Embed Size (px)
Citation preview
University of Southern Queensland
Faculty of Engineering and Surveying
Shear Strengthening of Headstocks
using Prestressed Fibre Strips
A dissertation submitted by
Lindsay Peter Jobling
in ulfillment of the requirements of f
Courses ENG4111 and 4112 Research Project
towards the degree of
Bachelor of Engineering (Civil)
Submitted: October, 2004

Abstract There is an urgent need to repair concrete structures that are failing short of their
expected design life. There are many concrete bridges in Australia and around the
world that are inadequate in terms of strength and serviceability. As engineers we
need to find the best possible solution to repair these structures instead of just tearing
them down and replacing them. Sustainable engineering practice is a requirement,
and repair rather than replace is the best option for sustainability.
External post tensioning offers a method of repairing these bridge structures that
requires minimal work to put in place and significant improvements in strength and
serviceability. This repair method gives engineers a viable and economical
alternative to replacing bridge structures. The downside of external post tensioning
work to date is the use of mainly steel tendons in the post tensioning components.
These components are inherently vulnerable to corrosion under the conditions in
which these structures exist. A viable alternative needs to be found.
This research aims to show that fibre reinforced plastic (FRP) laminates can be this
viable alternative. The main focus of this research was the development and
construction of an FRP post tensioning system and testing it on a model bridge
headstock, analyzing the resulting effects on strength and serviceability. The main
focus of the testing was on enhancing the shear capacity of the headstocks. Some
testing was also conducted on the effects of epoxy on shear cracking. A comparison
was also made between the predicted capacity of headstocks using AS3600 and the
actual observed capacity.
The system has two main components – a jacking block and an FRP laminate wrap.
The jacking block is constructed from high strength polymer concrete. It is designed
to last as long as standard concrete but with increased strength and durability. The
laminate wrap is made from an economical fibre continuously woven around the
bridge headstock. The jacking blocks are used to exert a compressive force into the
i

laminate strip which is then transferred to the concrete structure. This results in the
same compressive force on the concrete that would occur through conventional steel
post tensioning.
When the system was tested on the model headstocks, increases in the shear strength
were observed with the addition of the prestressing system. The increase in capacity
was dependent on the extent of the shear cracking prior to strengthening. When the
headstock was repaired using just the prestressing system a strength increase of 16%
was observed. When the existing cracks were repaired with epoxy and then
prestressed the strength increase was observed to be 46%. This shows a beneficial
capacity increase by the use of epoxy and prestressing.
The comparison of the test results with the predicted capacity from AS3600 showed
that AS3600 adequately predicted the capacity of the new specimens. However,
testing revealed that AS3600 could not adequately predict the capacity of the
specimens with existing cracking. The author concluded that AS3600 was unable to
model the failure of specimens strengthened with prestressing with the presence of
existing cracks. AS3600 also does not readily assess diagonal compression failure as
this was observed to be occurring in the test specimens.
Overall further research into the design of FRP prestressing systems is required.
There are obvious benefits of FRP over steel products as there are no corrosion
problems. However further research into the design of the jacking system would be
warranted and also the cost of such systems. Further analysis is also required into the
effects of initial cracking on the predictions of AS3600. The standard does not
address the effects of this initial cracking when predicting strengthened capacities.
Further research also needs to be conducted in the assessment of diagonal
compression failure loads as this is not easily computed with existing methods.
ii

University of Southern Queensland
F
aculty of Engineering and Surveying
ENG4111 & ENG4112 Research Project
Limitations of Use
The Council of the University of Southern Queensland, its Faculty of Engineering and Surveying, and the staff of the University of Southern Queensland, do not accept any responsibility for the truth, accuracy or completeness of material contained within or associated with this dissertation. Persons using all or any part of this material do so at their. own risk, and not at the risk of the Council of the University of Southern Queensland, its Faculty of Engineering and Surveying or the staff of the University of Southern Queensland. This dissertation reports an educational exercise and has no purpose or validity beyond this exercise. The sole purpose of the course pair entitled 'Research Project' is to contribute to the overall education within the student's chosen degree program. This document, the associated hardware, software, drawings, and other material set out in the associated appendices should not be used for any other purpose: if they are so used, it is entirely at
sk of the user. the ri
Prof G Baker Dean Faculty of Engineering and Surveying
iii

Certification I certify that the ideas, designs and experimental work, results, analyses and conclusions set out in this dissertation are entirely my own effort, except where otherwise indicated and acknowledged.
I further certify that the work is original and has not been previously submitted for assessment in any other course or institution, except where
ecifically stated. sp
Lindsay Peter Jobling
Student Number: Q97220510
___________________________________ Signature
___________________________________ Date
iv

Acknowledgements I would like thank my supervisor, Dr. Thiru Aravinthan for his support and
guidance throughout the duration of my project. This research would have
certainly been much more difficult without his expertise and knowledge on the
subject.
I would also like to thank my associate supervisor, Dr. Tim Heldt from USQ Fibre
Composite Design and Development, for his assistance throughout the year. The
design and construction of the prestress system would have been very difficult
without his assistance.
Special thanks go to Evan Woods for his assistance throughout the construction
and testing for this research project. His help during testing particularly made the
task much easier.
I would also like to extend a special thanks to the technical staff at the University
of Southern Queensland and USQ Fibre Composite Design and Development. A
special mention goes to Glen Bartkowski, Bernhard Black and Darren Browne for
their assistance in the construction and testing stages of this project.
Finally I would like to extend my deepest thanks to my family and friends,
particularly my wife Tamara for her encouragement and sacrifices during this
research project. I most certainly could not have done it without her support.
v

Table of Contents Abstract........................................................................................................................ i
Limitations of Use .....................................................................................................iii
Certification ............................................................................................................... iv
Acknowledgements..................................................................................................... v
List of Figures............................................................................................................ xi
List of Tables ...........................................................................................................xiii
Introduction ............................................................................. 1 1.1 Background .................................................................................................. 1
1.2 Aims and Objectives .................................................................................... 4
1.3 Assessment of consequential effects............................................................ 5
1.3.1 Aspects of Sustainability...................................................................... 5
1.3.2 Aspects of Safety.................................................................................. 6
1.3.3 Aspects of Ethical Responsibility ........................................................ 7
1.4 External Prestressing Technology................................................................ 7
Literature Review.................................................................... 8 2.1 General Overview ........................................................................................ 8
2.2 Historical Work............................................................................................ 9
2.3 Previous Research Investigations............................................................... 10
2.4 Summary .................................................................................................... 18
Design Methodology .............................................................. 20 3.1 Introduction................................................................................................ 20
3.2 Specimen Design........................................................................................ 22
3.3 Theoretical Design Capacity ...................................................................... 23
3.4 Theoretical Design Capacity – Prestressed Specimen ............................... 33
vi

3.4.1 Fibre Laminate Design....................................................................... 33
3.4.2 Prestress Jacking Block Design ......................................................... 35
3.4.3 Theoretical Design Capacity of the Prestressed Specimen ................ 37
3.5 Design Summary........................................................................................ 42
Experimental Methodology................................................... 44 4.1 Introduction................................................................................................ 44
4.2 Test Specimens........................................................................................... 44
4.3 Construction of the Specimens................................................................... 45
4.3.1 Concrete ............................................................................................. 45
4.3.1.1 Reinforcing..................................................................................... 45
4.3.1.2 Formwork....................................................................................... 48
4.3.1.3 Strain Gauges ................................................................................. 49
4.3.1.4 Pouring Concrete............................................................................ 52
4.3.1.5 Curing............................................................................................. 54
4.3.1.6 Preparing specimens for testing ..................................................... 54
4.3.2 Fibre Composite Prestress System..................................................... 55
4.3.2.1 Polymer Concrete Jacking Block ................................................... 55
4.3.2.2 FRP Laminate................................................................................. 58
4.3.2.3 FPR Laminate Strain Gauges ......................................................... 60
4.3.2.4 Preparation of Specimens for Testing ............................................ 61
4.4 Application of Epoxy ................................................................................. 62
4.4.1 Application of External Sealant ......................................................... 62
4.5 Testing Specimens ..................................................................................... 64
4.5.1 Test Setup........................................................................................... 64
4.5.1.1 System 5000 Data Logger.............................................................. 65
4.5.1.2 Load Variable Displacement Transducer (LVDT) ........................ 66
4.5.1.3 Loading Frame ............................................................................... 67
4.5.1.4 60 Tonne Hydraulic Jack ............................................................... 69
4.5.1.5 440kN Load Cell ............................................................................ 70
4.5.1.6 30 Tonne Hydraulic Prestress Jack ................................................ 70
vii

4.5.2 Testing Procedure............................................................................... 71
4.6 Health and Safety Issues ............................................................................ 74
Discussion of Results ............................................................. 76 5.1 Introduction................................................................................................ 76
5.2 Concrete and Reinforcement Strength ....................................................... 77
5.3 Crack Observations .................................................................................... 79
5.4 Loads and Deflections................................................................................ 84
5.5 Steel Strain Analysis .................................................................................. 89
5.5.1 Shear Strain ........................................................................................ 89
5.5.2 Compression Strain ............................................................................ 93
5.5.3 Tensile Strain ..................................................................................... 94
5.6 Analysis of Prestress .................................................................................. 95
5.7 Comparison of Results with AS3600 Predictions...................................... 98
5.7.1 Specimen 1 ......................................................................................... 99
5.7.2 Specimen 2 ....................................................................................... 102
5.7.3 Specimen 3 ....................................................................................... 106
5.7.4 Summary of Comparisons with AS3600 Predictions....................... 111
5.8 Conclusion................................................................................................ 112
Conclusion ............................................................................ 113 6.1 Achievement of Objectives ............................................................................ 113
6.2 Conclusions .................................................................................................... 114
6.3 Further Research ............................................................................................ 115
List of References................................................................. 117 Bibliography......................................................................... 120
Appendix A........................................................................... 122 Project Specification
viii

Appendix B........................................................................... 124
Test Specimen Design Drawings
Appendix C........................................................................... 127
Ultimate Moment Capacity Prediction
Appendix D........................................................................... 131
Prestress Jacking Block Design Drawings
Appendix E........................................................................... 134
Strain Gauge and Adhesive Data Sheets
Appendix F ........................................................................... 139
Prestressing System Material Properties
Appendix G .......................................................................... 142
Epoxy Injection Material Properties
Appendix H .......................................................................... 148
Risk Assessment and Management
Appendix I ............................................................................ 151
Concrete Compression Testing
ix

Appendix J ........................................................................... 153
Steel Reinforcement Testing
Appendix K .......................................................................... 155
Revised Multiframe Analysis
x

List of Figures Figure 1.1 - Tenthill Creek Bridge external post tensioning........................................ 2
Figure 1.2 - Effect of prestress on cracking ................................................................. 3
Figure 2.1 – Prestressed CFRP tendon anchor........................................................... 11
Figure 2.2 - Debonding failure of CFRP sheet .......................................................... 13
Figure 2.3 - Different CFRP wraps used by Adhikary and Mutsuyoshi (2004) ........ 14
Figure 2.4 - Mechanically fastened CFRP strips ....................................................... 15
Figure 2.5 - CFRP external shear reinforcement ....................................................... 17
Figure 3.1 - Tenthill Creek Bridge............................................................................. 21
Figure 3.2 - Basic Specimen Design .......................................................................... 22
Figure 3.3 - Reinforcement Diagram ......................................................................... 24
Figure 3.4 - Doubly reinforced section at Mu............................................................. 24
Figure 3.5 - 3D Jacking block concept drawing ........................................................ 36
Figure 4.1 - Reinforcement Diagram ......................................................................... 46
Figure 4.2 - Tying the steel reinforcing cages............................................................ 47
Figure 4.3 - Assembled Reinforcing Cage................................................................. 48
Figure 4.4 - The Formwork........................................................................................ 49
Figure 4.5 - Strain gauge fixed to shear ................................................................ 51
Figure 4.6 - Strain gauge fixed to tensile ligature reinforcement .............................. 51
Figure 4.7 - Lifting ferrules........................................................................................ 53
Figure 4.8 - Attaching strain gauge connector ........................................................... 55
Figure 4.9 - Polymer concrete mix............................................................................. 56
Figure 4.10 - Jacking block mould............................................................................. 57
Figure 4.11 - Jacking blocks in place on headstock................................................... 58
Figure 4.12 - Application of the FRP laminate .......................................................... 59
Figure 4.13 - FRP Laminate strain gauges in place ................................................... 61
Figure 4.14 - Epoxy sealant ....................................................................................... 63
Figure 4.15 - Epoxy injection..................................................................................... 64
Figure 4.16 - System 5000 data logger ...................................................................... 66
Figure 4.17 - LVDT deflection transducer................................................................. 67
xi

Figure 4.18 - Loading Frame ..................................................................................... 68
Figure 4.19 - 60 tonne hydraulic jack ........................................................................ 69
Figure 4.20 - 440kN Load Cell .................................................................................. 70
Figure 4.21 - 30 tonne Hydraulic Prestress Jack........................................................ 71
Figure 4.22 - Prestressed specimen ready for testing................................................. 73
Figure 5.1 - Concrete strength vs slump .................................................................... 78
Figure 5.2 - Specimen 1 crack pattern ....................................................................... 80
Figure 5.3 - Specimen 2 failure crack pattern ............................................................ 82
Figure 5.4 - Specimen 3 failure crack pattern ............................................................ 83
Figure 5.5 - Specimen 1 load - deflection curve ........................................................ 85
Figure 5.6 - Specimen 2 load - deflection curve ........................................................ 86
Figure 5.7 - Specimen 3 load - deflection curve ........................................................ 88
Figure 5.8 - Specimen 1 shear strain.......................................................................... 90
Figure 5.9 - Specimen 2 shear strain.......................................................................... 91
Figure 5.10 - Specimen 3 shear strain........................................................................ 92
Figure 5.11 - Compression Strain .............................................................................. 93
Figure 5.12 - Tensile Strain........................................................................................ 94
Figure 5.13 - Prestress strain – specimen 3................................................................ 96
Figure 5.14 - Prestress strain - specimen 2 ................................................................ 96
xii

List of Tables Table 3.1 - Laminate material properties ................................................................... 33
Table 3.2 - Polymer concrete design properties......................................................... 36
Table 3.3 - Section and material properties ............................................................... 38
Table 3.4 - Headstock design summary ..................................................................... 43
Table 4.1 - Design specimen details .......................................................................... 44
Table 5.1 - Concrete strength ..................................................................................... 77
Table 5.2 - Steel reinforcement test results................................................................ 79
Table 5.3 - Summary of failure loads......................................................................... 89
Table 5.4 - Prestress increase ..................................................................................... 97
Table 5.5 - Actual material properties........................................................................ 98
Table 5.6 - Specimen 1 comparison......................................................................... 101
Table 5.7 - Specimen 2 comparison......................................................................... 106
Table 5.8 - Specimen 3 comparison......................................................................... 110
Table 5.9 - Summary of comparisons with AS3600 ................................................ 111
xiii

Introduction Chapter 1
Chapter 1
Introduction 1.1 Background Australia has 33,000 bridges of which 50% are reinforced or prestressed concrete.
Repairing these structures has become a real issue for engineers in Australia. These
structures are starting to suffer premature failure due to increased traffic loading,
failure of reinforcement and environmental damage. This is causing structures to fall
short of their initially expected design life.
The options available to engineers are to repair or replace. In the past the option to
replace rather than repair may have been chosen due to the relative ease in design
and the lack of suitable repair methods. The problem with replacing structures is the
use of natural resources. Both concrete and steel are manufactured from naturally
occurring resources of a finite nature. In today’s best practise we as engineers must
strive to minimise the use of natural resources and use the most environmentally
sound option available. Because of this, extensive research into repairing Australia’s
aging structures has been conducted using conventional methods of steel post-
tensioning.
External post-tensioning can be defined as using external unbonded materials,
usually steel bars or tendons, to exert a compressive force on a member. This usually
1
Introduction Chapter 1
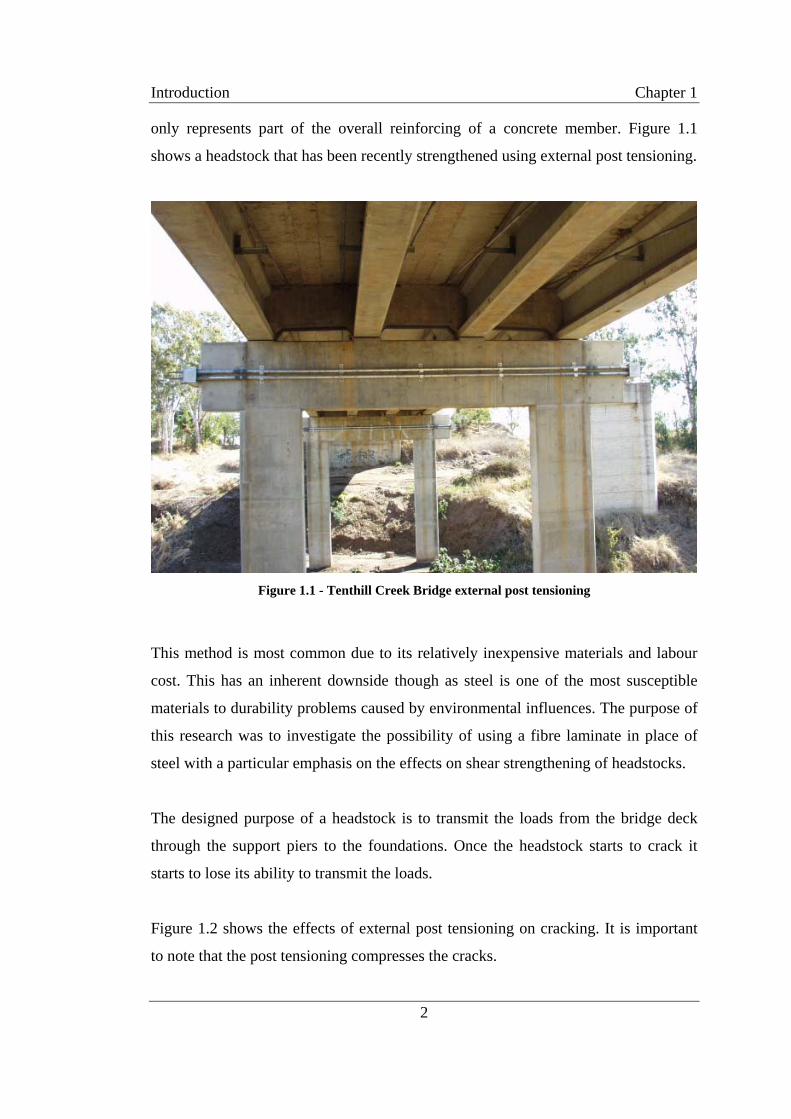
only represents part of the overall reinforcing of a concrete member. Figure 1.1
shows a headstock that has been recently strengthened using external post tensioning.
Figure 1.1 - Tenthill Creek Bridge external post tensioning
This method is most common due to its relatively inexpensive materials and labour
cost. This has an inherent downside though as steel is one of the most susceptible
materials to durability problems caused by environmental influences. The purpose of
this research was to investigate the possibility of using a fibre laminate in place of
steel with a particular emphasis on the effects on shear strengthening of headstocks.
The designed purpose of a headstock is to transmit the loads from the bridge deck
through the support piers to the foundations. Once the headstock starts to crack it
starts to lose its ability to transmit the loads.
Figure 1.2 shows the effects of external post tensioning on cracking. It is important
to note that the post tensioning compresses the cracks.
2

Introduction Chapter 1
Figure 1.2 - Effect of prestress on cracking
3

Introduction Chapter 1
As shown by Figure 1.2, post tensioning does have a positive effect on cracking. This
research however aimed to improve the corrosion limitations of steel post tensioning
by the use of a fibre composite strip which is not bonded to the structure but can still
apply a force to improve the concrete strength. This system works similarly to the
conventional steel post-tensioning. The main focus of this research was the
development and testing of this prestressing system.
1.2 Aims and Objectives The aim of this research was to investigate the viability of composites as an
alternative to conventional steel post-tensioning for the shear strengthening of bridge
headstocks. This also involved the construction and testing of model headstocks and
a comparison with the predictions from current design standards.
In order to ensure this aim was achieved, the research had to meet the following
objectives:
1. Review the existing research into strengthening of concrete structures.
2. Design and analyse the fibre composite prestress system and jacking
blocks.
3. Construct and test headstock specimens.
4. Analyse the results and compare with the predictions from the design
equations.
4

Introduction Chapter 1
1.3 Assessment of consequential effects This research project has the ability to have a positive effect on the use of concrete in
construction and the lifespan of structures. In developing a system using fibre
reinforced plastics, existing structures can be repaired rather than being replaced and
continue to serve out the lifespan for which they were originally designed. This has
positive effects on environmental sustainability and public safety. It is the author’s
opinion that this project provides an ethically responsible attitude towards
sustainable engineering.
1.3.1 Aspects of Sustainability As professional engineers and members of the community, we have a commitment
along with the Institute of Engineers, Australia, to contemplate sustainability of
solutions as we develop new projects. In following the guidelines set out in Towards
Sustainable Engineering Practice (IE Aust, 1997) part of the initial work for this
research was to analyse this project to ensure it is aligned with good engineering
practice.
Good sustainable developments need to remember future generations' needs as well
as our own needs now. Using manufactured, high strength materials such as glass or
carbon fibres reduces the use of natural materials like steel or concrete. As
composites often have a much greater strength per unit area less material is required
which also benefits future generations. The increase in environmental corrosion
resistance in composites means a longer life before replacement. However in
repairing structures now we also create a possible problem for the next generation
when these structures can no longer be repaired and require replacement. This could
mean a great cost burden as well as a problem for disposal of materials. Therefore
the project has the potential benefit of minimal material use but the potential problem
of replacement and disposal by future generations.
5

Introduction Chapter 1
Reducing material usage and waste benefits the community and the environment.
The possibility of this being a simple temporary 10 to 20 year fix is cause for some
concern about the implications to future generations. The immediate benefit is
obvious and the author believes the replacement of structures is not a significant
problem for future generations. The method of repairing structures is not instant and
therefore it is not expected that all structures will suddenly need replacement. The
replacement of these repaired structures will be required over a large amount of time
and therefore causes far less impact on the environment than originally thought. The
aspect of extending the life of structures does save on material costs and disposal
problems as these same methods can be applied to the new structures when they
show similar problems. It is the author’s view that this project has potentially
significant benefits for now and the future.
1.3.2 Aspects of Safety There are only a few aspects in relation to safety that surround this project. The main
aim of this project is to rehabilitate existing structures. This means that there is no
change to the structure and less likelihood of accidents due to changed traffic
conditions. The unobtrusive nature of the installation means there is little likelihood
of accident or death while the strengthening is installed. The nature of strengthening
a structure implies that there is some safety requirement which is not being met and
therefore the impact of improving this requirement subsequently means that the level
of safety is being improved. In regards to safety aspects it is the author’s opinion that
this project has only positive effects on safety.
6

Introduction Chapter 1
1.3.3 Aspects of Ethical Responsibility After carefully studying the Engineers Australia Code of Ethics for professional
engineers, this research was regarded as completely ethical. Unethical behaviour is
unacceptable and therefore it is important that nothing unethical occurs during this or
any research project and after its completion.
1.4 External Prestressing Technology The technology used in external post tensioning is constantly under development and
refinement due to the large number of structures being strengthened using this
method around the world.
Most of the post tensioning around the world is done using conventional steel
products such as post tensioning bars and tendons. The more recent work has been
conducted on the various methods of protecting the steel bars from corrosion. In
normal ducted internal concrete post tensioning, the steel is protected from corrosion
by the concrete grout. With external post tensioning the steel is exposed to a harsh,
corrosive environment. To improve the longevity of the external steel most of the
recent research has been conducted into different protection methods for the steel.
The use of external ducts filled with grout is just one method of protecting the steel.
This research aimed to show that a composite laminate can be used instead of steel
for a post tensioning mechanism. The laminate does not suffer the exposure problems
of the steel product and therefore offers a much more long term solution to the
strengthening of structures. This is the one of the most innovative methods of
strengthening structures today.
7

Literature Review Chapter 2
Chapter 2
Literature Review 2.1 General Overview In researching this project a number of articles of interest were studied, however no
information was found on the use of a prestressed strip as a direct alternative to steel.
There has been a significant amount of research into plate bonding rehabilitation of
structures using either steel or composite laminates. There has been some research
conducted on the use of a fibre reinforced plastic rod inserted into channels cut into
the lower section of a beam to provide external reinforcement.
External post-tensioning is now a common method of strengthening structures. There
has been a significant amount of research conducted on the use of conventional steel
tendons in the rehabilitation of structures. There have been three recent research
projects conducted in external post tensioning at the University of Southern
Queensland. Sabonchy (2003), Snelling (2003) and Woods (2004) all confirmed that
external post-tensioning was a valid strengthening mechanism. What their research
also concluded however is the inadequacy of AS3600 to predict the capacity of
cracked structures that had been repaired using external post tensioning.
The research undertaken at the University of Southern Queensland by Sabonchy
(2003), Snelling (2003) and Woods (2004) also only dealt with conventional steel
8

Literature Review Chapter 2
post tension bars. No research could be located on the viability of fibre composites as
a direct replacement alternative to steel for post tensioning in headstocks.
2.2 Historical Work
Quite a number of research projects have been conducted on using a steel plate
bonded to an existing structure in order to increase its strength. Allen, Edwards and
Shaw (1993) stated that this method of strengthening has been used since around
1965. It was simultaneously developed in both South Africa and France. This method
uses an epoxy resin to adhere a steel plate to the surface of the concrete structure
acting as an external reinforcement. Further study of this method has been conducted
in Australia more recently.
More recently however there has been significant research into the use of fibre
composite products for concrete rehabilitation. Following on from the use of bonded
steel plates some researchers have examined the use of a bonded composite plate.
Beber, Campos & Campagnolo (2001) examined the use of a carbon fibre reinforced
plastic (CFRP) sheet bonded to a concrete beam to test the increase in strength. They
encountered some problems with concrete delamination. Further study in this field
by the Hunun University in China revealed similar failure in the bonding of the
laminate to the concrete. Weijian & Huiming (2001) also found that in the instance
of the bonding not failing they actually had tensile failure of the laminate sheets.
Further to this they had problems with the anchorage system of the sheets failing.
Further study is required in this field to improve both the laminate bonding and the
anchorage system used to eliminate problems of premature failure.
Several new studies have been conducted recently into the use of a bonded,
prestressed CFRP plate. A recent study by Kojima et. al. (2001) examined the effects
of various amounts of prestress force on a carbon fibre plate bonded to a concrete
9

Literature Review Chapter 2
beam. This research showed that the use of a prestressed plate provided a greater
increase in strength than that of a non prestressed plate. Wight, Green & Erki (2001)
conducted similar research using prestressed and non-prestressed plates and
confirmed Kojima’s findings. A test comparison of a sheet of non-prestressed CFRP
and a sheet prestressed with 200MPa force showed that the prestressed sheet
provided a 12% increase in yield strength. Interestingly the prestressed sheet could
handle almost twice the load before the first cracks appeared.
There has been significant research into the use of laminates as bonded plates
however little research could be found using laminates as a post tensioning
mechanism.
2.3 Previous Research Investigations The use of post tensioning has been widely researched as a strengthening mechanism
for flexural failure. The use of post tensioning for strengthening shear failure is not
as common. The previous investigations of interest to this research project were the
use of fibre reinforced plastics in the strengthening of concrete structures.
The use of carbon fibre reinforced plastic (CFRP) as a replacement for conventional
steel tendons has been researched by Andrä, Maier and Poorbiazar (2004). They
examined the changes necessary to conventional prestressing equipment in order to
make use of CFRP tendons.
They identified in their research that the longitudinal properties in the direction of
loading for CFRP are exceptional. The problems in the use of CFRP tendons arise in
the anchorage zone.
10

Literature Review Chapter 2
Steel tendons, due to their isotropic nature, allow redistribution of stresses in the
anchorage zone around sharp edges, grooves, notches and threads, which make up
the anchorage mechanism of conventional post tensioning. As CFRP is anisotropic
these conventional anchorage systems are unsuitable.
Andrä, Maier and Poorbiazar (2004) described a clever prestressing frame which
much like a violin bow prestresses a CFRP strip before being fixed to the structure
with adhesive. Unfortunately when the frame was removed the CFRP immediately
delaminated from the structure. This was due to the shear stress at the ends of the
strip being far greater than the shear capacity of the concrete cover. This basic design
however could be overcome by applying mechanical anchorages at each end of the
strip. A refined clamping type anchor is shown below in Figure 2.1.
Figure 2.1 – Prestressed CFRP tendon anchor
(Source: CARBON FIBRE COMPOSITES FOR A NEW GENERATION OF TENDONS, Andrä, Maier
and Poorbiazar 2004)
11

Literature Review Chapter 2
This shows one of the anchorage mechanisms used in strengthening the Koerschtal
Bridge near Stuttgart, Germany in 2001. Refinement of this anchorage mechanism
would lead to more wide spread acceptance and use of CFRP tendons. The
conclusions drawn on the use of CFRP tendons by Andrä, Maier and Poorbiazar
(2004) are that the improvement and design of efficient anchorages for CFRP
tendons (Anchorage failure load > tendon failure load) would result in more wide
spread competition with conventional steel tendons.
Research by Zou (2003) investigated the long term deflection of beams reinforced
with CFRP tendons. His experimental research was based on test specimens with
only prestressed CFRP tendons as reinforcement. He also investigated the cracking
behaviour of these specimens.
His research monitored the behaviour of the specimen under a constant service load
for a period of 250 days. After this time the load was progressively increased until
cracking occurred.
The differences noted by Zou (2003) between steel tendons and CFRP tendons were
negligible. The long term deflection of the CFRP reinforced beam was comparable to
the steel reinforced beam. After cracking had occurred the long term deflection of the
CFRP reinforced beam was again comparable to the steel reinforced beam. The only
notable difference was in the crack widths. The crack widths in the CFRP reinforced
beam were slightly higher than the crack widths in the steel reinforced beam.
The other more common use for CFRP is as a bonded plate. This method of
strengthening is well known and has been used with steel plates since the mid
1960’s. As with conventional steel post tensioning though, the bonded steel plate has
the same inherent corrosive problems as the steel tendons. For this reason researchers
started to investigate the possibility of using CFRP plates in place of steel.
12

Literature Review Chapter 2
Recent research by Pellegrino and Modena (2002) showed that the addition of
bonded CFRP plates provides an increase in shear capacity. They found that the
contribution of the CFRP plate to the shear capacity of the beam however depended
on several factors including stiffness of the plate, types of resins in the laminate,
compressive strength of the concrete and the orientation of the fibres.
Figure 2.2 - Debonding failure of CFRP sheet
(Source: Fiber Reinforced Polymer Shear Strengthening of Reinforced Concrete Beams with
Transverse Steel Reinforcement, Pellegrino and Modena 2002) Figure 2.2 shows the debonding failure of one of their test specimens. On all the tests
conducted by Pellegrino and Modena (2002) the failure occurred due to debonding of
the laminate. They concluded that there was a significant strength gain from the
application of only one layer of CFRP laminate. This improved again with two and
three layers however the increase was not as significant.
This research was confirmed in a similar study undertaken by Adhikary and
Mutsuyoshi (2004). They also investigated the behaviour of concrete beams
13

Literature Review Chapter 2
strengthened in shear by CFRP plates. They tested various styles of wrapping from
small plates around only one face to a full ‘U’ shape wrap that covered 3 sides of the
beam. The eight different styles that were used in the testing are shown in Figure 2.3.
They noted that the bonded plate increased the shear capacity by up to 119% over
standard non strengthened strength for the ‘U’ shape wrap (B-8). They also noted
debonding failure in some tests.
Figure 2.3 - Different CFRP wraps used by Adhikary and Mutsuyoshi (2004)
(Source: Behaviour of Concrete Beams Strengthened in Shear with Carbon Fibre Sheets, Adhikary
and Mutsuyoshi 2004)
14

Literature Review Chapter 2
In an endeavour to refine the problems associated with debonding failure of
laminates, Lamanna, Bank and Scott (2004) researched to effect of mechanically
bonded laminates on flexural strength. Their research was trying to find a rapid
solution to the rehabilitation of structures in a military situation. They found that
other than debonding failure, structures strengthened with bonded plates often
required days of preparation with sandblasting and cleaning before the strips could
be bonded. They also found other problems associated with the application
particularly in the time required for the adhesive to properly cure before loading. In a
bridge application the headstock would not be able to be loaded for up to 7 days
which means closing a road for this period of time. This is unacceptable in most
hostile military situations.
Lamanna, Bank and Scott (2004) examined the possibility of fastening the strips to
the structure using small nails. They found that the use of many small fasteners gave
a more evenly distributed load than fewer large fasteners. Figure 2.4 shows the test
specimen used in their research.
Figure 2.4 - Mechanically fastened CFRP strips
(Source: Flexural Strengthening of Reinforced Concrete Beams by Mechanically Attaching Fiber-
Reinforced Polymer Strips, Lamanna, Bank and Scott 2004) They found that this method of attaching the strips resulted in increases in moment
capacity of up to 20%. They concluded that this method of attaching the strips gave a
15

Literature Review Chapter 2
much more ductile failure than the brittle debonding failure that comes from bonded
plate applications.
There has been very little research into the shear strengthening of headstocks using a
fibre prestress system. Research by Lees, Winistörfer and Meier (2002) investigated
the enhancement in shear properties using a vertical fibre wrap. This acts in a similar
fashion as the internal shear stirrups. Figure 2.5 shows an outline of the system. The
practical application of non-laminated strap elements has four main steps:
a) Wrap beam;
b) fusion bond outer layer to second outermost layer;
c) tension strap;
d) transfer of prestress force to concrete
16

Literature Review Chapter 2
Figure 2.5 - CFRP external shear reinforcement
(Source: External Prestressed Carbon Fiber-Reinforced Polymer Straps for Shear Enhancement of
Concrete, Lees, Winistörfer and Meier 2002) The fibre used to construct this external shear reinforcement was a carbon fibre
reinforced thermoplastic tape. The tape was wrapped around 20 times for each shear
ligature and then the two outermost layers fusion bonded together. A prestress force
of 60kN was applied to each strap. The specimens were then tested and results
recorded.
The researchers recorded failure loads of two identical beams, one reinforced with
external shear straps and one without. The failure load of the control specimen was
305kN and shear failure occurred. The second specimen however reached 420kN
was reached and at this point flexural yielding started to occur. This represents a 35%
17
Literature Review Chapter 2
increase in capacity. The researchers conclude that this method is an effective
strengthening mechanism for shear failure. The major problem associated with this
design is the accessibility of the specimen. Access is required right around the cross-
section of the specimen. This can create problems in certain situations.
There has been very little investigative research done on the effects of epoxy
injection for concrete repair. At the University of Southern Queensland, Snelling
(2003) and Woods (2004) both concluded that the epoxy injection does have a
positive effect on the capacity. However due to the small number of tests conducted
it is difficult to quantify the effect of the epoxy.
Minoru, Toshiro, Yuichi and Keitetsu (2001) examined the bond properties of
concrete repair materials. Their research concluded that the bond strength of epoxy
injection materials was greater than that of the standard concrete specimens. They
also noted that a rough cracked section exhibited better bond strength than a smooth
surface.
2.4 Summary The extent of research into the use of fibre reinforced plastic (FRP) as a replacement
for conventional steel post tensioning tendons is limited. FRP is widely used in a
bonded plate strengthening for both shear and flexural failure. There has been
extensive research into this use of FRP and the problems associated with debonding
failure. There has also been significant research in the use of FRP strips as a
strengthening mechanism however this also generally relies on the bonding of the
prestressed strips with the concrete. This highlights the need to develop a system
such as the one used in this research to strengthen headstocks. A system that works
under a similar mechanism to conventional steel tendons would be likely to be more
widely adopted due to the similarity of the system.
18

Literature Review Chapter 2
Conventional unbonded steel tendon post tensioning is becoming more common in
the strengthening of bridge headstocks. There is a large potential market for a system
that works well and overcomes the problems associated with corrosion of steel. FRP
offers a viable alternative to local, state and federal authorities around the world for
the repair of their concrete structures.
19

Design Methodology Chapter 3
Chapter 3
Design Methodology
3.1 Introduction The design component of this research focussed on the predicted failure loads for the
test specimens. In order to assess the increase in shear strength of the headstock
using the repair methods, the design had to be such that the failure of the specimens
would be in shear. This means that to ensure that shear was the failure mode, the test
specimens needed to be under reinforced with respect to shear. The ultimate moment
capacity of the section also needed to be checked to ensure that the specimens would
always fail with respect to shear.
The theoretical design used the techniques developed in the Australian Standard for
Concrete Structures, AS3600. This method is discussed in more detail in Section 3.3.
There were other considerations factored into the specimen design. This research
project was conducted as a scale model of a real life bridge, the Tenthill Creek
Bridge near Gatton.
The bridge is a typical reinforced concrete bridge with the headstock being a beam
supported on two columns. A photograph of the actual bridge headstock is shown in
Figure 3.1. This bridge has suffered shear failure due to recent overloading. This has
caused significant shear cracking extending from the supports up to 100mm below
the central girders.
20

Design Methodology Chapter 3
Figure 3.1 - Tenthill Creek Bridge
It was decided that to maintain a sense of reality to this research, that the test
specimens be scale modelled from this headstock. Construction drawings were
obtained and different scales were investigated. One of the major considerations in
the scale model decision was the weight of the test specimens. Initially a ⅓ model
was considered as appropriate. The weight of such as specimen would be around
1250kg. This is quite heavy and the manoeuvring of such as specimen would be
difficult with the available equipment. Another consideration was the load required
to induce shear failure and the ability of the test equipment to produce this load.
After careful consideration a ¼ model was decided upon. The dimensions of the
model were scaled to ¼ of the actual headstock. This produced a specimen weighing
650kg which was much easier to handle with the available equipment.
21

Design Methodology Chapter 3
After this was decided the design calculations were carried out to ensure that the
specimen would fail in shear as required.
3.2 Specimen Design Based on the information provided in the construction drawings for the Tenthill
Creek Bridge, the specimen dimensions were scaled. The original bridge headstock
was a trapezoid shape with a width of 1066mm at the top and 686mm at the base.
The depth of the section was 1676mm. The headstock was supported on two
rectangular piers of dimensions 1524mm x 686mm.
To simplify the construction of the test specimens, the headstock was designed with
a rectangular cross-section. To ensure the test specimens depicted the real life
headstock accurately the ratio of area of concrete to area of steel was maintained the
same. The resulting specimen design is shown in Figure 3.2. This figure shows the
basic dimensions of the test specimen however a detailed design drawing is supplied
in Appendix B.
Figure 3.2 - Basic Specimen Design
All of these dimensions represent a ¼ scale of the actual bridge headstock. The
reinforcement for this headstock was scaled to 161 of the original headstock. The
assessment of capacity in reinforced concrete is based on an area ratio of steel to
22

Design Methodology Chapter 3
concrete. Therefore when the dimensions of the headstock were scaled by ¼ the
resulting effect on the area is ¼ 2 giving 161 . Simplifications were again made to the
reinforcing design to make construction an easier task. The reinforcement in the
original structure was much more complex however the steel to concrete ratio was
consistent with that of the test specimens.
Once the physical dimensions of the headstock had been decided on, the assessment
of the headstock capacity could be carried out. This involved the techniques
discussed in Warner, Rangan, Hall and Faulkes (1998) for calculation of shear
capacity which follows that described in AS3600. The moment capacity was also
assessed to ensure that shear failure would occur.
3.3 Theoretical Design Capacity As previously discussed I needed to assess the failure mode of the test specimen. As
this research focused on shear strengthening of headstocks, the ultimate shear
capacity, Vu, had to be less than the ultimate moment capacity, Mu. The following
cross-section, Figure 3.3, shows the properties of the design specimen which were
used in the calculations.
23

Design Methodology Chapter 3
Figure 3.3 - Reinforcement Diagram
The design concrete strength for the test specimens was 32MPa.
Figure 3.4 - Doubly reinforced section at Mu
(Source: Faulkes et al. 1998)
24

Design Methodology Chapter 3
From Figure 3.4 it can be seen that the calculation of the concrete force, C, rests on
the determination of the neutral axis depth. Initially it is assumed that both the
compression and tension reinforcement had yielded. From this assumption we get:
Tensile Steel Force: T = Ast x fsy
where Ast is the cross-sectional area of the steel in tension and fsy is the yield strength
of the steel. For this design the tensile steel force is calculated to be:
T = 600 x 500 = 300 x 103 N
The compressive steel force, Cs, is calculated using the same equation giving:
Cs = 400 x 500 = 200 x 103 N
As concrete is relatively weak in tension, usually <5MPa, the tensile force given by
the concrete is neglected. The compressive force in the concrete, Cc, is derived from
the rectangular stress block shown in Figure 3.4. This gives the following formula for
Cc:
Cc = 0.85f’cγbdn
where f’c is the compressive strength of the concrete, γ is given by the formula:
γ = 0.85 – 0.007( f’c – 28 )
b is the width of the section and dn is the depth to the neutral axis from the outer most
fibre of the concrete. Assessing these properties for the design cross-section gives:
γ = 0.85 – 0.007 ( 32 – 28 )
γ = 0.822
25

Design Methodology Chapter 3
and then calculating the concrete compressive force, Cc, gives:
Cc = 0.85 x 32 x 0.822 x 220 x dn
Cc = 4.919 x 10³ dn
Applying equilibrium equation to these three forces gives the following:
∑FH = 0
T = Cs + Cc
300 = 200 + 4.919dn
dn = 20mm
It was initially assumed that all the steel yielded and that assumption must now be
checked. For the strain in the tensile steel, εst, :
n
nst d
dd )(003.0 −=ε
where d is the depth to the centre of the tensile reinforcement from the outermost
fibre of the concrete. This gives:
εst = 0.003 ( 366 – 20 )
20
εst = 0.052
εsy, the yield strain of the reinforcement, of the reinforcement is taken as 0.0025.
Therefore as εst > εsy then the tensile steel has yielded. This assumption is correct.
Checking the strain in the compressive steel, εsc, for yield however gives:
26

Design Methodology Chapter 3
εsc = 0.003 ( 20 – 54 ) 20
εsc = -0.005
this means εsc < εsy which means the assumption that the compressive steel has
yielded is invalid. This means the compressive steel is still in the elastic region so the
depth to the neutral axis, dn, needs to be recalculated. This is done by expressing the
compressive steel strain and stress and the concrete compressive force in terms of dn
and solving the resulting quadratic equation this is shown below:
Cs = Asc x σs = Asc Es εs
where Es is the modulus of elasticity of the steel, which is given at 200 x 103MPa.
Substituting in the known values gives:
Cs = 400 x 200 x 103 x εs = 80 x 106 εs
Substituting in the equation for εs gives:
( )n
ns d
dC
54003.01080 6 −
××=
( )n
ns d
dC
541024.0 6 −
×=
Similarly the equation for concrete stays as before and is given as:
Cc = 4.919 x 10³ dn
Now once again applying the equilibrium equation we arrive at:
27

Design Methodology Chapter 3
Cc + Cs – T = 0
4.919 x 10³ dn + 0.24 x 10⁶ ( )
n
n
dd 54−
– 300 x 103 = 0
which simplifies to the following quadratic:
4.919dn2 – 60dn – 12960 = 0
Solving for dn gives:
dn = 58mm
Once again we must check that the tensile steel has yielded
εst = 0.003 ( 366 - 58 ) 58
εst = 0.016
The assumption that the tensile steel has yielded is correct as εst > εsy. Therefore the
dn value can be accepted. The values of the forces Cc and Cs can now be calculated.
This gives:
Cc = 4.919 x 103 x 58
Cc = 285 x 103 N
and
Cs = 0.24 x 10⁶ ( 58 – 54) 58
Cs = 17 x 103 N
28

Design Methodology Chapter 3
To calculate the ultimate moment capacity, Mu, moments for each of the three forces
are taken about the top fibre. This gives:
Mu = ( 300 x 103 x 366 ) – ( 17 x 103 x 54 ) – ( 285 x 103 x (58 x 0.822 ) 2
Mu = 102 kNm
From this the ultimate load capacity, Pu, can be calculated. This is given by the
following formula:
abLM
P uu =
where L is the distance between the centre of the two supports, a is the distance from
one support centre to the loading point and b is equal to L - a. This gives an ultimate
load capacity of:
Pu = 102 x 106 x 1920 580 x 1340
Pu = 252 kN
This estimation of Pu is not totally accurate. The above formula for Pu is based on a
simply supported beam. For a simply supported beam the moment through the
supports is zero. For the test specimens used in this design the beam is rigidly
connected to the supports. This means that at the supports the moment is not
necessarily zero. This means that the load required to create the flexural failure will
be much higher than that calculated above.
In order to assess the effect of the connections on the ultimate failure load, a frame
analysis package was used to predict the bending moment. A copy of the output of
29

Design Methodology Chapter 3
the software is provided in Appendix C. The load required to produce Mu = 102kNm
is:
Pu = 420kN
The ultimate shear capacity, Vu, of the design specimens can now be calculated to
ensure that shear failure will occur before reaching the ultimate load capacity. The
ultimate shear capacity is calculated from the following formula:
Vu = Vuc + Vus
where Vuc is the ultimate shear resisted by the concrete and Vus is the shear resisted
by the steel reinforcement. The value of Vus is calculated from the following formula:
Vus = s
Asv fsy◊f do cotθv
where Asv is the area of the shear reinforcement provided, fsy◊f is the yield strength of
the shear reinforcement with respect to shear, do is the depth from the top to the
centre of the tensile reinforcement and θv is the angle between the axis of the
concrete compression strut and the longitudinal axis of the member which is taken
conservatively at 45°. Therefore for the design specimen the shear resisted by the
shear ligatures is:
Vus = 62 x 250 x 366 x cot 45 280
Vus = 20.3 kN
The shear resisted by the concrete is given by:
Vuc = β1 β2 β3 bv do
31
0
'⎟⎟⎠
⎞⎜⎜⎝
⎛ ×db
fA
v
cst
30

Design Methodology Chapter 3
where β1 is given by:
β1 = 1.1 ( 1.6 – do / 1000 ) ≥ 1.1
β1 = 1.1 ( 1.6 – 366 / 1000 )
β1 = 1.357
and β2 is equal to 1 for members with no significant axial tension or compression and
β3 is given by:
22 0
3 ≤=va
dβ
where av is the distance from the loading point to the face of the support. This gives:
877.1390
36623 =
×=β for the closest support
and as the distance from the face of the other support is greater than 2d0, β3 = 1 for
the longer shear span.
bv is simply equal to b for rectangular members. Therefore the shear resisted by the
concrete can be calculated as for the shorter shear span is
Vuc = 1.357 x 1 x 1.877 x 220 x 366 x 3
1
36622032600
⎟⎠⎞
⎜⎝⎛
××
Vuc = 127.2 kN
Therefore the total ultimate shear capacity of the design specimen over the shorter
shear span is:
31

Design Methodology Chapter 3
Vu = 127.2 + 20.3
Vu = 148 kN
The load required to produce shear failure over the short shear span is given by:
bLV
P uu =
Pu = 148 x 1920 = 212kN 1340
The shear capacity of the test specimen over the longer shear span is given by:
Vuc = 1.357 x 1 x 1 x 220 x 366 x (600 x 32 )⅓ 220 x 366
Vuc = 67.8 kN
Vu = 67.8 + 20.3
Vu = 89 kN
The load required to produce shear failure over the long shear span is given by:
aLV
P uu =
Pu = 89 x 1920 = 294 kN 580
The effect of the rigid connections has no effect on the predicted shear capacity. A
check was carried out using the frame analysis software to confirm this and the
resulting shear force diagram is included in Appendix C.
32

Design Methodology Chapter 3
The ultimate load causing shear failure is much less than the ultimate load causing
flexural failure and therefore the specimen will fail in shear. The ultimate shear
capacity is also much less than the load capacity of the test equipment. Therefore the
design specimen is suitable for construction and testing.
3.4 Theoretical Design Capacity – Prestressed Specimen The design capacity of the prestressed specimens is calculated in a similar manner to
that of the standard specimen. In order to assess the capacity of the prestressed
specimen, some calculation of material properties and basic stress analysis needs to
be conducted on the laminate and on the polymer concrete jacking blocks.
3.4.1 Fibre Laminate Design
Fibre Composite Design and Development (FCDD) have carried out some material
testing on the properties of the particular laminate used for this research. The results
of that testing are shown in Table 3.1.
Table 3.1 - Laminate material properties Longitudinal Modulus of Elasticity, E11 26800 MPa
Maximum tensile stress, σ11 588 MPa
Theoretical thickness per layer 0.58mm
From this data other essential information can be calculated. The yield strain of the
laminate, ε11, is calculated from this formula:
33

Design Methodology Chapter 3
ε11 = 11
11
Eσ
ε11 = 0.022
The prestress force applied was scaled down from the repair method used in the
actual Tenthill Creek Bridge headstock. The actual headstock had four prestressing
bars with a 1000kN prestress force applied to each bar. Once again scaling by a
factor of 161 as it is an area scaling gives the prestress force applied, Pe, as 250kN.
Using this prestress force a simple calculation was conducted as to the area of
laminate required to withstand this force and remain elastic. A factor of safety of 4
was applied to prestress load of 250kN to obtain a design prestress force in the
laminate of 1000kN. This was done to ensure the laminate strip remained in the
elastic region. Using this design prestress force and the maximum tensile stress, σ11,
the cross sectional area of the strip, A, was calculated. This is shown below:
σeP
A =
A = 1000000 588
A = 1700mm2
From this the dimensions of the strip can be calculated. The design for the strip is for
10 layers of the laminate at 0.58mm per layer. This gives a theoretical thickness of
the strip of 5.8mm. The height of the strip, h, is given as:
h = 1700 5.8
h = 293 mm
34

Design Methodology Chapter 3
In order to simplify the construction of the laminate, 10 layers of 300mm width will
be used. This will ensure the laminate remains in the elastic region.
3.4.2 Prestress Jacking Block Design The concept drawing of the jacking block is shown in Figure 3.5. There were some
finite limitations on the jacking block design, mainly concerned with the cut out for
the prestress jack. The prestressed jack had already been purchased so the block
needed to be able to fit the jack inside. This gave the minimum dimensions of the cut
out to be 120mm x 110mm. The other main limitation was the overall width of the
block. As the block needed to sit flush with the face of the headstock in order to
construct the laminate, the overall width was limited to that of the headstock of
220mm. A detailed design drawing of the jacking block is provided in Appendix D.
35

Design Methodology Chapter 3
Figure 3.5 - 3D Jacking block concept drawing
The jacking block was constructed from a polymer concrete material. The design
properties of this material are outlined in Table 3.2.
Table 3.2 - Polymer concrete design properties Modulus of Elasticity, I 9700 MPa
Modulus of Rigidity, G 3500 MPa
Tensile strength, f’ct 20 MPa
Compressive strength, f’cc 68 MPa
The design checks the localised stress on both the jacking block and the headstock
during the application of prestress. The stress on the jacking block from the head of
the hydraulic prestress jack is shown below:
36

Design Methodology Chapter 3
MPaAPe 9.78
3167250000
===σ
As this is greater than the compressive strength of the concrete, a steel bearing plate
will need to be inserted between the jacking surface and the polymer concrete
bearing face. The area of this plate needs to be at least 4000mm2. The stress on the
concrete headstock face is:
MPaAPe 8.30
8107250000
===σ
The design compressive strength of the concrete should be sufficient to withstand the
local stress. A steel plate would minimise the chance of crushing if the concrete
strength was very close or less than the design strength.
After completing the design of the components of the prestress system, the
theoretical design strength of the prestressed headstock can be calculated.
3.4.3 Theoretical Design Capacity of the Prestressed Specimen After considering the design of the prestressing system, the capacity of the
prestressed specimen can be analysed. The same constraints apply to the prestressed
specimen as they did for the standard specimen. The specimen must fail in shear to
be able to assess the methods of shear strengthening. In order to guarantee this shear
failure, the moment capacity, Mu, will again be calculated. The design properties of
the test specimen are outlined in Table 3.3.
37

Design Methodology Chapter 3
Table 3.3 - Section and material properties Concrete compressive strength, f’c 32 MPa
Concrete γ 0.822
Concrete Modulus of Elasticity, Ec 25600 MPa
Prestress yield strength, fpy 588 MPa
Prestress Modulus of Elasticity, Ep 26800 MPa
Prestress force applied, Pe 250kN
Prestress cross-sectional area, Ap 3480 mm2
Section gross cross-sectional area, Ag 92400 mm2
Second moment of area, Ig 1.36 x 10⁹
As for the standard specimen, it is assumed that the compressive steel will not yield.
Therefore to apply the equilibrium equation, the compressive steel must be expressed
in terms of dn. Once again we end up with a quadratic equation which must be solved
with respect to dn. This equation is derived below.
Cc + Cs – Ts – Tp = 0
where:
( )n
ns d
dC
541024.0 6 −
×= N
Cc = 4.919 x 10³ dn N
Ts = 300 x 103 N
Tp = 250 x 103 N
38

Design Methodology Chapter 3
This yields the quadratic equation:
12960310919.40 2 −−= nn dd
Solving with respect to dn gives:
dn = 92mm
Checking the assumption that only the tensile steel yields:
( ) 0012.092
5492003.0 =−
=scε
( ) 0089.092
92366003.0 =−
=stε
As εsc < εsy the compressive steel has not yielded and therefore that assumption was
correct. εst > εsy and therefore has yielded and that assumption was also correct.
Hence the dn of 92mm can be accepted and the moment capacity calculated.
( ) ( ) ( ) ( )5410992
92822.0104522101025036610300 3333 ××−⎟⎠⎞
⎜⎝⎛ ×
××−××+××=uM
Mu =140 kNm
The ultimate load required to cause bending failure is calculated as:
Pu = 140 x 106 x 1920
580 x 1340
Pu = 346 kN
39

Design Methodology Chapter 3
Once again this load is under predicted using the above formula. The more accurate
prediction obtained from software analysis is:
Pu = 580kN
This is again shown in Appendix C.
Now the shear capacity of the prestressed specimens needs to be predicted to ensure
that shear failure will still occur. As the shear resisted by the reinforcing steel
remains unchanged the steel shear capacity, Vus, remains the same. The calculation of
Vuc however has some extra terms to include the prestress force. This is shown
below:
( )vdec
v
cptstvuc PV
dbfAA
dbV ++⎥⎥⎦
⎤
⎢⎢⎣
⎡ +=
31
0
'
0321 βββ
The extra terms in this equation include the shear component of the decompression
moment, Vdec, the vertical component of the prestressing force, Pv, which in this case
is 0 as the prestress is at the centroid, and the area of the prestressing tendon, Apt.
In order to calculate Vdec it is necessary to calculate the decompression moment. This
is calculated using this formula:
b
gb
ggdec y
Iy
IPe
APM
⎥⎥⎦
⎤
⎢⎢⎣
⎡+=
2101036.1210
1036.10250000
92400250000 9
9
×⎥⎦⎤
⎢⎣⎡
××
+=
kNmM dec 5.17=
40

Design Methodology Chapter 3
From this information the shear component, Vdec, can be calculated. The formula for
Vdec is:
( )**
VMM
V decdec =
For the purposes of these design calculations, M* and V* have been assumed as being
equal to Mu and Vu calculated in section 3.3. This gives a Vdec of:
( ) kNVdec 4.25
1014810102
105.17
36
6
=
××
×=
Substituting these values into the original formula yields for failure over the short
shear span:
( ) 025400366220
323480600366220877.11375.13
1
++⎥⎦⎤
⎢⎣⎡
××+
××××=ucV
= 269.5 kN
Therefore the total shear capacity of the section is:
Vu = 290 kN
and:
Pu = 290 x 1920 = 415 kN 1340
The shear capacity for failure over the long shear span is:
41

Design Methodology Chapter 3
( ) 025400366220
32348060036622011375.13
1
++⎥⎦⎤
⎢⎣⎡
××+
××××=ucV
= 155.5 kN
Therefore the total shear capacity of the section is:
Vu = 176 kN
and:
Pu = 176 x 1920 = 582 kN 580
3.5 Design Summary The final design of the specimen remained unchanged from the original drawing
shown in Figure 3.2. The design capacity of both the standard and prestressed
specimen is set out in Table 3.4. All the design objectives relating to the test
specimens have been met. The main objectives were:
- The specimens must fail in shear, hence Pu should be significantly greater
than Vu;
- The failure loads must be less than the 600kN capacity of the test
equipment;
- Stress in the prestress system should be less than the elastic limit of the
material.
42

Design Methodology Chapter 3
All three of these objectives have been satisfied with this design.
Table 3.4 - Headstock design summary
Design Characteristic Standard Prestressed
Ultimate Moment Capacity, Mu 102kNm (420kN) 140kNm (580kN)
Ultimate Shear Capacity (Short Shear Span), Vu
148kN (212kN) 290kN (415kN)
Ultimate Shear Capacity (Long Shear Span), Vu
89kN (294kN) 176kN (582kN)
**Ultimate loads required to cause failure mode shown in brackets
43

Experimental Methodology Chapter 4
Chapter 4
Experimental Methodology
4.1 Introduction In order to assess the affects of the strengthening and the accuracy of the design
equations, three headstocks were required to be constructed. This chapter outlines the
distinct phases of the construction and testing process. In each step of the process
consideration was given to the relevant construction standards to ensure that the
results would be comparable to those achieved in real life situations.
4.2 Test Specimens As previously mentioned three test specimens were constructed. Each of these
specimens were cast in the same manner using the same formwork to ensure
uniformity of the test specimens. The treatment outline for each specimen is shown
below in Table 4.1.
Table 4.1 - Design specimen details
Specimen Number Repair Treatment Prestress Force
1 None None
2 Prestress Only 250kN
3 Epoxy and Prestress 250kN
44

Experimental Methodology Chapter 4
Each specimen was constructed exactly the same to ensure that a comparison of the
results could be made between the different strengthening methods. Specimen 1 was
loaded until failure and no repair made. This specimen represents the control
headstock which forms the baseline for comparison of the repair methods.
Specimens 2 and 3 were preloaded to simulate shear failure. This was used to create
a shear crack of similar dimensions to the real headstock. Specimen 2 was then
repaired using prestress only and then loaded until complete failure. Specimen 3 was
repaired initially with epoxy and then prestressed. It was then loaded to complete
failure and the increase in strength noted.
4.3 Construction of the Specimens
4.3.1 Concrete The test specimens were constructed on campus in the civil engineering laboratory of
University of Southern Queensland. There were six main stages of the construction
of the concrete specimens. These stages were:
1. Organising the steel reinforcement
2. Preparing the timber formwork
3. Preparing the strain gauges
4. Pouring the concrete
5. Curing
6. Preparing the specimens for testing
These stages are discussed in detail in the following pages.
4.3.1.1 Reinforcing The steel reinforcement required for these specimens was regular ‘N’ Type
reinforcement. The reinforcing cages were supplied locally through OneSteel
Toowoomba. The reinforcing diagram is shown below in Figure 4.1.
45

Experimental Methodology Chapter 4
Figure 4.1 - Reinforcement Diagram
The reinforcing diagram shows the top two bars in the beam part of the headstock.
These bars were bent 90° and used as part of the pier reinforcing. This was done for
simplicity of assembly of the cages.
The steel for the cages was supplied cut to length and assembled on site. The main
reinforcing bars and shear ligatures were supplied pre bent to the design
specifications. This was done to cut down on time required for assembly of the
cages. Figure 4.2 shows the tying of the reinforcing cages.
46

Experimental Methodology Chapter 4
Figure 4.2 - Tying the steel reinforcing cages
Each of the three cages was tied at the same time to ensure consistent assembly.
Standard mild steel reinforcing ties were used in the assembly process. Once the
cages were assembled they were ready for attachment of the strain gauges which is
discussed later in this chapter. Figure 4.3 shows the finished cage prior to the
attachment of the strain gauges. Figure 4.3 also shows the extension of the pier
reinforcement up into the main beam. This ensures the headstocks are able to handle
the prestressing force on the ends of the specimen.
47

Experimental Methodology Chapter 4
Figure 4.3 - Assembled Reinforcing Cage
4.3.1.2 Formwork The formwork was constructed by the technical staff in the Civil Engineering
Laboratory. An important factor in the construction of the formwork was that it
needed to be able to be disassembled and reassembled on numerous occasions. This
particular formwork was required for five specimen castings at least. This meant the
construction materials were required to be quite robust. Figure 4.4 shows the
formwork after removal of a specimen. The formwork was constructed of 70mm x
38mm radiata pine framing and 16mm marine grade ply. The ply was chosen due to
its water resistant qualities and also the shiny surface for casting. Prior to the
concrete pouring the entire formwork was generously coated with oil to prevent the
concrete bonding to the formwork. This made the removal of the specimen much
easier. The right edge of the formwork in Figure 4.4 was designed to be easily
removed to enable removal of each specimen.
48

Experimental Methodology Chapter 4
Figure 4.4 - The Formwork
It was important that after each casting the formwork was thoroughly cleaned to
ensure there were no imperfections in the next specimen. Once the formwork had
been cleaned and oiled it was ready for the placing of the reinforcement prior to
pouring.
4.3.1.3 Strain Gauges To ensure the behaviour of the internal reinforcing was monitored strain gauges were
strategically placed on the reinforcing cages. For each specimen there were eight
strain gauges placed inside the specimen attached to the steel reinforcing. These
strain gauges were of the type FLA-2-11. The gauges were supplied from Tokyo
Sokki Kenkyujo Co. Ltd in Japan. A data sheet of the strain gauge calibration
information is supplied in Appendix E.
49

Experimental Methodology Chapter 4
In order to ensure the strain gauges worked properly a good bond between the gauge
and the reinforcing steel was required. The steel surface of the N16 bars was the
regular ribbed style. This was ground off using an electric angle grinder to obtain a
flat surface. This was not necessary on the R6 shear ligatures as they were already
quite smooth. The surfaces of both the N16 and the R6 steel were then finely sanded
using emery tape.
Once the surface was sufficiently smooth the area was cleaned using acetone to
ensure a good bond. The strain gauges were applied to the steel using CN adhesive.
This is a fast curing epoxy adhesive which ensures a rapid bond with the surface of
the steel. The adhesive was applied over the surface of the strain gauge and then the
strain gauge held firmly on the reinforcement for 30 seconds to allow the adhesive to
cure.
Care was taken during this process to ensure the bare wires of the strain gauges were
not crossed over or touching each other during the fixing. Once this was checked the
strain gauges were sealed using a wax. This was done to prevent any water entering
the area and causing a debonding of the strain gauge. Finally the area was sealed
using waterproof tape. This ensured no damage was done to the strain gauges during
the pouring of the specimen.
50

Experimental Methodology Chapter 4
Figure 4.5 - Strain gauge fixed to shear Figure 4.6 - Strain gauge fixed to tensile ligature reinforcement It was important to ensure these strain gauges were all working prior to the pouring
of the concrete. The resistance of each strain gauge was checked with an ohm-meter
prior to the pouring of the concrete and again after the concrete pour. This was done
to confirm the working order of each gauge prior to the curing of the concrete.
The strain gauges were located at the midpoint of the shear ligatures. They were
attached to the shear ligatures through which the shear crack was expected to
develop. This was the third shear ligature from each end. One strain gauge was
attached to each leg of these two ligatures. This gave a total of four shear strain
gauges. The remaining four strain gauges were attached to the tensile and
compression reinforcement. These were attached at the midpoint of the beam on each
side of the beam. This gave two strain gauges for measuring strain in the tensile
reinforcement and two gauges for measuring strain in the compression
51

Experimental Methodology Chapter 4
reinforcement. These were attached to the System 5000 data logging system during
the testing process. This is discussed later in this chapter.
4.3.1.4 Pouring Concrete When the reinforcing and formwork had been prepared the specimens were ready for
casting. The reinforcing cage was placed into the oiled formwork and supported at
the correct height from the base using reinforcing chairs. These plastic chairs were
placed around the formwork and supported the reinforcing cage at a distance of
50mm from the face of the concrete.
To facilitate easy moving of the cured specimens, special M16 ferrules were cast into
the top of the specimen. These ferrules enabled a threaded lifting lug to be screwed
into the top of the headstock to allow attachment of a chain to manoeuvre the
specimens in and out of the testing laboratory. To ensure the ferrules could not pull
out of the concrete they were attached using a bent N16 bar as shown in Figure 4.7.
The bar was tied to the reinforcing cage using wire ties and this helped to ensure the
lifting forces were distributed through the reinforcing cage.
52

Experimental Methodology Chapter 4
Figure 4.7 - Lifting ferrules
Once all the reinforcing was positioned the specimen was ready for pouring. The
concrete was supplied in a ready mix form from a local supplier. The concrete was
ordered at 32MPa compressive strength and 80mm slump. The formwork was
positioned to allow easy placement of the concrete through the chute on the rear of
the concrete truck. Once the concrete was checked for slump it was poured and
vibrated into place. At the same time seven 100mm diameter test cylinders and two
150mm diameter test cylinders were poured. These were used later to perform tensile
and compression tests to assess the concrete strength. Once the concrete had started
to cure, it was trowelled off for a smooth finish.
53

Experimental Methodology Chapter 4
4.3.1.5 Curing Once the specimens were poured they were left in the formwork for three days.
During this time the specimen was covered with plastic and watered daily to ensure it
did not undergo premature surface curing and develop small surface cracks.
After three days the specimen was removed from the formwork and placed outside to
air cure for at least 28 days. The test cylinders were also removed from their moulds
and placed with the headstocks to cure under the same conditions. This ensured the
concrete in the test cylinders was the same as the concrete in the specimens.
4.3.1.6 Preparing specimens for testing Once the specimens had cured for 28 days they could be prepared for testing. The
first step in the preparation was to move the specimens around from the construction
laboratory to the testing laboratory. This was done using a forklift as each specimen
weighed around 600kg. Once the specimens were in the laboratory they were moved
around on a gantry with a chain block. This enabled the specimens to be placed
under the testing equipment ready for testing.
The other important step in preparing the specimens for testing was the attachment of
the strain gauges to the data logger. The strain gauges were connected using a
standard 9-pin sub D connector. This required soldering these connectors onto each
strain gauge. Figure 4.8 shows a connector being soldered onto the strain gauge
wires.
Once a connector had been attached to each strain gauge the specimen was ready for
testing.
54
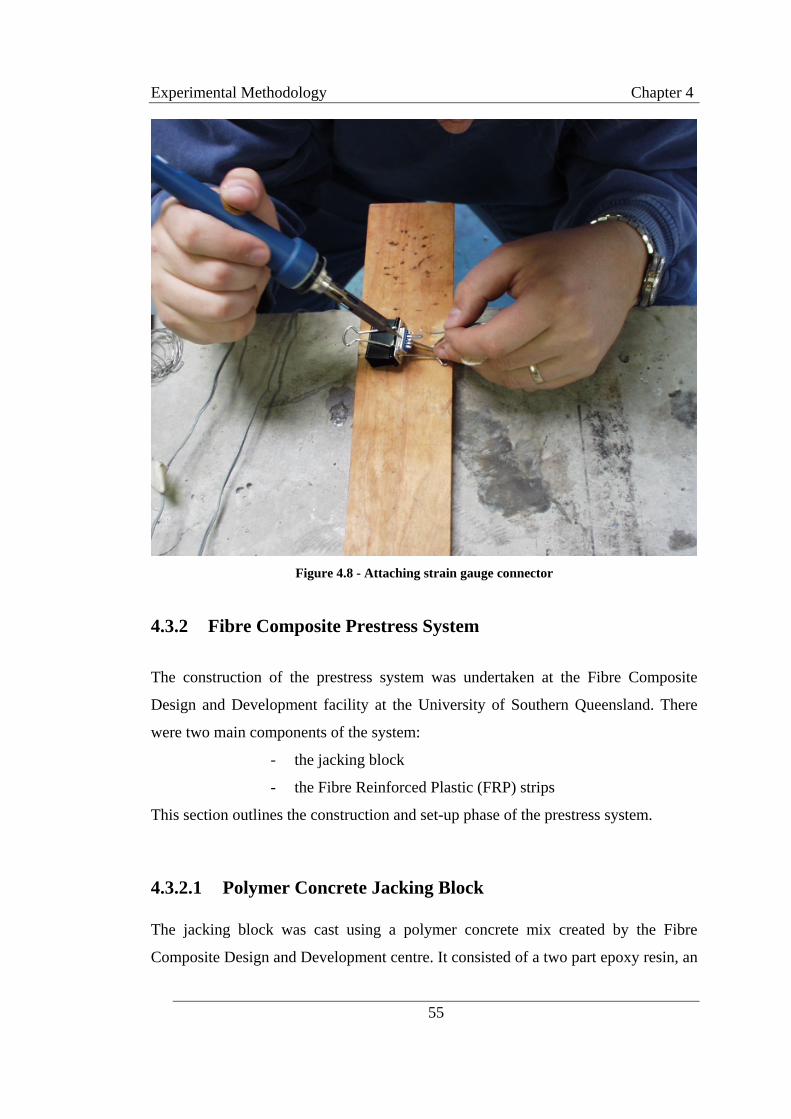
Experimental Methodology Chapter 4
Figure 4.8 - Attaching strain gauge connector
4.3.2 Fibre Composite Prestress System
The construction of the prestress system was undertaken at the Fibre Composite
Design and Development facility at the University of Southern Queensland. There
were two main components of the system:
- the jacking block
- the Fibre Reinforced Plastic (FRP) strips
This section outlines the construction and set-up phase of the prestress system.
4.3.2.1 Polymer Concrete Jacking Block The jacking block was cast using a polymer concrete mix created by the Fibre
Composite Design and Development centre. It consisted of a two part epoxy resin, an
55

Experimental Methodology Chapter 4
aggregate and finally a filler. The finished mix is shown in Figure 4.9. The finished
product is a high strength concrete with a compressive strength of 68MPa and a
tensile strength of 20MPa. The technical data relating to the composition of this
concrete and the test data is supplied in Appendix F.
Figure 4.9 - Polymer concrete mix
The mix was cast into a mould as shown in Figure 4.10. The mould was constructed
from laminated MDF board and thin mild steel sheeting. As the face of the block was
semi-circular the mould had to be constructed with a steel sheet. To stop the polymer
mix from bonding to the mould a coat of wax was applied to all the components prior
to pouring to ensure the block was easy to remove.
The reinforcing is placed in the mould prior to pouring. The particular reinforcing
used in this case was an F52 mesh which was placed at 25 mm from the surface of
the block. There were also three N16 Bars placed in the face of the block.
56

Experimental Methodology Chapter 4
The blocks were cast over a five day period. They were cast in the afternoon of one
day and removed the following morning. This process continued until four blocks
had been made.
Figure 4.10 - Jacking block mould
Once the blocks had all been cast and the concrete headstocks had undergone the
preliminary loading, the jacking blocks could be set in place. The blocks were
attached to the headstocks using glass pins. Small 10mm diameter holes were drilled
in the ends of the headstock and in the legs of the jacking block. These blocks were
then mounted on each end of the headstock and held in place using packaging straps.
Figure 4.11 shows the jacking blocks mounted on the headstock ready for the
application of the FRP laminate.
57

Experimental Methodology Chapter 4
Figure 4.11 - Jacking blocks in place on headstock
4.3.2.2 FRP Laminate
Once the jacking blocks were in place the laminate could be constructed around the
headstock. The laminate consists of ten layers of glass fibre which is impregnated
with an epoxy resin.
For these specimens the glass fibre used was a Uniglass material with 500 grams of
glass per square metre. There were ten strips cut of six metres in length. These were
wrapped continuously around the headstock with varying overlaps. The resin used
was a UV resin which cures under exposure to UV light.
The first step in creating the laminate was to coat the concrete, around where the
strips would be applied in resin. Once the entire area had been coated the first layer
of glass was applied and the glass was then impregnated with more resin. Once this
58

Experimental Methodology Chapter 4
was sufficiently coated the resin was covered with a layer of prepreg paper. This
paper produces a good surface when removed for the adhesion of the next layer.
Once the resin was covered it was taken out in direct sun and allowed to cure for five
to ten minutes. Once the laminate had hardened it was taken back inside and the next
layer was applied. This process was repeated until the ten layers had been applied.
Figure 4.12 shows the first layer of the glass fibre being applied to the headstock.
Figure 4.12 - Application of the FRP laminate
Once the ten layers had been applied to the headstock using this process, the entire
headstock was cured in an oven for 12 hours. This speeds up the curing time of the
laminate and the polymer concrete blocks. Once the curing was complete the
specimens were ready for testing.
59

Experimental Methodology Chapter 4
4.3.2.3 FPR Laminate Strain Gauges In order to monitor the prestress force being applied to the headstock, strain gauges
were placed at points along the laminate. For this test four strain gauges, of the type
PFL-30-11, were placed on the surface of the laminate. The calibration information
for these gauges is supplied in Appendix E. The first strain gauge was placed at the
tip of the laminate around the face of the jacking block. This was used to monitor the
strain in the face of the laminate around the jacking block. The three remaining
gauges were placed along one side of the laminate, two at around one quarter
distance from the end and one at the centre of the headstock. These were used to
monitor the prestress force being applied.
These gauges were applied in a similar fashion to the steel gauges. The surface was
sanded smooth using emery tape and the area cleaned using acetone. Finally the
gauges were attached using the CN adhesive. Once again care was taken to ensure
the wires coming from the strain gauge were not in contact with each other. The
standard 9-Pin sub D connector was again soldered to the wires to enable interfacing
with the System 5000 data logger. Figure 4.13 shows the location of the strain
gauges on the test specimen.
60

Experimental Methodology Chapter 4
Figure 4.13 - FRP Laminate strain gauges in place
Once the strain gauges were applied the specimen was ready for prestressing and
testing.
4.3.2.4 Preparation of Specimens for Testing Once the strain gauges are installed and the connectors attached the specimens were
ready for the final testing. In order to apply the prestress force the packaging straps
were removed to allow the prestress forces to be applied. The specimens were placed
under the test equipment using the gantry and chain block. Once they were centrally
located the internal and external strain gauges were connected to the data logger. The
test equipment was set-up and the testing was ready to commence.
61

Experimental Methodology Chapter 4
4.4 Application of Epoxy Specimen 3 for this research was repaired using the epoxy injection method of
rehabilitating cracks. This method is relatively new but is thought to produce
excellent results in the shear strengthening of headstocks. The repair method is a two
step process which is described in detail in this section.
4.4.1 Application of External Sealant The first stage in epoxy repairing was to seal the cracks on the surface of the
specimen. This was done to prevent the epoxy from leaking out of the cracks during
the second injection stage. The sealant used for this project was the Lokset E. This is
a two part epoxy paste which has a relatively high viscosity giving it a pasty
appearance. The technical data relating to the epoxy is supplied in Appendix G. The
mixture was applied to the surface of the specimen over the cracks as shown in
Figure 4.14.
During the application of the paste special injection nozzles were placed on the
surface and the sealant applied around them. This provides injection points for the
connection of the injection hose during the second stage.
62

Experimental Methodology Chapter 4
Figure 4.14 - Epoxy sealant
The paste was left to cure for a minimum of 24 hours to allow it to gain sufficient
strength to handle the pressure of the injection equipment
The second stage was the injection of the low viscosity crack sealant. For this
research project Nitofill LV was used. This is a two part epoxy base and hardener
mix which has a compressive strength of 83MPa. The technical information relating
to this product is provided in Appendix E. This mix was injected through the nozzles
placed in the first stage from the bottom up. Initially the injection pipe was connected
to the lowest nozzle and the resin injected in until it started to flow out of the higher
nozzles. Figure 4.15 shows the shear cracks being injected with the epoxy resin.
Once the resin had started to flow out at the top, the crack has been sufficiently filled
with resin. This was left to cure for 7 days before testing.
63

Experimental Methodology Chapter 4
Figure 4.15 - Epoxy injection Figure 4.15 - Epoxy injection
4.5 Testing Specimens 4.5 Testing Specimens Testing of the specimens was conducted over five days. Each test took approximately
one day to complete. Specimen 1 was tested once as it was the control headstock.
Specimens 2 and 3 were tested twice – once for preloading and the second time for
the failure load. This section gives an overview of the testing equipment and the
testing procedure for each specimen.
Testing of the specimens was conducted over five days. Each test took approximately
one day to complete. Specimen 1 was tested once as it was the control headstock.
Specimens 2 and 3 were tested twice – once for preloading and the second time for
the failure load. This section gives an overview of the testing equipment and the
testing procedure for each specimen.
4.5.1 Test Setup 4.5.1 Test Setup The testing of the specimens was carried out in the Civil Testing Laboratory of the
University of Southern Queensland. The test equipment included the following
apparatus. For the tests without prestressing, the equipment list included:
The testing of the specimens was carried out in the Civil Testing Laboratory of the
University of Southern Queensland. The test equipment included the following
apparatus. For the tests without prestressing, the equipment list included:
Experimental Methodology Chapter 4
64
64

Experimental Methodology Chapter 4
1. System 5000 Data Logger
2. Load Variable Displacement Transducer (LVDT)
3. Loading frame
4. 60 tonne hydraulic jack
5. 440kN load cell
For the tests where a prestress force was being applied an extra 30 tonne hydraulic
jack was required to apply the prestress force.
4.5.1.1 System 5000 Data Logger The System5000 data logger is a 20 channel data capture device. The logger records
data at specified time intervals during the duration of the testing. This enables the
capture of load and strain data at regular intervals for analysis after testing. It also
enables real time monitoring of the loads applied to ensure they are within the limits
of the test equipment. This is done through the on screen display of the computer.
Figure 4.16 shows the data logger set up ready for testing.
65

Experimental Methodology Chapter 4
Figure 4.16 - System 5000 data logger
4.5.1.2 Load Variable Displacement Transducer (LVDT) The LVDT transducer is an electronic dial gauge. This was used in the testing to
monitor the deflection of the headstock at the point of loading. This was connected to
the data logger to record the deflection at one second intervals. Figure 4.17 shows the
transducer installed on the test specimen during a test procedure. The magnetic base
was attached to a heavy steel stand to stop the transducer from moving during the
test.
66

Experimental Methodology Chapter 4
Figure 4.17 - LVDT deflection transducer
4.5.1.3 Loading Frame The loading frame was the support used to jack against during the application of the
failure load. This frame is constructed of two main vertical supports and a horizontal
cross member. The frame is constructed from 14mm steel plate with welded joints.
The two main vertical supports are an ‘I’ Beam with pre-drilled mounting holes for
the cross member. This cross member can be moved up and down the frame using
the chain block and is supported on the frame by 12 20mm diameter high strength
steel bolts.
67

Experimental Methodology Chapter 4
Figure 4.18 - Loading Frame
The frame, shown in Figure 4.18, is attached to the floor using 2 30mm diameter
high tensile steel bolts. A tensile test has been conducted on both the bolts and the
concrete floor and it has been determined that both are capable of sustaining 300kN
loads. This ensures that the frame is able to take the full force of the 60 tonne
hydraulic jack.
68

Experimental Methodology Chapter 4
4.5.1.4 60 Tonne Hydraulic Jack In order to apply the load to fail the specimens a large jack was required. The 250kN
Instron hydraulic ram was assessed to be insufficient to fail the test specimens. In its
place a 60 tonne (588kN) manual hydraulic jack was installed. The jack was bolted
to the loading frame and this was used as the loading apparatus. The applied load
was monitored using the 440kN load cell which was placed between the test
specimen and the jack face. The jack used was a two way hydraulic hollow core jack.
The two way system allows the jack to be both extended and retracted using the
hydraulic pump. Figure 4.19 shows the loading system. The manual pump was also
fitted with a pressure gauge which provided a crude monitoring of the load being
applied.
Figure 4.19 - 60 tonne hydraulic jack
(Courtesy of FCDD)
69

Experimental Methodology Chapter 4
4.5.1.5 440kN Load Cell The load cell, shown in Figure 4.20, was used to monitor and record the load being
applied to the test specimen. This data was captured using the data logger and then
examined during the analysis of the results. The location of the load cell was between
the jack face and the top surface of the test specimen. To ensure the load was
distributed evenly large plates were placed between the jack and the load cell and the
load cell and the concrete.
Figure 4.20 - 440kN Load Cell
4.5.1.6 30 Tonne Hydraulic Prestress Jack The 30 tonne jack was used to apply the prestress force to the headstock. This jack
had specific size limitations as it needed to fit inside the polymer concrete jacking
blocks. The jack was quite compact in comparison to the 60 tonne jack used to load
the specimens. It had a diameter of 103mm and a retracted height of 125mm. The
70

Experimental Methodology Chapter 4
stroke of this jack was 60mm. This jack was a single action jack with a spring return.
Figure 4.21 shows a picture of the particular jack used for this testing.
Figure 4.21 - 30 tonne Hydraulic Prestress Jack
4.5.2 Testing Procedure
The specimens were placed under the frame and the various treatments applied. This
section details the test procedure for each specimen.
Specimen 1 was the control headstock. This test was placed under the loading frame
and the load applied at a constant rate. This was monitored using the System 5000
and recorded against the steel strains and the deflection. This data was used after
71

Experimental Methodology Chapter 4
testing for comparison with the theoretical results. The data logged in this specimen
was also used to compare the results obtained through the various strengthening
methods.
Specimens 2 and 3 were initially loaded in the same way as specimen 1. The load,
deflection and steel strains were monitored while the loading was applied. A load
was applied to the specimen until the desired shear crack had formed. The load
required to induce this crack was recorded. Due to variances in concrete strength
however, different loads were required to induce the same size shear crack. Once the
desired shear cracking had occurred the load was released and the residual deflection
and strains recorded.
Specimen 2 was then repaired using the application of prestress only. The specimen
was taken to Fibre Composite Design and Development (FCDD) for the construction
of the prestress system. Once the laminate had cured it was returned to the laboratory
for prestressing and final testing. Figure 4.22 shows specimen 2 after returning from
FCDD. The prestressing system is installed and ready for the prestress force to be
applied.
72

Experimental Methodology Chapter 4
Figure 4.22 – Prestressed specimen ready for testing
Specimen 3 was repaired using an epoxy, to seal the cracks, prior to the application
of prestress. After the epoxy had sufficiently cured the specimen was then sent to
FCDD for the installation of the prestress system. Again once the laminate had cured
the specimen was returned to the laboratory for testing.
The final tests on specimens 2 and 3 were conducted in the following manner. The
strain gauges installed on the laminate and the steel reinforcement were connected to
the data logger so the effect of the prestress could be monitored during the
application. The prestress jack was installed at one end and a small 50kN prestress
force was applied to that end first and then released. This was done to help break the
initial bonds of the laminate to the face of the headstock. Once this was achieved
jack was released and placed inside the other jacking block. This time the full 250kN
prestress force was applied to the jacking block. The force was monitored using the
strain gauges placed on the laminate.
73

Experimental Methodology Chapter 4
Once the full prestress force had been applied the jacking blocks were supported
away from the headstock using steel plates. These plates allowed the prestress jack to
be released whilst maintaining the full 250kN prestress force. Once the jack had been
removed the final loading of the headstock could begin.
Specimen 2 and 3 were then loaded using the 60 tonne hydraulic jack to a point of
complete failure. Once again the load, deflection, steel strains and laminate strains
were all monitored and recorded using the System 5000. This ensured the behaviour
of the laminate during the loading could be analysed after the testing was complete.
The initial cracking loads and the failure loads were noted as the testing was carried
out.
Once the specimen had failed it was important to release the prestress load to ensure
that no residual stress was left in the laminate. This was carried out using the
prestress jack to take the force off the support plates for the jacking block and then
removing the plate and releasing the jack. Once the prestress force had been released
the laminate could be removed to inspect the specimens for the cracking mode.
After the specimens were inspected they were removed from the laboratory using the
gantry and chain block.
4.6 Health and Safety Issues During the duration of this project several safety issues arose. As with any project
with large scale testing there are many opportunities for people involved to suffer
injury or quite possibly death if each safety issue is not identified and dealt with in a
timely manner.
The construction of the test specimens brought to light several possible causes for
injury. The reinforcing steel has the potential for severe injury if a person fell or was
hit by a piece during assembly. The edges of the reinforcement were quite sharp
74

Experimental Methodology Chapter 4
giving potential for cuts. Obvious hazards were also identified during the pouring of
the concrete. If a person was to swallow a large amount of concrete this could cause
health problems.
Due to the shear size of the test specimens there is the possibility of severe injury or
death from a specimen falling on a person. This was identified as a major hazard
early on. It was decided early on that any person working on or near the testing area
would be required to wear steel capped shoes. This could prevent injury from
dropping heavy equipment or specimens.
The test equipment used, in particular the hydraulic loading jacks, work using
pressurised oil. This means that at any point during loading a damaged jack hose may
split causing injury to people within the test area.
To eliminate the number of people affected by these hazards, only people who were
required to be in the room during testing were allowed in the area.
Other health hazards became apparent during the construction and set-up of the fibre
composite components of the prestress system. Due to the nature of the materials
used in this system, various health problems could be identified if correct safety
equipment was not worn. Safety glasses, breathing apparatus and good protective
clothing were required for anyone working in the vicinity of the composite materials.
Complete risk identification and management sheets are compiled, for every
potential hazard identified, in Appendix H. This covers the identification of the
hazards, the possible risk and the management of the risk.
75

Discussion of Results Chapter 5
Chapter 5
Discussion of Results 5.1 Introduction This chapter examines the results obtained during the testing of the specimens. This
chapter aims to try and explain the reasons for these results.
The discussion of the results will include the following analysis:
- Concrete and steel strengths;
- Analysis of crack observations;
- Loads and deflections of each specimen;
- The recorded strains in the reinforcing steel;
- The behaviour of the FRP laminate; &
- Compare the test results with the predicted AS3600 results
The discussion will show the variance between the test results and the predicted
results and that the standard can not be readily applied to the strengthening of
headstocks through post-tensioning after initial cracking has occurred.
76

Discussion of Results Chapter 5
5.2 Concrete and Reinforcement Strength The importance of performing slump tests when the concrete is delivered was
highlighted during the compression testing of the concrete samples. Due to budget
constraints only one specimen formwork could be constructed. This meant that only
one test specimen could be constructed per day. To construct the three test specimens
required three different batches of concrete. To ensure that a comparison between the
results could be made, test cylinders were poured to evaluate the concrete strength.
On the day of pouring for each specimen slump tests were also performed. A
comparison between the concrete strengths and slump tests of each specimen is
shown in Table 5.1. A spreadsheet of the collected compression test results and
resulting concrete strength is shown in Appendix I.
Table 5.1 - Concrete strength
Test Specimen Slump Test Concrete Strength
Supply Specification 80mm 32 MPa
Specimen 1 130mm 22.2 MPa
Specimen 2 40mm 39.3 MPa
Specimen 3 300mm 17.8 MPa
It should first be noted the difference between the specified concrete requirements
and what was received. There was a large variance in the concrete strengths and a
large variance in the concrete slump. From this information we can clearly see that
there is a correlation between slump and concrete strength. Figure 5.1 shows the
correlation between slump and concrete strength. It is difficult to prove that this is an
accurate depiction of the link with the small number of samples taken in this
research. It does show quite clearly though that there is a dramatic decrease in
strength between concrete slump of 40mm to 120mm.
77

Discussion of Results Chapter 5
Although the strength of specimen 2 was extremely high, the workability was quite
poor. The mixture was quite dry and difficult to work into place around the
reinforcement. There is a definite trade off between workability and strength in
standard concrete.
0
5
10
15
20
25
30
35
40
45
0 50 100 150 200 250 300 350
Slump (mm)
Stre
ngth
(MPa
)
Figure 5.1 - Concrete strength vs slump
Due to the significant differences in the specified concrete strength and the supplied
concrete strengths the predicted capacities outlined in Chapter 3 needed to be
evaluated with the actual concrete strengths. This would enable comparisons to be
made between the predictions and the actual results.
Like the concrete the reinforcement was tested to show that the specified design
values were largely different from the actual test results. A comparison of the values
assumed in the design and test values is made in Table 5.2. This shows that the
values assumed in the design were significantly smaller than the results obtained in
the testing.
78

Discussion of Results Chapter 5
Table 5.2 - Steel reinforcement test results
Type of Reinforcement Assumed Design Value,
Fsy
Actual Test Value,
Fsy
R6 Shear Ligatures 250 MPa 441 MPa
N16 Tensile and
Compression Reinforcement 500 MPa 581 MPa
As can be seen from the test data the yield values, particularly for the shear
reinforcement, were quite under estimated in the design process. The data obtained
from testing of the reinforcement is shown in Appendix J. This information was also
used in the recalculation of the AS3600 predictions.
5.3 Crack Observations During the testing of the headstocks the crack pattern was monitored over 50kN
intervals. This was done to monitor the progression of any shear cracks and
ultimately the failure pattern of each specimen.
Specimen 1 was the control headstock. This headstock was loaded once to a point of
ultimate failure. This was done to give a baseline to compare each of the
strengthening methods to. Figure 5.2 shows the specimen after failure.
79

Discussion of Results Chapter 5
Figure 5.2 - Specimen 1 crack pattern
As can be seen from the picture the standard headstock failure occurred over the
longer shear span. It was observed that flexural cracking first occurred at 100kN
load. This cracking did not develop much more than around 100mm from the bottom
of the beam. At 150kN it was observed that shear cracking had commenced
extending from the face of the pier over the shorter shear span. At 200kN this shear
crack had extended almost to the loading point with an average crack width of
0.5mm. That was all the cracking that occurred over the shorter shear span.
At 200kN the shear crack over the longer shear span had also started to develop. This
crack at this point extended about half way up the specimen. As the loading
increased to 250kN this crack extended to the loading point and the crack width had
reached 0.5mm. At 300kN this shear crack had opened up to almost 1.0mm. At the
ultimate failure load, 356kN, the crack width was recorded at 5.0mm. There had been
no change to the crack over the short shear span.
80

Discussion of Results Chapter 5
Specimen 2 was loaded twice – initially to generate shear cracking and again after
strengthening with prestress. The initial loading was applied to generate a failure
crack of 1mm width. The crack width was chosen as the comparative value due to
the variance expected in specimen failure loads from the varying concrete strengths.
If the concrete strength had been consistent each specimen could have been loaded to
the same failure load.
In the initial loading, the cracking occurred at the almost the same rate as specimen
1. The initial cracking however didn’t occur until around 180kN. This was due to the
substantial increase in concrete strength. The shear cracking progressed in the same
manner as specimen 1 and failure was again over the longer shear span. The load
required to induce the crack of 1mm width was 369kN. Figure 5.3 shows the
cracking after the ultimate failure of specimen 2. However all the cracks shown in
Figure 5.3, developed during the initial loading.
Due to the application of the wide prestressing strip it was difficult to monitor the
cracking developing. From the area which could be inspected, I noted that all of the
original cracks were opening up as the load increased. After the failure had occurred
the prestressing strip was removed to inspect the cracks. The failure of this specimen
once again occurred over the longer shear span. The ultimate failure load of this
specimen was noted to be 430kN.
The flexural cracking shown in Figure 5.3 also extended further up the specimen
during the secondary loading, much more than in the control headstock.
81

Discussion of Results Chapter 5
Figure 5.3 - Specimen 2 failure crack pattern
Specimen 3 responded much differently to the prestressing force than specimen 2.
The initial loading was the same as specimen 2, although the load to induce the 1mm
shear crack width was only 301kN. It should be noted here however that the
difference in concrete strengths between specimen 2 and 3 was 21 MPa. This
resulted in a much lower cracking strength. Once again the failure shear crack was
over the long shear span during initial loading.
Once the headstock was repaired using the epoxy injection method and prestressed, a
change in the crack pattern was observed. Figure 5.4 shows the crack pattern of the
specimen after failure.
82

Discussion of Results Chapter 5
Figure 5.4 - Specimen 3 failure crack pattern
The cracking which occurred in the initial loading is highlighted in black in Figure
5.4. These cracks were repaired using the epoxy injection method prior to the
application of the prestress wrap.
When the specimen was prestressed and loaded the cracking highlighted in red
occurred. The flexural cracking shown on the lower portion of the beam occurred
initially around 150kN. The shear crack over the short shear span was first noted
around 200kN. This crack continued to progress until failure occurred at 440kN. This
specimen was the only one to fail over the short shear span. Once again due to
prestress it was difficult to assess the width of this crack.
Overall the specimens showed consistency in the initial cracking. The main
difference to note is the effect of the epoxy and prestress to ultimate failure. The
effect of the epoxy concluded by this research is repairing a headstock to effectively
a new specimen. This combined with prestress produces the shear failure over the
short shear span.
83

Discussion of Results Chapter 5
This research concludes that the reason the failure of standard specimens occurs over
the long shear span is due to the span to depth ratio for the short shear span. The
section depth (420mm) is greater than that of the distance from the face of the
support to the loading point (390mm). It was concluded that the initial cracking over
the short shear span forms a compression strut which then increases in strength with
the increased loading.
5.4 Loads and Deflections The load - deflection response for all three specimens is similar under initial loading
conditions. There is a change when the different strengthening processes are applied.
Figure 5.1 shows the response for the control headstock. The first point of interest
occurs in the initial load. The start of the curve should simply extend linearly from
zero.
84

Discussion of Results Chapter 5
-50
0
50
100
150
200
250
300
350
400
-1 0 1 2 3 4 5 6 7 8
Deflection (mm)
Load
(kN
)
Figure 5.5 - Specimen 1 load - deflection curve The cause of this variance in the test specimen was due to some initial seating errors
in the testing. The support surface was not perfectly flat and tended to undergo
deflections with minimal load. This error is only minimal and therefore was not
taken into account in the analysis.
From 30kN to 250kN the curve is effectively linear, which is the expected behaviour
for concrete. From 250kN the curve starts to flatten out and the same increase in load
causes a much larger increase in deflection. This correlates to the increase in shear
crack width and hence the load is being transferred to the shear reinforcement.
As the load continues to increase and the shear crack starts to open more load is
transferred to the shear stirrups to the point where the majority of the load is being
taken on the reinforcement. As this load continues to increase the reinforcement
yields and the load starts to decrease whilst the deflection continues to increase. This
represents the shear failure of the specimen. As the load is released the deflection
decreases elastically to reveal the plastic deformation of the specimen of 4mm.
85

Discussion of Results Chapter 5
-50
0
50
100
150
200
250
300
350
400
450
500
0 1 2 3 4 5 6
Deflection (mm)
Load
(kN
)
Initial Loading After Strengthening
Figure 5.6 - Specimen 2 load - deflection curve
For specimen 2 the load - deflection response has two sections. The curve is shown
in Figure 5.6. The blue line represents the initial loading. Again there are the seating
errors initially associated with the initial 0-30kN range. From 30kN on the curve has
two distinct linear ranges. The first rang from 30 – 125kN shows a typical concrete
load deflection curve. At this point the load is being taken by the concrete only. Then
as the load continues to increase the loading of the shear reinforcement continues.
The curve remains linear but at a lower slope.
The change in slope at 125kN is due to a slip in the specimen during testing. As the
load increased the support piers started to rotate slightly. This caused a significant
crack to develop in the support piers. At 125kN in this specimen this crack “let go”
and caused this change in the load – deflection curve. After this point the load
continued to increase linearly with deflection at a faster rate. This was due to the pier
being able to rotate easier and allowing deflection to increase more rapidly.
86

Discussion of Results Chapter 5
The loading was ceased before the load had started to transfer to the shear
reinforcement as the desired crack width had been achieved. The specimen returned
almost to the point of zero deflection accounting for the initial seating errors. This is
due to the specimen remaining in the elastic region.
During the secondary loading after the application of the 250kN prestress, the
specimen followed almost the same curve as during initial loading. The curve is very
much linear again up to 370kN. At this point the load started to transfer to the shear
reinforcement and the curve flattens out.
It is important to note that specimen 2 failed in a much more brittle manner than
specimen 1. The load increase in the flatter section of the curve is only 50kN in
specimen 2. In specimen 1 this same section of the curve related to an increase of
100kN.
This research concluded that as the secondary loading opened up the original cracks
the effect of the prestress on this specimen was minimal. This caused the increase in
the slope of the curve. However the specimen failed in a much more brittle manner.
87

Discussion of Results Chapter 5
-50
0
50
100
150
200
250
300
350
400
450
500
0 2 4 6 8 10
Deflection (mm)
Load
(kN
)
12
Initial Loading After Strengthing
Figure 5.7 - Specimen 3 load - deflection curve Specimen 3 showed some different behaviour to that of specimens 1 and 2. Once
again Figure 5.7 shows some early seating errors in the range 0 – 30kN. Due to the
decreased concrete strength the initial loading of this specimen caused the load to
start to be transferred to the shear reinforcement. This is shown in the flattening of
the curve around 250kN. Figure 5.7 also shows there is a greater residual deflection
in this specimen.
The interesting thing to note about the secondary loading of this specimen is the
longer linear section of the curve. After being repaired with the epoxy and the
prestress, the linear section of the curve was increased from 250kN to 380kN.
Like specimen 2 however the specimen also failed in a brittle manner. The flatter
section of the curve again only shows an increase of 50kN unlike the 100kN in
specimen 1. This research concluded that the application of prestress causes a much
more brittle failure of the specimen.
88

Discussion of Results Chapter 5
A summary of the results achieved for each specimen is given in Table 5.3. There is
a significant increase in strength provided using the epoxy resin to repair the cracks
before applying prestress.
Table 5.3 - Summary of failure loads
Specimen Initial Load Failure Load % Increase
1 - 356 -
2 369 430 16%
3 301 440 46%
5.5 Steel Strain Analysis The predictions made by the AS3600 equations mean that the failure of the
specimens should occur before the failure of the tensile and compression
reinforcement. From the load deflection curves it can be seen that the shear
reinforcement yielded in all the test specimens. This gives the characteristic flat
section of the curve.
5.5.1 Shear Strain Due to the limited funds available at the time of construction, and the relatively high
cost of steel strain gauges, only four shear strain gauges could be used. This meant
that the path of the shear crack had to be estimated before the specimens were cast.
Specimen 1 and 2 failed over the long shear span and as such the shear strain gauges
were not greatly affected by this cracking. It should be noted that the yield strain of
the shear ligatures was calculated at 2200 micro strain and the failure strain was
calculated as 2700 micro strain. Figure 5.8 shows the maximum shear strain reached
in Specimen 1 was 800 micro strain. Although the specimen had failed in shear, the
89

Discussion of Results Chapter 5
shear ligature that was being recorded did reach the failure strain. One of the inherent
problems in monitoring shear is the limitations of the amount of data that can be
recorded.
-50
0
50
100
150
200
250
300
350
400
-100 0 100 200 300 400 500 600 700 800 900
Shear Stirrup Strain (micro strain)
Load
(kN
)
Figure 5.8 - Specimen 1 shear strain
Specimen 2 also had the same problem. The shear strain being recorded did not
indicate a shear failure had occurred. Figure 5.9 shows the specimen reached a
maximum strain of 800 micro strain.
Another interesting feature of Figure 5.9 is that the strain in the shear ligature after
prestressing was lower than the initial loading. It also shows that significant load is
required before the load starts to be transferred to the shear reinforcement. You will
note in Figure 5.9 that the strain in the initial loading reached 170kN before any
significant load was carried in the shear ligature. After prestressing this load was
increased to 250kN before any significant shear was recorded.
90
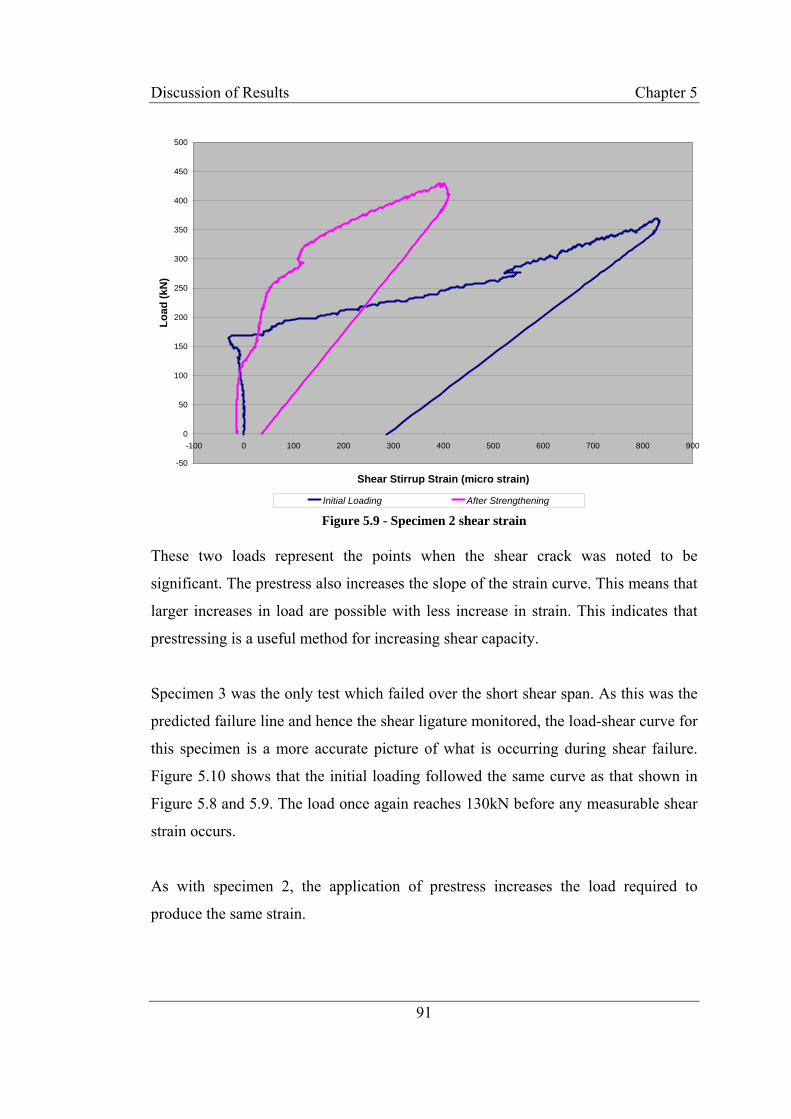
Discussion of Results Chapter 5
-50
0
50
100
150
200
250
300
350
400
450
500
-100 0 100 200 300 400 500 600 700 800 900
Shear Stirrup Strain (micro strain)
Load
(kN
)
Initial Loading After Strengthening
Figure 5.9 - Specimen 2 shear strain These two loads represent the points when the shear crack was noted to be
significant. The prestress also increases the slope of the strain curve. This means that
larger increases in load are possible with less increase in strain. This indicates that
prestressing is a useful method for increasing shear capacity.
Specimen 3 was the only test which failed over the short shear span. As this was the
predicted failure line and hence the shear ligature monitored, the load-shear curve for
this specimen is a more accurate picture of what is occurring during shear failure.
Figure 5.10 shows that the initial loading followed the same curve as that shown in
Figure 5.8 and 5.9. The load once again reaches 130kN before any measurable shear
strain occurs.
As with specimen 2, the application of prestress increases the load required to
produce the same strain.
91

Discussion of Results Chapter 5
-50
0
50
100
150
200
250
300
350
400
450
500
-500 0 500 1000 1500 2000 2500 3000
Shear Strain (micro strain)
Load
(kN
)
Initial Loading After Strengthening
Figure 5.10 - Specimen 3 shear strain Another interesting point to note about the initial loading is the centre section where
the strain decreases. At 270kN the strain suddenly increases from 500 to 750 micro
strain. This is due to a shear crack “letting go”. The concrete suddenly slips quickly
transferring a large load to the shear reinforcement. This gives the increase in strain
and decrease in load seen in Figure 5.10.
The final and possibly most important note about specimen 3 is the maximum shear
strain. The maximum shear strain recorded is 2800 micro strain. This is slightly
larger than the ultimate shear strain calculated as 2700 micro strain. This was the
only test specimen with recorded yielding shear strain due to the shear crack passing
through the shear ligature being monitored.
92

Discussion of Results Chapter 5
5.5.2 Compression Strain The compressive strain in the reinforcing steel recorded during testing was as
expected. It is important to note that the specimens were designed to fail in shear and
according to the design calculations, the moment capacity was significantly higher
than the shear capacity. The design calculations showed that the compression
reinforcement would remain in the elastic region even under ultimate moment
capacity. All of this means that the expected strain in the compressive reinforcement
prior to testing was expected to be less than the yielding strain.
-50
0
50
100
150
200
250
300
350
400
450
500
-500 0 500 1000 1500 2000 2500
Compression Reinforcement Strain (micro strain)
Load
(kN
)
Specimen 1 Specimen 2 Specimen 3
Specimen 2 (After Strengthening) Specimen 3 (After Strengthening) Figure 5.11 - Compression Strain
It is important to note from Figure 5.11, that the compression reinforcement
behaviour for all three specimens was very similar. The chart shows the initial
loadings, for specimens 1, 2 and 3 (dark blue, pink and yellow lines), follow the
exact same path for compression strain. The same applies for the prestressed
specimens 2 and 3 (light blue and purple lines) during the final loading.
The other interesting point from Figure 5.11 is the behaviour of the specimens during
failure. The dark blue line showing specimen 1 at the failure load shows an increase
93

Discussion of Results Chapter 5
in strain of around 2000 micro strain with no increase in load at the failure point.
This was again due to the concrete “letting go” and transferring the entire load to the
reinforcement.
As expected however the strain in the compressive reinforcement never reached the
yield strain, which was calculated as 2900 micro strain. The closest specimen to this
strain was specimen 1 during failure which reached 2000 micro strain.
5.5.3 Tensile Strain Once again AS3600 predicted the shear capacity to be much less than the ultimate
moment capacity. Therefore it was expected that the tensile strain, like the
compressive strain, would not reach the yielding strain of the steel. This is confirmed
in Figure 5.12.
-50
0
50
100
150
200
250
300
350
400
450
500
-500 0 500 1000 1500 2000 2500
Tensile Reinforcement Strain (micro strain)
Load
(kN
)
Specimen 1 Specimen 2 Specimen 3Specimen 2 (After Strengthening) Specimen 3 (After Strengthening)
Figure 5.12 - Tensile Strain
94

Discussion of Results Chapter 5
Once again the strain in the tensile reinforcement follows much the same path for
specimens 1, 2 and 3 (dark blue, pink and yellow lines) during initial loading. The
correlation was not quite as close as the compression reinforcement but this research
concluded that the varying concrete strengths played a large role in the transfer of
force to the steel. This was much more dominant in the tensile reinforcement than the
compression reinforcement.
The strain in the tensile reinforcement after prestressing was again very similar for
specimens 1 and 2 (light blue and purple lines) for the failure loading. Again the
correlation was not as good as for the compression strains, however the influence of
concrete strength is the dominant factor once again.
Once again the strain in the tensile reinforcement did not yield. This was predicted in
the AS3600 equations and is demonstrated by Figure 5.12. The maximum strain
reached by the tensile reinforcement was 1900 micro strain. The yield strain for the
tensile reinforcement was also 2900 micro strain.
5.6 Analysis of Prestress From the strain recorded in the prestress during loading, the increase in prestress can
be measured. Figure 5.13 shows the prestress strain plotted against the deflection of
the headstock during loading for specimen 3. This shows the variation depicts the
stress gradient of the laminate. The strain decreases with the distance from the
loading point.
What can be seen from Figure 5.13 is the maximum prestress strain of 3300 micro
strain corresponds to the maximum jacking force of 275kN. From this it can be seen
that the initial force applied to the headstock at the commencement of loading was
242kN.
95

Discussion of Results Chapter 5
-500
0
500
1000
1500
2000
2500
3000
3500
-2 0 2 4 6 8
Deflection (mm)
Fibr
e St
rain
s (m
icro
str
ain)
10
Fibre Side Right Fibre Side Middle Fibre Side Left
Figure 5.13 - Prestress strain – specimen 3
0
500
1000
1500
2000
2500
3000
-0.5 0 0.5 1 1.5 2 2.5 3 3.5 4 4.5 5
Deflection (mm)
Pres
tres
s St
rain
(mic
ro s
trai
n)
Fibre Side Right Fibre Side Middle Fibre Side Left Figure 5.14 - Prestress strain - specimen 2
96

Discussion of Results Chapter 5
Figure 5.14 shows the same plot of prestress strain against deflection for specimen 2.
Once again the stress gradient of the laminate is prominent. The maximum strain
which corresponds to the maximum prestress jack force of 275kN is 2750 micro
strain. From this the initial prestress force at the commencement of loading is
calculated as 245kN
There were differences in the initial prestress load applied and neither specimen was
initially loaded to 250kN as specified in the design.
The data can be summarised and this is shown in Table 5.4 Table 5.4 - Prestress increase
Specimen Initial Prestress
Force (kN)
Maximum Prestress
Force (kN)
% Increase during
loading
2 245 265 8.2%
3 242 250 3.3%
There was an increase in the prestress during loading as expected. This needs to be
incorporated into the design equations to calculate a more accurate theoretical
capacity. It is thought that the difference in the increases between the two specimens
was due to the time spent initially debonding the laminate from the headstock.
Specimen 3 was loaded at one end initially to break the bond between the laminate
and the headstock at that end. This was then released and the force applied from the
other end to ensure that the laminate was not bonded at any point. It was thought in
doing that, that it would minimise the increase in prestressing force during loading.
As shown in Figure 5.14 it also reduced the effect of the stress gradient in the
laminate.
Overall the prestressing system behaved in a similar fashion to conventional steel
post tensioning systems. Steel undergoes a similar increase, approximately 5-10%
97

Discussion of Results Chapter 5
during loading. This research concluded that the laminate behaviour was suitable for
use as a prestressing medium.
5.7 Comparison of Results with AS3600 Predictions After all the testing was complete and the actual steel and concrete strengths
recorded, new more accurate predictions were able to be made. The material
specifications used in design differed somewhat from those found in the test results.
Table 5.5 shows an overview of the differences in theoretical and actual material
properties.
Table 5.5 - Actual material properties
Material Property Theoretical Actual % difference
Shear Reinforcement Yield
Stress 250MPa 441MPa 76%
Tensile/Compression
Reinforcement Yield Stress 500MPa 581MPa 16%
Concrete Compressive
Strength, F’c32MPa
S1 - 22MPa
S2 - 39MPa
S3 - 18MPa
-45%
22%
-79%
Prestress Force Applied, P 250kN S2 - 245kN
S3 - 242kN
S2 - 2%
S3 - 3%
Using these actual test results, the new predictions of capacity were calculated using
AS3600. This section aims to give an overview of these new predictions and also
compare these results with the actual results obtained from testing.
98

Discussion of Results Chapter 5
5.7.1 Specimen 1 The control headstock had a concrete strength of only 22 MPa. This means that the
32 MPa that was assumed in the initial design calculations was inaccurate. There
were also large differences in the shear reinforcement yield stress for all specimens.
Using the equations from Chapter 3, a new prediction of the ultimate moment and
ultimate shear capacity can be calculated. An overview of these equations is provided
below:
γ = 0.85 – 0.007 ( 22 – 28 )
γ = 0.892
Cc = 0.85 x 22 x 0.892 x 220 x dn = 3.669 x 10³ dn N
T = 600 x 581 = 349 x 103 N
Again it is assumed that the compressive steel does not yield, which gives Cs:
( )n
ns d
dC
541024.0 6 −
×=
Applying the equilibrium equation gives the following quadratic equation:
3.669dn2 – 109dn – 12960 = 0
Using the spreadsheet from Chapter 2 to solve for dn yields the following solution:
dn = 76mm
Solving for Mu gives:
99

Discussion of Results Chapter 5
Mu = ( 349 x 103 x 366 ) – ( 69 x 103 x 54 ) – ( 278 x 103 x (76 x 0.892 ) 2
Mu = 115kNm
Using the frame software analysis to predict ultimate load gives:
Pu = 475kN
The resulting bending moment diagram is supplied in Appendix K. Calculating the
shear capacity provided by the shear reinforcement gives:
Vus = 62 x 441 x 366 x cot 45 280
Vus = 35.7 kN
The shear capacity of the concrete is calculated over the short and long shear spans.
This gives for the short shear span (β3 = 1.877):
Vuc = 1.357 x 1 x 1.877 x 220 x 366 x3
1
36622022600
⎟⎠⎞
⎜⎝⎛
××
Vuc = 112.2 kN
And for the long shear span (β3 = 1):
Vuc = 1.357 x 1 x 1 x 220 x 366 x3
1
36622022600
⎟⎠⎞
⎜⎝⎛
××
Vuc = 59.8 kN
Therefore the total ultimate shear capacity of the design specimen is:
100

Discussion of Results Chapter 5
Vu = 112.2 + 35.7
Vu = 148 kN over the shorter shear span
and
Vu = 95 kN over the longer shear span.
This gives Pu values over the short and long shear span respectively as:
Pu = 148 x 1920 = 212 kN 1340
And
Pu = 95 x 1920 = 314 kN 580
The comparison of these predictions with the actual test results is shown in Table
5.6. Although this specimen should have failed over the short shear span, the actual
failure occurred over the longer shear span. Therefore the prediction for the long
shear span was used in the comparison. AS3600 is only equipped to readily analyse
diagonal shear tension failure. What is thought to have occurred in these test
specimens is the shorter shear span has gone into compression. This means that to
predict the failure of this specimen over the short shear span would require a lengthy
and difficult calculation of the shear compression failure capacity. This is beyond the
scope of this research and therefore has not been carried out. It was expected
however that the load required to cause diagonal compression failure was much
higher than the load required to cause diagonal tension failure over the long shear
span.
Table 5.6 - Specimen 1 comparison
Theoretical Shear
Capacity
Actual Shear
Capacity % difference
Specimen 1 314 kN 356 kN 13% increase
As the results show, AS3600 under predicted the capacity by 13%.
101

Discussion of Results Chapter 5
5.7.2 Specimen 2 As for specimen 1, the new predictions need to be calculated using the actual test
data. The calculations are as follows. The concrete strength of specimen 2 was
39MPa. Therefore the factor γ is given as:
γ = 0.85 – 0.007 ( 39 – 28 )
γ = 0.773
and the concrete force is given as:
Cc = 0.85 x 39 x 0.773 x 220 x dn = 5.637 x 10³ dn N
T = 600 x 581 = 349 x 103 N
Again it is assumed that the compressive steel does not yield, which gives Cs:
( )n
ns d
dC
541024.0 6 −
×=
Applying the equilibrium equation gives the following quadratic equation:
5.637dn2 – 109dn – 12960 = 0
Using the spreadsheet from Chapter 2 to solve for dn yields the following solution:
dn = 59mm
Solving for Mu gives:
Mu = ( 349 x 103 x 366 ) – ( 20 x 103 x 54 ) – ( 333 x 103 x (59 x 0.773 ) 2
Mu = 119kNm
102

Discussion of Results Chapter 5
Using the frame software analysis to predict ultimate load gives:
Pu = 490kN
The resulting bending moment diagram is also supplied in Appendix K. The shear
capacity of the reinforcement remains unchanged from the previous calculation
which leaves the calculation of the concrete shear capacity:
Vuc = 135.8 kN for the short shear span
and
Vuc = 72.3 kN for the long shear span
Therefore the total ultimate shear capacity of the design specimen is:
Vu = 172 kN for the short shear span and;
Vu = 108 kN for the long shear span
This gives Pu values over the short and long shear span respectively as:
Pu = 172 x 1920 = 246 kN 1340
And
Pu = 108 x 1920 = 357 kN 580
As specimen 2 was also prestressed, new predictions need to be calculated for its
prestressed section capacity. The maximum prestress value obtained during testing
will be used for the applied prestress force.
The specimen forces are:
103

Discussion of Results Chapter 5
( )n
ns d
dC
541024.0 6 −
×=
Cc = 5.637 x 10³ dn N
Ts = 349 x 103 N
Tp = 223 x 103 N
This yields the quadratic equation:
12960332637.50 2 −−= nn dd
Solving with respect to dn gives:
dn = 86mm
The new ultimate moment capacity is:
( ) ( ) ( ) ( )5410892
86773.0104852101022336610349 3333 ××−⎟⎠⎞
⎜⎝⎛ ×
××−××+××=uM
Mu =154 kNm
and ultimate load capacity from the frame analysis software is:
Pu = 635 kN
Once again the ultimate shear capacity is computed. The shear capacity of the shear
reinforcement remains unchanged. The shear capacity of the concrete is:
104

Discussion of Results Chapter 5
kNmM dec 6.15=
For the purposes of these design calculations, M* and V* have been assumed as being
equal to Mu and Vu (short shear span) calculated in the non prestressed section. This
gives a Vdec of:
kNVdec 5.22=
Substituting these values into the original formula for the short shear span yields:
( ) 022500366220
393480600366220877.11375.13
1
++⎥⎦⎤
⎢⎣⎡
××+
××××=ucV
= 283.3kN for the short shear span and;
= 161.4kN for the long shear span
Therefore the total shear capacity of the section is:
Vu = 319 kN for the short shear span and;
Vu = 197 kN for the long shear span
This gives Pu values over the short and long shear span respectively as:
Pu = 319 x 1920 = 457 kN 1340
And
Pu = 197 x 1920 = 652 kN 580
Again the as the specimen failed over the long shear span, these predictions have
been used in the comparison. This is shown below in Table 5.7. Note in this case that
the failure still occurred over the long shear span even though the failure load was
105

Discussion of Results Chapter 5
much higher than the short shear span. This is thought to have occurred due to the
cracks already being present prior to the application of prestress. Had the prestress
been in place from new, it would be expected that failure would occur over the short
shear span.
Table 5.7 - Specimen 2 comparison
Theoretical Shear
Capacity
Actual Shear
Capacity % difference
Specimen 2
(39MPa) 357 kN 369 kN 3% increase
Specimen 2 –
prestressed 652 kN 430 kN 34% decrease
In this case AS3600 has over predicted the capacity of the prestressed specimen. This
research concluded that AS3600 is unable to predict the capacity of cracked sections.
5.7.3 Specimen 3 The new capacity predictions from AS3600 are as follows:
γ = 0.85 – 0.007 ( 18 – 28 )
γ = 0.92
Cc = 0.85 x 18 x 0.92 x 220 x dn = 3.097 x 10³ dn N
T = 600 x 581 = 349 x 103 N
( )n
ns d
dC
541024.0 6 −
×=
106

Discussion of Results Chapter 5
Applying the equilibrium equation gives the following quadratic equation:
3.097dn2 – 109dn – 12960 = 0
dn = 85mm
Solving for Mu gives:
Mu = ( 349 x 103 x 366 ) – ( 88 x 103 x 54 ) – ( 263 x 103 x (85 x 0.92 ) 2
Mu = 113kNm
Again from the frame analysis software Pu is calculated as:
Pu = 466 kN
This is again included in appendix K. The shear capacity of the reinforcement
remains unchanged from the previous calculation which leaves the calculation of the
concrete shear capacity:
Vuc = 105.1 kN for the short shear span
and
Vuc = 55.9 kN for the long shear span
Therefore the total ultimate shear capacity of the design specimen is:
Vu = 141 kN for the short shear span and;
Vu = 92 kN for the long shear span
This gives Pu values over the short and long shear span respectively as:
107

Discussion of Results Chapter 5
Pu = 141 x 1920 = 202 kN 1340
And
Pu = 92 x 1920 = 305 kN 580
As specimen 3 was also prestressed, new predictions need to be calculated for its
prestressed section capacity. The maximum prestress value obtained during testing
will be used for the applied prestress force.
The specimen forces are:
( )n
ns d
dC
541024.0 6 −
×=
Cc = 3.097 x 10³ dn N
Ts = 349 x 103 N
Tp = 256 x 103 N
This yields the quadratic equation:
12960365097.30 2 −−= nn dd
Solving with respect to dn gives:
dn = 146mm
The new ultimate moment capacity is:
108

Discussion of Results Chapter 5
( ) ( ) ( ) ( )54101512
14692.0104522101025636610349 3333 ××−⎟⎠⎞
⎜⎝⎛ ×
××−××+××=uM
Mu =143 kNm
and ultimate load capacity from frame analysis:
Pu = 590 kN
Again the plot of the moment diagram is provided in Appendix K. Once again the
ultimate shear capacity is computed. The shear capacity of the shear reinforcement
remains unchanged. The shear capacity of the concrete is:
kNmM dec 9.17=
For the purposes of these design calculations, M* and V* have been assumed as being
equal to Mu and Vu (short shear span) calculated in the non prestressed section. This
gives a Vdec of:
kNVdec 3.22=
Substituting these values into the original formula yields:
Vuc = 223.8kN for the short shear span and
Vuc = 129.7kN for the long shear span
Therefore the total shear capacity of the section is:
Vu = 260 kN over the short shear span and
Vu = 165 kN over the long shear span
This gives Pu values over the short and long shear span respectively as:
109

Discussion of Results Chapter 5
Pu = 260 x 1920 = 372 kN 1340
And
Pu = 165 x 1920 = 546 kN 580
Now a comparison of these predictions can be made with the actual test results.
Again as we know the failure mode of the specimen, only those predicted values will
be used. Table 5.8 shows a summary of this comparison. Note in this case that the
difference between the loads for diagonal tension failure over the long and short
span. The load causing diagonal tension failure for the long shear span is much
higher than the load required for diagonal tension failure over the short shear span.
As the structure was repaired to a like new form with epoxy the load required to
cause failure over the long shear span was much larger than the load over the short
shear span and this caused the failure over the short shear span.
Table 5.8 - Specimen 3 comparison
Theoretical Shear
Capacity
Actual Shear
Capacity % difference
Specimen 3
(18MPa) 305 kN 301 kN 1% decrease
Specimen 3 –
prestressed and
epoxy
372 kN 440 kN 18% increase
In this case the predicted failure load was over predicted in the initial loading. This
may not be entirely accurate however as the specimen was not actually completely
failed in the initial loading. In the final loading however the capacity was under
predicted by AS3600 by 18%. This shows that the epoxy does repair the specimen to
a like new form.
110
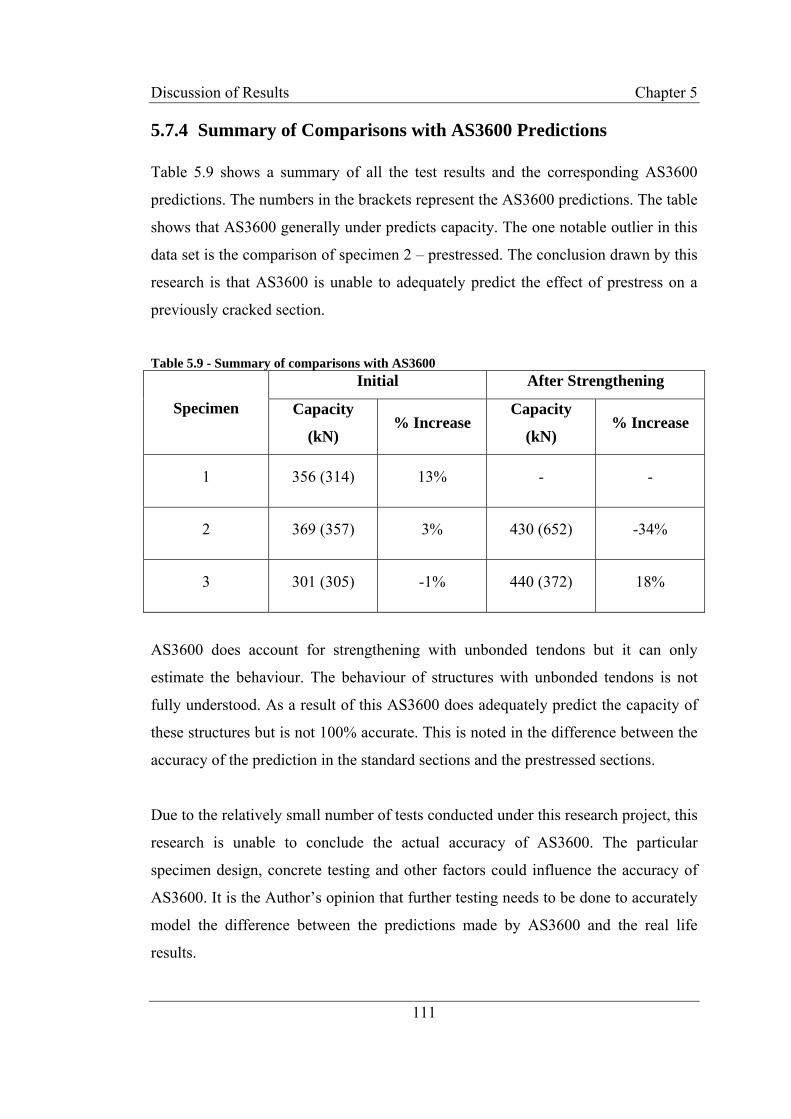
Discussion of Results Chapter 5
5.7.4 Summary of Comparisons with AS3600 Predictions Table 5.9 shows a summary of all the test results and the corresponding AS3600
predictions. The numbers in the brackets represent the AS3600 predictions. The table
shows that AS3600 generally under predicts capacity. The one notable outlier in this
data set is the comparison of specimen 2 – prestressed. The conclusion drawn by this
research is that AS3600 is unable to adequately predict the effect of prestress on a
previously cracked section.
Table 5.9 - Summary of comparisons with AS3600
Initial After Strengthening
Specimen Capacity
(kN) % Increase
Capacity
(kN) % Increase
1 356 (314) 13% - -
2 369 (357) 3% 430 (652) -34%
3 301 (305) -1% 440 (372) 18%
AS3600 does account for strengthening with unbonded tendons but it can only
estimate the behaviour. The behaviour of structures with unbonded tendons is not
fully understood. As a result of this AS3600 does adequately predict the capacity of
these structures but is not 100% accurate. This is noted in the difference between the
accuracy of the prediction in the standard sections and the prestressed sections.
Due to the relatively small number of tests conducted under this research project, this
research is unable to conclude the actual accuracy of AS3600. The particular
specimen design, concrete testing and other factors could influence the accuracy of
AS3600. It is the Author’s opinion that further testing needs to be done to accurately
model the difference between the predictions made by AS3600 and the real life
results.
111

Discussion of Results Chapter 5
5.8 Conclusion The results outlined in this chapter have shown that external post tensioning is an
effective method of strengthening structures. The extent of the strength increase that
may be obtained however is quite dependent on the size of the existing cracks. This
research concludes that if the cracking is extensive that post tensioning alone will not
give any significant increase in strength. Based on the testing obtained the expected
strength increase, for specimens with existing cracks and external post tensioning, is
around 16%.
For specimens with large existing cracks, an epoxy treatment to repair these cracks
combined with external post tensioning provides an excellent repair method. The
increase in strength that can be gained from this treatment is around 46%. The testing
and analysis has shown that when the epoxy is used properly the structure can be
restored to a “like new” structural form.
The predictions made by AS3600 are generally within 20% of the actual tested
capacity. Further testing is necessary to ensure that the differences were not caused
by this particular section’s properties or inaccurate test methods. It is the Author’s
opinion that AS3600 does however under predict capacities. This research has also
concluded that AS3600 is inadequate to predict the properties of sections
strengthened with external post tensioning after initial cracking has occurred. The
extent of this inadequacy is unknown due to the relatively small number of tests
conducted. This may also depend on the extent of the existing cracking.
112

Conclusions Chapter 6
113
Chapter 6
Conclusions 6.1 Achievement of Objectives All of the objectives initially set out for this research have been satisfactorily
achieved. The objectives set out in Chapter 1 were:
1. Review the existing research into strengthening of concrete structures.
2. Design and analyse the fibre composite prestress system and jacking
blocks.
3. Construct and test headstock specimens.
4. Analyse the results and compare with the predictions from the design
equations.
Objective 1 was achieved in Chapter 1 and 2 where the previous research into
strengthening of structures was covered. A review of the historical work into the
concrete strengthening was also discussed.
Objective 2 was achieved in Chapter 3 where the design and prediction of the test
specimens was conducted. This chapter also reviewed the design specifications and

Conclusions Chapter 6
114
limitations. The design of the prestressing system and calculation of new theoretical
capacity after the application of prestress is also discussed in Chapter 3.
Objective 3, which is related to the construction and testing methodology, is covered
in Chapter 4. This chapter covered all the various stages of construction and testing
in detail. This chapter explains the methods used to obtain the data needed to
ultimately verify the theoretical predictions. It helps to understand the physical work
that has gone into the research and testing of this strengthening system.
Finally Chapter 5 deals with the understanding of the results obtained from the
testing. It also discusses the comparison between the predictions made by AS3600
and the actual test results and tries to explain the differences between them. This
represents the achievement of objective 4.
6.2 Conclusions At the beginning of this project, this research set out to prove that conventional steel
post tensioning could be replaced with fibre composites. It also set out to show that
post tensioning in general was a viable shear strengthening method. This research has
succeeded in both of these aims.
The prestressing system designed and tested in this research was successful in shear
strengthening the test specimens. The FRP system used in this testing shows
potential as a replacement for corrosive steel. One of the main conclusions drawn
from the testing was that shear strengthening is possible using post tensioning and
that this can be conducted with FRP. The application of post tensioning not only
increases the service load capacity, but also increases the stiffness of the section
resulting in lower deflections and therefore crack widths. This denotes an
improvement in both the strength and serviceability limit states.

Conclusions Chapter 6
115
The important point to note however is that the extent of the strength increase
available is dependent on the extent of the existing cracks. If the existing cracking is
relatively minor then the post tensioning will provide a significant increase in
strength. This research concludes that if shear cracking is significant, epoxy injection
is a viable method for the repair of these cracks. The application of epoxy injection
and post tensioning to the test specimen resulted in a significantly larger increase in
strength than post tensioning alone. When the specimen was repaired with just
prestressing the strength increase recorded was 16%. When the specimen was
repaired with prestress and epoxy the strength increase recorded was 46%. The
bonding of the crack with epoxy has the effect of rebuilding a specimen to a like new
form. This provides a greater potential for the post tensioning resulting in increased
load capacity and decreased deflection. This is due to the specimen needing a larger
load to create new cracks, rather than simply opening up old ones.
Due to the relatively small number of tests conducted, definite conclusions about the
accuracy of AS3600 can not be developed. It would appear from this research that
AS3600 under predicts the shear capacity of beams by around 10%. One of the
problems associated with making definite conclusions about this under prediction is
the properties of this particular section, which failed under both diagonal shear
tension failure and diagonal shear compression failure. To accurately assess the
variance in AS3600 predictions and real life, a large number of tests with different
section types would be recommended.
6.3 Further Research There are a number of opportunities for future research into the strengthening of
concrete structures. There is the possibility of further research into the refinement of
the jacking blocks used with this system. This research has only looked at a semi
circular section and no analysis has been done on different shapes possible. The
research has discussed the possibility of using a parabola or some other shape to

Conclusions Chapter 6
116
enhance the properties of the block. This research could be either analytical or
experimental.
There is also a need for more research into the effects of epoxy injection. This
research has only looked at the epoxy repair method combined with post tensioning.
A limited amount of information on the properties of epoxy repaired concrete is
available. Research into the effects of the epoxy treatment on its own is required to
better understand the properties of this repair medium.
Finally further research is required into the accuracy of AS3600. The standard does
address the behaviour of prestressed concrete with unbonded tendons however it can
only estimate the force in the prestress. As the change in strain in the prestress does
not equal the change in strain in the concrete, it is difficult to model the behaviour of
the concrete. Further analysis of the behaviour of concrete strengthened in this
manner is required in order to be able to accurately predict the new capacity of
structures currently in service that have been strengthened using external post
tensioning.
Further research may also be conducted into the calculation of easier modelling of
diagonal compression failure. This is difficult to predict with the current standard and
requires further numerical analysis to provide quick empirical formulae for
assessment of sections in which this is the expected failure mode.

References
117
List of References Adhikary, B B, Mutsuyoshi, H 2004, ‘Behavior of Concrete Beams Strengthened in
Shear with Carbon-Fiber Sheets’, Journal of Composites for Construction, May/June
2004, pp. 258-264
Allen, R.T.L, Edwards, S.C, Shaw, J.D.N 1993, The Repair of Concrete Structures,
2nd Edn, Blackie Academic & Professional, Glasgow
Andrä, H P, Maier, M, Poorbiazar, M 2004, ‘Carbon Fibre Composites for a New
Generation of Tendons’, 1st Conference on Application of FRP Composites in
Construction and Rehabilitation of Structures, Tehran, Iran, pp. 29-37
Beber, A.J, Campos Filho, A, Campagnolo, J.L 2001, ‘CFRP in the Strengthening of
Reinforced Concrete Beams’, FRP Composites in Civil Engineering, Vol 1, pp 391-
398
Kojima, T, Takagi, N, Hamada, Y, Kobayashi, A 2001 ‘Flexural Strengthening of
Bridge by Using Tensioned Carbon Fibre Reinforced Polymer Plate’, FRP
Composites in Civil Engineering, Vol 2, pp 1077-1084
Lamanna, A J, Bank, L C, Scott, D W 2004, ‘Flexural Strengthening of Reinforced
Concrete Beams by Mechanically Attaching Fiber-Reinforced Polymer Strips’,
Journal of Composites for Construction, May/June 2004, pp.203-210
Lees, J M, Winistörfer, A U, Meier, U 2002, ‘External Prestressed Carbon Fiber-
Reinforced Polymer Straps for Shear Enhancement of Concrete’, Journal of
Composites for Construction, November 2002, pp. 249-256
Minoru, K, Toshiro, K, Yuichi, U, Keitetsu, R 2001, ‘Evaluation of Bond Properties
in Concrete Repair Materials’, Journal of Materials in Civil Engineering,
March/April 2001, pp. 98-105

References
118
Pellegrino C, Modena C 2002, ‘Fiber Reinforced Polymer Shear Strengthening of
Reinforced Concrete Beams with Transverse Steel Reinforcement’, Journal of
Composites for Construction, May 2002, pp.104-111
Sabonchy, E 2003, Flexural Strengthening of Headstocks in Bridge Piers Using
External Prestressing, Undergraduate Dissertation, University of Southern
Queensland, Toowoomba
Snelling, G 2003, The Shear Strengthening of Bridge Headstocks Using External
Prestressing, Undergraduate Dissertation, University of Southern Queensland,
Toowoomba.
Standards Australia 2003, AS3600 – Concrete Structures, Standards Australia,
Homebush
Towards Sustainable Engineering Practice: Engineering Frameworks for
Sustainability, Institution of Engineers, Australia, Canberra, 1997
Warner, R.F, Rangan, B.V, Hall, A.S, Faulkes, K.A 1998, Concrete Structures,
Addison Wesley Longman Australia Pty Limited, Australia, Melbourne
Weijan, Yi, Huiming, Huang 2001, ‘Experimental Study on the Flexural Behaviour
of RC Beams Strengthened with CFRP Laminates’, FRP Composites in Civil
Engineering, Vol 1, pp 399-405
Wight, R.G, Green, M. F, Erki, M-A, 2001 ‘Prestressed FRP Sheets for
Poststrengthening Reinforced Concrete Beams’, Journal of Composites for
Construction, pp 214-220

References
119
Woods, E 2004 (submitted), Shear Strengthening and Model Testing of Concrete
Bridge Headstocks, Undergraduate Dissertation, University of Southern Queensland,
Toowoomba
Zou, P X W 2003, ‘Long-Term Deflection and Cracking Behavior of Concrete
Beams Prestressed with Carbon Fiber-Reinforced Polymer Tendons’, Journal of
Composites for Construction, August 2003, pp. 187-193

Bibliography
120
Bibliography Gao, B, Leung, W, Cheung, C, Kim, J-K, Leung, C.K.Y 2001, ‘Effects of Adhesive
Properties on Strengthening of Concrete Beams with Composite Strips’, FRP
Composites in Civil Engineering, Vol 1, pp 423-432
Gergely, J, Pantelides, C.P, Reaveley, L.D 2000, ‘Shear Strengthening of RCT Joints
Using CFRP Composites’, Journal of Composites for Construction, May 2000, pp
56-64
Hollaway, L.C, Leeming, M.B 1999, Strengthening of Reinforced Concrete
Structures, Woodhead Publishing Limited, England, Cambridge
Kachlakev, D, McCurry, D.D 2000, ‘Behaviour of Full Scale Reinforced Concrete
Beams Retrofitted for Shear and Flexural with FRP Laminates’, Composites: Part B
– Engineering, pp 445-452
Li, A, Diagana, C, Delmas, Y 2002, ‘Shear Strengthening Effect by Bonded
Composite Fabric on RC Beams’, Composites: Part B – Engineering, pp 225-239
Rabinovitch, O, Frostig, Y 2003, ‘Experiments and analytical comparison of RC
beams strengthened with CFRP composites’, Composites: Part B – Engineering, pp
663-677
Rizkalla, S, Hassan, T 2001, ‘Various FRP Strengthening Techniques for Retrofitting
Concrete Structures’, FRP Composites in Civil Engineering, Vol 2, pp 1033-1040
Seible, Frieder 2001, ‘Designing with FRP Composites in the Civil Structural
Environment’, FRP Composites in Civil Engineering, Vol 1, pp 73-84
Sen, R, Liby, L, Mullins, G 2001, ‘Strengthening Steel Bridge Sections using CFRP
Laminates’, Composites: Part B – Engineering, pp 309-322

Bibliography
121
Stepanek, P, Podolka, L 2001, ‘Strengthening and Repair of RC Structures in the
Czech Republic Using CFRP Strips’, FRP Composites in Civil Engineering, Vol 1,
pp 467-473
Triantafillou, T.C, Antonopoulos, C.P 2000, ‘Design of Concrete Flexural Members
Strengthened in Shear with FRP’, Journal of Composites for Construction,
November 2000, pp 198-205
University of Southern Queensland 2002, Stress Analysis Study Book, USQ Distance
Education Centre, Toowoomba
Uomoto, Taketo 2001, ‘Durability of FRP Reinforcement as Concrete
Reinforcement’, FRP Composites in Civil Engineering, Vol 1, pp 85-96
Wight, R.G, El-Hacha, R, Erki, M.A 2001, ‘CFRP Sheet Strengthening Damaged
Continuous Reinforced Concrete Beams’, FRP Composites in Civil Engineering, Vol
1, pp 433-440
Yue, Qingrue 2001, ‘Study and Application of Strengthening of Structures Using
Fibre Reinforced Polymers in China’, FRP Composites in Civil Engineering, Vol 1,
pp 147-153

Project Specification Appendix A
Appendix A
Project Specification
122

Project Specification Appendix A University of Southern Queensland
FACULTY OF ENGINEERING AND SURVEYING
ENG 4111/4112 Research Project
PROJECT SPECIFICATION
FOR: LINDSAY JOBLING
TOPIC: EXPERIMENTAL INVESTIGATION OF THE STRENGTHENING OF HEADSTOCKS USING EXTERNALLY PRESTRESSED FIBRE STRIPS
SUPERVISOR: Dr. Thiru Aravinthan
Dr. Tim Heldt (FCDD)
ENROLMENT: ENG 4111 – S1,D,2004 ENG 4112 – S2,D,2004
PROJECT AIM: This project seeks to examine the possibility for using fibre composites to extend the service life of failing bridge headstocks. The project will be a model of an existing headstock near Gatton.
SPONSORSHIP: USQ Research Project Program
PROGRAMME: Issue B, 22nd October 2004
1. Research existing work relating to strengthening of headstocks using prestressed fibre strips
2. Design a method of prestressing a fibre strip
3. Construct a prototype for testing on the model headstock of the Tent Hill
Ck Bridge near Gatton
4. Carry out a repair of the test specimens using prestress only on the 1st and prestress and epoxy injection on the 2nd
5. Compare results to the AS3600 design equations
AGREED:
____________________ (Student) ____________________(Supervisor) ___/ ___/ ___ ___/ ___/ ___
123

Test Specimen Design Drawings Appendix B
124
Appendix B
Test Specimen Design Drawings

Test Specimen Design Drawings Appendix B
Figure B.1 - Model design drawing
125

Test Specimen Design Drawings Appendix B
Figure B.2 - Model reinforcement diagram
126

Ultimate Moment Capacity Prediction Appendix C
127
Appendix C
Ultimate Moment Capacity Prediction

Ultimate Moment Capacity Prediction Appendix C
Figure C.1 - Bending moment diagram for P = 420kN
128

Ultimate Moment Capacity Prediction Appendix C
Figure C.2 - Shear force diagram for P = 212kN
129

Ultimate Moment Capacity Prediction Appendix C
Figure C.3 - Bending moment diagram for P = 580kN
130

Prestress Jacking Block Design Drawings Appendix D
131
Appendix D
Prestress Jacking Block Design Drawings

Prestress Jacking Block Design Drawings Appendix D
132
Prestress Jacking Block Design Drawings Appendix D
132

Prestress Jacking Block Design Drawings Appendix D
133

Strain Gauge and Adhesive Data Sheets Appendix E
134
Appendix E
Strain Gauge and Adhesive Data Sheets

Strain Gauge and Adhesive Data Sheets Appendix E
135
Steel Reinforcement Strain Gauge Data Sheet

Strain Gauge and Adhesive Data Sheets Appendix E
136
Laminate Strain Gauge Data Sheet

Strain Gauge and Adhesive Data Sheets Appendix E
137
CN Strain Gauge Adhesive Data Sheet

Strain Gauge and Adhesive Data Sheets Appendix E
138
Strain Gauge Waterproofing Wax Data Sheet

Prestressing System Material Specifications Appendix F
139
Appendix F
Prestressing System Material Specifications

Prestressing System Material Specifications Appendix F
140
Polymer Concrete Jacking Block
Epoxy Resin System
Resin: Hyrez 201R
Hardener Hyrez 201H
Fillers:
- 5-7mm crushed basalt (42% by volume)
- Envirospheres SLG (24% by volume)
Finished Product Test Results
MOE: 9700 MPa
σ tension: 20 MPa
σ compression: 68 MPa
(Information courtesy of Craig Cattell – Engineer FCDD)
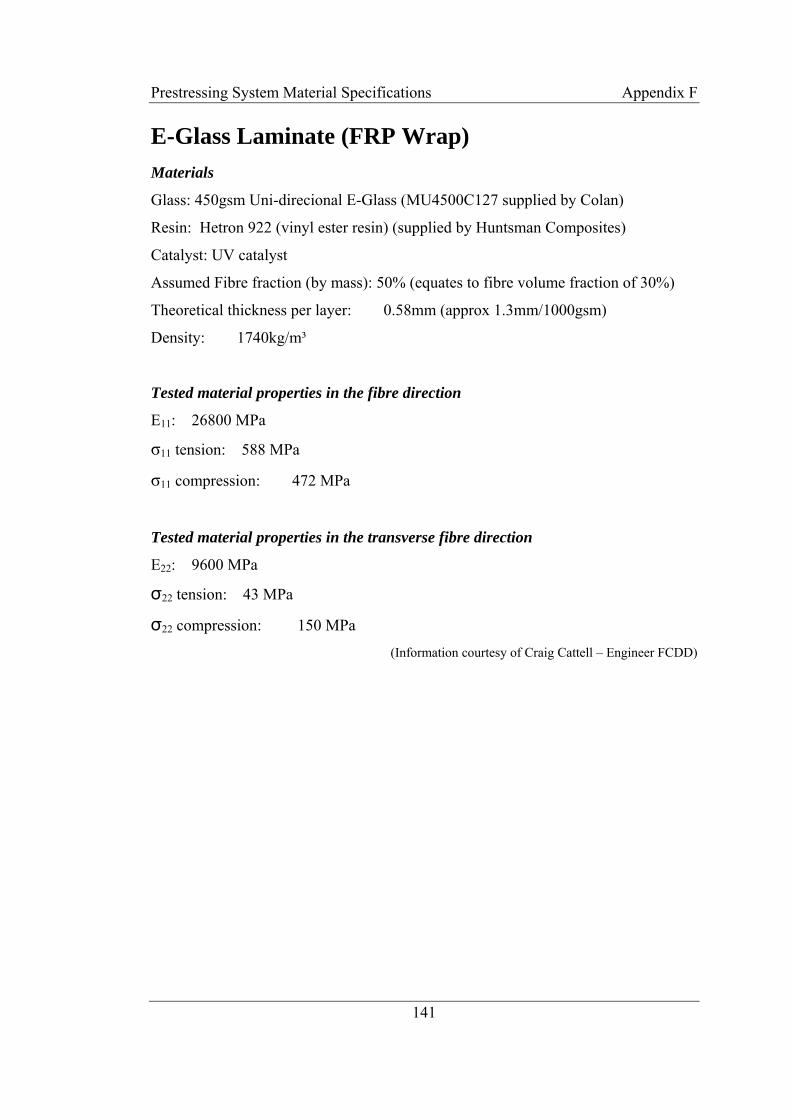
Prestressing System Material Specifications Appendix F
141
E-Glass Laminate (FRP Wrap) Materials
Glass: 450gsm Uni-direcional E-Glass (MU4500C127 supplied by Colan)
Resin: Hetron 922 (vinyl ester resin) (supplied by Huntsman Composites)
Catalyst: UV catalyst
Assumed Fibre fraction (by mass): 50% (equates to fibre volume fraction of 30%)
Theoretical thickness per layer: 0.58mm (approx 1.3mm/1000gsm)
Density: 1740kg/m³
Tested material properties in the fibre direction
E11: 26800 MPa
σ11 tension: 588 MPa
σ11 compression: 472 MPa
Tested material properties in the transverse fibre direction
E22: 9600 MPa
σ22 tension: 43 MPa
σ22 compression: 150 MPa
(Information courtesy of Craig Cattell – Engineer FCDD)

Epoxy Injection Material Properties Appendix G
142
Appendix G
Epoxy Injection Material Properties

Epoxy Injection Material Properties Appendix G
143

Epoxy Injection Material Properties Appendix G
144
(Source: Parchem Website)

Epoxy Injection Material Properties Appendix G
145

Epoxy Injection Material Properties Appendix G
146
Epoxy Injection Material Properties Appendix G
147
(Source: Parchem Website)

Risk Assessment and Management Appendix H
148
Appendix H
Risk Assessment and Management

Risk Assessment and Management Appendix H
149

Risk Assessment and Management Appendix H
150
Risk Assessment and Management Appendix H
150

Concrete Compression Testing Appendix I
151
Appendix I
Concrete Compression Testing

Concrete Compression Testing Appendix I
152
Table I.1 - Concrete compression testing
Sample ID
Concrete Batch
Diameter 1 (mm)
Diameter 2 (mm)
Height (mm)
Failure Load (kN)
F'c
1 1 101.6 100.9 199 185 22.98
2 1 100.9 101.3 200 175 21.80
3 1 100.2 102.1 201 175 21.78
Average Strength 22.2
4 2 101.9 101.5 199 140 17.23
5 2 101.6 100.9 201 150 18.63
6 2 101.2 101.8 200 145 17.92
7 2 101.4 100.8 199 140 17.44
Average Strength 17.8
8 3 101.3 100.9 200 320 39.86
9 3 101.4 100.7 200 310 38.65
10 3 100.6 100.9 199 315 39.51
Average Strength 39.3

Steel Reinforcement Testing Appendix J
153
Appendix J
Steel Reinforcement Testing

Steel Reinforcement Testing Appendix J
0
2000
4000
6000
8000
10000
12000
14000
16000
18000
0 1 2 3 4 5 6 7 8
Deflection (mm)
Load
(N)
9
Test 1 Test 2
Figure J.1 - R6 reinforcement test results
0
100
200
300
400
500
600
700
-10 0 10 20 30 40 50 60 70
Strain
Stre
ss (M
Pa)
Figure J.2 - N16 reinforcement test results
154

Revised Multiframe Analysis Appendix K
155
Appendix K
Revised Multiframe Analysis

Revised Multiframe Analysis Appendix K
Figure K.1 - Bending moment diagram for P = 475
156

Revised Multiframe Analysis Appendix K
Figure K.2 - Bending moment diagram for P = 490kN
157
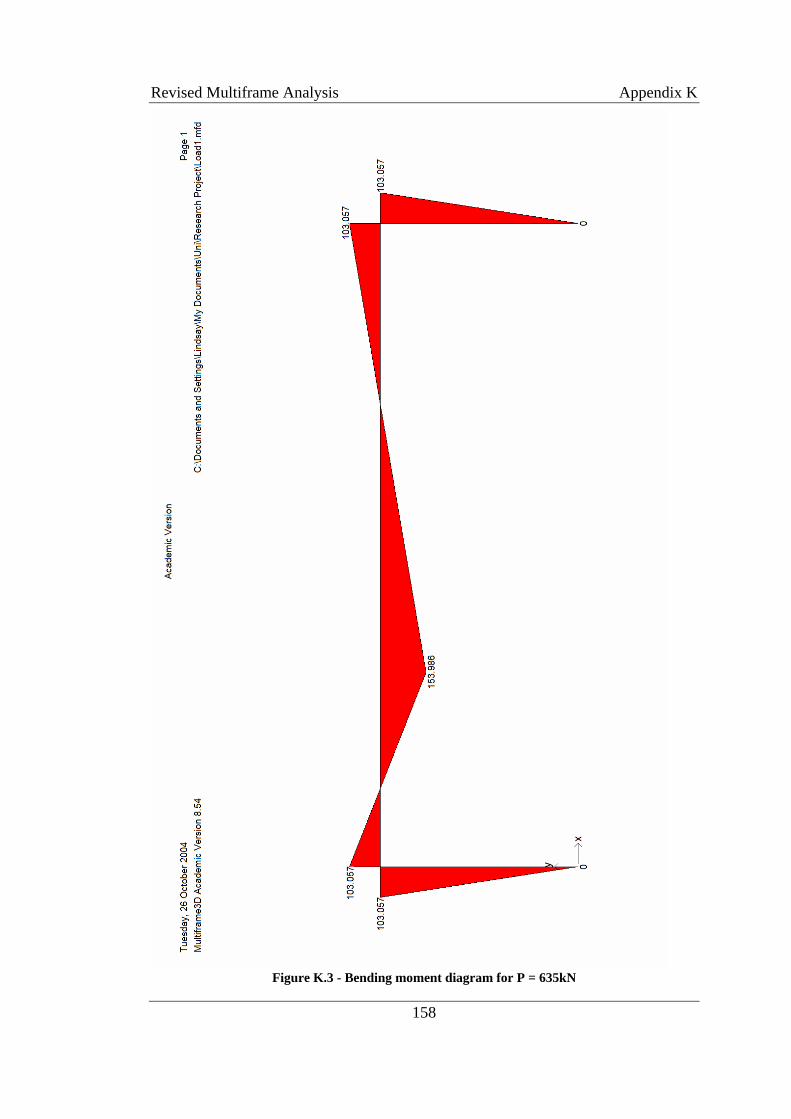
Revised Multiframe Analysis Appendix K
Figure K.3 - Bending moment diagram for P = 635kN
158

Revised Multiframe Analysis Appendix K
Figure K.4 - Bending moment diagram for P = 466kN
159

Revised Multiframe Analysis Appendix K
Figure K.5 - Bending moment diagram for P = 590kN
160