Embed Size (px)
Citation preview

She Figures Handbook
2015

EUROPEAN COMMISSION
Directorate-General for Research and Innovation Directorate B – Open Innovation and Open Science Unit B.7 Science with and for Society E-mail: [email protected] European Commission B-1049 Brussels
EUROPEAN COMMISSION
She Figures Handbook
2015
Produced and written by
Science-Metrix and KU Leuven: David Campbell, Chantale Tippett, Guillaume Roberge, Rémi Lavoie & Éric Archambault; Julie Callaert ICFI: Lucy Arora & Katerina Mantouvalou Version Date: 31/07/2015
Directorate-General for Research and Innovation 2016 FP7 Capacities – Science in Society
LEGAL NOTICE
The contents of this publication do not necessarily reflect the position or opinion of the European Commission.
More information on the European Union is available on the internet (http://europa.eu).
Luxembourg: Publications Office of the European Union, 2016.
PDF __ ISBN 978-92-79-48374-5 doi:10.2777/402057 KI-04-15-388-EN-N
© European Union, 2016. Reproduction is authorised provided the source is acknowledged.
EUROPE DIRECT is a service to help you find answers to your questions about the European Union
Freephone number (*): 00 800 6 7 8 9 10 11
(*) The information given is free, as are most calls (though some operators, phone boxes or hotels may charge you)
iii
CONTENTS TABLES ............................................................................................................... V
ACRONYMS ....................................................................................................... VI
GENERAL INTRODUCTION .................................................................. 1 1.
AIM AND SCOPE ........................................................................................ 1 1.1. HISTORY AND BACKGROUND OF THE SHE FIGURES ............................................... 2 1.2. STRUCTURE OF THE HANDBOOK ..................................................................... 3 1.3.
INDICATORS ...................................................................................... 4 2.
EUROSTAT – EDUCATION STATISTICS .............................................................. 4 2.1.2.1.1. Proportion of women PhD and women ISCED 6 graduates ...................................... 4 2.1.2. Compound annual growth rate (CAGR) of graduates by sex (ISCED 6 or PhD) .......... 5 2.1.3. Proportion of students and graduates by sex at the tertiary level of education (ISCED
5 and 6), by broad field of study ......................................................................... 7 2.1.4. Distribution of graduates by sex across the broad fields of study (either ISCED 6 or
PhD level) ........................................................................................................ 9 2.1.5. Proportion of women graduates by narrow field of study in natural science and
engineering (either ISCED 6 or PhD level) .......................................................... 11 2.1.6. Compound annual growth rates (CAGR) of graduates (ISCED 6 or PhD) by narrow
field of study in natural science and engineering, by sex ...................................... 13 EUROSTAT – HUMAN RESOURCES IN SCIENCE AND TECHNOLOGY ............................. 15 2.2.
2.2.1. Proportion of women in total employment .......................................................... 15 2.2.2. Compound annual growth rate (CAGR) for people in employment, by sex ............... 16 2.2.3. Tertiary educated and employed as professionals and technicians (HRSTC), as a
percentage of tertiary-educated people (HRSTE), by sex ...................................... 18 2.2.4. Proportion of tertiary-educated women employed as professionals or technicians
(HRSTC) ......................................................................................................... 19 2.2.5. Compound annual growth rate (CAGR) for tertiary-educated people who are employed
as professionals or technicians (HRSTC), by sex .................................................. 20 2.2.6. Proportion of scientists and engineers (S&E) in the total labour force, by sex .......... 22 2.2.7. Proportion of women in total employed as scientists and engineers (S&E) .............. 24 2.2.8. Compound annual growth rate (CAGR) for scientists and engineers (S&E), by sex ... 25
EUROSTAT – HIGH-TECH INDUSTRY AND KNOWLEDGE-INTENSIVE SERVICES ............... 27 2.3.2.3.1. Employment in knowledge-intensive activities (KIA), by sex (%) ........................... 27 2.3.2. Employment in knowledge-intensive activities – Business industries (KIABI), by sex
(%) ............................................................................................................... 30 EUROSTAT – RESEARCH AND DEVELOPMENT STATISTICS ...................................... 32 2.4.
2.4.1. Proportion of women researchers ...................................................................... 33 2.4.2. Compound annual growth rate (CAGR) for researchers, by sex ............................. 34 2.4.3. Researchers per thousand labour force by sex .................................................... 35 2.4.4. Proportion of women researchers by sector ........................................................ 37 2.4.5. Distribution of researchers across sectors, by sex ................................................ 38 2.4.6. Distribution of researchers in the higher education sector (HES) across fields of
science, by sex ............................................................................................... 40 2.4.7. Compound annual growth rates (CAGR) of women researchers in the higher education
sector (HES), by field of science ........................................................................ 42 2.4.8. Proportion of women researchers in the main fields of science, in different sectors of
the economy (HES, GOV and BES) .................................................................... 43 2.4.9. Distribution of researchers in the government sector (GOV) across fields of science,
by sex ............................................................................................................ 46 2.4.10. Compound annual growth rates (CAGR) of women researchers in the government
sector (GOV) by field of science ........................................................................ 48 2.4.11. Distribution of researchers across economic activities (NACE Rev. 2) in the business
enterprise sector (BES), by sex ......................................................................... 49 2.4.12. Proportion of women researchers by economic activity (NACE) in the business
enterprise sector (BES) .................................................................................... 52 2.4.13. Compound annual growth rate (CAGR) for researchers in the higher education sector
(HES), by sex ................................................................................................. 54 2.4.14. Compound annual growth rate (CAGR) for researchers in the government sector
(GOV), by sex ................................................................................................. 56 2.4.15. Compound annual growth rate for researchers in the business enterprise sector (BES),
by sex ............................................................................................................ 57

iv
2.4.16. Distribution of researchers in the higher education sector (HES), by sex and age group ............................................................................................................. 59
2.4.17. Distribution of researchers in the government sector (GOV), by sex and age group . 61 2.4.18. Dissimilarity Index for researchers in the higher education sector (HES) and
government sector (GOV) ................................................................................. 63 2.4.19. Distribution of R&D personnel by sector of the economy, occupation and sex .......... 64 2.4.20. Total intramural R&D expenditure (GERD) per researcher in FTE, by sector of the
economy ........................................................................................................ 67 EUROSTAT – STRUCTURE OF EARNINGS SURVEYS (SES) ..................................... 68 2.5.
2.5.1. Gender pay gap (%) by country across economic activities (NACE Rev. 2) .............. 68 2.5.2. Gender pay gap (%) by age group across economic activities (NACE Rev. 2) .......... 70
MORE SURVEY ...................................................................................... 72 2.6.2.6.1. Sex differences for international mobility during PhD ........................................... 73 2.6.2. Sex differences for international mobility in post-PhD career stages, per country ..... 76 2.6.3. Part-time employment of researchers in the higher education sector (HES) out of total
researcher population, by sex ........................................................................... 78 2.6.4. ‘Precarious’ working contracts of researchers in HES out of total researcher
population, by sex ........................................................................................... 80 WOMEN IN SCIENCE (WIS) QUESTIONNAIRE.................................................... 82 2.7.
2.7.1. Proportion of women academic staff, by grade .................................................... 83 2.7.2. Proportion of women in grade A academic positions ............................................. 84 2.7.3. Grade A (%) amongst all academic staff, by sex ................................................. 85 2.7.4. Proportion of staff for all main fields of science, by sex and by grade ..................... 86 2.7.5. Distribution of grade A staff across fields of science, by sex .................................. 88 2.7.6. Glass Ceiling Index .......................................................................................... 89 2.7.7. Proportion of women grade A staff, by age group ................................................ 91 2.7.8. Distribution of grade A staff across age groups, by sex ........................................ 92 2.7.9. Proportion of women heads of institutions in the higher education sector (HES) ...... 93 2.7.10. Proportion of women heads of universities or assimilated institutions based on
capacity to deliver PhDs ................................................................................... 94 2.7.11. Proportion of women on boards ......................................................................... 94 2.7.12. Funding success rate difference between women and men .................................... 95 2.7.13. Funding success rate difference between women and men, by field of science ......... 96
WEB OF SCIENCETM (WOSTM) ..................................................................... 97 2.8.2.8.1. Ratio of women to men scientific authorships ...................................................... 99 2.8.2. Compound annual growth rate (CAGR) of women scientific authorships ................ 100 2.8.3. Ratio of women to men international co-publication rate .................................... 101 2.8.4. Compound annual growth rate (CAGR) of the ratio of women to men international co-
publication rate ............................................................................................. 102 2.8.5. Women to men ratio of their average of relative impact factors (ARIF) ................. 103 2.8.6. Compound annual growth rate (CAGR) of the women to men ratio of their average of
relative impact factors (ARIF) ......................................................................... 104 2.8.7. Proportion of a country’s research output integrating a gender dimension in its
research content (GDRC) ................................................................................ 105 2.8.8. Compound annual growth rate (CAGR) of the proportion of a country’s research
outputs integrating a GDRC ............................................................................ 106 EPO WORLDWIDE PATENT STATISTICAL DATABASE (PATSAT) ............................ 107 2.9.
2.9.1. Ratio of women to men inventorships .............................................................. 108 2.9.2. Compound annual growth rate (CAGR) of the proportion of women inventorships .. 109
EUROPEAN RESEARCH AREA (ERA) SURVEY 2014 ........................................... 110 2.10.2.10.1. Proportion of research performing organisations (RPOs) that adopted gender equality
plans ........................................................................................................... 110 2.10.2. Proportion of research and development (R&D) personnel working in organisations
that adopted gender equality plans .................................................................. 112 2.10.3. Implementation of gender equality measures in research performing organisations
(RPOs) ......................................................................................................... 113
QUALITY PLAN: VERIFICATION AND VALIDATION OF DATA .......... 115 3.
ANNEX 1: CHANGES TO INTERNATIONAL CLASSIFICATION STANDARDS ....... 124
ANNEX 2: DEFINITIONS OF KEY TERMS .......................................................... 126
ANNEX 3: INDEX LIST OF INDICATORS .......................................................... 128
REFERENCES ................................................................................................... 130

v
TABLES
TABLE 1 TOTAL KNOWLEDGE-INTENSIVE ACTIVITIES (KIA), NACE REV. 2 29 TABLE 2 KNOWLEDGE-INTENSIVE ACTIVITIES – BUSINESS INDUSTRIES (KIABI), NACE REV. 2 31 TABLE 3 DIMENSIONS OF THE DATA QUALITY FRAMEWORK 116 TABLE 4 LIST OF COHERENCE CHECKS 118 TABLE 5 CORRESPONDENCE BETWEEN ISCED 2011 AND ISCED 1997 LEVELS 124

She Figures Handbook, 2015
vi
ACRONYMS
ARIF Average of relative impact factors
BES Business enterprise sector
CAGR Compound annual growth rate
DI Dissimilarity Index
DG Directorate-General
EIGE European Institute for Gender Equality
EPO European Patent Office
EPO PATSTAT EPO Worldwide Patent Statistical Database
ERA European Research Area
FOS Field of science
FTE Full-time equivalent
GCI Glass Ceiling Index
GDP Gross Domestic Product
GDRC Gender dimension in research content
GERD Gross domestic expenditure on R&D
GOV Government sector
GPG Gender pay gap
HC Head count
HEI Higher education institutions
HES Higher education sector
HQP Highly qualified personnel
HRST Human resources in science and technology
ILO International Labour Organization
IPC International Patent Classification (by WIPO)
ISCED International Standard Classification of Education
ISCO International Standard Classification of Occupations
KIA Knowledge-intensive activities
KIABI Knowledge-intensive activities – Business industries
LFS Eurostat Labour Force Survey
MORE Mobility and Career Paths of Researchers in Europe
NACE Nomenclature générale des activités économiques dans les communautés européennes
PATSTAT EPO Worldwide Patent Statistical Database
PNP Private non-profit
PPS Purchasing power standards
R&D Research and development
R&I Research and innovation
RFOs Research funding organisations
RPOs Research performing organisations
S&E Scientists and engineers
S&T Science and technology
She Figures Handbook, 2015
vii
SES Structure of Earnings Survey
SILC Survey on Income and Living Conditions
WIPO World Intellectual Property Organization
WiS Women in Science
WoSTM Web of ScienceTM database (by Thomson Reuters)
She Figures Handbook, 2015
Page 1
GENERAL INTRODUCTION 1.
This Handbook of Indicators on Women in Science has been developed to accompany the She Figures publication. It contains methodological guidance on the collection of data and the calculation of all indicators in the She Figures. In doing so, it provides further guidelines and recommendations with regard to the collection, processing and use of data on gender equality in research, innovation and science, with the potential to inform organisations at both the national and European level.
She Figures
The She Figures provides pan-European, comparable statistics on the state of gender equality in science and research. It covers a wide range of themes, including the gender balance amongst PhD students and academic staff, the relative working conditions of men and women researchers and the steps taken by research institutions to promote gender equality internally. Released every three years since 2003, the report provides a crucial evidence base for policies in this area. It is produced in close collaboration with the Helsinki Group and their Statistical Correspondents. It is recommended reading for policymakers, researchers and anybody with a general interest in these issues.
A large portion of the She Figures publication is dedicated to reporting back on a core set of well-established indicators, which serve as the foundation for exposing persistent gender inequalities in the fields of research and innovation (R&I). In addition, each She Figures publication builds on previous versions by introducing new indicators, which aim to bring additional and critical gender-based issues to the forefront of the science and technology debate.
This handbook serves as a resource detailing the relevant guidelines for the collection of data pertaining to all She Figures indicators.
Upon future developments and new editions of the She Figures indicators, the handbook will be revised accordingly. As such, it is designed to reflect the state of the art in the mapping and monitoring of gender equality in science and research.
Aim and scope 1.1.
Aim
This handbook aims to provide specific guidelines and recommendations concerning the necessary data and indicators for monitoring progress towards gender equality in science, research and innovation.
In particular, the handbook promotes cross-country uniformity in terms of data collection, indicator computation and data-validation procedures. Furthermore, it provides interested stakeholders with detailed information on the data needed to examine gender equality in research and innovation as well as the importance given to gender/sex issues in research content. It serves as a reference document and provides users with the methods needed to calculate the indicators, so as to increase the quality and consistency of gender-related indicators across countries and time periods.
Scope
The handbook is not intended to be specific to any version of the She Figures publications. Rather, it is intended to be used as the basis for the computation of indicators in current and future versions of She Figures and related publications.
Current version of the handbook
Although intended to act as a stand-alone document (i.e. untied to any of the specific versions of the She Figures publication), the current version of the handbook was created to accompany the 2015 edition of the publication and thus includes some details specific to that edition. In the 2015 version of She Figures, data are presented at the individual country level as well as the broader EU level for the current 28 EU Member States, plus candidate countries (Iceland, the Former Yugoslav Republic of Macedonia, Montenegro, the Republic of Serbia, Turkey) and associated
She Figures Handbook, 2015
Page 2
countries (Albania, Bosnia and Herzegovina, the Faroe Islands, Israel, Liechtenstein, the Republic of Moldova, Norway, Switzerland).
The handbook has been thoroughly cross-referenced and contains an indexed list of key terms aimed at improving accessibility and readability (see Annex 2).
History and background of the She Figures 1.2.
History
In 1999, the Council of the EU recognised that women were under-represented in the fields of scientific and technical research, describing this as a ‘common concern’ at the national and European level.1 At this time, there were virtually no pan-European statistics on what happened to women after they left university, despite fears that after graduating from their degrees, ‘women frequently encounter[ed] obstacles in their career[s]’, which contributed to their under-representation in scientific posts (DG Research and Innovation, 2009c).
In the late 1990s, the EU recognised the need for harmonised sex-disaggregated data on women in science and research if governments were to develop effective policies in this area.2 Meeting in 1999, the Helsinki Group on Women and Science appointed a sub-group of Statistical Correspondents with responsibility for collecting national data and feeding into the creation of European statistics on these topics.
The end result of this process was the She Figures, first released in 2003 and updated every three years since. By presenting statistical indicators on a wide range of topics, the report enables readers to develop a comprehensive understanding of the state of gender equality in science and research.
Changes to the She Figures over time
Primarily, the She Figures publication serves as a tool for measuring the impact and effectiveness of gender equality policies in science and research. The majority of indicators in the She Figures present and explore the following themes:
• The presence of women in research across different sectors (in line with the Frascati Manual);
• Horizontal segregation by sex across different fields of study and occupations (in R&D roles);
• Vertical segregation by sex in academia, i.e. the (under-)representation of women in the highest grades/posts of research and as heads of academic institutions.
Each edition also aims to further understanding of these issues by introducing additional indicators that explore new themes.
The second, third and fourth editions of the She Figures (2006, 2009 and 2012) expanded the scope of the indicators in many ways. She Figures 2006 developed new indicators to give a more detailed picture of the labour force as a whole and the patterns of employment for women and men researchers across different sectors, such as the business enterprise sector (BES). The 2009 edition introduced indicators on the gender pay gap and began to break down some data by age group (in addition to sex disaggregation). Amongst other things, the 2012 report added indicators on the mobility of researchers and the proportion of researchers with children.
Similarly, She Figures 2015 includes new indicators to match emerging policy priorities. Some provide further insight into the working conditions of researchers, considering the degree to which they are employed on a part-time basis or on precarious contracts. Another new indicator considered what research organisations had done to promote gender equality in the workplace.
1 Council Resolution of 20 May 1999 on Women and Science (1999/C 201/01).
2 For example, see European Commission (1999), ‘Women and science: mobilising women to enrich European research’, COM(1999)76; European Parliament Resolution on Commission’s Communication COM(1999)76 (PE 284.656), 1999.

She Figures Handbook, 2015
Page 3
Four more new indicators measure the relative contribution of women and men to published research and inventorships.
One new indicator in the 2015 edition measures the degree to which researchers integrate a sex/gender analysis into their research papers in different countries. This indicator is the first to consider research content itself, as opposed to the personnel and conditions within the research community.
Data in the She Figures
Most of the She Figures indicators originate from Eurostat (the Statistical Office of the EU), which provides sex-disaggregated data on education, research and development, professional earnings and scientific employment. The Statistical Correspondents enrich this picture, by collecting primary data (broken down by sex) on senior academic staff, the heads of universities, funding applicants and beneficiaries and the membership of scientific boards.3 Expansion of the She Figures since 2003 has resulted in the use of other sources, including the MORE Survey on the Mobility of Researchers, the European Research Area (ERA) Survey, the Web of ScienceTM database and the EPO Worldwide Patent Statistical Database.
Structure of the handbook 1.3.
The Handbook of Indicators on Women in Science is made up of three sections and one annex:
• The first (current) section provides a brief overview of the aim and scope of the handbook, as well as a background to the She Figures.
• The second describes all indicators used in the She Figures publication, including definitions, rationale as well as computation method (with the necessary data, data source, formulas and any calculation specifications or comments that may be of relevance).
• The third section details the general quality plan of the She Figures publication, focusing on the methodological principles employed in the verification and validation of data.
• There are three annexes. The first synthesises recent changes to international classification standards that were taken into account. The second provides an overview of how key terms are defined. Finally, the third provides lists of the indicators sorted by alphabetical order, by (sub)topic and by key terms.
The sections and annexes are followed by the bibliography.
3 This primary data makes up the Women in Science (WiS) database.

She Figures Handbook, 2015
Page 4
INDICATORS 2.
The indicators presented in this handbook have been selected from a variety of different sources on the basis that they provide important information on gender inequalities in the field of research and innovation. The development of each new version of She Figures includes several in-depth consultations with key stakeholders to determine how the landscape of data on gender equalities has changed since the previous version of the publication was created and whether the inclusion of new indicators is merited. During this process, indicators from previous versions of the publication are also reassessed to determine whether they are still relevant and to ensure that they adhere to ever increasing quality and coverage standards.
The data required to compute the majority of indicators are drawn from Eurostat databases or from the Women in Science database of data collected by the Helsinki Group’s Statistical Correspondents. Other data sources have been used to develop new indicators in recent years. For example, in the 2015 edition of She Figures, the Web of ScienceTM (WoSTM) has been used to produce scientometric indicators by sex (e.g. ratio of women to men authorship of scientific papers, proportion of a country’s scientific production including a gender dimension), and the EPO Worldwide Patent Statistical Database (PATSTAT) has been used to produce a technometric indicator by sex (e.g. ratio of women to men inventorship).
The following Sections (2.1 to 2.11) present the She Figures indicators by data source and subject group. Each section is introduced by a general rationale for the selection of each group of indicators – based on a content perspective – as well as a broad description of the source.
Eurostat – Education statistics 2.1.
Content-based rationale
Indicators computed from Eurostat education statistics aim to investigate the level of progress and the persistent barriers that exist for women in the pursuit of postgraduate education, as well as the differences in subject choice and fields of study by gender, particularly in regard to natural science and engineering, within the context of persistent gender stereotypes and the EU’s policy agenda. Indicators falling into this category include the proportion of women ISCED 6 graduates by country, the proportion of women PhD graduates by country, the compound annual growth of ISCED 6 graduates by sex, the proportion of women PhD and ISCED 6 graduates by field of study, and the distribution of ISCED 6 graduates across the broad fields of study by sex.
Broad overview of the source
These data can be accessed through the Education and Training Statistics database on the Eurostat website (http://ec.europa.eu/eurostat/web/education-and-training/overview). The data on education and training statistics are concerned with student enrolment and the ‘education expectancy, funding, and the characteristics (e.g. gender and age) of graduates and educational personnel’ (European Commission, 2014a). Data are collected on an annual basis, based on the academic year (i.e. 2012 refers to the academic year 2011/12) (European Commission, 2015b). Indicators, such as ‘early leavers from education and training’ and ‘tertiary educational attainment’ are used by policymakers to monitor the Europe 2020 strategy. The other statistics provide information on ‘education, vocational training and lifelong learning’ (European Commission, 2015a). These statistics are publicly available, regularly updated and accompanied by extensive methodological notes.
A complete list of indicators falling into this category can be found in Annex 3 and their detailed description follows below.
2.1.1. Proportion of women PhD and women ISCED 6 graduates
Definition of indicator
This indicator presents the proportion of women in either ISCED 6-level programmes or PhD programmes, broken down by country.

She Figures Handbook, 2015
Page 5
Rationale
In line with its ambition to encourage more ‘research-intensive’ economies, the European Commission has called for more doctoral candidates and argued that efforts must be made to tackle ‘stereotyping and … the barriers still faced by women in reaching the highest levels in post-graduate education and research’ (European Commission, 2011b). This indicator sheds light on the level of progress in increasing women’s representation in the top levels of education and research, considering their success in ultimately graduating from doctoral degrees, as opposed to their entry as candidates.
Computation method
Data needed
(F) Total number of women graduates, either at ISCED-97 Level 6 or pursuing direct PhD programmes: Unit=Total;
(T) Total number of graduates, either at ISCED-97 Level 6 or pursuing direct PhD programmes: Unit=Total.
Source of data
For F and T: Eurostat – Education Statistics (online data code: educ_grad5)
Specifications = F T⁄
Students and graduates
The International Standard Classification of Education (ISCED-97) categorises education programmes by level. ISCED-97 Level 6 (also referred to as ISCED 6) covers:
• The second stage, which leads to the award of an advanced research qualification (e.g. PhD, non-PhD programmes with an advanced research component, etc.). The programmes are devoted to advanced study and original research (ISCED 6).
Eurostat also makes use of a ‘direct PhD’ code, which includes only those graduates pursuing PhD programmes (excluding those pursuing non-PhD programmes with an advanced research component). This indicator is calculated using either the direct PhD code or the more general ISCED Level 6.
The number of graduates refers to those graduating in the reference year and not to the number of graduates in the population.
The number of graduates also refers to non-nationals graduating in the country, but does not include nationals graduating abroad.
Comments/critical issues
There were some changes to the ISCED in 2011, although the She Figures continues to use the 1997 classifications. For more explanation, see Annex 1, which presents recent changes to international classification standards.
In most countries, the number of graduates at ISCED 6 and PhD level is the same. When calculating this indicator, it is important to make clear which code (ISCED 6 or direct PhD) is being used.
2.1.2. Compound annual growth rate (CAGR) of graduates by sex (ISCED 6 or PhD)
Definition of indicator
This indicator presents the compound annual growth rate (CAGR) of graduates by sex, meaning the average percentage growth each year for women and men graduates in a given period. It does so for graduates at either the ISCED 6 or the PhD level.

She Figures Handbook, 2015
Page 6
Rationale
In 2012, the European Commission warned that ‘while the proportion of women at the first two levels of tertiary education is higher than that of men, the proportion of women at PhD level is lower. It diverges even more in academic positions, and is greatest in the higher (more prestigious) academic positions’ (DG Research and Innovation, 2012b). The EU recognises the potential benefits of boosting women’s representation in the highest positions of research and academia, in order to reach its target of one million new research jobs (European Commission, 2011b). This indicator demonstrates the level of progress over time in increasing women’s presence amongst those taking doctoral degrees.
Computation method
Data needed
(F) Total number of women graduates in the earliest and latest reference year (ISCED-97 Level 6 or PhD): Unit=Total;
(M) Total number of men graduates in the earliest and latest reference year (ISCED-97 Level 6 or PhD): Unit=Total;
(N) Number of years in reference period (calculated by subtracting the defined starting reference year (or the latest year with available data) from latest reference year with available data): Unit=Number of years.
Source of data
For F, M and N: Eurostat – Education Statistics (online data code: educ_grad5)
Specifications
The CAGR shows the yearly average rate of growth for a given period. For women and men graduates, it is respectively computed as follows: = (F F⁄ ) − 1
= (M M⁄ ) − 1 where:
s refers to the start year;
e refers to the end year;
N denotes the number of years in the reference period (i.e. e – s);
Fs denotes the number of women graduates in the start year;
Fe denotes the number of women graduates in the end year;
Ms denotes the number of men graduates in the start year;
Me denotes the number of men graduates in the end year.
For example, if there were 100 women graduates in 2002 and 150 in 2006, the calculation would be: = (150 100⁄ ) − 1 = 10.67%
Students and graduates
The International Standard Classification of Education (ISCED-97) categorises education programmes by level. ISCED-97 Level 6 (also referred to as ISCED 6) covers:

She Figures Handbook, 2015
Page 7
• The second stage, which leads to the award of an advanced research qualification (e.g. PhD, non-PhD programmes with an advanced research component, etc.). The programmes are devoted to advanced study and original research (ISCED 6).
Eurostat also makes use of a ‘direct PhD’ code, which includes only those graduates pursuing PhD programmes (excluding those pursuing non-PhD programmes with an advanced research component). This indicator is calculated using either the direct PhD code or the more general ISCED Level 6.
The number of graduates refers to those graduating in the reference year and not to the number of graduates in the population. The number of graduates also refers to non-nationals graduating in the country, but does not include nationals graduating abroad.
Comments/critical issues
There were some changes to the ISCED in 2011, although the She Figures publication continues to use the 1997 classifications. For further details see Annex 1, which presents recent changes to international classification standards.
In most countries, the number of graduates at ISCED 6 and PhD level is the same. When calculating this indicator, it is important to make clear which code (ISCED 6 or direct PhD) is being used.
2.1.3. Proportion of students and graduates by sex at the tertiary level of education (ISCED 5 and 6), by broad field of study
Definition of indicator
This indicator looks at the number of men and women present at different stages of a typical educational pathway throughout the different levels of study, in various fields of study, for all the EU-28 countries combined.
Rationale
Although there is some disagreement amongst experts,4 it is generally accepted that differences in women and men’s educational pathways may have some impact on the occupations they pursue at a later stage. For example, the proportion of women amongst PhD graduates in ‘engineering, manufacturing and construction’ and ‘science, mathematics and computing’ has traditionally been low, as has their representation amongst academic staff who work in science and engineering.5 By breaking down PhD graduations into different fields of study, this indicator enables more in-depth analysis of the extent of gender difference in subject choice.
In 2012, DG Research and Innovation recognised that, despite accounting for nearly 60 % of all university graduates in Europe (DG Research and Innovation, 2012d; DG Research, 2009b; original data from Eurostat, educ_grad5), women were still severely under-represented at the higher levels of the academic career path. Indeed, only 18 % of full professors, 13 % of heads of higher education institutions and 22 % of board members in research decision-making are women (DG Research and Innovation, 2012d; DG Research, 2009b). As such, it is interesting to monitor the number of women present at each level of academia in order to observe whether there is progress towards reducing vertical segregation (‘the leaky pipeline’). Vertical segregation is defined as the under- or over-representation of a clearly identifiable group of workers in occupations or sectors at the top of an ordering based on ‘desirable’ attributes (European Commission’s Expert Group on Gender and Employment, 2009).
4 The debate relates to the level and nature of the impact on educational segregation on later segregation in the labour market. For an overview of the debate, consider EGGE (2009), pp. 42–45.
5 This scenario conforms to the picture given by She Figures 2006, She Figures 2009, and She Figures 2012.

She Figures Handbook, 2015
Page 8
Computation method
Data needed
(Te,s) Total number of students/ISCED 6 graduates by their educational status in each broad field of study: Unit=Total;
(Fe,s) Number of women students/ISCED 6 graduates by their educational status in each broad field of study: Unit=Total;
(Me,s) Number of men students/ISCED 6 graduates by their educational status in each broad field of study: Unit=Total.
(e) Denotes the education status of a student:
ISCED-97 Level 5A −
ISCED-97 Level 5B −
ISCED-97 Level 6 −
(s) Denotes a given broad field of study:
Education −
Humanities and arts −
Social sciences, business and law −
Science, mathematics and computing −
Engineering, manufacturing and construction −
Agriculture and veterinary −
Health and welfare −
Services −
Total of all fields of study −
Source of data
EUROBASE – the Eurostat dissemination database; Eurostat – Education Statistics (online data code: educ_enrl1tl, educ_grad4, educ_grad5)
Specifications / ℎ = F , T ,⁄ / ℎ = M , T ,⁄
where:
e denotes a particular field;
S denotes a given education status; F , denotes the number of women ISCED 6 graduates in this field; T , denotes the total number of ISCED graduates in this field.
ISCED
The International Standard Classification of Education (ISCED-97) categorises education programmes by level.
Tertiary education or higher education involves two stages:

She Figures Handbook, 2015
Page 9
• The first stage includes largely theory-based programmes to provide sufficient qualifications to gain entry to advanced research programmes and professions with high skills requirements (ISCED 5A) and to programmes that are generally more practically, technically or occupationally specific than ISCED 5A (ISCED 5B).
• The second stage leads to the award of an advanced research qualification (e.g. PhD, non-PhD programmes with an advanced research component, etc.). The programmes are devoted to advanced study and original research (ISCED 6).
The number of graduates refers to those graduating in the reference year and not to the number of graduates in the population. The number of graduates also refers to non-nationals graduating in the country, but does not include nationals graduating abroad.
ISCED-97 fields of education/study
The International Standard Classification of Education (ISCED) has been designed as an instrument suitable for assembling, compiling and presenting statistics on education both within countries and internationally. The system has recently been revised and updated, and the ‘new’ ISCED was introduced in 1997 (ISCED-97). The system is developed by classifying each educational programme by field of education and by level.
The ISCED-97 classification proposes nine one-digit fields of education:
• Code 0 General programmes
• Code 1 Education
• Code 2 Humanities and arts
• Code 3 Social sciences, business and law
• Code 4 Science
• Code 5 Engineering, manufacturing and construction
• Code 6 Agriculture
• Code 7 Health and welfare
• Code 8 Services
Comments/critical issues
• There were some changes to the ISCED in 2011, although the She Figures publication continues to use the 1997 classifications. For further details see Annex 1, which presents recent changes to international classification standards.
• In some countries, non-PhD programmes with an advanced research component are included in ISCED 6. It is important to note that these data are not always completely cross-country comparable as the seniority of grades is not yet part of a formal international classification.
2.1.4. Distribution of graduates by sex across the broad fields of study (either ISCED 6 or PhD level)
Definition of indicator
This indicator presents the distribution of women and men graduates across seven fields of study (either at ISCED 6 or PhD level).
Rationale
As mentioned above, experts generally consider that the differences in women and men’s educational pathways may have an impact on the occupations they pursue at a later stage.6 This association between education and employment is a core part of the EU policy agenda. For instance, the European Commission is campaigning to encourage more girls to take science
6 There is, however, debate about the level and nature of this impact. For an overview of the debate, consider EGGE (2009), pp. 42–45.
She Figures Handbook, 2015
Page 10
subjects, with a view to considering a career in this area (for example, via DG Research and Innovation’s ‘Science: It’s a girl thing!’ campaign).
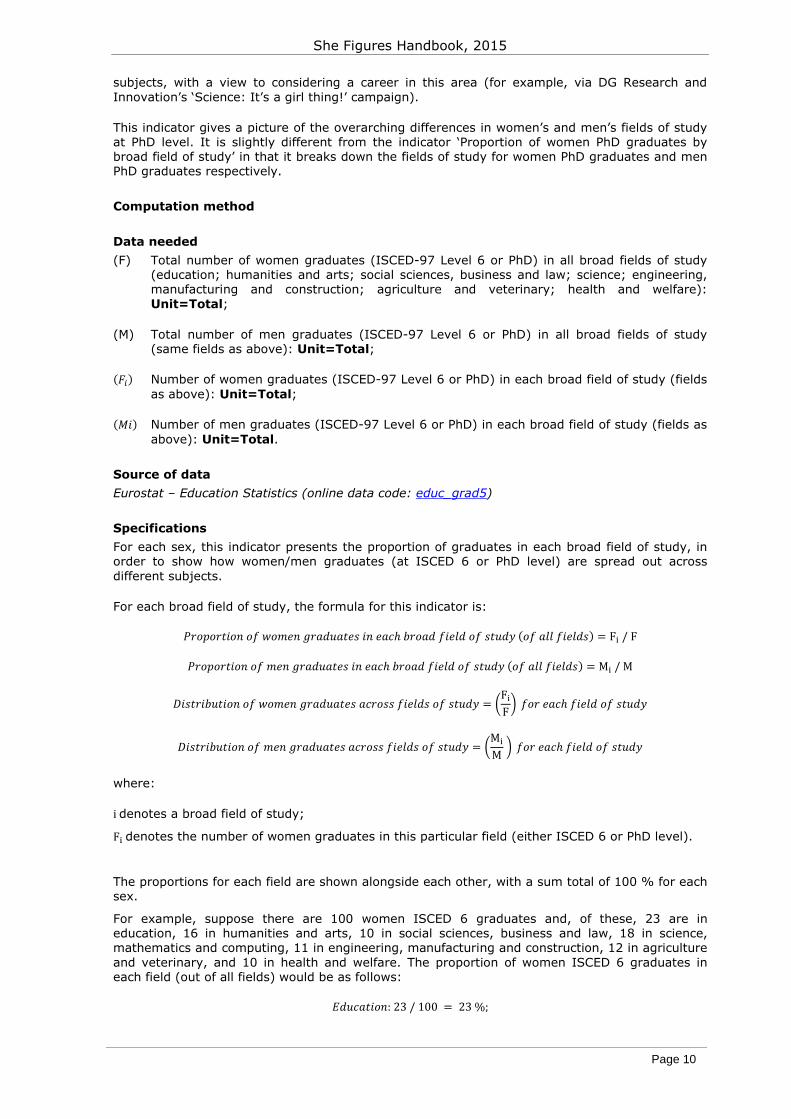
This indicator gives a picture of the overarching differences in women’s and men’s fields of study at PhD level. It is slightly different from the indicator ‘Proportion of women PhD graduates by broad field of study’ in that it breaks down the fields of study for women PhD graduates and men PhD graduates respectively.
Computation method
Data needed
(F) Total number of women graduates (ISCED-97 Level 6 or PhD) in all broad fields of study (education; humanities and arts; social sciences, business and law; science; engineering, manufacturing and construction; agriculture and veterinary; health and welfare): Unit=Total;
(M) Total number of men graduates (ISCED-97 Level 6 or PhD) in all broad fields of study (same fields as above): Unit=Total; ( ) Number of women graduates (ISCED-97 Level 6 or PhD) in each broad field of study (fields as above): Unit=Total; ( ) Number of men graduates (ISCED-97 Level 6 or PhD) in each broad field of study (fields as above): Unit=Total.
Source of data
Eurostat – Education Statistics (online data code: educ_grad5)
Specifications
For each sex, this indicator presents the proportion of graduates in each broad field of study, in order to show how women/men graduates (at ISCED 6 or PhD level) are spread out across different subjects.
For each broad field of study, the formula for this indicator is: ℎ ( ) = F /F ℎ ( ) = M /M
= FF ℎ
= MM ℎ
where: idenotes a broad field of study; F denotes the number of women graduates in this particular field (either ISCED 6 or PhD level).
The proportions for each field are shown alongside each other, with a sum total of 100 % for each sex.
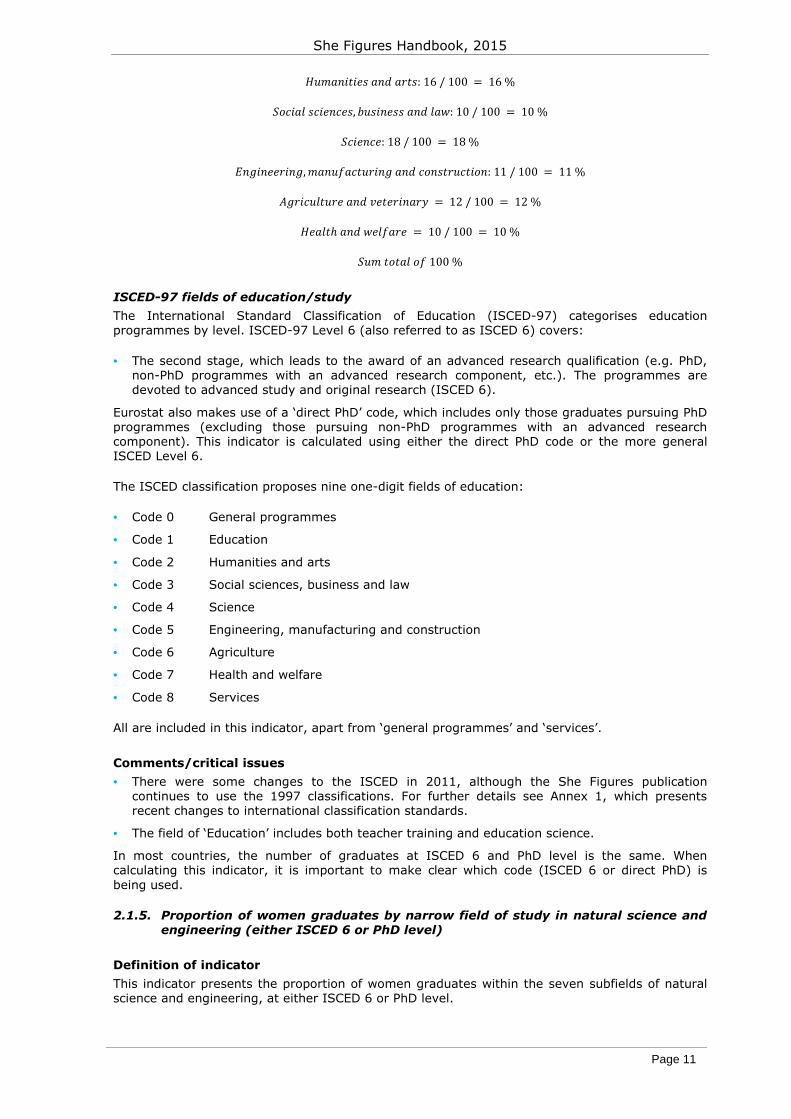
For example, suppose there are 100 women ISCED 6 graduates and, of these, 23 are in education, 16 in humanities and arts, 10 in social sciences, business and law, 18 in science, mathematics and computing, 11 in engineering, manufacturing and construction, 12 in agriculture and veterinary, and 10 in health and welfare. The proportion of women ISCED 6 graduates in each field (out of all fields) would be as follows: :23/100 = 23%;
She Figures Handbook, 2015
Page 11
:16/100 = 16% , :10/100 = 10% :18/100 = 18% , :11/100 = 11% = 12/100 = 12% ℎ = 10/100 = 10% 100%
ISCED-97 fields of education/study
The International Standard Classification of Education (ISCED-97) categorises education programmes by level. ISCED-97 Level 6 (also referred to as ISCED 6) covers:
• The second stage, which leads to the award of an advanced research qualification (e.g. PhD, non-PhD programmes with an advanced research component, etc.). The programmes are devoted to advanced study and original research (ISCED 6).
Eurostat also makes use of a ‘direct PhD’ code, which includes only those graduates pursuing PhD programmes (excluding those pursuing non-PhD programmes with an advanced research component). This indicator is calculated using either the direct PhD code or the more general ISCED Level 6.
The ISCED classification proposes nine one-digit fields of education:
• Code 0 General programmes
• Code 1 Education
• Code 2 Humanities and arts
• Code 3 Social sciences, business and law
• Code 4 Science
• Code 5 Engineering, manufacturing and construction
• Code 6 Agriculture
• Code 7 Health and welfare
• Code 8 Services
All are included in this indicator, apart from ‘general programmes’ and ‘services’.
Comments/critical issues
• There were some changes to the ISCED in 2011, although the She Figures publication continues to use the 1997 classifications. For further details see Annex 1, which presents recent changes to international classification standards.
• The field of ‘Education’ includes both teacher training and education science.
In most countries, the number of graduates at ISCED 6 and PhD level is the same. When calculating this indicator, it is important to make clear which code (ISCED 6 or direct PhD) is being used.
2.1.5. Proportion of women graduates by narrow field of study in natural science and engineering (either ISCED 6 or PhD level)
Definition of indicator
This indicator presents the proportion of women graduates within the seven subfields of natural science and engineering, at either ISCED 6 or PhD level.

She Figures Handbook, 2015
Page 12
Rationale
The EU recognises the existence of horizontal segregation, whereby women and men at the same level of education or employment are concentrated in different fields (full definition available in Annex 2). For example, according to the Gendered Innovations project (in which the European Commission is a partner), ‘[i]n both the United States and European Union, women are slightly underrepresented with respect to overall doctoral (PhD or ISCED Level 6) degrees, but substantially underrepresented with respect to S&E doctorates’ (Stanford University, ‘Disparities between women and men’).
This indicator allows one to measure such segregation at PhD or ISCED Level 6, by presenting the proportion of women graduates in certain subfields. By breaking down the graduations by subfield, one can assess variations within broader fields of study.
Computation method
Data needed
(F) Number of women graduates (ISCED-97 Level 6 or PhD) in each narrow field of study (ISCED-97) in natural science and engineering: Unit=Total;
(T) Total number of graduates (ISCED-97 Level 6 or PhD) in each narrow field of study (ISCED-97) in natural science and engineering: Unit=Total.
Source of data
For F and T: Eurostat – Education Statistics (online data code: educ_grad5)
Specifications ℎ = F T⁄
where: i refers to a particular narrow field of study; F denotes the number of women graduates (ISCED 6 or PhD) in that field; T denotes the total number of graduates (ISCED 6 or PhD) in the same field as F .
ISCED-97 narrow fields of study in natural science and engineering
The International Standard Classification of Education (ISCED-97) categorises education programmes by level. ISCED-97 Level 6 (also referred to as ISCED 6) covers:
• The second stage, which leads to the award of an advanced research qualification (e.g. PhD, non-PhD programmes with an advanced research component, etc.). The programmes are devoted to advanced study and original research (ISCED 6).
Eurostat also makes use of a ‘direct PhD’ code, which includes only those graduates pursuing PhD programmes (excluding those pursuing non-PhD programmes with an advanced research component). This indicator is calculated using either the direct PhD code or the more general ISCED Level 6.
Narrow fields of study in natural science and engineering
ISCED-97: Science
• Life science
• Physical science
• Mathematics and statistics
• Computing
ISCED-97: Engineering, manufacturing and construction

She Figures Handbook, 2015
Page 13
• Engineering and engineering trades
• Manufacturing and processing
• Architecture and building
Comments/critical issues
• There were some changes to the ISCED in 2011, although the She Figures publication continues to use the 1997 classifications. For further details see Annex 1, which presents recent changes to international classification standards.
• In the body of the She Figures, this indicator is presented for two reference years in order to show the evolution of the proportion of women PhD graduates in various fields of study (i.e. the extent of change over time).
• In most countries, the number of graduates at ISCED 6 and PhD level is the same. When calculating this indicator, it is important to make clear which code (ISCED 6 or direct PhD) is being used.
2.1.6. Compound annual growth rates (CAGR) of graduates (ISCED 6 or PhD) by narrow field of study in natural science and engineering, by sex
Definition of indicator
This indicator presents the compound annual growth rate of the number of men and women graduates (ISCED 6 or PhD level) within various scientific subfields: 1) life science, physical science, mathematics and statistics, computing (falling under the broad field of ‘science’) and 2) engineering and engineering trades, manufacturing and processes, and architecture and building (falling under the broad field of ‘engineering, manufacturing and construction’).
Rationale
The EU recognises the persistent differences in the educational choices of women and men. In 2014, the Council of the EU called on Member States and the European Commission to ‘consider … possible ways to address gender stereotypes and segregation in education such as … undertaking media campaigns encouraging and enabling girls and boys/women and men to choose educational paths and occupations in accordance with their abilities and skills’ (Council of the European Union, 2014).
This indicator allows one to gauge the extent of such segregation at ISCED 6 or PhD level, by calculating the changes in women and men’s representation over time. By breaking down the graduations by subfield, one can assess variations within broader fields of study.7 Please note that the results of this indicator can be compared with those of the similar indicator showing the proportion of women graduates (ISCED 6 or PhD) by narrow field of study in natural science and engineering.
Computation method
Data needed
(FS) Total number of women graduates (ISCED-97 Level 6 or PhD) in each narrow field of study S in the earliest and latest reference year: Unit=Total;
(MS) Total number of men graduates (ISCED-97 Level 6 or PhD) in each narrow field of study S in the earliest and latest reference year: Unit=Total;
(N) Number of years in reference period (calculated by subtracting earliest reference year with available data, from latest reference year with available data): Unit=Number of years.
7 For example, in She Figures 2012, women were relatively well-represented in ‘life science’ PhDs, but this subfield falls under the broad field of ‘science, mathematics and computing’, where they are under-represented (40 % of PhD graduates in this broad field in 2010 in the EU-27).

She Figures Handbook, 2015
Page 14
Source of data
For F, M and N: Eurostat – Education Statistics (online data code: educ_grad5)
Specifications
The compound annual growth rate (CAGR) shows the average rate of growth per year for a given period. In this indicator, it shows the average percentage growth of women graduates and men graduates (either ISCED 6 or PhD) in narrow fields of natural science and engineering.
It is respectively computed as follows: = (F F⁄ ) − 1 = (M M⁄ ) − 1
where:
s refers to the start year;
e refers to the end year;
Fs denotes the number of women graduates (ISCED 6 or PhD) in a narrow field in the start year;
Fe denotes the number of women graduates (ISCED 6 or PhD) in a narrow field in the end year;
Ms denotes the number of men graduates (ISCED 6 or PhD) in a narrow field in the start year;
Me denotes the number of men graduates (ISCED 6 or PhD) in a narrow field in the end year.
For example, if there were 100 women PhD graduates from physical science in 2002 and 150 in 2006, the calculation would be: ℎ ℎ = (150 100⁄ ) − 1 = 10.67%
ISCED-97 levels and narrow fields of study in science and engineering
The International Standard Classification of Education (ISCED-97) categorises education programmes by level.
ISCED-97 Level 6 (also referred to as ISCED 6) covers:
• The second stage, which leads to the award of an advanced research qualification (e.g. PhD, non-PhD programmes with an advanced research component, etc.). The programmes are devoted to advanced study and original research (ISCED 6).
Eurostat also makes use of a ‘direct PhD’ code, which includes only those graduates pursuing PhD programmes (excluding those pursuing non-PhD programmes with an advanced research component). This indicator is calculated using either the direct PhD code or the more general ISCED Level 6.
ISCED-97: Science
• Life science
• Physical science
• Mathematics and statistics
• Computing
ISCED-97: Engineering, manufacturing and construction
• Engineering and engineering trades
• Manufacturing and processing
She Figures Handbook, 2015
Page 15
• Architecture and building
Comments/critical issues
There were some changes to the ISCED in 2011, although the She Figures publication continues to use the 1997 classifications. For further details see Annex 1, which presents recent changes to international classification standards.
In most countries, the number of graduates at ISCED 6 and PhD level is the same. When calculating this indicator, it is important to make clear which code (ISCED 6 or direct PhD) is being used.
Eurostat – Human resources in science and technology 2.2.
Content-based rationale
The European Commission has warned that ‘gender segregation, or the tendency for men and women to take different jobs, is pervasive across Europe’ (European Commission, 2014d, p. 26). Historically, women have been under-represented in scientific and technical fields. She Figures indicators based on human resources in science and technology (HRST) data explore this situation further. Many are designed to consider the extent to which available human resources in science and technology are being fully utilised, and whether differences by sex persist. These include the following: the proportion of tertiary-educated women employed as professionals or technicians, and the proportion of scientists and engineers in the total labour force, by sex.
Broad overview of the source
These data can be accessed through the Human Resources in Science and Technology (HRST) database on the Eurostat website: http://ec.europa.eu/eurostat/web/science-technology-innovation/data/database.
The Human Resources in Science and Technology database presents data on ‘stocks’ and
‘flows’. Specifically, the data cover the ‘demand for and supply of’ highly qualified personnel (HQP) in the field of science and technology (S&T) and deal with ‘stock’, i.e. the current state of the labour force in S&T, and ‘flow’, i.e. the movement of HQP from job to job and from the academic sector to the public and private sectors. Data are disseminated on a yearly basis (European Commission, 2014b), and are used by both scientists and policymakers (European Commission, 2015f). Data from Eurostat is publicly available, regularly updated and accompanied by extensive methodological notes.
Many data breakdowns are available through the HRST database: sex, age, region, sector of economic activity, occupation, educational attainment and fields of education (however, not all combinations are possible). The HRST database uses some international classifications, including:
• The International Standard Classification of Education (ISCED-97);
• The International Standard Classification of Occupations (ISCO-08);
• Statistical classification of economic activities in the European Community (NACE Rev. 2).
In She Figures, indicators based on HRST data consider women and men’s employment, including S&T occupations in general, and as scientists and engineers in particular. Additional data are required for these indicators from the Eurostat Labour Force Survey (LFS) database (http://ec.europa.eu/eurostat/web/lfs/data/database), as indicated in the following subsections.
A complete list of indicators falling into this category can be found in Annex 3 and their detailed description follows below.
2.2.1. Proportion of women in total employment
Definition of indicator
This indicator presents the proportion of women in total employment as a starting point for considering their participation in different fields and sectors of the labour market.

She Figures Handbook, 2015
Page 16
Rationale
The EU is highly committed to ensuring equality between women and men in the labour market. This is demonstrated in particular by the European Pact for Gender Equality (2011–2020), which pledges to overcome gender gaps in employment and social protection (Council of the European Union, 2011). Boosting women’s participation in employment is also fundamental to the Europe 2020 strategy for growth, which aims at a 75 % employment rate amongst all 20–64 year olds. This indicator considers the current representation of women in the labour market in general.
Computation method
Data needed
(F) Total number of women in employment (aged 25–64): Unit=Total;
(T) Total number of people in employment (aged 25–64): Unit=Total.
Source of data
Eurostat – Labour Force Survey – Employment by sex, age and nationality (1 000) (online data code: lfsa_egan)
Note that the numbers here are in thousand units.
Specifications
The formula for this indicator is as follows: = /
Persons in employment
The EU Labour Force Survey defines employed persons as ‘all persons who worked at least one hour for pay or profit during the reference week or were temporarily absent from such work’.
Comments/critical issues
• In the body of the She Figures, this indicator is presented in a figure that shows multiple indicators alongside each other. This figure is entitled ‘Proportion of women for total employment, tertiary educated and employed as professionals and technicians (HRSTC) and scientists and engineers, compound annual growth rate for women and men’.
• It is important to ensure the same age range when calculating the indicators in this figure. The age range 25–64 is available only through the detailed Labour Force Survey results, at data code lfsa_egan. There are minor differences between the detailed LFS results and the general LFS results (online data code: lfsi_emp_a).
2.2.2. Compound annual growth rate (CAGR) for people in employment, by sex
Definition of indicator
This indicator presents the average yearly growth in the number of women and men in total employment.
Rationale
As discussed above, the EU is highly committed to ensuring equality between women and men in the labour market, as demonstrated by the European Pact for Gender Equality (2011–2020) in particular (Council of the European Union, 2011). This is also shown in the Europe 2020 strategy for growth, which aims at a 75 % employment rate amongst all 20–64 year olds, including women. This indicator considers the current representation of women in the labour market in general.
She Figures Handbook, 2015
Page 17
Computation method
Data needed
(F) Total number of women in employment (aged 25–64) in a start and an end year: Unit=Total;
(M) Total number of men in employment (aged 25–64) in a start and an end year: Unit=Total;
(N) Number of years in the reference period (calculated by subtracting the defined start year from the defined end year): Unit=Number of years.
Note that the numbers here are in thousand units. This does not affect the calculation of the compound annual growth rates.
Source of data
Eurostat – Labour Force Survey – Employment by sex, age and nationality (1 000) (online data code: lfsa_egan)
Specifications
The compound annual growth rate shows the average rate of growth per year for a given period. In this case, it shows the average percentage growth of women employees and men employees in a given period. For women and men, it is respectively computed as follows: = (F F⁄ ) − 1
= (M M⁄ ) − 1 where:
s refers to the start year;
e refers to the end year;
N denotes the number of years in the reference period (in other words, e – s);
Fs denotes the number of women in employment in the start year;
Fe denotes the number of women in employment in the end year;
Ms denotes the number of men in employment in the start year;
Me denotes the number of men in employment in the end year.
For example, if there were 1 000 men in employment in 2002 and 1 500 in 2012, the calculation would be:
= (1500 1000⁄ ) − 1 = 4.14%
Employed persons
The EU Labour Force Survey (LFS) defines employed persons as ‘all persons who worked at least one hour for pay or profit during the reference week or were temporarily absent from such work’.
Comments/critical issues
In the body of the She Figures, this indicator is presented in a figure that shows multiple indicators alongside each other. This figure is entitled: ‘Proportion of women for total employment, tertiary educated and employed as professionals and technicians (HRSTC) and scientists and engineers, compound annual growth rate for women and men’.

She Figures Handbook, 2015
Page 18
It is important to ensure the same age range when calculating the indicators in this figure. The age range 25-64 is available only through the detailed Labour Force Survey results, at data code lfsa_egan. There are minor differences between the detailed LFS results and the general LFS results (online data code: lfsi_emp_a).
In the EU, the total employment rate for men remains higher than that for women. For there to be a reduction of the gender gap in employment rates, the CAGR needs to be higher for women than it is for men.
2.2.3. Tertiary educated and employed as professionals and technicians (HRSTC), as a percentage of tertiary-educated people (HRSTE), by sex
Definition of indicator
This indicator identifies the proportions of highly educated men and women who are employed as professionals or technicians, broken down by country. Specifically, it presents the proportions of women and men who are tertiary educated and working in a science and technology occupation, out of the total number of women and men who are tertiary educated. Those in science and technology occupations are those working as ‘Professionals’ or ‘Technicians and Associate Professionals’.
Rationale
Fostering greater investment in science and technology is a core part of the European vision for growth. The EU’s main funding instrument for research and innovation (R&I), the Horizon 2020 programme, recognises the economic benefits that science and technology can deliver (DG Research and Innovation, 2014), whilst the Europe 2020 strategy sees this as a priority growth area. Speaking in 2004, the European Commission’s High Level Group on Human Resources in Science and Technology warned that ‘Europe simply cannot reach the level of SET [science, engineering and technology] resources needed for its development without finding ways to remove its anachronistic science gender imbalance’ (Gago, 2004). This indicator considers the extent to which the available human resources in science and technology are being fully utilised, broken down by sex.
Computation method
Data needed
(F) Total number of tertiary-educated women, aged 25–64 (HRSTE): Unit=Total;
(Fc) Total number of tertiary-educated women, aged 25–64, who are also employed in S&T occupations (HRSTC): Unit=Total;
(M) Total number of tertiary-educated men, aged 25–64 (HRSTE): Unit=Total;
(Mc) Number of tertiary-educated men, aged 25–64, who are also employed in S&T occupations (HRSTC): Unit=Total.
Source of data
Eurostat – Human Resources in Science & Technology (online data code: hrst_st_ncat)
Note that the numbers here are in thousand units.
Specifications
The formula for this indicator is: & = / & = /
where:
c denotes tertiary-educated people who are also working in an S&T occupation.

She Figures Handbook, 2015
Page 19
Human Resources in Science and Technology (HRST)
• HRSTC: Human Resources in Science and Technology Core – People who are both HRSTE and HRSTO;
• HRSTE: Human Resources in Science & Technology Education – People who have successfully completed tertiary education in any ISCED-97 field of study;
• HRSTO: Human Resources in Science and Technology Occupations – People employed in S&T occupations as ‘Professionals’ or ‘Technicians and Associate Professionals’.
International Standard Classification of Occupations (ISCO)
Occupations are classified using the International Standard Classification of Occupations (ISCO), developed by the International Labour Organization (ILO) and adapted for the EU.
Recommendations in the Canberra Manual identify certain occupation groups as HRSTO, namely:
• ISCO Major Group 2 (Professionals) – Occupations whose main tasks require a high level of professional knowledge and experience in the fields of physical and life sciences, or social sciences and humanities.
• ISCO Major Group 3 (Technicians and Associate Professionals) – Occupations whose main tasks require technical knowledge and experience in one or more fields of physical and life sciences, or social sciences and humanities.
• Since 2011, the ISCO-08 edition has been used for Eurostat statistics on human resources in science and technology. The new version of ISCO affects the precise population covered by HRSTO, due to changes in the definition of ‘Professionals’ and ‘Technicians and Associate Professionals’. This has an impact on comparability across She Figures editions (which use the older ISCO-88 classifications up to 2011). For more information, see Annex 1.
Comments/critical issues
• Changes to ISCO affect data interpretation (see Annex 1).
• Break in time series (2011).
2.2.4. Proportion of tertiary-educated women employed as professionals or technicians (HRSTC)
Definition of indicator
This indicator presents the proportion of women within the Human Resources in Science and Technology Core group. This category covers those who have completed tertiary education (in any subject) and are employed in a science and technology (S&T) occupation (either as professionals or technicians).
Rationale
Fostering greater investment in science and technology is a core part of the European vision for growth, as shown by the Horizon 2020 programme (DG Research and Innovation, 2014) and the Europe 2020 strategy. This indicator considers the extent to which the available human resources in science and technology are being fully utilised, broken down by sex.
Computation method
Data needed
(F) Total number of tertiary-educated women aged 25–64 who are employed as professionals or technicians (Human Resources in Science and Technology – Core (HRSTC)): Unit=Total;
(T) Total number of tertiary-educated people aged 25–64 who are employed as professionals or technicians (Human Resources in Science and Technology – Core (HRSTC)): Unit=Total.

She Figures Handbook, 2015
Page 20
Source of data
Eurostat – Human Resources in Science & Technology (online data code: hrst_st_ncat)
Note that the numbers here are in thousand units.
Specifications
The formula for this indicator is: ℎ = /
Human Resources in Science and Technology (HRST)
• HRSTC: Human Resources in Science and Technology Core – People who are both HRSTE and HRSTO;
• HRSTE: Human Resources in Science & Technology Education – People who have successfully completed tertiary education in any ISCED-97 field of study;
• HRSTO: Human Resources in Science and Technology Occupations – People employed in S&T occupations as ‘Professionals’ or ‘Technicians and Associate Professionals’.
International Standard Classification of Occupations (ISCO)
Occupations are classified using the International Standard Classification of Occupations (ISCO), developed by the International Labour Organization (ILO) and adapted for the EU.
Recommendations in the Canberra Manual identify certain occupation groups as HRSTO, namely:
• ISCO Major Group 2 (Professionals) – Occupations whose main tasks require a high level of professional knowledge and experience in the fields of physical and life sciences, or social sciences and humanities.
• ISCO Major Group 3 (Technicians and Associate Professionals) – Occupations whose main tasks require technical knowledge and experience in one or more fields of physical and life sciences, or social sciences and humanities.
Since 2011, the ISCO-08 edition has been used for Eurostat statistics on human resources in science and technology. The new version of ISCO affects the precise population covered by HRSTO, due to changes in the definition of ‘Professionals’ and ‘Technicians and Associate Professionals’. This has an impact on comparability across She Figures editions (which use the older ISCO-88 classifications up to 2011). For more information, see Annex 1.
Comments/critical issues
• In the body of the She Figures, this indicator is presented in a figure that shows multiple indicators alongside each other. This figure is entitled ‘Proportion of women for total employment, tertiary educated and employed as professionals and technicians (HRSTC) and scientists and engineers, compound annual growth rate for women and men’.
• Changes to ISCO affect data interpretation (see Annex 1).
• Break in time series (2011).
2.2.5. Compound annual growth rate (CAGR) for tertiary-educated people who are employed as professionals or technicians (HRSTC), by sex
Definition of indicator
This indicator presents the average percentage growth each year in the number of women and men in the Human Resources in Science and Technology – Core (HRSTC) group. This covers those who have completed tertiary education (in any subject) and are employed in a science and technology (S&T) occupation (either as professionals or technicians).

She Figures Handbook, 2015
Page 21
Rationale
Fostering greater investment in science and technology is a core part of the European vision for growth, as shown by the Horizon 2020 programme (DG Research and Innovation, 2014) and the Europe 2020 strategy. This indicator considers whether there have been any changes to the use of available human resources in science and technology over time (broken down by sex).
Computation method
Data needed
(F) Total number of tertiary-educated women aged 25–64 who are employed as professionals or technicians (HRSTC) in a start and an end year: Unit=Total;
(M) Total number of tertiary-educated men aged 25–64 who are employed as professionals or technicians (HRSTC) in a start and an end year: Unit=Total;
(N) Number of years in the reference period (calculated by subtracting the defined start year from the defined end year): Unit=Number of years.
Source of data
Eurostat – Human Resources in Science & Technology (online data code: hrst_st_ncat)
Note that the numbers here are in thousand units. This does not affect the calculation of the compound annual growth rates.
Specifications
The CAGR shows the yearly average rate of growth for a given period. In this case, it shows the average percentage growth per year in the number of tertiary-educated women and men employed in S&T occupations. For women and men, it is respectively computed as follows: = (F F⁄ ) − 1
= (M M⁄ ) − 1 where:
s refers to the start year;
e refers to the end year;
N denotes the number of years in the reference period;
Fs denotes the number of women in the HRSTC category in the start year;
Fe denotes the number of women in the HRSTC category in the end year;
Ms denotes the number of men in the HRSTC category in the start year;
Me denotes the number of men in the HRSTC category in the end year.
For example, if there were 1 000 tertiary-educated women employed in S&T occupations in 2002, and 1 500 in 2006, the calculation would be: (1500 1000⁄ ) − 1 = 10.67%
Human Resources in Science and Technology (HRST)
• HRSTC: Human Resources in Science and Technology Core – People who are both HRSTE and HRSTO;
• HRSTE: Human Resources in Science & Technology Education – People who have successfully completed tertiary education in any ISCED-97 field of study;
• HRSTO: Human Resources in Science and Technology Occupations – People employed in S&T occupations as ‘Professionals’ or ‘Technicians and Associate Professionals’.

She Figures Handbook, 2015
Page 22
International Standard Classification of Occupations (ISCO)
Occupations are classified using the International Standard Classification of Occupations (ISCO), developed by the International Labour Organization (ILO) and adapted for the EU.
Recommendations in the Canberra Manual identify certain occupation groups as HRSTO, namely:
• ISCO Major Group 2 (Professionals) – Occupations whose main tasks require a high level of professional knowledge and experience in the fields of physical and life sciences, or social sciences and humanities.
• ISCO Major Group 3 (Technicians and Associate Professionals) – Occupations whose main tasks require technical knowledge and experience in one or more fields of physical and life sciences, or social sciences and humanities.
Since 2011, the ISCO-08 edition has been used for Eurostat statistics on human resources in science and technology. The new version of ISCO affects the precise population covered by HRSTO, due to changes in the definition of ‘Professionals’ and ‘Technicians and Associate Professionals’. This has an impact on comparability across She Figures editions (which use the older ISCO-88 classifications up to 2011). For more information, see Annex 1.
Comments/critical issues
• In the body of the She Figures, this indicator is presented in a figure that shows multiple indicators alongside each other. This figure is entitled: Proportion of women for total employment, tertiary educated and employed as professionals and technicians (HRSTC) and scientists and engineers, compound annual growth rate for women and men’.
• Changes to ISCO affect data interpretation (see Annex 1).
• Break in time series (2011).
2.2.6. Proportion of scientists and engineers (S&E) in the total labour force, by sex
Definition of indicator
This indicator presents the proportion of scientists and engineers in the labour force, by sex.
Rationale
According to a report by the European Commission, ‘[g]ender segregation, or the tendency for men and women to take different jobs, is pervasive across Europe. Only 16 % of all employees work in mixed occupations (i.e. where the proportions of men and women are between 40 % and 60 %)’ (European Commission, 2014d, p. 26). Traditionally, science and engineering is one occupation where the under-representation of women has been striking. This is of particular significance given that such professionals are ‘often the innovators at the centre of technology-led development’ (European Commission, 2015d). By comparing the proportion of women and men engineers and scientists in the entire labour force, this indicator offers one measure of the level of segregation in this area (which is sometimes seen as connected to earlier segregation in the education pathways chosen by young women and men).
Computation method
Data needed
(F) Total number of women working as scientists and engineers aged 25–64: Unit=Total;
(M) Total number of men working as scientists and engineers aged 25–64: Unit=Total; ( ) Total number of people (both men and women) in the active population, aged 25–64 (definition provided below): Unit=Total.
Source of data
For F and M: Eurostat – Human Resources in Science & Technology (online data code: hrst_st_ncat)
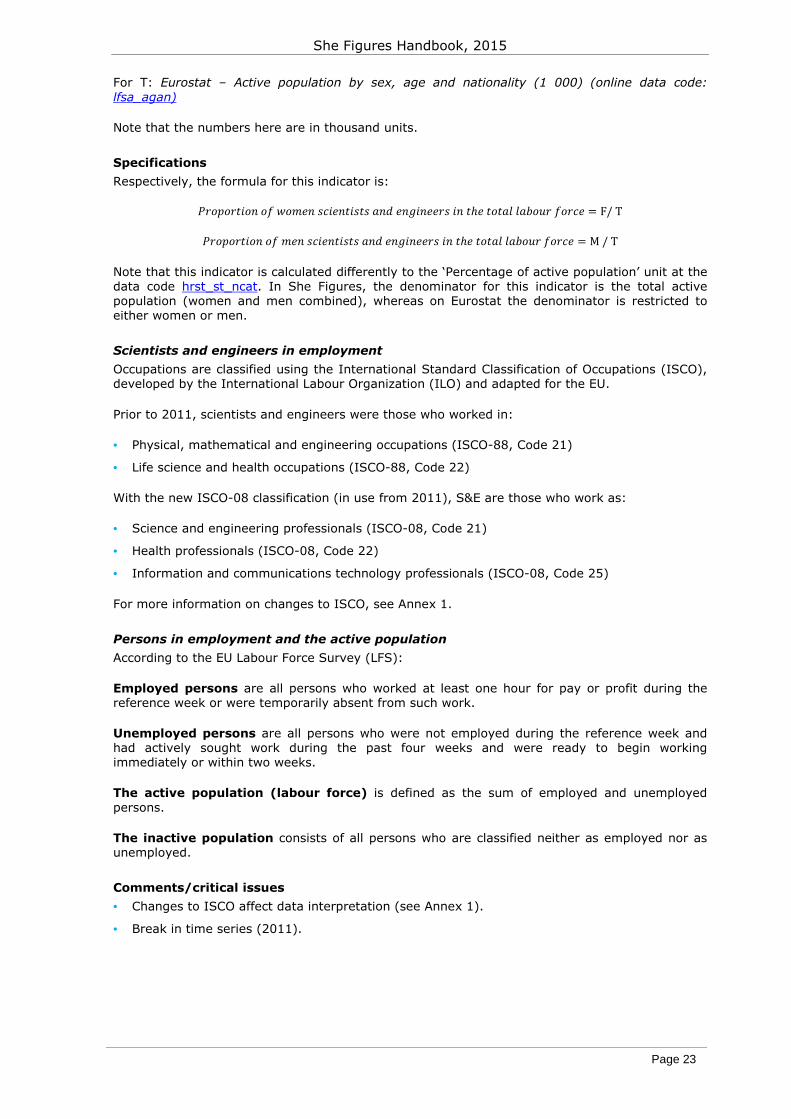
She Figures Handbook, 2015
Page 23
For T: Eurostat – Active population by sex, age and nationality (1 000) (online data code: lfsa_agan)
Note that the numbers here are in thousand units.
Specifications
Respectively, the formula for this indicator is: ℎ = F/T ℎ = M/T Note that this indicator is calculated differently to the ‘Percentage of active population’ unit at the data code hrst_st_ncat. In She Figures, the denominator for this indicator is the total active population (women and men combined), whereas on Eurostat the denominator is restricted to either women or men.
Scientists and engineers in employment
Occupations are classified using the International Standard Classification of Occupations (ISCO), developed by the International Labour Organization (ILO) and adapted for the EU.
Prior to 2011, scientists and engineers were those who worked in:
• Physical, mathematical and engineering occupations (ISCO-88, Code 21)
• Life science and health occupations (ISCO-88, Code 22)
With the new ISCO-08 classification (in use from 2011), S&E are those who work as:
• Science and engineering professionals (ISCO-08, Code 21)
• Health professionals (ISCO-08, Code 22)
• Information and communications technology professionals (ISCO-08, Code 25)
For more information on changes to ISCO, see Annex 1.
Persons in employment and the active population
According to the EU Labour Force Survey (LFS):
Employed persons are all persons who worked at least one hour for pay or profit during the reference week or were temporarily absent from such work.
Unemployed persons are all persons who were not employed during the reference week and had actively sought work during the past four weeks and were ready to begin working immediately or within two weeks.
The active population (labour force) is defined as the sum of employed and unemployed persons.
The inactive population consists of all persons who are classified neither as employed nor as unemployed.
Comments/critical issues
• Changes to ISCO affect data interpretation (see Annex 1).
• Break in time series (2011).
She Figures Handbook, 2015
Page 24
2.2.7. Proportion of women in total employed as scientists and engineers (S&E)
Definition of indicator
This indicator presents the proportion of women within the total number of scientists and engineers in employment.
Rationale
The European Commission has reported on the persistence of ‘gender segregation’ in the labour market (the concentration of women and men in particular fields and at particular levels) (European Commission, 2014d, p. 26). Traditionally, science and engineering is one occupation where the under-representation of women has been striking. This is of particular significance given that such professionals are ‘often the innovators at the centre of technology-led development’ (European Commission, 2015d). By considering the sex breakdown for employed engineers and scientists, this indicator enables one to see whether there have any advances in equalising the representation of women and men in this area.
For a full explanation of ‘gender segregation’ and other terms, see Annex 2.
Computation method
Data needed
(F) Total number of women employed as scientists and engineers, aged 25–64: Unit=Total;
(T) Total number of people employed as scientists and engineers, aged 25–64: Unit=Total.
Source of data
Eurostat – Human Resources in Science & Technology (online data code: hrst_st_ncat)
Note that the numbers here are in thousand units.
Specifications
The formula for this indicator is: = F/T Scientists and engineers in employment
Occupations are classified using the International Standard Classification of Occupations (ISCO), developed by the International Labour Organization (ILO) and adapted for the EU.
Prior to 2011, scientists and engineers were those who worked in:
• Physical, mathematical and engineering occupations (ISCO-88, Code 21)
• Life science and health occupations (ISCO-88, Code 22)
With the new ISCO-08 classification (in use from 2011), S&E are those who work as:
• Science and engineering professionals (ISCO-08, Code 21)
• Health professionals (ISCO-08, Code 22)
• Information and communications technology professionals (ISCO-08, Code 25)
For more information on changes to ISCO, see Annex 1.
Persons in employment and the active population
According to the EU Labour Force Survey (LFS), employed persons are ‘all persons who worked at least one hour for pay or profit during the reference week or were temporarily absent from such work’.
She Figures Handbook, 2015
Page 25
The total number of employed persons differs from those in the ‘active population’, which is the sum of the employed and unemployed population. Unemployed persons are ‘all persons who were not employed during the reference week and had actively sought work during the past four weeks and were ready to begin working immediately or within two weeks’.
This indicator covers employed persons rather than those in the active population.
Comments/critical issues
• In the body of the She Figures, this indicator is presented in a figure that shows multiple indicators alongside each other. This figure is entitled ‘Proportion of women for total employment, tertiary educated and employed as professionals and technicians (HRSTC) and scientists and engineers, compound annual growth rate for women and men’.
• It is important to ensure the same age range is covered when calculating each of the indicators in this figure.
• Changes to ISCO affect data interpretation (see Annex 1).
• Break in time series (2011).
2.2.8. Compound annual growth rate (CAGR) for scientists and engineers (S&E), by sex
Definition of indicator
This indicator presents the rate of growth per year for the number of people employed as scientists and engineers, broken down by sex.
Rationale
The European Commission has reported on the persistence of ‘gender segregation’ in the labour market (the concentration of women and men in particular fields and at particular levels) (European Commission, 2014d, p. 26). Traditionally, science and engineering is one occupation where the under-representation of women has been striking. This indicator enables one to see the rate at which women and men’s employment as scientists and engineers has been growing over time. To reduce the gender imbalance, it is likely that women’s representation will need to be growing at a faster rate than that for men.
For a full explanation of ‘gender segregation’ and other terms, see Annex 2.
Computation method
Data needed
(F) Total number of women, aged 25–64, employed as scientists and engineers in the start and end year: Unit=Total;
(M) Total number of men, aged 25–64, employed as scientists and engineers in the start and end year: Unit=Total;
(N) Number of years in the reference period (calculated by subtracting the earliest year with available data from the latest year with available data): Unit=Number of years.
Source of data
Eurostat – Human Resources in Science & Technology (online data code: hrst_st_ncat)
Data are in thousand units, but this does not affect the calculation of the CAGR.
Specifications
The CAGR shows the yearly average rate of growth for a given period. In this case, it shows the average percentage growth of women and men employed as scientists and engineers. For women and men, it is respectively computed as follows: = (F F⁄ ) − 1

She Figures Handbook, 2015
Page 26
= (M M⁄ ) − 1 where:
s refers to the start year;
e refers to the end year;
N denotes the number of years in the reference period;
Fs denotes the number of women S&E in the start year;
Fe denotes the number of women S&E in the end year;
Ms denotes the number of men S&E in the start year;
Me denotes the number of men S&E in the end year.
For example, if there were 100 women S&E in 2002, and 150 in 2006, the calculation would be: & = (150 100⁄ ) − 1 = 10.67%
Scientists and engineers in employment
Occupations are classified using the International Standard Classification of Occupations (ISCO), developed by the International Labour Organization (ILO) and adapted for the EU.
Prior to 2011, scientists and engineers were those who worked in:
• Physical, mathematical and engineering occupations (ISCO-88, Code 21)
• Life science and health occupations (ISCO-88, Code 22)
With the new ISCO-08 classification (in use from 2011), S&E are those who work as:
• Science and engineering professionals (ISCO-08, Code 21)
• Health professionals (ISCO-08, Code 22)
• Information and communications technology professionals (ISCO-08, Code 25)
For more information on changes to ISCO, see Annex 1.
Persons in employment and the active population
According to the EU Labour Force Survey (LFS), employed persons are ‘all persons who worked at least one hour for pay or profit during the reference week or were temporarily absent from such work’.
The total number of employed persons differs from those in the ‘active population’, which is the sum of the employed and unemployed population. Unemployed persons are ‘all persons who were not employed during the reference week and had actively sought work during the past four weeks and were ready to begin working immediately or within two weeks’.
This indicator covers employed persons, rather than those in the active population.
Comments/critical issues
• Changes to ISCO affects data interpretation (see Annex 1).
• Break in time series (2011).
• In the body of the She Figures, this indicator is presented in a figure that shows multiple indicators alongside each other. This figure is entitled ‘Proportion of women for total employment, tertiary educated and employed as professionals and technicians (HRSTC) and scientists and engineers, compound annual growth rate for women and men’.

She Figures Handbook, 2015
Page 27
• In the EU, men are more likely to be employed as scientists and engineers than women. For a reduction of the gender gap in employment rates, the CAGR needs to be higher for women than it is for men.
Eurostat – High-tech industry and knowledge-intensive services 2.3.
Content-based rationale
These indicators were selected in line with Europe’s 2020 vision of ‘smart growth’ to determine the extent to which women’s full educational capacities are being exploited and as a way to gauge the EU’s use of available human capital and women’s role within a priority area of the economy. The indicators for high-tech industry and knowledge-intensive services include employment in knowledge-intensive activities (KIA), and employment in knowledge-intensive activities – business industries (KIABI).
Broad overview of the source
These data can be accessed from the Science, Technology and Innovation Statistics database on Eurostat’s website (http://ec.europa.eu/eurostat/web/science-technology-innovation/overview).
‘Statistics on high-tech industry and knowledge-intensive services’ (sometimes referred to simply as ‘high-tech statistics’) cover statistics concerning employment, economic indicators, patents and products in the high-tech categories of the manufacturing sector, as well as the knowledge-intensive service sector (European Commission, 2015c). Data from Eurostat is publicly available, regularly updated and accompanied by extensive methodological notes.
A complete list of indicators falling into this category can be found in Annex 3 and their detailed description follows below.
2.3.1. Employment in knowledge-intensive activities (KIA), by sex (%)
Definition of indicator
This indicator presents the relative presence of employed women and men in KIA,8 covering all sectors of the economy.
Rationale
The Europe 2020 vision of ‘smart growth’ aims to foster an economy based on knowledge and innovation, with a target of 3 % of the EU’s GDP to be invested in research and development (R&D) (European Commission, 2010b). This indicator reveals the extent to which women’s full educational capacities are being utilised, by measuring the relative proportion of women and men in KIA.
Computation method
Data needed
(F) Total number of women employed in all sectors of the economy: Unit=Total;
(Fk) Total number of women employed in knowledge-intensive activities specifically: Unit=Total;
(M) Total number of men employed in all sectors of the economy: Unit=Total;
(Mk) Total number of men employed in knowledge-intensive activities specifically: Unit=Total;
(T) Total number of people employed in all sectors of the economy: Unit=Total;
8 Activities where more than one third of the workforce is tertiary educated.

She Figures Handbook, 2015
Page 28
(Tk) Total number of people employed in knowledge-intensive activities specifically: Unit=Total.
Source of data
For Tk, Fk and Mk: Eurostat – High-tech industry and knowledge-intensive services (online data code: htec_kia_emp2)
Note that this data code (htec_kia_emp2) does not provide the following data: T, F or M. However, it already provides the KIA employment rates in this indicator (which use the formulas below).
Specifications
Respectively, the formulas for this indicator are: = F / = M / = T /
where:
k denotes knowledge-intensive-activities specifically.
Tertiary-educated people
The International Standard Classification of Education (ISCED-97) categorises education programmes by level. Tertiary-educated people are those who have graduated from one or both of these stages:
• The first stage, which includes largely theory-based programmes to provide sufficient qualifications to gain entry to advanced research programmes and professions with high skills requirements (ISCED 5A) and programmes which are practically, technically or occupationally specific (ISCED 5B).
• The second stage, which leads to the award of an advanced research qualification (e.g. PhD, non-PhD programmes with an advanced research component, etc.). The programmes are devoted to advanced study and original research (ISCED 6).
Knowledge-intensive activities
An activity is classified as ‘knowledge-intensive’ if tertiary-educated people employed in this activity represent more than 33% of the total employment in the activity. The definition is based on the average number of employed persons aged 25–64 at aggregated EU-28 level.
The activities come from the NACE Rev. 2 categories (2-digit level), based on EU Labour Force Survey (LFS) data. NACE refers to the European Community’s statistical classification of economic activities.
In this indicator, there is one aggregate in use based on the following classification: total knowledge-intensive activities (KIA). The lists of activities included in each aggregate, according to NACE Rev. 2 (2-digit level), are presented in the tables below:

She Figures Handbook, 2015
Page 29
Table 1 Total knowledge-intensive activities (KIA), NACE Rev. 2
Codes Description
09 Mining support service activities
19 Manufacture of coke and refined petroleum products
21 Manufacture of basic pharmaceutical products and pharmaceutical preparations
26 Manufacture of computer, electronic and optical products
51 Air transport
58 Publishing activities
59 Motion picture, video and television programme production, sound recording
60 Programming and broadcasting activities
61 Telecommunications
62 Computer programming, consultancy and related activities
63 Information service activities
64 Financial service activities, except insurance and pension funding
65 Insurance, reinsurance and pension funding, except compulsory social security
66 Activities auxiliary to financial services and insurance activities
69 Legal and accounting activities
70 Activities of head offices; management consultancy activities
71 Architectural and engineering activities; technical testing and analysis
72 Scientific research and development
73 Advertising and market research
74 Other professional, scientific and technical activities
75 Veterinary activities
78 Employment activities
79 Travel agency, tour operator reservation service and related activities
84 Public administration and defence; compulsory social security
85 Education
86 Human health activities
90 Creative, arts and entertainment activities
91 Libraries, archives, museums and other cultural activities
She Figures Handbook, 2015
Page 30
Codes Description
94 Activities of membership organisations
99 Activities of extraterritorial organisations and bodies
Comments/critical issues
• Women may be over-represented in some knowledge-intensive activities that are not related to science and research. This indicator does not enable one to analyse differences in representation across the activities.
• Due to the revision of the NACE from NACE Rev. 1.1 to NACE Rev. 2, the definition of high-technology industries and knowledge-intensive services changed in 2008.
2.3.2. Employment in knowledge-intensive activities – Business industries (KIABI), by sex (%)
Definition of indicator
Similar to the previous indicator, this indicator shows the relative proportion of employed women and men in knowledge-intensive activities (KIA) (activities where more than one third of the workforce is tertiary educated), although it is restricted to business industries only.
Rationale
KIA are key to the EU’s vision of fostering a knowledge-based economy. The term itself encompasses a wide range of activities, although this indicator restricts the focus to business industries (KIABI). This is a particularly important sector of the economy to examine, given that the EU considers ‘innovation through business activities’ to represent a strength of national research and innovation systems.9 Assessing the relative proportion of women and men’s employment in KIABI is thus a key way of gauging the EU’s use of available human capital, as well as the foundation for considering women’s role within a priority area of the economy.
Computation method
Data needed
(F) Total number of women employed in all sectors of the economy: Unit=Total;
(F ) Total number of women employed specifically in knowledge-intensive activities – business industries (KIABI): Unit=Total;
(M) Total number of men employed in all sectors of the economy: Unit=Total;
(M ) Total number of men employed specifically in knowledge-intensive activities – business industries (KIABI): Unit=Total;
(T) Total number of people employed in all sectors of the economy: Unit=Total;
(T ) Total number of people employed in specifically in knowledge-intensive activities – business industries (KIABI): Unit=Total.
Source of data
For Tb, Fb and Mb: Eurostat – High-tech industry and knowledge-intensive services (online data code: htec_kia_emp2)
9 This is evident in, for example, European Commission (2014), Innovation Union Scoreboard 2014: The Innovation Union’s Performance Scoreboard for Research and Innovation [Executive Summary].

She Figures Handbook, 2015
Page 31
Please note that this data code (htec_kia_emp2) does not provide the following data: T, F or M. However, it does provide the KIABI employment rates in this indicator (which use the formulas below).
Specifications
Respectively, the formulas for this indicator are: = F /F = M / = T /
Tertiary-educated people
The International Standard Classification of Education (ISCED-97) categorises education programmes by level. Tertiary-educated people are those who have graduated from one or both of these stages:
• The first stage, which includes largely theory-based programmes to provide sufficient qualifications to gain entry to advanced research programmes and professions with high skills requirements (ISCED 5A) and programmes which are practically, technically or occupationally specific (ISCED 5B).
• The second stage, which leads to the award of an advanced research qualification (e.g. PhD, non-PhD programmes with an advanced research component, etc.). The programmes are devoted to advanced study and original research (ISCED 6).
Knowledge-intensive activities – Business industries
An activity is classified as ‘knowledge-intensive’ if tertiary-educated people employed in this activity represent more than 33% of the total employment in the activity. The definition is based on the average number of employed persons aged 25–64 at aggregated EU-28 level.
The activities come from the NACE Rev. 2 categories (2-digit level), based on EU Labour Force Survey (LFS) data. NACE refers to the European Community’s statistical classification of economic activities. In this indicator, there is one aggregate in use based on the following classification: Knowledge-intensive activities – Business industries (KIABI). The list of activities included in this aggregate, according to NACE Rev. 2 (2-digit level), is given below:
Table 2 Knowledge-intensive activities – Business industries (KIABI), NACE Rev. 2
Codes Description
09 Mining support service activities
19 Manufacture of coke and refined petroleum products
21 Manufacture of basic pharmaceutical products and pharmaceutical preparations
26 Manufacture of computer, electronic and optical products
51 Air transport
58 Publishing activities
59 Motion picture, video and television programme production, sound recording
60 Programming and broadcasting activities

She Figures Handbook, 2015
Page 32
61 Telecommunications
62 Computer programming, consultancy and related activities
63 Information service activities
64 Financial service activities, except insurance and pension funding
65 Insurance, reinsurance and pension funding, except compulsory social security
66 Activities auxiliary to financial services and insurance activities
69 Legal and accounting activities
70 Activities of head offices; management consultancy activities
71 Architectural and engineering activities; technical testing and analysis
72 Scientific research and development
73 Advertising and market research
74 Other professional, scientific and technical activities
75 Veterinary activities
78 Employment activities
79 Travel agency, tour operator reservation service and related activities
90 Creative, arts and entertainment activities
Comments/critical issues
Due to the revision of NACE from NACE Rev. 1.1 to NACE Rev. 2, the definition of high-technology industries and knowledge-intensive services changed in 2008.
Eurostat – Research and development statistics 2.4.
Content-based rationale
Research and development (R&D) is central to the EU’s vision for growth, as demonstrated by the Horizon 2020 programme and the Europe 2020 strategy. Although, on average, a higher proportion of women in the EU are completing degrees than ever before, there are signs that they continue to lag behind men when it comes to their representation amongst the researcher population. This situation persists across all sectors, particularly in the business enterprise sector (BES). She Figures indicators based on R&D statistics explore women’s presence as researchers, broken down by sector, as well as by field of science and age group.
In addition, some indicators consider R&D expenditure, in order to provide an insight into whether there are any correlations between spending levels and other factors.
Broad overview of the source
These data can be accessed through the Research and Development (R&D) database on the Eurostat website, through the ‘science and technology’ tab here: http://ec.europa.eu/eurostat/data/database
Eurostat’s Statistics on Research and Development provide data on R&D spending and R&D personnel working in the main sectors of the economy: the business enterprise (BES),

She Figures Handbook, 2015
Page 33
government (GOV), higher education (HES), and the private non-profit (PNP) sectors. R&D personnel data can be viewed in full-time equivalent (FTE), in head count (HC), as a percentage of employment and as a percentage of the labour force. Amongst other things, the data are disaggregated by occupation, qualification, gender, citizenship, age group, fields of science and economic activity (NACE Rev. 2).
Data from Eurostat is publicly available, regularly updated and accompanied by extensive methodological notes. The data are collected through samples, census surveys or administrative registers – or through a combination of sources.
A complete list of indicators falling into this category can be found in Annex 3 and their detailed description follows below.
2.4.1. Proportion of women researchers
Definition of indicator
This indicator presents the proportion of women researchers, broken down by country, out of the researcher population in all sectors of the economy.
Rationale
In recent decades, women in the EU have made significant advances in raising their level of educational qualification, now making up a majority of all tertiary education graduates. Despite this, the EU’s researcher population has continued to be dominated by men. According to the European Commission’s Expert Group on Structural Change, boosting the proportion of women in the research and innovation (R&I) workforce could have many benefits, including greater use of available talent, economic growth and an increase in the relevance and quality of R&I outputs for all members of society (DG Research and Innovation, 2012d, p. 13). This indicator aims to shed light on whether there have been any improvements in the gender balance amongst this group.
Computation method
Data needed
(F) Number of women researchers in all sectors of the economy: Unit=Head count;
(T) Number of researchers in all sectors of the economy: Unit=Head count.
Source of data
EUROBASE – the Eurostat dissemination database; Eurostat – Statistics on research and development (online data code: rd_p_femres)
Specifications ℎ = T⁄
Note that the following data code (rd_p_femres) has already performed the calculation. The underlying data are available through Eurostat – Statistics on research and development (online data code: rd_p_persocc).
Units (head count & full-time equivalent)
The units of measurement of personnel employed on R&D as proposed by the Frascati Manual are:
HC (§329): Head count. The number of persons engaged in R&D at a given date or the average number of persons engaged in R&D during the (calendar) year or the total number of persons engaged in R&D during the (calendar) year.
FTE (§333): Full-time equivalent. One FTE corresponds to one year’s work by one person on R&D.
This indicator is calculated using head count.

She Figures Handbook, 2015
Page 34
Researchers
The OECD’s Proposed Standard Practice for Surveys on Research and Experimental Development (Frascati Manual, 2002) provides an international definition for researchers:
‘Researchers are professionals engaged in the conception or creation of new knowledge, products, processes, methods and systems and also in the management of the projects concerned.’ (§301, Frascati Manual, OECD, 2002).
Comments/critical issues
None identified.
2.4.2. Compound annual growth rate (CAGR) for researchers, by sex
Definition of indicator
This indicator compares the average annual percentage change in the proportion of women and men in the researcher population over a particular period.
Rationale
This indicator aims to capture the relative increases in women’s and men’s participation in the researcher population, against a backdrop of historic under-representation of women in this field. As a priority, the European Commission encourages EU Member States to overcome barriers to the recruitment, retention and career progression of women researchers (European Commission, 2012a). The EU has pledged to redress this imbalance, given the potential benefits to the quality of research and available stocks of qualified researchers, stating in a Communication: ‘Increased women participation will improve the quality of research and innovation while helping to address the existing deficit of highly qualified and experienced scientists necessary for enhanced European competitiveness and economic growth’ (European Commission, 2011a).
Computation method
Data needed
(F) Total number of women researchers in the earliest and latest reference year: Unit=Head count;
(M) Total number of men researchers in the earliest and latest reference year: Unit=Head count;
(N) Number of years in reference period (calculated by subtracting the defined starting reference year (or the next earliest year with available data) from latest reference year with available data): Unit=Number of years.
Source of data
Eurostat – Statistics on research and development (online data code: rd_p_persocc)
Specifications
The CAGR shows the average rate of growth per year for a given period. In this case, it shows the average percentage growth of women researchers and men researchers each year in a given period. It is calculated in the following way: ℎ = (F F⁄ ) − 1
ℎ = (M M⁄ ) − 1 where:
s refers to the start year;
e refers to the end year;
She Figures Handbook, 2015
Page 35
Fs denotes the number of women researchers in the start year;
Fe denotes the number of women researchers in the end year;
Ms denotes the number of men researchers in the start year;
Me denotes the number of men researchers in the end year.
For example, if there were 200 women researchers in 2002 and 150 in 2006, the calculation would be: ℎ = (150 200⁄ ) − 1 = −6.93%
Researchers and R&D personnel
The Frascati Manual (2002) provides international definitions for these terms:
• R&D personnel, §294: ‘All persons employed directly on R&D should be counted, as well as those providing direct services such as R&D managers, administrators, and clerical staff.’
• Researchers, §301: ‘Professionals engaged in the conception or creation of new knowledge, products, processes, methods and systems and also in the management of the projects concerned.’
This indicator uses the ‘Researcher’ classification only.
Head count
The head count unit of measurement for R&D personnel comes from the Frascati Manual (OECD, 2002):
HC (§329): Head count: The number of persons engaged in R&D at a given date or the average number of persons engaged in R&D during the (calendar) year or the total number of persons engaged in R&D during the (calendar) year.
Comments/critical issues
• Ensure the same reference period when calculating the CAGR for women and men respectively.
• In the EU, men are more likely to be employed as researchers than women. For a reduction of the gender gap in employment rates, the CAGR needs to be higher for women than it is for men.
2.4.3. Researchers per thousand labour force by sex
Definition of indicator
This indicator presents the number of researchers for every thousand people in the labour force in a given country, broken down by sex.
Rationale
This indicator is another measure of the level of gender balance amongst the researcher population, given the historic tendency for this field to be dominated by men. Fostering equality in the representation of women and men amongst researchers demonstrates the EU’s wider desire to ‘reduce gender segregation at all levels in education and employment, as it contributes to inequalities in terms of the economic independence of women and men’ (Council of the European Union, 2014). Considering the composition of the researcher population is of particular importance at a time when the EU has stated the need to create a further one million research jobs by 2020 (European Commission, 2011b, p. 5).10
10 Note that the ‘one million research jobs’ target was originally identified in European Commission, Europe 2020 Flagship Initiative: Innovation Union, COM(2010)546 final.

She Figures Handbook, 2015
Page 36
Computation method
Data needed
(F) Number of women researchers: Unit=Head count;
(M) Number of men researcher: Unit=Head count;
(Fi) Number of women in the active population (definition below), aged 15 and over: Unit=Total;
(Mi) Number of men in the active population (definition below), aged 15 and over: Unit=Total.
Source of data
For F and M: Eurostat – Statistics on research and development (online data code: rd_p_persocc)
For Fi and Mi:Eurostat – Labour Force Survey (online data code: lfsa_agan)
Note that the numbers from the Labour Force Survey are in thousand units.
Specifications
The formula for this indicator is: ℎ ℎ = F/F ℎ ℎ = M/M
Researchers
The Frascati Manual (2002) provides an international definition for researchers: ‘Professionals engaged in the conception or creation of new knowledge, products, processes, methods and systems and also in the management of the projects concerned’ (§301).
Head count
The head count unit of measurement for R&D personnel comes from the Frascati Manual (OECD, 2002):
HC (§329): Head count. The number of persons engaged in R&D at a given date or the average number of persons engaged in R&D during the (calendar) year or the total number of persons engaged in R&D during the (calendar) year.
The EU Labour Force Survey (LFS) provides further definitions:
• Employed persons are all persons who worked at least one hour for pay or profit during the reference week or were temporarily absent from such work.
• Unemployed persons are all persons who were not employed during the reference week and had actively sought work during the past four weeks and were ready to begin working immediately or within two weeks.
• The active population (labour force) is defined as the sum of employed and unemployed persons.
• The inactive population consists of all persons who are classified neither as employed nor as unemployed.
Comments/critical issues
Note that F and M are in head count, whereas Fi and Mi are in thousand units (EGGE, 2009). It is for this reason that the indicator states ‘per thousand labour force’.

She Figures Handbook, 2015
Page 37
2.4.4. Proportion of women researchers by sector
Definition of indicator
This indicator presents the proportion of women researchers in three broad economic sectors: the higher education sector (HES), the government sector (GOV), the business enterprise sector (BES) and the private non-profit sector (PNP).
Rationale
The European Commission’s Expert Group on Gender and Employment has warned of the damage that may be caused through the concentration of men and women in different occupations and sectors. These include labour and skills shortages, the gender pay gap, the undervaluation of women’s skills, and discrimination (European Commission’s Expert Group on Gender and Employment, 2009). For these reasons – and others – the EU is strongly committed to tackling this form of segregation, as demonstrated by the Europe 2020 strategy and the European Pact for Gender Equality (2011–2020). This indicator enables greater analysis of the extent of such ‘gender segregation’, by considering the situation for researchers within different sectors.
Computation method
Data needed
(F) Total number of women researchers, aged 25–64, in the higher education sector, the government sector and in the business enterprise sector: Unit=Head count;
(T) Total number of researchers, aged 25–64, in the higher education sector, the government sector and in the business enterprise sector: Unit=Head count.
Source of data
Eurostat – Statistics on research and development (online data code: rd_p_persocc)
Specifications
The formula for this indicator is: ℎ = F /T
where:
i denotes one particular sector (either HES, GOV or BES).
Researchers
The Frascati Manual (OECD, 2002) defines researchers as ‘Professionals engaged in the conception or creation of new knowledge, products, processes, methods and systems and also in the management of the projects concerned’ (§301, Frascati Manual 2002).
Sectors of the economy
The Frascati Manual also identifies and defines five sectors of the economy (§159): the higher education sector (HES), the government sector (GOV), the business enterprise sector (BES), the private non-profit sector (PNP) and the abroad sector. The abroad sector is not included in the Eurobase data and as such is not used. The definitions for the first three of these (included in this indicator) are:
HES (§206): the higher education sector includes all universities, colleges of technology and other institutes of post-secondary education, whatever their source of finance or legal status. It also includes all research institutes, experimental stations and clinics operating under the direct control of, administered by or associated with higher education institutions.
GOV (§184): the government sector includes all departments, offices and other bodies, which offer but normally do not sell to the community those common services, other than higher education, which cannot otherwise be conveniently and economically provided and administer the

She Figures Handbook, 2015
Page 38
state and the economic and social policy of the community (public enterprises are included in the business enterprise sector) as well as non-profit institutes (NPIs) controlled and mainly financed by government.
BES (§163): the business enterprise sector includes all firms, organisations and institutions whose primary activity is the market production of goods or services (other than higher education) for sale to the general public at an economically significant price. It includes the private non-profit institutes mainly serving them.
Head count
The head count unit of measurement for R&D personnel comes from the Frascati Manual (OECD, 2002):
HC (§329): Head count. The number of persons engaged in R&D at a given date or the average number of persons engaged in R&D during the (calendar) year or the total number of persons engaged in R&D during the (calendar) year.
Comments/critical issues
None identified.
2.4.5. Distribution of researchers across sectors, by sex
Definition of indicator
This indicator presents the distribution of men and women researchers across four broad sectors of activity: the higher education sector (HES), the government sector (GOV), the business enterprise sector (BES) and the private non-profit sector (PNP).
Rationale
This indicator enables one to compare the sectors in which men and women researchers work. There are many reasons why this may be of interest, partly arising from the economic changes currently affecting much of the EU. For example, the European Commission has predicted that most research jobs needed in the EU will fall in the private sector (i.e. the business enterprise sector) (European Commission, 2011b, p. 5).11 Relatedly, in the context of the economic crisis, ‘pressures on jobs and pay are very much concentrated on the public [GOV] sector, where many women are employed’.12
Computation method
Data needed
(F) The number of women researchers, aged 25–64, in each of the four economic sectors: the higher education sector (HES), the government sector (GOV), the business enterprise sector (BES) and the private non-profit sector (PNP): Unit=Head count;
(M) The number of men researchers, aged 25–64, in each of the four economic sectors: the higher education sector (HES), the government sector (GOV), the business enterprise sector (BES) and the private non-profit sector (PNP): Unit=Head count.
Source of data
Eurostat – Statistics on research and development (online data code: rd_p_persocc)
11 Ibid.
12 According to the fifth European Working Conditions Survey (EWCS), conducted in 2010, women are more likely to work in the public sector than men. These survey results – and quoted text – are from Eurofound (2013).
She Figures Handbook, 2015
Page 39
Specifications
This indicator shows how researchers are spread out across different sectors, broken down by sex.
To compute this indicator, perform these two calculations for each sector: ℎ , = F /F ℎ , = M /M
where:
i denotes a particular sector (HES, GOV, BES or PNP);
a denotes all sectors; denotes the number of women researchers in a particular sector; denotes the number of men researchers in a particular sector; denotes the number of women researchers in all sectors; denotes the number of men researchers in all sectors.
For each sex, the proportions for the sectors are shown alongside one another (with a sum total of 100%).
For example, suppose there are 1 000 women researchers. Of these, 350 are in the HES, 224 are in the GOV sector, 326 are in the BES, and 100 are in the PNP. The proportion of women researchers in each sector would be as follows: :350/1000 = 35%; :224/1000 = 22.4%; :326/1000 = 32.6%; :100/1000 = 10%. ( 100%) Sectors of the economy
The Frascati Manual (OECD, 2002) identifies and defines five sectors of the economy: HES, GOV, BES, PNP and abroad (§159). The abroad sector is not included in the Eurobase data and as such is not used.
HES (§206): the higher education sector includes all universities, colleges of technology and other institutes of post-secondary education, whatever their source of finance or legal status. It also includes all research institutes, experimental stations and clinics operating under the direct control of, administered by or associated with higher education institutions.
GOV (§184): the government sector includes all departments, offices and other bodies, which offer but normally do not sell to the community those common services, other than higher education, which cannot otherwise be conveniently and economically provided and administer the state and the economic and social policy of the community (public enterprises are included in the business enterprise sector) as well as non-profit institutes (NPIs) controlled and mainly financed by government.
BES (§163): the business enterprise sector includes all firms, organisations and institutions whose primary activity is the market production of goods or services (other than higher education) for sale to the general public at an economically significant price. It includes the private non-profit institutes mainly serving them.

She Figures Handbook, 2015
Page 40
PNP (§194): the private non-profit sector covers non-market, private non-profit institutions serving households (i.e. the general public) but also private individuals or households.
Head count
The head count unit of measurement for R&D personnel comes from the Frascati Manual (OECD, 2002):
HC (§329): Head count. The number of persons engaged in R&D at a given date or the average number of persons engaged in R&D during the (calendar) year or the total number of persons engaged in R&D during the (calendar) year.
Comments/critical issues
None identified.
2.4.6. Distribution of researchers in the higher education sector (HES) across fields of science, by sex
Definition of indicator
This indicator focuses on the higher education sector (HES) and presents the distribution of women and men researchers across the six major fields of science and technology: natural sciences; engineering and technology; medical sciences; agricultural sciences; social sciences; humanities.
Rationale
Consistent with the indicators on PhD graduations, this indicator sheds light on the extent of gender segregation across different fields of research in the higher education sector (HES). It is particularly important to consider this sector, given that it is the main source of employment for researchers in the EU.13 The results can be compared with the similar indicators on researchers in the HES in the She Figures.
In particular, this indicator can be used to gauge women’s representation in fields of study traditionally dominated by men, such as technical sciences and engineering. The imbalance in such fields has been a long-term concern for the EU. For example, in 2008, the European Parliament warned of persistent ‘gender stereotypes, in particular in areas of research such as the natural sciences’.14 As early as 1999, the Council of the EU argued that the ‘under-representation of women in the field of scientific and technical research is a common concern for Member States’.15
Computation method
Data needed
(F) Number of women researchers in the Higher Education Sector (HES), broken down by each field of science: Unit=Head count;
(M) Number of men researchers in the Higher Education Sector (HES), broken down by each field of science: Unit=Head count.
Source of data
Eurostat – Research and development statistics (online data code: rd_p_perssci)
13 According to latest available data (2011). See Eurostat, total R&D personnel and researchers by sectors of performance, sex and fields of science [rd_p_perssci].
14 European Parliament Resolution of 21 May 2008 on women and science (2007/2206(INI)).
15 Council Resolution of 20 May 1999 on women and science (1999/C 201/01).

She Figures Handbook, 2015
Page 41
Specifications
This indicator shows how researchers are spread out across different fields of science, broken down by sex.
To compute this indicator, perform these two calculations for each field of science in turn: ℎ , = F /F ℎ , = M /M
where:
i denotes a particular field of science;
a denotes all fields of science;
denotes the number of women researchers in the HES, in all fields of science;
denotes the number of men researchers in the HES, in all fields of science;
denotes the number of women researchers in the HES, in a given field of science;
denotes the number of men researchers in the HES, in a given field of science.
For each sex, the proportions for the fields of science are shown alongside one another (with a sum total of 100 %).
For example, suppose there are 1 000 women researchers in the HES. Of these, 150 are in natural sciences, 170 in engineering and technology, 200 in medical sciences, 82 in agricultural sciences, 250 in social sciences, and 148 in humanities. The proportion of women researchers in the HES in each field of science would be as follows: :150/1000 = 15%; ℎ :170/1000 = 17%; :200/1000 = 20%; :82/1000 = 8.2%; :250/1000 = 25%; :148/1000 = 14.8%. ( 100%) Main fields of science
The Frascati Manual (OECD, 2002) provides definitions for the six main fields of science (p. 67) that are included in this indicator:
• (NS) Natural sciences
• (ET) Engineering and technology
• (MS) Medical sciences
• (AS) Agricultural sciences
• (SS) Social sciences
• (H) Humanities
Head count
The head count unit of measurement for R&D personnel comes from the Frascati Manual (OECD, 2002):
She Figures Handbook, 2015
Page 42
HC (§329): Head count. The number of persons engaged in R&D at a given date or the average number of persons engaged in R&D during the (calendar) year or the total number of persons engaged in R&D during the (calendar) year.
Comments/critical issues
The breakdown of researchers by field of science is performed according to the field in which they work and not according to the field of their qualification.
2.4.7. Compound annual growth rates (CAGR) of women researchers in the higher education sector (HES), by field of science
Definition of indicator
This indicator presents the compound annual growth rate of women researchers in the Higher education sector (HES) in six major fields of science and technology: natural sciences; engineering and technology; medical sciences; agricultural sciences; social sciences; humanities.
Rationale
Consistent with the indicators on PhD graduations, this indicator sheds light on the extent of gender segregation across different fields of research in the higher education sector (HES). It is particularly important to consider this sector, given that it is the main source of employment for researchers in the EU.16 The results can be compared with the similar indicators on researchers in the HES in the She Figures.
In particular, this indicator can be used to gauge women’s representation in fields of study traditionally dominated by men, such as technical sciences and engineering. The imbalance in such fields has been a long-term concern for the EU. For example, in 2008, the European Parliament warned of persistent ‘gender stereotypes, in particular in areas of research such as the natural sciences’.17 As early as 1999, the Council of the EU argued that the ‘under-representation of women in the field of scientific and technical research is a common concern for Member States’.18
Computation method
Data needed
(F) Total number of women researchers in each of the fields of science in the higher education sector, in the earliest and the latest reference year: Unit=Head count;
(N) Number of years in reference period (calculated by subtracting the defined starting reference year (or the next earliest year with available data) from latest reference year with available data): Unit=Number of years.
Source of data
Eurostat – Research and development statistics (online data code: rd_p_perssci)
Specifications
The CAGR shows the average rate of growth per year, for a given period. In this case, it shows the average percentage growth of women researchers in each main field of science in the higher education sector (HES) in a given period.
For each field of science respectively, perform this calculation:
16 According to latest available data (2011). See Eurostat, total R&D personnel and researchers by sectors of performance, sex and fields of science [rd_p_perssci].
17 European Parliament Resolution of 21 May 2008 on women and science (2007/2206(INI)).
18 Council Resolution of 20 May 1999 on women and science (1999/C 201/01).
She Figures Handbook, 2015
Page 43
cℎ ℎ = (F F⁄ ) − 1 where:
s refers to the start year;
e refers to the end year;
denotes the number of women researchers in the chosen field of science (HES); the number of women researchers in the chosen field of science (HES) in the start year; the number of women researchers in the chosen field of science (HES) in the end year.
Main fields of science
The Frascati Manual (OECD, 2002) provides definitions for the six main fields of science (p. 67), which are included in this indicator:
• (NS) Natural sciences
• (ET) Engineering and technology
• (MS) Medical sciences
• (AS) Agricultural sciences
• (SS) Social sciences
• (H) Humanities
The breakdown of researchers by field of science is performed according to the field in which they work and not according to the field of their qualification.
Head count
The head count unit of measurement for R&D personnel comes from the Frascati Manual (OECD, 2002):
HC (§329): Head count. The number of persons engaged in R&D at a given date or the average number of persons engaged in R&D during the (calendar) year or the total number of persons engaged in R&D during the (calendar) year.
Comments/critical issues
In fields of science where one sex is under-represented, a higher CAGR for that sex may signal a reduction in the gender imbalance in that field.
2.4.8. Proportion of women researchers in the main fields of science, in different sectors of the economy (HES, GOV and BES)
Definition of indicator
This indicator presents the proportion of women researchers in each of the six fields of science: natural sciences; engineering and technology; medical sciences; agricultural sciences; social sciences; and humanities. It does so for the higher education sector (HES), the government sector (GOV) and the business enterprise sector (BES) in turn.
Rationale
The EU’s commitment to tackling ‘gender segregation at all levels in education and employment’ encompasses the research fields in which women and men work (Council of the European Union, 2014). This indicator sheds light on the extent of gender segregation across different fields of research in the HES, GOV and BES sectors.
It is important to consider the higher education sector, given that it is the main source of employment for researchers in the EU. The government and business enterprise sectors are also of interest when considering researchers’ career patterns and the extent of horizontal segregation. In 2011, the government sector employed more than 10 % of researchers in the

She Figures Handbook, 2015
Page 44
EU,19 and the European Commission has identified the need for an expansion of researcher jobs in the private sector (i.e. the business enterprise sector) (European Commission, 2011b, p. 5).20
Computation method
Data needed
(F) Number of women researchers, broken down by sector (HES, GOV, BES) and field of science (same fields as T): Unit=Head count;
(T) Total number of researchers, broken down by sector (HES, GOV, BES) and field of science (natural sciences, engineering and technology, medical sciences, agricultural sciences, social sciences and humanities): Unit=Head count.
Source of data
Eurostat – Research and development statistics (online data code: rd_p_perssci)
Specifications
For each field of science, perform this calculation: ℎ ℎ = F /T ℎ ℎ = F /T ℎ ℎ = F /T
where:
i denotes a particular field of science (FOS);
h denotes the higher education sector;
g denotes the government sector;
b denotes the business enterprise sector; F denotes the number of women researchers working in the HES in a particular field of science; T denotes the total number of researchers working in the HES in the same field of science as that in F ; Fgi denotes the number of women researchers working in GOV in a particular field of science;
Tgi denotes the total number of researchers working in GOV in the same field of science as that in Fgi;
Fbi denotes the number of women researchers working in the BES in a particular field of science;
Tbi denotes the total number of researchers working in the BES in the same field of science as that in Fgi.
For example, in a particular sector, suppose there are 1 200 people working as researchers. Of these, 150 work in natural sciences (68 of them women), 245 work in engineering and technology (80 of them are women), 300 work in medical sciences (178 of them are women), 95 work in agricultural sciences (34 of them are women), 140 work in social sciences (75 are women), and finally, 270 work in humanities (125 are women).
19 According to latest available data (2011). See Eurostat, total R&D personnel and researchers by sectors of performance, sex and fields of science [rd_p_perssci].
20 Note that the ‘one million research jobs’ target was originally identified in European Commission, Europe 2020 Flagship Initiative: Innovation Union, COM(2010)546 final.
She Figures Handbook, 2015
Page 45
The proportion of women researchers in each field of science is as follows: ( ):68/150 = 45.3% cℎ ( ):80/245 = 32.7% ( ):178/300 = 59.3% ( ):34/95 = 35.8% ( ):75/140 = 53.6% ( ):125/270 = 46.3%
Main fields of science
The Frascati Manual (OECD, 2002) provides definitions for the six main fields of science (p. 67), which are included in this indicator:
• (NS) Natural sciences
• (ET) Engineering and technology
• (MS) Medical sciences
• (AS) Agricultural sciences
• (SS) Social sciences
• (H) Humanities
The breakdown of researchers by field of science is according to the field in which they work and not according to the field of their qualification.
Sectors of the economy
The Frascati Manual (OECD, 2002) identifies and defines five sectors of the economy (§159): the higher education sector (HES), the government sector (GOV), the business enterprise sector (BES), the private non-profit sector (PNP) and the abroad sector. Eurobase data, however, does not cover the abroad sector data and as such this sector was not included.
The three sectors used in this indicator are:
HES (§206): the higher education sector includes all universities, colleges of technology and other institutes of post-secondary education, whatever their source of finance or legal status. It also includes all research institutes, experimental stations and clinics operating under the direct control of, administered by or associated with higher education institutions.
GOV (§184): the government sector includes all departments, offices and other bodies, which offer but normally do not sell to the community those common services, other than higher education, which cannot otherwise be conveniently and economically provided and administer the state and the economic and social policy of the community (public enterprises are included in the business enterprise sector) as well as non-profit institutes (NPIs) controlled and mainly financed by government.
BES (§163): the business enterprise sector includes all firms, organisations and institutions whose primary activity is the market production of goods or services (other than higher education) for sale to the general public at an economically significant price. It includes the private non-profit institutes mainly serving them.
Researchers and R&D personnel
The Frascati Manual (OECD, 2002) provides an international definition for research and development (R&D) personnel, §294: ‘All persons employed directly on R&D should be counted, as well as those providing direct services such as R&D managers, administrators, and clerical

She Figures Handbook, 2015
Page 46
staff’. R&D personnel comprise three categories: 1) researchers; 2) technicians and equivalent staff; and 3) other supporting staff.
The category used in this indicator is ‘Researchers’ (§301): ‘Researchers are professionals engaged in the conception or creation of new knowledge, products, processes, methods and systems and also in the management of the projects concerned’.
Head count
The head count unit of measurement for R&D personnel comes from the Frascati Manual (OECD, 2002):
HC (§329): Head count. The number of persons engaged in R&D at a given date or the average number of persons engaged in R&D during the (calendar) year or the total number of persons engaged in R&D during the (calendar) year.
Comments/critical issues
In the body of the She Figures, this indicator is presented for two reference years in order to show the evolution of the proportion of women researchers in different fields and sectors (i.e. the extent of change over time).
2.4.9. Distribution of researchers in the government sector (GOV) across fields of science, by sex
Definition of indicator
This indicator focuses on the government sector (GOV) and presents the distribution of men and women researchers across the six fields of science: natural sciences; engineering and technology; medical sciences; agricultural sciences; social sciences; and humanities.
Rationale
The EU is committed to reducing ‘gender segregation at all levels in education and employment’, which includes the research fields in which women and men work. Indicators on horizontal segregation tend to focus on the higher education sector. However, in 2011, the government sector employed more than 10 % of researchers in the EU,21 making it another sector of interest when considering researchers’ career patterns and the extent of horizontal segregation.
For a definition of horizontal segregation, please refer to Annex 2.
The results for this indicator can be compared with the results of similar She Figures indicators on researchers in the government sector (GOV).
Computation method
Data needed
(F) Number of women researchers in the government sector, in all fields of science: Unit=Head count;
(Fi) Number of women researchers in the government sector, in each field of science: Unit=Head count;
(M) Number of men researchers in the government sector, in all fields of science: Unit=Head count;
(Mi) Number of men researchers in the government sector, in each field of science: Unit=Head count.
21 According to latest available data (2011). See Eurostat, total R&D personnel and researchers by sectors of performance, sex and fields of science [rd_p_perssci].
She Figures Handbook, 2015
Page 47
Source of data
Eurostat – Research and development statistics (online data code: rd_p_perssci)
Specifications
This indicator shows how researchers are spread out across different fields of science (FOS).
For each field of science, the formula for this indicator is: ℎ ( ) = F /F ℎ S( ) = M /M
where:
i refers to a particular field of science; denotes the number of women researchers in the GOV sector, in a given field of science;
denotes the number of men researchers in the GOV sector, in a given field of science.
For each sex, the proportions for the fields of science are shown alongside one another (with a sum total of 100 %).
For example, suppose there are 1 000 women researchers in the GOV sector. Of these, 150 are in natural sciences, 170 in engineering and technology, 200 in medical sciences, 82 in agricultural sciences, 250 in social sciences, and 148 in humanities. The proportion of women researchers in the GOV sector in each field of science would be as follows: :150/1000 = 15%; ℎ :170/1000 = 17%; :200/1000 = 20%; :82/1000 = 8.2%; :250/1000 = 25%; :148/1000 = 14.8%. ( 100%) Main fields of science
The Frascati Manual (OECD, 2002) provides definitions for the six main fields of science (p. 67), which are included in this indicator:
• (NS) Natural sciences
• (ET) Engineering and technology
• (MS) Medical sciences
• (AS) Agricultural sciences
• (SS) Social sciences
• (H) Humanities
Head count
The head count unit of measurement for R&D personnel comes from the Frascati Manual (OECD, 2002):

She Figures Handbook, 2015
Page 48
HC (§329): Head count. The number of persons engaged in R&D at a given date or the average number of persons engaged in R&D during the (calendar) year or the total number of persons engaged in R&D during the (calendar) year.
Comments/critical issues
The breakdown of researchers by field of science is performed according to the field in which they work and not according to the field of their qualification.
2.4.10. Compound annual growth rates (CAGR) of women researchers in the government sector (GOV) by field of science
Definition of indicator
This indicator presents the compound annual growth rate of women researchers in the government sector across the six fields of science: natural sciences; engineering and technology; medical sciences; agricultural sciences; social sciences; and humanities.
Rationale
The EU is committed to reducing ‘gender segregation at all levels in education and employment’, which includes the research fields in which women and men work (Council of the European Union, 2014). Indicators on horizontal segregation (the concentration of women and men in particular fields) tend to focus on the higher education sector. However, in 2011, the government sector employed more than 10 % of the researchers in the EU, making it another sector of interest when considering researchers’ career patterns and the extent of horizontal segregation.22
The results for this indicator can be compared with the results of similar She Figures indicators on researchers in the government sector (GOV).
Computation method
Data needed
(F) Number of women researchers in the government sector, working in each of the fields of science, in the earliest and the latest reference year: Unit=Head count;
(N) Number of years in reference period (calculated by subtracting the defined starting reference year (or the next earliest year with available data) from latest reference year with available data): Unit=Number of years.
Source of data
Eurostat – Research and development statistics (online data code: rd_p_perssci)
Specifications
The CAGR shows the average rate of growth per year for a given period. In this case, it shows the average percentage growth of women researchers in each main field of science in the government (GOV) sector, in a given period.
For each field of science respectively, the following calculation is performed: ℎ ℎ = (F F⁄ ) − 1 where:
s refers to the start year;
e refers to the end year;
22 According to latest available data (2011). See Eurostat, total R&D personnel and researchers by sectors of performance, sex and fields of science [rd_p_perssci].
She Figures Handbook, 2015
Page 49
denotes the number of women researchers (GOV sector) in the chosen field of science; is the number of women researchers (GOV) in the chosen field of science in the start year; F is the number of women researchers (GOV) in the chosen field of science in the end year.
Main fields of science
The Frascati Manual (OECD, 2002) provides definitions for the six main fields of science (p. 67), which are included in this indicator:
• (NS) Natural sciences
• (ET) Engineering and technology
• (MS) Medical sciences
• (AS) Agricultural sciences
• (SS) Social sciences
• (H) Humanities
Head count
The head count unit of measurement for R&D personnel comes from the Frascati Manual (OECD, 2002):
HC (§329): Head count. The number of persons engaged in R&D at a given date or the average number of persons engaged in R&D during the (calendar) year or the total number of persons engaged in R&D during the (calendar) year.
Comments/critical issues
• In areas where one sex is under-represented, a higher CAGR for that sex may signal a reduction in the gender imbalance.
• The breakdown of researchers by field of science is performed according to the field in which they work and not according to the field of their qualification.
2.4.11. Distribution of researchers across economic activities (NACE Rev. 2) in the business enterprise sector (BES), by sex
Definition of indicator
This indicator presents the distribution of men and women researchers across specific economic activities in the business enterprise sector: manufacturing; services of the business economy; and all other economic activities.
Rationale
As part of its Europe 2020 targets, the European Commission has identified the need for an estimated one million new research jobs in the EU, which should fall ‘mainly in the private sector’ (i.e. the business enterprise sector) (European Commission, 2011b, p. 5).23 Whilst other She Figures indicators give a picture of women’s overall representation in this sector, this indicator provides an insight into the economic activities being pursued by women and men researchers within the sector. According to a report by the European Foundation for the Improvement of Living and Working Conditions, segregation by gender in the labour market is far-reaching (Eurofound, 2013). Given this situation, it is worthwhile to investigate whether this also holds for individual economic activities within the business enterprise sector.
23 Note that the ‘one million research jobs’ target was originally identified in European Commission, Europe 2020 Flagship Initiative: Innovation Union, COM(2010)546 final.

She Figures Handbook, 2015
Page 50
Computation method
Data needed
(F) Total number of women researchers in the business enterprise sector (BES), in all economic activities (Unit=Head count), as well as:
Number of women researchers in the BES, in the economic activity ‘Manufacturing’: −Unit=Head count;
Number of women researchers in the BES, in the economic activity ‘Services of the −business economy’: Unit=Head count;
Number of women researchers in the BES, in all NACE economic activities except −‘Manufacturing’ and ‘Services of the business economy’: Unit=Head count.
(M) Total number of men researchers in the business enterprise sector (BES) in all economic activities (Unit=Head count), as well as:
Number of men researchers in the business enterprise sector (BES), in the economic −activity ‘Manufacturing’: Unit=Head count;
Number of men researchers in the business enterprise sector (BES), in the economic −activity ‘Services of the business economy’: Unit=Head count;
Number of men researchers in the business enterprise sector (BES), in all NACE Rev. 2 −economic activities except ‘Manufacturing’ and ‘Services of the business economy’: Unit=Head count.
Source of data
Eurostat – Research and development statistics (online data code: rd_p_bempoccr2)
Note that this data code from Eurostat already combines codes G–N as ‘Services of the business economy’, as well as some of the ‘Other NACE codes’.
Specifications
This indicator covers three types of economic activities in the NACE Rev. 2 classifications:
• ‘Manufacturing’ – Code C;
• ‘Services of the business economy – Codes G–N combined;
• ‘Other NACE codes’ – Codes A, B, D–F, O–U.
The formula for this indicator is: ℎ (BES) . (ofallactivities) = / ℎ (BES) . (ofallactivities) = /
where:
i denotes a particular economic activity (for this indicator, either ‘Manufacturing’, ‘Services of the business economy’ or ‘Other NACE codes’); denotes the total number of women researchers in the BES;
denotes the total number of men researchers in the BES;
denotes the number of women researchers in the BES, in a given economic activity;
denotes the number of men researchers in the BES, in a given economic activity.
For each sex, the proportions for the three types of economic activity are shown alongside one another (with a sum total of 100 %).
She Figures Handbook, 2015
Page 51
For example, suppose there are 1 000 women researchers in the BES. Of these, 240 work in manufacturing, 340 in ‘services of the business economy’, and 420 in the remaining economic activities (‘Other NACE codes’). The proportion of women researchers in the BES in each type of economic activity would be as follows: ′ ′ = 240/1000 = 24%; ′ ℎ ′ = 340/1000 = 34%; ′ ℎ ′:420/1000 = 42%. ( 100%) NACE categories
Researchers in the business enterprise sector are categorised using the Statistical Classification of Economic Activities in the European Community, Rev. 2 (NACE Rev. 2). This has 21 main sections:
A Agriculture, forestry and fishing
B Mining and quarrying
C Manufacturing
D Electricity, gas, steam and air conditioning supply
E Water supply, sewerage, waste management and remediation activities
F Construction
G Wholesale and retail trade; repair of motor vehicles and motorcycles
H Transportation and storage
I Accommodation and food service activities
J Information and communication
K Financial and insurance activities
L Real estate activities
M Professional, scientific and technical activities
N Administrative and support service activities
O Public administration and defence; compulsory social security
P Education
Q Human health and social work activities
R Arts, entertainment and recreation
S Other service activities
T Activities of households as employers; undifferentiated goods- and services-producing activities of households for own use
U Activities of extraterritorial organisations and bodies
For a full listing of the NACE Rev. 2 categories (including divisions and groups), please see: http://ec.europa.eu/eurostat/ramon/nomenclatures/index.cfm?TargetUrl=LST_NOM_DTL&StrNom=NACE_REV2
Head count
The head count unit of measurement for R&D personnel comes from the Frascati Manual (OECD, 2002):
HC (§329): Head count. The number of persons engaged in R&D at a given date or the average number of persons engaged in R&D during the (calendar) year or the total number of persons engaged in R&D during the (calendar) year.
She Figures Handbook, 2015
Page 52
Comments/critical issues
NACE Rev. 2 was adopted in December 2006, building on NACE Rev. 1.1. In general, the updated version of NACE is used in statistics on economic activities from 1 January 2008 onwards.
2.4.12. Proportion of women researchers by economic activity (NACE) in the business enterprise sector (BES)
Definition of indicator
This indicator allows comparison of the proportion of women researchers across five different economic activities in the business enterprise sector: manufacturing; manufacturing of chemicals and chemical products; manufacturing of basic pharmaceutical products and pharmaceutical preparations; services of the business economy; other NACE codes.
Rationale
Previous editions of the She Figures (2006, 2009, 2012) have shown that, of the three main sectors of the economy (HES, GOV and BES), women researchers are worst represented in the business enterprise sector, making up less than a fifth of such employees. By considering individual economic activities, this indicator enables one to assess if this picture also holds in key sections of the sector. Encouraging greater gender balance in different activities is central to the EU policy agenda, which calls for the closure of gender gaps in employment and social protection (Council of the European Union, 2011).
Computation method
Data needed
(F) Number of women researchers in the business enterprise sector (BES), in each of the following activities/divisions:
Economic activity, ‘Manufacturing’: Unit=Head count; −
Division ‘Manufacturing of chemicals and chemical products’ of the economic activity, −‘Manufacturing’: Unit=Head count;
Division ‘Manufacture of basic pharmaceutical products and pharmaceutical preparations’ of −the economic activity, ‘Manufacturing’: Unit=Head count;
Economic activity, ‘Services of the business economy’: Unit=Head count; −
All NACE economic activities, except ‘Manufacturing’ and ‘Services of the business −economy’: Unit=Head count.
(T) Total number of researchers in the business enterprise sector (BES), in each of the following activities/divisions:
Economic activity, ‘Manufacturing’: Unit=Head count; −
Division ‘Manufacturing of chemicals and chemical products’ of the economic activity, −‘Manufacturing’: Unit=Head count;
Division ‘Manufacture of basic pharmaceutical products and pharmaceutical preparations’ of −the economic activity, ‘Manufacturing’: Unit=Head count;
Economic activity, ‘Services of the business economy’: Unit=Head count; −
All NACE economic activities, except ‘Manufacturing’ and ‘Services of the business −economy’: Unit=Head count.
Source of data
Eurostat – Research and development statistics (online data code: rd_p_bempoccr2)
Note that this data code from Eurostat (rd_p_bempoccr2) already combines codes G–N as ‘Services of the business economy’, as well as some of the ‘Other NACE codes’.
She Figures Handbook, 2015
Page 53
Specifications
This indicator covers five types of economic activities/divisions in the NACE Rev. 2 classifications:
• ‘Manufacturing’ – Code C
• ‘Manufacturing of chemicals and chemical products’- Code C20
• ‘Manufacture of basic pharmaceutical products and pharmaceutical preparations’ – Code C21
• ‘Services of the business economy – Codes G–N combined
• ‘Other NACE codes’ – Codes A, B, D–F, O–U
Applied to each activity/division in turn, the formula for this indicator is: ℎ = /
where:
denotes a particular economic activity (one of the five covered by this indicator);
denotes the number of women researchers in the BES in a particular economic activity;
denotes the total number of researchers in the BES, in a given economic activity.
Note: Ensure that the economic activity covered by Fi and Ti is the same.
Researchers
Researchers are ‘professionals engaged in the conception or creation of new knowledge, products, processes, methods and systems and also in the management of the projects concerned’ (§301, Frascati Manual, OECD, 2002).
NACE categories
Researchers in the business enterprise sector are categorised using the Statistical Classification of Economic Activities in the European Community, Rev. 2 (NACE Rev. 2). This has 21 main sections. For this indicator, the most relevant sections are:
C Manufacturing, which includes two divisions:
C20: Manufacture of chemicals and chemical products −
C21: Manufacture of basic pharmaceutical products and pharmaceutical preparations −
G Wholesale and retail trade; repair of motor vehicles and motorcycles
H Transportation and storage
I Accommodation and food service activities
J Information and communication
K Financial and insurance activities
L Real estate activities
M Professional, scientific and technical activities
N Administrative and support service activities
The remaining sections (covered in ‘Other NACE codes’) are:
A Agriculture, forestry and fishing
B Mining and quarrying
D Electricity, gas, steam and air conditioning supply
E Water supply, sewerage, waste management and remediation activities

She Figures Handbook, 2015
Page 54
F Construction
O Public administration and defence; compulsory social security
P Education
Q Human health and social work activities
R Arts, entertainment and recreation
S Other service activities
T Activities of households as employers; undifferentiated goods- and services-producing activities of households for own use
U Activities of extraterritorial organisations and bodies
For a full listing of the NACE Rev. 2 categories (including divisions and groups), please see: http://ec.europa.eu/eurostat/ramon/nomenclatures/index.cfm?TargetUrl=LST_NOM_DTL&StrNom=NACE_REV2
Head count
The head count unit of measurement for R&D personnel comes from the Frascati Manual (OECD, 2002):
HC (§329): Head count. The number of persons engaged in R&D at a given date or the average number of persons engaged in R&D during the (calendar) year or the total number of persons engaged in R&D during the (calendar) year.
Comments/critical issues
NACE Rev. 2 was adopted in December 2006, building on NACE Rev. 1.1. In general, the updated version of NACE is used in statistics on economic activities from 1 January 2008 onwards.
2.4.13. Compound annual growth rate (CAGR) for researchers in the higher education sector (HES), by sex
Definition of indicator
This indicator compares the average annual rate of growth in women and men’s employment as researchers in the higher education sector over a particular period.
Rationale
This indicator enables one to gauge changes in the patterns of women and men’s employment as researchers over time, in the higher education sector (HES). Through comparing these results with those of the equivalent indicators for the government (GOV) sector and business enterprise sector (BES), it is also possible to consider whether increases/decreases in one sector are offset by those in another.
Gender segregation in the labour market – understood simply as the prevalence of women or men in a particular sector or occupation – ‘narrows employment choices for both men and women’, according to the European Commission (2014d, p. 26). In addition, the Commission warns that segregation ‘facilitates the under-valuation of women’s work, and of skills and competences associated with women’ (Ibid.). At present, gender segregation remains an issue for the researcher population as a whole, particularly for some sectors.
Computation method
Data needed
(F) Total number of women researchers (aged 25–64) in the higher education sector in the earliest and latest reference year: Unit=Head count;
(M) Total number of men researchers (aged 25–64) in the higher education sector (head count) in the earliest and latest reference year: Unit=Head count;

She Figures Handbook, 2015
Page 55
(N) Number of years in reference period (calculated by subtracting the defined starting reference year (or the next earliest year with available data) from latest reference year with available data): Unit=Number of years.
Source of data
Eurostat – Statistics on research and development (online data code: rd_p_persocc)
Specifications
The CAGR shows the average rate of growth per year for a given period. In this case, it shows the average percentage growth of women researchers and men researchers in the higher education sector (HES) each year in a given period.
It is calculated in the following way: ℎ ℎ = (F F⁄ ) − 1 ℎ ℎ = (M M⁄ ) − 1
where:
s refers to the start year;
e refers to the end year;
denotes the number of women researchers in the HES in the start year;
denotes the number of women researchers in the HES in the end year;
Ms denotes the number of men researchers in the HES in the start year;
Me denotes the number of men researchers in the HES in the end year.
For example, if there were 100 women researchers in the HES in 2002, and 150 in 2006, the calculation would be: ℎ = (150 100⁄ ) − 1 = 10.67%
Note: Ensure the same reference period when calculating the CAGR for women and men respectively.
Researchers
Researchers are ‘professionals engaged in the conception or creation of new knowledge, products, processes, methods and systems and also in the management of the projects concerned’ (§301, Frascati Manual, OECD, 2002).
Sectors of the economy
The Frascati Manual (OECD, 2002) identifies and defines five sectors of the economy: HES, GOV, BES, PNP and abroad (§159). The abroad sector is not included in the Eurobase data and as such is not used.
HES (§206): the higher education sector includes all universities, colleges of technology and other institutes of post-secondary education, whatever their source of finance or legal status. It also includes all research institutes, experimental stations and clinics operating under the direct control of, administered by or associated with higher education institutions.
Head count
The head count unit of measurement for R&D personnel comes from the Frascati Manual (OECD, 2002):

She Figures Handbook, 2015
Page 56
HC (§329): Head count. The number of persons engaged in R&D at a given date or the average number of persons engaged in R&D during the (calendar) year or the total number of persons engaged in R&D during the (calendar) year.
Comments/critical issues
In areas where one sex is under-represented, a higher CAGR for that sex may signal a reduction in the gender imbalance.
2.4.14. Compound annual growth rate (CAGR) for researchers in the government sector (GOV), by sex
Definition of indicator
This indicator compares the average annual rate of growth in women and men’s employment as researchers in the government sector, over a particular period.
Rationale
This indicator enables one to gauge changes in the patterns of women and men’s employment as researchers over time, in the government sector (GOV). Through comparing these results with those of the equivalent indicators for the higher education sector (HES) and business enterprise sector (BES), it is also possible to consider whether increases/decreases in one sector are offset by those in another.
Gender segregation in the labour market – understood simply as the prevalence of women or men in a particular sector or occupation – ‘narrows employment choices for both men and women’, according to the European Commission (2014d, p. 26). In addition, the Commission warns that segregation ‘facilitates the under-valuation of women’s work, and of skills and competences associated with women’ (Ibid.). At present, gender segregation remains an issue for the researcher population as a whole, particularly for some sectors.
Computation method
Data needed
(F) Total number of women researchers (aged 25–64) in the government sector in the earliest and latest reference year: Unit=Head count;
(M) Total number of men researchers (aged 25–64) in the government sector (head count) in the earliest and latest reference year: Unit=Head count;
(N) Number of years in reference period (calculated by subtracting the defined starting reference year (or the next earliest year with available data) from latest reference year with available data): Unit=Number of years.
Source of data
Eurostat – Statistics on research and development (online data code: rd_p_persocc)
Specifications
The compound annual growth rate (CAGR) shows the average rate of growth per year, for a given period. In this case, it shows the average percentage growth of women researchers and men researchers in the government sector (GOV) each year in a given period.
It is calculated in the following way: ℎ ℎ = (F F⁄ ) − 1 ℎ ℎ = (M M⁄ ) − 1
where:
She Figures Handbook, 2015
Page 57
s refers to the start year;
e refers to the end year;
denotes the number of women researchers in the GOV in the start year;
denotes the number of women researchers in the GOV in the end year;
Ms denotes the number of men researchers in the GOV in the start year;
Me denotes the number of men researchers in the GOV in the end year.
For example, if there were 100 women researchers in the GOV in 2002, and 150 in 2006, the calculation would be: ℎ = (150 100⁄ ) − 1 = 10.67%
Note: Ensure the same reference period when calculating the CAGR for women and men respectively.
Researchers
Researchers are ‘professionals engaged in the conception or creation of new knowledge, products, processes, methods and systems and also in the management of the projects concerned’ (§301, Frascati Manual, OECD, 2002).
Sectors of the economy
The Frascati Manual (OECD, 2002) identifies and defines five sectors of the economy: HES, GOV, BES, PNP and abroad (§159). The abroad sector is not included in the Eurobase data and as such is not used.
GOV (§184): the government sector includes all departments, offices and other bodies, which offer but normally do not sell to the community those common services, other than higher education, which cannot otherwise be conveniently and economically provided and administer the state and the economic and social policy of the community (public enterprises are included in the business enterprise sector) as well as non-profit institutes (NPIs) controlled and mainly financed by government.
Head count
The head count unit of measurement for R&D personnel also comes from the Frascati Manual (OECD, 2002):
HC (§329): Head count. The number of persons engaged in R&D at a given date or the average number of persons engaged in R&D during the (calendar) year or the total number of persons engaged in R&D during the (calendar) year.
Comments/critical issues
In areas where one sex is under-represented, a higher CAGR for that sex may signal a reduction in the gender imbalance.
2.4.15. Compound annual growth rate for researchers in the business enterprise sector (BES), by sex
Definition of indicator
This indicator compares the average annual rate of growth in women and men’s employment as researchers in the business enterprise sector, over a particular period.
Rationale
This indicator enables one to gauge changes in the patterns of women and men’s employment as researchers over time, in the business enterprise sector (BES). Through comparing these results with those of the equivalent indicators for the higher education sector (HES) and government
She Figures Handbook, 2015
Page 58
sector (GOV), it is also possible to consider whether increases/decreases in one sector are offset by those in another.
Gender segregation in the labour market – understood simply as the prevalence of women or men in a particular sector or occupation – ‘narrows employment choices for both men and women’, according to the European Commission (2014d, p. 26). In addition, the Commission warns that segregation ‘facilitates the undervaluation of women’s work, and of skills and competences associated with women’ (Ibid.). At present, gender segregation remains an issue for the researcher population as a whole, particularly for some sectors.
Computation method
Data needed
(F) Total number of women researchers (aged 25–64) in the business enterprise sector in the earliest and latest reference year: Unit=Head count;
(M) Total number of men researchers (aged 25–64) in the business enterprise sector (head count) in the earliest and latest reference year: Unit=Head count;
(N) Number of years in reference period (calculated by subtracting the defined starting reference year (or the next earliest year with available data) from latest reference year with available data): Unit=Number of years.
Source of data
Eurostat – Statistics on research and development (online data code: rd_p_persocc)
Specifications
The CAGR shows the average rate of growth per year for a given period. In this case, it shows the average percentage growth of women researchers and men researchers in the business enterprise sector (BES) each year in a given period.
It is calculated in the following way: ℎ ℎ = (F F⁄ ) − 1 ℎ ℎ = (M M⁄ ) − 1
where:
s refers to the start year;
e refers to the end year;
denotes the number of women researchers in the BES in the start year;
denotes the number of women researchers in the BES in the end year;
Ms denotes the number of men researchers in the BES in the start year;
Me denotes the number of men researchers in the BES in the end year.
For example, if there were 100 women researchers in the BES in 2002, and 150 in 2006, the calculation would be: ℎ = (150 100⁄ ) − 1 = 10.67%
Note: Ensure the same reference period when calculating the CAGR for women and men respectively.

She Figures Handbook, 2015
Page 59
Researchers
Researchers are ‘professionals engaged in the conception or creation of new knowledge, products, processes, methods and systems and also in the management of the projects concerned’ (§301, Frascati Manual, OECD, 2002).
Sectors of the economy
The Frascati Manual (OECD, 2002) identifies and defines five sectors of the economy: HES, GOV, BES, PNP and abroad (§159). The abroad sector is not included in the Eurobase data and as such is not used.
BES (§163): the business enterprise sector includes all firms, organisations and institutions whose primary activity is the market production of goods or services (other than higher education) for sale to the general public at an economically significant price. It includes the private non-profit institutes mainly serving them.
Head count
The head count unit of measurement for R&D personnel comes from the Frascati Manual (OECD, 2002):
HC (§329): Head count. The number of persons engaged in R&D at a given date or the average number of persons engaged in R&D during the (calendar) year or the total number of persons engaged in R&D during the (calendar) year.
Comments/critical issues
In areas where one sex is under-represented, a higher CAGR for that sex may signal a reduction in the gender imbalance.
2.4.16. Distribution of researchers in the higher education sector (HES), by sex and age group
Definition of indicator
This indicator breaks down the distribution of both men and women researchers in the higher education sector (HES) across different age groups.
Rationale
This indicator focuses on the higher education sector (HES), and can be compared with the results of the equivalent indicator for the government sector (GOV).24
Considering the age distribution of researchers may reveal differences in the career patterns of women and men. For example, according to Eurostat, a higher proportion of women are inactive due to caring responsibilities, including for children.25 This may reduce their participation in the labour market during the key childbearing years of a particular country. On another level, by taking older age as a ‘proxy’ for seniority, this indicator can be used to gauge women and men’s relative presence in the top research positions, against a backdrop of far-reaching under-representation of women in decision-making roles (DG Justice, ‘Database: Women and men in decision-making’).
24 Distribution of researchers in the government sector (GOV), by sex and age group.
25 In 2013, in the EU, 38.8 % of women (aged 25 to 49) who were inactive were in the position due to looking after children or incapacitated adults. For inactive men of the same age group, the rate was 3.9 %. See Eurostat, ‘Inactive Population – Main reason for not seeking employment – Distributions by sex and age (%)’, data table lfsa_igar.

She Figures Handbook, 2015
Page 60
Computation method
Data needed
(F) Total number of women researchers in the higher education sector (HES) aged 25 and over: Unit=Head count;
( ) Number of women researchers in the higher education sector (HES), in each of these age categories: 25–34; 35–44; 45–54; 55 and over: Unit=Head count;
(M) Total number of men researchers in the higher education sector (HES) aged 25 and over: Unit=Head count;
( ) Number of men researchers in the higher education sector (HES), in each of these age categories: 25–34; 35–44; 45–54; 55 and over: Unit=Head count.
Source of data
Eurostat – Statistics on research and development (online data code: rd_p_persage)
Specifications
The formula for this indicator is: ℎ (ofallagegroups) = F / ℎ (ofallagegroups) = M /
where:
denotes a particular age group;
denotes the number of women researchers in the HES, in a given age group; denotes the number of men researchers in the HES, in a given age group.
For each sex, the proportions for the age groups are shown alongside one another (with a sum total of 100 %).
For example, suppose there are 100 men researchers (aged 25 and over) in the HES in one country. Of these, 12 are aged 25–34; 26 aged 35–44; 38 aged 45–54; and 24 aged 55 and over. The proportion of men in each age group would be as follows: 25 − 34; 12/100 = 12%; 35 − 44; 26/100 = 26%; 45 − 54; 38/100 = 38%; 55 :24/100 = 24%. ( 100%) Researchers
Researchers are ‘professionals engaged in the conception or creation of new knowledge, products, processes, methods and systems and also in the management of the projects concerned’ (§301, Frascati Manual, OECD, 2002).
Sectors of the economy
The Frascati Manual (OECD, 2002) identifies and defines five sectors of the economy (§159): HES, GOV, BES, PNP and abroad. The abroad sector is not included in the Eurobase data and as such is not used.
She Figures Handbook, 2015
Page 61
HES (§206): the higher education sector includes all universities, colleges of technology and other institutes of post-secondary education, whatever their source of finance or legal status. It also includes all research institutes, experimental stations and clinics operating under the direct control of, administered by or associated with higher education institutions.
Head count
The head count unit of measurement for R&D personnel comes from the Frascati Manual (OECD, 2002):
HC (§329): Head count. The number of persons engaged in R&D at a given date or the average number of persons engaged in R&D during the (calendar) year or the total number of persons engaged in R&D during the (calendar) year.
Comments/critical issues
None identified.
2.4.17. Distribution of researchers in the government sector (GOV), by sex and age group
Definition of indicator
This indicator breaks down the distribution of both men and women researchers in the government sector (GOV) across different age groups.
Rationale
This indicator focuses on the government sector (GOV), and can be compared with the results of the equivalent indicator for the higher education sector (HES).
Considering the age distribution of researchers may reveal differences in the career patterns of women and men. For example, according to Eurostat, a higher proportion of women are inactive due to caring responsibilities, including for children.26 This may reduce their participation in the labour market during the key childbearing years of a particular country. On another level, by taking older age as a ‘proxy’ for seniority, this indicator can be used to gauge women and men’s relative presence in the top research positions, against a backdrop of far-reaching under-representation of women in decision-making roles (DG Justice, ‘Database: Women and men in decision-making’).
Computation method
Data needed
(F) Total number of women researchers in the GOV sector aged 25 and over: Unit=Head count;
( ) Number of women researchers in the GOV sector, in each of these age categories: 25–34; 35–44; 45–54; 55 and over: Unit=Head count;
(M) Total number of men researchers in the GOV sector, aged 25 and over: Unit=Head count;
( ) Number of men researchers in the GOV sector, in each of these age categories: 25–34; 35–44; 45–54; 55 and over: Unit=Head count.
Source of data
Eurostat – Statistics on research and development (online data code: rd_p_persage)
26 Ibid.

She Figures Handbook, 2015
Page 62
Specifications
The formula for this indicator is: ℎ (ofallagegroups) = F / ℎ (ofallagegroups) = M /
where:
denotes a particular age group;
denotes the number of women researchers in the GOV sector, in a given age group; denotes the number of men researchers in the GOV sector, in a given age group.
For each sex, the proportions for the age groups are shown alongside one another (with a sum total of 100 %).
For example, suppose there are 100 men researchers (aged 25 and over) in the GOV sector in one country. Of these, 12 are aged 25–34; 26 aged 35–44; 38 aged 45–54; and 24 aged 55 and over. The proportion of men in each age group would be as follows: 25 − 34; 12/100 = 12%; 35 − 44; 26/100 = 26%; 45 − 54; 38/100 = 38%; 55 :24/100 = 24%. ( 100%) Researchers
Researchers are ‘professionals engaged in the conception or creation of new knowledge, products, processes, methods and systems and also in the management of the projects concerned’ (§301, Frascati Manual, OECD, 2002).
Sectors of the economy
The Frascati Manual (OECD, 2002) identifies and defines five sectors of the economy (§159): HES, GOV, BES, PNP and abroad. The abroad sector is not included in the Eurobase data and as such is not used.
GOV (§184): the government sector includes all departments, offices and other bodies, which furnish but normally do not sell to the community those common services, other than higher education, which cannot otherwise be conveniently and economically provided and administer the state and the economic and social policy of the community (public enterprises are included in the business enterprise sector) as well as non-profit institutes (NPIs) controlled and mainly financed by government.
Head count
The head count unit of measurement for R&D personnel comes from the Frascati Manual (OECD, 2002):
HC (§329): Head count. The number of persons engaged in R&D at a given date or the average number of persons engaged in R&D during the (calendar) year or the total number of persons engaged in R&D during the (calendar) year.
Comments/critical issues
None identified.
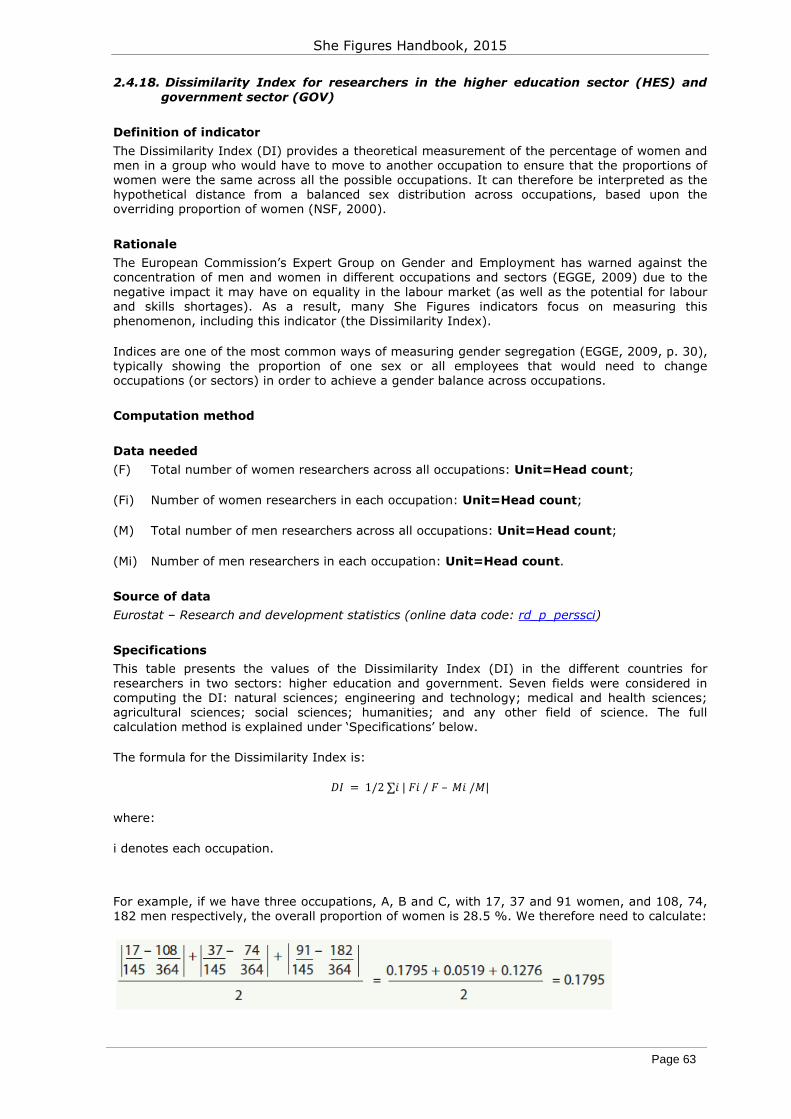
She Figures Handbook, 2015
Page 63
2.4.18. Dissimilarity Index for researchers in the higher education sector (HES) and government sector (GOV)
Definition of indicator
The Dissimilarity Index (DI) provides a theoretical measurement of the percentage of women and men in a group who would have to move to another occupation to ensure that the proportions of women were the same across all the possible occupations. It can therefore be interpreted as the hypothetical distance from a balanced sex distribution across occupations, based upon the overriding proportion of women (NSF, 2000).
Rationale
The European Commission’s Expert Group on Gender and Employment has warned against the concentration of men and women in different occupations and sectors (EGGE, 2009) due to the negative impact it may have on equality in the labour market (as well as the potential for labour and skills shortages). As a result, many She Figures indicators focus on measuring this phenomenon, including this indicator (the Dissimilarity Index).
Indices are one of the most common ways of measuring gender segregation (EGGE, 2009, p. 30), typically showing the proportion of one sex or all employees that would need to change occupations (or sectors) in order to achieve a gender balance across occupations.
Computation method
Data needed
(F) Total number of women researchers across all occupations: Unit=Head count;
(Fi) Number of women researchers in each occupation: Unit=Head count;
(M) Total number of men researchers across all occupations: Unit=Head count;
(Mi) Number of men researchers in each occupation: Unit=Head count.
Source of data
Eurostat – Research and development statistics (online data code: rd_p_perssci)
Specifications
This table presents the values of the Dissimilarity Index (DI) in the different countries for researchers in two sectors: higher education and government. Seven fields were considered in computing the DI: natural sciences; engineering and technology; medical and health sciences; agricultural sciences; social sciences; humanities; and any other field of science. The full calculation method is explained under ‘Specifications’ below.
The formula for the Dissimilarity Index is: = 1/2∑ | / – / | where:
i denotes each occupation.
For example, if we have three occupations, A, B and C, with 17, 37 and 91 women, and 108, 74, 182 men respectively, the overall proportion of women is 28.5 %. We therefore need to calculate:

She Figures Handbook, 2015
Page 64
This means that 18 % of researchers will have to change occupation in order to maintain the background proportion of 28.5 % women in each occupation.
Researchers
Researchers are ‘professionals engaged in the conception or creation of new knowledge, products, processes, methods and systems and also in the management of the projects concerned’ (§301, Frascati Manual, OECD, 2002).
Head count
The head count unit of measurement for R&D personnel comes from the Frascati Manual (OECD, 2002):
HC (§329): Head count. The number of persons engaged in R&D at a given date or the average number of persons engaged in R&D during the (calendar) year or the total number of persons engaged in R&D during the (calendar) year.
Comments/critical issues
• In order to interpret the DI correctly, it is important to know which sex is in the majority overall. The maximum value is 1, which indicates the presence of either women or men only in each of the occupations, depending on the majority gender. The minimum value of 0 indicates a distribution between women and men within each occupation which is equal to the overall average proportion of women. If the same occupational categories are used for different countries, the DI yields a comparable and descriptive statistic that reflects the extent to which the two sexes are differently distributed. The results also depend on the number of categories. If more categories are used, the indicator will reflect greater variability in the distribution, which in turn will yield results indicating a higher level of segregation.
• The index shown in the She Figures is the Duncan and Duncan Index of Dissimilarity, first developed in the 1950s and now used extensively for international comparisons of inequality and dissimilarity (not solely between the sexes but also between other groups).
2.4.19. Distribution of R&D personnel by sector of the economy, occupation and sex
Definition of indicator
This indicator presents the distribution, by sex, of research and development (R&D) personnel across three occupations (researchers, technicians, and others) in the three main sectors of the economy combined: higher education sector (HES), government (GOV) sector and business enterprise sector (BES).
Rationale
It is well known that women continue to be under-represented in science & technology (S&T), in part due to the ‘continuous exit’ of women throughout career progression in this field (DG Research, 2009c). This indicator focuses on R&D personnel across all three sectors, namely the higher education sector, the government sector and the business enterprise sector. Since this indicator corrects for the total number of personnel for each sex, it allows for a comparison of the presence of each sex across the different occupations.
Computation method
Data needed
(Ms,i) Number of men in a given R&D occupation in a given sector: Unit=Head count;
(Fs,i) Number of women in a given R&D occupation in a given sector: Unit=Head count;
(Ms) Number of men in all R&D occupations in a given sector: Unit=Head count;
(Fs) Number of women in all R&D occupations in a given sector: Unit=Head count.
(i) Denotes a particular R&D occupation:

She Figures Handbook, 2015
Page 65
Researchers −
Technicians −
Other supporting staff −
(s) Denotes a sector of activity:
Higher education sector (HES) −
Government sector (GOV) −
Business enterprise sector (BES) −
Total of all sectors. −
Source of data
For Ms,i, Fs,i, Ms, Fs: Eurostat – Statistics on research and development (online data code: rd_p_persocc)
Specifications
This indicator presents the relative proportion of personnel per occupation by sex. = F , F⁄ = M , M⁄
where:
(i) Denotes a particular R&D occupation:
Researchers −
Technicians −
Other supporting staff −
(s) Denotes a sector of activity:
Higher education sector (HES) −
Government sector (GOV) −
Business enterprise sector (BES) −
Private non-profit sector (PNP) −
Total of all sectors −
For each sex, the proportions for the occupations are shown alongside one another (with a sum total of 100 %).
For example, suppose there are 1 000 women R&D personnel in these three sectors. Of these, 390 work as researchers, 260 work as technicians and 350 work as other supporting staff. The proportion of women in each occupation would be as follows: ; ℎ = 390 1000 = 39%⁄ ; ℎ = 260 1000 = 26%⁄ ; ℎ = 350 1000 = 35%⁄ (Sumtotalof100%)
She Figures Handbook, 2015
Page 66
Occupations
The Frascati Manual (OECD, 2002) provides an international definition for R&D personnel, §294: ‘All persons employed directly on R&D should be counted, as well as those providing direct services such as R&D managers, administrators, and clerical staff.’
R&D personnel comprise three categories of occupations:
Researchers §301: ‘Researchers are professionals engaged in the conception or creation of new knowledge, products, processes, methods and systems and also in the management of the projects concerned.’ Researchers are classified as ISCO-2.
Technicians and equivalent staff §306: ‘Technicians and equivalent staff are persons whose main tasks require technical knowledge and experience in one or more fields of engineering, physical and life sciences or social sciences and humanities. They participate in R&D by performing scientific and technical tasks involving the application of concepts and operational methods, normally under the supervision of researchers. Equivalent staff performs the corresponding R&D tasks under the supervision of researchers in the social sciences and humanities.’
Other supporting staff (Others) §309: ‘Other supporting staff includes skilled and unskilled craftsmen, secretarial and clerical staff participating in R&D projects or directly associated with such projects.’
Sectors of the economy
The Frascati Manual (OECD, 2002) identifies and defines five sectors of the economy (§159): the higher education sector (HES), the government sector (GOV), the business enterprise sector (BES), the private non-profit sector (PNP) and the abroad sector. The abroad sector is not included in the Eurobase data and as such is not used. The three sectors relevant to this indicator are:
HES (§206): the higher education sector includes all universities, colleges of technology and other institutes of post-secondary education, whatever their source of finance or legal status. It also includes all research institutes, experimental stations and clinics operating under the direct control of, administered by or associated with higher education institutions.
GOV (§184): the government sector includes all departments, offices and other bodies, which offer but normally do not sell to the community those common services, other than higher education, which cannot otherwise be conveniently and economically provided and administer the state and the economic and social policy of the community (public enterprises are included in the business enterprise sector) as well as non-profit institutes (NPIs) controlled and mainly financed by government.
BES (§163): the business enterprise sector includes all firms, organisations and institutions whose primary activity is the market production of goods or services (other than higher education) for sale to the general public at an economically significant price. It includes the private non-profit institutes mainly serving them.
Head count
The head count unit of measurement for R&D personnel comes from the Frascati Manual (OECD, 2002):
HC (§329): Head count. The number of persons engaged in R&D at a given date or the average number of persons engaged in R&D during the (calendar) year or the total number of persons engaged in R&D during the (calendar) year.
Comments/critical issues
None identified.
She Figures Handbook, 2015
Page 67
2.4.20. Total intramural R&D expenditure (GERD) per researcher in FTE, by sector of the economy
Definition of indicator
This indicator breaks down R&D expenditure per capita researcher in FTE by sector (business enterprise, government, higher education or private non-profit) for a given year. To account for differences in prices, currency and exchange rates, the data are expressed in purchasing power standards (PPS).
This indicator is calculated as follows:
• R&D expenditure in PPS per capita researcher (by sector) = R&D expenditure in PPS for a given sector/Number of researchers in FTE for this sector
Rationale
This indicator looks at the R&D expenditure of the different sectors. Partly, this relates to the idea that the overall level of R&D expenditure may influence women’s success rates in obtaining research funding (DG Research, 2009a). Although it does not provide any gender-specific information, the indicator should be viewed in conjunction with the indicator that addresses the distribution of researchers across sectors by sex, in order to see if there is any correlation between R&D spending and women researchers’ presence.
Computational method
Data needed
(Ti) The overall number of researchers, in full-time equivalent (FTE), in the sectors of the economy (HES, GOV, BES, PNP, Total): Unit=Full-Time Equivalent;
(Ei) R&D expenditure in millions of purchasing power standards (PPS), by sector of activity (HES, GOV, BES, PNP, Total): Unit=Million PPS:
(i) Denotes a particular field:
Higher education sector (HES) −
Government sector (GOV) −
Business enterprise sector (BES) −
Private non-profit (PNP) −
Sum of the sectors (HES+GOV+BES+PNP) −
Source of data
Ti: Eurostat – Statistics on research and development (online data code: rd_p_persocc)
Ei: Eurostat – Statistics on research and development (online data code: rd_e_gerdtot)
Specifications & ℎ ( ) = (E 1,000,000) T⁄
Full-time equivalent
The definition of the full-time equivalent unit of measurement of personnel employed in R&D, as proposed by the Frascati Manual, is:
FTE (§333): Full-time equivalent. One FTE corresponds to one year’s work by one person on R&D.
R&D expenditure
The Frascati Manual defines intramural expenditures on R&D as all expenditures for R&D performed within a statistical unit or sector of the economy during a specific period, whatever the

She Figures Handbook, 2015
Page 68
source of funds. It recommends using purchasing power parities (PPP) to express R&D statistics in monetary terms.
The PPPs are currency conversion rates that convert to a common currency and equalise the purchasing power of different currencies. They eliminate the differences in price levels between countries because economic indicators expressed in a national currency are converted into an artificial common currency, called the purchasing power standards (PPS).
Comments/critical issues
None identified.
Eurostat – Structure of Earnings Surveys (SES) 2.5.
Content-based rationale
Indicators computed from the Structure of Earnings Survey aim to explore the gender pay gap in hourly earnings. As an unadjusted indicator, the gender pay gap gives an overall picture of the differences between men and women in terms of hourly pay and measures a concept which is broader than the concept of equal pay for equal work. A part of the earnings difference can be explained by individual characteristics of employed men and women (e.g. experience and education) and by sectoral and occupational gender segregations (e.g., there are more men than women in some occupations with, on the average, higher earnings compared to other occupations). A part of the earnings difference can also be linked to the undervaluation of women’s skills and capacities, the under-representation of women in decision-making positions, the unequal division of caring responsibilities, gender stereotypes and discriminatory practices in the workplace (both direct and indirect). This pay gap often leads to substantial losses in terms of productivity, poorer economic performance and lower living standards for the affected individuals. Indicators used to measure the gender pay gap include: gender pay gap in percentage by country across economic activities; gender pay gap in percentage by age group across economic activities.
Broad overview of the source
This data, in particular, related to scientific and research development (NACE Rev. 2, Section M, Division 72) is calculated from Eurostat's Structure of Earnings Survey database. The survey provides data regarding earnings, and employee and employer characteristics such as gender, age and occupation, economic activity and enterprise size, respectively, in a manner that allows for comparisons at the EU level. The data are collected once every four years (more recently 2014), and are made available two years after the end of the reference year (European Commission, 2015e). Data from Eurostat are publicly available, regularly updated and accompanied by extensive methodological notes (http://ec.europa.eu/eurostat/web/labour-market/earnings). Having used the unadjusted GPG, the values reflect mainly the differences in careers (http://ec.europa.eu/justice/gender-equality/gender-pay-gap/situation-europe/index_en.htm).
A complete list of indicators falling into this category can be found in Annex 3 and their detailed description follows below.
2.5.1. Gender pay gap (%) by country across economic activities (NACE Rev. 2)
Definition of indicator
This indicator presents the gender pay gap, comparing statistics for a given year in the Structure of Earnings Survey regarding economic activities related to scientific and research development (NACE Rev. 2, Section M, Division 72), compared to statistics for an aggregate of economic activities (NACE Rev. 2, Sections B to S, excluding Section O).
This indicator is calculated as follows:
• Gender pay gap (GPG) = (Average gross hourly earnings of paid men employees – Average gross hourly earnings of paid women employees) / Average gross hourly earnings of paid men employees (expressed in %)

She Figures Handbook, 2015
Page 69
In other words, the unadjusted GPG represents the difference between the average gross hourly earnings of paid men employees and of paid women employees as a percentage of the average gross hourly earnings of paid men employees.
Rationale
Gender pay gaps exist across all walks of economic life and lead to substantial losses in productivity, poorer economic performance and lower living standards for the affected individuals (OECD, 2012). GPG captures enduring gender inequalities in research as well as in the labour market in general (Smith, 2010). The gender pay gap is, in a sense, the final and most synthetic indicator of the inequalities between men and women that structure the labour market (O’Dorchai, 2011). This indicator focuses on the gender pay gap for the total economy, as defined below.
Computation method
Data needed
(Fi) Average gross hourly earnings of women employees by economic activity: Unit=National Currency per hour;
(Mi) Average gross hourly earnings of men employees by economic activity: Unit=National Currency per hour.
(i) Denotes selected two defined sets of NACE economic activities:
‘Scientific and development research’ – Section M, Division 72; −
Total economy, defined here with Sections B to S, excluding Section O. −
Source of data
For M and F: Structure of earnings survey 2010 (earn_ses10_12)
Note that these results are pre-computed from data found under: Eurostat – Structure of Earnings Survey (SES) (variable code B43: Average gross hourly earnings in the reference month (to 2 decimal places)). Data for NACE section 70 are not online.
Specifications
This indicator covers two defined set of economic activities in the NACE Rev. 2 classifications:
• ‘Scientific and development research’ – Section M, Division 72;
• Total economy, defined here with Sections B to S, excluding Section O. = (M − F ) M⁄
where:
The target population consists of all paid employees aged 15–64 having worked at least 30 weeks during the reference year. The statistics refer to enterprises with at least 10 employees in the area of economic activity defined by sections B–S (excluding O) of NACE Rev. 2 (for SES 2010).
NACE categories
The Statistical Classification of Economic Activities in the European Community, Rev. 2 (NACE Rev. 2) is used. This has 21 main sections:
A Agriculture, forestry and fishing
B Mining and quarrying
C Manufacturing
D Electricity, gas, steam and air conditioning supply
E Water supply, sewerage, waste management and remediation activities

She Figures Handbook, 2015
Page 70
F Construction
G Wholesale and retail trade; repair of motor vehicles and motorcycles
H Transportation and storage
I Accommodation and food service activities
J Information and communication
K Financial and insurance activities
L Real estate activities
M Professional, scientific and technical activities
N Administrative and support service activities
O Public administration and defence; compulsory social security
P Education
Q Human health and social work activities
R Arts, entertainment and recreation
S Other service activities
T Activities of households as employers; undifferentiated goods- and services-producing activities of households for own use
U Activities of extraterritorial organisations and bodies
Division 72 ‘Scientific and development research’ is in section M.
For a full listing of the NACE Rev. 2 categories (including divisions and groups), please see: http://ec.europa.eu/eurostat/ramon/nomenclatures/index.cfm?TargetUrl=LST_NOM_DTL&StrNom=NACE_REV2
Comments/critical issues
A local unit is classified by its principal economic activity. A local unit may, however, also perform secondary activities. This means that NACE division 72 includes local units having their principle activity in research and development as defined in the NACE classification. Note that those local units could have some secondary activities. It is also possible that research and development is a secondary activity for some local units having another principal activity (e.g. in education). SES does not provide information on secondary activities. See more on the principal and secondary activities in the document on NACE Rev. 2 classification (pages 22-30): http://ec.europa.eu/eurostat/documents/3859598/5902521/KS-RA-07-015-EN.PDF
The gender pay gap for the EU is calculated as the weighted mean of the gender pay gaps in EU Member States, where the numbers of employees in Member States are weights.
2.5.2. Gender pay gap (%) by age group across economic activities (NACE Rev. 2)
Definition of indicator
This indicator presents the gender pay gap, comparing statistics for a given year in the Structure of Earnings Survey regarding economic activities related to scientific and research development (NACE Rev. 2, Section M, Division 72), compared to statistics for an aggregate of economic activities (NACE Rev. 2, Sections B to S, excluding Section O).
This indicator is calculated as follows:
• Gender pay gap (GPG) = (Average gross hourly earnings of paid men employees – Average gross hourly earnings of paid women employees) / Average gross hourly earnings of paid men employees (expressed in %).
In other words, the unadjusted GPG represents the difference between the average gross hourly earnings of paid men employees and of paid women employees as a percentage of the average gross hourly earnings of paid men employees.
She Figures Handbook, 2015
Page 71
This indicator presents the breakdown of the gender pay gap (GPG) by age group (15–34 years, 35–44 years, and 55–64 years) and over the total economy, following NACE Rev. 2 classification, and in the NACE Rev. 2 Division 72.
Rationale
Gender pay gaps exist across all walks of economic life and lead to substantial losses in terms of productivity, poorer economic performance and lower living standards for the affected individuals (OECD, 2012).
The causes of the gender pay gap continue to be debated, although it has been linked to the undervaluation of women’s skills and capacities, the under-representation of women in decision-making positions, the unequal division of caring responsibilities, gender stereotypes and discriminatory practices in the workplace (both direct and indirect), and gender segregation across sectors and occupations (EGGE, 2009; DG Justice, 2014, pp. 5–8). The gender wage gap is, in a sense, the final and most synthetic indicator of the inequalities between men and women that structure the labour market (O’Dorchai, 2011).
Computation method
Data needed
(Fa,i) Average gross hourly earnings of women employees by age group and economic activity: Unit=National Currency per hour;
(Ma,i) Average gross hourly earnings of men employees by age group and economic activity: Unit=National Currency per hour.
(i) Denotes selected two defined sets of NACE economic activities:
‘Scientific and development research’ – Section M, Division 72; −
Total economy, defined here with Sections B to S, excluding Section O. −
(a) Denotes age group of employees:
<35 years old −
35–44 years old −
45–54 years old −
55+ years old −
Source of data
For (Ma,i) and (Fa,i): Structure of earnings survey 2010 (earn_ses10_12)
Note that these results are pre-computed from data found under: Eurostat – Structure of Earnings Survey (SES) (variable code B43: Average gross hourly earnings in the reference month (to 2 decimal places))
Specifications = (M , − F , ) M ,⁄ where:
The target population consists of all paid employees aged <35–55+ having worked at least 30 weeks during the reference year. The statistics refer to enterprises with at least 10 employees in the area of economic activity defined by sections B–S without O of NACE Rev. 2 (for SES 2010).
NACE categories
The Statistical Classification of Economic Activities in the European Community, Rev. 2 (NACE Rev. 2) is used. This has 21 main sections:
She Figures Handbook, 2015
Page 72
A Agriculture, forestry and fishing
B Mining and quarrying
C Manufacturing
D Electricity, gas, steam and air conditioning supply
E Water supply, sewerage, waste management and remediation activities
F Construction
G Wholesale and retail trade; repair of motor vehicles and motorcycles
H Transportation and storage
I Accommodation and food service activities
J Information and communication
K Financial and insurance activities
L Real estate activities
M Professional, scientific and technical activities
N Administrative and support service activities
O Public administration and defence; compulsory social security
P Education
Q Human health and social work activities
R Arts, entertainment and recreation
S Other service activities
T Activities of households as employers; undifferentiated goods- and services-producing activities of households for own use
U Activities of extraterritorial organisations and bodies
Division 72 ‘Scientific and development research’ is in section M.
For a full listing of the NACE Rev. 2 categories (including divisions and groups), please see: http://ec.europa.eu/eurostat/ramon/nomenclatures/index.cfm?TargetUrl=LST_NOM_DTL&StrNom=NACE_REV2
Comments/critical issues
A local unit is classified by its principal economic activity. A local unit may, however, also perform secondary activities. This means that NACE division 72 includes local units having their principle activity in research and development as defined in the NACE classification. Note that those local units could have some secondary activities. It is also possible that research and development is a secondary activity for some local units having another principal activity (e.g. in education). SES does not provide information on secondary activities. See more on the principal and secondary activities in the document on NACE Rev. 2 classification (pages 22–30): http://ec.europa.eu/eurostat/documents/3859598/5902521/KS-RA-07-015-EN.PDF
The gender pay gap for the EU is calculated as the weighted mean of the gender pay gaps in EU Member States, where the numbers of employees in Member States are weights.
MORE Survey 2.6.
Content-based rationale
Directive 2006/54/EC of 5 July 2006 lays down the principle of equal treatment of men and women in the EU, in relation to their working conditions, access to promotion and access to occupational security schemes. Amongst other things, the Mobility and Career Paths of Researchers in Europe (MORE) Survey investigates gender differences in the working conditions of women and men researchers working in higher education institutions, including their contractual status and level of mobility. She Figures indicators from this data source include sex differences in mobility; part-time employment of researchers in the higher education sector
She Figures Handbook, 2015
Page 73
(HES), by sex; and precarious working contracts of researchers in HES out of total researcher population, by sex.
Broad overview of the source
The MORE Surveys are part of the Mobility and Career Paths of Researchers in Europe (MORE) Project (European Commission, ‘More’ and ‘More 2’), funded by the European Commission and conducted with a number of partner organisations.27 The project was set up to improve understanding of research careers in Europe. The survey is an important source of data on the research profession, including researchers’ career progression and ability to move/work between different countries.
To date, there have been two editions of the MORE Survey: the MORE1 Survey (2009 data) and the MORE2 Survey (2012 data; released in 2013). As discussed under individual indicators, the results of these surveys are not fully comparable due to some differences in the questionnaire design.
Although the MORE1 and MORE2 Surveys produced questionnaires for researchers in multiple sectors, the She Figures uses only the survey of higher education institutions (HEIs). This is because the HEI survey contained the most relevant questions on the contractual status and mobility of researchers.
A complete list of indicators falling into this category can be found in Annex 3 and their detailed description follows below.
2.6.1. Sex differences for international mobility during PhD
Definition of indicator
The indicators show the difference in the percentage of women/men researchers who – during their PhD – moved for at least three months to a country other than that where they attained (or will attain) their PhD. It covers researchers in the early stages of their careers (R1 and R2).
Rationale
In 2008, the European Parliament argued that ‘mobility is one of the crucial ways of developing and assuring research career advancement’.28 However, there are some concerns that women may be less mobile than men at certain stages of their life. For example, there are signs that women continue to bear the majority of childbearing responsibilities in the EU29 and – as the European Parliament warns – mobility ‘can be difficult to reconcile with family life’.30 According to the Gendered Innovations project, ‘gender roles that limit women’s mobility interfere with careers in science and engineering’ (DG Research, ‘Subtle bias’).31
This indicator aims to identify if there are indeed such differences in the mobility of women and men, focusing on researchers’ experiences of mobility during their PhDs.
27 IDEA Consult, WIFO, CHEPS, iFQ, Sapienza University, Danish Centre for Studies in Research and Research Policy, Loft33, Interago, CheckMarket, University of Wolverhampton.
28 European Parliament Resolution of 21 May 2008 on women and science (2007/2206(INI)).
29 For example, the gap between the EU employment rate of men and women widens with the arrival of dependent children. See Eurostat, ‘Employment rate of adults by sex, age groups, highest level of education attained, number of children and age of youngest child (%)’ [lfst_hheredch].
30 Ibid.
31 The European Commission is a partner of this project.

She Figures Handbook, 2015
Page 74
Computation method
Data needed
( ) Number of women researchers (R1 and R2 career stages) who – during their PhD – moved for at least three months to a country other than that where they attained (or will attain) their PhD: Unit=Total;
( ) Total number of women researchers (R1 and R2 career stages): Unit=Total;
( ) Number of men researchers (R1 and R2 career stages) who – during their PhD – moved for at least three months to a country other than that where they attained (or will attain) their PhD: Unit=Total;
( ) Total number of men researchers (R1 and R2 career stages): Unit=Total;
( ) Sampling weights for individual survey results, by country and field of science.
Source of data
European Commission: MORE Survey on mobility patterns and career paths of researchers
At present, there are two editions of the survey: MORE1 Survey (2009) and MORE2 Survey (2012). She Figures 2015 makes use of the MORE2 Survey. The MORE1 and MORE2 Surveys are not directly comparable due to changes in the design of the survey questionnaires. This is explained in more depth below.
Information on the MORE1 Survey is available here: http://www.researchersmobility.eu/
The database of results for the MORE2 Survey is publicly available at this address: http://www.more-2.eu/www/index.php?option=com_content&view=article&id=118&Itemid=125
Reports relating to the MORE2 Survey are available here: http://ec.europa.eu/euraxess/index.cfm/services/researchPolicies
Specifications
This indicator presents the percentage point difference in the percentage of women/men researchers (R1 and R2) who were ‘internationally mobile’ during their PhDs (using the definition provided in this indicator). It is calculated by subtracting women’s rate of mobility from men’s rate.
Before calculating this indicator, one must weight the survey results to increase their representativeness. To do this, encode the responses of interest to an easily understandable numerical format (for example, assign ‘1’ to cases where the respondent indicated s/he was internationally mobile, then ‘0’ to remaining responses). Apply sampling weights (by country and field of science) to redress sample representativeness (i.e. multiply the constructed 0–1 variable with the variable containing sampling weights).
Pre-calculated sampling weights (by country and field of science: ‘weihc’) are included in the MORE2 dataset.
Following the weighting phase, calculate the indicator as normal, using the weighted numbers.
Using the weighted values, perform these calculations: ℎ (R1andR2) = F /F ℎ (R1andR2) = M /M ℎ = (M /M ) − (F /F ) where:

She Figures Handbook, 2015
Page 75
i denotes international mobility (using the definition provided for this indicator);
w denotes that the values are weighted.
For example, refers to the number of internationally mobile women researchers (R1 and R2) (weighted, using the definition described above), whilst refers to the total number of men researchers (R1 and R2) (weighted).
For She Figures 2015, the MORE2 online database presented weighted survey results. As such, it was not necessary to perform the weighting phase when calculating this indicator.
In this indicator, the country of the researcher is the country of their PhD; that is, where the researcher is currently enrolled in a PhD programme or has previously obtained his or her PhD.
Definitions – Researchers, career stages and mobility
The MORE2 Survey applies the Frascati Manual definition of researchers as ‘professionals engaged in the conception or creation of new knowledge, products, processes, methods and systems and also in the management of the projects concerned’ (European Commission, 2013a). This indicator focuses on researchers in the higher education sector only.
The survey asks researchers to classify their career stage, using the categories defined in the European Framework for Research Careers:
• R1: First Stage Researcher (up to the point of PhD);
• R2: Recognised Researcher (PhD holders or equivalent who are not yet fully independent);
• R3: Established Researcher (researchers who have developed a level of independence); and
• R4: Leading Researcher (researchers leading their research area or field).
This indicator focuses on those who classified themselves as being in the R1 and R2 career phases.
In this indicator, researchers who are ‘internationally mobile’ are defined as those who have moved abroad for at least three months during their PhD to a country other than the one where they completed (or will obtain) their PhD. It is based on a direct question in the MORE2 Survey of Higher Education Institutions (Q42 in the 2012 questionnaire).
Comments/critical issues
• The first indicator on mobility was added to the She Figures in 2012, based on the MORE Survey (2009). This was ‘Proportion of mobile researchers by gender’. Due to changes in the design of the MORE Survey, this indicator has now been separated into two indicators, one focusing on mobility during their PhD – for researchers in the early career stages (R1 and R2 combined) – and another focusing on mobility in the last 10 years in the post-PhD phases (R2–R4).
• The changes to the MORE Survey have also resulted in a new definition of ‘mobile researchers’. In She Figures 2012, mobile researchers were defined as researchers who, in the last three years, had moved from the country where they had obtained their highest level of qualification to work as a researcher for at least three months in another country. The definition did not distinguish between career stages. This affects the comparability across different editions of the She Figures.
• Note that there are large differences in the distribution of researchers across different career stages, depending on the country.
• The selected method for the survey results is direct weighting, so that the multiplication of each variable with the weighting coefficient returns the reference population. Here, sampling weights were calculated using the estimated number of researchers in each field of science in a given country (2009 data). Note that the sampling error can be higher at subpopulation level (including for gender).
She Figures Handbook, 2015
Page 76
2.6.2. Sex differences for international mobility in post-PhD career stages, per country
Definition of indicator
The indicators present the percentage point difference in the proportion of women/men researchers who – in the last 10 years – have worked abroad for at least three months in a country other than the country where they attained their highest educational degree. It focuses on researchers in the post-PhD phases of their careers (phases R2–R4).
Rationale
In 2008, the European Parliament argued that ‘mobility is one of the crucial ways of developing and assuring research career advancement’.32 However, there are some concerns that women may be less mobile than men at certain stages of their life. For example, there are signs that women continue to bear the majority of childbearing responsibilities in the EU33 and – as the European Parliament warns – mobility ‘can be difficult to reconcile with family life’.34 According to the Gendered Innovations project, ‘gender roles that limit women’s mobility interfere with careers in science and engineering’ (DG Research, ‘Subtle bias’).35
This indicator aims to identify if there are indeed such differences in the mobility of women and men, focusing on researchers’ experience of mobility in their later career stages (after gaining a PhD).
Computation method
Data needed
( ) Number of women researchers (R2, R3 and R4 career stages combined) who – in the last 10 years – moved for at least three months to a country other than that where they attained their highest educational qualification: Unit=Total;
( ) Total number of women researchers (R2, R3 and R4 career stages combined): Unit=Total;
( ) Number of men researchers (R2, R3 and R4 career stages combined) who – in the last 10 years – moved for at least three months to a country other than that where they attained their highest educational qualification: Unit=Total;
( ) Total number of men researchers (R2, R3 and R4 career stages combined): Unit=Total;
( ) Calibrated sampling weights for individual survey results, by country and field of science.
Source of data
European Commission: MORE Survey on mobility patterns and career paths of researchers
At present, there are two editions of the survey: MORE1 Survey (2009) and MORE2 Survey (2012). She Figures 2015 uses the MORE2 Survey. The MORE1 and MORE2 Surveys are not directly comparable due to changes in the design of the survey questionnaires. This is explained in more depth below.
Information on the MORE1 Survey is available here: http://www.researchersmobility.eu/
32 European Parliament resolution of 21 May 2008 on women and science (2007/2206(INI)).
33 For example, the gap between the EU employment rate of men and women widens with the arrival of dependent children. See Eurostat, ‘Employment rate of adults by sex, age groups, highest level of education attained, number of children and age of youngest child (%)’ [lfst_hheredch].
34 Ibid.
35 The European Commission is a partner of this project.
She Figures Handbook, 2015
Page 77
The database for the MORE2 Survey is publicly available at this address: http://www.more-2.eu/www/index.php?option=com_content&view=article&id=118&Itemid=125
Reports relating to the MORE2 Survey are available here: http://ec.europa.eu/euraxess/index.cfm/services/researchPolicies
Specifications
This indicator presents the percentage point difference in the percentage of women/men researchers (R2, R3 and R4 combined) who were ‘internationally mobile’ in the last 10 years (using the definition provided in this indicator). It is calculated by subtracting women’s rate of mobility from that of men.
Before calculating this indicator, one must weight the survey results to increase their representativeness. To do this, encode the responses of interest to an easily understandable numerical format (for example, assign ‘1’ to cases where the respondent indicated s/he was internationally mobile, then ‘0’ to remaining responses). Apply calibrated sampling weights (by country and field of science) to redress sample representativeness (i.e. multiply the constructed 0–1 variable with a variable containing sampling weights).
Pre-calculated and calibrated sampling weights (by country and field of science) are included in the MORE2 dataset as ‘calwq47hc’.
Following the weighting phase, calculate the indicator as normal. Using the weighted values, perform these calculations: ℎ (R2, R3andR4) = F /F ℎ (R2, R3andR4) = M /M − ℎ = (M /M ) − (F /F )
where:
i denotes international mobility (using the definition provided for this indicator);
w denotes that the values are weighted.
For example, refers to the number of internationally mobile women researchers (R2–R4) (weighted, using definition described above), whilst refers to the total number of men researchers (R2–R4) (weighted).
For She Figures 2015, the MORE2 online database presented weighted survey results. As such, it was not necessary to perform the weighting phase when calculating this indicator. However, the above steps were followed when calculating the EU-28 aggregate.
Note that She Figures 2015 computed this indicator for each country. The country of the researcher is their panel country (i.e. the country identified as their country of current employment during the collection of researcher contact details before the survey).
Definitions – Researchers, career stages and mobility
The MORE2 Survey applies the Frascati Manual definition of researchers as ‘professionals engaged in the conception or creation of new knowledge, products, processes, methods and systems and also in the management of the projects concerned’ (European Commission, 2013a). This indicator focuses on researchers in the higher education sector only.
The MORE2 Survey asks researchers to classify their career stage using the categories defined in the European Framework for Research Careers:
She Figures Handbook, 2015
Page 78
• R1: First Stage Researcher (up to the point of PhD);
• R2: Recognised Researcher (PhD holders or equivalent who are not yet fully independent);
• R3: Established Researcher (researchers who have developed a level of independence); and
• R4: Leading Researcher (researchers leading their research area or field).
This indicator focuses on those who classified themselves as being in the R2, R3 and R4 phases (combined).
In this indicator, researchers who are ‘internationally mobile’ are defined as those who have worked abroad for more than three months at least once in the last 10 years, since obtaining their highest educational qualification (PhD or other). It is based on a direct question in the MORE2 Survey of Higher Education Institutions (Q47 in the 2012 questionnaire).
Comments/critical issues
• The first indicator on mobility was added to the She Figures in 2012, based on the MORE Survey (2009). This was ‘Proportion of mobile researchers by gender’. Due to changes in the design of the MORE Survey, this indicator has now been separated into two indicators, one focusing on mobility during PhD for researchers in the early career stages (R1 and R2 combined) and another focusing on mobility in the last 10 years for researchers in the post-PhD phases (R2–R4).
• The changes to the MORE Survey have also resulted in a new definition of international mobility. In She Figures 2012, mobile researchers were defined as researchers who, in the last three years, had moved from the country of their highest level of qualification to work as a researcher for at least three months in another country. The definition did not distinguish between career stages. This affects the comparability across different editions of the She Figures.
• Following the main data-collection phase of the MORE2 Survey, an additional survey was conducted to correct for non-response and seasonal effects in the answering patterns to key questions, including the question of interest in this indicator (Q47). The calibrated sampling weights in the MORE2 dataset are based on these findings.
• Note that there are large differences in the distribution of researchers across different career stages, depending on the country.
• The selected method for the survey results is direct weighting, so that the multiplication of each variable with the weighting coefficient returns the reference population. Here, sampling weights were calculated using the estimated number of researchers in each field of science in a given country (2009 data). Note that the sampling error can be higher at subpopulation level (including for gender).
2.6.3. Part-time employment of researchers in the higher education sector (HES) out of total researcher population, by sex
Definition of indicator
This indicator compares the part-time employment rate amongst women researchers and the part-time employment rate amongst men researchers (each calculated as a percentage of the research population of women and men respectively). It covers the higher education sector (HES) only.
Rationale
Directive 2006/54/EC of 5 July 2006 lays down the principle of equal treatment of men and women in the EU, including in relation to their working conditions, access to promotion and occupational security schemes. According to the Council of the EU, part-time employment has many potential benefits, such as ‘facilitating labour force participation’, as well as offering ‘an opportunity for both women and men to enhance their well-being, improve work/life balance and contribute to a more gender equal society’ (Council of the European Union, 2014). At the same time, the Council warns of its ‘potential to exacerbate gender differences in pay, working conditions and career advancement over the life cycle’.
She Figures Handbook, 2015
Page 79
As a first step towards understanding this situation better, this indicator aims to consider the relative propensity of women and men researchers to be employed part-time.
Computation method
Data needed
( ) Total number of women researchers who indicated that they worked part-time, combining all of these three categories: part-time (more than 50 %), part-time (50 %) and part-time (less than 50 %): Unit=Total;
( ) Total number of men respondents who indicated that they work part-time, combining all of these three categories: part-time (more than 50 %), part-time (50 %) and part-time (less than 50 %): Unit=Total;
(F) Total number of women researchers who indicated their employment status: Unit=Total;
(M) Total number of men researchers who indicated their employment status: Unit=Total;
(S) Sampling weights for individual survey results, by country and field of science (‘weihc’, available through the survey dataset).
Source of data
European Commission: MORE Survey on mobility patterns and career paths of researchers
At present, there are two editions of the survey: MORE1 Survey (2009) and MORE2 Survey (2012). She Figures 2015 makes use of MORE2 Survey. The MORE1 and MORE2 Surveys are not directly comparable due to changes in the design of the survey questionnaires. This is explained in more depth below.
Information on the MORE1 Survey is available here: http://www.researchersmobility.eu/
The database for the MORE2 Survey is publicly available at this address: http://www.more-2.eu/www/index.php?option=com_content&view=article&id=118&Itemid=125
Reports relating to the MORE2 Survey are available here: http://ec.europa.eu/euraxess/index.cfm/services/researchPolicies
Specifications
This indicator compares the proportion of the women researcher population that work part-time with the proportion of the men researcher population that work part-time.
Before calculating this indicator, one must weight the survey results to increase their representativeness. To do this, encode the responses of interest to an easily understandable numerical format (for example, assign ‘1’ to cases where the respondent indicated s/he worked part-time, then ‘0’ to remaining responses). Apply sampling weights (by country and field of science) to redress sample representativeness (i.e. multiply the constructed 0–1 variable with a variable containing sampling weights).
Pre-calculated sampling weights (by country and field of science: ‘weihc’) are included in the MORE2 dataset.
Following the weighting phase, calculate the indicator as normal, but using the weighted numbers. Perform these calculations: ℎ ℎ ℎ ℎ = F /F ℎ ℎ ℎ ℎ = M /M
where:
She Figures Handbook, 2015
Page 80
p denotes part-time employment;
w denotes that the values are weighted.
For example, indicates the number of part-time women researchers in the higher education sector (weighted), whilst indicates the number of men researchers in the higher education sector (weighted).
In She Figures 2015, the indicator was calculated for each country. Each researcher’s country is his/her country of current employment (Q20). Organisations based in countries outside of the She Figures were excluded.
For She Figures 2015, the MORE2 online database presented weighted survey results. As such, it was not necessary to calculate this indicator. However, the EU-28 aggregate was calculated, following the steps described above.
Definitions
The MORE2 Survey applies the Frascati Manual definition of researchers as ‘professionals engaged in the conception or creation of new knowledge, products, processes, methods and systems and also in the management of the projects concerned’ (European Commission, 2013a). This indicator focuses on researchers in the higher education sector only.
The responses of interest in the survey are those given to the question ‘Type of position’ (labelled as Q22 in the MORE2 Survey, 2012–2013). In this indicator, the three categories of part-time employment (more than 50 %, 50 %, less than 50 %) are grouped together to form a single ‘part-time’ category.
This indicator covers researchers at all career stages.
Comments/critical issues
• The results can give an indication of the relative working conditions of men and women researchers, but it is worth bearing in mind that this indicator does not explore the reasons behind potential differences, nor does it provide a value judgement as to relative merits of working part-time or full-time. Using this indicator alone, it is not possible to judge the extent to which part-time employment is a free choice or a constraint.
• The selected method for the survey results is direct weighting, so that the multiplication of each variable with the weighting coefficient returns the reference population. Here, sampling weights were calculated using the estimated number of researchers in each field of science in a given country (2009 data). Note that the sampling error can be higher at subpopulation level (including for gender).
2.6.4. ‘Precarious’ working contracts of researchers in HES out of total researcher population, by sex
Definition of indicator
This indicator compares the proportion of women researchers and the proportion of men researchers on ‘precarious working contracts’ (each calculated as a percentage of the research population of women and men respectively) in the higher education sector (HES).
Rationale
Directive 2006/54/EC of 5 July 2006 lays down the principle of equal treatment of men and women in the EU, including in relation to their working conditions, access to promotion and occupational security schemes. Within this picture, the role of ‘precarious working contracts’, such as fixed-term contracts and student contracts, remains debated, although some academics have warned of their association with lower job quality, particularly when it comes to reduced job security and wages. This indicator aims to measure the relative propensity of women and men researchers to be employed on such contracts.
She Figures Handbook, 2015
Page 81
Computation method
Data needed ( ) Total number of women researchers who indicated that they worked on a ‘precarious’ working contract: Unit=Total; ( ) Total number of men researchers who indicated that they worked on a ‘precarious’ working contract: Unit=Total; ( ) Total number of women researchers who indicated their contractual status: Unit=Total; ( ) Total number of men researchers who indicated their contractual status: Unit=Total; ( ) Sampling weights for individual survey results, by country and field of science (‘weihc’), available through the MORE dataset.
Source of data
European Commission: MORE Survey on mobility patterns and career paths of researchers
At present, there are two editions of the survey: the MORE1 Survey (2009) and MORE2 Survey (2012). She Figures 2015 makes use of MORE2 Survey. The MORE1 and MORE2 Surveys are not directly comparable due to changes in the design of the survey questionnaires. This is explained in more depth below.
Information on the MORE1 Survey is available here: http://www.researchersmobility.eu/
The database for the MORE2 Survey is publicly available at this address: http://www.more-2.eu/www/index.php?option=com_content&view=article&id=118&Itemid=125
Reports relating to the MORE2 Survey are available here: http://ec.europa.eu/euraxess/index.cfm/services/researchPolicies
Specifications
Consistent with the approach followed in the MORE2 Survey Final Report (European Commission, 2013b), this indicator considers the following researchers to have precarious working contracts:
• Researchers who indicated they have a fixed-term contract of one year or less;
• Researchers who indicated they have no contract;
• Researchers who indicated they have an ‘other’ type of contract (often associated with student status), unless they stated explicitly that they had a contract of indefinite duration.
This indicator compares the proportion of women researchers with precarious contracts with the proportion of the men researchers in the same position.
Before calculating this indicator, one must weight the survey results to increase their representativeness. To do this, encode the responses of interest to an easily understandable numerical format (for example, assign ‘1’ to cases where the respondent indicated s/he worked on a precarious contract, then ‘0’ to remaining responses). Apply sampling weights (by country and field of science) to redress sample representativeness (i.e. multiply the constructed 0–1 variable with a variable containing sampling weights).
Pre-calculated sampling weights (by country and field of science: ‘weihc’) are included in the MORE2 dataset.
Following the weighting phase, calculate the indicator as normal, but using the weighted numbers. Perform these calculations: ℎ ℎ ℎ ℎ = _ / _

She Figures Handbook, 2015
Page 82
ℎ ℎ ℎ ℎ = /
where:
i denotes employment on a ‘precarious’ working contract;
w denotes that the values are weighted.
For example, indicates the number of women researchers on precarious contracts in the higher education sector (weighted), whilst indicates the number of men researchers in the higher education sector (weighted).
In She Figures 2015, the indicator was calculated for each country. Each researcher’s country is his/her country of current employment (Q20). Organisations based in countries outside of the She Figures were excluded.
For She Figures 2015, the MORE2 online database did not present all required data online (see below), meaning it was necessary to request the survey dataset from the European Commission and perform the weighting phase before calculating this indicator.
Definitions
The MORE2 Survey applies the Frascati Manual definition of researchers as ‘professionals engaged in the conception or creation of new knowledge, products, processes, methods and systems and also in the management of the projects concerned’ (European Commission, 2013a). This indicator focuses on researchers in the higher education sector only.
The responses of interest in the survey are those given to the question ‘Type of contract’ (labelled as Q21 in the MORE2 Survey, 2013). The possible answers for respondents were: ‘No contract (regarded as a student)’; ‘Fixed term <= 1 year’; ‘Fixed term >1–2 years’; ‘Fixed term >2–4 years’; ‘Fixed term >4 years’; ‘Permanent contract’; ‘Self-employed’; ‘Other’.
This indicator covers researchers at all career stages.
Comments/critical issues
• The results can give an indication of the relative working conditions for men and women researchers, but it is worth bearing in mind that this indicator does not explore the reasons behind potential differences, nor does it provide a value judgement as to relative merits of working on different contracts. Using this indicator alone, it is not possible to judge the extent to which the use of different contracts is a free choice or a constraint.
• Note that the online MORE2 database groups together the fixed-term contract types into a single category of ‘fixed term’ and does not present the ‘Other’ answers.
• The selected method for the survey results is direct weighting, so that the multiplication of each variable with the weighting coefficient returns the reference population. Here, sampling weights were calculated using the estimated number of researchers in each field of science in a given country (2009 data). Note that the sampling error can be higher at subpopulation level (including for gender).
Women in Science (WiS) questionnaire 2.7.
Content-based rationale
These indicators investigate the under-representation of women at the higher levels of the academic career path and in positions of power (known as the ‘glass ceiling’ phenomenon – whereby the representation of women decreases as the seniority of the role increases). It covers a wide range of sectors, particularly in science and technology, as well as the differences in success in obtaining research funding, by gender. Indicators computed include the proportion of women academic staff by grade and total; the proportion of women grade A staff by main field of science; the distribution of grade A staff across fields of science by sex; and the Glass Ceiling Index.

She Figures Handbook, 2015
Page 83
Broad overview of the source
The Women in Science (WiS) questionnaires were sent to Statistical Correspondents from 41 countries and provide data in support of the sets of indicators investigating the under-representation of women at the higher levels of the academic career path, as detailed in the rationale above.
2.7.1. Proportion of women academic staff, by grade
Definition of indicator
This indicator presents the number of women occupying positions at different grades of an academic career for a given year.
Rationale
By looking at the proportion of women present at each grade, one can track their progress in advancing through the stages of the academic career and identify the levels at which women are lost. Indeed, in 2012, DG Research and Innovation recognised that, despite accounting for nearly 60 % of all university graduates in the European Union (i.e. EU-27 in 2012) (DG Research and Innovation, 2012d; DG Research, 2009b; original data from Eurostat, educ_grad5), women were still severely under-represented at the higher levels of the academic career path. Indeed, only 18 % of full professors, 13 % of heads of higher education institutions and 22 % of board members in research decision-making are women (Ibid.). As such, it is interesting to monitor the number of women present at each level of academia in order to observe whether there is progress towards reducing vertical segregation (‘the leaky pipeline’), defined as the under- or over-representation of a clearly identifiable group of workers in occupations or sectors at the top of an ordering based on ‘desirable’ attributes (EGGE, 2009).
Computation method
Data needed
(FGY) Number of women academic staff at a given grade G (G = A, B, C, D, or all) for a given year Y: Unit=Head count;
(MGY) Number of men academic staff at a given grade G (G = A, B, C, D, or all) for a given year Y: Unit=Head count.
Source of data
For FG and MG: DG Research and Innovation – WiS – Women in Science database
Specifications = FF +M
Senior grades / Academic staff
The grades presented in She Figures are based upon national mappings according to the following definitions:
(A) The single highest grade/post at which research is normally conducted;
(B) Researchers working in positions not as senior as the top position (A) but more senior than newly qualified PhD holders (ISCED 6);
(C) The first grade/post into which a newly qualified PhD graduate would normally be recruited;
(D) Either postgraduate students not yet holding a PhD degree who are engaged as researchers, or researchers working in posts that do not normally require a PhD.
Head count
The head count unit of measurement for R&D personnel comes from the Frascati Manual (OECD, 2002):
She Figures Handbook, 2015
Page 84
HC (§329): Head count. The number of persons engaged in R&D at a given date or the average number of persons engaged in R&D during the (calendar) year or the total number of persons engaged in R&D during the (calendar) year.
Comments/critical issues
• The classification of academic positions into A, B, C and D grades may vary across countries. This should be taken into account when comparing or aggregating statistics.
• It is important to note that these data are not always completely cross-country comparable as the seniority of grades is not yet part of a formal international classification. Furthermore, it is not always possible to distinguish research staff from teaching staff, although the target population for ‘academic staff’ is researchers in higher education institutions (excluding staff involved in teaching or administration only and not at all in research).
2.7.2. Proportion of women in grade A academic positions
Definition of indicator
This indicator presents the proportion of women occupying the highest-level academic positions in a given year.
Rationale
By comparing different years, this indicator allows one to track the progress made with regard to women’s presence at the highest level of the academic career path. Such a comparison is particularly relevant given that in 2012, DG Research and Innovation recognised that, despite accounting for almost 60 % of all university graduates in the European Union, women were still severely under-represented at the higher levels of the academic career path. Indeed, only 18 % of full professors, 13 % of heads of higher education institutions and 22 % of board members in research decision-making are women (DG Research and Innovation, 2012d; DG Research, 2009b). As such, it is interesting to monitor the number of women present at each level of academia in order to observe whether there is progress towards reducing vertical segregation (‘the leaky pipeline’), defined as the under- or over-representation of a clearly identifiable group of workers in occupations or sectors at the top of an ordering based on ‘desirable’ attributes (EGGE, 2009).
Computation method
Data needed
(FAY) Number of women in grade A academic positions for a given year Y: Unit=Head count;
(MAY) Number of men in grade A academic positions for a given year Y: Unit=Head count.
Source of data
For FAY and MAY: DG Research and Innovation – WiS – Women in Science database
Specifications = FF + M
Senior grades / Academic staff
The grades presented in She Figures are based upon national mappings according to the following definitions:
(A) The single highest grade/post at which research is normally conducted.
Head count
The head count unit of measurement for R&D personnel comes from the Frascati Manual (OECD, 2002):

She Figures Handbook, 2015
Page 85
HC (§329): Head count. The number of persons engaged in R&D at a given date or the average number of persons engaged in R&D during the (calendar) year or the total number of persons engaged in R&D during the (calendar) year.
Comments/critical issues
The classification of academic positions into grades may vary across countries. This should be taken into account when comparing or aggregating statistics.
It is important to note that these data are not always completely cross-country comparable as the seniority of grades is not yet part of a formal international classification. Furthermore, it is not always possible to distinguish research staff from teaching staff, although the target population for ‘academic staff’ is researchers in higher education institutions (excluding staff involved in teaching or administration only and not at all in research).
2.7.3. Grade A (%) amongst all academic staff, by sex
Definition of indicator
This indicator allows for a comparison of the number of men and women staff at the highest-level academic positions compared to the number of staff of the same sex across all academic positions, for a given year.
Rationale
As recognised by DG Research and Innovation in 2012, women are still severely under-represented at the higher levels of the academic career path (grade A), despite accounting for nearly 60 % of all university graduates in the European Union (i.e. EU-27 in 2012) (DG Research and Innovation, 2012d; DG Research, 2009b). In this indicator, the low proportion of women grade A staff is compared to the overall number of women staff in academia, thereby correcting for the relative presence of women in academic positions overall. The advantage of such a calculation is that it moves beyond the absolute numbers of men and women in academic positions, which enhances comparability of the measure across different settings.
Computation method
Data needed
(FG) Number of women academic staff at a given grade G (G = A, or T [Total]) for a given year Y: Unit=Head count;
(MG) Number of men academic staff at a given grade G (G = A, or T [Total]) for a given year Y: Unit=Head count.
Source of data
For FG and MG: DG Research and Innovation – WiS – Women in Science database
Specifications = FF
= MM
Senior grades / Academic staff
The grades presented in She Figures are based upon national mappings according to the following definitions:
(A) The single highest grade/post at which research is normally conducted;
(B) Researchers working in positions not as senior as the top position (A) but more senior than newly qualified PhD holders (ISCED 6);
She Figures Handbook, 2015
Page 86
(C) The first grade/post into which a newly qualified PhD graduate would normally be recruited;
(D) Either postgraduate students not yet holding a PhD degree who are engaged as researchers, or researchers working in posts that do not normally require a PhD.
Head count
The head count unit of measurement for R&D personnel comes from the Frascati Manual (OECD, 2002):
HC (§329): Head count. The number of persons engaged in R&D at a given date or the average number of persons engaged in R&D during the (calendar) year or the total number of persons engaged in R&D during the (calendar) year.
Comments/critical issues
The classification of academic positions into A, B, C and D grades may vary across countries. This should be taken into account when comparing or aggregating statistics.
It is important to note that these data are not always completely cross-country comparable as the seniority of grades is not yet part of a formal international classification. Furthermore, it is not always possible to distinguish research staff from teaching staff, although the target population for ‘academic staff’ is researchers in higher education institutions (excluding staff involved in teaching or administration only and not at all in research).
2.7.4. Proportion of staff for all main fields of science, by sex and by grade
Definition of indicator
This indicator looks at the presence of women in top academic positions across different fields of study, allowing for the identification of the fields in which women are more or less present for a given year.
Rationale
As recognised by DG Research and Innovation in 2012, women are still severely under-represented at the higher levels of the academic career path (grade A), despite accounting for nearly 60 % of all university graduates in the EU (DG Research and Innovation, 2012d; DG Research, 2009b; original data from Eurostat, educ_grad5). However, there may be some differences in the employment of women in top positions across different fields of science. As such, looking at the proportion of women in different positions of seniority reveals which fields of science have seen a more successful integration of women staff in top positions over time.
The field of science and engineering remains particularly prone to vertical segregation (‘the leaky pipeline’) (DG Research and Innovation, 2012c), defined as the under- or over-representation of a clearly identifiable group of workers in occupations or sectors at the top of an ordering based on ‘desirable’ attributes (EGGE, 2009). Indeed, in 2012, DG Research and Innovation recognised that women were still severely under-represented at the higher levels of the academic career path. Indeed, only 18 % of full professors, 13 % of heads of higher education institutions and 22 % of board members in research decision-making are women (DG Research and Innovation, 2012d; DG Research, 2009b). As such, it is interesting to monitor the number of women present at each level of academia in order to observe whether there is progress towards reducing vertical segregation.
Computation method
Data needed
(FASY) Number of women in a given seniority grade of academia in a main field of science for reference year Y: Unit=Head count;
(MASY) Number of men in a given seniority grade of academia in a main field of science for reference year Y: Unit=Head count.
(s) Denotes main fields of science:

She Figures Handbook, 2015
Page 87
(NS) Natural sciences −
(ET) Engineering and technology −
(MS) Medical sciences −
(AS) Agricultural sciences −
(SS) Social sciences −
(H) Humanities −
(Tot) Total of all fields of science −
Source of data
For FASY and MASY: DG Research and Innovation – WiS – Women in Science database
Specifications = FF + M
= MF + M
Senior posts / Academic staff
The grades presented in She Figures are based upon national mappings according to the following definitions:
(A) The single highest grade/post at which research is normally conducted;
(B) Researchers working in positions not as senior as the top position (A) but more senior than newly qualified PhD holders (ISCED 6);
(C) The first grade/post into which a newly qualified PhD graduate would normally be recruited;
(D) Either postgraduate students not yet holding a PhD degree who are engaged as researchers, or researchers working in posts that do not normally require a PhD.
Main fields of science
The Frascati Manual (OECD, 2002) provides definitions for the six main fields of science (p. 67). The following abbreviations are used:
• (NS) Natural sciences
• (ET) Engineering and Technology
• (MS) Medical sciences
• (AS) Agricultural sciences
• (SS) Social sciences
• (H) Humanities
The breakdown of researchers by field of science is according to the field in which they work and not according to the field of their qualification.
• SET fields of education = Science, maths and computing, and engineering, manufacturing and construction
• SET fields of science = Engineering and technology, natural sciences
Head count
The head count unit of measurement for R&D personnel comes from the Frascati Manual (OECD, 2002):
She Figures Handbook, 2015
Page 88
HC (§329): Head count. The number of persons engaged in R&D at a given date or the average number of persons engaged in R&D during the (calendar) year or the total number of persons engaged in R&D during the (calendar) year.
Comments/critical issues
The classification of academic positions into A, B, C and D grades may vary across countries. This should be taken into account when comparing or aggregating statistics. As a general rule, EU aggregates should not be presented by the She Figures research team, unless calculated by Eurostat.
It is important to note that these data are not always completely cross-country comparable as the seniority of grades is not yet part of a formal international classification. Furthermore, it is not always possible to distinguish research staff from teaching staff, although the target population for ‘academic staff’ is researchers in higher education institutions (excluding staff involved in teaching or administration only and not at all in research).
2.7.5. Distribution of grade A staff across fields of science, by sex
Definition of indicator
This indicator reveals differences in the distribution of men and women grade A staff across the different fields of science for a given year, by presenting the relative proportion of grade A staff of a given sex by field.
Rationale
As recognised by DG Research and Innovation in 2012, women are still severely under-represented at the higher levels of the academic career path (grade A), despite accounting for nearly 60 % of all university graduates in the European Union (i.e. EU-27 in 2012) (DG Research and Innovation, 2012d; DG Research, 2009b; original data from Eurostat, educ_grad5). Since this indicator corrects for the total number of grade A staff for each sex, it allows for a comparison of the fields of science in which each sex is more or less present in the top levels.
Computation method
Data needed
(FASY) Number of grade A women in the main field of science S for year Y: Unit=Head count;
(MASY) Number of grade A men in the main field of science S for year Y: Unit=Head count.
Source of data
For FASY and MASY: DG Research and Innovation – WiS – Women in Science database
Specifications = F∑ F
= M∑ M
Senior grades / Academic staff
The grades presented in She Figures are based upon national mappings according to the following definitions:
(A) The single highest grade/post at which research is normally conducted.
Main fields of science
The Frascati Manual (OECD, 2002) provides definitions for the six main fields of science (p. 67), which are included in this indicator:
She Figures Handbook, 2015
Page 89
• (NS) Natural sciences
• (ET) Engineering and technology
• (MS) Medical sciences
• (AS) Agricultural sciences
• (SS) Social sciences
• (H) Humanities
The breakdown of researchers by field of science is according to the field in which they work and not according to the field of their qualification.
Head count
The head count unit of measurement for R&D personnel comes from the Frascati Manual (OECD, 2002):
HC (§329): Head count. The number of persons engaged in R&D at a given date or the average number of persons engaged in R&D during the (calendar) year or the total number of persons engaged in R&D during the (calendar) year.
Comments/critical issues
• The classification of academic positions into A, B, C and D grades may vary across countries. This should be taken into account when comparing or aggregating statistics.
• It is important to note that these data are not always completely cross-country comparable as the seniority of grades is not yet part of a formal international classification. Furthermore, it is not always possible to distinguish research staff from teaching staff, although the target population for ‘academic staff’ is researchers in higher education institutions (excluding staff involved in teaching or administration only and not at all in research).
2.7.6. Glass Ceiling Index
Definition of indicator
The Glass Ceiling Index (GCI) is a relative index comparing the proportion of women in academia (grades A, B, and C) to the proportion of women in top academic positions (grade A positions; equivalent to full professorships in most countries), for a given year. The GCI can range from 0 to infinity. A GCI of 1 indicates that there is no difference between women and men in the chance of being promoted. A score of less than 1 means that women are over-represented at grade A level and a GCI score of more than 1 points towards a glass ceiling effect, meaning that women are under-represented in grade A positions. In other words, the interpretation of the GCI is that the higher the value, the stronger the glass ceiling effect and the more difficult it is for women to move into a higher position.
Rationale
Both the European Commission Database on Women and Men in Decision-making (DG Justice, ‘Database: Women and men in decision-making’) and the Gender Equality Index (EIGE, ‘Gender Equality Index’) demonstrate the under-representation of women in positions of power, across a wide range of sectors in the EU. The ‘glass ceiling’ phenomenon – whereby the representation of women decreases as the seniority of the role increases – is much debated in academic literature and wider society. Reasons put forward include the persistence of gender stereotypes and biases about women’s skills and role in society (leading to direct and indirect discrimination during their careers) (NPWDPE, 2012, p. 3; Liff & Ward, 2001); the ‘gatekeeper’ phenomenon, whereby leaders (often men) may act unconsciously to support the careers of those similar to themselves (Van den Brink, 2010; ENLEFGE, updated 2012, p. 26; NPWDPE, 2012, p. 3); working cultures that are not ‘gender-sensitive’;36 and, finally, gender differences in individual choices and behaviour (Belkin, 2003; Williams, 2007).
36 For example, the importance attributed to the working culture is reflected in the Inter-Parliamentary Union’s Plan of Action for Gender-Sensitive Parliaments (2012). Action Area 4 is ‘Institute or improve
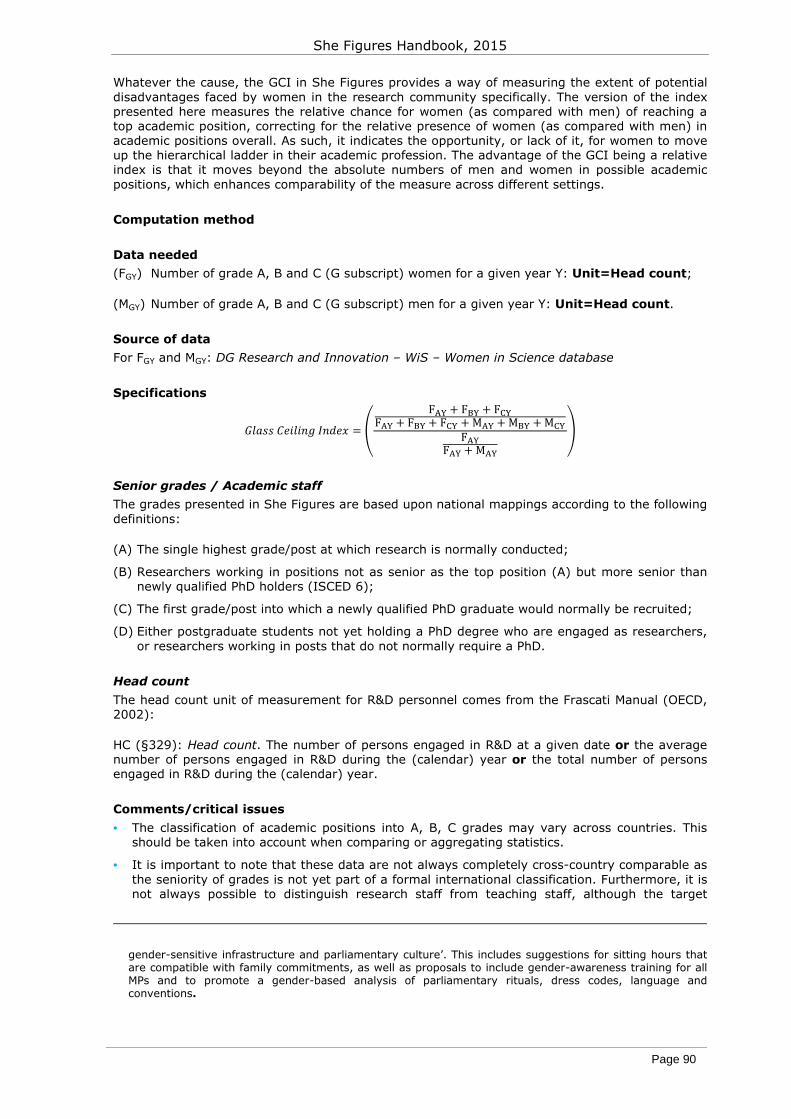
She Figures Handbook, 2015
Page 90
Whatever the cause, the GCI in She Figures provides a way of measuring the extent of potential disadvantages faced by women in the research community specifically. The version of the index presented here measures the relative chance for women (as compared with men) of reaching a top academic position, correcting for the relative presence of women (as compared with men) in academic positions overall. As such, it indicates the opportunity, or lack of it, for women to move up the hierarchical ladder in their academic profession. The advantage of the GCI being a relative index is that it moves beyond the absolute numbers of men and women in possible academic positions, which enhances comparability of the measure across different settings.
Computation method
Data needed
(FGY) Number of grade A, B and C (G subscript) women for a given year Y: Unit=Head count;
(MGY) Number of grade A, B and C (G subscript) men for a given year Y: Unit=Head count.
Source of data
For FGY and MGY: DG Research and Innovation – WiS – Women in Science database
Specifications
= F + F + FF + F + F + M +M +MFF + M
Senior grades / Academic staff
The grades presented in She Figures are based upon national mappings according to the following definitions:
(A) The single highest grade/post at which research is normally conducted;
(B) Researchers working in positions not as senior as the top position (A) but more senior than newly qualified PhD holders (ISCED 6);
(C) The first grade/post into which a newly qualified PhD graduate would normally be recruited;
(D) Either postgraduate students not yet holding a PhD degree who are engaged as researchers, or researchers working in posts that do not normally require a PhD.
Head count
The head count unit of measurement for R&D personnel comes from the Frascati Manual (OECD, 2002):
HC (§329): Head count. The number of persons engaged in R&D at a given date or the average number of persons engaged in R&D during the (calendar) year or the total number of persons engaged in R&D during the (calendar) year.
Comments/critical issues
• The classification of academic positions into A, B, C grades may vary across countries. This should be taken into account when comparing or aggregating statistics.
• It is important to note that these data are not always completely cross-country comparable as the seniority of grades is not yet part of a formal international classification. Furthermore, it is not always possible to distinguish research staff from teaching staff, although the target
gender-sensitive infrastructure and parliamentary culture’. This includes suggestions for sitting hours that are compatible with family commitments, as well as proposals to include gender-awareness training for all MPs and to promote a gender-based analysis of parliamentary rituals, dress codes, language and conventions.

She Figures Handbook, 2015
Page 91
population for ‘academic staff’ is researchers in higher education institutions (excluding staff involved in teaching or administration only and not at all in research).
2.7.7. Proportion of women grade A staff, by age group
Definition of indicator
This indicator presents the proportion of women at grade A level across different age groups (<35 years, 35–44 years, 45–54 years, and +55 years) for a given year.
Rationale
As recognised by DG Research and Innovation in 2012, women are still severely under-represented at the higher levels of the academic career path (grade A), despite accounting for nearly 60 % of all university graduates in the European Union (i.e. EU-27 in 2012) (DG Research and Innovation, 2012d; DG Research, 2009b; original data from Eurostat, educ_grad5). This indicator sheds light on the age profile of women in grade A research positions. By comparing these results with those for the indicator, ‘Number of academic staff (Grade A) by age group and sex’, one can compare potential differences in the age distribution of women and men working in the top positions. There are various reasons why this may be of interest. For example, according to Eurostat, a higher proportion of women are inactive due to caring responsibilities, including for children.37 This may reduce their participation in the labour market during the key childbearing years of a particular country.
Computation method
Data needed
(FAOY) Number of grade A women by age group O (<35 years of age, 35–44 years, 45–54 years, 55+ years) for a given year Y: Unit=Head count;
(MAOY) Number of grade A men by age group O (<35 years of age, 35–44 years, 45–54 years, 55+ years) for a given year Y: Unit=Head count.
Source of data
For FAOY and MAOY: DG Research and Innovation – WiS – Women in Science database
Specifications = FF +M
Senior grades / Academic staff
The grades presented in She Figures are based upon national mappings according to the following definition:
(A) The single highest grade/post at which research is normally conducted.
Head count
The head count unit of measurement for R&D personnel comes from the Frascati Manual (OECD, 2002):
HC (§329): Head count. The number of persons engaged in R&D at a given date or the average number of persons engaged in R&D during the (calendar) year or the total number of persons engaged in R&D during the (calendar) year.
37 In 2013, in the EU, 38.8 % of women (aged 25 to 49) who were inactive were in the position due to looking after children or incapacitated adults. For inactive men of the same age group, the rate was 3.9 %. See Eurostat, ‘Inactive Population – Main reason for not seeking employment – Distributions by sex and age (%)’, data table lfsa_igar.
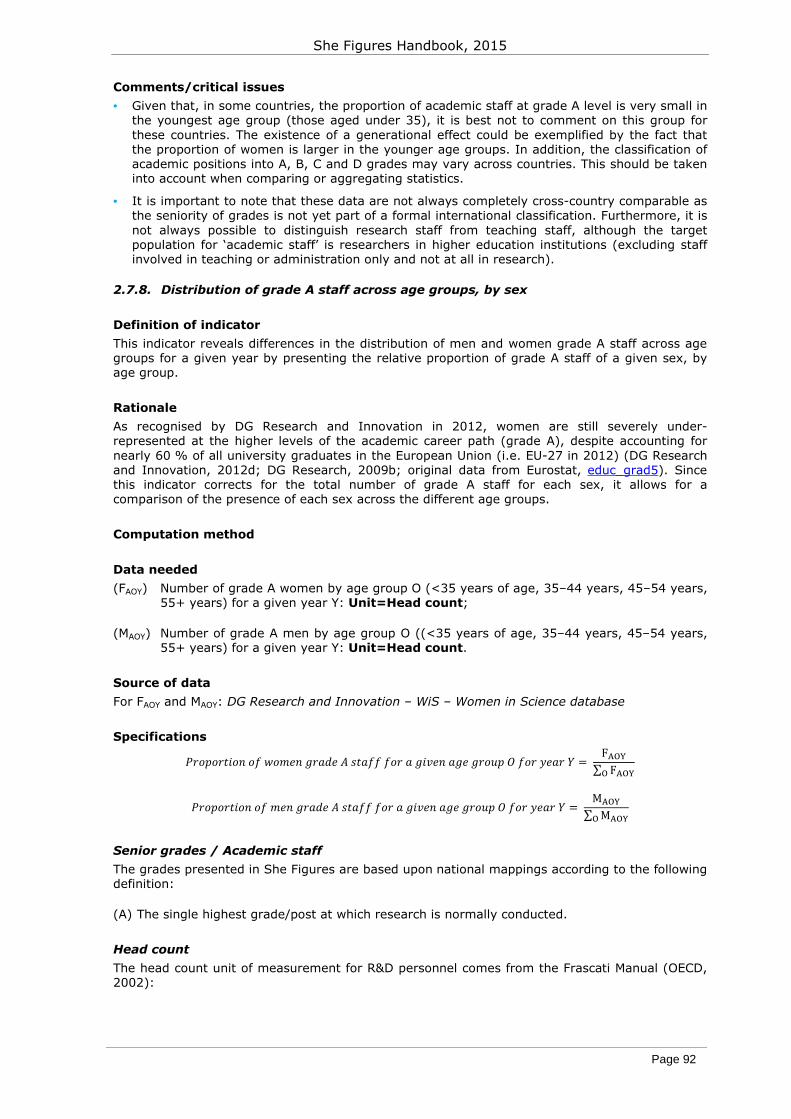
She Figures Handbook, 2015
Page 92
Comments/critical issues
• Given that, in some countries, the proportion of academic staff at grade A level is very small in the youngest age group (those aged under 35), it is best not to comment on this group for these countries. The existence of a generational effect could be exemplified by the fact that the proportion of women is larger in the younger age groups. In addition, the classification of academic positions into A, B, C and D grades may vary across countries. This should be taken into account when comparing or aggregating statistics.
• It is important to note that these data are not always completely cross-country comparable as the seniority of grades is not yet part of a formal international classification. Furthermore, it is not always possible to distinguish research staff from teaching staff, although the target population for ‘academic staff’ is researchers in higher education institutions (excluding staff involved in teaching or administration only and not at all in research).
2.7.8. Distribution of grade A staff across age groups, by sex
Definition of indicator
This indicator reveals differences in the distribution of men and women grade A staff across age groups for a given year by presenting the relative proportion of grade A staff of a given sex, by age group.
Rationale
As recognised by DG Research and Innovation in 2012, women are still severely under-represented at the higher levels of the academic career path (grade A), despite accounting for nearly 60 % of all university graduates in the European Union (i.e. EU-27 in 2012) (DG Research and Innovation, 2012d; DG Research, 2009b; original data from Eurostat, educ_grad5). Since this indicator corrects for the total number of grade A staff for each sex, it allows for a comparison of the presence of each sex across the different age groups.
Computation method
Data needed
(FAOY) Number of grade A women by age group O (<35 years of age, 35–44 years, 45–54 years, 55+ years) for a given year Y: Unit=Head count;
(MAOY) Number of grade A men by age group O ((<35 years of age, 35–44 years, 45–54 years, 55+ years) for a given year Y: Unit=Head count.
Source of data
For FAOY and MAOY: DG Research and Innovation – WiS – Women in Science database
Specifications = F∑ F
= M∑ M
Senior grades / Academic staff
The grades presented in She Figures are based upon national mappings according to the following definition:
(A) The single highest grade/post at which research is normally conducted.
Head count
The head count unit of measurement for R&D personnel comes from the Frascati Manual (OECD, 2002):
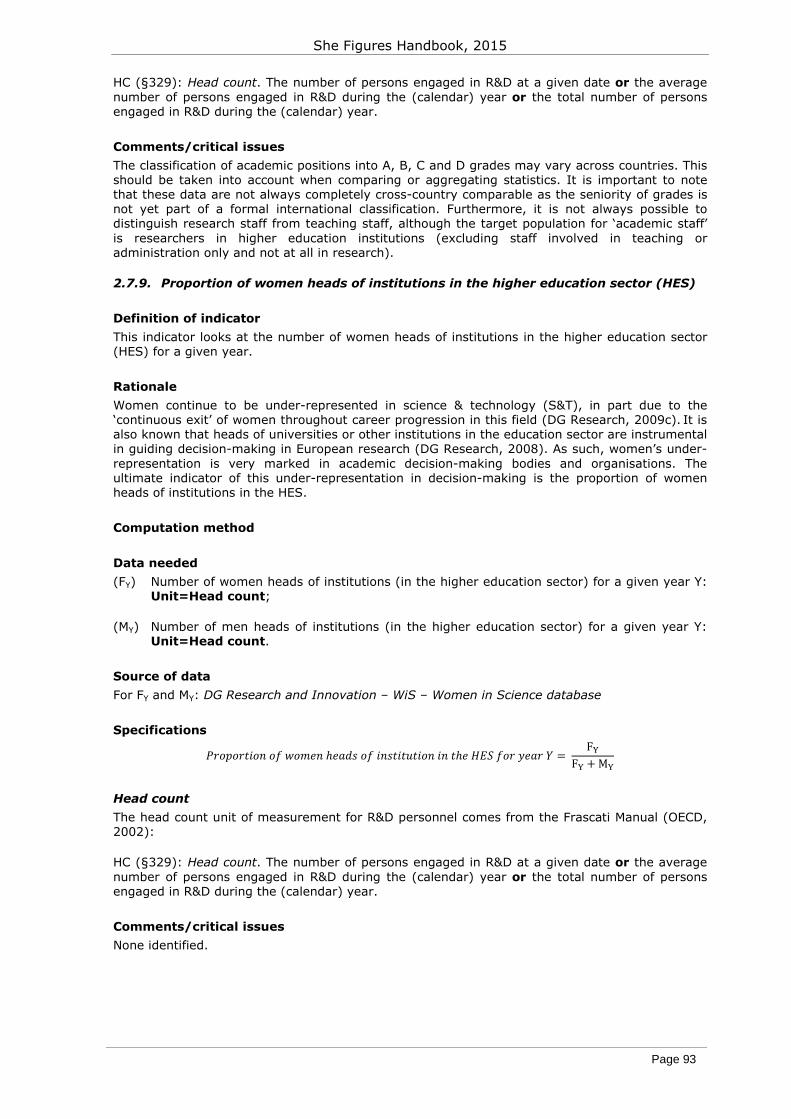
She Figures Handbook, 2015
Page 93
HC (§329): Head count. The number of persons engaged in R&D at a given date or the average number of persons engaged in R&D during the (calendar) year or the total number of persons engaged in R&D during the (calendar) year.
Comments/critical issues
The classification of academic positions into A, B, C and D grades may vary across countries. This should be taken into account when comparing or aggregating statistics. It is important to note that these data are not always completely cross-country comparable as the seniority of grades is not yet part of a formal international classification. Furthermore, it is not always possible to distinguish research staff from teaching staff, although the target population for ‘academic staff’ is researchers in higher education institutions (excluding staff involved in teaching or administration only and not at all in research).
2.7.9. Proportion of women heads of institutions in the higher education sector (HES)
Definition of indicator
This indicator looks at the number of women heads of institutions in the higher education sector (HES) for a given year.
Rationale
Women continue to be under-represented in science & technology (S&T), in part due to the ‘continuous exit’ of women throughout career progression in this field (DG Research, 2009c). It is also known that heads of universities or other institutions in the education sector are instrumental in guiding decision-making in European research (DG Research, 2008). As such, women’s under-representation is very marked in academic decision-making bodies and organisations. The ultimate indicator of this under-representation in decision-making is the proportion of women heads of institutions in the HES.
Computation method
Data needed
(FY) Number of women heads of institutions (in the higher education sector) for a given year Y: Unit=Head count;
(MY) Number of men heads of institutions (in the higher education sector) for a given year Y: Unit=Head count.
Source of data
For FY and MY: DG Research and Innovation – WiS – Women in Science database
Specifications ℎ ℎ = FF +M
Head count
The head count unit of measurement for R&D personnel comes from the Frascati Manual (OECD, 2002):
HC (§329): Head count. The number of persons engaged in R&D at a given date or the average number of persons engaged in R&D during the (calendar) year or the total number of persons engaged in R&D during the (calendar) year.
Comments/critical issues
None identified.
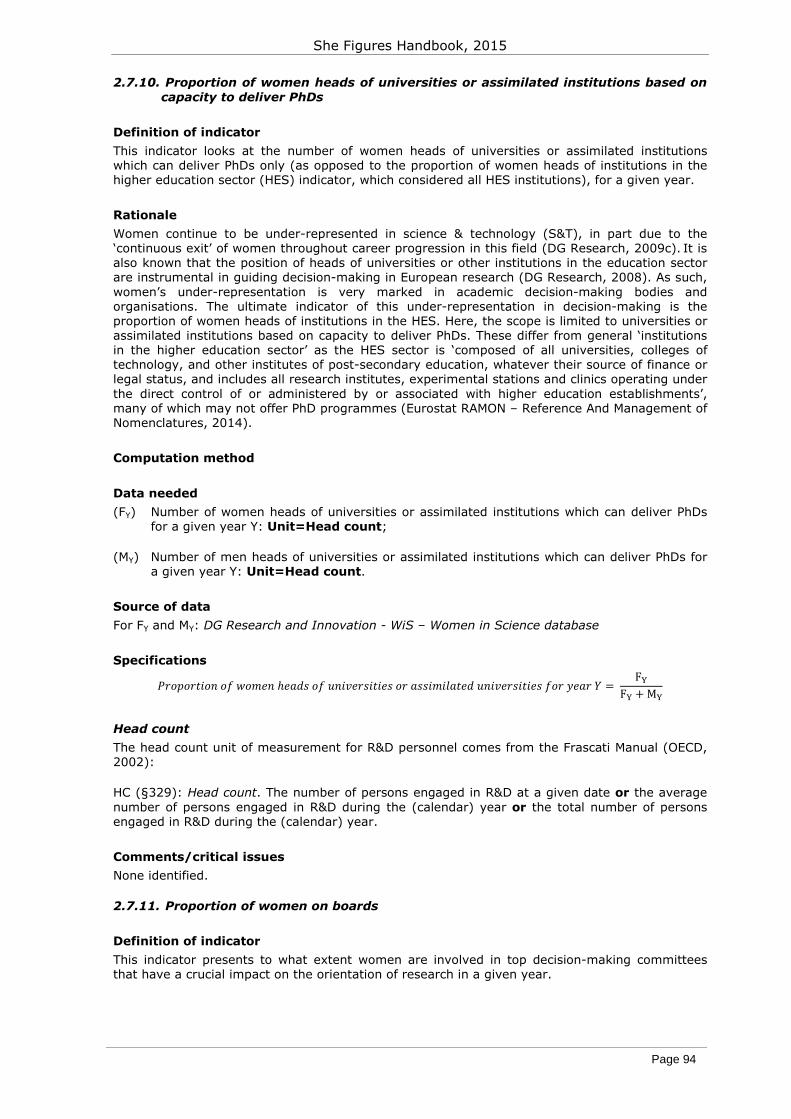
She Figures Handbook, 2015
Page 94
2.7.10. Proportion of women heads of universities or assimilated institutions based on capacity to deliver PhDs
Definition of indicator
This indicator looks at the number of women heads of universities or assimilated institutions which can deliver PhDs only (as opposed to the proportion of women heads of institutions in the higher education sector (HES) indicator, which considered all HES institutions), for a given year.
Rationale
Women continue to be under-represented in science & technology (S&T), in part due to the ‘continuous exit’ of women throughout career progression in this field (DG Research, 2009c). It is also known that the position of heads of universities or other institutions in the education sector are instrumental in guiding decision-making in European research (DG Research, 2008). As such, women’s under-representation is very marked in academic decision-making bodies and organisations. The ultimate indicator of this under-representation in decision-making is the proportion of women heads of institutions in the HES. Here, the scope is limited to universities or assimilated institutions based on capacity to deliver PhDs. These differ from general ‘institutions in the higher education sector’ as the HES sector is ‘composed of all universities, colleges of technology, and other institutes of post-secondary education, whatever their source of finance or legal status, and includes all research institutes, experimental stations and clinics operating under the direct control of or administered by or associated with higher education establishments’, many of which may not offer PhD programmes (Eurostat RAMON – Reference And Management of Nomenclatures, 2014).
Computation method
Data needed
(FY) Number of women heads of universities or assimilated institutions which can deliver PhDs for a given year Y: Unit=Head count;
(MY) Number of men heads of universities or assimilated institutions which can deliver PhDs for a given year Y: Unit=Head count.
Source of data
For FY and MY: DG Research and Innovation - WiS – Women in Science database
Specifications ℎ = FF + M
Head count
The head count unit of measurement for R&D personnel comes from the Frascati Manual (OECD, 2002):
HC (§329): Head count. The number of persons engaged in R&D at a given date or the average number of persons engaged in R&D during the (calendar) year or the total number of persons engaged in R&D during the (calendar) year.
Comments/critical issues
None identified.
2.7.11. Proportion of women on boards
Definition of indicator
This indicator presents to what extent women are involved in top decision-making committees that have a crucial impact on the orientation of research in a given year.

She Figures Handbook, 2015
Page 95
Rationale
Since research funding applications are reviewed by scientific boards, the success of women in this process depends on the senior academics that make such decisions, who are often men. It is important to include women in this ‘gate-keeping’ procedure in order to ensure equal access to funding (DG Research, 2008; Bagihole, 2005). Given that both advisory and executive boards have considerable decision-making power, this indicator assesses the proportion of women sitting on such boards in order to further investigate decision-making by women in academic careers.
Computation method
Data needed
(FY) Number of women on boards for a given year Y: Unit=Head count;
(MY) Number of men on boards for a given year Y: Unit=Head count.
The list of boards provided by Statistical Correspondents is given as an Annex in the main She Figures publication.
Source of data
For FY and MY: DG Research and Innovation – WiS – Women in Science database
Specifications = FF + M
Head count
The head count unit of measurement for R&D personnel comes from the Frascati Manual (OECD, 2002):
HC (§329): Head count. The number of persons engaged in R&D at a given date or the average number of persons engaged in R&D during the (calendar) year or the total number of persons engaged in R&D during the (calendar) year.
Comments/critical issues
No common definition of boards exists and the number of boards varies significantly between countries. However, in an attempt to harmonise the data on boards provided by Statistical Correspondents of different countries, and after a consultation process, decisions were taken to limit the scope to boards of umbrella national research organisations, as opposed to research organisations operating in a particular country. Furthermore, it was requested that the metadata submitted should distinguish between boards of organisations performing research and the boards of organisations that are funding research, although both are included in the final computations.
2.7.12. Funding success rate difference between women and men
Definition of indicator
This indicator presents research funding success-rate differences between women and men. A positive difference means that men have a higher success rate whereas a negative difference means that women have a higher success rate.
Rationale
The European Research Council has recognised that imbalances persist in the success of women in their calls for funding, and that these imbalances vary across countries (DG Research and Innovation, 2012a). There is also a marked difference in the propensity of women to apply for funding (DG Research, 2009a). As such, this indicator looks at the differences in the success rate of men and women when applying for research funding. The calculation of a success rate rather than the use of raw numbers allows one to normalise for the total number of applications.

She Figures Handbook, 2015
Page 96
Computation method
Data needed
(FAY) Number of women applicants for research funding for a given year Y: Unit=Head count;
(FBY) Number of women beneficiaries for research funding for a given year Y: Unit=Head count;
(MAY) Number of men applicants for research funding for a given year Y: Unit=Head count;
(MBY) Number of men beneficiaries for research funding for a given year Y: Unit=Head count.
The list of boards provided by Statistical Correspondents is given as an Annex in the main She Figures publication.
Source of data
For FAY, FBY, MAY and MBY: DG Research and Innovation – WiS – Women in Science database
Specifications = MM − FF
Head count
The head count unit of measurement for R&D personnel comes from the Frascati Manual (OECD, 2002):
HC (§329): Head count. The number of persons engaged in R&D at a given date or the average number of persons engaged in R&D during the (calendar) year or the total number of persons engaged in R&D during the (calendar) year.
Comments/critical issues
No common definition of funds exists and the total number of funds varies significantly between the countries and over the time period being considered. However, in an attempt to harmonise the data on funds provided by Statistical Correspondents of different countries, it was requested that data should cover all publicly managed research funds (funds granted by institutions in the public sector, excluding private sector funding).
2.7.13. Funding success rate difference between women and men, by field of science
Definition of indicator
This indicator presents research funding success-rate differences between women and men across different fields of science. A positive difference means that men have a higher success rate whereas a negative difference means that women have a higher success rate.
Rationale
The European Research Council has recognised that imbalances persist in the success of women in their calls for funding, and that these imbalances vary across countries (DG Research and Innovation, 2012a). There is also a marked difference in the propensity of women to apply for funding (DG Research, 2009a). As such, this indicator looks at the differences in the success rate of men and women when applying for research funding. The calculation of a success rate rather than the use of raw numbers allows one to normalise for the total number of applications. This indicator specifically looks at these differences across different fields of science.

She Figures Handbook, 2015
Page 97
Computation method
Data needed
(FASY) Number of women applicants for research funding for a given year Y in a given field of science S: Unit=Head count;
(FBSY) Number of women beneficiaries for research funding for a given year Y in a given field of science S: Unit=Head count;
(MASY) Number of men applicants for research funding for a given year Y in a given field of science S: Unit=Head count;
(FBSY) Number of men beneficiaries for research funding for a given year Y in a given field of science S: Unit=Head count.
The list of boards provided by Statistical Correspondents is given as an Annex in the main She Figures publication.
Source of data
For FASY, FBSY, MASY and MBSY: DG Research and Innovation – WiS – Women in Science database
Specifications = MM − FF
Main fields of science
The Frascati Manual (OECD, 2002) provides definitions for the six main fields of science (p. 67), which are included in this indicator:
• (NS) Natural sciences
• (ET) Engineering and technology
• (MS) Medical sciences
• (AS) Agricultural sciences
• (SS) Social sciences
• (H) Humanities
The breakdown of researchers by field of science is according to the field in which they work and not according to the field of their qualification.
Head count
The head count unit of measurement for R&D personnel comes from the Frascati Manual (OECD, 2002):
HC (§329): Head count. The number of persons engaged in R&D at a given date or the average number of persons engaged in R&D during the (calendar) year or the total number of persons engaged in R&D during the (calendar) year.
Web of ScienceTM (WoSTM) 2.8.
Content-based rationale
Women have been shown to lag behind men in terms of the size (as measured by the number of peer-reviewed scientific publications) and impact (as measured by citations to their publications) of their scientific production, as well as their propensity to partner on an international scale (as measured by the proportion of papers co-authored by researchers located in at least two countries) (Larivière et al., 2013). Because of the emphasis placed by funding agencies on the

She Figures Handbook, 2015
Page 98
above dimensions in the evaluation of research proposals, women could be disadvantaged in grant competitions relative to their men counterparts. If this is the case, women may get caught in a vicious circle whereby, with less funding, they have difficulty publishing as many papers and garnering as much attention (through citations to their papers) as men, thereby hindering them in improving their scientific performance in terms of the dimensions they are assessed on. Bibliometric indicators derived from the Web of ScienceTM are integrated into the She Figures publication so as to investigate gaps between women and men in terms of these dimensions by country, year and field of science (FOS). These indicators include:
• The ratio of women to men in terms of scientific authorships;
• The ratio of women to men in terms of scientific quality/impact;
• The ratio of women to men in terms of international co-authorship rates.
Additionally, within the context of Horizon 2020, activities towards achieving gender equality are being implemented around three main objectives (European Commission, 2014e):
• Fostering gender balance in research teams;
• Ensuring gender balance in decision-making;
• Integrating gender analysis in research and innovation (R&I) content.
There is, in fact, a legal basis in place to ensure the attainment of these objectives. For example, Horizon 2020 participants are asked to specify in their grant proposals how they intend to integrate a gender dimension into the subject matter of their projects. As such, it has become highly relevant to begin monitoring the extent to which researchers in different countries incorporate such aspects into their research content, so as to monitor changes over time. The following indicator has therefore been incorporated into the She Figures publication:
• Proportion of a country’s research output integrating a gender dimension in its research content (GDRC).
Regarding country attribution, each article is attributed only to the country of the corresponding author. In case of multiple addresses of the corresponding author (i.e. a different address is listed in the main list of author addresses relative to the ‘corresponding author’ field), the corresponding address is chosen. This means that in rare cases where the two addresses differ, there is a risk that the publication will be attributed to the country the author resides in as opposed to the country where the research took place.
Broad overview of the source
The indicators presented in this section were computed by Science-Metrix using raw bibliographic data derived from the Web of ScienceTM (WoSTM), which is produced by Thomson Reuters. The version of the WoSTM used for the She Figures publication comprises three databases: the Science Citation Index Expanded (SCI Expanded), the Social Sciences Citation Index (SSCI), and the Arts & Humanities Citation Index (A&HCI). These contain peer-reviewed scientific publications and ‘content citation metrics’ covering all major fields of scientific research. Some 12 000 refereed journals are indexed, covering all major fields of science in natural sciences and engineering, health sciences and social sciences and humanities. As they are peer-reviewed, the publications listed in the WoSTM represent high-quality and original contribution to scientific knowledge. In producing the indicators presented in this section, only three document types published in refereed scientific journals – articles, notes and reviews – were retained. The terms ‘papers’, or alternatively ‘publications’, are used throughout when referring to these three document types.
Data from the WoSTM can be used by researchers and policymakers to determine trends and collaborative patterns in scientific research (Thomson Reuters, 2014). A licence from Thomson Reuters is required to gain access to the WoSTM, as well as to produce bibliometric data using this database. For more details on this data source, refer to the annex document to this handbook, which provides a comprehensive description of the methodology used in computing the indicators covered in this section (She Figures Team, 2015).
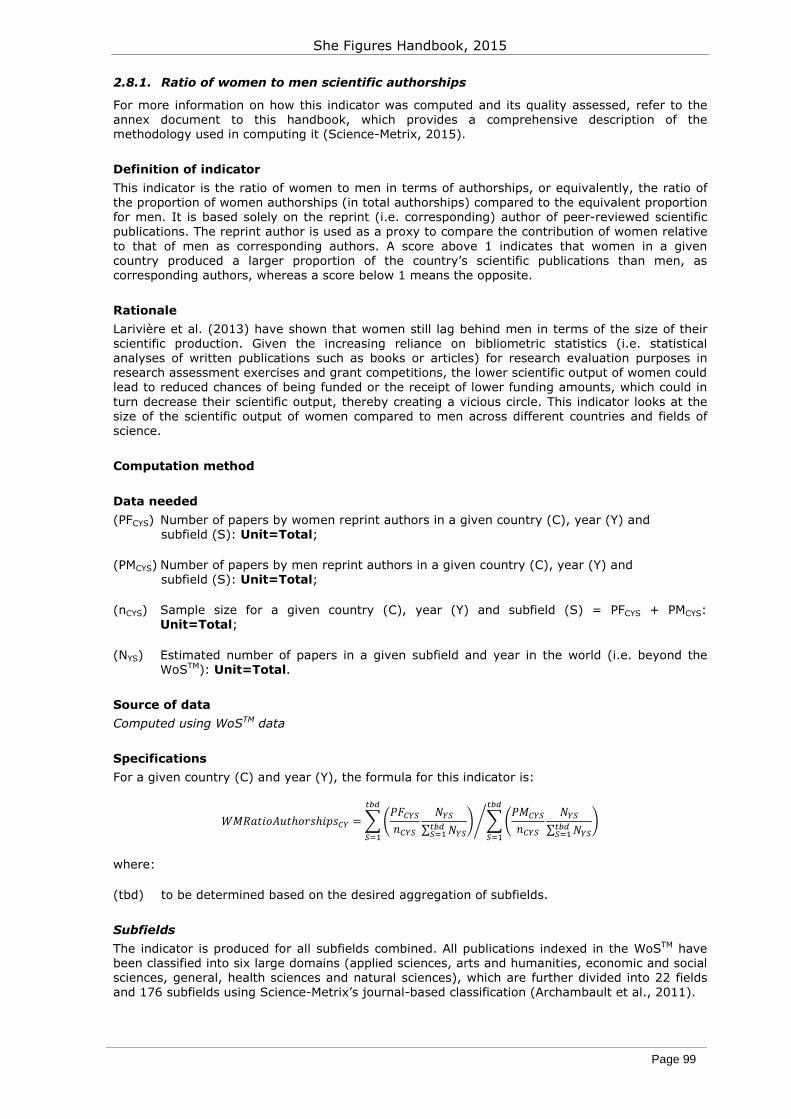
She Figures Handbook, 2015
Page 99
2.8.1. Ratio of women to men scientific authorships
For more information on how this indicator was computed and its quality assessed, refer to the annex document to this handbook, which provides a comprehensive description of the methodology used in computing it (Science-Metrix, 2015).
Definition of indicator
This indicator is the ratio of women to men in terms of authorships, or equivalently, the ratio of the proportion of women authorships (in total authorships) compared to the equivalent proportion for men. It is based solely on the reprint (i.e. corresponding) author of peer-reviewed scientific publications. The reprint author is used as a proxy to compare the contribution of women relative to that of men as corresponding authors. A score above 1 indicates that women in a given country produced a larger proportion of the country’s scientific publications than men, as corresponding authors, whereas a score below 1 means the opposite.
Rationale
Larivière et al. (2013) have shown that women still lag behind men in terms of the size of their scientific production. Given the increasing reliance on bibliometric statistics (i.e. statistical analyses of written publications such as books or articles) for research evaluation purposes in research assessment exercises and grant competitions, the lower scientific output of women could lead to reduced chances of being funded or the receipt of lower funding amounts, which could in turn decrease their scientific output, thereby creating a vicious circle. This indicator looks at the size of the scientific output of women compared to men across different countries and fields of science.
Computation method
Data needed
(PFCYS) Number of papers by women reprint authors in a given country (C), year (Y) and subfield (S): Unit=Total;
(PMCYS) Number of papers by men reprint authors in a given country (C), year (Y) and subfield (S): Unit=Total;
(nCYS) Sample size for a given country (C), year (Y) and subfield (S) = PFCYS + PMCYS: Unit=Total;
(NYS) Estimated number of papers in a given subfield and year in the world (i.e. beyond the WoSTM): Unit=Total.
Source of data
Computed using WoSTM data
Specifications
For a given country (C) and year (Y), the formula for this indicator is:
ℎ ℎ = ∑ ∑
where:
(tbd) to be determined based on the desired aggregation of subfields.
Subfields
The indicator is produced for all subfields combined. All publications indexed in the WoSTM have been classified into six large domains (applied sciences, arts and humanities, economic and social sciences, general, health sciences and natural sciences), which are further divided into 22 fields and 176 subfields using Science-Metrix’s journal-based classification (Archambault et al., 2011).
She Figures Handbook, 2015
Page 100
Fields of science (FOS)
The indicator is also produced by FOS (as defined in the Frascati Manual, Table 3.2). For a table matching subfields to FOS, refer to the annex document to this handbook, which provides a comprehensive description of the methodology used in computing it (Science-Metrix, 2015). The FOS are the following:
• (NS) Natural sciences
• (ET) Engineering and technology
• (MS) Medical sciences
• (AS) Agricultural sciences
• (SS) Social sciences
• (H) Humanities
Moving periods
Because the confidence intervals (see annex document to this handbook – Science-Metrix, 2015 - for how these intervals were computed) of some of the smaller countries were sometimes relatively large on a yearly basis, due to the size of the available samples by subfield, the ratios were computed using three-year moving periods (e.g. 2007–2009, 2008–2010, 2009–2011, 2010–2012 and 2011–2013). Thus, the ‘Y’ subscript in the above formula refers to such periods. This way, the samples used were larger, providing more robust estimates. A similar approach has been used in measuring the compound annual growth rate (CAGR) in the proportion of women authorships (see Section 2.8.2 for how the CAGR of this indicator was computed).
2.8.2. Compound annual growth rate (CAGR) of women scientific authorships
For more information on how this indicator was computed and its quality assessed, refer to the annex document to this handbook, which provides a comprehensive description of the methodology used in computing it (Science-Metrix, 2015).
Definition of indicator
This indicator presents the compound annual growth rate of women scientific authorships (see Section 2.8.1), meaning the average yearly percentage increase/decrease in the proportion of women scientific authorships, moving from one period to the next (using three-year moving periods, e.g. 2007–2009, 2008–2010, 2009–2011, 2010–2012 and 2011–2013), year on year.
Rationale
Larivière et al. (2013) have shown that women still lag behind men in terms of the size of their scientific production. Given the increasing reliance on bibliometric statistics (i.e. statistical analyses of written publications such as books or articles) for research evaluation purposes in research assessment exercises and grant competitions, the lower scientific output of women could lead to reduced chances of being funded or the receipt of lower funding amounts, which could in turn decrease their scientific output, thereby creating a vicious circle. This indicator looks at the size of the scientific output of women compared to men across different countries and fields of science.
Computation method
Data needed
(Fs) Estimated proportion of women authorships in the start period: Unit=Unitless;
(Fe) Estimated proportion of women authorships in the end period: Unit=Unitless;
N denotes the number of years in the reference period (i.e. last year of end period – last year of start period): Unit=Year.
Source of data
Computed using WoSTM data

She Figures Handbook, 2015
Page 101
Specifications ℎ ℎ = (F F⁄ ) − 1 2.8.3. Ratio of women to men international co-publication rate
For more information on how this indicator was computed and its quality assessed, refer to the annex document to this handbook, which provides a comprehensive description of the methodology used in computing it (Science-Metrix, 2015). It should be noted that international refers to papers published by authors from at least two countries located within the EU and/or beyond.
Definition of indicator
This indicator is the ratio of women to men in terms of the international co-authorship rate, or equivalently, the ratio of the proportion of women’s output stemming from involvement in international teams (in total women authorships) compared to the equivalent proportion for men. It is based solely on the reprint (i.e. corresponding) author of peer-reviewed scientific publications. The reprint author is used as a proxy to compare the contribution of women relative to that of men as corresponding authors. A score above 1 indicates that women publish their publications more frequently through involvement in international teams than men, as corresponding authors, whereas a score below 1 means the opposite.
Rationale
Larivière et al. (2013) have shown that women still lag behind men in terms of the ratio of their output coming from internationally co-authored publications. Given the increasing reliance on bibliometric statistics (i.e. statistical analyses of written publications such as books or articles) for research evaluation purposes in research assessment exercises and grant competitions, the lower international co-authorship rate of women could lead to reduced chances of being funded (or the receipt of lower funding amounts), which could in turn decrease their international co-authorship rate, thereby creating a vicious circle. This indicator looks at the ratio of internationally co-authored publications for women compared to men across different countries and fields of science.
Computation method
Data needed
(PFCYS) Number of papers by women reprint authors in a given country (C), year (Y) and subfield (S): Unit=Total;
(PMCYS) Number of papers by men reprint authors in a given country (C), year (Y) and subfield (S): Unit=Total;
(PFCCYS) Number of papers by women reprint authors in a given country (C), year (Y) and subfield (S) with international co-authors: Unit=Total;
(PMCCYS) Number of papers by men reprint authors in a given country (C), year (Y) and subfield (S) with international co-authors: Unit=Total;
(NYS) Estimated number of papers in a given subfield and year in the world (i.e. beyond the WoSTM): Unit=Total.
Source of data
Computed using WoSTM data
Specifications
For a given country (C) and year (Y), the formula for this indicator is:
= ∑ ∑

She Figures Handbook, 2015
Page 102
where:
(tbd) to be determined based on the desired aggregation of subfields.
Subfields
The indicator is produced for all subfields combined. All publications indexed in the WoSTM have been classified into six large domains (applied sciences, arts and humanities, economic and social sciences, general, health sciences and natural sciences), which are further divided into 22 fields and 176 subfields using Science-Metrix’s journal-based classification (Archambault et al., 2011).
Fields of science (FOS)
The indicator is also produced by FOS (as defined in the Frascati Manual, Table 3.2). For a table matching subfields to FOS, refer to the annex document to this handbook (Science-Metrix, 2015), which provides a comprehensive description of the methodology used in computing it. The FOS are the following:
• (NS) Natural sciences
• (ET) Engineering and technology
• (MS) Medical sciences
• (AS) Agricultural sciences
• (SS) Social sciences
• (H) Humanities
Moving periods
Because the confidence intervals (see annex document to this handbook – Science-Metrix, 2015 – for how these intervals were computed) of some of the smaller countries were sometimes relatively large on a yearly basis, due to the size of the available samples by subfield, the ratios were computed using three-year moving periods (e.g. 2007–2009, 2008–2010, 2009–2011, 2010–2012 and 2011–2013). Thus, the ‘Y’ subscript in the above formula refers to such periods. This way, the samples used were larger, providing more robust estimates. A similar approach has been used in measuring the compound annual growth rate (CAGR) in the proportion of women authorships (see Section 2.8.4 for how the CAGR of this indicator was computed).
2.8.4. Compound annual growth rate (CAGR) of the ratio of women to men international co-publication rate
For more information on how this indicator was computed and its quality assessed, refer to the annex document to this handbook, which provides a comprehensive description of the methodology used in computing it (Science-Metrix, 2015).
Definition of indicator
This indicator presents the compound annual growth rate of the ratio of women to men in terms of the international co-authorship rate (see Section 2.8.3), meaning the average yearly percentage increase/decrease in the ratio, moving from one period to the next (using three-year moving periods, e.g. 2007–2009, 2008–2010, 2009–2011, 2010–2012 and 2011–2013), year on year.
Rationale
Larivière et al. (2013) have shown that women still lag behind men in terms of the size of their scientific production. Given the increasing reliance on bibliometric statistics (i.e. statistical analyses of written publications such as books or articles) for research evaluation purposes in research assessment exercises and grant competitions, the lower scientific output of women could lead to reduced chances of being funded or the receipt of lower funding amounts, which could in turn decrease their scientific output, thereby creating a vicious circle. This indicator looks at the size of the scientific output of women compared to men across different countries and fields of science.
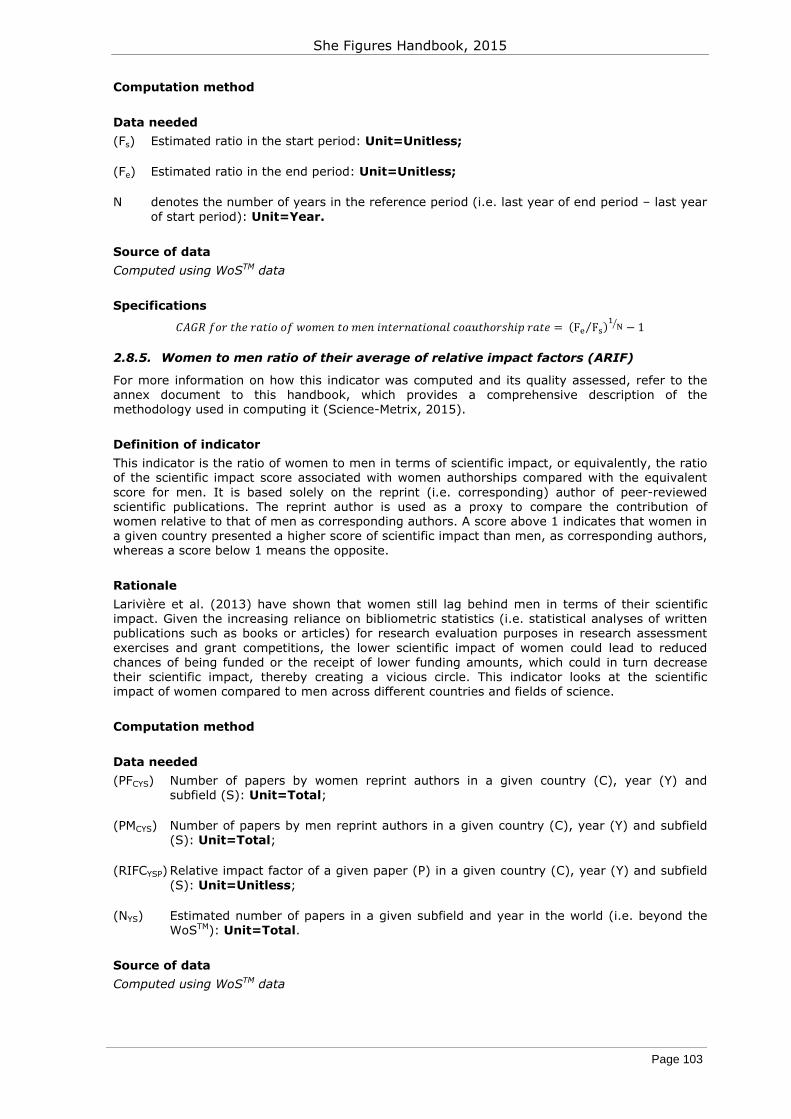
She Figures Handbook, 2015
Page 103
Computation method
Data needed
(Fs) Estimated ratio in the start period: Unit=Unitless;
(Fe) Estimated ratio in the end period: Unit=Unitless;
N denotes the number of years in the reference period (i.e. last year of end period – last year of start period): Unit=Year.
Source of data
Computed using WoSTM data
Specifications ℎ ℎ ℎ = (F F⁄ ) − 1 2.8.5. Women to men ratio of their average of relative impact factors (ARIF)
For more information on how this indicator was computed and its quality assessed, refer to the annex document to this handbook, which provides a comprehensive description of the methodology used in computing it (Science-Metrix, 2015).
Definition of indicator
This indicator is the ratio of women to men in terms of scientific impact, or equivalently, the ratio of the scientific impact score associated with women authorships compared with the equivalent score for men. It is based solely on the reprint (i.e. corresponding) author of peer-reviewed scientific publications. The reprint author is used as a proxy to compare the contribution of women relative to that of men as corresponding authors. A score above 1 indicates that women in a given country presented a higher score of scientific impact than men, as corresponding authors, whereas a score below 1 means the opposite.
Rationale
Larivière et al. (2013) have shown that women still lag behind men in terms of their scientific impact. Given the increasing reliance on bibliometric statistics (i.e. statistical analyses of written publications such as books or articles) for research evaluation purposes in research assessment exercises and grant competitions, the lower scientific impact of women could lead to reduced chances of being funded or the receipt of lower funding amounts, which could in turn decrease their scientific impact, thereby creating a vicious circle. This indicator looks at the scientific impact of women compared to men across different countries and fields of science.
Computation method
Data needed
(PFCYS) Number of papers by women reprint authors in a given country (C), year (Y) and subfield (S): Unit=Total;
(PMCYS) Number of papers by men reprint authors in a given country (C), year (Y) and subfield (S): Unit=Total;
(RIFCYSP) Relative impact factor of a given paper (P) in a given country (C), year (Y) and subfield (S): Unit=Unitless;
(NYS) Estimated number of papers in a given subfield and year in the world (i.e. beyond the WoSTM): Unit=Total.
Source of data
Computed using WoSTM data
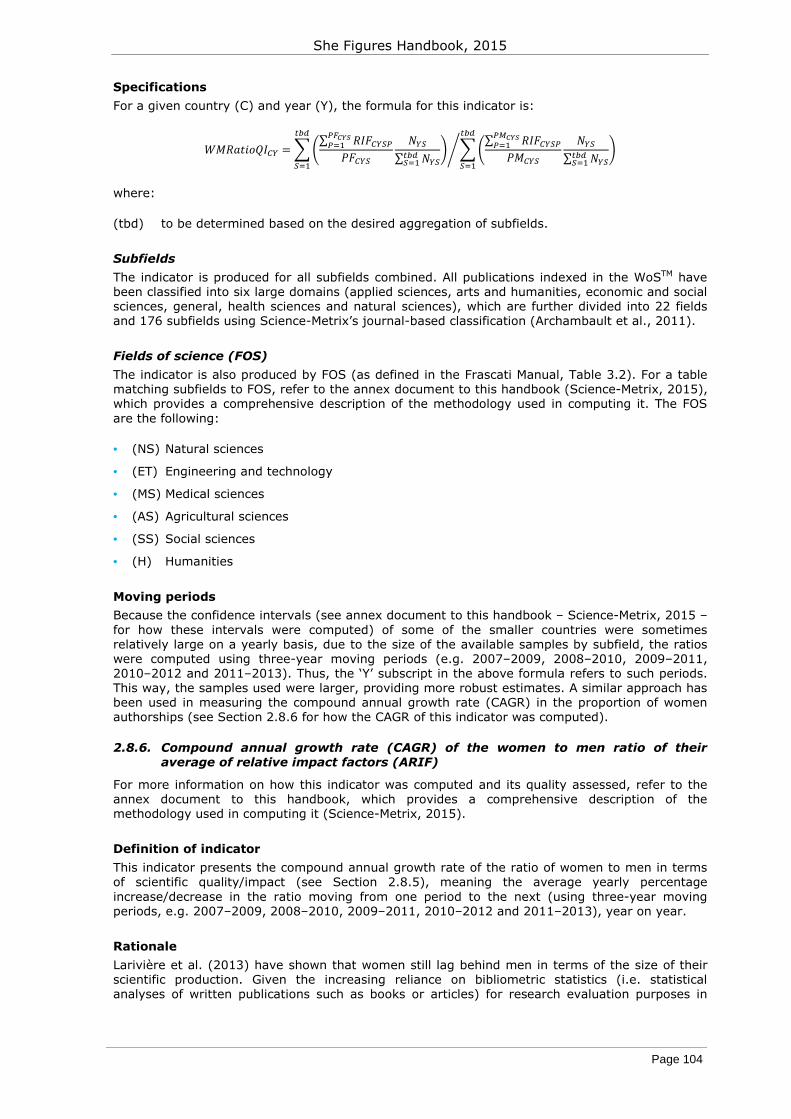
She Figures Handbook, 2015
Page 104
Specifications
For a given country (C) and year (Y), the formula for this indicator is:
= ∑ ∑ ∑ ∑
where:
(tbd) to be determined based on the desired aggregation of subfields.
Subfields
The indicator is produced for all subfields combined. All publications indexed in the WoSTM have been classified into six large domains (applied sciences, arts and humanities, economic and social sciences, general, health sciences and natural sciences), which are further divided into 22 fields and 176 subfields using Science-Metrix’s journal-based classification (Archambault et al., 2011).
Fields of science (FOS)
The indicator is also produced by FOS (as defined in the Frascati Manual, Table 3.2). For a table matching subfields to FOS, refer to the annex document to this handbook (Science-Metrix, 2015), which provides a comprehensive description of the methodology used in computing it. The FOS are the following:
• (NS) Natural sciences
• (ET) Engineering and technology
• (MS) Medical sciences
• (AS) Agricultural sciences
• (SS) Social sciences
• (H) Humanities
Moving periods
Because the confidence intervals (see annex document to this handbook – Science-Metrix, 2015 – for how these intervals were computed) of some of the smaller countries were sometimes relatively large on a yearly basis, due to the size of the available samples by subfield, the ratios were computed using three-year moving periods (e.g. 2007–2009, 2008–2010, 2009–2011, 2010–2012 and 2011–2013). Thus, the ‘Y’ subscript in the above formula refers to such periods. This way, the samples used were larger, providing more robust estimates. A similar approach has been used in measuring the compound annual growth rate (CAGR) in the proportion of women authorships (see Section 2.8.6 for how the CAGR of this indicator was computed).
2.8.6. Compound annual growth rate (CAGR) of the women to men ratio of their average of relative impact factors (ARIF)
For more information on how this indicator was computed and its quality assessed, refer to the annex document to this handbook, which provides a comprehensive description of the methodology used in computing it (Science-Metrix, 2015).
Definition of indicator
This indicator presents the compound annual growth rate of the ratio of women to men in terms of scientific quality/impact (see Section 2.8.5), meaning the average yearly percentage increase/decrease in the ratio moving from one period to the next (using three-year moving periods, e.g. 2007–2009, 2008–2010, 2009–2011, 2010–2012 and 2011–2013), year on year.
Rationale
Larivière et al. (2013) have shown that women still lag behind men in terms of the size of their scientific production. Given the increasing reliance on bibliometric statistics (i.e. statistical analyses of written publications such as books or articles) for research evaluation purposes in

She Figures Handbook, 2015
Page 105
research assessment exercises and grant competitions, the lower scientific output of women could lead to reduced chances of being funded or the receipt of lower funding amounts, which could in turn decrease their scientific output, thereby creating a vicious circle. This indicator looks at the size of the scientific output of women compared to men across different countries and fields of science.
Computation method
Data needed
(Fs) Estimated ratio in the start period: Unit=Unitless;
(Fe) Estimated ratio in the end period: Unit=Unitless;
N denotes the number of years in the reference period (i.e. last year of end period – last year of start period): Unit=Year.
Source of data
Computed using WoSTM data
Specifications ℎ / = (F F⁄ ) − 1 2.8.7. Proportion of a country’s research output integrating a gender dimension in its
research content (GDRC)
For more information on how this indicator was computed and its quality assessed, refer to the annex document to this handbook, which provides a comprehensive description of the methodology used in computing it (Science-Metrix, 2015).
Definition of indicator
This indicator consists of a country’s number of peer-reviewed scientific papers (those with at least one author from the said country) in which a gender dimension has been identified in the research content, divided by the total number of peer-reviewed scientific papers from the corresponding country. Papers are counted using full counting: that is, each publication is counted only once for a given country, even if more than one author from the said country are listed as authors in the publication. Note that the concept of GDRC covers both the sex (biological characteristics of both women and men) and gender (social/cultural factors of both women and men) dimensions. These scientific publications were retrieved using keyword-based queries searching for specific terms in the title, keywords or abstract of papers. For a detailed description of the approach used in identifying publications that include a gender dimension in their research content, refer to the comprehensive methodology provided alongside this handbook in an annex document (Science-Metrix, 2015). Briefly, research output focused on well-defined gender topics (e.g. feminism, gender pay gap, gender equality, LGBT), as well as research content in which a distinction or a comparison is made between men and women (either in the title, abstract, or author keywords), were both deemed relevant. Exceptions to the queries were also included in order to exclude research outputs from studies on the animal kingdom (e.g. feminisation of fish populations) and other non-human biological entities, such as plants. Papers investigating specific medical conditions (e.g. menopause, erectile dysfunction) were also specifically excluded as they would have returned a very large portion of scientific publications in the medical fields.
Rationale
Since 2014, with the new EU Research and Innovation funding programme Horizon 2020, applicants are invited to specify how they intend to integrate a gender dimension in their research content. They are expected to describe, where relevant, how sex and/or gender analysis is taken into account in the project’s content. As such, it has become highly relevant to start monitoring the extent to which researchers in different countries incorporate such aspects into their research content, so as to monitor changes over time.
She Figures Handbook, 2015
Page 106
Computation method
Data needed
(GDRCPCYF) Number of GDRC papers in a given country (C), year (Y) and field of science (F): Unit=Total;
(TPCYF) Total number of papers in a given country (C), year (Y) and field of science (F) in WoSTM: Unit=Total.
Source of data
Computed using WoSTM data
Specifications
For a given country (C), year (Y) and FOS (F), the formula for this indicator is: = ⁄
Fields of science (FOS)
The indicator is also produced by FOS (as defined in the Frascati Manual, Table 3.2) as well as for all fields combined, including unclassified papers (subscript F in the above formula):
• (NS) Natural sciences
• (ET) Engineering and technology
• (MS) Medical sciences
• (AS) Agricultural sciences
• (SS) Social sciences
• (H) Humanities
• (T) Total across all FOS including unclassified papers
Moving periods
This indicator was computed using four-year moving periods (e.g. 2002–2005, 2006–2009 and so on). Thus, the ‘Y’ subscript in the above formula refers to such periods. This way, the samples used were larger, providing more robust estimates. A similar approach has been used in measuring the compound annual growth rate (CAGR) in this indicator (see Section 2.8.8 for how the CAGR of this indicator was computed).
2.8.8. Compound annual growth rate (CAGR) of the proportion of a country’s research outputs integrating a GDRC
For more information on how this indicator was computed and its quality assessed, refer to the annex document to this handbook, which provides a comprehensive description of the methodology used in computing it (Science-Metrix, 2015).
Definition of indicator
This indicator presents the compound annual growth rate of the proportion of a country’s research output integrating a GDRC (see Section 2.8.7), meaning the average yearly percentage increase/decrease in the proportion, moving from one period to the next (using four-year moving periods, e.g. 2002–2005, 2006–2009 and so on), year on year.
Rationale
Larivière et al. (2013) have shown that women still lag behind men in terms of the size of their scientific production. Given the increasing reliance on bibliometric statistics (i.e. statistical analyses of written publications such as books or articles) for research evaluation purposes in research assessment exercises and grant competitions, the lower scientific output of women could lead to reduced chances of being funded or the receipt of lower funding amounts, which could in turn decrease their scientific output, thereby creating a vicious circle. This indicator looks at the

She Figures Handbook, 2015
Page 107
size of the scientific output of women compared to men across different countries and fields of science.
Computation method
Data needed
(Fs) Estimated proportion in the start period: Unit=Unitless;
(Fe) Estimated proportion in the end period: Unit=Unitless;
N denotes the number of years in the reference period (i.e. last year of end period – last year of start period): Unit=Year.
Source of data
Computed using WoSTM data
Specifications ℎ ’ ℎ = (F F⁄ ) − 1 EPO Worldwide Patent Statistical Database (PATSAT) 2.9.
Content-based rationale
Women have been shown to lag behind men in terms of the size (as measured by the number of peer-reviewed scientific publications) and impact (as measured by citations to their publications) of their scientific production, as well as their propensity to partner on an international scale (as measured by the proportion of papers co-authored by researchers located in at least two countries) (Larivière et al., 2013). Because of the emphasis placed by funding agencies on the above dimensions in the evaluation of research proposals, women could be disadvantaged in grant competitions relative to their men counterparts. In grant competitions focusing more heavily on applied research, the number of patent applications in which a researcher is listed as an inventor might also prove to be a decisive factor in the funding decision. An example of this would be the European Commission’s Framework Programmes, for which the transfer of knowledge from academia to the private sector is a key aspect aimed at fostering economic growth through innovation. Thus, a technometric indicator derived from PATSTAT is integrated in the She Figures publication so as to monitor gaps in the contribution of women and men to the production of inventions by country, year and technological fields – namely, the ratio of women to men in terms of inventorships.
Broad overview of the source
The indicator presented in this section was computed using raw bibliographic data derived from the EPO Worldwide Patent Statistical Database (PATSTAT). PATSTAT covers patent data from over 150 offices worldwide, including the USPTO, EPO and JPO. The USPTO covers the United States, the EPO covers Europe, the JPO covers Japan, and so forth. For the She Figures publication, the statistics are based on the EPO within PATSTAT, as the European market is one of the largest in the world and certainly the most relevant in the context of the She Figures publication, since it covers all countries associated with the European Research Area (ERA).
Note that statistics on inventorships can be produced by measuring issued patents or patent applications when working with EPO data. On a conceptual level, if the goal is to get a sense of the inventive/innovative capacity of a given entity (e.g. women in a given country) rather than of ‘marketable/innovative outputs’, as in this study, then applications are more appropriate. Furthermore, in cases where trends in the inventiveness of entities are to be investigated, also as in this study, the capacity to produce timely data is important. In this regard, issued patents have the disadvantage of running behind and becoming visible only years after the innovative activity has taken place. Thus, from a methodological standpoint, applications are still preferable. Consequently, EPO patent applications (kind codes: A1 and A2) were retained in computing the ratio of women to men inventorships. These patent applications are later referred to as ‘patent applications’, ‘patents’ or ‘inventions’.
She Figures Handbook, 2015
Page 108
2.9.1. Ratio of women to men inventorships
For more information on how this indicator was computed and its quality assessed, refer to the annex document to this handbook, which provides a comprehensive description of the methodology used in computing it (Science-Metrix, 2015).
Definition of indicator
This indicator is the ratio of women to men inventorships, or equivalently, the ratio of the proportion of women inventorships (in total inventorships) compared to the equivalent proportion for men. The absolute number of inventorships used in computing this indicator is based on fractionalised counts of patent applications across their corresponding inventors: for example, if a patent application involves 10 inventors, each inventor is attributed an equal fraction of the inventorships (i.e. 1/10 of the invention). A score above 1 indicates that women in a given country produced a larger proportion of the country’s inventions than men, whereas a score below 1 means the opposite.
Rationale
Larivière et al. (2013) have shown that women still lag behind men in terms of the size of their scientific production. Given the increasing reliance on bibliometric statistics (i.e. statistical analyses of written publications such as books or articles) for research evaluation purposes in research assessment exercises and grant competitions, the lower scientific output of women could lead to reduced chances of being funded (or the receipt of lower funding amounts), which could in turn decrease their scientific output, thereby creating a vicious circle. In grant competitions focusing more heavily on applied research, the number of patent applications on which a researcher is listed as an inventor might also prove to be a decisive factor in the funding decision. This indicator looks at the size of the technological output of women compared to men across different countries and fields of technology.
Computation method
Data needed
(FICYI) Sum of fractionalised inventorships for women in a given country (C), year (Y) and section (I, based on the International Patent Classification [IPC]): Unit=Total of fractionalised counts;
(MICYI) Sum of fractionalised inventorships for men in a given country (C), year (Y) and IPC section (I): Unit=Total of fractionalised counts;
(TICYI) Sum of fractionalised inventorships across women and men in a given country (C), year (Y) and IPC section (I): Unit=Total of fractionalised counts.
Source of data
Computed using PATSTAT data
Specifications
For a given country (C), year (Y) and IPC section (I), the formula for this indicator is:
ℎ = =
IPC Classification Version 2015.01
All EPO patent applications are classified based on the International Patent Classification (IPC) of the World Intellectual Property Organization (WIPO) in PATSTAT (WIPO, 2015). This hierarchical classification is divided into eight sections (Level 1), which are further divided into classes (Level 2), subclasses (Level 3), main groups (Level 4) and subgroups (lower level). This classification is not mutually exclusive (i.e. each patent application is classified into one or more sections, classes, subclasses, main groups and subgroups). Thus, a given patent application can contribute to the scores of more than one of the eight IPC sections for which this indicator has been computed, in addition to the total for all EPO patent applications (subscript I in the above formula):
She Figures Handbook, 2015
Page 109
• (A) Human Necessities
• (B) Performing Operations & Transporting
• (C) Chemistry & Metallurgy
• (D) Textiles & Paper
• (E) Fixed Constructions
• (F) Mechanical Engineering, Lighting, Heating, Weapons & Blasting
• (G) Physics
• (H) Electricity
• (T) Total across all sections including unclassified patent applications (unique/distinct count of patent applications across sections)
Moving periods
Because the confidence intervals (see annex document to this handbook – Science-Metrix, 2015 – for how these intervals were computed) of some of the smaller countries were sometimes relatively large on a yearly basis, due to the size of the available samples by IPC section, the ratios were computed using four-year moving periods (e.g. 2002–2005, 2003–2006 and so on). This way, the samples used were larger, providing more robust estimates. A similar approach has been used in measuring the compound annual growth rate (CAGR) in the proportion of women inventorships (see Section 2.9.2 for how the CAGR of this indicator was computed).
2.9.2. Compound annual growth rate (CAGR) of the proportion of women inventorships
For more information on how this indicator was computed and its quality assessed, refer to the annex document to this handbook, which provides a comprehensive description of the methodology used in computing it (Science-Metrix, 2015).
Definition of indicator
This indicator presents the compound annual growth rate of the proportion of women inventorships (see Section 2.9.1), meaning the average yearly percentage increase/decrease in the proportion, moving from one period to the next (using four-year moving periods, e.g. 2002–2005, 2006–2009 and so on), year on year.
Rationale
Larivière et al. (2013) have shown that women still lag behind men in terms of the size of their scientific production. Given the increasing reliance on bibliometric statistics (i.e. statistical analyses of written publications such as books or articles) for research evaluation purposes in research assessment exercises and grant competitions, the lower scientific output of women could lead to reduced chances of being funded or the receipt of lower funding amounts, which could in turn decrease their scientific output, thereby creating a vicious circle. This indicator looks at the size of the scientific output of women compared to men across different countries and fields of science.
Computation method
Data needed
(Fs) Estimated proportion in the start period: Unit=Unitless;
(Fe) Estimated proportion in the end period: Unit=Unitless;
N denotes the number of years in the reference period (i.e. last year of end period – last year of start period): Unit=Year.
Source of data
Computed using WoSTM data
She Figures Handbook, 2015
Page 110
Specifications ℎ ℎ = (F F⁄ ) − 1 European Research Area (ERA) Survey 2014 2.10.
Content-based rationale
The European Commission’s Expert Group on Structural Change has identified a range of institutional barriers that may be limiting women’s advancement in research organisations, including a lack of transparency in decision-making, institutional practices that indirectly discriminate against women, gender biases in the assessment of excellence, the lack of a gender perspective in research content, and gendered organisation of the workplace (DG Research and Innovation, 2012d, pp. 6–7). In the She Figures, the ERA Survey is used to gain an insight into what is happening within research organisations, and whether efforts are being made to overcome these barriers.
Broad overview of the source
Amongst other things, the European Research Area encourages stakeholders to pursue gender equality through institutional change in human resources management, funding, decision-making and research programmes (European Commission, 2012a). The European Commission has conducted two surveys to measure the level of progress made by research organisations in the EU in implementing the policy priorities of the ERA. The ERA Surveys include questions that explore the actions taken by research organisations to promote gender equality (both internally and externally).
There have been two editions of the ERA Survey so far: the first occurred in 2012 (completed in early 2013) and the second in 2014. One part of the ERA Survey is aimed at both research performing organisations (RPOs) and the other at research funding organisations (RFOs).
The survey covers the countries associated with the European Research Area, including the 28 Member States of the EU, plus Switzerland, Norway, Serbia, Israel, Montenegro, Turkey, Albania, Bosnia and Herzegovina, the Faroe Islands and Iceland.
The original ERA datasets (2012 and 2014) are available online via the following link. The main findings from both surveys are also available at this link, within the ‘ERA Progress Reports’ and ‘ERA Facts and Figures Reports’: http://ec.europa.eu/research/era/eraprogress_en.htm.
A complete list of indicators falling into this category can be found in Annex 3 and their detailed description follows below.
2.10.1. Proportion of research performing organisations (RPOs) that adopted gender equality plans
Definition of indicator
Using ERA survey data, this indicator presents the proportion of respondent RPOs which indicated that they had adopted a gender equality plan in a given year.
Rationale
Various She Figures editions suggest that, despite support at the EU level for gender equality in science and research, women face persistent barriers when pursuing careers and reaching decision-making positions within these fields, even if their representation at entry level is strong. In recent years there has been growing policy emphasis on the role of research institutions themselves in enhancing gender equality. According to the European Commission’s Expert Group on Structural Change, ‘gender-aware management of universities and research organisations would have a positive impact on policies and practices in the recruitment, promotion and retention of both women and men, thus ultimately benefiting the very quality of science’ (DG Research and Innovation, 2012d, p. 5).
With such concerns in mind, the European Commission has called on stakeholders to implement institutional change through gender equality plans (European Commission, 2012a). This indicator

She Figures Handbook, 2015
Page 111
represents a first step towards understanding how widespread the adoption of such plans is within the European Research Area.
Computation method
Data needed ( ) Number of respondent RPOs that adopted gender equality plans: Unit=Total; ( ) Total number of respondent RPOs to the ERA Survey: Unit=Total.
In She Figures 2015, it was not possible to weight the ERA survey results, meaning that these results apply to the situation in the respondent RPOs only, rather than the broader population.
Source of data
European Research Area (ERA) Survey: http://ec.europa.eu/research/era/eraprogress_en.htm
She Figures 2015 makes use of the 2014 ERA Survey of RPOs. These were the variables of interest for this indicator: P36, PCountry.
In the ERA Survey of 2014, the relevant questions related to actions taken in 2013. Due to changes in the design of the questionnaires, it is not possible to compare results with the previous ERA Survey (2012), which gathered data for the year 2011. This is because the wording of the questions on gender has changed.
Specifications
The formula for this indicator is: ℎ ℎ = /
In She Figures 2015, this calculation was performed for each country. RPOs are defined by the country in which they are based. International organisations have been excluded.
Research performing organisations
According to the ERA, a research performing organisation (RPO) encompasses any organisation conducting public research (specifically, research ‘with a public mission’) (DG Research and Innovation, 2013). For example, RPOs could cover higher education institutions (both government-funded and private), large private research organisations and publicly funded scientific libraries.
Gender equality plans
A gender equality plan is defined as a ‘consistent set of provisions and actions aiming at ensuring gender equality’. RPOs were provided with this definition when they participated in the ERA Survey.
Comments/critical issues
• Note that the sample for the ERA Survey was not randomly selected; furthermore, the survey results have not been weighted due to a lack of substantiated information about the sample frame and the whole population of RPOs. This means that it is not possible to produce inferential statistics about the wider population. Care should be taken to make clear that this indicator gives a snapshot of the situation in respondent organisations only.
• The survey of research funding organisations (RFOs) did not include these questions on gender equality plans or the introduction of specific measures. As a result, RFOs are not included in this indicator.
• Indicator based on self-reporting by RPOs.

She Figures Handbook, 2015
Page 112
2.10.2. Proportion of research and development (R&D) personnel working in organisations that adopted gender equality plans
Definition of indicator
Using ERA survey data, this indicator presents the proportion of R&D personnel working in respondent RPOs that adopted a gender equality plan in a given year, out of all R&D personnel employed in the respondent RPOs.
Rationale
As discussed above, there is growing emphasis on the steps that research organisations themselves can take to support gender equality in science and research. For instance, the European Commission has called on stakeholders to implement institutional change by introducing gender equality plans (European Commission, 2012a). This indicator represents a first step towards understanding how common it is for R&D personnel to work in RPOs that have adopted such plans and thus made a formal commitment to gender equality. It provides an insight into the working conditions within the European Research Area (in the respondent RPOs).
Computation method
Data needed ( ) Number of R&D personnel working in RPOs that adopted gender equality plans: Unit=Head count; ( ) Total number of R&D personnel in all RPOs that responded to the ERA Survey: Unit=Head count.
In She Figures 2015, it was not possible to weight the ERA survey results, meaning that these results apply to the situation in the respondent RPOs only, rather than the broader population.
Source of data
European Research Area (ERA) Survey: http://ec.europa.eu/research/era/eraprogress_en.htm
She Figures 2015 makes use of the 2014 ERA Survey of RPOs. These were the variables of interest for this indicator: P17, P36, PCountry.
In the ERA Survey of 2014, the relevant questions related to actions taken in 2013. Due to changes in the design of the questionnaires, it is not possible to compare results with the previous ERA Survey (2012), which gathered data for the year 2011. This is because the wording of the questions on gender has changed.
Specifications
The formula for this indicator is: ℎ & ℎ = /
In She Figures 2015, this calculation was performed for each country. The country of R&D personnel is the country in which their RPO is based. R&D personnel in international organisations have been excluded.
Responding organisations provided the number of R&D personnel in head count.
Research performing organisations
According to the ERA, a research performing organisation (RPO) encompasses any organisation conducting public research (specifically, research ‘with a public mission’) (DG Research and Innovation, 2013). For example, RPOs could cover higher education institutions (both government-funded and private), large private research organisations and publicly funded scientific libraries.
She Figures Handbook, 2015
Page 113
Gender equality plans
A gender equality plan is defined as a ‘consistent set of provisions and actions aiming at ensuring gender equality’. RPOs were provided with this definition when they participated in the ERA Survey.
R&D personnel
The ERA Survey 2014 makes use of the Frascati Manual definition of R&D personnel:
• R&D personnel, §294: ‘All persons employed directly on R&D …, as well as those providing direct services such as R&D managers, administrators, and clerical staff’.
Comments/critical issues
• Results are representative of R&D personnel working in RPOs that responded to the ERA Survey. Care should be taken to make clear that this indicator gives a snapshot of the situation in respondent organisations only.
• The survey of research funding organisations (RFOs) did not include questions on the introduction of gender equality plans. As a result, RFOs are excluded from this indicator.
• Indicator based on self-reporting by RPOs.
2.10.3. Implementation of gender equality measures in research performing organisations (RPOs)
Definition of indicator
Using ERA survey data, this indicator presents the proportion of respondent RPOs which stated that they had adopted one or more measures to promote gender equality in a given year.
Rationale
As discussed above, there is growing policy emphasis on the role of research institutions themselves in enhancing gender equality. In 2012, the Council of the EU emphasised the need to improve ‘gender equality practices’ in research organisations (Council of the European Union, 2012). This indicator seeks to capture whether (respondent) RPOs in the European Research Area have introduced specific measures to promote gender equality, in line with the recent shifts in policy. It provides important context for interpreting other She Figures indicators on gender equality plans, by exploring tangible actions taken to further this end.
Computation method
Data needed
(R) Number of respondent RPOs that adopted each of the gender equality measures in the survey: flexible career trajectory; recruitment and promotion measures; support for leadership development; targets to ensure gender balance in recruitment committees; work–life balance measures; and other measures: Unit=Total;
(T) Total number of respondent RPOs to the ERA Survey: Unit=Total.
Source of data
European Research Area (ERA) Survey: http://ec.europa.eu/research/era/eraprogress_en.htm
She Figures 2015 makes use of the 2014 ERA Survey of RPOs. These were the variables of interest for this indicator: P37, PCountry.
In the ERA Survey of 2014, the relevant questions related to actions taken in 2013. Due to changes in the design of the questionnaires, it is not possible to compare results with the previous ERA Survey (2012), which gathered data for the year 2011. This is because the wording of the questions on gender has changed.
She Figures Handbook, 2015
Page 114
Specifications
The formula for this indicator is: = R /
where:
i denotes a particular measure;
denotes the number of RPOs which adopted that particular measure.
This calculation is performed for each of the six measures in turn. Note that respondents could indicate that they had introduced multiple measures.
In She Figures 2015, this calculation was performed for each country. RPOs are defined by the country in which they are based. International organisations have been excluded.
In She Figures 2015, it was not possible to weight the ERA survey results, meaning that these results apply to the situation in the respondent RPOs only, rather than the broader population.
Research performing organisations (RPOs) and gender equality measures
According to the ERA, a research performing organisation (RPO) encompasses any organisation conducting public research (specifically, research ‘with a public mission’) (DG Research and Innovation, 2013). For example, RPOs could cover higher education institutions (both government-funded and private), large private research organisations and publicly funded scientific libraries.
In the survey, RPOs selected from this list of six possible measures to promote gender equality:
• Flexible career trajectory (e.g. provisions for interruptions of career, returning schemes after career breaks, gender-aware conditions, provisions on dual careers);
• Recruitment and promotion measures;
• Support for leadership development (e.g. mentoring or networking opportunities for women researchers);
• Targets to ensure gender balance in recruitment committees;
• Work–life balance measures (e.g. parental leave, flexible working arrangements);
• Other.
Comments/critical issues
• Results are representative of RPOs that responded to the ERA Survey only. Care should be taken to make clear that this indicator gives a snapshot of the situation in respondent organisations only.
• Respondent organisations which selected ‘Other’ were not asked to explain what these measures were, which presents an issue when interpreting these answers.
• The survey of research funding organisations (RFOs) did not include this question on the introduction of specific measures. As a result, RFOs are excluded from this indicator.
• Indicator based on self-reporting by RPOs.

She Figures Handbook, 2015
Page 115
QUALITY PLAN: VERIFICATION AND VALIDATION OF DATA 3.
In preparing the present study, data quality was viewed as a multi-faceted concept. The quality framework suggested covered three different dimensions to be considered in selecting indicators: relevance, accuracy and availability (Table 3). Each indicator was to be evaluated by grading it for each dimension and by an overall assessment.
The relevance of an indicator was determined by a qualitative assessment of the value contributed by that indicator in terms of its policy relevance. An indicator had to be policy relevant by addressing key policy issues related to gender inequalities in the EU and associated countries.
The accuracy of an indicator is the degree to which the indicator correctly estimates or describes the quantities or characteristics it is designed to measure. Accuracy has two dimensions: the data-collection method and the degree of cross-country standardisation. The data-collection method was considered sound if the data correctly estimated or described the quantities or characteristics that it was designed to measure. Thus, accuracy based on the data-collection method refers to the closeness between the values provided and the (unknown) true value.
The evaluation of the accuracy of data-collection methods was significant in the present study, given that the data used had to be collected not only from high-quality databases of national statistical offices and international organisations but also from other databases held by the European Commission and some of its agencies, as well as Statistical Correspondents. The latter may not have undergone formal quality reviews by statistical authorities. The accuracy of data-collection methods in the present study can be evaluated as being very good, good and acceptable.
The other dimension of data accuracy was cross-country comparability: whether an indicator was comparable across countries required consideration as to the methods of data collection in the countries concerned. For example, an indicator was comparable if the same question was asked in all countries in the same way and by the same means. It was desirable to have the highest degree of comparability across countries. For data collected through the Statistical Correspondents of the Helsinki Group, a guideline was prepared to maximise cross-country comparability in the data collected through the WiS questionnaire. Metadata were also collected through the questionnaire from every participating country to allow an assessment of comparability. Additionally, much attention has been paid to ensuring data quality by regular consultation with Statistical Correspondents throughout the process of data gathering and input.
The concept of availability related to the accessibility of a given indicator in various countries and for a given time frame. It was desirable to have data from as many countries as possible, including the EU Member States and associated countries. In addition, an indicator that was available beyond the initial benchmark year was considered better than one that was available for only one year.
At the same time, ensuring maximum quality and reliability of the resulting data warehouse requires a posteriori verification and validation of the data received. The diagnosis of the accuracy and reliability of databases evolves over time, along with their content. In She Figures 2015, this diagnosis is primarily based on two approaches, which are further explained in this section.

She Figures Handbook, 2015
Page 116
Table 3 Dimensions of the data quality framework
Depends on Addressed by
RELEVANCE
• Relevance of selected indicators in the current models and measuring systems of research and innovation: are they up-to-date from a content/policy perspective?
• Steering group discussions • Thorough mapping of state of
the art with respect to R&I indicators
• Identification of new indicators to introduce in She Figures 2015
ACCURACY OF DATA COLLECTION METHOD/COMPARABILITY
• Alignment between countries in reporting system, classifications used, etc. by data source
• Trying to rely as much as possible on existing official classifications and manuals for data collection (e.g. Frascati Manual, etc.); international standards, etc.
• Guidelines and aiming to have Statistical Correspondents adhere as much as possible to quality standards of data collection
• Metadata sheets (to systematically register potential deviations from the defined classifications and standards)
• Validity/coherence checks after data gathering and computation of confidence intervals (for new indicators only)
AVAILABILITY
• Capacity and resources of governments to collect the required information
• Availability of secondary source databases
• Steering group discussions, discussions with key stakeholders
• Lessons from previous rounds • Flagging system (to
systematically register missing data)
Identification of unreliable data points through detection of outliers
Non-sampling errors (e.g. processing errors such as cleaning errors, mis-assignment of gender, reporting errors) could in some instances result in the occurrence of inaccurate data points. To detect potential errors in data collection, outliers across countries and time should be identified by applying Chauvenet’s Criterion in statistical theory. This rule defines unreliable data points as those observations whose probability of occurrence is less than 1/(2N), where N is the total number of observations. The exact value of the criterion for any N can be determined using the Gaussian probability distribution where the assumption of normality in the underlying data holds. For N = 41 (e.g. number of countries covered in She Figures 2015), the criterion states that scores higher or lower than 2.5 times the standard deviation should be further investigated. Note that this step should be performed only once (no iterations of the removal process for a given dataset) and that any exclusion must be dealt with care as this is a criterion in the ‘statistical sense’. Indeed, such outliers may still reflect true variation in the phenomena being measured.
She Figures Handbook, 2015
Page 117
Coherence checks
For data broken down in categories, totals are also available. Categories are defined regarding:
• Sex
• Age groups (see later in this section ‘Additional data considerations’)
• Institutional sectors (see main grouping as defined by the Frascati Manual)
• NACE activities (see NACE Rev. 2.0 categories under Section 2.4.11)
• Fields of science (see ‘Fields of science’ in Section 2.4.6 as well as in Table 3.2 of Frascati Manual)
• Education levels and fields (see categories in Section 2.1.3) of education (see the International Standard Classification of Education, UNESCO, 1997)
• Grades (see definition of grades in Annex 2)
• Academic positions
• ISCO-08 categories (see definition of Major Groups in ILO, 2012)
• R&D personnel categories
• Countries
• Years
Having available both the broken-down data and the totals allows for coherence checks by comparing provided totals with the sum of provided data by categories. For example, a check which can be performed on most of the tables is that the sum of the values for women (w) and men (m) should correspond to the reported totals (t), hence the verification is done by applying the definition t = w + m. A similar data verification procedure is followed to assess whether reported totals correspond to the sums of breakdowns at the level of the above-mentioned categorisations. Table 4 below shows the details of these coherence checks for each of the specific data sources adopted in the data-gathering process.

She Figures Handbook, 2015
Page 118
Table 4 List of coherence checks
Data Verification Description Verification Formula
E1 (which includes: hrst_st_ncat, lsfi_emp_a and htec_kia_emp2): HRST BY SUBGROUPS, AGE AND SEX (2002–2013), EMPLOYMENT (MAIN CHARACTERISTICS AND RATES) – ANNUAL AVERAGES, ANNUAL DATA ON EMPLOYMENT IN KNOWLEDGE-INTENSIVE ACTIVITIES AT THE NATIONAL LEVEL, BY SEX (FROM 2008 ONWARDS, NACE REV. 2)
Check Total sexes {Men} + {Women} = Total
E2 (which includes: rd_p_femres): EMPLOYMENT (MAIN CHARACTERISTICS AND RATES) – ANNUAL AVERAGES (2002–2013)
Check Total countries
{AT}+ {BE}+ {BG}+ {CY}+ {CZ}+ {HR}+ {DE}+ {DK}+ {EL}+ {EE}+ {ES}+ {FI}+ {FR}+ {HU}+ {IE}+ {IT}+ {LT}+ {LV}+ {LU}+ {MT}+ {NL}+ {PL}+ {PT}+ {RO}+ {SE}+ {SI}+ {SK}+ {UK} = EU (28 countries)
E3 (which includes: rd_p_persocc): ANNUAL DATA ON EMPLOYMENT IN KNOWLEDGE-INTENSIVE ACTIVITIES AT THE NATIONAL LEVEL, BY SEX (FROM 2008 ONWARDS, NACE REV. 2)
Check Total sexes {Men} + {Women} = Total
Check Total sectors {BES} + {GOV} + {HES} + {PNP} = All sectors
Check Total R&D personnel categories
{Researchers} + {Technicians/equivalent staff} + {Other supporting staff} = Total
Check Total countries
{AT}+ {BE}+ {BG}+ {CY}+ {CZ}+ {HR}+ {DE}+ {DK}+ {EL}+ {EE}+ {ES}+ {FI}+ {FR}+ {HU}+ {IE}+ {IT}+ {LT}+ {LV}+ {LU}+ {MT}+ {NL}+ {PL}+ {PT}+ {RO}+ {SE}+ {SI}+ {SK}+ {UK} = EU (28 countries)
E4 (which includes: rd_p_persage): RESEARCHERS (HC) IN GOVERNMENT AND HIGHER EDUCATION SECTOR BY AGE AND SEX
Check Total sexes {Men} + {Women} = Total
Check Total age groups {<25} + {25–34} + {35–44} + {45–54} + {55–64} + {65+} = Total

She Figures Handbook, 2015
Page 119
Data Verification Description Verification Formula
E5 (which includes: educ_grad5): GRADUATIONS IN ISCED 3 TO 6 BY FIELD OF EDUCATION AND SEX
Check Total sexes {Men} + {Women} = Total
Check Total fields of education
{EF14} + {EF2} + {EF3} + {EF4} + {EF5} + {EF6} + {EF7} + {EF8} + {Unknown} = Total per ISCED-97
E6 (which includes: rd_p_perssci): TOTAL R&D PERSONNEL AND RESEARCHERS BY SECTORS OF PERFROMANCE, SEX AND FIELDS OF SCIENCE
Check Total sexes {Men} + {Women} = Total
Check Total sectors {BES} + {GOV} + {HES} + {PNP} = All sectors
Check Total fields of science {FOS1–4} + {FOS 5–6} + {NSP} = Total
E7 (which includes: rd_p_bempoccr2): TOTAL R&D PERSONNEL AND RESEARCHERS, IN BUSINESS ENTERPRISE SECTOR BY ECONOMIC ACTIVITY AND SEX (NACE REV. 2)
Check Total sexes {Men} + {Women} = Total
Check Total NACE activities {A} + {B} + {C} + {D_E} + {F} + {G–N} + {O_P} + {Q} + {R} + {S} – {U} = All NACE activities
E8 (which includes: educ_enrl1tl): STUDENTS BY ISCED LEVEL, AGE AND SEX
Check Total sexes {Men} + {Women} = Total
Check Total age groups
{Y_LT3} + {Y3}+ {Y4} + {Y5} + {Y6} + {Y7} + {Y8} + {Y9} + {Y10} + {Y11} + {Y12} + {Y13} + {Y14} + {15–19} + {20–44} + {25–29} + {30–34} + {35–39} + {40+} + {Unknown} = Total
Check Total ISCED levels {ED0} + {ED1} + {ED2} + {ED3} + {ED4} + {ED5_6} =Total
E9 (which includes: educ_grad4): GRADUATES IN ICSED 5 AND 6 BY AGE AND SEX
Check Total sexes {Men} + {Women} = Total
Check Total age groups
{<15} + {15–19} + {20–24} + {25–29} + {30–34} + {35–39} + {40+} + {Unknown} = Total
Check Total education levels {ED5AD1} + {ED5AD2} + {ED5BQ1} + {ED5BQ2} + {ED6} + {ED6PHD} = Total

She Figures Handbook, 2015
Page 120
Data Verification Description Verification Formula
(ED5_6)
E10 (which includes: educ_enrl5): TERTIARY STUDENTS (ISCED 5–6) BY FIELD OF EDUCATION AND SEX
Check Total sexes {Men} + {Women} = Total
Check Total fields of education
{EF14} + {EF2} + {EF3} + {EF4} + {EF5} + {EF6} + {EF7} + {EF8} + {Unknown} = Total per ISCED-97
Check Total education levels {ED5A} + {ED5B} + {ED6} = Total (ED5_6)
E11 (which includes: rd_e_gerdtot): TERTIARY STUDENTS (ISCED 5–6) BY FIELD OF EDUCATION AND SEX
Check Total sectors {BES} + {GOV} + {HES} + {PNP} = All sectors
E12 (which includes: earn_ses_annual): TERTIARY STUDENTS (ISCED 5–6) BY FIELD OF EDUCATION AND SEX
Check Total age groups {<30} + {30–39} + {40–49} + {50–59} + {60+} = Total
Check Total ISCO-08 categories
{OC1–5} + {OC6–8} + {OC9} = Total
Women in Science Questionnaire – Table T1 (HC) and T2 (FTE): ACADEMIC STAFF BY SEX, GRADE AND MAIN FIELD OF SCIENCE AND AGE GROUP (FOR LATEST YEAR ONLY)
Check Total sexes {Men} + {Women} = Total
Check Total age groups {<35} + {35–44} + {45–54} + {55+} = Total
Check Total fields of science {NS} + {ET} + {MS} + {AS} + {SS} + {H} + {Unknown} = Total per grade
Check Total grades {A} + {B} + {C} + {D} = ALL grades
Women in Science Questionnaire – Table T3 (Team leaders) and T4 (Team members): APPLICANTS AND BENEFICIARIES OF PUBLICLY MANAGED RESEARCH FUNDS BY SEX, MAIN FIELD OF SCIENCE, AMOUNT APPLIED FOR AND AMOUNT RECEIVED
Check Total sexes {Men} + {Women} = Total
Check Total fields of science {NS} + {ET} + {MS} + {AS} + {SS} + {H} + {Unknown} = Total per fund
Check Comparison applicants and beneficiaries
# applicants > # beneficiaries

She Figures Handbook, 2015
Page 121
Data Verification Description Verification Formula
Women in Science Questionnaire – Table T5 & Table T6: PRESIDENTS / LEADERS AND MEMBERS OF SCIENTIFIC BOARDS BY SEX, FIELD OF SCIENCE, AND POSITION & PRESIDENTS / LEADERS AND MEMBERS OF ADMINISTRATIVE/ADVISORY BOARDS BY SEX, FIELD OF SCIENCE, AND POSITION
Check Total sexes {Men} + {Women} = Total
Check Total fields of science {NS} + {ET} + {MS} + {AS} + {SS} + {H} + {Unknown} = Total per board
Women in Science Questionnaire - Table T7 (institutions) and T8 (universities): HEADS OF INSTITUTIONS IN THE HES BY SEX & HEADS OF UNIVERSITIES OR ASSIMILATED INSTITUTIONS (BASED ON CAPACITY TO DELIVER PhDS) BY SEX
Check Total sexes {Men} + {Women} = Total
Check Number of institutes # institutes T7 ≥ # institutes T8
MORE Survey
Check Total sexes {Men} + {Women} = Total
Check Total contract types
{Part-time} + {Full-time} = Total
{Permanent} + {Fixed-term} + {No contract} + {Self-employment} + {Other} = Total
Check Total ‘Precarious’ contracts
{Fixed-term up to 1 year} + {No contract} + {Other} = Precarious
Check Total countries
{AT}+ {BE}+ {BG}+ {CY}+ {CZ}+ {HR}+ {DE}+ {DK}+ {EL}+ {EE}+ {ES}+ {FI}+ {FR}+ {HU}+ {IE}+ {IT}+ {LT}+ {LV}+ {LU}+ {MT}+ {NL}+ {PL}+ {PT}+ {RO}+ {SE}+ {SI}+ {SK}+ {UK} = EU (28 countries)
NB: MORE2 Survey calculated only EU-27 average
ERA SURVEY Check Total RPOs For each measure, {Number that adopted each measure} + {Number that did not adopt each measure} = Total
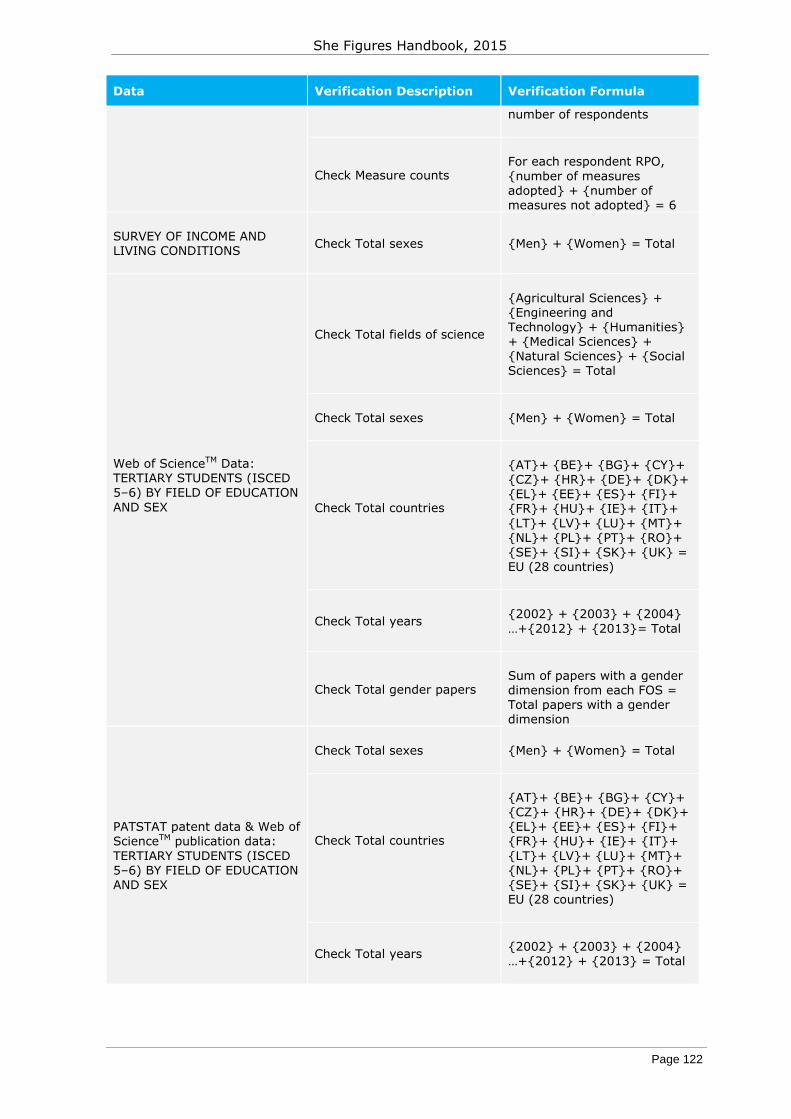
She Figures Handbook, 2015
Page 122
Data Verification Description Verification Formula
number of respondents
Check Measure counts For each respondent RPO, {number of measures adopted} + {number of measures not adopted} = 6
SURVEY OF INCOME AND LIVING CONDITIONS Check Total sexes {Men} + {Women} = Total
Web of ScienceTM Data: TERTIARY STUDENTS (ISCED 5–6) BY FIELD OF EDUCATION AND SEX
Check Total fields of science
{Agricultural Sciences} + {Engineering and Technology} + {Humanities} + {Medical Sciences} + {Natural Sciences} + {Social Sciences} = Total
Check Total sexes {Men} + {Women} = Total
Check Total countries
{AT}+ {BE}+ {BG}+ {CY}+ {CZ}+ {HR}+ {DE}+ {DK}+ {EL}+ {EE}+ {ES}+ {FI}+ {FR}+ {HU}+ {IE}+ {IT}+ {LT}+ {LV}+ {LU}+ {MT}+ {NL}+ {PL}+ {PT}+ {RO}+ {SE}+ {SI}+ {SK}+ {UK} = EU (28 countries)
Check Total years {2002} + {2003} + {2004} …+{2012} + {2013}= Total
Check Total gender papers Sum of papers with a gender dimension from each FOS = Total papers with a gender dimension
PATSTAT patent data & Web of ScienceTM publication data: TERTIARY STUDENTS (ISCED 5–6) BY FIELD OF EDUCATION AND SEX
Check Total sexes {Men} + {Women} = Total
Check Total countries
{AT}+ {BE}+ {BG}+ {CY}+ {CZ}+ {HR}+ {DE}+ {DK}+ {EL}+ {EE}+ {ES}+ {FI}+ {FR}+ {HU}+ {IE}+ {IT}+ {LT}+ {LV}+ {LU}+ {MT}+ {NL}+ {PL}+ {PT}+ {RO}+ {SE}+ {SI}+ {SK}+ {UK} = EU (28 countries)
Check Total years {2002} + {2003} + {2004} …+{2012} + {2013} = Total

She Figures Handbook, 2015
Page 123
Note that a final visual scan of the formatted tables/charts appearing in the main publication is performed in the end to detect any inconsistencies that would have been overlooked in previous validation steps.
Additional data considerations
Age groups
Data referring to the labour force refer to all persons aged 15+ living in private households and include the employed and the unemployed. Data referring to human resources in science and technology (HRST) refer to the age group 25–64.
Small numbers
For some countries with small populations, raw data relating to small numbers of people have been reported here. The percentages and indicators have not always been included (mostly growth rates) and this is identified in the footnotes to the indicators. The reader is therefore asked to bear this in mind when interpreting the most disaggregated data, in particular for Luxembourg, Cyprus and Malta, and, in some cases, for Estonia, Iceland and Latvia.
EU estimates
EU totals estimated by DG Research and Innovation (as noted in the footnotes) are based upon existing data for the reference year in combination with the next available year if the reference year is unavailable, in the following sequence (n-1, n+1, n-2, n+2, etc.).
The aggregates were estimated by DG Research and Innovation only when at least 60 % of the EU population on a given indicator was available. These estimates are intended only as an indication for the reader.
Rounding error
In some cases, the row or column totals do not match the sum of the data. This may be due to rounding error.
Decimal places
All the data in the figures have been calculated at the precision levels of one or two decimals. However, the values have been rounded in the figures to make them fit.
Cut-off date
The cut-off date for data downloaded from Eurostat’s dissemination database (Eurostat) is usually around October. Due to the large variety of data sources and variability in data availability, some other cut-off dates are used in order to gather all the required data.
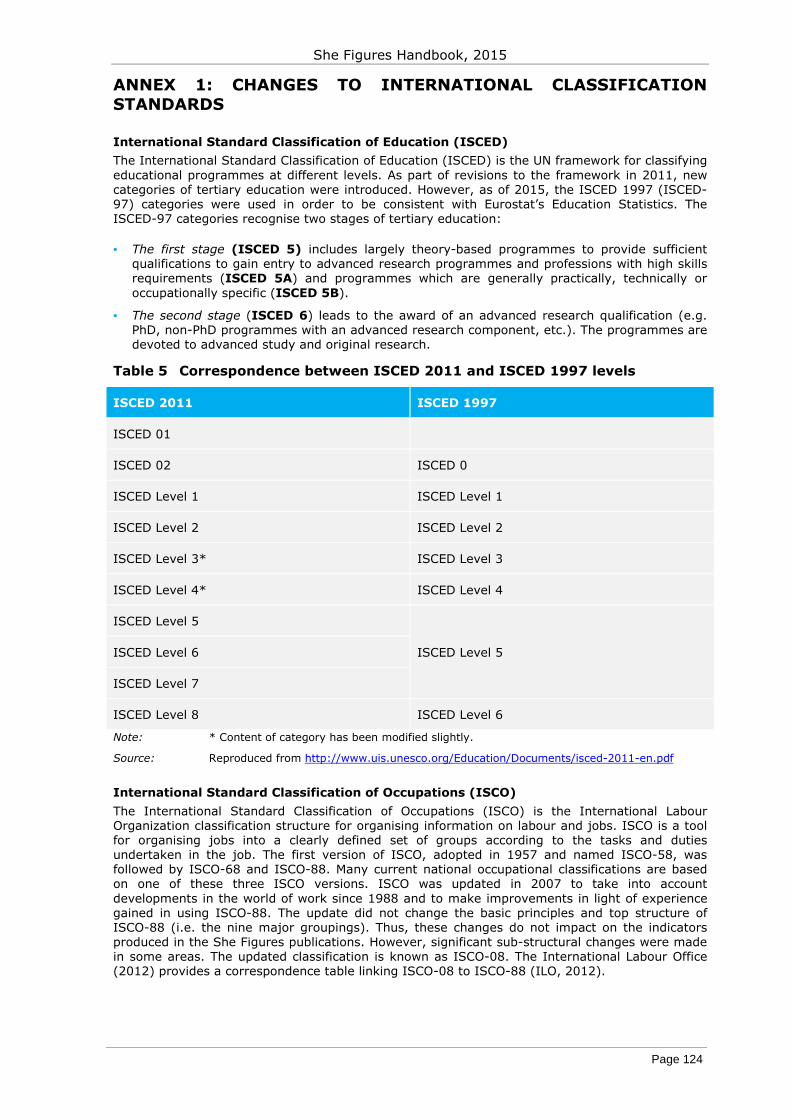
She Figures Handbook, 2015
Page 124
ANNEX 1: CHANGES TO INTERNATIONAL CLASSIFICATION STANDARDS
International Standard Classification of Education (ISCED)
The International Standard Classification of Education (ISCED) is the UN framework for classifying educational programmes at different levels. As part of revisions to the framework in 2011, new categories of tertiary education were introduced. However, as of 2015, the ISCED 1997 (ISCED-97) categories were used in order to be consistent with Eurostat’s Education Statistics. The ISCED-97 categories recognise two stages of tertiary education:
• The first stage (ISCED 5) includes largely theory-based programmes to provide sufficient qualifications to gain entry to advanced research programmes and professions with high skills requirements (ISCED 5A) and programmes which are generally practically, technically or occupationally specific (ISCED 5B).
• The second stage (ISCED 6) leads to the award of an advanced research qualification (e.g. PhD, non-PhD programmes with an advanced research component, etc.). The programmes are devoted to advanced study and original research.
Table 5 Correspondence between ISCED 2011 and ISCED 1997 levels
ISCED 2011 ISCED 1997
ISCED 01
ISCED 02 ISCED 0
ISCED Level 1 ISCED Level 1
ISCED Level 2 ISCED Level 2
ISCED Level 3* ISCED Level 3
ISCED Level 4* ISCED Level 4
ISCED Level 5
ISCED Level 5 ISCED Level 6
ISCED Level 7
ISCED Level 8 ISCED Level 6
Note: * Content of category has been modified slightly.
Source: Reproduced from http://www.uis.unesco.org/Education/Documents/isced-2011-en.pdf
International Standard Classification of Occupations (ISCO)
The International Standard Classification of Occupations (ISCO) is the International Labour Organization classification structure for organising information on labour and jobs. ISCO is a tool for organising jobs into a clearly defined set of groups according to the tasks and duties undertaken in the job. The first version of ISCO, adopted in 1957 and named ISCO-58, was followed by ISCO-68 and ISCO-88. Many current national occupational classifications are based on one of these three ISCO versions. ISCO was updated in 2007 to take into account developments in the world of work since 1988 and to make improvements in light of experience gained in using ISCO-88. The update did not change the basic principles and top structure of ISCO-88 (i.e. the nine major groupings). Thus, these changes do not impact on the indicators produced in the She Figures publications. However, significant sub-structural changes were made in some areas. The updated classification is known as ISCO-08. The International Labour Office (2012) provides a correspondence table linking ISCO-08 to ISCO-88 (ILO, 2012).

She Figures Handbook, 2015
Page 125
The International Standard Classification of Occupations (ISCO-88)
Professionals are subdivided into four sub-major groups: physical, mathematical and engineering science professionals; life science and health professionals; teaching professionals; and other professionals. The first two make up the subset of scientists and engineers (S&E).
Technicians and associate professionals are subdivided in four sub-major groups: physical and engineering science associate professionals; life science and health associate professionals; teaching associate professionals; and other associate professionals
The International Standard Classification of Occupations (ISCO-08)
Professionals are subdivided into six sub-major groups: science and engineering professionals; health professionals; teaching professionals; business and administration professionals; information and communications technology professionals; and legal, social and cultural professionals.
Technicians and associate professionals are subdivided into five sub-major groups: science and engineering associate professionals; health associate professionals; business and administration associate professionals; legal, social, cultural and related associate professionals; and information and communications technicians.
Changes to the definition of scientists and engineers (S&E)
Prior to 2011, scientists and engineers (S&E) were defined as people who worked in:
• Physical, mathematical and engineering occupations (ISCO-88, Code 21)
• Life science and health occupations (ISCO-88, Code 22)
With the new ISCO-08 classification (in use from 2011), S&E are defined as people who work as:
• Science and engineering professionals (ISCO-08, Code 21)
• Health professionals (ISCO-08, Code 22)
• Information and communications technology professionals (ISCO-08, Code 25)
HRST on Eurostat
HRST on Eurostat has made use of ISCO-08 since 2011. This has a knock-on effect on individuals covered by the ‘HRSTO’ group.
HRSTC: Human Resources in Science and Technology Core – People who are both HRSTE and HRSTO.
• HRSTE: Human Resources in Science & Technology Education – People who have successfully completed tertiary education in any ISCED-97 field of study.
• HRSTO: Human Resources in Science and Technology Occupations – People employed in S&T occupations as ‘Professionals’ or ‘Technicians and Associate Professionals’.
For more information, go to Annex 1, HRST Stocks, available here: http://ec.europa.eu/eurostat/cache/metadata/en/hrst_esms.htm
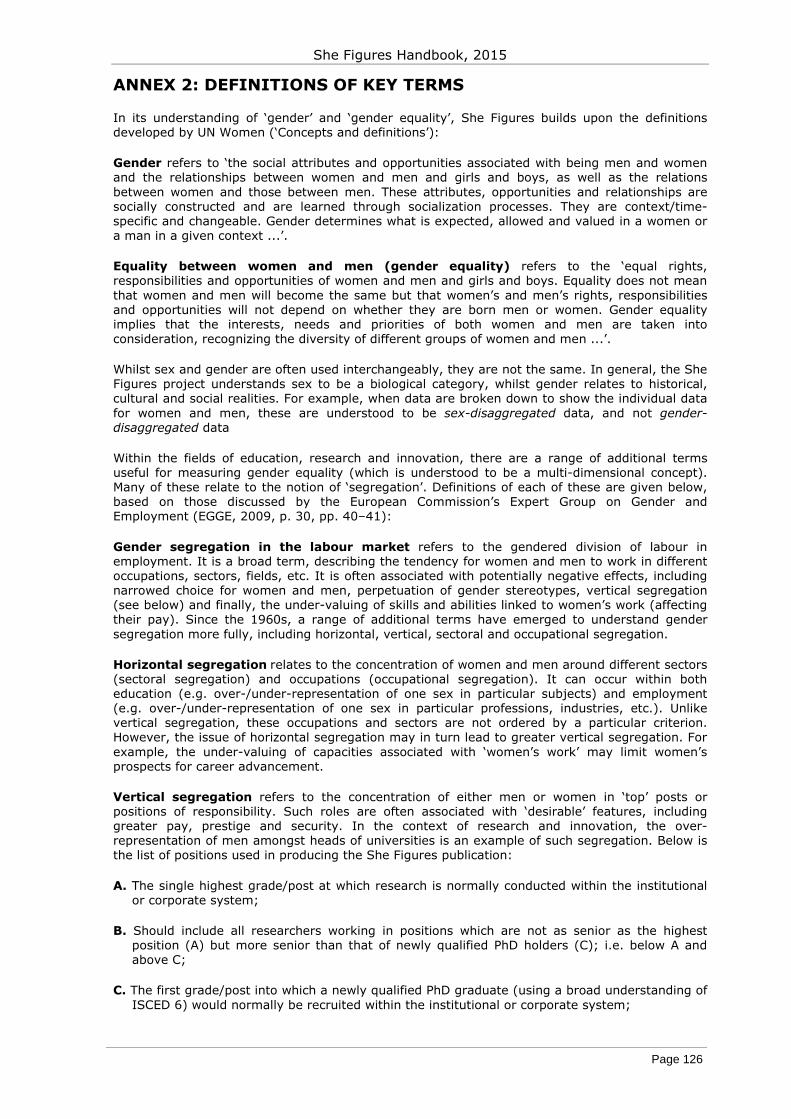
She Figures Handbook, 2015
Page 126
ANNEX 2: DEFINITIONS OF KEY TERMS
In its understanding of ‘gender’ and ‘gender equality’, She Figures builds upon the definitions developed by UN Women (‘Concepts and definitions’):
Gender refers to ‘the social attributes and opportunities associated with being men and women and the relationships between women and men and girls and boys, as well as the relations between women and those between men. These attributes, opportunities and relationships are socially constructed and are learned through socialization processes. They are context/time-specific and changeable. Gender determines what is expected, allowed and valued in a women or a man in a given context ...’.
Equality between women and men (gender equality) refers to the ‘equal rights, responsibilities and opportunities of women and men and girls and boys. Equality does not mean that women and men will become the same but that women’s and men’s rights, responsibilities and opportunities will not depend on whether they are born men or women. Gender equality implies that the interests, needs and priorities of both women and men are taken into consideration, recognizing the diversity of different groups of women and men ...’.
Whilst sex and gender are often used interchangeably, they are not the same. In general, the She Figures project understands sex to be a biological category, whilst gender relates to historical, cultural and social realities. For example, when data are broken down to show the individual data for women and men, these are understood to be sex-disaggregated data, and not gender-disaggregated data
Within the fields of education, research and innovation, there are a range of additional terms useful for measuring gender equality (which is understood to be a multi-dimensional concept). Many of these relate to the notion of ‘segregation’. Definitions of each of these are given below, based on those discussed by the European Commission’s Expert Group on Gender and Employment (EGGE, 2009, p. 30, pp. 40–41):
Gender segregation in the labour market refers to the gendered division of labour in employment. It is a broad term, describing the tendency for women and men to work in different occupations, sectors, fields, etc. It is often associated with potentially negative effects, including narrowed choice for women and men, perpetuation of gender stereotypes, vertical segregation (see below) and finally, the under-valuing of skills and abilities linked to women’s work (affecting their pay). Since the 1960s, a range of additional terms have emerged to understand gender segregation more fully, including horizontal, vertical, sectoral and occupational segregation.
Horizontal segregation relates to the concentration of women and men around different sectors (sectoral segregation) and occupations (occupational segregation). It can occur within both education (e.g. over-/under-representation of one sex in particular subjects) and employment (e.g. over-/under-representation of one sex in particular professions, industries, etc.). Unlike vertical segregation, these occupations and sectors are not ordered by a particular criterion. However, the issue of horizontal segregation may in turn lead to greater vertical segregation. For example, the under-valuing of capacities associated with ‘women’s work’ may limit women’s prospects for career advancement.
Vertical segregation refers to the concentration of either men or women in ‘top’ posts or positions of responsibility. Such roles are often associated with ‘desirable’ features, including greater pay, prestige and security. In the context of research and innovation, the over-representation of men amongst heads of universities is an example of such segregation. Below is the list of positions used in producing the She Figures publication:
A. The single highest grade/post at which research is normally conducted within the institutional or corporate system;
B. Should include all researchers working in positions which are not as senior as the highest position (A) but more senior than that of newly qualified PhD holders (C); i.e. below A and above C;
C. The first grade/post into which a newly qualified PhD graduate (using a broad understanding of ISCED 6) would normally be recruited within the institutional or corporate system;

She Figures Handbook, 2015
Page 127
D. Either postgraduate students who do not yet hold a PhD degree (using a broad understanding of ISCED 6) but who are engaged as researchers (on the payroll), or researchers working in posts that do not normally require a PhD.
Research boards
She Figures 2015 introduced new definitions of ‘boards’ as part of the Women in Science questionnaire, based on consultation with the European Commission and the Statistical Correspondents. These distinguish more clearly between the functions of different boards, by focusing on ‘scientific boards’ and ‘administrative/advisory boards’:
Scientific boards of research organisations: ‘A publicly or privately managed and financed group of elected or appointed experts that exists to implement scientific policy by, amongst other things, directing the research agenda, resource allocation and management within scientific research.’
Administrative/advisory boards of research organisations: ‘A publicly or privately managed and financed group of elected or appointed experts that exists to support the research agenda in a non-executive function by, amongst other things, administering research activities, consulting and coordinating different actors and taking a general advisory role.’
Where boards fall into both categories, this was indicated by Statistical Correspondents. She Figures includes only research boards of national research performing organisations (RPOs), as opposed to all research organisations operating in a particular country.
Whilst data were collected separately for the two types of boards in 2015, this indicator remained combined in one indicator in the publication. The possibility of presenting these as two separate indicators may be explored in subsequent editions of the publication.
Gender dimension in research content (GDRC)
‘Gender dimension in research: is a concept regrouping the various aspects concerning biological characteristics and social/cultural factors of both women and men into the development of research policies, programmes and projects’ (European Commission, 2014e).
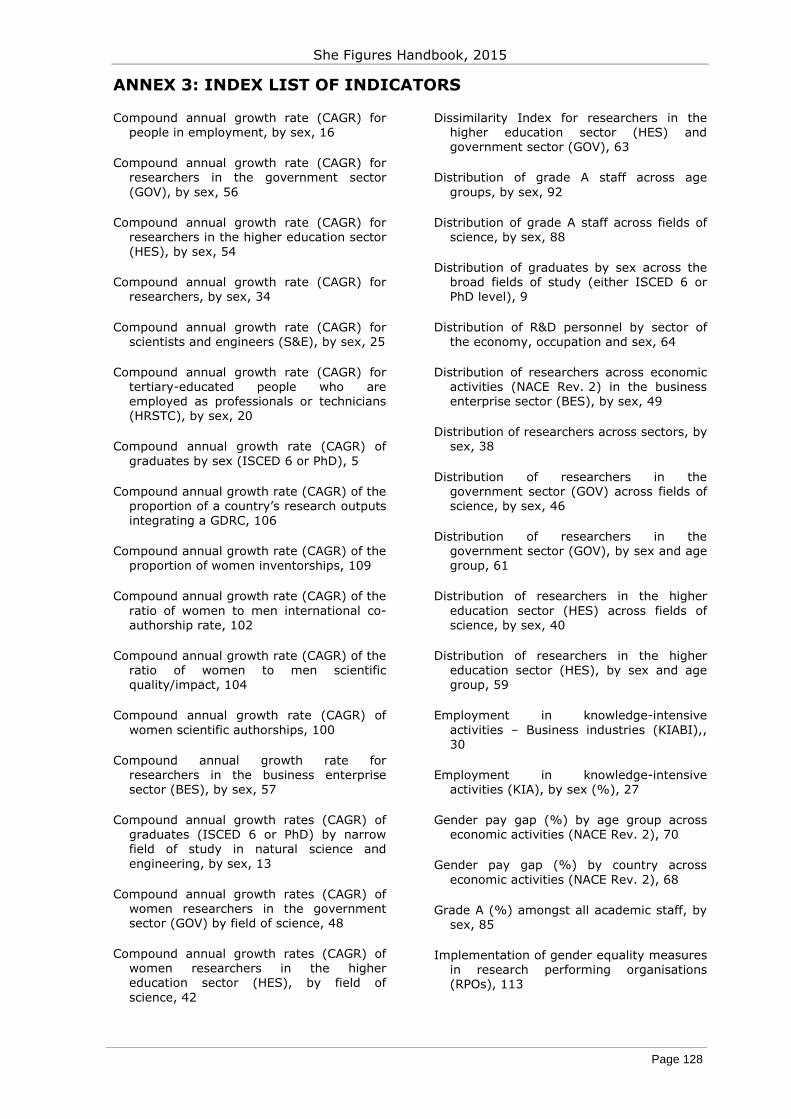
She Figures Handbook, 2015
Page 128
ANNEX 3: INDEX LIST OF INDICATORS
Compound annual growth rate (CAGR) for people in employment, by sex, 16
Compound annual growth rate (CAGR) for researchers in the government sector (GOV), by sex, 56
Compound annual growth rate (CAGR) for researchers in the higher education sector (HES), by sex, 54
Compound annual growth rate (CAGR) for researchers, by sex, 34
Compound annual growth rate (CAGR) for scientists and engineers (S&E), by sex, 25
Compound annual growth rate (CAGR) for tertiary-educated people who are employed as professionals or technicians (HRSTC), by sex, 20
Compound annual growth rate (CAGR) of graduates by sex (ISCED 6 or PhD), 5
Compound annual growth rate (CAGR) of the proportion of a country’s research outputs integrating a GDRC, 106
Compound annual growth rate (CAGR) of the proportion of women inventorships, 109
Compound annual growth rate (CAGR) of the ratio of women to men international co-authorship rate, 102
Compound annual growth rate (CAGR) of the ratio of women to men scientific quality/impact, 104
Compound annual growth rate (CAGR) of women scientific authorships, 100
Compound annual growth rate for researchers in the business enterprise sector (BES), by sex, 57
Compound annual growth rates (CAGR) of graduates (ISCED 6 or PhD) by narrow field of study in natural science and engineering, by sex, 13
Compound annual growth rates (CAGR) of women researchers in the government sector (GOV) by field of science, 48
Compound annual growth rates (CAGR) of women researchers in the higher education sector (HES), by field of science, 42
Dissimilarity Index for researchers in the higher education sector (HES) and government sector (GOV), 63
Distribution of grade A staff across age groups, by sex, 92
Distribution of grade A staff across fields of science, by sex, 88
Distribution of graduates by sex across the broad fields of study (either ISCED 6 or PhD level), 9
Distribution of R&D personnel by sector of the economy, occupation and sex, 64
Distribution of researchers across economic activities (NACE Rev. 2) in the business enterprise sector (BES), by sex, 49
Distribution of researchers across sectors, by sex, 38
Distribution of researchers in the government sector (GOV) across fields of science, by sex, 46
Distribution of researchers in the government sector (GOV), by sex and age group, 61
Distribution of researchers in the higher education sector (HES) across fields of science, by sex, 40
Distribution of researchers in the higher education sector (HES), by sex and age group, 59
Employment in knowledge-intensive activities – Business industries (KIABI),, 30
Employment in knowledge-intensive activities (KIA), by sex (%), 27
Gender pay gap (%) by age group across economic activities (NACE Rev. 2), 70
Gender pay gap (%) by country across economic activities (NACE Rev. 2), 68
Grade A (%) amongst all academic staff, by sex, 85
Implementation of gender equality measures in research performing organisations (RPOs), 113
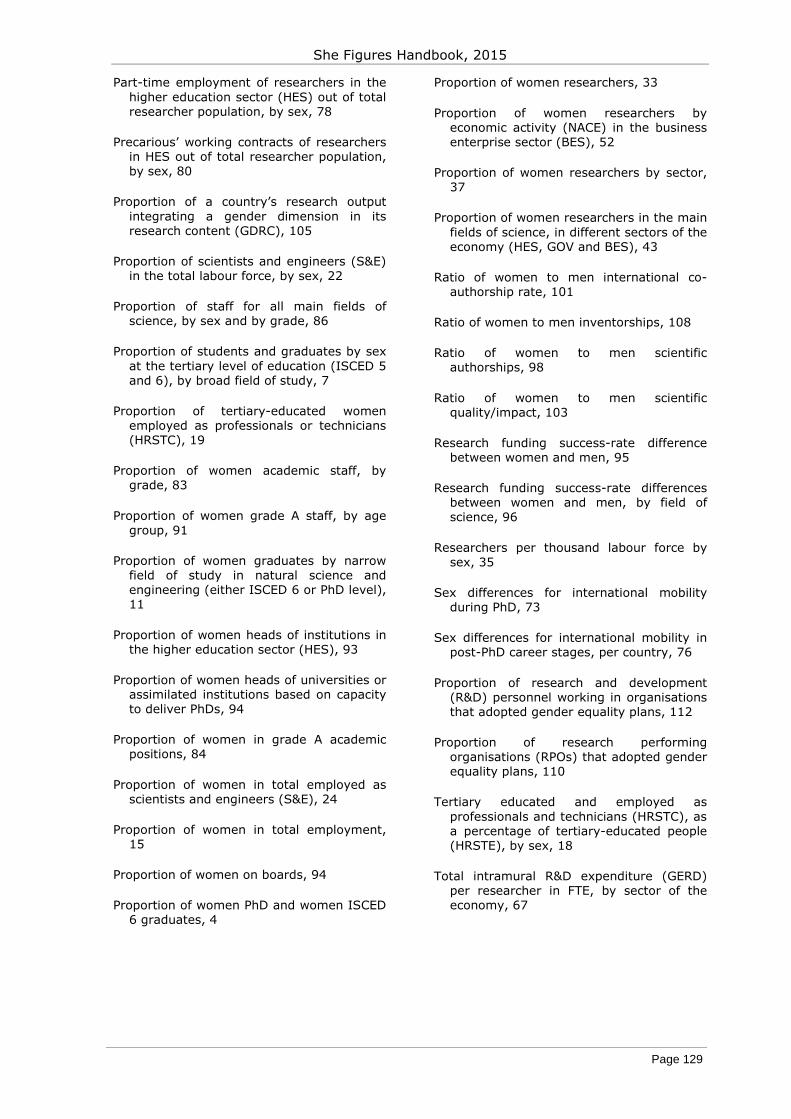
She Figures Handbook, 2015
Page 129
Part-time employment of researchers in the higher education sector (HES) out of total researcher population, by sex, 78
Precarious’ working contracts of researchers in HES out of total researcher population, by sex, 80
Proportion of a country’s research output integrating a gender dimension in its research content (GDRC), 105
Proportion of scientists and engineers (S&E) in the total labour force, by sex, 22
Proportion of staff for all main fields of science, by sex and by grade, 86
Proportion of students and graduates by sex at the tertiary level of education (ISCED 5 and 6), by broad field of study, 7
Proportion of tertiary-educated women employed as professionals or technicians (HRSTC), 19
Proportion of women academic staff, by grade, 83
Proportion of women grade A staff, by age group, 91
Proportion of women graduates by narrow field of study in natural science and engineering (either ISCED 6 or PhD level), 11
Proportion of women heads of institutions in the higher education sector (HES), 93
Proportion of women heads of universities or assimilated institutions based on capacity to deliver PhDs, 94
Proportion of women in grade A academic positions, 84
Proportion of women in total employed as scientists and engineers (S&E), 24
Proportion of women in total employment, 15
Proportion of women on boards, 94
Proportion of women PhD and women ISCED 6 graduates, 4
Proportion of women researchers, 33
Proportion of women researchers by economic activity (NACE) in the business enterprise sector (BES), 52
Proportion of women researchers by sector, 37
Proportion of women researchers in the main fields of science, in different sectors of the economy (HES, GOV and BES), 43
Ratio of women to men international co-authorship rate, 101
Ratio of women to men inventorships, 108
Ratio of women to men scientific authorships, 98
Ratio of women to men scientific quality/impact, 103
Research funding success-rate difference between women and men, 95
Research funding success-rate differences between women and men, by field of science, 96
Researchers per thousand labour force by sex, 35
Sex differences for international mobility during PhD, 73
Sex differences for international mobility in post-PhD career stages, per country, 76
Proportion of research and development (R&D) personnel working in organisations that adopted gender equality plans, 112
Proportion of research performing organisations (RPOs) that adopted gender equality plans, 110
Tertiary educated and employed as professionals and technicians (HRSTC), as a percentage of tertiary-educated people (HRSTE), by sex, 18
Total intramural R&D expenditure (GERD) per researcher in FTE, by sector of the economy, 67
130
REFERENCES
Archambault, É., Caruso, J. and Beauchesne, O. (2011), Towards a Multilingual, Comprehensive and Open Scientific Journal Ontology, in Noyons, B., Ngulube, P. and Leta, J., Proceedings of the 13th International Conference of the International Society for Scientometrics and Informetrics (ISSI), Durban, South Africa, pp 66–77.
Bagilhole, B., (2005), NORFACE gender equality workshop address, Rejkjavik, Iceland.
Butler, J. (1993), Bodies that matter: on the discursive limits of sex [pdf], available at http://eng5010.pbworks.com/f/ButlerBodiesThatMatterEx.pdf.
Council of the European Union (2011), Council conclusions on the European Pact for Gender Equality for the period 2011–2020 [pdf], available at https://www.consilium.europa.eu/uedocs/cms_data/docs/pressdata/en/lsa/119628.pdf.
Council of the EU (2012), Conclusions on ‘A reinforced European Research Area partnership for excellence and growth’ [pdf], available at http://www.consilium.europa.eu/uedocs/cms_data/docs/pressdata/en/intm/134168.pdf.
Council of the European Union (2014), Council conclusions on women and the economy: Economic independence from the perspective of part-time work and self-employment [pdf], available at http://www.consilium.europa.eu/uedocs/cms_data/docs/pressdata/en/lsa/143269.pdf.
DG Justice (2014), Tackling the gender pay gap in the European Union [pdf], Publications Office of the European Union, Luxembourg, available at http://ec.europa.eu/justice/gender-equality/files/gender_pay_gap/gpg_brochure_2013_final_en.pdf.
DG Justice, ‘Database: Women and men in decision-making’, available at http://ec.europa.eu/justice/gender-equality/gender-decision-making/database/index_en.htm.
DG Research (2008), Mapping the maze: Getting more women to the top in research [pdf], Office for Official Publications of the European Communities, Luxembourg, available at http://ec.europa.eu/research/science-society/document_library/pdf_06/mapping-the-maze-getting-more-women-to-the-top-in-research_en.pdf.
DG Research (2009a), The gender challenge in research funding: Assessing the European national scenes [pdf], Office for Official Publications of the European Communities, Luxembourg, available at http://ec.europa.eu/research/science-society/document_library/pdf_06/gender-challenge-in-research-funding_en.pdf.
DG Research (2009b), She Figures 2009 [pdf], Publications Office of the European Union, Luxembourg, available at http://ec.europa.eu/research/science-society/document_library/pdf_06/she_figures_2009_en.pdf.
DG Research (2009c), Women in science and technology: Creating sustainable careers [pdf], Office for Official Publications of the European Communities, Luxembourg, available at http://ec.europa.eu/research/science-society/document_library/pdf_06/wist2_sustainable-careers-report_en.pdf.
DG Research, ‘Subtle bias’, available at http://ec.europa.eu/research/swafs/gendered-innovations/index_en.cfm.
DG Research and Innovation (2012a), ‘Drive to integrate the gender dimension in science’, available at http://ec.europa.eu/research/infocentre/article_en.cfm?artid=28773.
DG Research and Innovation (2012b), Researchers’ Report 2012, available at http://ec.europa.eu/euraxess/pdf/research_policies/121003_The_Researchers_Report_2012_FINAL_REPORT.pdf.
DG Research and Innovation (2012c), She Figures 2012 [pdf], Publications Office of the European Union, Luxembourg, available at http://www.eurofound.europa.eu/sites/default/files/ef_publication/field_ef_document/ef1327en.pdf
DG Research and Innovation (2012d), Structural change in research institutions: Enhancing excellence, gender equality and efficiency in research and innovation [pdf], Publications Office of

131
the European Union, Luxembourg, available at http://ec.europa.eu/research/science-society/document_library/pdf_06/structural-changes-final-report_en.pdf.
DG Research and Innovation (2013), ERA: Progress Report [pdf], Publications Office of the European Union, Luxembourg, available at http://ec.europa.eu/research/era/pdf/era_progress_report2013/era_progress_report2013.pdf.
DG Research and Innovation (2014), HORIZON 2020 in Brief [pdf], Publications Office of the European Union, Luxembourg, available at http://ec.europa.eu/programmes/horizon2020/sites/horizon2020/files/H2020_inBrief_EN_FinalBAT.pdf.
DG Research and Innovation, ‘Science: It’s a girl thing!’, available at http://science-girl-thing.eu/en.
Ecklund, E. H. and Lincoln, A. E. (2011), ‘Scientists want more children’, PLoS ONE Vol. 6, No. 8: e22590. doi:10.1371/journal.pone.0022590.
EIGE, ‘Gender Equality Index’, available at http://eige.europa.eu/content/gender-equality-index#/domain/power.
Eurofound (2013), Women, men and working conditions: Executive summary [pdf], Dublin, available at http://www.eurofound.europa.eu/sites/default/files/ef_files/pubdocs/2013/491/en/1/EF13491EN.pdf.
European Commission (1999), ‘Women and science: Mobilising women to enrich European research’, COM(1999)76.
European Commission (2010a), ‘Europe 2020 Flagship Initiative: Innovation Union’, COM(2010)546 final.
European Commission (2010b), ‘Europe 2020: A strategy for smart, sustainable and inclusive growth’, COM(2010)2020.
European Commission (2011a), ‘Horizon 2020: The Framework Programme for Research and Innovation’, COM(2011)808 final.
European Commission (2011b), ‘Supporting growth and jobs – an agenda for the modernisation of Europe’s higher education systems’, COM(2011)567 final.
European Commission (2012a), ‘A reinforced European Research Area partnership for excellence and Growth’, COM(2012)392 final, available at http://ec.europa.eu/euraxess/pdf/research_policies/era-communication_en.pdf.
European Commission (2013a), MORE2: Higher Education Sector Report (Methodological Report), European Commission, Brussels.
European Commission (2013b), MORE2 Survey: Final report, European Commission, Brussels.
European Commission (2014a), ‘Education statistics’, available at http://ec.europa.eu/eurostat/statistics-explained/index.php/Education_statistics#Data_sources_and_availability.
European Commission (2014b), ‘Human resources in science and technology’, available at http://ec.europa.eu/eurostat/cache/metadata/en/hrst_esms.htm.
European Commission (2014c), ‘Income and living conditions: Overview’, available at http://ec.europa.eu/eurostat/web/income-and-living-conditions/overview.
European Commission (2014d), Report on progress on equality between women and men in 2013 [pdf], SWD(2014) 142 final, available at http://ec.europa.eu/justice/gender-equality/files/swd_2014_142_en.pdf.
European Commission (2014e). Gender Equality in Horizon 2020 [pdf], available at http://ec.europa.eu/research/participants/data/ref/h2020/grants_manual/hi/gender/h2020-hi-guide-gender_en.pdf.
132
European Commission (2015a), ‘Education and training: Overview’, available at http://ec.europa.eu/eurostat/web/education-and-training/overview.
European Commission (2015b), ‘Education statistics at regional level’, available at http://ec.europa.eu/eurostat/statistics-explained/index.php/Education_statistics_at_regional_level.
European Commission (2015c), ‘High-tech statistics’, available at http://ec.europa.eu/eurostat/statistics-explained/index.php/High-tech_statistics#Database.
European Commission (2015d), ‘Human resources in science and technology: Statistics explained’, available at http://ec.europa.eu/eurostat/statistics-explained/index.php/Human_resources_in_science_and_technology#Women_in_science_and_technology.
European Commission (2015e), ‘Labour market: Earnings’, available at http://ec.europa.eu/eurostat/web/labour-market/earnings.
European Commission (2015f), ‘Science, technology and innovation: Overview’, available at http://ec.europa.eu/eurostat/web/science-technology-innovation/overview.
European Commission, ‘More’, available at http://www.researchersmobility.eu/.
European Commission, ‘More 2’, available at http://www.more-2.eu/.
European Commission’s Expert Group on Gender and Employment (EGGE) (2009), Gender segregation in the labour market: Root causes, implications and policy responses in the EU [pdf], Publications Office of the European Union, Luxembourg, available at http://ec.europa.eu/social/main.jsp?catId=738&langId=en&pubId=364&furtherPubs=yes.
European Network of Legal Experts in the field of Gender Equality (ENLEFGE) (updated 2012), Positive action measures to ensure full equality in practice between men and women, including on company boards [pdf], available at http://ec.europa.eu/justice/gender-equality/files/gender_balance_decision_making/report_gender-balance_2012_en.pdf.
European Commission’s Network to Promote Women in Decision-making in Politics and the Economy (NPWDPE) (2012), Working paper: How to engage senior men to promote women to decision-making positions [pdf], available at http://ec.europa.eu/justice/gender-equality/files/gender_balance_decision_making/working_paper_engage_men_promote_women_en.pdf.
Eurostat – Methodologies and Working papers (2008), Nace Rev.2 – Statistical classification of economic activities in the European Community, available at http://ec.europa.eu/eurostat/documents/3859598/5902521/KS-RA-07-015-EN.PDF
Eurostat RAMON – Reference And Management of Nomenclatures (2014), ‘Concepts and definitions – Higher education sector’, available at http://ec.europa.eu/eurostat/ramon/nomenclatures/index.cfm?TargetUrl=DSP_GLOSSARY_NOM_DTL_VIEW&StrNom=CODED2&StrLanguageCode=EN&IntKey=16490735&RdoSearch=&TxtSearch=&CboTheme=&IsTer=&ter_valid=0&IntCurrentPage=1.
Gago, J. M. (2004), ‘Europe needs more scientists’ [pdf], Contribution to the EC conference Increasing human resources for science and technology, Brussels, 2 April 2004, available at http://ec.europa.eu/research/conferences/2004/sciprof/pdf/gago.pdf.
ILO (2012), International classification of occupations (ISCO-08) [pdf], available at http://www.ilo.org/wcmsp5/groups/public/---dgreports/---dcomm/---publ/documents/publication/wcms_172572.pdf.
Larivière, V., Ni, C., Gingras, Y., Cronin, B. and Sugimoto, C. R. (2013), ‘Global gender disparities in science’, Nature, No. 504, pp. 211–213.
Liff, S. and Ward, K. (2001), ‘Distorted views through the Glass Ceiling: The construction of women’s understandings of promotion and senior management positions’, Gender, Work and Organization, Vol. 8, No. 1, pp. 19–36.

133
National Science Foundation (NSF) (2000), Women, minorities, and persons with disabilities in science and engineering: 2000, (NSF 00-327), Arlington, USA, available at http://www.nsf.gov/statistics/nsf00327/.
O’Dorchai, S. P. (2011), ‘The gender pay gap in research: A comparison of 23 European countries’, Brussels Economic Review, Vol. 54, Issue 2–3, pp. 237–275.
OECD (2002), Frascati manual, OECD Publishing, Paris, available at http://dx.doi.org/10.1787/9789264199040-en.
OECD (2012), Closing the gender gap: Act now, OECD Publishing, Paris, available at http://dx.doi.org/10.1787/9789264179370-en.
Science-Metrix (2015), She Figures 2015: Comprehensive methodology – New research & innovation output indicators, Annex document to this Handbook submitted to the European Commission DG RTD.
Smith, M. (2010), Analysis note: The gender pay gap in the EU – What policy responses?, available at http://ec.europa.eu/justice/gender-equality/gender-pay-gap/causes/index_en.htm.
Stanford University, ‘Disparities between women and men’, available at https://genderedinnovations.stanford.edu/institutions/disparities.html.
Thomson Reuters (2014), Web of ScienceTM [pdf], available at http://thomsonreuters.com/products/ip-science/04_062/wos-next-gen-brochure.pdf.
UN Women, ‘Concepts and definitions’, available at http://www.un.org/womenwatch/osagi/conceptsandefinitions.htm.
UNESCO (1997), International standard classification of education [pdf], available at http://www.uis.unesco.org/Library/Documents/ISCED-97-en.pdf.
Van den Brink, M. (2010), Behind the scenes of sciences: Gender practices in the recruitment and selection of professors in the Netherlands, PhD thesis, Radboud University Nijmegen, Netherlands.
WIPO (2015), International Patent Classification. Version 2015.01, available at http://www.wipo.int/classifications/ipc/en/.

How to obtain EU publications
Free publications:
• one copy: via EU Bookshop (http://bookshop.europa.eu);
• more than one copy or posters/maps: from the European Union’s representations (http://ec.europa.eu/represent_en.htm); from the delegations in non-EU countries (http://eeas.europa.eu/delegations/index_en.htm); by contacting the Europe Direct service (http://europa.eu/europedirect/index_en.htm) or calling 00 800 6 7 8 9 10 11 (freephone number from anywhere in the EU) (*). (*) The information given is free, as are most calls (though some operators, phone boxes or hotels may charge you).
Priced publications:
• via EU Bookshop (http://bookshop.europa.eu)

KI-0
4-1
5-3
88-E
N-N
The She Figures Handbook (2015) provides methodological guidance on the calculation of indicators included in the She Figures 2015 publication, the fifth iteration of the European Commission’s She Figures publication since the release of its seminal version in 2003.
Organised by data source, information provided on each indicator includes a brief definition, rationale, computation method and any comments or critical issues for the reader to note. The handbook also includes a section on the verification and validation of data that outlines coherence checks and additional data considerations to be taken into consideration in the computation and interpretation of indicators. Finally, the annexes outline important information regarding international classification standards (e.g. ISCED, ISCO) to which data for several of the indicators are tied, as well as key terminology and definitions.
The release of the 2015 version of the handbook beyond the groups directly involved in the production of the She Figures publication is intended to strengthen the capacity of other stakeholders to systematically produce meaningful, systematic data on gender in research and innovation.
Studies and reports
ISBN 978-92-79-48374-5