Embed Size (px)
Citation preview
July 28, 2015Visit us at www.sharekhan.com
Sharekhan’s top equity mutual fund picks
Index
Top rated equity funds >> Large-cap funds
>> Mid-cap funds
>> Multi-cap funds
>> Tax-saving funds
>> Thematic funds
>> Balanced funds
Fund focus >> DSP BlackRock Balanced Fund
Fund ranking procedure
For Private Circulation only
REGISTRATION DETAILS Regd Add: Sharekhan Limited, 10th Floor, Beta Building, Lodha iThink Techno Campus, Off. JVLR, Opp. Kanjurmarg RailwayStation, Kanjurmarg (East), Mumbai – 400042, Maharashtra. Tel: 022 - 61150000. Sharekhan Ltd.: SEBI Regn. Nos. BSE - INB/INF011073351 ; BSE- CD ;NSE- INB/INF231073330; CD-INE231073330 ; MCX Stock Exchange - INB/INF261073333 ; CD-INE261073330 ; DP - NSDL-IN-DP-NSDL-233-2003 ; CDSL-IN-DP-CDSL-271-2004 ; PMS-INP000000662 ; Mutual Fund-ARN 20669 ; Commodity trading through Sharekhan Commodities Pvt. Ltd.: MCX-10080 ; (MCX/TCM/CORP/0425) ; NCDEX-00132 ; (NCDEX/TCM/CORP/0142) ; NCDEX SPOT-NCDEXSPOT/116/CO/11/20626 ; For any complaints email at [email protected];Disclaimer: Client should read the Risk Disclosure Document issued by SEBI & relevant exchanges and Do’s & Don’ts by MCX & NCDEX and the T & C onwww.sharekhan.com before investing.
Mutual Funds Mutual Gains
2Sharekhan July 28, 2015
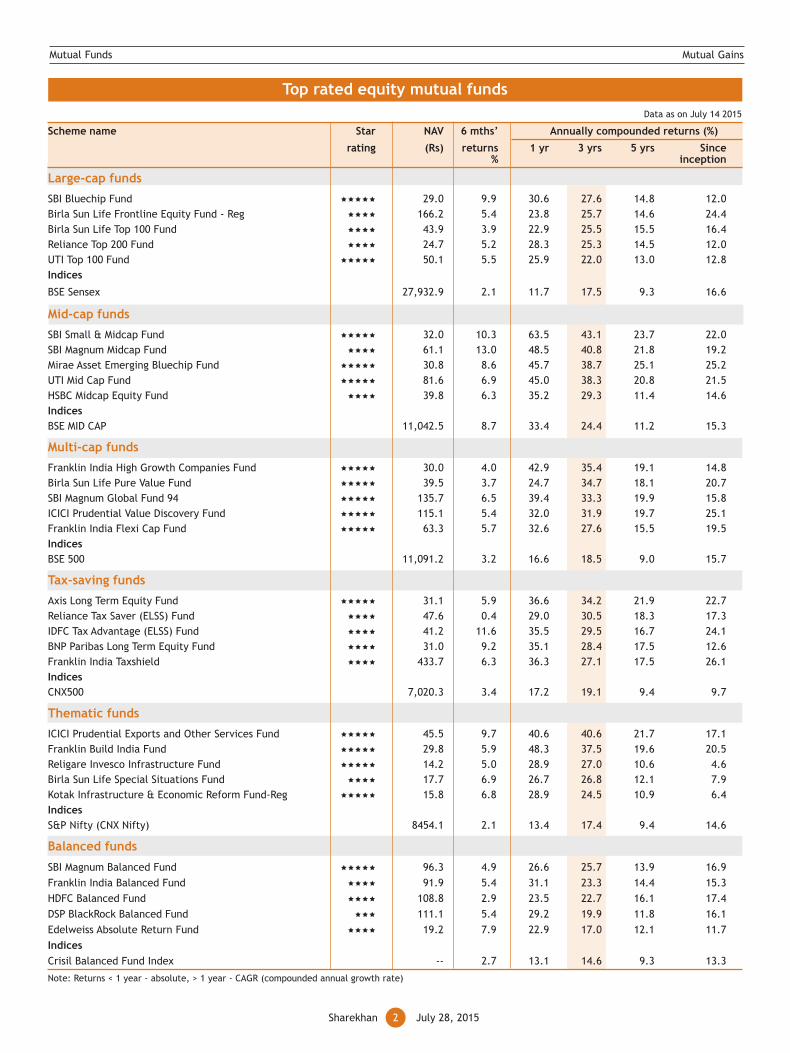
Top rated equity mutual funds
Scheme name Star NAV 6 mths’ Annually compounded returns (%)
rating (Rs) returns 1 yr 3 yrs 5 yrs Since% inception
Large-cap funds
SBI Bluechip Fund 29.0 9.9 30.6 27.6 14.8 12.0Birla Sun Life Frontline Equity Fund - Reg 166.2 5.4 23.8 25.7 14.6 24.4Birla Sun Life Top 100 Fund 43.9 3.9 22.9 25.5 15.5 16.4Reliance Top 200 Fund 24.7 5.2 28.3 25.3 14.5 12.0UTI Top 100 Fund 50.1 5.5 25.9 22.0 13.0 12.8Indices
BSE Sensex 27,932.9 2.1 11.7 17.5 9.3 16.6
Mid-cap funds
SBI Small & Midcap Fund 32.0 10.3 63.5 43.1 23.7 22.0SBI Magnum Midcap Fund 61.1 13.0 48.5 40.8 21.8 19.2Mirae Asset Emerging Bluechip Fund 30.8 8.6 45.7 38.7 25.1 25.2UTI Mid Cap Fund 81.6 6.9 45.0 38.3 20.8 21.5HSBC Midcap Equity Fund 39.8 6.3 35.2 29.3 11.4 14.6IndicesBSE MID CAP 11,042.5 8.7 33.4 24.4 11.2 15.3
Multi-cap funds
Franklin India High Growth Companies Fund 30.0 4.0 42.9 35.4 19.1 14.8Birla Sun Life Pure Value Fund 39.5 3.7 24.7 34.7 18.1 20.7SBI Magnum Global Fund 94 135.7 6.5 39.4 33.3 19.9 15.8ICICI Prudential Value Discovery Fund 115.1 5.4 32.0 31.9 19.7 25.1Franklin India Flexi Cap Fund 63.3 5.7 32.6 27.6 15.5 19.5IndicesBSE 500 11,091.2 3.2 16.6 18.5 9.0 15.7
Tax-saving funds
Axis Long Term Equity Fund 31.1 5.9 36.6 34.2 21.9 22.7Reliance Tax Saver (ELSS) Fund 47.6 0.4 29.0 30.5 18.3 17.3IDFC Tax Advantage (ELSS) Fund 41.2 11.6 35.5 29.5 16.7 24.1BNP Paribas Long Term Equity Fund 31.0 9.2 35.1 28.4 17.5 12.6Franklin India Taxshield 433.7 6.3 36.3 27.1 17.5 26.1IndicesCNX500 7,020.3 3.4 17.2 19.1 9.4 9.7
Thematic funds
ICICI Prudential Exports and Other Services Fund 45.5 9.7 40.6 40.6 21.7 17.1Franklin Build India Fund 29.8 5.9 48.3 37.5 19.6 20.5Religare Invesco Infrastructure Fund 14.2 5.0 28.9 27.0 10.6 4.6Birla Sun Life Special Situations Fund 17.7 6.9 26.7 26.8 12.1 7.9Kotak Infrastructure & Economic Reform Fund-Reg 15.8 6.8 28.9 24.5 10.9 6.4IndicesS&P Nifty (CNX Nifty) 8454.1 2.1 13.4 17.4 9.4 14.6
Balanced funds
SBI Magnum Balanced Fund 96.3 4.9 26.6 25.7 13.9 16.9Franklin India Balanced Fund 91.9 5.4 31.1 23.3 14.4 15.3HDFC Balanced Fund 108.8 2.9 23.5 22.7 16.1 17.4DSP BlackRock Balanced Fund 111.1 5.4 29.2 19.9 11.8 16.1Edelweiss Absolute Return Fund 19.2 7.9 22.9 17.0 12.1 11.7IndicesCrisil Balanced Fund Index -- 2.7 13.1 14.6 9.3 13.3
Note: Returns < 1 year - absolute, > 1 year - CAGR (compounded annual growth rate)
Data as on July 14 2015

Mutual Funds Mutual Gains
3Sharekhan July 28, 2015
DSP BlackRock Balanced Fund
With more than 15 years of experience, the fund has been a decent performer in comparison with both the benchmark indexes,Crisil Balanced Fund and category average. Despite the volatility and uncertainties in the market, the fund performed betterthan its peers, giving returns of 29.2% over one year as against that of 13.1% and 23.7% given by the benchmark index and thecategory average, respectively, in the same period. Over the longer time horizon of three years, the fund has grown at 19.9%compounded annual growth rate (CAGR) while the Crisil Balanced Fund and the category average have grown at 14.6% and 22.0%respectively. In the recent months, the fund has garnered returns of 5.4% as compared with the 2.7% returns posted by thebenchmark index and 4.4% returns from the balanced funds’ category average.
The fund currently has about 40 stocks in its portfolio. It has nearly 68% of its net assets exposed to equity while the rest isexposed to other money-market instruments. The top ten stocks form about 30.5% of the portfolio. The fund has invested nearly17.6% of its funds in the banking sector followed by pharmaceutical and auto with 12.8% and 10.2% allocations respectively.
Scheme’s performance
Key features• Fund category Balanced Fund Category• Launch date May 27, 1999• Minimum investment Rs1,000
• Load structure Entry load is nil/if redeemed bet.0 months to 12 months; exit load is 1%
• Fund manager Dhawal Dalal, Vinit Sambre• Latest NAV (gr.) Rs113.1
• Latest NAV (div.) Rs25.9• Expense ratio (%) 2.7 (June 30, 2015)• AUM Rs662 crore (June 30, 2015)
• Benchmark index Crisil Balanced Fund Index
Holdings by market cap
Particulars %
CNX Nifty 23.6
CNX Mid-cap 21.8
CNX Small-cap 5.5
Crisil Balanced Fund -
Top 5 holdings 19.7
Top 10 holdings 30.5
Top 10 stock holdings (total no. of scrips: 40)
Company name % of net assets
HDFC Bank 5.7
SRF 4.7
Britannia Industries 3.7
Tata Motors 3.0
IndusInd Bank 2.5
IPCA Laboratories 2.4
Larsen & Toubro 2.2
Container Corporation Of India 2.1
Dr Reddy’s Laboratories 2.0
Strides Arcolab 2.0
Style box analysis
Fact sheet
An open ended balanced scheme, seeking to generate long-term capital appreciation and create income from a portfolioconstituted of equity and equity related securities as well asfixed income securities (debt and money market securities).
Mid-cap
Small-cap
Top 5 sectors
Scheme analysis
Large-cap
Growth blend value
Returns < 1 yr: Absolute, >1yr: CAGR
Mutual Funds Mutual Gains
4Sharekhan July 28, 2015
We have identified the best equity-oriented schemesavailable in the market today based on the following fiveparameters: the past performance as indicated by theone-year, two-year and three-year returns, the Sharperatio and the Information ratio.
The Sharpe ratio indicates risk-adjusted returns, ie thereturns earned in excess of the risk-free rate for eachunit of the risk taken. The Sharpe ratio is also indicativeof the consistency of the returns as it takes into accountthe volatility in the returns as measured by the standarddeviation.
The Information ratio is one of the most important toolsin active fund management. It is the ratio of active return(the return over the index return) to active risk annualised.A higher Information ratio indicates a better fund manager.
We have selected the schemes based upon their rankingusing the above five parameters and then calculated themaximum value of each of the five parameters. Thereafter,we have calculated the percentage under-performance
Fund ranking procedure
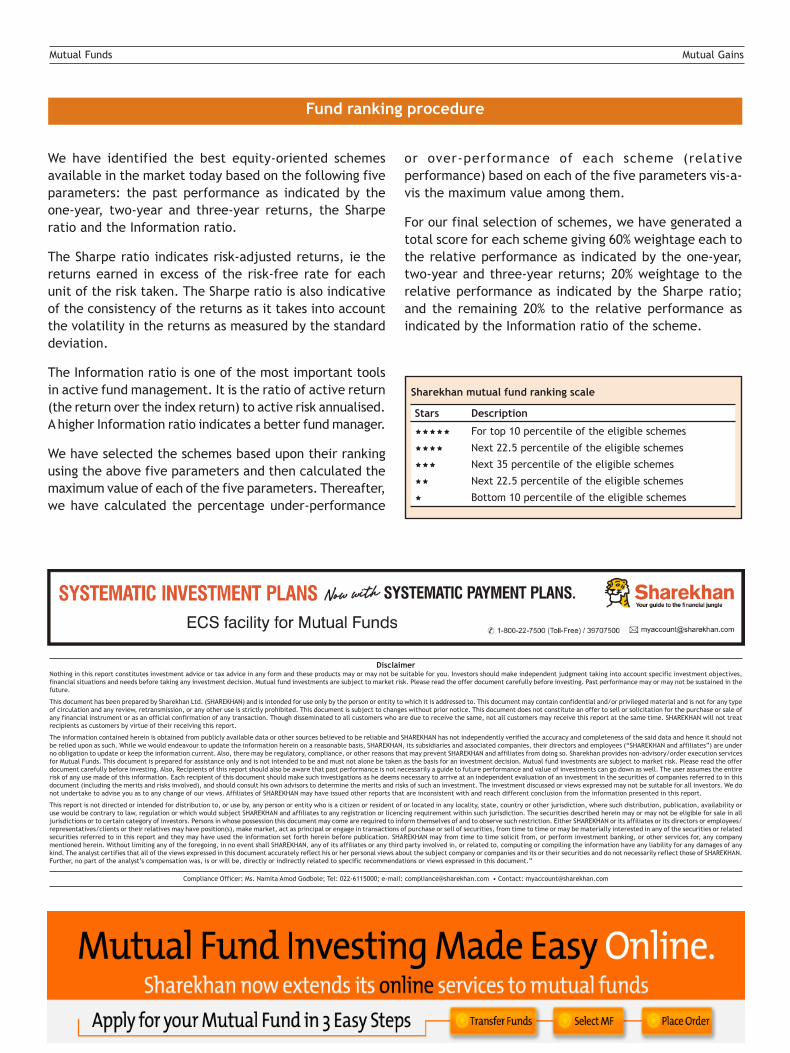
Sharekhan mutual fund ranking scale
Stars Description
For top 10 percentile of the eligible schemes
Next 22.5 percentile of the eligible schemes
Next 35 percentile of the eligible schemes
Next 22.5 percentile of the eligible schemes
Bottom 10 percentile of the eligible schemes
DisclaimerNothing in this report constitutes investment advice or tax advice in any form and these products may or may not be suitable for you. Investors should make independent judgment taking into account specific investment objectives,financial situations and needs before taking any investment decision. Mutual fund investments are subject to market risk. Please read the offer document carefully before investing. Past performance may or may not be sustained in thefuture.
This document has been prepared by Sharekhan Ltd. (SHAREKHAN) and is intended for use only by the person or entity to which it is addressed to. This document may contain confidential and/or privileged material and is not for any typeof circulation and any review, retransmission, or any other use is strictly prohibited. This document is subject to changes without prior notice. This document does not constitute an offer to sell or solicitation for the purchase or sale ofany financial instrument or as an official confirmation of any transaction. Though disseminated to all customers who are due to receive the same, not all customers may receive this report at the same time. SHAREKHAN will not treatrecipients as customers by virtue of their receiving this report.
The information contained herein is obtained from publicly available data or other sources believed to be reliable and SHAREKHAN has not independently verified the accuracy and completeness of the said data and hence it should notbe relied upon as such. While we would endeavour to update the information herein on a reasonable basis, SHAREKHAN, its subsidiaries and associated companies, their directors and employees (“SHAREKHAN and affiliates”) are underno obligation to update or keep the information current. Also, there may be regulatory, compliance, or other reasons that may prevent SHAREKHAN and affiliates from doing so. Sharekhan provides non-advisory/order execution servicesfor Mutual Funds. This document is prepared for assistance only and is not intended to be and must not alone be taken as the basis for an investment decision. Mutual fund investments are subject to market risk. Please read the offerdocument carefully before investing. Also, Recipients of this report should also be aware that past performance is not necessarily a guide to future performance and value of investments can go down as well. The user assumes the entirerisk of any use made of this information. Each recipient of this document should make such investigations as he deems necessary to arrive at an independent evaluation of an investment in the securities of companies referred to in thisdocument (including the merits and risks involved), and should consult his own advisors to determine the merits and risks of such an investment. The investment discussed or views expressed may not be suitable for all investors. We donot undertake to advise you as to any change of our views. Affiliates of SHAREKHAN may have issued other reports that are inconsistent with and reach different conclusion from the information presented in this report.
This report is not directed or intended for distribution to, or use by, any person or entity who is a citizen or resident of or located in any locality, state, country or other jurisdiction, where such distribution, publication, availability oruse would be contrary to law, regulation or which would subject SHAREKHAN and affiliates to any registration or licencing requirement within such jurisdiction. The securities described herein may or may not be eligible for sale in alljurisdictions or to certain category of investors. Persons in whose possession this document may come are required to inform themselves of and to observe such restriction. Either SHAREKHAN or its affiliates or its directors or employees/representatives/clients or their relatives may have position(s), make market, act as principal or engage in transactions of purchase or sell of securities, from time to time or may be materially interested in any of the securities or relatedsecurities referred to in this report and they may have used the information set forth herein before publication. SHAREKHAN may from time to time solicit from, or perform investment banking, or other services for, any companymentioned herein. Without limiting any of the foregoing, in no event shall SHAREKHAN, any of its affiliates or any third party involved in, or related to, computing or compiling the information have any liability for any damages of anykind. The analyst certifies that all of the views expressed in this document accurately reflect his or her personal views about the subject company or companies and its or their securities and do not necessarily reflect those of SHAREKHAN.Further, no part of the analyst’s compensation was, is or will be, directly or indirectly related to specific recommendations or views expressed in this document.”
Compliance Officer: Ms. Namita Amod Godbole; Tel: 022-6115000; e-mail: [email protected] • Contact: [email protected]
or over-performance of each scheme (relativeperformance) based on each of the five parameters vis-a-vis the maximum value among them.
For our final selection of schemes, we have generated atotal score for each scheme giving 60% weightage each tothe relative performance as indicated by the one-year,two-year and three-year returns; 20% weightage to therelative performance as indicated by the Sharpe ratio;and the remaining 20% to the relative performance asindicated by the Information ratio of the scheme.
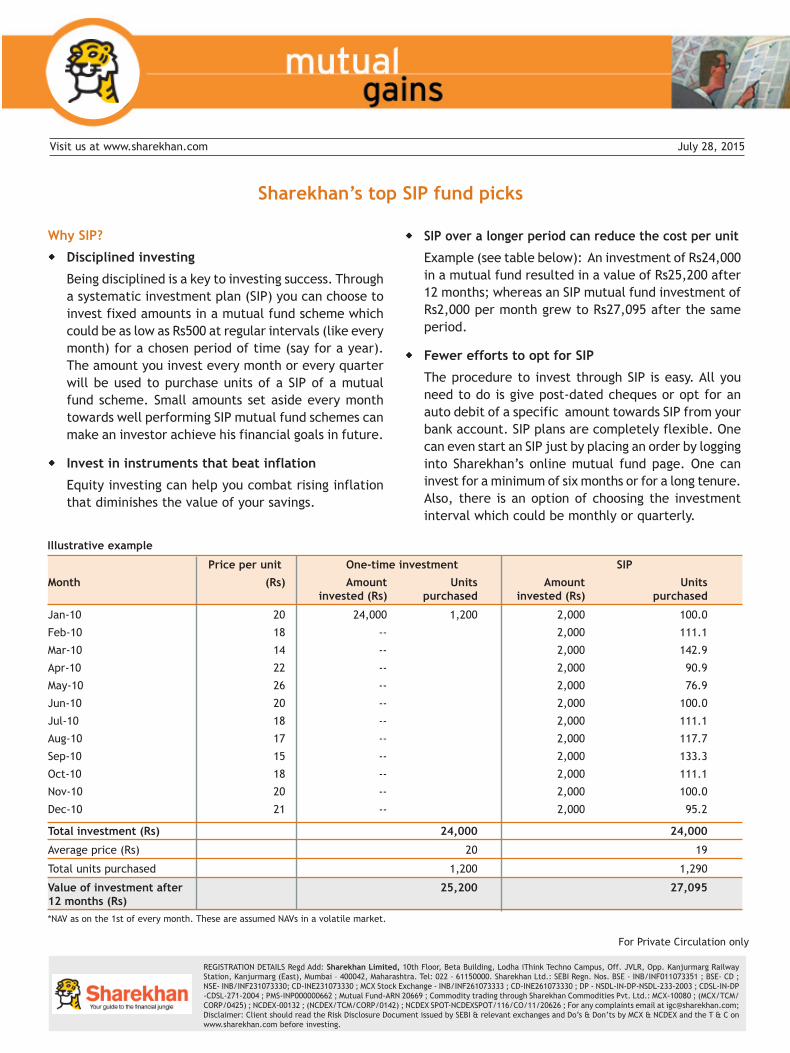
Sharekhan’s top SIP fund picks
Why SIP?
Disciplined investing
Being disciplined is a key to investing success. Througha systematic investment plan (SIP) you can choose toinvest fixed amounts in a mutual fund scheme whichcould be as low as Rs500 at regular intervals (like everymonth) for a chosen period of time (say for a year).The amount you invest every month or every quarterwill be used to purchase units of a SIP of a mutualfund scheme. Small amounts set aside every monthtowards well performing SIP mutual fund schemes canmake an investor achieve his financial goals in future.
Invest in instruments that beat inflation
Equity investing can help you combat rising inflationthat diminishes the value of your savings.
SIP over a longer period can reduce the cost per unit
Example (see table below): An investment of Rs24,000in a mutual fund resulted in a value of Rs25,200 after12 months; whereas an SIP mutual fund investment ofRs2,000 per month grew to Rs27,095 after the sameperiod.
Fewer efforts to opt for SIP
The procedure to invest through SIP is easy. All youneed to do is give post-dated cheques or opt for anauto debit of a specific amount towards SIP from yourbank account. SIP plans are completely flexible. Onecan even start an SIP just by placing an order by logginginto Sharekhan’s online mutual fund page. One caninvest for a minimum of six months or for a long tenure.Also, there is an option of choosing the investmentinterval which could be monthly or quarterly.
Illustrative example
Price per unit One-time investment SIP
Month (Rs) Amount Units Amount Unitsinvested (Rs) purchased invested (Rs) purchased
Jan-10 20 24,000 1,200 2,000 100.0
Feb-10 18 -- 2,000 111.1
Mar-10 14 -- 2,000 142.9
Apr-10 22 -- 2,000 90.9
May-10 26 -- 2,000 76.9
Jun-10 20 -- 2,000 100.0
Jul-10 18 -- 2,000 111.1
Aug-10 17 -- 2,000 117.7
Sep-10 15 -- 2,000 133.3
Oct-10 18 -- 2,000 111.1
Nov-10 20 -- 2,000 100.0
Dec-10 21 -- 2,000 95.2
Total investment (Rs) 24,000 24,000
Average price (Rs) 20 19
Total units purchased 1,200 1,290
Value of investment after 25,200 27,09512 months (Rs)*NAV as on the 1st of every month. These are assumed NAVs in a volatile market.
July 28, 2015Visit us at www.sharekhan.com
For Private Circulation only
REGISTRATION DETAILS Regd Add: Sharekhan Limited, 10th Floor, Beta Building, Lodha iThink Techno Campus, Off. JVLR, Opp. Kanjurmarg RailwayStation, Kanjurmarg (East), Mumbai – 400042, Maharashtra. Tel: 022 - 61150000. Sharekhan Ltd.: SEBI Regn. Nos. BSE - INB/INF011073351 ; BSE- CD ;NSE- INB/INF231073330; CD-INE231073330 ; MCX Stock Exchange - INB/INF261073333 ; CD-INE261073330 ; DP - NSDL-IN-DP-NSDL-233-2003 ; CDSL-IN-DP-CDSL-271-2004 ; PMS-INP000000662 ; Mutual Fund-ARN 20669 ; Commodity trading through Sharekhan Commodities Pvt. Ltd.: MCX-10080 ; (MCX/TCM/CORP/0425) ; NCDEX-00132 ; (NCDEX/TCM/CORP/0142) ; NCDEX SPOT-NCDEXSPOT/116/CO/11/20626 ; For any complaints email at [email protected];Disclaimer: Client should read the Risk Disclosure Document issued by SEBI & relevant exchanges and Do’s & Don’ts by MCX & NCDEX and the T & C onwww.sharekhan.com before investing.
Mutual Funds mutual gains
2Sharekhan July 28, 2015
Data as on July 14, 2015
(*invested on 2nd day of every month)
We will be showing compounded annualised returns for three years and five years from now on.
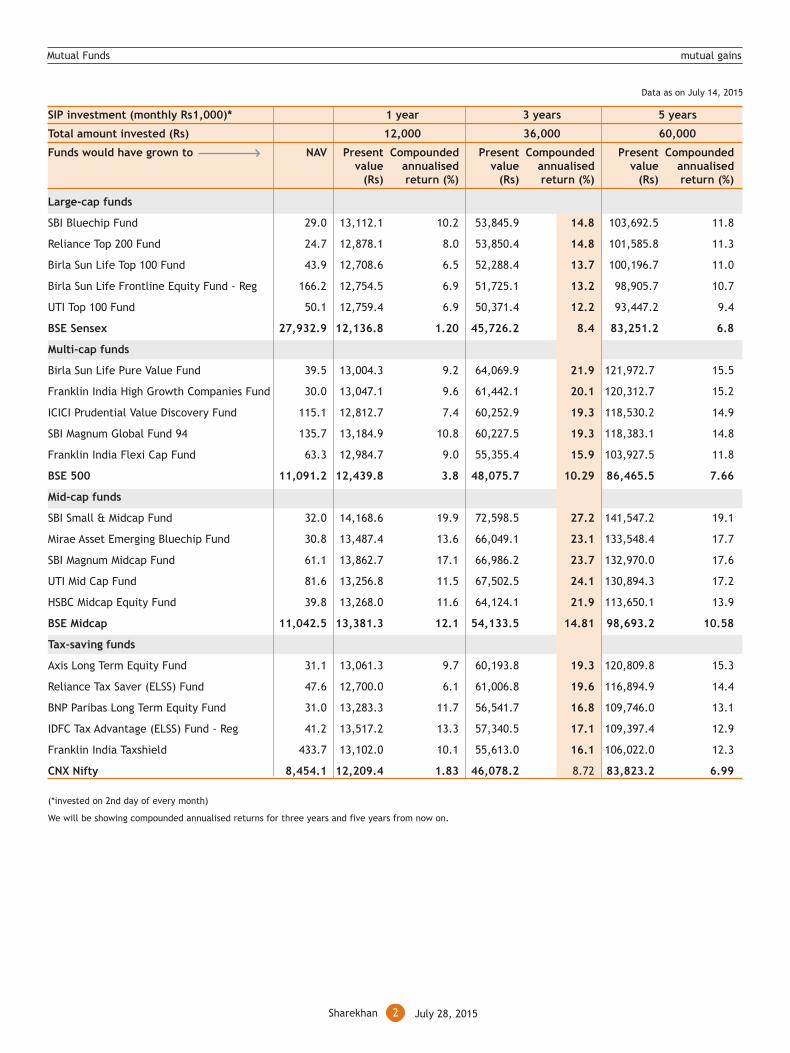
SIP investment (monthly Rs1,000)* 1 year 3 years 5 years
Total amount invested (Rs) 12,000 36,000 60,000
Funds would have grown to NAV Present Compounded Present Compounded Present Compoundedvalue annualised value annualised value annualised
(Rs) return (%) (Rs) return (%) (Rs) return (%)
Large-cap funds
SBI Bluechip Fund 29.0 13,112.1 10.2 53,845.9 14.8 103,692.5 11.8
Reliance Top 200 Fund 24.7 12,878.1 8.0 53,850.4 14.8 101,585.8 11.3
Birla Sun Life Top 100 Fund 43.9 12,708.6 6.5 52,288.4 13.7 100,196.7 11.0
Birla Sun Life Frontline Equity Fund - Reg 166.2 12,754.5 6.9 51,725.1 13.2 98,905.7 10.7
UTI Top 100 Fund 50.1 12,759.4 6.9 50,371.4 12.2 93,447.2 9.4
BSE Sensex 27,932.9 12,136.8 1.20 45,726.2 8.4 83,251.2 6.8
Multi-cap funds
Birla Sun Life Pure Value Fund 39.5 13,004.3 9.2 64,069.9 21.9 121,972.7 15.5
Franklin India High Growth Companies Fund 30.0 13,047.1 9.6 61,442.1 20.1 120,312.7 15.2
ICICI Prudential Value Discovery Fund 115.1 12,812.7 7.4 60,252.9 19.3 118,530.2 14.9
SBI Magnum Global Fund 94 135.7 13,184.9 10.8 60,227.5 19.3 118,383.1 14.8
Franklin India Flexi Cap Fund 63.3 12,984.7 9.0 55,355.4 15.9 103,927.5 11.8
BSE 500 11,091.2 12,439.8 3.8 48,075.7 10.29 86,465.5 7.66
Mid-cap funds
SBI Small & Midcap Fund 32.0 14,168.6 19.9 72,598.5 27.2 141,547.2 19.1
Mirae Asset Emerging Bluechip Fund 30.8 13,487.4 13.6 66,049.1 23.1 133,548.4 17.7
SBI Magnum Midcap Fund 61.1 13,862.7 17.1 66,986.2 23.7 132,970.0 17.6
UTI Mid Cap Fund 81.6 13,256.8 11.5 67,502.5 24.1 130,894.3 17.2
HSBC Midcap Equity Fund 39.8 13,268.0 11.6 64,124.1 21.9 113,650.1 13.9
BSE Midcap 11,042.5 13,381.3 12.1 54,133.5 14.81 98,693.2 10.58
Tax-saving funds
Axis Long Term Equity Fund 31.1 13,061.3 9.7 60,193.8 19.3 120,809.8 15.3
Reliance Tax Saver (ELSS) Fund 47.6 12,700.0 6.1 61,006.8 19.6 116,894.9 14.4
BNP Paribas Long Term Equity Fund 31.0 13,283.3 11.7 56,541.7 16.8 109,746.0 13.1
IDFC Tax Advantage (ELSS) Fund - Reg 41.2 13,517.2 13.3 57,340.5 17.1 109,397.4 12.9
Franklin India Taxshield 433.7 13,102.0 10.1 55,613.0 16.1 106,022.0 12.3
CNX Nifty 8,454.1 12,209.4 1.83 46,078.2 8.72 83,823.2 6.99
Mutual Funds mutual gains
3Sharekhan July 28, 2015
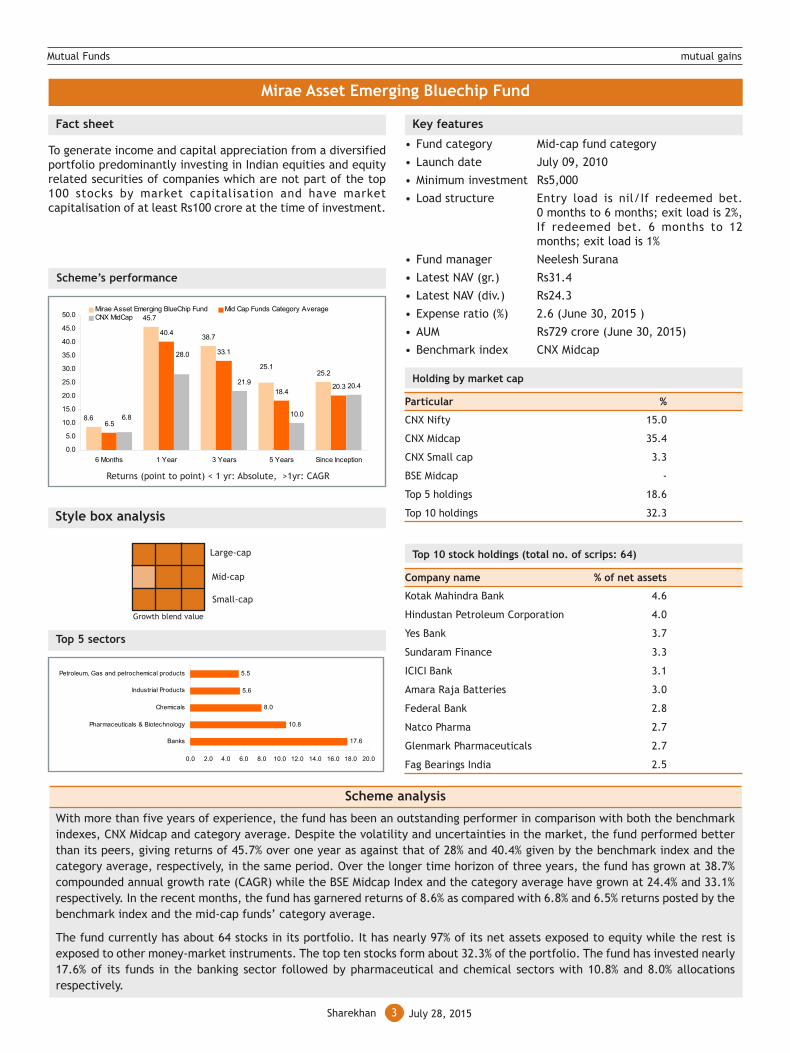
Mirae Asset Emerging Bluechip Fund
With more than five years of experience, the fund has been an outstanding performer in comparison with both the benchmarkindexes, CNX Midcap and category average. Despite the volatility and uncertainties in the market, the fund performed betterthan its peers, giving returns of 45.7% over one year as against that of 28% and 40.4% given by the benchmark index and thecategory average, respectively, in the same period. Over the longer time horizon of three years, the fund has grown at 38.7%compounded annual growth rate (CAGR) while the BSE Midcap Index and the category average have grown at 24.4% and 33.1%respectively. In the recent months, the fund has garnered returns of 8.6% as compared with 6.8% and 6.5% returns posted by thebenchmark index and the mid-cap funds’ category average.
The fund currently has about 64 stocks in its portfolio. It has nearly 97% of its net assets exposed to equity while the rest isexposed to other money-market instruments. The top ten stocks form about 32.3% of the portfolio. The fund has invested nearly17.6% of its funds in the banking sector followed by pharmaceutical and chemical sectors with 10.8% and 8.0% allocationsrespectively.
Key features
• Fund category Mid-cap fund category
• Launch date July 09, 2010
• Minimum investment Rs5,000
• Load structure Entry load is nil/If redeemed bet.0 months to 6 months; exit load is 2%,If redeemed bet. 6 months to 12months; exit load is 1%
• Fund manager Neelesh Surana
• Latest NAV (gr.) Rs31.4
• Latest NAV (div.) Rs24.3
• Expense ratio (%) 2.6 (June 30, 2015 )
• AUM Rs729 crore (June 30, 2015)
• Benchmark index CNX Midcap
Holding by market cap
Particular %
CNX Nifty 15.0
CNX Midcap 35.4
CNX Small cap 3.3
BSE Midcap -
Top 5 holdings 18.6
Top 10 holdings 32.3
Top 10 stock holdings (total no. of scrips: 64)
Company name % of net assets
Kotak Mahindra Bank 4.6
Hindustan Petroleum Corporation 4.0
Yes Bank 3.7
Sundaram Finance 3.3
ICICI Bank 3.1
Amara Raja Batteries 3.0
Federal Bank 2.8
Natco Pharma 2.7
Glenmark Pharmaceuticals 2.7
Fag Bearings India 2.5
Style box analysis
Fact sheet
To generate income and capital appreciation from a diversifiedportfolio predominantly investing in Indian equities and equityrelated securities of companies which are not part of the top100 stocks by market capitalisation and have marketcapitalisation of at least Rs100 crore at the time of investment.
Top 5 sectors
Scheme analysis
Scheme’s performance
Large-cap
Mid-cap
Small-cap
Growth blend value
Returns (point to point) < 1 yr: Absolute, >1yr: CAGR
38.7
25.2
6.5
40.4
33.1
18.420.3
10.0
20.4
8.6
45.7
25.1
6.8
28.0
21.9
0.0
5.0
10.0
15.0
20.0
25.0
30.0
35.0
40.0
45.0
50.0
6 Months 1 Year 3 Years 5 Years Since Inception
Mirae Asset Emerging BlueChip Fund Mid Cap Funds Category AverageCNX MidCap
17.6
10.8
8.0
5.6
5.5
0.0 2.0 4.0 6.0 8.0 10.0 12.0 14.0 16.0 18.0 20.0
Banks
Pharmaceuticals & Biotechnology
Chemicals
Industrial Products
Petroleum, Gas and petrochemical products
Mutual Funds mutual gains
4Sharekhan July 28, 2015
DisclaimerNothing in this report constitutes investment advice or tax advice in any form and these products may or may not be suitable for you. Investors should make independent judgment taking into account specific investment objectives,financial situations and needs before taking any investment decision. Mutual fund investments are subject to market risk. Please read the offer document carefully before investing. Past performance may or may not be sustained in thefuture.
This document has been prepared by Sharekhan Ltd. (SHAREKHAN) and is intended for use only by the person or entity to which it is addressed to. This document may contain confidential and/or privileged material and is not for any typeof circulation and any review, retransmission, or any other use is strictly prohibited. This document is subject to changes without prior notice. This document does not constitute an offer to sell or solicitation for the purchase or sale ofany financial instrument or as an official confirmation of any transaction. Though disseminated to all customers who are due to receive the same, not all customers may receive this report at the same time. SHAREKHAN will not treatrecipients as customers by virtue of their receiving this report.
The information contained herein is obtained from publicly available data or other sources believed to be reliable and SHAREKHAN has not independently verified the accuracy and completeness of the said data and hence it should notbe relied upon as such. While we would endeavour to update the information herein on a reasonable basis, SHAREKHAN, its subsidiaries and associated companies, their directors and employees (“SHAREKHAN and affiliates”) are underno obligation to update or keep the information current. Also, there may be regulatory, compliance, or other reasons that may prevent SHAREKHAN and affiliates from doing so. Sharekhan provides non-advisory/order execution servicesfor Mutual Funds. This document is prepared for assistance only and is not intended to be and must not alone be taken as the basis for an investment decision. Mutual fund investments are subject to market risk. Please read the offerdocument carefully before investing. Also, Recipients of this report should also be aware that past performance is not necessarily a guide to future performance and value of investments can go down as well. The user assumes the entirerisk of any use made of this information. Each recipient of this document should make such investigations as he deems necessary to arrive at an independent evaluation of an investment in the securities of companies referred to in thisdocument (including the merits and risks involved), and should consult his own advisors to determine the merits and risks of such an investment. The investment discussed or views expressed may not be suitable for all investors. We donot undertake to advise you as to any change of our views. Affiliates of SHAREKHAN may have issued other reports that are inconsistent with and reach different conclusion from the information presented in this report.
This report is not directed or intended for distribution to, or use by, any person or entity who is a citizen or resident of or located in any locality, state, country or other jurisdiction, where such distribution, publication, availability oruse would be contrary to law, regulation or which would subject SHAREKHAN and affiliates to any registration or licencing requirement within such jurisdiction. The securities described herein may or may not be eligible for sale in alljurisdictions or to certain category of investors. Persons in whose possession this document may come are required to inform themselves of and to observe such restriction. Either SHAREKHAN or its affiliates or its directors or employees/representatives/clients or their relatives may have position(s), make market, act as principal or engage in transactions of purchase or sell of securities, from time to time or may be materially interested in any of the securities or relatedsecurities referred to in this report and they may have used the information set forth herein before publication. SHAREKHAN may from time to time solicit from, or perform investment banking, or other services for, any companymentioned herein. Without limiting any of the foregoing, in no event shall SHAREKHAN, any of its affiliates or any third party involved in, or related to, computing or compiling the information have any liability for any damages of anykind. The analyst certifies that all of the views expressed in this document accurately reflect his or her personal views about the subject company or companies and its or their securities and do not necessarily reflect those of SHAREKHAN.Further, no part of the analyst’s compensation was, is or will be, directly or indirectly related to specific recommendations or views expressed in this document.”
Compliance Officer: Ms. Namita Amod Godbole; Tel: 022-6115000; e-mail: [email protected] • Contact: [email protected]
1Sharekhan July 24, 2015
Visit us at www.sharekhan.com July 24, 2015
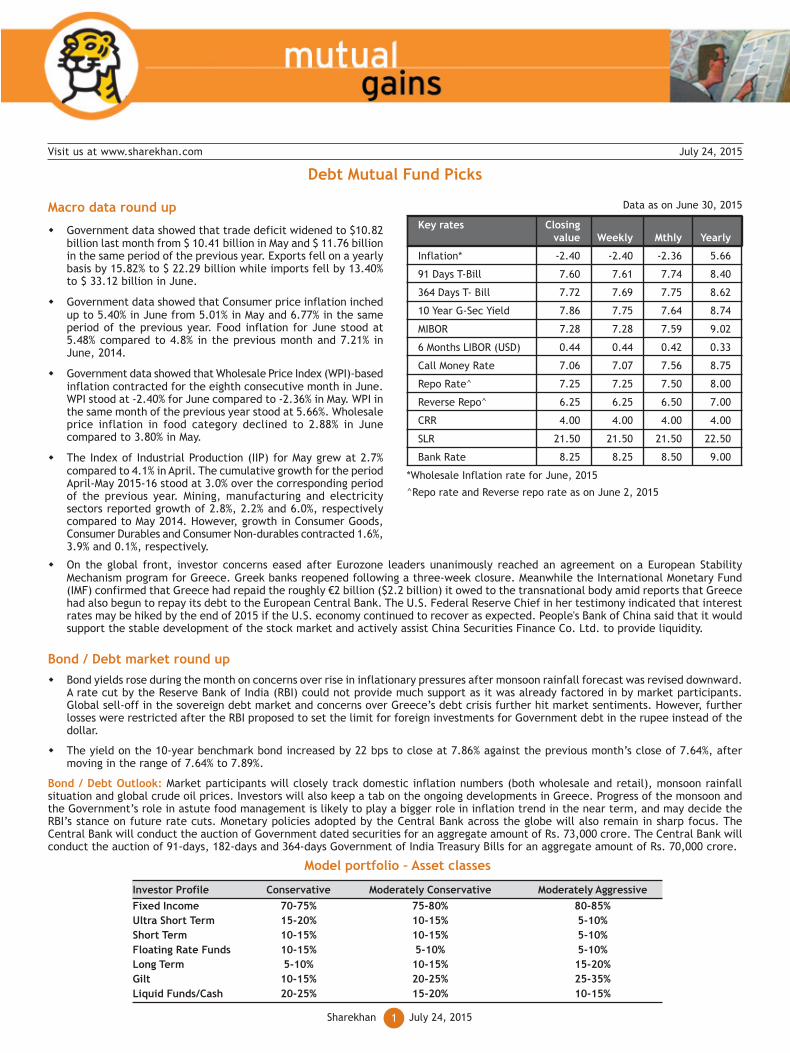
Debt Mutual Fund Picks
Macro data round up
Government data showed that trade deficit widened to $10.82billion last month from $ 10.41 billion in May and $ 11.76 billionin the same period of the previous year. Exports fell on a yearlybasis by 15.82% to $ 22.29 billion while imports fell by 13.40%to $ 33.12 billion in June.
Government data showed that Consumer price inflation inchedup to 5.40% in June from 5.01% in May and 6.77% in the sameperiod of the previous year. Food inflation for June stood at5.48% compared to 4.8% in the previous month and 7.21% inJune, 2014.
Government data showed that Wholesale Price Index (WPI)-basedinflation contracted for the eighth consecutive month in June.WPI stood at -2.40% for June compared to -2.36% in May. WPI inthe same month of the previous year stood at 5.66%. Wholesaleprice inflation in food category declined to 2.88% in Junecompared to 3.80% in May.
The Index of Industrial Production (IIP) for May grew at 2.7%compared to 4.1% in April. The cumulative growth for the periodApril-May 2015-16 stood at 3.0% over the corresponding periodof the previous year. Mining, manufacturing and electricitysectors reported growth of 2.8%, 2.2% and 6.0%, respectivelycompared to May 2014. However, growth in Consumer Goods,Consumer Durables and Consumer Non-durables contracted 1.6%,3.9% and 0.1%, respectively.
Model portfolio – Asset classes
Investor Profile Conservative Moderately Conservative Moderately AggressiveFixed Income 70-75% 75-80% 80-85%Ultra Short Term 15-20% 10-15% 5-10%Short Term 10-15% 10-15% 5-10%Floating Rate Funds 10-15% 5-10% 5-10%Long Term 5-10% 10-15% 15-20%Gilt 10-15% 20-25% 25-35%Liquid Funds/Cash 20-25% 15-20% 10-15%
Data as on June 30, 2015
Key rates Closingvalue Weekly Mthly Yearly
Inflation* -2.40 -2.40 -2.36 5.66
91 Days T-Bill 7.60 7.61 7.74 8.40
364 Days T- Bill 7.72 7.69 7.75 8.62
10 Year G-Sec Yield 7.86 7.75 7.64 8.74
MIBOR 7.28 7.28 7.59 9.02
6 Months LIBOR (USD) 0.44 0.44 0.42 0.33
Call Money Rate 7.06 7.07 7.56 8.75
Repo Rate^ 7.25 7.25 7.50 8.00
Reverse Repo^ 6.25 6.25 6.50 7.00
CRR 4.00 4.00 4.00 4.00
SLR 21.50 21.50 21.50 22.50
Bank Rate 8.25 8.25 8.50 9.00
*Wholesale Inflation rate for June, 2015
^Repo rate and Reverse repo rate as on June 2, 2015
On the global front, investor concerns eased after Eurozone leaders unanimously reached an agreement on a European StabilityMechanism program for Greece. Greek banks reopened following a three-week closure. Meanwhile the International Monetary Fund(IMF) confirmed that Greece had repaid the roughly €2 billion ($2.2 billion) it owed to the transnational body amid reports that Greecehad also begun to repay its debt to the European Central Bank. The U.S. Federal Reserve Chief in her testimony indicated that interestrates may be hiked by the end of 2015 if the U.S. economy continued to recover as expected. People's Bank of China said that it wouldsupport the stable development of the stock market and actively assist China Securities Finance Co. Ltd. to provide liquidity.
Bond / Debt market round upBond yields rose during the month on concerns over rise in inflationary pressures after monsoon rainfall forecast was revised downward.A rate cut by the Reserve Bank of India (RBI) could not provide much support as it was already factored in by market participants.Global sell-off in the sovereign debt market and concerns over Greece’s debt crisis further hit market sentiments. However, furtherlosses were restricted after the RBI proposed to set the limit for foreign investments for Government debt in the rupee instead of thedollar.
The yield on the 10-year benchmark bond increased by 22 bps to close at 7.86% against the previous month’s close of 7.64%, aftermoving in the range of 7.64% to 7.89%.
Bond / Debt Outlook: Market participants will closely track domestic inflation numbers (both wholesale and retail), monsoon rainfallsituation and global crude oil prices. Investors will also keep a tab on the ongoing developments in Greece. Progress of the monsoon andthe Government’s role in astute food management is likely to play a bigger role in inflation trend in the near term, and may decide theRBI’s stance on future rate cuts. Monetary policies adopted by the Central Bank across the globe will also remain in sharp focus. TheCentral Bank will conduct the auction of Government dated securities for an aggregate amount of Rs. 73,000 crore. The Central Bank willconduct the auction of 91-days, 182-days and 364-days Government of India Treasury Bills for an aggregate amount of Rs. 70,000 crore.
2Sharekhan July 24, 2015
Mutual Gains
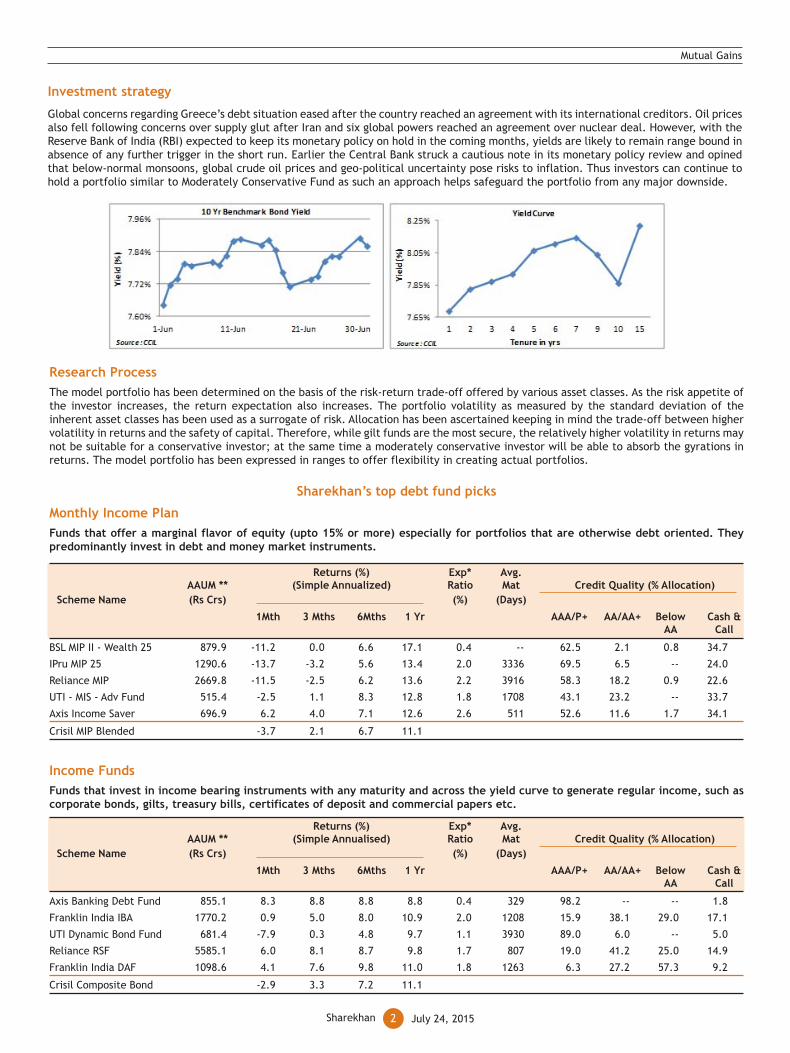
Investment strategy
Global concerns regarding Greece’s debt situation eased after the country reached an agreement with its international creditors. Oil pricesalso fell following concerns over supply glut after Iran and six global powers reached an agreement over nuclear deal. However, with theReserve Bank of India (RBI) expected to keep its monetary policy on hold in the coming months, yields are likely to remain range bound inabsence of any further trigger in the short run. Earlier the Central Bank struck a cautious note in its monetary policy review and opinedthat below-normal monsoons, global crude oil prices and geo-political uncertainty pose risks to inflation. Thus investors can continue tohold a portfolio similar to Moderately Conservative Fund as such an approach helps safeguard the portfolio from any major downside.
Income FundsFunds that invest in income bearing instruments with any maturity and across the yield curve to generate regular income, such ascorporate bonds, gilts, treasury bills, certificates of deposit and commercial papers etc.
Returns (%) Exp* Avg.AAUM ** (Simple Annualised) Ratio Mat Credit Quality (% Allocation)
Scheme Name (Rs Crs) (%) (Days)
1Mth 3 Mths 6Mths 1 Yr AAA/P+ AA/AA+ Below Cash &AA Call
Axis Banking Debt Fund 855.1 8.3 8.8 8.8 8.8 0.4 329 98.2 -- -- 1.8
Franklin India IBA 1770.2 0.9 5.0 8.0 10.9 2.0 1208 15.9 38.1 29.0 17.1
UTI Dynamic Bond Fund 681.4 -7.9 0.3 4.8 9.7 1.1 3930 89.0 6.0 -- 5.0
Reliance RSF 5585.1 6.0 8.1 8.7 9.8 1.7 807 19.0 41.2 25.0 14.9
Franklin India DAF 1098.6 4.1 7.6 9.8 11.0 1.8 1263 6.3 27.2 57.3 9.2
Crisil Composite Bond -2.9 3.3 7.2 11.1
Research ProcessThe model portfolio has been determined on the basis of the risk-return trade-off offered by various asset classes. As the risk appetite ofthe investor increases, the return expectation also increases. The portfolio volatility as measured by the standard deviation of theinherent asset classes has been used as a surrogate of risk. Allocation has been ascertained keeping in mind the trade-off between highervolatility in returns and the safety of capital. Therefore, while gilt funds are the most secure, the relatively higher volatility in returns maynot be suitable for a conservative investor; at the same time a moderately conservative investor will be able to absorb the gyrations inreturns. The model portfolio has been expressed in ranges to offer flexibility in creating actual portfolios.
Sharekhan’s top debt fund picks
Monthly Income PlanFunds that offer a marginal flavor of equity (upto 15% or more) especially for portfolios that are otherwise debt oriented. Theypredominantly invest in debt and money market instruments.
Returns (%) Exp* Avg.AAUM ** (Simple Annualized) Ratio Mat Credit Quality (% Allocation)
Scheme Name (Rs Crs) (%) (Days)
1Mth 3 Mths 6Mths 1 Yr AAA/P+ AA/AA+ Below Cash &AA Call
BSL MIP II - Wealth 25 879.9 -11.2 0.0 6.6 17.1 0.4 -- 62.5 2.1 0.8 34.7
IPru MIP 25 1290.6 -13.7 -3.2 5.6 13.4 2.0 3336 69.5 6.5 -- 24.0
Reliance MIP 2669.8 -11.5 -2.5 6.2 13.6 2.2 3916 58.3 18.2 0.9 22.6
UTI - MIS - Adv Fund 515.4 -2.5 1.1 8.3 12.8 1.8 1708 43.1 23.2 -- 33.7
Axis Income Saver 696.9 6.2 4.0 7.1 12.6 2.6 511 52.6 11.6 1.7 34.1
Crisil MIP Blended -3.7 2.1 6.7 11.1
3Sharekhan July 24, 2015
Mutual Gains
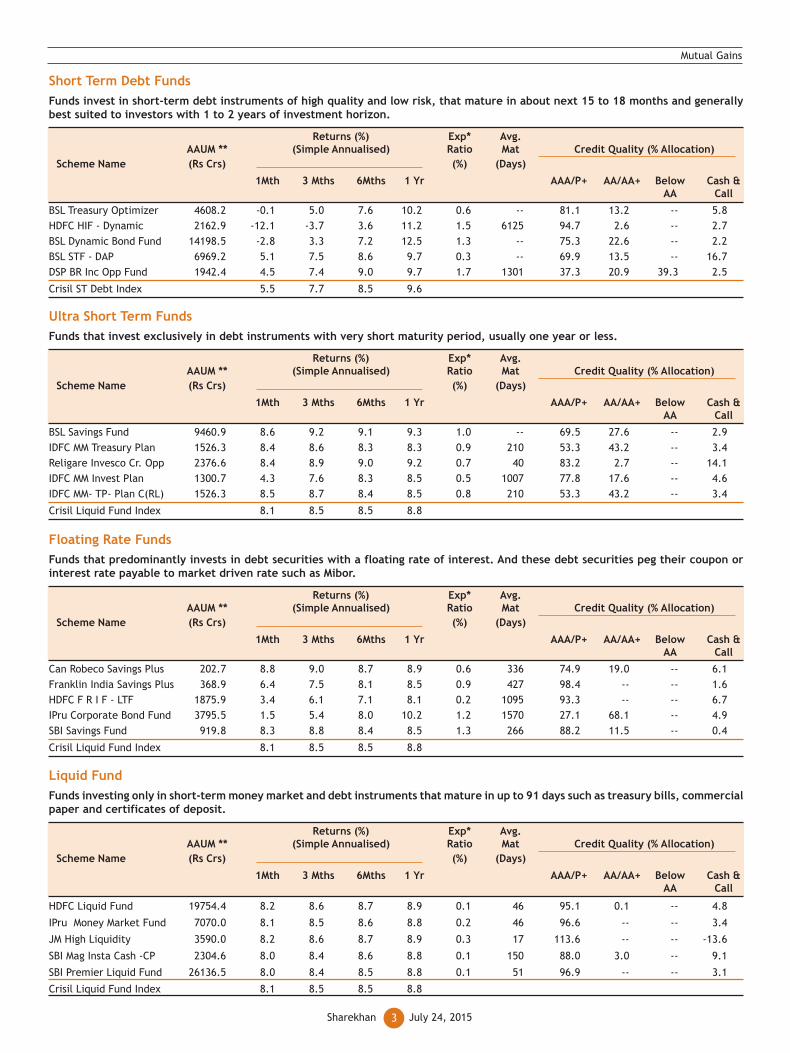
Short Term Debt FundsFunds invest in short-term debt instruments of high quality and low risk, that mature in about next 15 to 18 months and generallybest suited to investors with 1 to 2 years of investment horizon.
Returns (%) Exp* Avg.AAUM ** (Simple Annualised) Ratio Mat Credit Quality (% Allocation)
Scheme Name (Rs Crs) (%) (Days)
1Mth 3 Mths 6Mths 1 Yr AAA/P+ AA/AA+ Below Cash &AA Call
BSL Treasury Optimizer 4608.2 -0.1 5.0 7.6 10.2 0.6 -- 81.1 13.2 -- 5.8HDFC HIF - Dynamic 2162.9 -12.1 -3.7 3.6 11.2 1.5 6125 94.7 2.6 -- 2.7BSL Dynamic Bond Fund 14198.5 -2.8 3.3 7.2 12.5 1.3 -- 75.3 22.6 -- 2.2BSL STF - DAP 6969.2 5.1 7.5 8.6 9.7 0.3 -- 69.9 13.5 -- 16.7DSP BR Inc Opp Fund 1942.4 4.5 7.4 9.0 9.7 1.7 1301 37.3 20.9 39.3 2.5
Crisil ST Debt Index 5.5 7.7 8.5 9.6
Ultra Short Term FundsFunds that invest exclusively in debt instruments with very short maturity period, usually one year or less.
Returns (%) Exp* Avg.AAUM ** (Simple Annualised) Ratio Mat Credit Quality (% Allocation)
Scheme Name (Rs Crs) (%) (Days)
1Mth 3 Mths 6Mths 1 Yr AAA/P+ AA/AA+ Below Cash &AA Call
BSL Savings Fund 9460.9 8.6 9.2 9.1 9.3 1.0 -- 69.5 27.6 -- 2.9IDFC MM Treasury Plan 1526.3 8.4 8.6 8.3 8.3 0.9 210 53.3 43.2 -- 3.4Religare Invesco Cr. Opp 2376.6 8.4 8.9 9.0 9.2 0.7 40 83.2 2.7 -- 14.1IDFC MM Invest Plan 1300.7 4.3 7.6 8.3 8.5 0.5 1007 77.8 17.6 -- 4.6IDFC MM- TP- Plan C(RL) 1526.3 8.5 8.7 8.4 8.5 0.8 210 53.3 43.2 -- 3.4
Crisil Liquid Fund Index 8.1 8.5 8.5 8.8
Floating Rate FundsFunds that predominantly invests in debt securities with a floating rate of interest. And these debt securities peg their coupon orinterest rate payable to market driven rate such as Mibor.
Returns (%) Exp* Avg.AAUM ** (Simple Annualised) Ratio Mat Credit Quality (% Allocation)
Scheme Name (Rs Crs) (%) (Days)
1Mth 3 Mths 6Mths 1 Yr AAA/P+ AA/AA+ Below Cash &AA Call
Can Robeco Savings Plus 202.7 8.8 9.0 8.7 8.9 0.6 336 74.9 19.0 -- 6.1Franklin India Savings Plus 368.9 6.4 7.5 8.1 8.5 0.9 427 98.4 -- -- 1.6HDFC F R I F - LTF 1875.9 3.4 6.1 7.1 8.1 0.2 1095 93.3 -- -- 6.7IPru Corporate Bond Fund 3795.5 1.5 5.4 8.0 10.2 1.2 1570 27.1 68.1 -- 4.9SBI Savings Fund 919.8 8.3 8.8 8.4 8.5 1.3 266 88.2 11.5 -- 0.4
Crisil Liquid Fund Index 8.1 8.5 8.5 8.8
Liquid FundFunds investing only in short-term money market and debt instruments that mature in up to 91 days such as treasury bills, commercialpaper and certificates of deposit.
Returns (%) Exp* Avg.AAUM ** (Simple Annualised) Ratio Mat Credit Quality (% Allocation)
Scheme Name (Rs Crs) (%) (Days)
1Mth 3 Mths 6Mths 1 Yr AAA/P+ AA/AA+ Below Cash &AA Call
HDFC Liquid Fund 19754.4 8.2 8.6 8.7 8.9 0.1 46 95.1 0.1 -- 4.8
IPru Money Market Fund 7070.0 8.1 8.5 8.6 8.8 0.2 46 96.6 -- -- 3.4
JM High Liquidity 3590.0 8.2 8.6 8.7 8.9 0.3 17 113.6 -- -- -13.6
SBI Mag Insta Cash -CP 2304.6 8.0 8.4 8.6 8.8 0.1 150 88.0 3.0 -- 9.1
SBI Premier Liquid Fund 26136.5 8.0 8.4 8.5 8.8 0.1 51 96.9 -- -- 3.1
Crisil Liquid Fund Index 8.1 8.5 8.5 8.8
4Sharekhan July 24, 2015
Mutual Gains
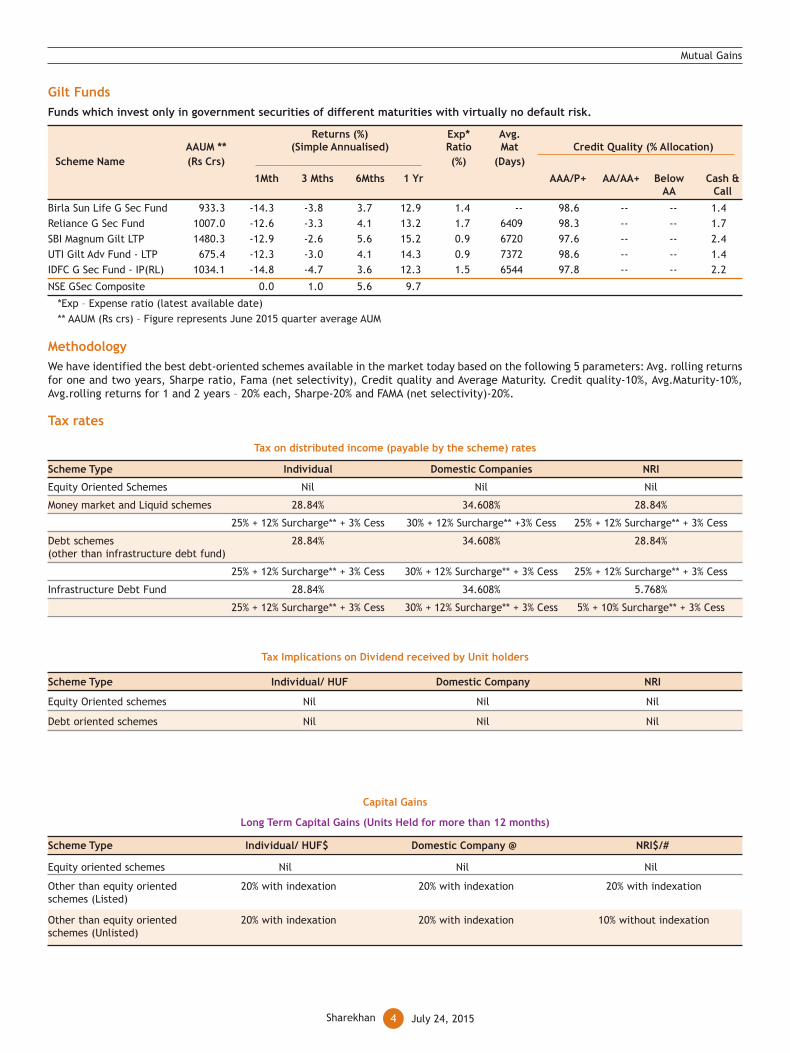
Gilt FundsFunds which invest only in government securities of different maturities with virtually no default risk.
Returns (%) Exp* Avg.AAUM ** (Simple Annualised) Ratio Mat Credit Quality (% Allocation)
Scheme Name (Rs Crs) (%) (Days)
1Mth 3 Mths 6Mths 1 Yr AAA/P+ AA/AA+ Below Cash &AA Call
Birla Sun Life G Sec Fund 933.3 -14.3 -3.8 3.7 12.9 1.4 -- 98.6 -- -- 1.4Reliance G Sec Fund 1007.0 -12.6 -3.3 4.1 13.2 1.7 6409 98.3 -- -- 1.7SBI Magnum Gilt LTP 1480.3 -12.9 -2.6 5.6 15.2 0.9 6720 97.6 -- -- 2.4UTI Gilt Adv Fund - LTP 675.4 -12.3 -3.0 4.1 14.3 0.9 7372 98.6 -- -- 1.4IDFC G Sec Fund - IP(RL) 1034.1 -14.8 -4.7 3.6 12.3 1.5 6544 97.8 -- -- 2.2
NSE GSec Composite 0.0 1.0 5.6 9.7
*Exp – Expense ratio (latest available date) ** AAUM (Rs crs) – Figure represents June 2015 quarter average AUM
MethodologyWe have identified the best debt-oriented schemes available in the market today based on the following 5 parameters: Avg. rolling returnsfor one and two years, Sharpe ratio, Fama (net selectivity), Credit quality and Average Maturity. Credit quality-10%, Avg.Maturity-10%,Avg.rolling returns for 1 and 2 years – 20% each, Sharpe-20% and FAMA (net selectivity)-20%.
Tax rates
Tax on distributed income (payable by the scheme) rates
Scheme Type Individual Domestic Companies NRI
Equity Oriented Schemes Nil Nil Nil
Money market and Liquid schemes 28.84% 34.608% 28.84%
25% + 12% Surcharge** + 3% Cess 30% + 12% Surcharge** +3% Cess 25% + 12% Surcharge** + 3% Cess
Debt schemes 28.84% 34.608% 28.84%(other than infrastructure debt fund)
25% + 12% Surcharge** + 3% Cess 30% + 12% Surcharge** + 3% Cess 25% + 12% Surcharge** + 3% Cess
Infrastructure Debt Fund 28.84% 34.608% 5.768%
25% + 12% Surcharge** + 3% Cess 30% + 12% Surcharge** + 3% Cess 5% + 10% Surcharge** + 3% Cess
Tax Implications on Dividend received by Unit holders
Scheme Type Individual/ HUF Domestic Company NRI
Equity Oriented schemes Nil Nil Nil
Debt oriented schemes Nil Nil Nil
Capital Gains
Long Term Capital Gains (Units Held for more than 12 months)
Scheme Type Individual/ HUF$ Domestic Company @ NRI$/#
Equity oriented schemes Nil Nil Nil
Other than equity orientedschemes (Listed)
20% with indexation 20% with indexation20% with indexation
Other than equity orientedschemes (Unlisted)
20% with indexation 10% without indexation20% with indexation
5Sharekhan July 24, 2015
Mutual Gains
Tax Deduced at Source (Applicable only to NRI Investors)
Scheme Type Short term capital gains Long term capital gains
Equity oriented schemes 15% Nil
Other than equity oriented schemes (Listed) 30% 20%##
Other than equity oriented schemes (Unlisted) 30% 10%
Short Term Capital Gains (Units Held for 12 months or less)
Scheme Type Individual/ HUF$ Domestic Company @ NRI$/#
Equity oriented schemes 15% 15% 15%
Other than equity oriented schemes 30%^ 30% 30%^
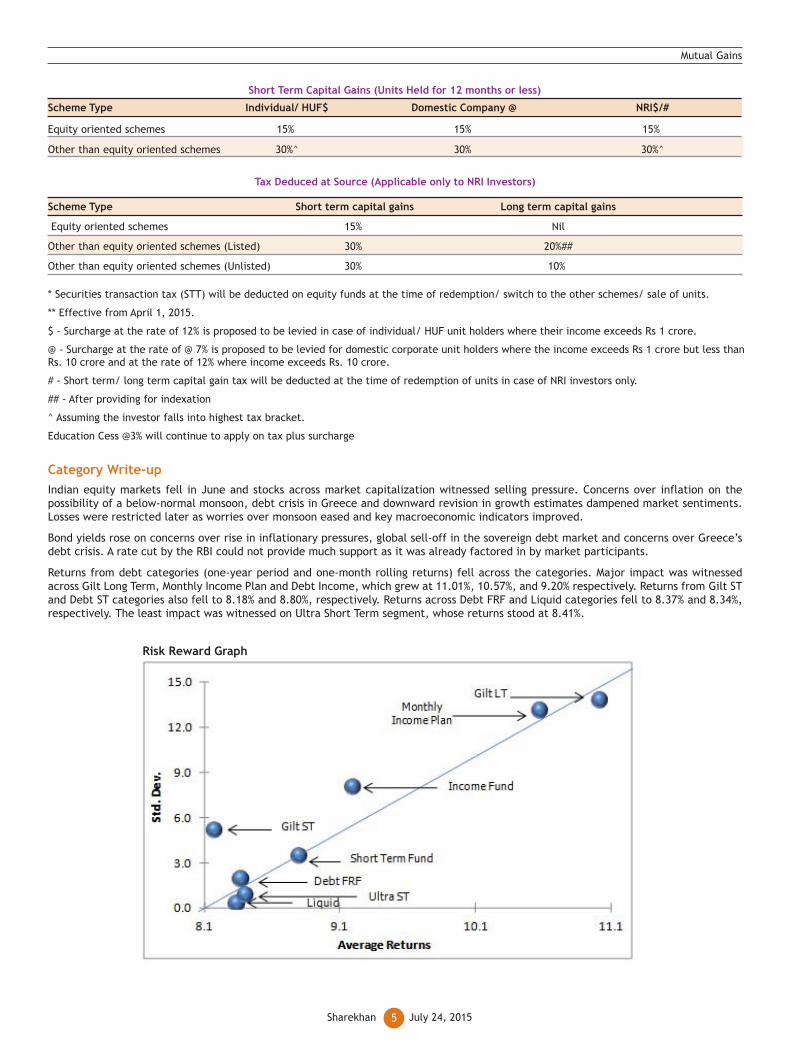
Risk Reward Graph
* Securities transaction tax (STT) will be deducted on equity funds at the time of redemption/ switch to the other schemes/ sale of units.
** Effective from April 1, 2015.
$ - Surcharge at the rate of 12% is proposed to be levied in case of individual/ HUF unit holders where their income exceeds Rs 1 crore.
@ - Surcharge at the rate of @ 7% is proposed to be levied for domestic corporate unit holders where the income exceeds Rs 1 crore but less thanRs. 10 crore and at the rate of 12% where income exceeds Rs. 10 crore.
# - Short term/ long term capital gain tax will be deducted at the time of redemption of units in case of NRI investors only.
## - After providing for indexation
^ Assuming the investor falls into highest tax bracket.
Education Cess @3% will continue to apply on tax plus surcharge
Category Write-upIndian equity markets fell in June and stocks across market capitalization witnessed selling pressure. Concerns over inflation on thepossibility of a below-normal monsoon, debt crisis in Greece and downward revision in growth estimates dampened market sentiments.Losses were restricted later as worries over monsoon eased and key macroeconomic indicators improved.
Bond yields rose on concerns over rise in inflationary pressures, global sell-off in the sovereign debt market and concerns over Greece’sdebt crisis. A rate cut by the RBI could not provide much support as it was already factored in by market participants.
Returns from debt categories (one-year period and one-month rolling returns) fell across the categories. Major impact was witnessedacross Gilt Long Term, Monthly Income Plan and Debt Income, which grew at 11.01%, 10.57%, and 9.20% respectively. Returns from Gilt STand Debt ST categories also fell to 8.18% and 8.80%, respectively. Returns across Debt FRF and Liquid categories fell to 8.37% and 8.34%,respectively. The least impact was witnessed on Ultra Short Term segment, whose returns stood at 8.41%.
6Sharekhan July 24, 2015
MethodologyThe bubble diagram gives you a snapshot of how the mutual funds have performed on the risk – return parameter in the past. We have usedbubble analysis method to measure their performance on two parameters i.e. Average rolling returns and Standard deviation. For allfunds, we have considered one month rolling and periodic frequency for the period of one year, as on June 30, 2015.
Forthcoming NFOs
Fund House Scheme Name Open Date Close Date Structure Nature
DWS Mutual Fund DWS Hybrid Fixed Term fund - Series 41 20-Jul-15 03-Aug-15 Close Ended Fixed Term Fund(1100 days)
ICICI Mutual Fund ICICI Pru FMP Sr-77-1104D-O-Reg (D) 23-Jul-15 29-Jul-15 Close Ended Fixed Maturity Plan
UTI Mutual Fund UTI – Fixed Term Income Fund 13-Jul-15 24-Jul-15 Close Ended Fixed Maturity PlanSeries – XXII – XII (1100 days)
SBI Mutual Fund SBI Debt Fund Sr-B-24 (1100 D) DP (D) 27-Jul-15 29-Jul-15 Close Ended Fixed Maturity Plan
Reliance Mutual Fund Reliance DAFTF VIII - Plan A (G) 27-Jul-15 05-Aug-15 Close Ended Fixed Maturity Plan
Reliance Mutual Fund Reliance DAFTF VIII - Plan A-DP (D) 27-Jul-15 05-Aug-15 Close Ended Fixed Maturity Plan
Mutual Gains
DisclaimerNothing in this report constitutes investment advice or tax advice in any form and these products may or may not be suitable for you. Investors should make independent judgment taking into account specific investment objectives,financial situations and needs before taking any investment decision. Mutual fund investments are subject to market risk. Please read the offer document carefully before investing. Past performance may or may not be sustained in thefuture.
This document has been prepared by Sharekhan Ltd. (SHAREKHAN) and is intended for use only by the person or entity to which it is addressed to. This document may contain confidential and/or privileged material and is not for any typeof circulation and any review, retransmission, or any other use is strictly prohibited. This document is subject to changes without prior notice. This document does not constitute an offer to sell or solicitation for the purchase or sale ofany financial instrument or as an official confirmation of any transaction. Though disseminated to all customers who are due to receive the same, not all customers may receive this report at the same time. SHAREKHAN will not treatrecipients as customers by virtue of their receiving this report.
The information contained herein is obtained from publicly available data or other sources believed to be reliable and SHAREKHAN has not independently verified the accuracy and completeness of the said data and hence it should notbe relied upon as such. While we would endeavour to update the information herein on a reasonable basis, SHAREKHAN, its subsidiaries and associated companies, their directors and employees (“SHAREKHAN and affiliates”) are underno obligation to update or keep the information current. Also, there may be regulatory, compliance, or other reasons that may prevent SHAREKHAN and affiliates from doing so. Sharekhan provides non-advisory/order execution servicesfor Mutual Funds. This document is prepared for assistance only and is not intended to be and must not alone be taken as the basis for an investment decision. Mutual fund investments are subject to market risk. Please read the offerdocument carefully before investing. Also, Recipients of this report should also be aware that past performance is not necessarily a guide to future performance and value of investments can go down as well. The user assumes the entirerisk of any use made of this information. Each recipient of this document should make such investigations as he deems necessary to arrive at an independent evaluation of an investment in the securities of companies referred to in thisdocument (including the merits and risks involved), and should consult his own advisors to determine the merits and risks of such an investment. The investment discussed or views expressed may not be suitable for all investors. We donot undertake to advise you as to any change of our views. Affiliates of SHAREKHAN may have issued other reports that are inconsistent with and reach different conclusion from the information presented in this report.
This report is not directed or intended for distribution to, or use by, any person or entity who is a citizen or resident of or located in any locality, state, country or other jurisdiction, where such distribution, publication, availability oruse would be contrary to law, regulation or which would subject SHAREKHAN and affiliates to any registration or licencing requirement within such jurisdiction. The securities described herein may or may not be eligible for sale in alljurisdictions or to certain category of investors. Persons in whose possession this document may come are required to inform themselves of and to observe such restriction. Either SHAREKHAN or its affiliates or its directors or employees/representatives/clients or their relatives may have position(s), make market, act as principal or engage in transactions of purchase or sell of securities, from time to time or may be materially interested in any of the securities or relatedsecurities referred to in this report and they may have used the information set forth herein before publication. SHAREKHAN may from time to time solicit from, or perform investment banking, or other services for, any companymentioned herein. Without limiting any of the foregoing, in no event shall SHAREKHAN, any of its affiliates or any third party involved in, or related to, computing or compiling the information have any liability for any damages of anykind. The analyst certifies that all of the views expressed in this document accurately reflect his or her personal views about the subject company or companies and its or their securities and do not necessarily reflect those of SHAREKHAN.Further, no part of the analyst’s compensation was, is or will be, directly or indirectly related to specific recommendations or views expressed in this document.”
Compliance Officer: Ms. Namita Amod Godbole; Tel: 022-6115000; e-mail: [email protected] • Contact: [email protected]