Embed Size (px)
Citation preview

May 19, 2015Visit us at www.sharekhan.com
Sharekhan’s top equity mutual fund picks
Index
Top rated equity funds >> Large-cap funds
>> Mid-cap funds
>> Multi-cap funds
>> Tax-saving funds
>> Thematic funds
>> Balanced funds
Fund focus >> Franklin Build India Fund
Fund ranking procedure
For Private Circulation only
REGISTRATION DETAILS Regd Add: Sharekhan Limited, 10th Floor, Beta Building, Lodha iThink Techno Campus, Off. JVLR, Opp. Kanjurmarg RailwayStation, Kanjurmarg (East), Mumbai – 400042, Maharashtra. Tel: 022 - 61150000. Sharekhan Ltd.: SEBI Regn. Nos. BSE - INB/INF011073351 ; BSE- CD ;NSE- INB/INF231073330; CD-INE231073330 ; MCX Stock Exchange - INB/INF261073333 ; CD-INE261073330 ; DP - NSDL-IN-DP-NSDL-233-2003 ; CDSL-IN-DP-CDSL-271-2004 ; PMS-INP000000662 ; Mutual Fund-ARN 20669 ; Commodity trading through Sharekhan Commodities Pvt. Ltd.: MCX-10080 ; (MCX/TCM/CORP/0425) ; NCDEX-00132 ; (NCDEX/TCM/CORP/0142) ; NCDEX SPOT-NCDEXSPOT/116/CO/11/20626 ; For any complaints email at [email protected];Disclaimer: Client should read the Risk Disclosure Document issued by SEBI & relevant exchanges and Do’s & Don’ts by MCX & NCDEX and the T & C onwww.sharekhan.com before investing.
Mutual Funds Mutual Gains
2Sharekhan May 19, 2015
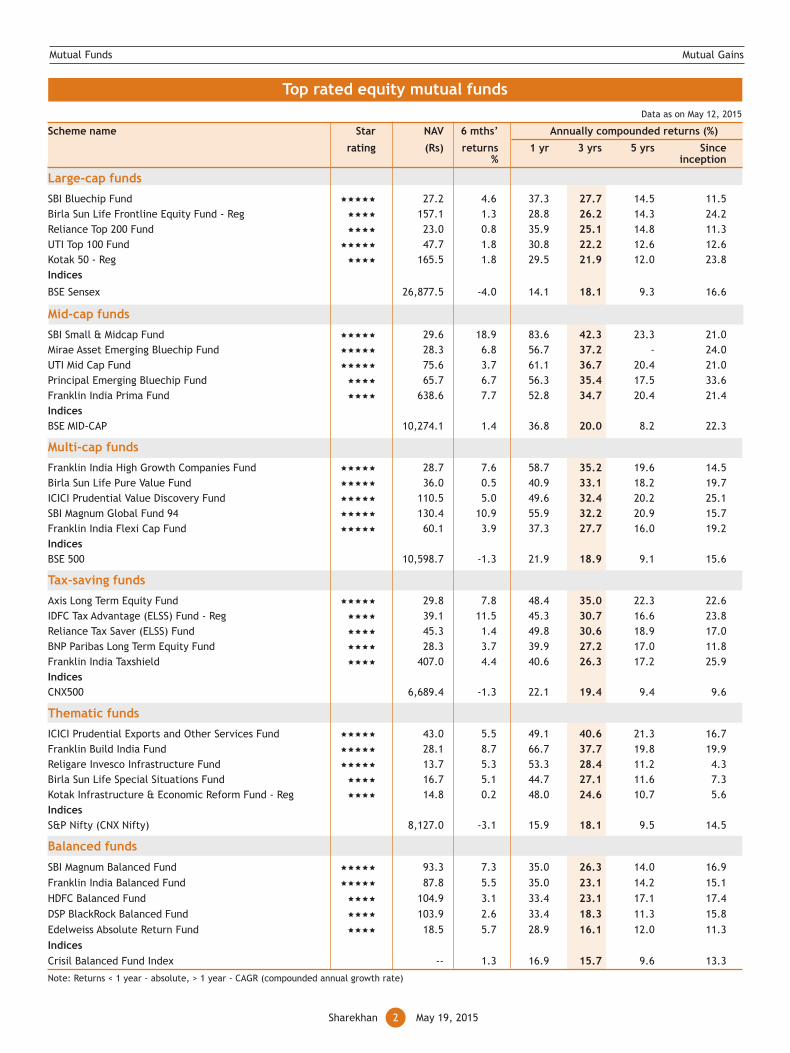
Top rated equity mutual funds
Scheme name Star NAV 6 mths’ Annually compounded returns (%)
rating (Rs) returns 1 yr 3 yrs 5 yrs Since% inception
Large-cap funds
SBI Bluechip Fund 27.2 4.6 37.3 27.7 14.5 11.5Birla Sun Life Frontline Equity Fund - Reg 157.1 1.3 28.8 26.2 14.3 24.2Reliance Top 200 Fund 23.0 0.8 35.9 25.1 14.8 11.3UTI Top 100 Fund 47.7 1.8 30.8 22.2 12.6 12.6Kotak 50 - Reg 165.5 1.8 29.5 21.9 12.0 23.8Indices
BSE Sensex 26,877.5 -4.0 14.1 18.1 9.3 16.6
Mid-cap funds
SBI Small & Midcap Fund 29.6 18.9 83.6 42.3 23.3 21.0Mirae Asset Emerging Bluechip Fund 28.3 6.8 56.7 37.2 - 24.0UTI Mid Cap Fund 75.6 3.7 61.1 36.7 20.4 21.0Principal Emerging Bluechip Fund 65.7 6.7 56.3 35.4 17.5 33.6Franklin India Prima Fund 638.6 7.7 52.8 34.7 20.4 21.4IndicesBSE MID-CAP 10,274.1 1.4 36.8 20.0 8.2 22.3
Multi-cap funds
Franklin India High Growth Companies Fund 28.7 7.6 58.7 35.2 19.6 14.5Birla Sun Life Pure Value Fund 36.0 0.5 40.9 33.1 18.2 19.7ICICI Prudential Value Discovery Fund 110.5 5.0 49.6 32.4 20.2 25.1SBI Magnum Global Fund 94 130.4 10.9 55.9 32.2 20.9 15.7Franklin India Flexi Cap Fund 60.1 3.9 37.3 27.7 16.0 19.2IndicesBSE 500 10,598.7 -1.3 21.9 18.9 9.1 15.6
Tax-saving funds
Axis Long Term Equity Fund 29.8 7.8 48.4 35.0 22.3 22.6IDFC Tax Advantage (ELSS) Fund - Reg 39.1 11.5 45.3 30.7 16.6 23.8Reliance Tax Saver (ELSS) Fund 45.3 1.4 49.8 30.6 18.9 17.0BNP Paribas Long Term Equity Fund 28.3 3.7 39.9 27.2 17.0 11.8Franklin India Taxshield 407.0 4.4 40.6 26.3 17.2 25.9IndicesCNX500 6,689.4 -1.3 22.1 19.4 9.4 9.6
Thematic funds
ICICI Prudential Exports and Other Services Fund 43.0 5.5 49.1 40.6 21.3 16.7Franklin Build India Fund 28.1 8.7 66.7 37.7 19.8 19.9Religare Invesco Infrastructure Fund 13.7 5.3 53.3 28.4 11.2 4.3Birla Sun Life Special Situations Fund 16.7 5.1 44.7 27.1 11.6 7.3Kotak Infrastructure & Economic Reform Fund - Reg 14.8 0.2 48.0 24.6 10.7 5.6IndicesS&P Nifty (CNX Nifty) 8,127.0 -3.1 15.9 18.1 9.5 14.5
Balanced funds
SBI Magnum Balanced Fund 93.3 7.3 35.0 26.3 14.0 16.9Franklin India Balanced Fund 87.8 5.5 35.0 23.1 14.2 15.1HDFC Balanced Fund 104.9 3.1 33.4 23.1 17.1 17.4DSP BlackRock Balanced Fund 103.9 2.6 33.4 18.3 11.3 15.8Edelweiss Absolute Return Fund 18.5 5.7 28.9 16.1 12.0 11.3IndicesCrisil Balanced Fund Index -- 1.3 16.9 15.7 9.6 13.3
Note: Returns < 1 year - absolute, > 1 year - CAGR (compounded annual growth rate)
Data as on May 12, 2015
Mutual Funds Mutual Gains
3Sharekhan May 19, 2015
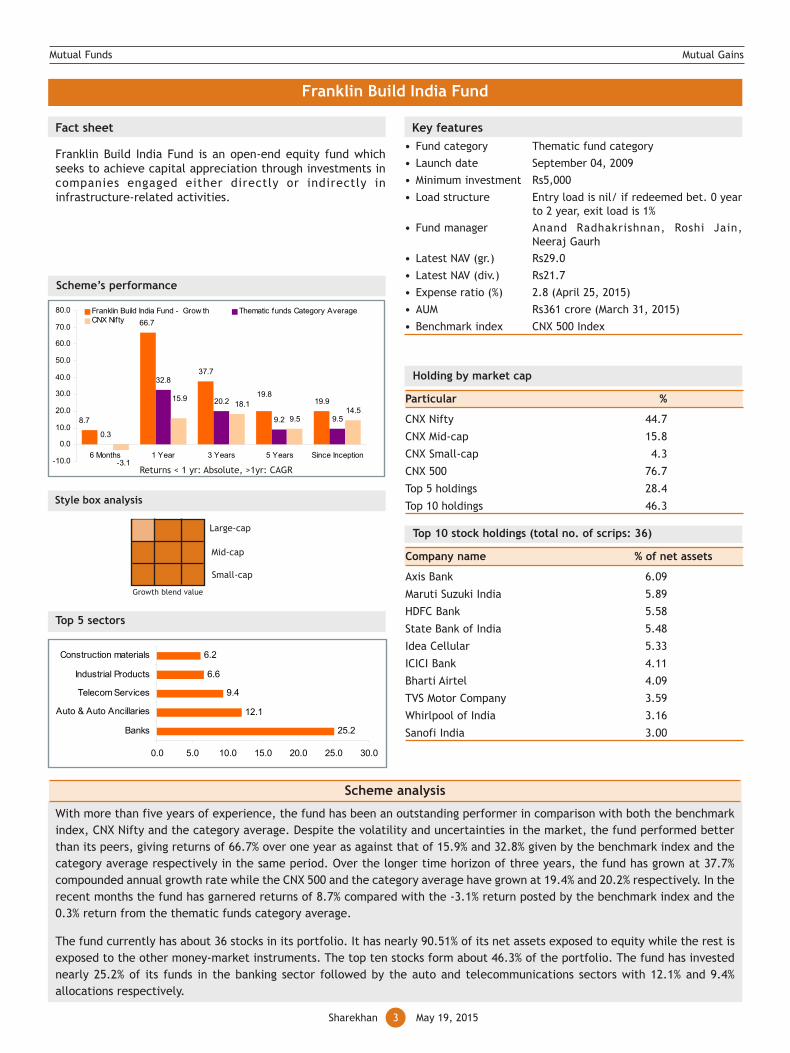
Franklin Build India Fund
With more than five years of experience, the fund has been an outstanding performer in comparison with both the benchmarkindex, CNX Nifty and the category average. Despite the volatility and uncertainties in the market, the fund performed betterthan its peers, giving returns of 66.7% over one year as against that of 15.9% and 32.8% given by the benchmark index and thecategory average respectively in the same period. Over the longer time horizon of three years, the fund has grown at 37.7%compounded annual growth rate while the CNX 500 and the category average have grown at 19.4% and 20.2% respectively. In therecent months the fund has garnered returns of 8.7% compared with the -3.1% return posted by the benchmark index and the0.3% return from the thematic funds category average.
The fund currently has about 36 stocks in its portfolio. It has nearly 90.51% of its net assets exposed to equity while the rest isexposed to the other money-market instruments. The top ten stocks form about 46.3% of the portfolio. The fund has investednearly 25.2% of its funds in the banking sector followed by the auto and telecommunications sectors with 12.1% and 9.4%allocations respectively.
Scheme’s performance
Key features• Fund category Thematic fund category• Launch date September 04, 2009• Minimum investment Rs5,000
• Load structure Entry load is nil/ if redeemed bet. 0 yearto 2 year, exit load is 1%
• Fund manager Anand Radhakrishnan, Roshi Jain,Neeraj Gaurh
• Latest NAV (gr.) Rs29.0
• Latest NAV (div.) Rs21.7• Expense ratio (%) 2.8 (April 25, 2015)• AUM Rs361 crore (March 31, 2015)
• Benchmark index CNX 500 Index
Holding by market cap
Particular %
CNX Nifty 44.7
CNX Mid-cap 15.8
CNX Small-cap 4.3
CNX 500 76.7
Top 5 holdings 28.4
Top 10 holdings 46.3
Top 10 stock holdings (total no. of scrips: 36)
Company name % of net assets
Axis Bank 6.09
Maruti Suzuki India 5.89
HDFC Bank 5.58
State Bank of India 5.48
Idea Cellular 5.33
ICICI Bank 4.11
Bharti Airtel 4.09
TVS Motor Company 3.59
Whirlpool of India 3.16
Sanofi India 3.00
Style box analysis
Fact sheet
Franklin Build India Fund is an open-end equity fund whichseeks to achieve capital appreciation through investments incompanies engaged either directly or indirectly ininfrastructure-related activities.
Mid-cap
Small-cap
Top 5 sectors
Scheme analysis
Large-cap
Growth blend value
25.2
12.1
9.4
6.6
6.2
0.0 5.0 10.0 15.0 20.0 25.0 30.0
Banks
Auto & Auto Ancillaries
Telecom Services
Industrial Products
Construction materials
37.7
19.9
0.3
32.8
20.2
9.2 9.59.514.5
8.7
66.7
19.8
-3.1
15.918.1
-10.0
0.0
10.0
20.0
30.0
40.0
50.0
60.0
70.0
80.0
6 Months 1 Year 3 Years 5 Years Since Inception
Franklin Build India Fund - Grow th Thematic funds Category AverageCNX Nifty
Returns < 1 yr: Absolute, >1yr: CAGR
Mutual Funds Mutual Gains
4Sharekhan May 19, 2015
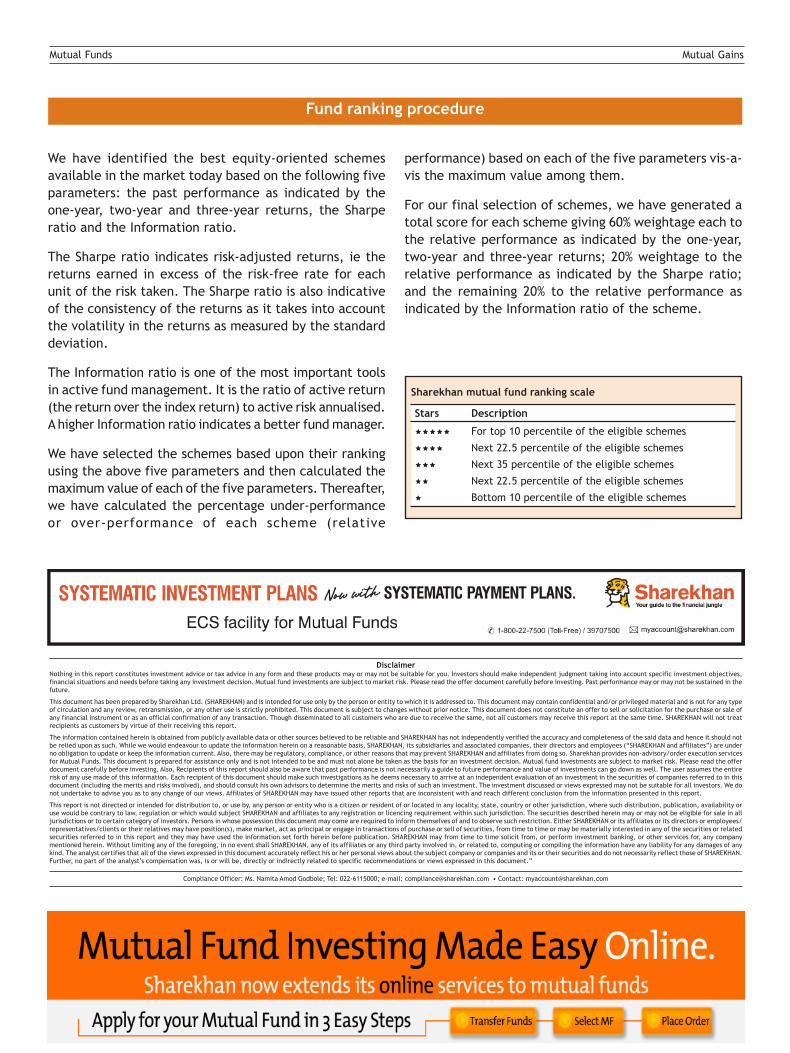
We have identified the best equity-oriented schemesavailable in the market today based on the following fiveparameters: the past performance as indicated by theone-year, two-year and three-year returns, the Sharperatio and the Information ratio.
The Sharpe ratio indicates risk-adjusted returns, ie thereturns earned in excess of the risk-free rate for eachunit of the risk taken. The Sharpe ratio is also indicativeof the consistency of the returns as it takes into accountthe volatility in the returns as measured by the standarddeviation.
The Information ratio is one of the most important toolsin active fund management. It is the ratio of active return(the return over the index return) to active risk annualised.A higher Information ratio indicates a better fund manager.
We have selected the schemes based upon their rankingusing the above five parameters and then calculated themaximum value of each of the five parameters. Thereafter,we have calculated the percentage under-performanceor over-performance of each scheme (relative
Fund ranking procedure
Sharekhan mutual fund ranking scale
Stars Description
For top 10 percentile of the eligible schemes
Next 22.5 percentile of the eligible schemes
Next 35 percentile of the eligible schemes
Next 22.5 percentile of the eligible schemes
Bottom 10 percentile of the eligible schemes
performance) based on each of the five parameters vis-a-vis the maximum value among them.
For our final selection of schemes, we have generated atotal score for each scheme giving 60% weightage each tothe relative performance as indicated by the one-year,two-year and three-year returns; 20% weightage to therelative performance as indicated by the Sharpe ratio;and the remaining 20% to the relative performance asindicated by the Information ratio of the scheme.
DisclaimerNothing in this report constitutes investment advice or tax advice in any form and these products may or may not be suitable for you. Investors should make independent judgment taking into account specific investment objectives,financial situations and needs before taking any investment decision. Mutual fund investments are subject to market risk. Please read the offer document carefully before investing. Past performance may or may not be sustained in thefuture.
This document has been prepared by Sharekhan Ltd. (SHAREKHAN) and is intended for use only by the person or entity to which it is addressed to. This document may contain confidential and/or privileged material and is not for any typeof circulation and any review, retransmission, or any other use is strictly prohibited. This document is subject to changes without prior notice. This document does not constitute an offer to sell or solicitation for the purchase or sale ofany financial instrument or as an official confirmation of any transaction. Though disseminated to all customers who are due to receive the same, not all customers may receive this report at the same time. SHAREKHAN will not treatrecipients as customers by virtue of their receiving this report.
The information contained herein is obtained from publicly available data or other sources believed to be reliable and SHAREKHAN has not independently verified the accuracy and completeness of the said data and hence it should notbe relied upon as such. While we would endeavour to update the information herein on a reasonable basis, SHAREKHAN, its subsidiaries and associated companies, their directors and employees (“SHAREKHAN and affiliates”) are underno obligation to update or keep the information current. Also, there may be regulatory, compliance, or other reasons that may prevent SHAREKHAN and affiliates from doing so. Sharekhan provides non-advisory/order execution servicesfor Mutual Funds. This document is prepared for assistance only and is not intended to be and must not alone be taken as the basis for an investment decision. Mutual fund investments are subject to market risk. Please read the offerdocument carefully before investing. Also, Recipients of this report should also be aware that past performance is not necessarily a guide to future performance and value of investments can go down as well. The user assumes the entirerisk of any use made of this information. Each recipient of this document should make such investigations as he deems necessary to arrive at an independent evaluation of an investment in the securities of companies referred to in thisdocument (including the merits and risks involved), and should consult his own advisors to determine the merits and risks of such an investment. The investment discussed or views expressed may not be suitable for all investors. We donot undertake to advise you as to any change of our views. Affiliates of SHAREKHAN may have issued other reports that are inconsistent with and reach different conclusion from the information presented in this report.
This report is not directed or intended for distribution to, or use by, any person or entity who is a citizen or resident of or located in any locality, state, country or other jurisdiction, where such distribution, publication, availability oruse would be contrary to law, regulation or which would subject SHAREKHAN and affiliates to any registration or licencing requirement within such jurisdiction. The securities described herein may or may not be eligible for sale in alljurisdictions or to certain category of investors. Persons in whose possession this document may come are required to inform themselves of and to observe such restriction. Either SHAREKHAN or its affiliates or its directors or employees/representatives/clients or their relatives may have position(s), make market, act as principal or engage in transactions of purchase or sell of securities, from time to time or may be materially interested in any of the securities or relatedsecurities referred to in this report and they may have used the information set forth herein before publication. SHAREKHAN may from time to time solicit from, or perform investment banking, or other services for, any companymentioned herein. Without limiting any of the foregoing, in no event shall SHAREKHAN, any of its affiliates or any third party involved in, or related to, computing or compiling the information have any liability for any damages of anykind. The analyst certifies that all of the views expressed in this document accurately reflect his or her personal views about the subject company or companies and its or their securities and do not necessarily reflect those of SHAREKHAN.Further, no part of the analyst’s compensation was, is or will be, directly or indirectly related to specific recommendations or views expressed in this document.”
Compliance Officer: Ms. Namita Amod Godbole; Tel: 022-6115000; e-mail: [email protected] • Contact: [email protected]
Sharekhan’s top SIP fund picks
Why SIP?
Disciplined investing
Being disciplined is a key to investing success. Througha systematic investment plan (SIP) you can choose toinvest fixed amounts in a mutual fund scheme whichcould be as low as Rs500 at regular intervals (like everymonth) for a chosen period of time (say for a year).The amount you invest every month or every quarterwill be used to purchase units of a SIP of a mutualfund scheme. Small amounts set aside every monthtowards well performing SIP mutual fund schemes canmake an investor achieve his financial goals in future.
Invest in instruments that beat Inflation
Equity investing can help you combat rising inflationthat diminishes the value of your savings.
SIP over a longer period can reduce the cost per unit
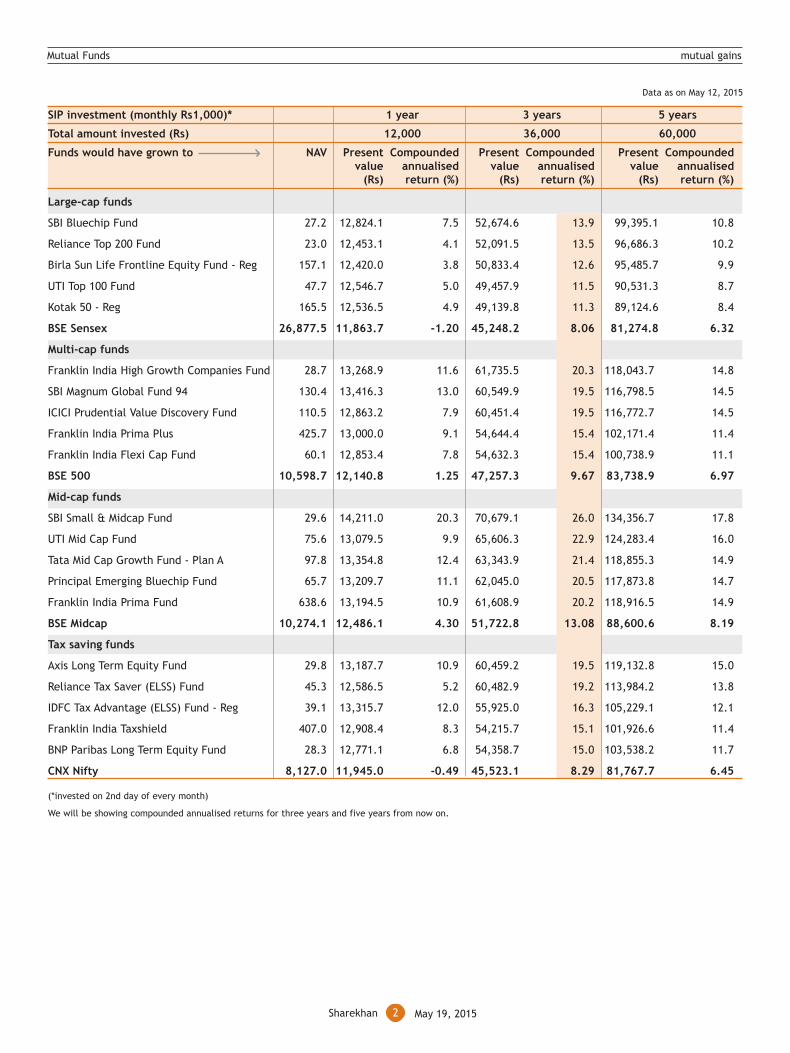
Example (see table below): An investment of Rs24,000in a mutual fund resulted in a value of Rs25,200 after12 months; whereas a SIP mutual fund investment ofRs2,000 per month grew to Rs27,095 after the sameperiod.
Fewer efforts to opt for SIP
The procedure to invest through SIP is easy. All youneed to do is give post-dated cheques or opt for anauto debit of a specific amount towards SIP from yourbank account. SIP plans are completely flexible. Onecan even start a SIP just by placing an order by logginginto Sharekhan’s online mutual fund page. One caninvest for a minimum of six months or for a long tenure.Also, there is an option of choosing the investmentinterval which could be monthly or quarterly.
Illustrative example
Price per unit One-time investment SIP
Month (Rs) Amount Units Amount Unitsinvested (Rs) purchased invested (Rs) purchased
Jan-10 20 24,000 1,200 2,000 100.0
Feb-10 18 -- 2,000 111.1
Mar-10 14 -- 2,000 142.9
Apr-10 22 -- 2,000 90.9
May-10 26 -- 2,000 76.9
Jun-10 20 -- 2,000 100.0
Jul-10 18 -- 2,000 111.1
Aug-10 17 -- 2,000 117.7
Sep-10 15 -- 2,000 133.3
Oct-10 18 -- 2,000 111.1
Nov-10 20 -- 2,000 100.0
Dec-10 21 -- 2,000 95.2
Total investment (Rs) 24,000 24,000
Average price (Rs) 20 19
Total units purchased 1,200 1,290
Value of investment after 25,200 27,09512 months (Rs)*NAV as on the 1st of every month. These are assumed NAVs in a volatile market.
May 19, 2015Visit us at www.sharekhan.com
For Private Circulation only
REGISTRATION DETAILS Regd Add: Sharekhan Limited, 10th Floor, Beta Building, Lodha iThink Techno Campus, Off. JVLR, Opp. Kanjurmarg RailwayStation, Kanjurmarg (East), Mumbai – 400042, Maharashtra. Tel: 022 - 61150000. Sharekhan Ltd.: SEBI Regn. Nos. BSE - INB/INF011073351 ; BSE- CD ;NSE- INB/INF231073330; CD-INE231073330 ; MCX Stock Exchange - INB/INF261073333 ; CD-INE261073330 ; DP - NSDL-IN-DP-NSDL-233-2003 ; CDSL-IN-DP-CDSL-271-2004 ; PMS-INP000000662 ; Mutual Fund-ARN 20669 ; Commodity trading through Sharekhan Commodities Pvt. Ltd.: MCX-10080 ; (MCX/TCM/CORP/0425) ; NCDEX-00132 ; (NCDEX/TCM/CORP/0142) ; NCDEX SPOT-NCDEXSPOT/116/CO/11/20626 ; For any complaints email at [email protected];Disclaimer: Client should read the Risk Disclosure Document issued by SEBI & relevant exchanges and Do’s & Don’ts by MCX & NCDEX and the T & C onwww.sharekhan.com before investing.
Mutual Funds mutual gains
2Sharekhan May 19, 2015
Data as on May 12, 2015
(*invested on 2nd day of every month)
We will be showing compounded annualised returns for three years and five years from now on.
SIP investment (monthly Rs1,000)* 1 year 3 years 5 years
Total amount invested (Rs) 12,000 36,000 60,000
Funds would have grown to NAV Present Compounded Present Compounded Present Compoundedvalue annualised value annualised value annualised
(Rs) return (%) (Rs) return (%) (Rs) return (%)
Large-cap funds
SBI Bluechip Fund 27.2 12,824.1 7.5 52,674.6 13.9 99,395.1 10.8
Reliance Top 200 Fund 23.0 12,453.1 4.1 52,091.5 13.5 96,686.3 10.2
Birla Sun Life Frontline Equity Fund - Reg 157.1 12,420.0 3.8 50,833.4 12.6 95,485.7 9.9
UTI Top 100 Fund 47.7 12,546.7 5.0 49,457.9 11.5 90,531.3 8.7
Kotak 50 - Reg 165.5 12,536.5 4.9 49,139.8 11.3 89,124.6 8.4
BSE Sensex 26,877.5 11,863.7 -1.20 45,248.2 8.06 81,274.8 6.32
Multi-cap funds
Franklin India High Growth Companies Fund 28.7 13,268.9 11.6 61,735.5 20.3 118,043.7 14.8
SBI Magnum Global Fund 94 130.4 13,416.3 13.0 60,549.9 19.5 116,798.5 14.5
ICICI Prudential Value Discovery Fund 110.5 12,863.2 7.9 60,451.4 19.5 116,772.7 14.5
Franklin India Prima Plus 425.7 13,000.0 9.1 54,644.4 15.4 102,171.4 11.4
Franklin India Flexi Cap Fund 60.1 12,853.4 7.8 54,632.3 15.4 100,738.9 11.1
BSE 500 10,598.7 12,140.8 1.25 47,257.3 9.67 83,738.9 6.97
Mid-cap funds
SBI Small & Midcap Fund 29.6 14,211.0 20.3 70,679.1 26.0 134,356.7 17.8
UTI Mid Cap Fund 75.6 13,079.5 9.9 65,606.3 22.9 124,283.4 16.0
Tata Mid Cap Growth Fund - Plan A 97.8 13,354.8 12.4 63,343.9 21.4 118,855.3 14.9
Principal Emerging Bluechip Fund 65.7 13,209.7 11.1 62,045.0 20.5 117,873.8 14.7
Franklin India Prima Fund 638.6 13,194.5 10.9 61,608.9 20.2 118,916.5 14.9
BSE Midcap 10,274.1 12,486.1 4.30 51,722.8 13.08 88,600.6 8.19
Tax saving funds
Axis Long Term Equity Fund 29.8 13,187.7 10.9 60,459.2 19.5 119,132.8 15.0
Reliance Tax Saver (ELSS) Fund 45.3 12,586.5 5.2 60,482.9 19.2 113,984.2 13.8
IDFC Tax Advantage (ELSS) Fund - Reg 39.1 13,315.7 12.0 55,925.0 16.3 105,229.1 12.1
Franklin India Taxshield 407.0 12,908.4 8.3 54,215.7 15.1 101,926.6 11.4
BNP Paribas Long Term Equity Fund 28.3 12,771.1 6.8 54,358.7 15.0 103,538.2 11.7
CNX Nifty 8,127.0 11,945.0 -0.49 45,523.1 8.29 81,767.7 6.45
Mutual Funds mutual gains
3Sharekhan May 19, 2015
Franklin India High Growth Companies Fund
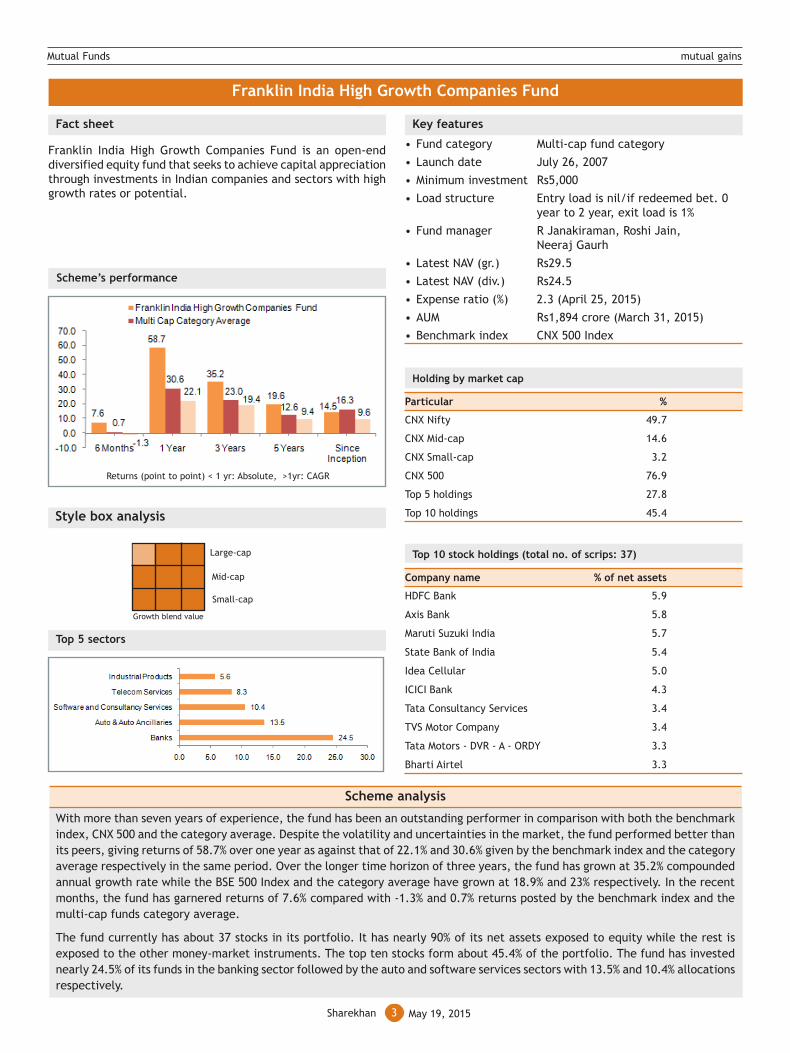
With more than seven years of experience, the fund has been an outstanding performer in comparison with both the benchmarkindex, CNX 500 and the category average. Despite the volatility and uncertainties in the market, the fund performed better thanits peers, giving returns of 58.7% over one year as against that of 22.1% and 30.6% given by the benchmark index and the categoryaverage respectively in the same period. Over the longer time horizon of three years, the fund has grown at 35.2% compoundedannual growth rate while the BSE 500 Index and the category average have grown at 18.9% and 23% respectively. In the recentmonths, the fund has garnered returns of 7.6% compared with -1.3% and 0.7% returns posted by the benchmark index and themulti-cap funds category average.
The fund currently has about 37 stocks in its portfolio. It has nearly 90% of its net assets exposed to equity while the rest isexposed to the other money-market instruments. The top ten stocks form about 45.4% of the portfolio. The fund has investednearly 24.5% of its funds in the banking sector followed by the auto and software services sectors with 13.5% and 10.4% allocationsrespectively.
Key features
• Fund category Multi-cap fund category
• Launch date July 26, 2007
• Minimum investment Rs5,000
• Load structure Entry load is nil/if redeemed bet. 0year to 2 year, exit load is 1%
• Fund manager R Janakiraman, Roshi Jain,Neeraj Gaurh
• Latest NAV (gr.) Rs29.5
• Latest NAV (div.) Rs24.5
• Expense ratio (%) 2.3 (April 25, 2015)
• AUM Rs1,894 crore (March 31, 2015)
• Benchmark index CNX 500 Index
Holding by market cap
Particular %
CNX Nifty 49.7
CNX Mid-cap 14.6
CNX Small-cap 3.2
CNX 500 76.9
Top 5 holdings 27.8
Top 10 holdings 45.4
Top 10 stock holdings (total no. of scrips: 37)
Company name % of net assets
HDFC Bank 5.9
Axis Bank 5.8
Maruti Suzuki India 5.7
State Bank of India 5.4
Idea Cellular 5.0
ICICI Bank 4.3
Tata Consultancy Services 3.4
TVS Motor Company 3.4
Tata Motors - DVR - A - ORDY 3.3
Bharti Airtel 3.3
Style box analysis
Fact sheet
Franklin India High Growth Companies Fund is an open-enddiversified equity fund that seeks to achieve capital appreciationthrough investments in Indian companies and sectors with highgrowth rates or potential.
Top 5 sectors
Scheme analysis
Scheme’s performance
Large-cap
Mid-cap
Small-cap
Growth blend value
Returns (point to point) < 1 yr: Absolute, >1yr: CAGR
Mutual Funds mutual gains
4Sharekhan May 19, 2015
DisclaimerNothing in this report constitutes investment advice or tax advice in any form and these products may or may not be suitable for you. Investors should make independent judgment taking into account specific investment objectives,financial situations and needs before taking any investment decision. Mutual fund investments are subject to market risk. Please read the offer document carefully before investing. Past performance may or may not be sustained in thefuture.
This document has been prepared by Sharekhan Ltd. (SHAREKHAN) and is intended for use only by the person or entity to which it is addressed to. This document may contain confidential and/or privileged material and is not for any typeof circulation and any review, retransmission, or any other use is strictly prohibited. This document is subject to changes without prior notice. This document does not constitute an offer to sell or solicitation for the purchase or sale ofany financial instrument or as an official confirmation of any transaction. Though disseminated to all customers who are due to receive the same, not all customers may receive this report at the same time. SHAREKHAN will not treatrecipients as customers by virtue of their receiving this report.
The information contained herein is obtained from publicly available data or other sources believed to be reliable and SHAREKHAN has not independently verified the accuracy and completeness of the said data and hence it should notbe relied upon as such. While we would endeavour to update the information herein on a reasonable basis, SHAREKHAN, its subsidiaries and associated companies, their directors and employees (“SHAREKHAN and affiliates”) are underno obligation to update or keep the information current. Also, there may be regulatory, compliance, or other reasons that may prevent SHAREKHAN and affiliates from doing so. Sharekhan provides non-advisory/order execution servicesfor Mutual Funds. This document is prepared for assistance only and is not intended to be and must not alone be taken as the basis for an investment decision. Mutual fund investments are subject to market risk. Please read the offerdocument carefully before investing. Also, Recipients of this report should also be aware that past performance is not necessarily a guide to future performance and value of investments can go down as well. The user assumes the entirerisk of any use made of this information. Each recipient of this document should make such investigations as he deems necessary to arrive at an independent evaluation of an investment in the securities of companies referred to in thisdocument (including the merits and risks involved), and should consult his own advisors to determine the merits and risks of such an investment. The investment discussed or views expressed may not be suitable for all investors. We donot undertake to advise you as to any change of our views. Affiliates of SHAREKHAN may have issued other reports that are inconsistent with and reach different conclusion from the information presented in this report.
This report is not directed or intended for distribution to, or use by, any person or entity who is a citizen or resident of or located in any locality, state, country or other jurisdiction, where such distribution, publication, availability oruse would be contrary to law, regulation or which would subject SHAREKHAN and affiliates to any registration or licencing requirement within such jurisdiction. The securities described herein may or may not be eligible for sale in alljurisdictions or to certain category of investors. Persons in whose possession this document may come are required to inform themselves of and to observe such restriction. Either SHAREKHAN or its affiliates or its directors or employees/representatives/clients or their relatives may have position(s), make market, act as principal or engage in transactions of purchase or sell of securities, from time to time or may be materially interested in any of the securities or relatedsecurities referred to in this report and they may have used the information set forth herein before publication. SHAREKHAN may from time to time solicit from, or perform investment banking, or other services for, any companymentioned herein. Without limiting any of the foregoing, in no event shall SHAREKHAN, any of its affiliates or any third party involved in, or related to, computing or compiling the information have any liability for any damages of anykind. The analyst certifies that all of the views expressed in this document accurately reflect his or her personal views about the subject company or companies and its or their securities and do not necessarily reflect those of SHAREKHAN.Further, no part of the analyst’s compensation was, is or will be, directly or indirectly related to specific recommendations or views expressed in this document.”
Compliance Officer: Ms. Namita Amod Godbole; Tel: 022-6115000; e-mail: [email protected] • Contact: [email protected]
1Sharekhan May 22, 2015
Visit us at www.sharekhan.com May 22, 2015
Debt Mutual Fund Picks
Macro data round up
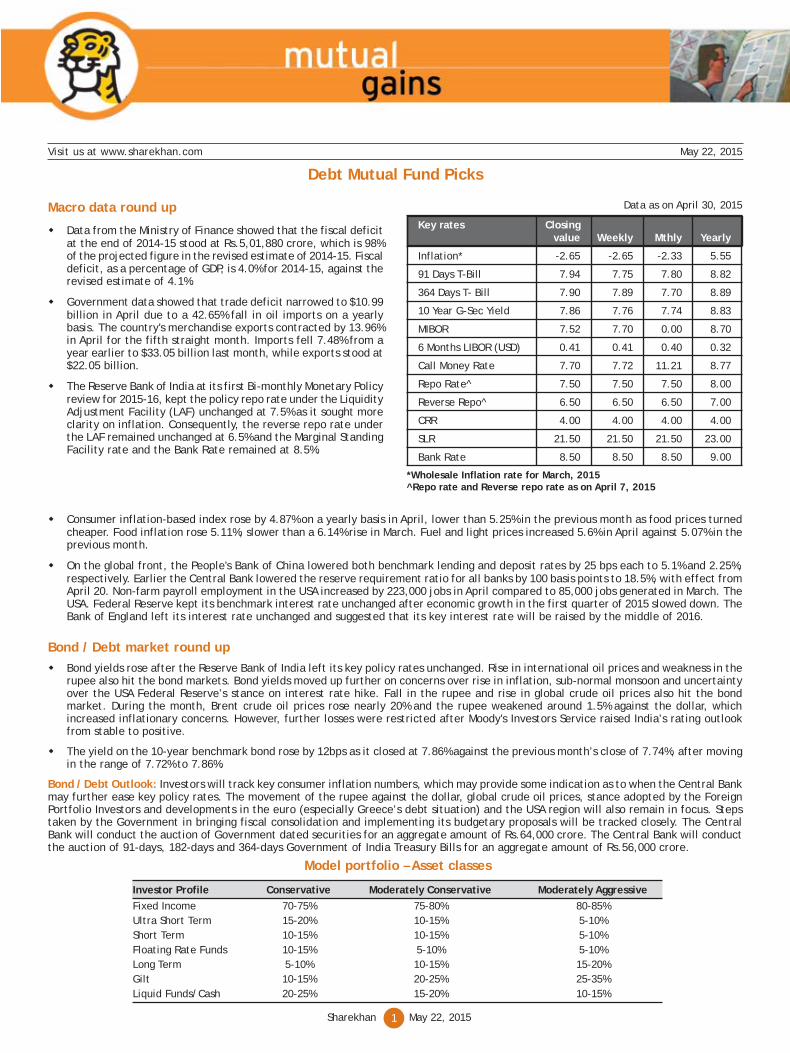
Data from the Ministry of Finance showed that the fiscal deficitat the end of 2014-15 stood at Rs.5,01,880 crore, which is 98%of the projected figure in the revised estimate of 2014-15. Fiscaldeficit, as a percentage of GDP, is 4.0% for 2014-15, against therevised estimate of 4.1%.
Government data showed that trade deficit narrowed to $10.99billion in April due to a 42.65% fall in oil imports on a yearlybasis. The country's merchandise exports contracted by 13.96%in April for the fifth straight month. Imports fell 7.48% from ayear earlier to $33.05 billion last month, while exports stood at$22.05 billion.
The Reserve Bank of India at its first Bi-monthly Monetary Policyreview for 2015-16, kept the policy repo rate under the LiquidityAdjustment Facility (LAF) unchanged at 7.5% as it sought moreclarity on inflation. Consequently, the reverse repo rate underthe LAF remained unchanged at 6.5% and the Marginal StandingFacility rate and the Bank Rate remained at 8.5%.
Model portfolio – Asset classes
Investor Profile Conservative Moderately Conservative Moderately Aggressive
Fixed Income 70-75% 75-80% 80-85%Ultra Short Term 15-20% 10-15% 5-10%Short Term 10-15% 10-15% 5-10%Floating Rate Funds 10-15% 5-10% 5-10%Long Term 5-10% 10-15% 15-20%Gilt 10-15% 20-25% 25-35%Liquid Funds/Cash 20-25% 15-20% 10-15%
Data as on April 30, 2015
Key rates Closingvalue Weekly Mthly Yearly
Inflation* -2.65 -2.65 -2.33 5.55
91 Days T-Bill 7.94 7.75 7.80 8.82
364 Days T- Bill 7.90 7.89 7.70 8.89
10 Year G-Sec Yield 7.86 7.76 7.74 8.83
MIBOR 7.52 7.70 0.00 8.70
6 Months LIBOR (USD) 0.41 0.41 0.40 0.32
Call Money Rate 7.70 7.72 11.21 8.77
Repo Rate^ 7.50 7.50 7.50 8.00
Reverse Repo^ 6.50 6.50 6.50 7.00
CRR 4.00 4.00 4.00 4.00
SLR 21.50 21.50 21.50 23.00
Bank Rate 8.50 8.50 8.50 9.00
*Wholesale Inflation rate for March, 2015^Repo rate and Reverse repo rate as on April 7, 2015
Consumer inflation-based index rose by 4.87% on a yearly basis in April, lower than 5.25% in the previous month as food prices turnedcheaper. Food inflation rose 5.11%, slower than a 6.14% rise in March. Fuel and light prices increased 5.6% in April against 5.07% in theprevious month.
On the global front, the People's Bank of China lowered both benchmark lending and deposit rates by 25 bps each to 5.1% and 2.25%,respectively. Earlier the Central Bank lowered the reserve requirement ratio for all banks by 100 basis points to 18.5%, with effect fromApril 20. Non-farm payroll employment in the USA increased by 223,000 jobs in April compared to 85,000 jobs generated in March. TheUSA. Federal Reserve kept its benchmark interest rate unchanged after economic growth in the first quarter of 2015 slowed down. TheBank of England left its interest rate unchanged and suggested that its key interest rate will be raised by the middle of 2016.
Bond / Debt market round up
Bond yields rose after the Reserve Bank of India left its key policy rates unchanged. Rise in international oil prices and weakness in therupee also hit the bond markets. Bond yields moved up further on concerns over rise in inflation, sub-normal monsoon and uncertaintyover the USA Federal Reserve’s stance on interest rate hike. Fall in the rupee and rise in global crude oil prices also hit the bondmarket. During the month, Brent crude oil prices rose nearly 20% and the rupee weakened around 1.5% against the dollar, whichincreased inflationary concerns. However, further losses were restricted after Moody's Investors Service raised India’s rating outlookfrom stable to positive.
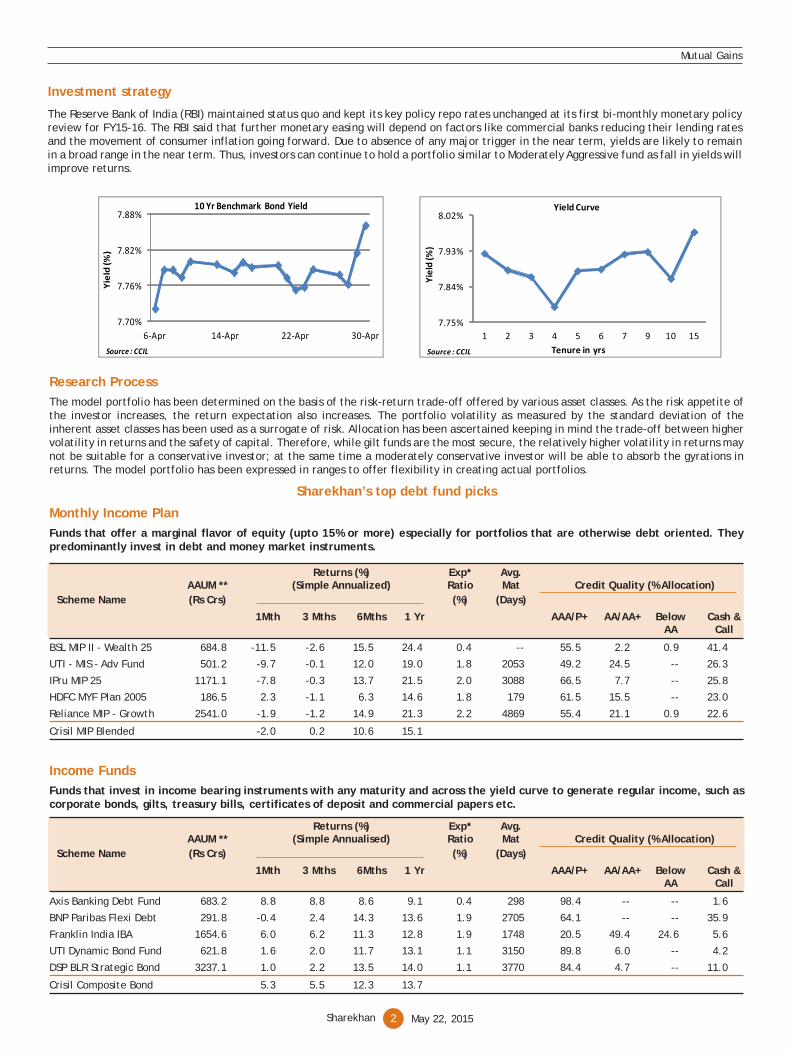
The yield on the 10-year benchmark bond rose by 12bps as it closed at 7.86% against the previous month’s close of 7.74%, after movingin the range of 7.72% to 7.86%.
Bond / Debt Outlook: Investors will track key consumer inflation numbers, which may provide some indication as to when the Central Bankmay further ease key policy rates. The movement of the rupee against the dollar, global crude oil prices, stance adopted by the ForeignPortfolio Investors and developments in the euro (especially Greece’s debt situation) and the USA region will also remain in focus. Stepstaken by the Government in bringing fiscal consolidation and implementing its budgetary proposals will be tracked closely. The CentralBank will conduct the auction of Government dated securities for an aggregate amount of Rs.64,000 crore. The Central Bank will conductthe auction of 91-days, 182-days and 364-days Government of India Treasury Bills for an aggregate amount of Rs.56,000 crore.
2Sharekhan May 22, 2015
Mutual Gains
Investment strategy
The Reserve Bank of India (RBI) maintained status quo and kept its key policy repo rates unchanged at its first bi-monthly monetary policyreview for FY15-16. The RBI said that further monetary easing will depend on factors like commercial banks reducing their lending ratesand the movement of consumer inflation going forward. Due to absence of any major trigger in the near term, yields are likely to remainin a broad range in the near term. Thus, investors can continue to hold a portfolio similar to Moderately Aggressive fund as fall in yields willimprove returns.
Income Funds
Funds that invest in income bearing instruments with any maturity and across the yield curve to generate regular income, such ascorporate bonds, gilts, treasury bills, certificates of deposit and commercial papers etc.
Returns (%) Exp* Avg.AAUM ** (Simple Annualised) Ratio Mat Credit Quality (% Allocation)
Scheme Name (Rs Crs) (%) (Days)
1Mth 3 Mths 6Mths 1 Yr AAA/P+ AA/AA+ Below Cash &AA Call
Axis Banking Debt Fund 683.2 8.8 8.8 8.6 9.1 0.4 298 98.4 -- -- 1.6
BNP Paribas Flexi Debt 291.8 -0.4 2.4 14.3 13.6 1.9 2705 64.1 -- -- 35.9
Franklin India IBA 1654.6 6.0 6.2 11.3 12.8 1.9 1748 20.5 49.4 24.6 5.6
UTI Dynamic Bond Fund 621.8 1.6 2.0 11.7 13.1 1.1 3150 89.8 6.0 -- 4.2
DSP BLR Strategic Bond 3237.1 1.0 2.2 13.5 14.0 1.1 3770 84.4 4.7 -- 11.0
Crisil Composite Bond 5.3 5.5 12.3 13.7
Research Process
The model portfolio has been determined on the basis of the risk-return trade-off offered by various asset classes. As the risk appetite ofthe investor increases, the return expectation also increases. The portfolio volatility as measured by the standard deviation of theinherent asset classes has been used as a surrogate of risk. Allocation has been ascertained keeping in mind the trade-off between highervolatility in returns and the safety of capital. Therefore, while gilt funds are the most secure, the relatively higher volatility in returns maynot be suitable for a conservative investor; at the same time a moderately conservative investor will be able to absorb the gyrations inreturns. The model portfolio has been expressed in ranges to offer flexibility in creating actual portfolios.
Sharekhan’s top debt fund picks
Monthly Income Plan
Funds that offer a marginal flavor of equity (upto 15% or more) especially for portfolios that are otherwise debt oriented. Theypredominantly invest in debt and money market instruments.
Returns (%) Exp* Avg.AAUM ** (Simple Annualized) Ratio Mat Credit Quality (% Allocation)
Scheme Name (Rs Crs) (%) (Days)
1Mth 3 Mths 6Mths 1 Yr AAA/P+ AA/AA+ Below Cash &AA Call
BSL MIP II - Wealth 25 684.8 -11.5 -2.6 15.5 24.4 0.4 -- 55.5 2.2 0.9 41.4
UTI - MIS - Adv Fund 501.2 -9.7 -0.1 12.0 19.0 1.8 2053 49.2 24.5 -- 26.3
IPru MIP 25 1171.1 -7.8 -0.3 13.7 21.5 2.0 3088 66.5 7.7 -- 25.8
HDFC MYF Plan 2005 186.5 2.3 -1.1 6.3 14.6 1.8 179 61.5 15.5 -- 23.0
Reliance MIP - Growth 2541.0 -1.9 -1.2 14.9 21.3 2.2 4869 55.4 21.1 0.9 22.6
Crisil MIP Blended -2.0 0.2 10.6 15.1
7.70%
7.76%
7.82%
7.88%
6‐Apr 14‐Apr 22‐Apr 30‐Apr
Yield (%)
10 Yr Benchmark Bond Yield
Source : CCIL
7.75%
7.84%
7.93%
8.02%
1 2 3 4 5 6 7 9 10 15
Yield (%
)
Tenure in yrs
Yield Curve
Source : CCIL
3Sharekhan May 22, 2015
Mutual Gains
Short Term Debt Funds
Funds invest in short-term debt instruments of high quality and low risk, that mature in about next 15 to 18 months and generallybest suited to investors with 1 to 2 years of investment horizon.
Returns (%) Exp* Avg.AAUM ** (Simple Annualised) Ratio Mat Credit Quality (% Allocation)
Scheme Name (Rs Crs) (%) (Days)
1Mth 3 Mths 6Mths 1 Yr AAA/P+ AA/AA+ Below Cash &AA Call
BSL Dynamic Bond Fund 11471.0 6.0 5.9 14.9 14.5 1.3 -- 74.3 23.0 -- 2.7BSL Treasury Optimizer 3616.7 7.3 6.8 10.8 11.9 0.6 -- 83.9 12.6 -- 3.5HDFC HIF - Dynamic 1816.6 0.3 0.5 14.2 15.4 1.5 5939 94.3 2.6 -- 3.1DSP BLR Income Opp- IP 1746.1 9.7 8.6 10.9 11.4 1.2 1314 39.1 19.2 38.3 3.4BSL ST Fund - DAP 6215.6 8.6 7.6 9.8 10.6 0.3 -- 78.0 14.1 -- 7.9
Crisil ST Debt Index 8.8 8.1 9.6 10.2
Ultra Short Term Funds
Funds that invest exclusively in debt instruments with very short maturity period, usually one year or less.
Returns (%) Exp* Avg.AAUM ** (Simple Annualised) Ratio Mat Credit Quality (% Allocation)
Scheme Name (Rs Crs) (%) (Days)
1Mth 3 Mths 6Mths 1 Yr AAA/P+ AA/AA+ Below Cash &AA Call
Religare Invesco Cr. Opp 2188.2 9.4 9.2 9.1 9.3 0.7 32 97.2 0.7 -- 2.2IDFC MM Invest Plan 1075.1 9.8 9.3 8.8 9.2 0.5 1037 78.0 17.9 -- 4.1IDFC MM Treasury Plan 1297.8 8.5 7.9 7.9 8.4 0.9 183 61.3 36.4 -- 2.3BSL Savings Fund 11002.7 9.8 8.9 9.0 9.5 0.4 -- 64.6 21.9 -- 13.6UTI FRF- STP - Growth 2938.6 9.1 8.6 8.6 8.8 0.7 730 62.3 17.5 2.6 17.6
Crisil Liquid Fund Index 8.8 8.5 8.5 8.9
Floating Rate Funds
Funds that predominantly invests in debt securities with a floating rate of interest. And these debt securities peg their coupon orinterest rate payable to market driven rate such as Mibor.
Returns (%) Exp* Avg.AAUM ** (Simple Annualised) Ratio Mat Credit Quality (% Allocation)
Scheme Name (Rs Crs) (%) (Days)
1Mth 3 Mths 6Mths 1 Yr AAA/P+ AA/AA+ Below Cash &AA Call
SBI Savings Fund 826.1 9.1 8.0 8.3 8.7 1.3 245 90.8 7.5 -- 1.7IPru Corporate Bond Fund 3312.7 7.2 6.4 10.5 11.8 1.2 1369 27.4 61.9 -- 10.8Franklin India Savings Plus 375.7 8.0 7.7 8.4 8.9 0.9 412 98.5 -- -- 1.5Can Robeco Savings Plus 203.6 9.0 8.1 8.4 8.9 0.6 299 83.3 13.0 -- 3.7HDFC F R I F - LTF 1603.2 6.5 7.2 8.0 8.9 0.2 1102 89.6 -- -- 10.4
Crisil Liquid Fund Index 8.8 8.5 8.5 8.9
Liquid Fund
Funds investing only in short-term money market and debt instruments that mature in up to 91 days such as treasury bills, commercialpaper and certificates of deposit.
Returns (%) Exp* Avg.AAUM ** (Simple Annualised) Ratio Mat Credit Quality (% Allocation)
Scheme Name (Rs Crs) (%) (Days)
1Mth 3 Mths 6Mths 1 Yr AAA/P+ AA/AA+ Below Cash &AA Call
IPru Money Market Fund 5828.7 8.8 8.7 8.7 8.9 0.2 45 101.1 -- -- -1.1
SBI Magnum Insta Cash 1352.2 8.8 8.7 8.6 8.9 0.1 33 94.6 -- -- 5.4
HDFC Liquid Fund 19153.7 9.0 8.7 8.7 9.0 0.1 35 98.0 -- -- 2.0
SBI Premier Liquid Fund 21985.6 8.8 8.6 8.6 8.9 0.1 37 86.6 -- -- 13.4
JM High Liquidity 5166.2 9.1 8.8 8.8 9.0 0.3 42 77.6 -- -- 22.4
Crisil Liquid Fund Index 8.8 8.5 8.5 8.9
4Sharekhan May 22, 2015
Mutual Gains
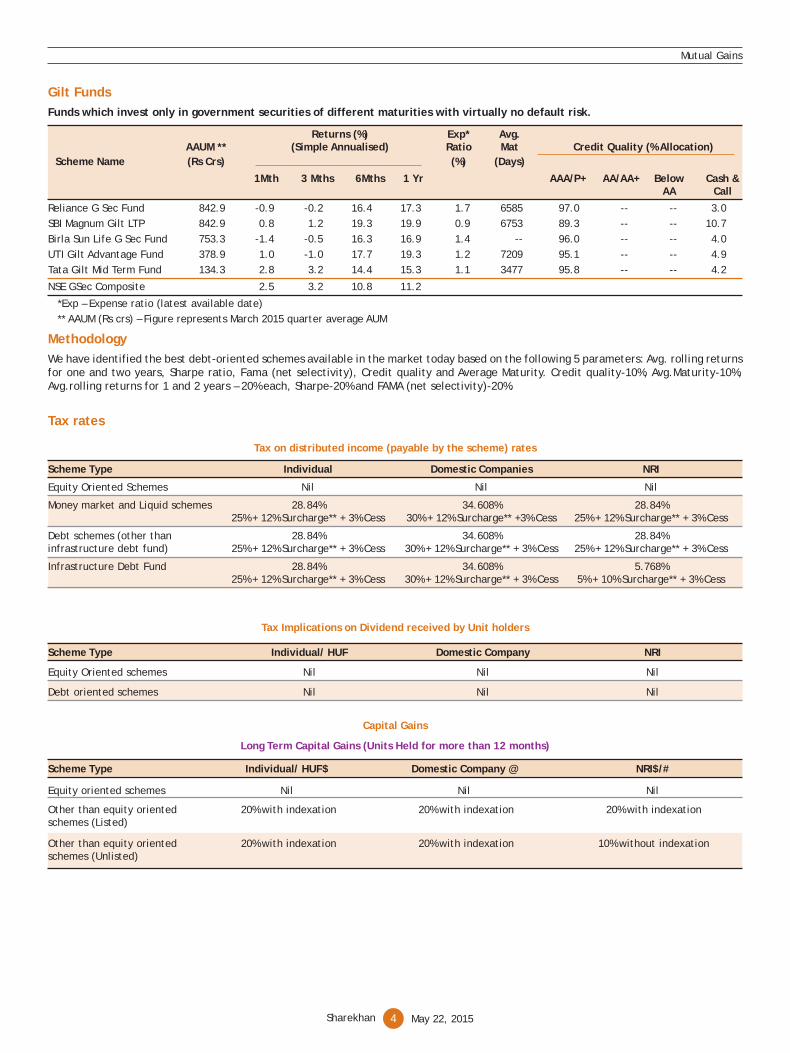
Gilt Funds
Funds which invest only in government securities of different maturities with virtually no default risk.
Returns (%) Exp* Avg.AAUM ** (Simple Annualised) Ratio Mat Credit Quality (% Allocation)
Scheme Name (Rs Crs) (%) (Days)
1Mth 3 Mths 6Mths 1 Yr AAA/P+ AA/AA+ Below Cash &AA Call
Reliance G Sec Fund 842.9 -0.9 -0.2 16.4 17.3 1.7 6585 97.0 -- -- 3.0SBI Magnum Gilt LTP 842.9 0.8 1.2 19.3 19.9 0.9 6753 89.3 -- -- 10.7Birla Sun Life G Sec Fund 753.3 -1.4 -0.5 16.3 16.9 1.4 -- 96.0 -- -- 4.0UTI Gilt Advantage Fund 378.9 1.0 -1.0 17.7 19.3 1.2 7209 95.1 -- -- 4.9Tata Gilt Mid Term Fund 134.3 2.8 3.2 14.4 15.3 1.1 3477 95.8 -- -- 4.2
NSE GSec Composite 2.5 3.2 10.8 11.2
*Exp – Expense ratio (latest available date) ** AAUM (Rs crs) – Figure represents March 2015 quarter average AUM
Methodology
We have identified the best debt-oriented schemes available in the market today based on the following 5 parameters: Avg. rolling returnsfor one and two years, Sharpe ratio, Fama (net selectivity), Credit quality and Average Maturity. Credit quality-10%, Avg.Maturity-10%,Avg.rolling returns for 1 and 2 years – 20% each, Sharpe-20% and FAMA (net selectivity)-20%.
Tax rates
Tax on distributed income (payable by the scheme) rates
Scheme Type Individual Domestic Companies NRI
Equity Oriented Schemes Nil Nil Nil
Money market and Liquid schemes 28.84% 34.608% 28.84%25% + 12% Surcharge** + 3% Cess 30% + 12% Surcharge** +3% Cess 25% + 12% Surcharge** + 3% Cess
Debt schemes (other than 28.84% 34.608% 28.84%infrastructure debt fund) 25% + 12% Surcharge** + 3% Cess 30% + 12% Surcharge** + 3% Cess 25% + 12% Surcharge** + 3% Cess
Infrastructure Debt Fund 28.84% 34.608% 5.768%25% + 12% Surcharge** + 3% Cess 30% + 12% Surcharge** + 3% Cess 5% + 10% Surcharge** + 3% Cess
Tax Implications on Dividend received by Unit holders
Scheme Type Individual/ HUF Domestic Company NRI
Equity Oriented schemes Nil Nil Nil
Debt oriented schemes Nil Nil Nil
Capital Gains
Long Term Capital Gains (Units Held for more than 12 months)
Scheme Type Individual/ HUF$ Domestic Company @ NRI$/#
Equity oriented schemes Nil Nil Nil
Other than equity orientedschemes (Listed)
20% with indexation 20% with indexation20% with indexation
Other than equity orientedschemes (Unlisted)
20% with indexation 10% without indexation20% with indexation
5Sharekhan May 22, 2015
Mutual Gains
Tax Deduced at Source (Applicable only to NRI Investors)
Scheme Type Short term capital gains Long term capital gains
Equity oriented schemes 15% Nil
Other than equity oriented schemes (Listed) 30% 20%##
Other than equity oriented schemes (Unlisted) 30% 10%
* Securities transaction tax (STT) will be deducted on equity funds at the time of redemption/ switch to the other schemes/ sale of units.
** Effective from June 1, 2013.
$ - Surcharge at the rate of 10% is proposed to be levied in case of individual/ HUF unit holders where their income exceeds Rs 1 crore.
@ - Surcharge at the rate of @ 5% is proposed to be levied for domestic corporate unit holders where the income exceeds Rs 1 crore but less than Rs. 10 crore and at the rate of10% where income exceeds Rs. 10 crore.
# - Short term/ long term capital gain tax will be deducted at the time of redemption of units in case of NRI investors only.
## - After providing for indexation ^ Assuming the investor falls into highest tax bracket.
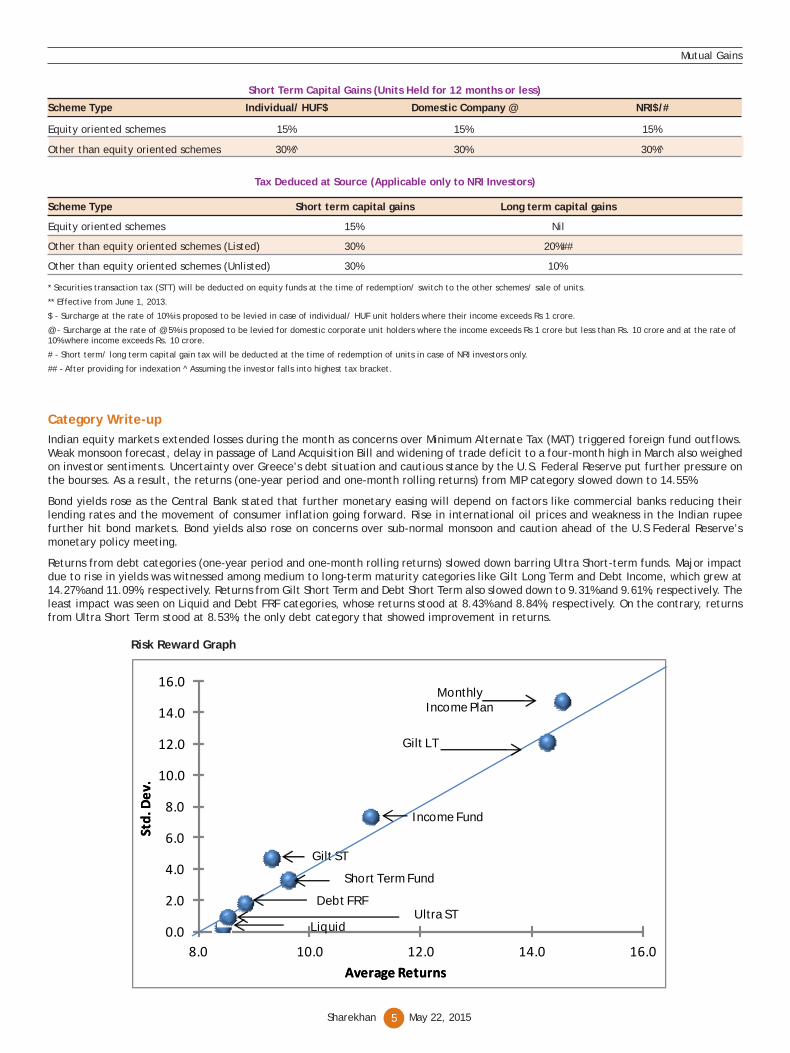
Category Write-up
Indian equity markets extended losses during the month as concerns over Minimum Alternate Tax (MAT) triggered foreign fund outflows.Weak monsoon forecast, delay in passage of Land Acquisition Bill and widening of trade deficit to a four-month high in March also weighedon investor sentiments. Uncertainty over Greece’s debt situation and cautious stance by the U.S. Federal Reserve put further pressure onthe bourses. As a result, the returns (one-year period and one-month rolling returns) from MIP category slowed down to 14.55%.
Bond yields rose as the Central Bank stated that further monetary easing will depend on factors like commercial banks reducing theirlending rates and the movement of consumer inflation going forward. Rise in international oil prices and weakness in the Indian rupeefurther hit bond markets. Bond yields also rose on concerns over sub-normal monsoon and caution ahead of the U.S Federal Reserve’smonetary policy meeting.
Returns from debt categories (one-year period and one-month rolling returns) slowed down barring Ultra Short-term funds. Major impactdue to rise in yields was witnessed among medium to long-term maturity categories like Gilt Long Term and Debt Income, which grew at14.27% and 11.09%, respectively. Returns from Gilt Short Term and Debt Short Term also slowed down to 9.31% and 9.61%, respectively. Theleast impact was seen on Liquid and Debt FRF categories, whose returns stood at 8.43% and 8.84%, respectively. On the contrary, returnsfrom Ultra Short Term stood at 8.53%, the only debt category that showed improvement in returns.
Short Term Capital Gains (Units Held for 12 months or less)
Scheme Type Individual/ HUF$ Domestic Company @ NRI$/#
Equity oriented schemes 15% 15% 15%
Other than equity oriented schemes 30%^ 30% 30%^
Risk Reward Graph
0.0
2.0
4.0
6.0
8.0
10.0
12.0
14.0
16.0
8.0 10.0 12.0 14.0 16.0
Average Returns
Std. D
ev.
Average Returns
Std. D
ev.
Liquid
Short Term Fund
Monthly Income Plan
Income Fund
Gilt ST
Gilt LT
Debt FRFUltra ST
6Sharekhan May 22, 2015
Methodology
The bubble diagram gives you a snapshot of how the mutual funds have performed on the risk – return parameter in the past. We have usedbubble analysis method to measure their performance on two parameters i.e. Average rolling returns and Standard deviation. For allfunds, we have considered one month rolling and periodic frequency for the period of one year, as on April 30, 2015.
Forthcoming NFOs
Fund House Scheme Name Open Date Close Date Structure Nature
ICICI Mutual Fund ICICI Prudential Fixed Maturity Plan - 18-May-15 21-May-15 Close Ended Fixed Maturity PlanSeries 77 - 1127 Days Plan E
UTI Mutual Fund UTI – Fixed Term Income Fund Series – 06-May-15 20-May-15 Close Ended Fixed Maturity PlanXXII – III (1099 days)
Reliance Mutual Fund Reliance Fixed Horizon Fund - 07-May-15 21-May-15 Close Ended Fixed Maturity Plan XXVIII - Series 18 (Tenure - 1115 Days)
Reliance Mutual Fund Reliance Fixed Horizon Fund - 07-May-15 21-May-15 Close Ended Fixed Maturity PlanXXVIII - Series 19 (Tenure - 1124 Days)
Reliance Mutual Fund Reliance Fixed Horizon Fund - XXVIII 07-May-15 21-May-15 Close Ended Fixed Maturity Plan- Series 19 (1124 D) - Direct Plan (G)
Reliance Mutual Fund Reliance Fixed Horizon Fund - 07-May-15 21-May-15 Close Ended Fixed Maturity PlanXXVIII - Series 18 (1115 D) (G)
Mutual Gains
DisclaimerNothing in this report constitutes investment advice or tax advice in any form and these products may or may not be suitable for you. Investors should make independent judgment taking into account specific investment objectives,financial situations and needs before taking any investment decision. Mutual fund investments are subject to market risk. Please read the offer document carefully before investing. Past performance may or may not be sustained in thefuture.
This document has been prepared by Sharekhan Ltd. (SHAREKHAN) and is intended for use only by the person or entity to which it is addressed to. This document may contain confidential and/or privileged material and is not for any typeof circulation and any review, retransmission, or any other use is strictly prohibited. This document is subject to changes without prior notice. This document does not constitute an offer to sell or solicitation for the purchase or sale ofany financial instrument or as an official confirmation of any transaction. Though disseminated to all customers who are due to receive the same, not all customers may receive this report at the same time. SHAREKHAN will not treatrecipients as customers by virtue of their receiving this report.
The information contained herein is obtained from publicly available data or other sources believed to be reliable and SHAREKHAN has not independently verified the accuracy and completeness of the said data and hence it should notbe relied upon as such. While we would endeavour to update the information herein on a reasonable basis, SHAREKHAN, its subsidiaries and associated companies, their directors and employees (“SHAREKHAN and affiliates”) are underno obligation to update or keep the information current. Also, there may be regulatory, compliance, or other reasons that may prevent SHAREKHAN and affiliates from doing so. Sharekhan provides non-advisory/order execution servicesfor Mutual Funds. This document is prepared for assistance only and is not intended to be and must not alone be taken as the basis for an investment decision. Mutual fund investments are subject to market risk. Please read the offerdocument carefully before investing. Also, Recipients of this report should also be aware that past performance is not necessarily a guide to future performance and value of investments can go down as well. The user assumes the entirerisk of any use made of this information. Each recipient of this document should make such investigations as he deems necessary to arrive at an independent evaluation of an investment in the securities of companies referred to in thisdocument (including the merits and risks involved), and should consult his own advisors to determine the merits and risks of such an investment. The investment discussed or views expressed may not be suitable for all investors. We donot undertake to advise you as to any change of our views. Affiliates of SHAREKHAN may have issued other reports that are inconsistent with and reach different conclusion from the information presented in this report.
This report is not directed or intended for distribution to, or use by, any person or entity who is a citizen or resident of or located in any locality, state, country or other jurisdiction, where such distribution, publication, availability oruse would be contrary to law, regulation or which would subject SHAREKHAN and affiliates to any registration or licencing requirement within such jurisdiction. The securities described herein may or may not be eligible for sale in alljurisdictions or to certain category of investors. Persons in whose possession this document may come are required to inform themselves of and to observe such restriction. Either SHAREKHAN or its affiliates or its directors or employees/representatives/clients or their relatives may have position(s), make market, act as principal or engage in transactions of purchase or sell of securities, from time to time or may be materially interested in any of the securities or relatedsecurities referred to in this report and they may have used the information set forth herein before publication. SHAREKHAN may from time to time solicit from, or perform investment banking, or other services for, any companymentioned herein. Without limiting any of the foregoing, in no event shall SHAREKHAN, any of its affiliates or any third party involved in, or related to, computing or compiling the information have any liability for any damages of anykind. The analyst certifies that all of the views expressed in this document accurately reflect his or her personal views about the subject company or companies and its or their securities and do not necessarily reflect those of SHAREKHAN.Further, no part of the analyst’s compensation was, is or will be, directly or indirectly related to specific recommendations or views expressed in this document.”
Compliance Officer: Ms. Namita Amod Godbole; Tel: 022-6115000; e-mail: [email protected] • Contact: [email protected]