Embed Size (px)
Citation preview

SHAREHOLDERS’ GUIDE 2007
Digital Garage, Inc. (Period: For the year ended June 30, 2007)
(Last Updated: December 17, 2007)

- 1 -
TABLE OF CONTENTS
Page No. Contents Last Updated To be Updated
2 Profile December 17, 2007 - 3 Financial Highlights December 17, 2007 - 4 Management’s Discussion and Analysis of December 17, 2007 - Financial Condition and Results of Operations 9 Financial Summary December 17, 2007 - 11 Consolidated Balance Sheets December 17, 2007 - 13 Consolidated Statements of Income December 17, 2007 - 15 Consolidated Statements of Changes in Net Assets December 17, 2007 - 17 Consolidated Statements of Cash Flows December 17, 2007 - 19 Segment Information December 17, 2007 - 21 Quarterly Information December 17, 2007 - 23 Significant Accounting Policies December 17, 2007 - 26 Stock Information December 17, 2007 - 27 Corporate History December 17, 2007 - 29 Corporate Information December 17, 2007 -
Disclaimer: Please note that the consolidated financial statements presented in English are a translated summary of audited consolidated financial statements presented in Japanese. The translation of the consolidated financial statements and the related information have NOT been audited by Ernst & Young ShinNihon, the Company’s accounting auditor. The Company provides this translation for reference and convenience purposes only, without any warranty as to its accuracy or otherwise. In the event of any discrepancy between the translation and the Japanese original, the latter shall prevail. In no event shall the Company be liable for damages of any nature, including but not limited to, direct, indirect, special, punitive, consequential or incidental damages arising from or in connection with this translation. The final decision and responsibility for investments rests solely with the reader of this document. Forward-Looking Statements: Statements made in this shareholders’ guide with respect to the Company’s current plans, estimates, strategies and beliefs and other statements that are not historical facts are forward-looking statements about the future performance of the Company. Forward-looking statements include, but are not limited to, those statements using such words as “believe,” “expect,” “plans,” “strategy,” “prospects,” “forecast,” “estimate,” “project,” “anticipate,” “aim,” “may” or “might” and words of similar meaning in connection with a discussion of future operations, financial performance, events or conditions. From time to time, oral or written forward-looking statements may also be included in other materials released to the public. These statements are based on management’s assumptions and beliefs in light of the information currently available to it. The Company cautions you that a number of important risks and uncertainties could cause actual results to differ materially from those discussed in the forward-looking statements, and therefore the reader should not place undue reliance on them. The reader also should not oblige the Company to update or revise any forward-looking statements, whether as a result of new information, future events or otherwise. The Company disclaims any such obligation. Risks and uncertainties that might affect the Company include, but are not limited to, (1) system risk, (2) security risk of customer information, (3) investment in incubation business, (4) possibility of legal regulation, (5) intellectual property right, (6) potential lawsuit, (7) competition, (8) reliance on someone specific, (9) group structures and (10) liquidation and retention of human resources. Risks and uncertainties also include the impact of any future events with materially adverse impacts.

- 2 -
PROFILE
The Digital Garage Group consists of Digital Garage, Inc., and its 19 consolidated subsidiaries. The Group’s major businesses include:
(1) “Solutions Business” to provide IT solutions and marketing solutions, etc., focusing on ROI, with fusing real fields with digital fields, (2) “Portal & Blog Business” to operate portal sites on the Internet and provide platform contents for mobile terminals, (3) “Finance Business” to conduct settlement/logistic services for e-commerce, and foreign-exchange margin trading services, and (4) “Incubation Business” to invest into and foster venture companies as well as provide incubation functions to each company in the Group.
The principal consolidated subsidiaries, business segments and business content are as follows:
Business Segment Company Name
Relation to Our
Company Principal Business Content
DG Solutions Co., Ltd. Consolidated subsidiary
Interim holding company of Solutions Business segment
DG & Ibex, Inc. Consolidated subsidiary
Marketing/Promotion support service, IT system design and development
Creative Garage, Inc. Consolidated subsidiary
Design and planning of advertising graphics, images and Web, etc., and Creative content development for publication, etc.
DG Media Marketing Inc. Consolidated subsidiary
Planning/Development/Distribution of Web advertising and group media consulting service
Solutions Business
Sogei Co., Ltd. Consolidated subsidiary Leading real estate advertising agency
Kakaku.com, Inc. Consolidated subsidiary
Planning and operation of price comparison site “Kakaku.com,” etc.
4travel, Inc. Consolidated subsidiary
Planning and operation of travel community site “4travel,” etc.
Technorati Japan, Inc. Consolidated subsidiary Planning and operation of blog search site
WEB2.0, Inc. Consolidated subsidiary
Planning and operation of information-sharing site “PingKing”
DG Mobile, Inc. Consolidated subsidiary
Planning and operation of mobile contents and delivery service, etc.
Portal & Blog Business
CGM Marketing, Inc. Consolidated subsidiary
Developing advertising products with CGM, Matching service for bloggers and advertisers
ECONTEXT, INC. Consolidated subsidiary
Settlement and logistics platform for e-commerce sites, etc.
Growth Partners, Inc. Consolidated subsidiary
Operation of IR support service business and IR portal site “STOCKCAFE”
Kakaku.com Insurance, Inc. Consolidated subsidiary
Insurance agency, operations related to life insurance subscription, etc.
Finance Business
Kakaku.com Financial, Inc. Consolidated subsidiary
Foreign-exchange margin trading services, etc.
DG Incubation, Inc. Consolidated subsidiary
Incubation business, investment and development of new businesses
DG & Partners, Inc. Consolidated subsidiary
Management and operation of venture capital fund property
Incubation Business
DG New Context Fund Consolidated subsidiary
Purchase and hold of shares or stock acquisition rights

- 3 -
FINANCIAL HIGHLIGHTS (As of and for the years ended June 30, 2006 and 2007)
2006 2007 2007 / 2006 2007(percentage
change)(thousands ofU.S. dollars)
¥12,476,240 ¥17,338,744 39.0% $140,6571,703,998 1,613,152 -5.3% 13,0861,505,034 2,475,808 64.5% 20,084
1,451,863 2,606,337 79.5% 21,143338,501 588,633 73.9% 4,775
¥4,294.73 ¥3,724.33 -13.3% $30.213,971.69 3,666.18 -7.7% 29.74
4.9% 8.1% 5.8% 7.1%
13.7% 9.3%
¥27,774,372 ¥42,407,669 52.7% $344,02310,668,036 11,743,684 10.1% 95,268
26.1% 17.2%¥91,745.46 ¥46,090.88 -49.8% $373.90
¥1,898,215 ¥779,065 $6,320(3,305,766) 3,355,538 27,2212,806,777 (203,196) (1,648)7,471,888 11,509,880 93,371
First Second Third FourthQuarter Quarter Quarter Quarter
2006 - - - - ¥0.002007 - - - - 0.002008 (Forecast) - - - - 0.00
DividendTotal Payout on Net
Dividends Ratio Assets Ratio(Annual) (Consolidated) (Consolidated)
(millions of yen) (%) (%)2006 - - -2007 - - -2008 (Forecast) - - -
Interim Annual
¥19,000 ¥43,000 40 3,000
(100) 2,700 (400) 700 (¥2,527.29) ¥4,422.77
Total assetsNet assets
2. Return on equity (ROE) = Net income / Average shareholders' equity3. Return on assets (ROA) = Ordinary income / Average total assets
2008
(millions of yen)
Cash and cash equivalents at year-end
Year
Net sales
Dividends per Share
4. Forecasts stated above disclosed on August 28, 2007 in the Consolidated Kessan Tanshin.
Operating incomeOrdinary income (loss)Net income (loss)Net income (loss), basic per share (yen)
1. U.S. dollar amounts are translated from Japanese yen, for readers' convenience only, at the exchange rate of 123.27 yen per U.S. dollar, the approximate exchange rate of TTM of Mizuho Bank, Ltd., on June 29, 2007.
Notes:
(yen)
Shareholders' equity ratioNet assets per share (yen, U.S. dollars)
3. Consolidated Results Forecast for Year Ending June 30, 2008
2. Dividends
(3) Consolidated cash flows:Cash flows from operating activitiesCash flows from investing activitiesCash flows from financing activities
Operating income to net salesReturn on assets (ROA)
1. Consolidated Performance
(1) Consolidated financial results:Net salesOperating income
Net income
(2) Consolidated financial position:
Ordinary incomeIncome before income taxes and minorityinterests
(thousands of yen)
Net income, basic per share (yen, U.S. dollars)Net income, diluted per share (yen, U.S. dollars)Return on equity (ROE)

- 4 -
MANAGEMENT’S DISCUSSION AND ANALYSIS OF FINANCIAL CONDITION AND RESULTS OF OPERATIONS
1. Summary of Performance
(1) Performance The Japanese economy over the course of the current consolidated fiscal year was generally on a course
of gradual recovery, thanks to private capital investment remaining at a high level sustained by improved corporate profits, as well as steady personal consumption due to an improved employment market. Furthermore, the Internet and broadband environment in which the Company focuses its activities showed positive expansion trends: the number of contracts for broadband service exceeded 26 million as of the end of March 2007, and has continued to expand.
Under such conditions, the Company has continued to form and implement business objectives from the position of the Group as a pure holding company, and to enhance organic cooperation among the Group’s companies. The Company in order to strengthen and leverage its core competence in Internet-related business created the following joint ventures. CGM Marketing Inc. (a consolidated subsidiary), with the mission to develop new marketing techniques and strategies using CGM (Consumer Generated Media), was co-founded with DENTSU INC., cyber communications inc., and ASATSU-DK INC., in August 2006. In the same month, Growth Partners Inc., a company supporting IR activities using Web2.0 technologies was established jointly with Asia Securities Printing Co., Ltd. (present PRONEXUS INC.). Furthermore in order to develop a wide range of businesses, in April 2007 the Company acquired 100% of the shares of Sogei Co., Ltd., a general advertising agency with a long track record in the field of real estate advertisement.
Solutions Business
In the Solutions Business, one-stop solutions in the digital field and the real field were actualized with corporate separation to make DG Solutions Co., Ltd. (a consolidated subsidiary), an interim holding company in August 2006 to functionally reconstruct resources within the Group. Consequently, DG & Ibex, Inc. (former Ibex & rims Corporation), took over the business and performed well, and DG Media Marketing Inc., established in the previous consolidated fiscal year, is growing steadily.
As a result, in comparison with the previous year, sales increased by 56.1% (¥2,788 million), to ¥7,761 million, and operating income surged by 246.8% (¥306 million), to ¥430 million.
Portal & Blog Business
In the Portal & Blog Business, sales and operating income expanded significantly, thanks to a full-year contribution from the introduction of the pay-as-you-go system to shops from March 2006 in Kakaku.com, Inc. (a consolidated subsidiary), improvement in ability to attract customers and diversification of profits with new releases and renewal of contents. Since sales of DG Mobile, Inc., which provides contents delivery service, etc., for mobile terminals, grew steadily, a full-year surplus was achieved.
As a result, in comparison with the previous year, sales increased by 68.0% (¥1,961 million), to ¥4,847 million, and operating income surged by 216.6% (¥621 million), to ¥907 million.
Finance Business
In the Finance Business, the Company emphasized on expansion in sales of settlement/logistics services provided by ECONTEXT, INC. (a consolidated subsidiary), with new partnerships with leading music and software delivery companies, and enhanced those services with the introduction of “Edy settlement,” pre-paid electronic money. In Kakaku.com Insurance, Inc., the insurance agency that became our consolidated subsidiary from the current consolidated fiscal year, the number of customers and sales amount are steadily increasing.
As a result, in comparison with the previous year, sales increased by 25.4% (¥550 million), to ¥2,718 million, and operating income decreased by 16.9% (¥102 million), to ¥503 million, absorbing the impact of initial expenses for newly established subsidiaries.

- 5 -
Incubation Business In the Incubation Business, ALC PRESS INC., which the Company invested in and fostered in previous
years, was listed on the JASDAQ market in August 2006, and CELSYS, Inc., which the Company also invested in was listed on the Centrex market of the Nagoya Stock Exchange in December 2006. Profits were ensured not only from the going public of invested companies but also sales of a part of shares of unlisted companies as a result of incubation.
As a result, in comparison with the previous year, sales decreased by 17.8% (¥437 million), to ¥2,012 million, and operating income decreased by 74.1% (¥814 million), to ¥284 million, with conservatively posting appraisal losses of a part of shares.
Finally, the Group’s consolidated sales increased by 39.0% (¥4,862 million), to ¥17,338 million, while
operating income decreased by 5.3% (¥90 million), to ¥1,613 million, with posting the above-mentioned share appraisal losses. Ordinary income increased by 64.5% (¥970 million), to ¥2,475 million, including dividends from contracts for investment in anonymous associations. Net income in which corporate tax and minority stockholder income was deducted increased by 73.9% (¥250 million), to ¥588 million.
2. Analysis of Financial Position and Business Results
(1) Analysis of Financial Position (Current Assets)
The balance of current assets at the end of the current consolidated fiscal year increased by ¥14,395 million, to ¥31,918 million, over the previous year. This is mainly because of receiving refund money and dividends from investment to anonymous associations aiming at integrating office buildings of major Group companies, as well as an increase in cash and deposits of ¥5,923 million due to making Sogei Co., Ltd., a consolidated subsidiary. Furthermore, also with making Sogei Co., Ltd., a consolidated subsidiary, notes receivable and account receivable increased by ¥6,884 million, inventory assets by ¥900 million and outstanding collections regarding settlement business of ECONTEXT INC., by ¥557 million.
(Fixed Assets)
The balance of fixed assets at the end of the current consolidated fiscal year increased by ¥238 million, to ¥10,489 million, over the previous year.
The major factors of this are as follows: While investment securities decreased by ¥2,632 million due to refund money from investment to
anonymous associations aiming at integrating office buildings of major Group companies, goodwill (consolidated adjustment accounts and business rights at the end of the current consolidated fiscal year) increased by ¥1,329 million, long-term deposits by ¥600 million and deposit guarantee by ¥795 million. Furthermore, software increased by ¥89 million due to new acquisition, etc.
(Current Liabilities)
The balance of current liabilities at the end of the current consolidated fiscal year increased by ¥12,599 million to ¥26,384 million over the previous year.
The major factors of this are as follows: Notes and accounts payable increased by ¥9,401 million, and corporate bonds to be redeemed within
one year by ¥888 million, due in part to making Sogei Co., Ltd., a consolidated subsidiary. Moreover, guarantee deposits received regarding securities loaned to financial institutions, which is indicated in short-term borrowings from the current consolidated fiscal year, decreased by ¥851 million.
(Long-Term Liabilities)
The balance of fixed liabilities at the end of the current consolidated fiscal year increased by ¥958 million, to ¥4,279 million, over the previous year. This is mainly because corporate bonds increased by ¥396 million and allowance for retirement benefits by ¥550 million, due in part to making Sogei Co., Ltd., a consolidated subsidiary.

- 6 -
(Net Assets) The balance of net assets at the end of the current consolidated fiscal year increased by ¥1,075 million,
to ¥11,743 million, over the previous year. The major factors of this are as follows: Retained earnings increased by ¥579 million due to posting current net income, and minority
shareholders’ interest increased by ¥1,025 million along with an increase in net assets with posting profits of consolidated subsidiaries. Meanwhile, valuation differences of other marketable securities decreased by ¥364 million in accordance with current prices of listed securities.
(2) Analysis of Business Results
(Net Sales) Net sales in the current consolidated fiscal year surged by ¥4,862 million, to ¥17,338 million, from
¥12,476 million in the previous year. The major factors of this are as follows: Sales of the Portal & Blog Business increased by ¥1,961 million, to ¥4,847 million, over the previous
year, thanks to a full-year contribution from the introduction of the pay-as-you-go system to stores from March 2006, improvement in ability to attract customers and diversification of profits with new releases and renewal of contents in Kakaku.com, Inc. (a consolidated subsidiary). Sales of the Solutions Business also increased by ¥2,788 million, to ¥7,761 million, over the previous year, as DG & Ibex, Inc. (former Ibex & rims Corporation), performed well, and DG Media Marketing Inc., established in the previous consolidated fiscal year, is growing steadily. Furthermore, sales of the Finance Business generally increased by ¥550 million, to ¥2,718 million, due to the favorable growth in ECONTEXT, INC.
(Operating Income)
Operating income in the current consolidated fiscal year slightly decreased by ¥90 million, to ¥1,613 million, from ¥1,703 million in the previous year. This is mainly because operating income in the Incubation Business decreased by ¥814 million, to ¥284 million, over the previous year, due to a conservatively posted valuation loss on certain stocks, and ones in the Finance Business fell by ¥102 million, to ¥503 million, over the previous year with burdens of initial expenses for a newly established subsidiary. Meanwhile, as the Solutions Business and the Portal & Blog Business performed well as mentioned above, significant increases in their operating income, respectively, to ¥430 million (year-on-year increase of ¥306 million) and to ¥907 million (year-on-year increase of ¥621 million) offset the above-mentioned decline.
(Ordinary Income)
In the current consolidated fiscal year, ordinary income increased by ¥970 million, to ¥2,475 million, from ¥1,505 million in the previous year. This is mainly because dividends of ¥999 million regarding investment in anonymous associations aiming at integrating office buildings of major Group companies were recorded.
(Net Income)
Net income in the current consolidated fiscal year increased by ¥250 million, to ¥588 million, from ¥338 million in the previous year.
The major factors of this are as follows: In addition to increases in ordinary income and others, gains on sale of shares of an affiliated company
of ¥122 million and gains on change of equity of ¥113 million were posted as extraordinary gains along with sale of shares of 4travel, Inc. (a consolidated subsidiary), and allocation of new shares to a third party. However, deferred income tax assets regarding amount of loss carried forward were not recorded. Consequently, the actual corporate tax burden ratio became higher, and the amount of income-taxes deferred increased by ¥546 million, to ¥256 million, over the previous year.

- 7 -
(3) Analysis of Cash Flows Cash and cash equivalents in the current consolidated fiscal year increased by ¥4,037 million (54.0%),
to ¥11,509 million, over the previous year.
(Cash Flows from Operating Activities) Cash flows from operating activities in the current consolidated fiscal year decreased by ¥1,119 million,
to ¥779 million, over the previous year. This is mainly because corporate tax of ¥1,223 million was paid, and funds decreased by ¥1,983 million along with an increase in trade receivable. Meanwhile, net income before taxes and other adjustment was ¥2,606 million, and funds increased by ¥1,574 million due to increased deposits regarding the settlement business of ECONTEXT, INC. (a consolidated subsidiary).
(Cash Flows from Investing Activities)
Cash flows from investing activities in the current consolidated fiscal year increased by ¥6,661 million, to ¥3,355 million, over the previous year. This is because of refunds of ¥3,000 million and dividends of ¥994 million from the investment to the anonymous association aiming at integrating office buildings of major Group companies, despite expenses to acquire investment securities of business partners, etc., of ¥468 million.
(Cash Flows from Financing Activities)
Cash flows from financing activities in the current consolidated fiscal year decreased by ¥3,009 million, to negative ¥203 million, over the previous year. This is because of the net amount of repayment of short-term borrowings of ¥331 million, the one of long-term borrowing of ¥411 million and redemption of corporate bonds of ¥100 million, despite income from payment by minority shareholders of ¥672 million.

- 8 -
[THIS PAGE INTENTIONALLY LEFT BLANK]

- 9 -
FINANCIAL SUMMARY (As of and for the years ended June 30, 2003, 2004, 2005, 2006 and 2007)
2003 2004 2005 2006 2007
Consolidated financial indicators:Net sales ¥3,520,266 ¥6,217,588 ¥7,846,467 ¥12,476,240 ¥17,338,744Ordinary income (loss) (202,576) (210,374) 108,532 1,505,034 2,475,808Income (loss) before income taxes andminority interests (125,267) 929,347 1,426,794 1,451,863 2,606,337Net income (loss) (217,423) 380,636 633,235 338,501 588,633Net assets 2,350,230 2,633,026 6,683,788 10,668,036 11,743,684Total assets 6,747,540 14,742,000 24,259,792 27,774,372 42,407,669Net assets per share (yen) ¥176,914.84 ¥36,985.75 ¥85,031.47 ¥91,745.46 ¥46,090.88Net income (loss), basic per share (yen) (17,168.55) 5,620.80 8,423.84 4,294.73 3,724.33Net income, diluted per share (yen) - 5,094.84 7,763.52 3,971.69 3,666.18Cash flows from operating activities ¥558,196 (¥1,647,427) ¥2,295,197 ¥1,898,215 ¥779,065Cash flows from investing activities (776,990) (3,795,977) (165,735) (3,305,766) 3,355,538Cash flows from financing activities 1,065,638 6,850,448 573,881 2,806,777 (203,196)Cash and cash equivalents at year-end 1,963,860 3,369,626 6,072,088 7,471,888 11,509,880
2003 2004 2005 2006 2007
Consolidated financial indicators:Net sales $29,397 $57,342 $70,925 $108,263 $140,657Ordinary income (loss) (1,692) (1,940) 981 13,060 20,084Income (loss) before income taxes andminority interests (1,046) 8,571 12,897 12,599 21,143Net income (loss) (1,816) 3,510 5,724 2,937 4,775Net assets 19,626 24,283 60,416 92,572 95,268Total assets 56,347 135,959 219,288 241,013 344,023Net assets per share (U.S. dollars) $1,477.37 $341.10 $768.61 $796.13 $373.90Net income (loss), basic per share(U.S. dollars) (143.37) 51.84 76.14 37.27 30.21Net income, diluted per share (U.S. dollars) - 46.99 70.18 34.46 29.74Cash flows from operating activities $4,661 ($15,193) $20,747 $16,472 $6,320Cash flows from investing activities (6,488) (35,009) (1,498) (28,686) 27,221Cash flows from financing activities 8,899 63,179 5,187 24,356 (1,648)Cash and cash equivalents at year-end 16,400 31,077 54,886 64,838 93,371
2003 2004 2005 2006 2007Consolidated key ratio:
Shareholders' equity ratio 34.8% 17.9% 27.6% 26.1% 17.2%Return on equity (ROE) -8.9% 15.1% 13.6% 4.9% 8.1%Price earnings ratio (PER) - 95.2 times 51.8 times 107.3 times 41.9 times
Consolidated other statistics:Number of employees 114 121 247 283 718
Note:
2005: U.S. $1.00 = 110.63 yen on June 30, 20052006: U.S. $1.00 = 115.24 yen on June 30, 20062007: U.S. $1.00 = 123.27 yen on June 29, 2007
1. U.S. dollar amounts are translated from Japanese yen, for readers' convenience only, at the exchange rate per U.S. dollar as described below; the approximate exchange rate of TTM of Mizuho Bank, Ltd., on June 30, 2003, June 30, 2004,
2003: U.S. $1.00 = 119.75 yen on June 30, 20032004: U.S. $1.00 = 108.43 yen on June 30, 2004
June 30, 2005, June 30, 2006, and June 29, 2007, respectively.
(thousands of yen, except per share amounts)
(thousands of U.S. dollars, except per share amounts)

- 10 -
Net sales
¥0
¥4,000,000
¥8,000,000
¥12,000,000
¥16,000,000
¥20,000,000
2003 2004 2005 2006 2007
(thou
sand
s of y
en)
Incom e (loss) before income taxes andm inority interests
(¥700,000)
¥0
¥700,000
¥1,400,000
¥2,100,000
¥2,800,000
2003 2004 2005 2006 2007
(thou
sand
s of y
en)
Net income (loss)
(¥400,000)
(¥200,000)
¥0
¥200,000
¥400,000
¥600,000
¥800,000
2003 2004 2005 2006 2007(thou
sand
s of y
en)
Net assets
¥0
¥2,500,000
¥5,000,000
¥7,500,000
¥10,000,000
¥12,500,000
2003 2004 2005 2006 2007
(thou
sand
s of y
en)
Total assets
¥0
¥10,000,000
¥20,000,000
¥30,000,000
¥40,000,000
¥50,000,000
2003 2004 2005 2006 2007
(thou
sand
s of y
en)
Cash flows
(¥5,000,000)
(¥2,500,000)
¥0
¥2,500,000
¥5,000,000
¥7,500,000
2003 2004 2005 2006 2007
(thou
sand
s of y
en)
Cash flows from operating activities Cash flows from investing activitiesCash flows from financing activities
Net assets per share
¥0.00
¥40,000.00
¥80,000.00
¥120,000.00
¥160,000.00
¥200,000.00
2003 2004 2005 2006 2007
(yen
)
Net income (loss), basic per shareNet incom e, diluted per share
(¥18,000.00)
(¥12,000.00)
(¥6,000.00)
¥0.00
¥6,000.00
¥12,000.00
2003 2004 2005 2006 2007(yen
)
Net income (loss), basic per share (yen) Net income, diluted per share (yen)
Return on equity (ROE)
-10.0%
-5.0%
0.0%
5.0%
10.0%
15.0%
20.0%
2003 2004 2005 2006 2007
(per
cent
age)
Price earnings ratio (PER)
0.0 times
24.0 times
48.0 times
72.0 times
96.0 times
120.0 times
2003 2004 2005 2006 2007
(tim
es)

- 11 -
CONSOLIDATED BALANCE SHEETS (As of June 30, 2006 and 2007)
2006 2007 2007(thousands ofU.S. dollars)
(Assets) I Current assets
1 Cash and deposits ¥7,575,614 ¥13,499,476 $109,5112 Notes and accounts receivable 2,662,547 9,546,686 77,4453 Investment securities for sales 4,528,656 3,769,005 30,5754 Allowance for investment loss (508,945) (226,358) (1,836)5 Inventories 118,113 1,018,311 8,2616 Deferred income taxes 175,592 234,996 1,9067 Other accounts receivable 2,542,621 3,100,575 25,1538 Other 430,572 1,025,356 8,318
Allowance for doubtful accounts (1,395) (49,407) (401)Total current assets 17,523,376 31,918,644 258,933
II Fixed assets1 Property, plant and equipment
(1) Buildings and structures, net 107,497 120,226 975(2) Machinery and vehicles, net - 0 0(3) Furniture and fixtures, net 190,394 220,255 1,787(4) Land 2,470 2,470 20(5) Construction in progress - 17,281 140
Total property, plant and equipment 300,362 360,233 2,9222 Intangible fixed assets
(1) Software 790,217 880,047 7,139(2) Consolidated adjustment account 5,186,799 - -(3) Goodwill - 6,645,839 53,913(4) Other 142,619 17,906 145
Total intangible fixed assets 6,119,636 7,543,793 61,1973 Investments and other assets
(1) Investment securities 3,168,387 536,250 4,350(2) Long-term receivables 1,665 78,412 636(3) Deferred income taxes 227,449 34,964 284(4) Other 434,995 1,952,680 15,841
Allowance for doubtful accounts (1,502) (17,310) (140)Total investments and other assets 3,830,996 2,584,997 20,970Total fixed assets 10,250,995 10,489,024 85,090Total assets ¥27,774,372 ¥42,407,669 $344,023
(thousands of yen)

- 12 -
2006 2007 2007(thousands ofU.S. dollars)
(Liabilities)I Current liabilities
1 Notes and accounts payable ¥1,238,963 ¥10,640,033 $86,3152 Short-term borrowings 1,130,000 5,537,212 44,9193 Current portion of long-term borrowings 411,770 332,820 2,7004 Current portion of bonds and notes 100,000 988,000 8,0155 Income taxes payable 819,125 893,610 7,2496 Deferred tax liabilities 78,417 - -7 Reserve for bonuses 53,838 102,554 8328 Reserve for sales return - 12,972 1059 Reserve for business reconstruction - 165,162 1,34010 Deposits received 9,542,633 6,399,144 51,91211 Other 409,670 1,312,492 10,647
Total current liabilities 13,784,419 26,384,002 214,034II Long-term liabilities
1 Bonds 420,000 816,000 6,6202 Long-term borrowings 2,870,000 2,630,000 21,3353 Deferred tax liabilities - 146,169 1,1864 Reserve for retirement benefits 22,807 573,611 4,6535 Other 9,108 114,201 926
Total long-term liabilities 3,321,915 4,279,982 34,720Total liabilities 17,106,335 30,663,984 248,755
(Net assets)I Shareholders' equity
1 Common stock 1,798,006 1,809,412 14,6782 Capital surplus 4,331,780 4,152,370 33,6853 Retained earnings 913,529 1,492,890 12,1114 Treasury stock (1,932) (1,921) (16)
Total shareholders' equity 7,041,383 7,452,752 60,459II Valuation and translation adjustments
1 Net unrealized gain on available-for-sale securities 206,801 (157,856) (1,281)Total valuation and translation adjustments 206,801 (157,856) (1,281)
III Stock acquisition rights - 3,198 26IV Minority interests 3,419,852 4,445,589 36,064
Total net assets 10,668,036 11,743,684 95,268Total liabilities and net assets ¥27,774,372 ¥42,407,669 $344,023
(thousands of yen)

- 13 -
CONSOLIDATED STATEMENTS OF INCOME (For the years ended June 30, 2006 and 2007)
2006 2007 2007(thousands ofU.S. dollars)
I Net sales ¥12,476,240 ¥17,338,744 $140,657II Cost of sales 6,627,105 10,046,843 81,503
Gross profit 5,849,135 7,291,900 59,154Provision for reserve for sales return - 12,972 105Gross profit, net 5,849,135 7,278,928 59,049
III Selling, general and administrative expenses 4,145,136 5,665,776 45,9621 Directors' and auditors' compensation 452,639 609,457 4,9442 Salary for employees 1,000,819 1,298,472 10,5343 Bonus for employees 44,499 75,679 6144 Legal welfare expenses 146,136 189,080 1,5345 Welfare expenses 13,980 21,580 1756 Retirement benefit 3,253 3,324 277 Sales commission 77,792 116,214 9438 Advertising expenses 501,487 898,629 7,2909 Entertainment expenses 16,758 26,812 21810 Travel and transportation expenses 80,174 111,591 90511 Communication expenses 51,123 58,550 47512 Office supplies 55,194 70,869 57513 Tax and dues 59,437 84,062 68214 Commissions 200,568 255,679 2,07415 Business consignment expenses 132,927 189,152 1,53416 Maintenance expenses 38,726 48,054 39017 Research and development expenses 41,477 49,479 40118 Rent 245,160 302,976 2,45819 Depreciation 27,659 37,883 30720 Amortization of consolidated adjustment account 526,570 - -21 Amortization of goodwill - 624,056 5,06322 Other 428,747 594,169 4,820
Operating income ¥1,703,998 ¥1,613,152 $13,086
(thousands of yen)

- 14 -
2006 2007 2007(thousands ofU.S. dollars)
IV Non-operating income ¥133,157 ¥1,032,797 $8,3781 Interest income 8,110 15,835 1282 Dividend income 128 6 03 Gain on investment business association 99,041 - -4 Gain on anonymous association agreements - 999,150 8,1055 Other 25,876 17,805 144
V Non-operating expenses 332,121 170,141 1,3801 Interest expenses 131,409 139,396 1,1312 Investment loss under equity method 144,579 - -3 Bond issue expenses 27,790 - -4 Other 28,342 30,744 249
Ordinary income 1,505,034 2,475,808 20,084VI Extraordinary gains 7,941 236,152 1,916
1 Gain on changes in equities - 113,747 9232 Gain on sales of investment securities 5,012 - -3 Gain on sales of investments in subsidiaries and affiliates - 122,371 9934 Reversal of allowance for doubtful accounts 2,667 - -5 Other 261 33 0
VII Extraordinary losses 61,112 105,623 8571 Loss on disposal of fixed assets 2,045 10,979 892 Loss on changes in equities 14,317 50,540 4103 Appraisal loss of investment securities - 37,325 3034 Restoration expense for operating site 41,714 - -5 Other 3,033 6,777 55Income before income taxes and minority interests 1,451,863 2,606,337 21,143Income taxes-current 875,376 1,202,403 9,754Income taxes-deferred (290,586) 256,359 2,080Minority interest in net income 528,572 558,940 4,534Net income ¥338,501 ¥588,633 $4,775
(thousands of yen)

- 15 -
CONSOLIDATED STATEMENTS OF CHANGES IN NET ASSETS (For the years ended June 30, 2006 and 2007)
CommonStock
CapitalSurplus
RetainedEarnings
TreasuryStock
Total Share-holders'Equity
Balance as of June 30, 2005 ¥1,769,763 ¥4,303,537 ¥575,027 (¥1,662) ¥6,646,666Changes in the yearIssue of new shares 28,242 28,242 56,485Net income 338,501 338,501Repurchase of treasury stock (270) (270)Net changes other than shareholders' equity
Total of changes in the year 28,242 28,242 338,501 (270) 394,716Balance as of June 30, 2006 1,798,006 4,331,780 913,529 (1,932) 7,041,383Changes in the year
Issue of new shares 11,406 11,406 22,812Deferred tax liabilities for unrealized gainon investments in subsidiaries and affiliates (190,817) (190,817)Decrease of retained earnings from rise innumber of consolidated subsidiaries (9,272) (9,272)Net income 588,633 588,633Disposal of treasury stock 2 11 13Net changes other than shareholders' equity
Total of changes in the year 11,406 (179,409) 579,361 11 411,369Balance as of June 30, 2007 ¥1,809,412 ¥4,152,370 ¥1,492,890 (¥1,921) ¥7,452,752
Net UnrealizedGain on
Available-for-sale Securities
TotalValuation and
TranslationAdjustments
StockAcquisition
Rights
MinorityInterests
Total NetAssets
Balance as of June 30, 2005 ¥37,121 ¥37,121 - ¥2,646,587 ¥9,330,375Changes in the yearIssue of new shares 56,485Net income 338,501Repurchase of treasury stock (270)Net changes other than shareholders' equity 169,679 169,679 773,264 942,944
Total of changes in the year 169,679 169,679 773,264 1,337,661Balance as of June 30, 2006 206,801 206,801 - 3,419,852 10,668,036Changes in the year
Issue of new shares 22,812Deferred tax liabilities for unrealized gainon investments in subsidiaries and affiliates (190,817)Decrease of retained earnings from rise innumber of consolidated subsidiaries (9,272)Net income 588,633Disposal of treasury stock 13Net changes other than shareholders' equity (364,658) (364,658) 3,198 1,025,737 664,277
Total of changes in the year (364,658) (364,658) 3,198 1,025,737 1,075,647Balance as of June 30, 2007 (¥157,856) (¥157,856) ¥3,198 ¥4,445,589 ¥11,743,684
(thousands of yen)
Valuation and TranslationAdjustments
(thousands of yen)
Shareholders' Equity

- 16 -
CommonStock
CapitalSurplus
RetainedEarnings
TreasuryStock
Total Share-holders'Equity
Balance as of June 30, 2006 $14,586 $35,141 $7,411 ($16) $57,122Changes in the year
Issue of new shares 93 93 185Deferred tax liabilities for unrealized gainon investments in subsidiaries and affiliates (1,548) (1,548)Decrease of retained earnings from rise innumber of consolidated subsidiaries (75) (75)Net income 4,775 4,775Disposal of treasury stock 0 0 0Net changes other than shareholders' equity
Total of changes in the year 93 (1,455) 4,700 0 3,337Balance as of June 30, 2007 $14,678 $33,685 $12,111 ($16) $60,459
Net UnrealizedGain on
Available-for-sale Securities
TotalValuation and
TranslationAdjustments
StockAcquisition
Rights
MinorityInterests
Total NetAssets
Balance as of June 30, 2006 $1,678 $1,678 - $27,743 $86,542Changes in the year
Issue of new shares 185Deferred tax liabilities for unrealized gainon investments in subsidiaries and affiliates (1,548)Decrease of retained earnings from rise innumber of consolidated subsidiaries (75)Net income 4,775Disposal of treasury stock 0Net changes other than shareholders' equity (2,958) (2,958) 26 8,321 5,389
Total of changes in the year (2,958) (2,958) 26 8,321 8,726Balance as of June 30, 2007 ($1,281) ($1,281) $26 $36,064 $95,268
(thousands of U.S. dollars)
Valuation and TranslationAdjustments
(thousands of U.S. dollars)
Shareholders' Equity
- 17 -
CONSOLIDATED STATEMENTS OF CASH FLOWS (For the years ended June 30, 2006 and 2007)
2006 2007 2007(thousands ofU.S. dollars)
I Cash flows from operating activities:1 Income before income taxes and minority interests ¥1,451,863 ¥2,606,337 $21,1432 Depreciation and amortization 83,579 107,371 8713 Amortization of software 125,773 269,081 2,1834 Amortization of consolidation adjustment account 526,570 - -5 Amortization of goodwill - 624,056 5,0636 Interest and dividend income (22,686) (32,972) (267)7 Gain on anonymous association agreements - (999,150) (8,105)8 Interest expenses 131,409 139,396 1,1319 Foreign exchange gains (272) (1,279) (10)10 Share issuing expense - 4,077 3311 New share issuing expense 2,158 - -12 Bond issue expenses 27,790 - -13 Gain on sales of investment securities (5,012) - -14 Investment loss under equity method 144,579 - -15 Loss (gain) on changes in equities 14,317 (63,207) (513)16 Gain on sales of investments in subsidiaries and affiliates - (122,371) (993)17 Increase in notes and accounts receivable (632,092) (1,983,860) (16,094)18 Decrease in investment securities for sales 136,667 177,908 1,44319 Decrease in allowance for investment loss - (282,587) (2,292)20 (Increase) decrease in sales deposit (70,000) 45,000 36521 (Increase) decrease in inventories 50,866 (1,489) (12)22 (Increase) decrease in accounts receivable 979,715 (551,137) (4,471)23 Increase in notes and accounts payable 135,264 1,112,837 9,02824 Increase in accrued expenses 55,356 53,569 43525 Increase (decrease) in accrued consumption taxes (78,681) 116,585 94626 Increase (decrease) in deposits received (598,324) 1,574,759 12,77527 Other (130,367) (653,288) (5,300)
Subtotal 2,328,475 2,139,635 17,35728 Interest and dividends received 11,354 - -29 Interest paid (128,844) (144,595) (1,173)30 Income taxes paid (314,808) (1,223,468) (9,925)31 Refund of income taxes 2,038 7,494 61
Net cash provided by operating activities ¥1,898,215 ¥779,065 $6,320
(thousands of yen)
- 18 -
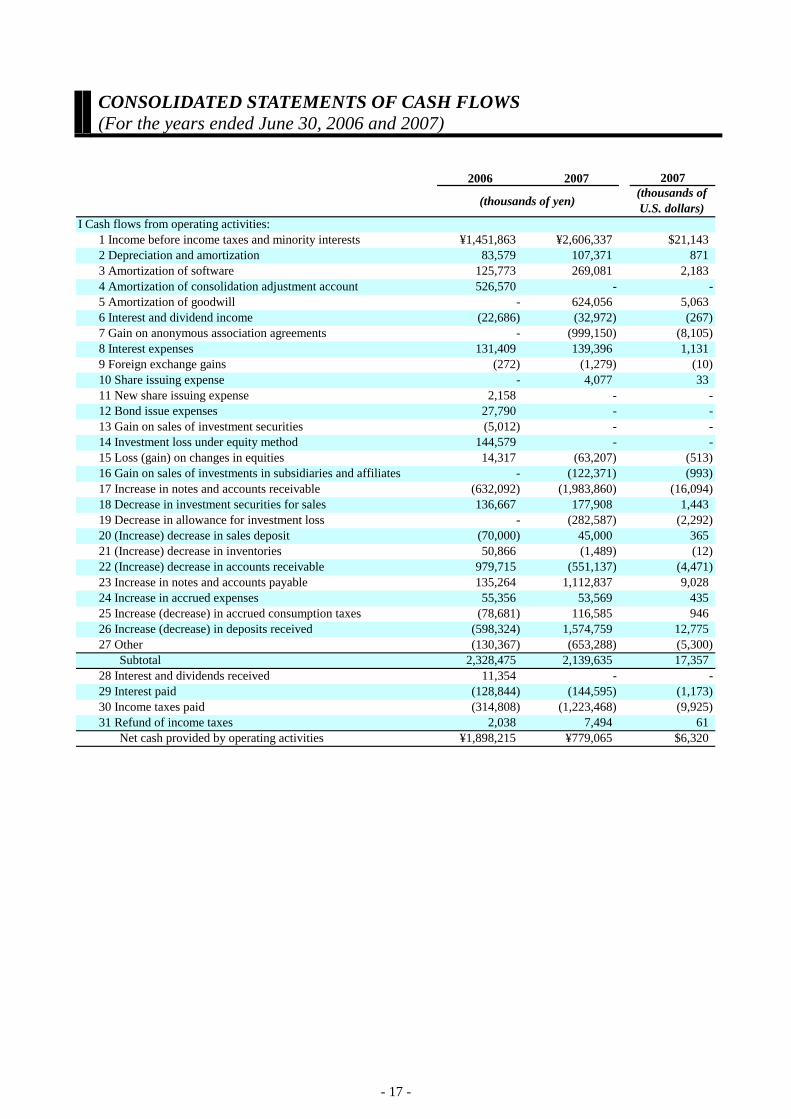
2006 2007 2007(thousands ofU.S. dollars)
II Cash flows from investing activities:1 Deposit into term-deposits (¥16,032) (¥300,019) ($2,434)2 Refund from term-deposits 656,981 360,057 2,9213 Payments for refund of specified deposits (2,000) - -4 Proceeds from refund of specified deposits 902 2,437 205 Payments for purchases of property, plant and equipment (171,704) (165,424) (1,342)6 Proceeds from sale of property, plant and equipment 349 2,693 227 Payments for purchases of intangible fixed assets (692,335) (379,273) (3,077)8 Proceeds from additional acquisition of shares of subsidiaries accompanied by change in scope of consolidation - 1,307,465 10,6079 Payments for purchases of investment securities (3,115,024) (468,985) (3,805)10 Payments for acquisition of shares of subsidiaries and affiliates (500,000) (560,589) (4,548)11 Proceeds from sale of investment securities 22,897 3,911 3212 Proceeds from sale of shares of subsidiaries and affiliates 489,029 181,125 1,46913 Payments for acquisition of investments in equity (9,800) - -14 Proceeds from refund of investments in anonymous association agreements - 3,000,000 24,33715 Proceeds from distribution of anonymous association agreements - 994,615 8,06916 Payments for loans (225,312) (3,426,850) (27,800)17 Proceeds from collection of loans 389,556 2,911,927 23,62218 Payments for security deposits/guarantee deposits (50,096) (79,511) (645)19 Proceeds from refund of security deposits/guarantee deposits 4,707 9,377 7620 Other, net (87,883) (37,419) (304)
Net cash (used in) provided by investing activities (3,305,766) 3,355,538 27,221III Cash flows from financing activities:
1 Proceeds from short-term borrowings 2,520,000 4,842,200 39,2812 Repayments of short-term borrowings (2,250,000) (5,174,116) (41,974)3 Proceeds from long-term borrowings 3,000,000 - -4 Repayment of long-term borrowings (505,560) (411,770) (3,340)5 Proceeds from bond issuance 300,000 - -6 Repayment of bond redemption (436,000) (100,000) (811)7 Proceeds from issue of shares 54,327 18,734 1528 Payments for repurchase of treasury stock (267) - -9 Proceeds from payments from minority shareholders 269,360 672,604 5,45610 Amount of payment of dividends for minority shareholders (25,455) (50,863) (413)11 Proceeds from acceptance of deposits received 2,840,157 - -12 Repayment of deposits received (2,937,062) - -13 Payments for listing of stock (22,721) - -14 Other, net - 13 0
Net cash provided by (used in) financing activities 2,806,777 (203,196) (1,648)IV Foreign currency translation adjustments on cash and cash equivalents 573 853 7V Net change in cash and cash equivalents 1,399,799 3,932,260 31,900VI Cash and cash equivalents at beginning of year 6,072,088 7,471,888 60,614VII Cash and cash equivalents of newly consolidated subsidiaries - 105,731 858VIII Cash and cash equivalents at end of year ¥7,471,888 ¥11,509,880 $93,371
(thousands of yen)

- 19 -
SEGMENT INFORMATION (As of and for the years ended June 30, 2006 and 2007)
Business Segment Information
SolutionsBusiness
Portal &Blog
Business
FinanceBusiness
IncubationBusiness Total Eliminations
and CorporateConsolidated
Total
I Net sales and operating income:Net sales
(1) Net sales to external customers ¥7,761,000 ¥4,847,034 ¥2,718,159 ¥2,012,550 ¥17,338,744 - ¥17,338,744(2) Intersegment net sales or transfer amount 163,303 155,420 11,824 - 330,548 (330,548) -
Total 7,924,303 5,002,454 2,729,983 2,012,550 17,669,292 (330,548) 17,338,744Operating expenses 7,494,168 4,094,532 2,226,903 1,728,200 15,543,805 181,786 15,725,592Operating income 430,135 907,921 503,080 284,349 2,125,487 (512,334) 1,613,152II Assets, depreciation and amortization and capital expenditures:
Assets 20,408,759 5,646,439 10,268,756 5,467,190 41,791,144 616,524 42,407,669Depreciation and amortization 28,294 222,750 131,591 4,800 387,436 23,697 411,134Capital expenditures ¥11,631 ¥373,385 ¥174,955 ¥4,477 ¥564,449 ¥20,674 ¥585,124
SolutionsBusiness
Portal &Blog
Business
FinanceBusiness
IncubationBusiness Total Eliminations
and CorporateConsolidated
Total
I Net sales and operating income:Net sales
(1) Net sales to external customers ¥4,972,751 ¥2,885,897 ¥2,167,966 ¥2,449,625 ¥12,476,240 - ¥12,476,240(2) Intersegment net sales or transfer amount 17,017 43,385 170 - 60,573 (60,573) -
Total 4,989,769 2,929,282 2,168,136 2,449,625 12,536,814 (60,573) 12,476,240Operating expenses 4,865,722 2,642,473 1,562,839 1,351,017 10,422,052 350,189 10,772,242Operating income 124,046 286,809 605,297 1,098,607 2,114,761 (410,762) 1,703,998II Assets, depreciation and amortization and capital expenditures:
Assets 6,219,176 4,634,317 7,287,065 6,143,837 24,284,397 3,489,974 27,774,372Depreciation and amortization 32,762 135,115 56,180 2,318 226,376 35,820 262,197Capital expenditures ¥21,978 ¥385,488 ¥434,340 ¥14,819 ¥856,626 ¥53,965 ¥910,592
SolutionsBusiness
Portal &Blog
Business
FinanceBusiness
IncubationBusiness Total Eliminations
and CorporateConsolidated
Total
I Net sales and operating income:Net sales
(1) Net sales to external customers $62,959 $39,320 $22,050 $16,326 $140,657 - $140,657(2) Intersegment net sales or transfer amount 1,325 1,261 96 - 2,681 (2,681) -
Total 64,284 40,581 22,146 16,326 143,338 (2,681) 140,657Operating expenses 60,795 33,216 18,065 14,020 126,096 1,475 127,570Operating income 3,489 7,365 4,081 2,307 17,243 (4,156) 13,086II Assets, depreciation and amortization and capital expenditures:
Assets 165,561 45,805 83,303 44,351 339,021 5,001 344,023Depreciation and amortization 230 1,807 1,068 39 3,143 192 3,335Capital expenditures $94 $3,029 $1,419 $36 $4,579 $168 $4,747
(thousands of yen)
(thousands of U.S. dollars)
(thousands of yen)
As of and for the year ended June 30, 2007
As of and for the year ended June 30, 2006
As of and for the year ended June 30, 2007

- 20 -
Geographical Segment Information
Geographical segment information is omitted because net sales and the amount of assets in the domestic market account for more than 90% of aggregate segment sales and assets, respectively.
Overseas Sales
Overseas sales is omitted because net sales in the overseas market account for less than 10% of consolidated net sales.

- 21 -
QUARTERLY INFORMATION (As of and for the years ended June 30, 2006 and 2007)
FirstQuarter
SecondQuarter
ThirdQuarter
FourthQuarter
(1) Consolidated financial results:Net sales ¥4,280,065 ¥7,601,510 ¥11,489,774 ¥17,338,744Operating income 1,000,230 1,015,339 1,204,992 1,613,152Ordinary income 960,203 938,149 1,096,662 2,475,808Quarterly (net) income 431,091 68,221 632 588,633
(2) Consolidated financial position:Total assets 27,301,685 29,065,096 28,426,421 42,407,669Net assets 11,198,831 11,071,188 11,269,005 11,743,684
(3) Consolidated cash flows:Cash flows from operating activities 497,444 1,520,966 750,375 779,065Cash flows from investing activities 674,750 511,936 259,445 3,355,538Cash flows from financing activities (490,655) (266,761) 120,681 (203,196)Cash and cash equivalents at quarter-end 8,259,290 9,344,158 8,708,446 11,509,880
(4) Per share data (yen) :Quarterly (net) income, basic per share ¥5,456.63 ¥863.48 ¥4.01 ¥3,724.33Quarterly (net) income, diluted per share 5,351.58 790.20 - 3,666.18Net assets per share 94,623.27 88,299.03 43,666.19 46,090.88
FirstQuarter
SecondQuarter
ThirdQuarter
FourthQuarter
(1) Consolidated financial results:Net sales ¥1,862,299 ¥4,296,433 ¥8,792,027 ¥12,476,240Operating income (loss) (192,574) (159,738) 1,077,769 1,703,998Ordinary income (loss) (327,495) (249,985) 968,794 1,505,034Quarterly (net) income (loss) (376,099) (433,800) 136,064 338,501
(2) Consolidated financial position:Total assets 24,132,280 28,578,862 27,202,453 27,774,372Net assets (shareholders' equity) 6,698,994 7,849,916 7,883,676 10,668,036
(3) Consolidated cash flows:Cash flows from operating activities 677,373 1,072,308 1,937,988 1,898,215Cash flows from investing activities 473,947 (1,026,959) (2,874,206) (3,305,766)Cash flows from financing activities 826,664 2,170,812 1,475,108 2,806,777Cash and cash equivalents at quarter-end 8,050,359 8,288,676 6,611,422 7,471,888
(4) Per share data (yen) :Quarterly (net) income (loss), basic per share (¥4,783.46) (¥5,514.36) ¥1,727.65 ¥4,294.73Quarterly (net) income, diluted per share - - 1,524.75 3,971.69Net assets (shareholders' equity) per share 85,176.16 99,588.90 99,795.65 91,745.46
(thousands of yen, except per share amounts)
(thousands of yen, except per share amounts)
As of and for the year ended June 30, 2007
As of and for the year ended June 30, 2006

- 22 -
FirstQuarter
SecondQuarter
ThirdQuarter
FourthQuarter
(1) Consolidated financial results:Net sales $36,306 $63,814 $97,297 $140,657Operating income 8,484 8,524 10,204 13,086Ordinary income 8,145 7,876 9,287 20,084Quarterly (net) income 3,657 573 5 4,775
(2) Consolidated financial position:Total assets 231,586 243,998 240,718 344,023Net assets 94,994 92,941 95,427 95,268
(3) Consolidated cash flows:Cash flows from operating activities 4,220 12,768 6,354 6,320Cash flows from investing activities 5,724 4,298 2,197 27,221Cash flows from financing activities (4,162) (2,239) 1,022 (1,648)Cash and cash equivalents at quarter-end 70,059 78,443 73,744 93,371
(4) Per share data (U.S. dollars) :Quarterly (net) income, basic per share $46.29 $7.25 $0.03 $30.21Quarterly (net) income, diluted per share 45.39 6.63 - 29.74Net assets per share 802.64 741.26 369.77 373.90
Third Quarter: U.S. $1.00 = 118.09 yen on March 30, 2007
As of and for the year ended June 30, 2007
(thousands of U.S. dollars, except per share amounts)
1. The Company's fiscal period is made up of the following four quarters:First Quarter: Three months ended September 30, 2005 and 2006
Notes:
December 29, 2006, March 30, 2007, and June 29, 2007, respectively. as described below; the approximate exchange rate of TTM of Mizuho Bank, Ltd., on September 29, 2006,
Fourth Quarter: U.S. $1.00 = 123.27 yen on June 29, 2007
2. U.S. dollar amounts are translated from Japanese yen, for readers' convenience only, at the exchange rate per U.S. dollar
First Quarter: U.S. $1.00 = 117.89 yen on September 29, 2006Second Quarter: U.S. $1.00 = 119.12 yen on December 29, 2006
Second Quarter: Three months ended December 31, 2005 and 2006Third Quarter: Three months ended March 31, 2006 and 2007Fourth Quarter: Three months ended June 30, 2006 and 2007

- 23 -
SIGNIFICANT ACCOUNTING POLICIES (As of and for the year ended June 30, 2007)
1. Scope of Consolidation
(1) Number of consolidated subsidiaries: 23
2. Significant Accounting Policies
(1) Standards and methods of valuation of significant assets a. Securities
Other securities (including operating investment securities) * Securities with market value:
- Stated at fair value determined by the market value at settlement of account. (Unrealized gains or losses are recorded in shareholders’ equity. Sales cost is determined by the moving-average method.)
* Securities without market value: - Stated at cost determined mainly by the moving-average method.
b. Derivatives - Stated at fair value.
c. Inventories Product in process
- Stated at cost determined by specific cost method. Commodity and stock
- Stated at cost determined by the moving-average method.
(2) Depreciation/amortization methods for significant depreciable assets a. Tangible fixed assets
Computed on declining-balance method. Depreciation expenses for buildings (other than fixtures) acquired on or after April 1, 1998 are
computed using the straight-line method. The period of depreciation for the main tangible fixed assets are as follows: - Buildings and structures 6-22 years - Furniture and fixtures 2-20 years
(Changes in accounting policies)
According to the revision of corporate tax law, the method of depreciation of tangible fixed assets acquired on or after April 1, 2007 was changed based on the revised corporate tax law.
This change slightly influenced operating income, ordinary income and income before income taxes and minority interests.
b. Intangible fixed assets Software
- Amortization of software costs for internal use is computed using the straight-line method based on the expected lifespan up to 5 years.
(3) Method of accounting of significant deferred assets
a. Stock issuance expenses - All costs are expensed as incurred.

- 24 -
(4) Standards of accounting for significant allowances and reserves a. Allowance for investment losses
To provide for investment losses, the estimated amount of losses is recorded in consideration of the actual state of invested companies.
b. Allowance for doubtful accounts The Company provides for losses on ordinary receivables using the historical default rate and
provides for losses on specific receivables where there is a possibility of default based on the estimated amount of uncollectible receivables on an individual basis.
c. Accrued bonuses to employees To provide for the payment of bonuses to employees, a part of consolidated subsidiaries makes
provisions for the amount of future payments incurred in the current consolidated fiscal year. d. Accrued retirement benefits for employees
To provide for employees’ retirement benefits, the Company records an amount that is recognized as arising at the end of the period based on the estimated retirement benefit obligations and value of pension assets at the end of the fiscal year.
The Company and a part of consolidated subsidiaries have adopted the simplified method in which the amount of liability estimated based on voluntary termination at end of term is regarded as retirement benefit obligations.
Unrecognized actuarial differences are amortized using the straight-line method over the average remaining service period for employees in service (12 years or less) at the time the liabilities are incurred. In this case actuarial differences are amortized from the following fiscal year this process has been applied.
e. Allowance for sales return For certain consolidated subsidiaries, an allowance is provided for estimated losses on sales returns at
an amount calculated based on historical experience. f. Allowance for business reconstruction
For certain consolidated subsidiaries, an allowance is provided for unrealized losses on business reconstruction at a reasonably estimated amount.
(5) Accounting methods for significant lease transactions
The Company accounts for finance leases, other than those in which ownership of the leased property is transferred to the lessee, in accordance with standards for ordinary operating leases.

- 25 -
(6) Significant hedge accounting a. Hedge accounting trading method
When interest rate swap fulfills certain requirements, special treatment is applied. b. Means of hedging and hedged item
- Means of hedging Interest rate swap - Hedged item Interest on borrowing
c. Hedging policy Based on the Group’s policy of derivatives trading, we principally aim to raise funds at a fixed rate
and do not conduct speculative trading. d. Method of assessing the effectiveness of hedges
The Company concludes only interest rate swap contracts that satisfy all of the following conditions, aimed at hedging interest volatility risks and cash flow volatility risks:
a) The notional principal amount of the interest rate swap contract is almost the same as the principal amount of the relevant long-term borrowing.
b) The term and maturity of the interest rate swap contract are almost the same as those of the relevant long-term borrowing.
c) Both the index of the floating rate received and paid in the interest rate swap contract and the index of the floating rate of the relevant long term borrowing are based on TIBOR.
d) The term for revision of interest rate of the interest rate swap contract are almost the same as those stipulated in the relevant long-term borrowing.
e) The receipt-and-payment conditions of the interest rate swap contract are fixed throughout the swap period.
3. Amortization of Goodwill and Negative Goodwill
Goodwill are amortized on a straight-line basis over the period that expenses are effective (5-20 years). 4. Cash and Cash Equivalents on Consolidated Statements of Cash Flows
Cash and cash equivalents on the consolidated statements of cash flows include cash on hand, saving accounts, current accounts and fixed-period deposits to mature within three months from the date of acquisition.
5. Changes of Significant Items for Basis of Preparation of Consolidated Financial Statements
(Accounting standards for business combinations) Beginning with this fiscal year under review, the Company has adopted “Accounting Standard for Business
Combinations” (Business Accounting Council, October 31, 2003), “Accounting Standard for Business Divestitures” (Accounting Standards Board of Japan Statement No. 7, December 27, 2005) and “Guidance on Accounting Standard for Business Combinations and Accounting Standard for Business Divestitures” (Accounting Standards Board of Japan Guidance No. 10, December 27, 2005).

- 26 -
STOCK INFORMATION (From July 1, 2002 to June 30, 2007)
Stock Price Index Compared with Main Indices
0
200
400
600
800
1,000
1,200
Jul-02Oct-02
Jan-03Apr-03
Jul-03Oct-03
Jan-04Apr-04
Jul-04Oct-04
Jan-05Apr-05
Jul-05Oct-05
Jan-06Apr-06
Jul-06Oct-06
Jan-07Apr-07
Digital Garage TOPIX Nikkei 225
Note: 1. One share was split into five shares on December 31, 2003, and one share was split into two shares on
December 31, 2006, respectively. Thus, the Company’s stock price index is computed on adjusted closing prices of split shares.

- 27 -
CORPORATE HISTORY (From August 17, 1995 to June 30, 2007)
August 1995 * Established Digital Garage, Inc., for the purpose of advertising, planning and production
using the Internet as a medium. (Representatives: Kaoru Hayashi, Joichi Ito) October 1996 * Made an exclusive contract for an Internet search engine service with Infoseek in the United
States, and newly set up Infoseek Division. December 1996 * Co-founded Digital Advertising Consortium with HAKUHODO INCORPORATED,
Asahi-Tsushin Co., Ltd. (present ASATSU-DK INC.), YOMIKO Advertising Inc., and I&S (present I&SBBDO)
May 1997 * Bought out From Garage, Studio Garage and Eccosys. April 1999 * Co-founded Electronic Commerce Institute, Inc., with Communication Science Institute,
Inc. June 1999 * Transferred business of Infoseek Division to Infoseek in the United States. * Acquired 60 % of shares of Electric Commerce Institute to make it a subsidiary. * Acquired 60 % of shares of Creative Garage (later DS Interactive Inc., present Xenlon
Corporation) to make it a subsidiary. May 2000 * Co-founded ECONTEXT, INC., with LAWSON INC., Toyo Information System Co., Ltd.
(present TIS, Inc.), and Mitsubishi Corporation, as a company in charge of an e-commerce platform for logistic/settlement service.
October 2000 * Co-founded Gift Port as an e-commerce gift company with Shaddy Co., Ltd. December 2000 * Listed on over-the-counter market. June 2002 * Acquired 45 % of Kakaku.com, Inc., to make it a consolidated subsidiary measured by the
degree of substantial control. December 2002 * Liquidated Gift Port. January 2003 * Underwrote capital increase of ECONTEXT, INC., through allocation of new shares to a
third party to make it a consolidated subsidiary. February 2003 * Established Creative Garage, Inc., as a consolidated subsidiary for creative production. May 2003 * Sold all shares of DS Interactive Inc. (present Xenlon Corporation), and removed it from
consolidated subsidiaries. February 2004 * Established DG Mobile Inc., as a consolidated subsidiary for contents for mobile terminals.June 2004 * Sold all shares of Electronic Commerce Institute, Inc., and removed it from consolidated
subsidiaries. December 2004 * Acquired shares of Ibex & rims Corporation, through stock exchange to make it a
consolidated subsidiary. * Applied to JSDA for cancellation of over-the-counter market registration and listed on
JASDAQ market. January 2005 * Established Technorati Japan, Inc., as a consolidated subsidiary to operate a blog search
engine site. * Kakaku.com, Inc. (a consolidated subsidiary), acquired shares of 4travel, Inc., through stock
exchange, etc., to make it a consolidated subsidiary. July 2005 * Established DG Incubation, Inc., as a consolidated subsidiary for incubation business. September 2005 * Co-founded DG & Partners, Inc., as a consolidated subsidiary for management and
operation of properties of venture capital fund with DG Incubation, Inc., and Japan Asia Investment Co., Ltd.
November 2005 * Co-founded WEB2.0, Inc., as a consolidated subsidiary to operate “PingKing,” an information-sharing site that is CGM (Consumer Generated Media) with PIA Corporation. and Kakaku.com, Inc.
December 2005 * Kakaku.com, Inc. (a consolidated subsidiary), established Kakaku.com Financial, Inc.

- 28 -
January 2006 * Implemented corporate separation to make DG Solutions Co., Ltd., a newly established
consolidated subsidiary, take over solution business, and DG Incubation, Inc. (a consolidated subsidiary), take over incubation business. Shifted to a pure holding company.
* Established DG Asset Management, Inc., as a consolidated subsidiary for real estate-related management/operation and investment.
March 2006 * Established DG Media Marketing Inc., as a consolidated subsidiary for general WEB advertising business.
August 2006 * DG Solutions Co., Ltd., for solution business implemented corporate separation to make Ibex & rims Corporation, and DG Media Marketing, Inc., take over its business, and became an intermediate holding company.
* Ibex & rims Corporation changed its corporate name to DG & Ibex, Inc. * Established CGM Marketing, Inc., as a consolidated subsidiary for developing new
marketing techniques and strategies with CGM and matching bloggers and advertisers, jointly with DENTSU INC., cyber communications inc., and ASATSU-DK INC.
* Established Growth Partners, Inc., as a consolidated subsidiary for IR supporting business with Web 2.0 and operation of “STOCKCAFE,” an IR portal site, jointly with Asia Securities Printing Co., Ltd. (present PRONEXUS INC.).
April 2007 * DG Solutions Co., Ltd. (a consolidated subsidiary), acquired all shares of Sogei Co., Ltd., to make it a consolidated subsidiary.
* Bought out DG Asset Management, Inc., and took over its business.

- 29 -
CORPORATE INFORMATION (As of June 30, 2007)
Corporate Name: Digital Garage, Inc. Date of Establishment: August 17, 1995 Paid-in Capital: ¥1,809,412,522 Fiscal Year: July 1 to June 30 Number of Shares Authorized: 480,000 Number of Shares Issued: 158,282 Number of Shareholders: 3,169 Securities Code: 4819 Stock Exchange Listing: JASDAQ Securities Exchange Number of Employees: 718 (Consolidated) Number of Subsidiaries: 23 Transfer Agent: The Chuo Mitsui Trust and Banking Company, Limited. Accounting Auditor: Ernst & Young ShinNihon Headquarters: Yamazaki Building, 2-43-15 Tomigaya, Shibuya-ku, Tokyo 151-0063, Japan Investor Relations Contact:
- Phone: +81-(0)3-5465-7747 - Fax: +81-(0)3-5465-7743 - E-mail: [email protected] - URL: http://www.garage.co.jp/en/index.html

- 30 -
Principal Shareholders (Top 10): As of June 30, 2007
Name of Shareholder Number of Shares Held
Percentage of Total Number of
Shares Issued Kaoru Hayashi 44,473 28.10% JP Morgan Chase CREF Jasdec Lending Account (Local Custodian: The Bank of Tokyo-Mitsubishi UFJ, Ltd.) 11,731 7.41% TIS Inc. 8,800 5.56% The Master Trust Bank of Japan, Ltd. (Trust Account) 6,081 3.84% K Garage Ltd. 5,360 3.39% Mitsui Asset Trust and Banking Company, Limited. (Local Custodian: Japan Trustee Services Bank, Ltd.) 5,300 3.35% Japan Trustee Services Bank, Ltd. (Trust Account) 5,249 3.32% Yasuyuki Rokuyata 4,986 3.15% Man and Machine Interface Co., Ltd. 4,701 2.97% Mixx (Local Custodian: The Bank of Tokyo-Mitsubishi UFJ, Ltd.) 4,189 2.65%
Total 100,870 63.73% As of June 30, 2006
Name of Shareholder Number of Shares Held
Percentage of Total Number of
Shares Issued Kaoru Hayashi 22,234.85 28.14% JP Morgan Chase CREF Jasdec Lending Account (Local Custodian: The Bank of Tokyo-Mitsubishi UFJ, Ltd.) 5,428.00 6.87% The Master Trust Bank of Japan, Ltd. (Trust Account) 5,330.00 6.75% Japan Trustee Services Bank, Ltd. (Trust Account) 4,616.00 5.84% TIS Inc. 4,400.00 5.57% Man and Machine Interface Co., Ltd. 2,850.96 3.61% K Garage Ltd. 2,680.00 3.39% Yasuyuki Rokuyata 2,492.70 3.15% Mitsui Asset Trust and Banking Company, Limited. (Local Custodian: Japan Trustee Services Bank, Ltd.) 2,000.00 2.53% Narihiko Yoshida 1,430.00 1.81%
Total 53,462.51 67.66% Note: 1. One share was split into two shares on December 31, 2006.

- 31 -
Digital Garage, Inc. Yamazaki Building, 2-43-15 Tomigaya, Shibuya-ku,
Tokyo 151-0063, Japan http://www.garage.co.jp/en/index.html