Embed Size (px)
Citation preview
HOW DO SHAREHOLDERS RESPOND TO DOWNSIZING? A META-ANALYSIS
Gunther CAPELLE-BLANCARD EconomiX, Université Paris X Nanterre and Panthéon Sorbonne Economie
Nicolas COUDERC Reims Management School and Panthéon Sorbonne Economie
Massive layoffs announcements often attract extensive media coverage. Beyond the newsworthiness of
such events, is such a decision in any way correlated to the company’s stock market performance? Do
some firms resort to massive layoffs simply to please shareholders? In this paper, we offer a thorough
review of the literature in an attempt to answer these questions. The core of the paper is a meta-analysis.
We show that layoffs announcements have an overall negative effect on stock market prices, and this
remains true whatever the country, the period of time or the type of firm considered. However, some
factors may ease as well as worsen the stock market’s reaction to such announcements. The reason for the
layoff decision is among the most decisive factors and the market sanction will be more severe in the case
of defensive layoffs (taken by firms facing difficulties) than for offensive layoffs (when they are part of a
more general reorganization strategy).
Key words: Massive layoffs, Downsizing, Corporate Social Responsibility, Socially Responsible Investing,
Corporate Governance, Event studies
___________________________________________________________________
1. Introduction
Massive layoffs announcements often make newspapers headlines and trigger off heated debates
which are frequently tainted with ideological considerations. Company managers, more particularly,
often stand accused of carrying out redundancies where it has no economic necessity. Massive layoffs
are more readily accepted when companies post poor results which call the firm’s own survival into
question. However, it is a totally different story when a firm displays all the signs of good health. It
nevertheless remains true that companies tend to turn more and more regularly to redundancy plans as
the first step in their downsizing policies (Baumol, Blinder and Wolf, 2003; Farber, 2003). Some will
then accuse company managers of taking a short-term view with the only objective of boosting the
firm’s short-term gains on the stock-exchange for the sole benefit of shareholders who could not care
less about the firm’s fundamentals. Yet, that is a judgment which runs contrary to all economic logic
because it implies that shareholders are mere myopic, if not blind, agents who disregard all economic
fundamentals when they assess a firm’s future prospects.
Over the past twenty years, more than forty empirical studies have looked into the impact of
massive layoffs on companies’ market value. Those studies cover about 15,000 layoffs announcements
over the 1970-2001 period in over a dozen industrialized countries. The method adopted is always that
of event studies. Although the technique is consistent throughout, each study concerns different
samples, so it is rather difficult to attempt any summarizing of all this since one can only get diverging
results. Worell, Davidson and Sharma (1991), Caves and Krepps (1993), Farber and Hallock (2004) as
well as others conclude to a negative market reaction, whereas Chatrah, Ramchander and Song (1995)
or even Palmon, Sun and Tang (1997) come to the exactly opposite conclusion. It must be added that a
large number of authors point out that market reaction can differ widely depending on which country,
period of time or economic situation, etc. is considered. It is then difficult to form an accurate opinion.
This paper resorts to meta-analysis to summarize all the empirical studies. Although meta-
analysis is as yet relatively rarely used in economics and management science, this synthesizing
quantitative method of reading the existing literature can yield most fruitful results. It offers a rigorous
analysis framework which facilitates the reading of the abundance of empirical results available. Meta-
2
regressions are particularly rich sources in so far as they allow a clear analysis of which among the
characteristics relating to the sample or to the methodology selected bear the greatest impact on the
conclusions. Besides, meta-analysis also allows to override the limitations — e.g., subjectivity,
selection bias etc. — that dominate the qualitative literature. This becomes of utmost importance when
dealing with such a sensitive a topic as the present one. And finally, meta-analysis helps to identify
which future research developments appear the most promising.
The paper is organized as follows. Section 2 is a reminder of the consequences that redundancies
may have on companies. Naturally, these consequences very much vary to the point of having
sometimes contradictory effects. Whenever a firm warns that it will have to resort to massive layoffs,
it is never easy to understand why. Section 3 looks into the investors’ reactions, which depend less on
the actual wording of the announcement as such but more on the type of signal sent to the market,
which includes external elements such as the firm’s public relations strategy on financial issues, the
prevailing economic and social climate, etc. The question then becomes of an essentially empirical
nature since it is about assessing how investors decipher layoffs announcements in the short term. The
core of the paper is therefore a meta-analysis, whose data and methodology are given in section 4.
Section 5 presents and discusses the results. Section 6 concludes.
2. What do companies gain from redundancy plans?
2.1. The reasons behind layoffs
It is not possible to consider the consequences of a layoff plan independently from the reasons that
first prompted the company to put it in place. The reasons that may cause a firm to implement a layoff
plan can be said to fall into three categories.1
The first case is the most simple. The company may wish to decrease its payroll after a fall in
demand. The redundancy decision is not necessarily made at the very moment when the firm is under
financial stress, nor even when it is overstaffed but can simply be taken as a preemptive move. The
decrease in demand may indeed be caused by many reasons. It can either be due to the company itself 1 See Pfann (2001) for a theoretical model. Following Blackburn (1999), we could also have added some
sociological or ideological reasons.
3
— because of production overcapacity, a failed commercial strategy or if the firm cannot produce at
competitive prices — or to some macro-economic reasons, such as a slowdown in growth, for
example. In all these situations, the layoffs can be described as “defensive” as they are meant to help
the firm balance its costs with its anticipated or current decreasing profits. In general, this type of
redundancy is “global” in reach since it indiscriminately affects more than one, if not all, of the
company’s sites or services.
Resorting to a layoff procedure does not always constitute an aim in itself. It can also be the
flexible means the firm needs so that it can adapt to fluctuating demand. The firm then does not aim so
much to reduce its payroll as to make it more adjustable. Most of the time, the company will
externalize one or more services. Many experts on management theories and industrial organization
issues are therefore dedicated followers of the “small is beautiful” saying — which was very much in
vogue in the 1980s. Thus, Womack et al. (1991) introduce the lean production concept and emphasize
the importance of keeping production units small-sized, reactive and changeable. Other such highly
normative management theories favouring supposedly value-creating redundancies could also be
quoted, like in Neinstedt (1989) or Hendricks (1992) — who replaces downsizing with rightsizing on
the assumption that laying off workers cannot be but beneficial in all circumstances… The firm may
also find it advantageous to lay off permanent contract workers and replace them — albeit sometimes
by stint of twisting labour laws and regulations — with temporary contract workers or even agency
workers as the extra cost incurred is made off by the net gain achieved in a more flexible manpower.
Finally, the decision to resort to massive redundancies can also form part of the firm’s more
general reorganisation program (Ofek, 1993). These are called “offensive” redundancies because they
generally target only a few services or sites. A redundancy plan as part of the firm’s reorganization
program is called for when: i) the firm is seeking to improve its internal communications system,
improve and shorten the decision-making process and reduce the number of management positions
and that of duplicated jobs (Carroll, 1994); ii) the firm wishes to refocus its activities on its most
profitable sectors and therefore must close down the less profitable subsidiaries or modify the way
they are organized; iii) the firm has found a means of reducing production costs. In other words, the
4
company will then use less work, less-skilled work or less costly work (through, for example, the
delocalization of some productive sites to lower-wage countries).
2.2 Redundancy costs
Whatever their reasons for laying off workers, companies always incur high costs in the process.2
Direct costs are the most obvious as, in all cases, redundancy procedures entail workers’ compensation
or reclassification, possibly also production reorganization and the hiring and training of new workers.
Besides, the company will most probably also have to deal with the negative impact of
redundancy plans on the morale of workers who then feel there has been a breach in the confidence
contract which bound them to the firm (Rousseau, 1985, 1995; Rust et al., 2005).3 The company must
be prepared to accept that from then on relations with workers and trade unions will become tenser,
possibly on a long-term basis. Most of the time, it results in overall demotivation and/ or it creates a
feeling of unfairness among workers, of increased job insecurity and stress, a decreased commitment
to the firm’s objectives and its management team etc., all of which lead to lesser workers’ loyalty and
hence flexibility. Payroll reduction is therefore often associated with productivity losses (Foulkes and
Whitman, 1985; Brockner et al., 1987; Brockner et al., 1992; Baily, Bartelsman and Haltiwanger,
1996; Capelli, 2000) which all add up to the original costs of the redundancy plan. Although these
“indirect” costs may be difficult to measure, they are not entirely ignored by investors and can
therefore induce a negative reaction from the markets.
Corporate tensions sometimes lead to litigation since, in many countries, labour laws and
regulations provide for workers’ legal action. Even though workers rarely seek the direct annulment of
a redundancy plan — because the courts seldom oppose layoffs programs — they sometimes win a 2 It must be noted that Bentolila and Bertola (1990) consider that the costs incurred tend to keep the number of
redundancies down — and thereby raise employment at macro-economic level — whereas Pfann and Palm
(1993) conclude that the costs only slow down the company’s staff adjustment process. 3 It can also be argued that the workers who keep their jobs may seize new opportunities after the dismissal of
their fellow workers and are therefore incited to become more efficient. Except if the redundancy plan is
combined with some wide-sweeping reform of the workers’ pay structure — including the introduction of
variable incentives into workers’ pay, the generalized use of worker participation plans and stock options — we
do not feel that this constitutes a convincing argument.
5
case on procedural or irregularity grounds. Whether successful or not, these legal procedures take a
long time and are costly for firms.
Social disputes may arise when redundancy negotiations end up in deadlock (Fowker, 1998). The
cost of such disputes is often high for both the firm and its shareholders. Becker and Olson (1986), for
example, have estimated that a strike involving over 1,000 workers may cost the company an average
of 80 million dollars (see also Ruback and Zimmerman, 1984; Kramer and Vasconcellos, 1996;
Kramer and Hyclak, 2002).
Massive redundancy plans may also affect the firm’s brand image, and consequently damage
future profits. Workers now readily turn to the media to call for the boycott of their company.
Although these campaigns are becoming more and more frequently used — especially in the U.S. —
their actual efficiency remains hard to prove.
Finally, it must be added that layoffs plans carry risks not just for the firm but for its management
team too. Although it seems that management pay is enhanced by redundancy plans (Brookman,
Chang and Rennie, 2005), at the same time, managers also become more likely to lose their jobs
(Billger and Hallock, 2005). However research in that field remains patchy, so the results still need
confirming.
3. How do investors perceive redundancy plans?
A firm’s market capitalization changes reflect investors’ anticipation of the company’s future profit
prospects. If the expected ambivalent impact of redundancies on labour costs and the firm’s productive
efficiency is to be considered, one cannot really demand a one-way response to redundancy
announcements from financial markets. Because of this ambiguity, the context in which the
redundancy plan is announced as well as the reasons given by the management for implementing it are
of utmost importance. When announcing a layoffs plan, the firm usually has to disclose information
that was hitherto unknown to the general public concerning, among other things, the firm’s financial
health, its perspectives or its determination to push through a certain number of reforms etc. In other
words, a redundancy plan announcement is more like a signal sent by the firm to financial markets.
6
The type of financial information passed on to the public when announcing a redundancy plan is
therefore essential in so far as it influences how markets will interpret it.
Markets will receive a positive signal when they consider that the firm is in good financial health
and that the announcement is part of a wider reorganization program. The layoffs plan will then
probably be interpreted as the proof that the firm is trying hard to become more efficient. This is
referred to as the pure efficiency hypothesis (Lin and Rozeff, 1993).
Conversely, if the company is in a more delicate situation, the markets will probably receive a
negative signal because they will interpret this as the proof that the firm is facing real difficulties with
lower growth and demand opportunities than anticipated (Worell, Davidson and Sharma, 1991). This
is referred to as investment decline (Elayan and al., 1998) or demand decrease (Lin and Rozeff, 1993).
The signal effect plays an even more important role when one leaves aside the efficient market
paradigm: if enough investors believe in the convention by which shareholders usually benefit from
layoffs by the firm, their reactions become biased and the signal sent by a redundancy announcement
no longer needs any rational basis. The stock market price of the firm laying off staff will then
increase simply because some investors — a large number of them — are convinced this is good news.
Paradoxically, the more negative noise is made around redundancies designed to please shareholders,
the more widespread the knowledge of their existence becomes and consequently the potential belief
in the convention becomes reinforced. This is an illustration of Keynes’s intuition about self-fulfilling
anticipations. Naturally, the existence of such a convention remains to be proven, yet it seems hardly
probable because it is non-viable. As shown in the next section, the convention cannot be validated
empirically.
In sum, the overall effect of redundancies on shareholders’ wealth depends on the accumulation
of several factors, both objective (the company’s economic situation and its reasons for implementing
the redundancy plan) and subjective (how the markets perceive the company’s future prospects and
how they interpret the signal sent by the firm concerning the layoffs plan). A redundancy decision may
increase the company’s profitability because of the consequent decrease in payroll costs and it can
lead to improvements in overall efficiency through reorganization, but at the same time, layoffs can
also have a negative impact because of worker demotivation and they may also cause a drop in
7

demand to the firm. Organizing the different factors by importance and work out their net effect is
obviously an empirical issue.
4. Methodology
This section first presents the sample of the studies selected (4.1). They all use the event studies
technique which is briefly recalled (4.2). The principles of meta-analysis are then presented (4.3) and
followed by a description of the variables used in this study (4.4).
4.1 The studies selected
We have reviewed 41 studies dated 1996 to 2006 which examine the financial markets’ reaction to
staff reduction announcements — i.e. both redundancy plans and plants closures (see Table A in
appendix). Over the period, the interest for the topic has never flagged: more than half of the studies
are dated post 1997, one quarter post 2000. These studies span over three decades (1970-2001), they
cover in all 14 countries and around a total of 15,000 announcements.
To review the studies, we did a key-word search — e.g., “layoff”, “downsizing”, “Reduction-in-
force”, “RIF”, “plant closure” “restructuring” — in the major economic databases like JSTOR,
Econlit, Science Direct, RepEc (IDEAS), NBER, CEPR and SSRN. After this first selection of papers
relevant to our study, we systematically exploited their bibliographic references so as to complete our
research and make sure that our review was as thorough as possible. No a priori filter was used
concerning the date or type of publication. To the studies closely related to redundancy
announcements we added those on site closures. However we did not retain studies on delocalization
schemes or abandoned projects — even though those types of programs most often also include
redundancies — because those announcements convey multi-dimensional information whose effects
can hardly be distinguished. Out of the 41 studies selected, 32 are published in academic journals, 2
are colloquium proceedings, 6 are working papers and 1 is part of a collective publication.4 For
4 In the course of our bibliography search, we came across the not yet published PhD thesis by Nemec (1997)
which we have unfortunately been unable to have access to.
8
clarification purposes, we use abbreviated references in the rest of the paper, for example, Abraham
and Kim (2004) is referred to as [AK]. Each study’s full references can be found in the bibliography.5
4.2 The event studies technique
All the studies considered use the event studies technique and our own approach is therefore consistent
in so far as it avoids the pitfall of the main criticism levelled at meta-analysis, i.e. the “apples and
oranges” confusion (Glass and al., 1981).
The event studies technique rests on the postulate that financial markets immediately incorporates
all the public information available — Fama’s semi-strong efficiency hypothesis. According to this
postulate, stock prices constantly mirror the actualized value of the company’s future anticipated
profits, which allows for the assessment of the impact of any new information on these anticipations.
The thrust of the event studies method comes from its being an assessment by very many investors
whose very major activity consists in judging companies’ decisions and the environment in which they
operate, etc.
Although numerous improvements have been added since Fama and al. (1969), the basic
principles have barely changed and its statistical properties are more than widely recognized
(MacKinlay, 1997). Investors’ reactions to new information — the announcement of a redundancy
plan, in our particular instance — can be simply measured by comparing the observed return with the
theoretical return that would have occurred in the absence of the new event. The return differential is
referred to as “abnormal return”. The average effect can be derived by aggregating the return in the
time and/ or space of the companies concerned. When the abnormal return is markedly positive, it
shows that the market has received the announcement favorably and it is the reverse in the case of a
negative return.
5 Some of the selected studies are by the same authors and yet concerns close but distinct samples at a several
years interval: they are [FH99] and [FH04] as well as [HMS01] and [HMS04]. In both cases, the second study
is the continuation of the first on an extended time period. As recommended by Stanley (2001), we have found it
interesting to include both the first and second studies.
9
4.3 The meta-analysis
Meta-analysis is an econometric technique used in academic journals. It is most particularly common
in medicine and biology. It has been gradually more and more used in economics since the early 1990s
— see Stanley (2001) for a formal presentation.6
Owing to meta-analysis, it becomes possible to summarize, aggregate and make comparable the
empirical results from different studies. Each of the studies is original in so far as it bears on a
different sample and period of time. It does not either use the same evaluation technique or the same
explanatory variables. It is therefore always particularly awkward, if not impossible to come to overall
conclusions when one refers only to a qualitative review of the literature. With meta-analysis, in
contrast, the differences between different studies’ results can be considered and combined through a
ceteris paribus reasoning. So, according to Glass, McGaw and Smith (1981), “the findings of multiple
studies should be regarded as a complex data set, no more comprehensible without statistical analysis
than would hundreds of data points in one study”.
Compared to a purely qualitative journal, meta-analysis provides a common treatment for all the
studies on a given topic, whereas the other academic summaries only consider a few papers since it is
too difficult to synthesize the results from too many surveys. Finally, meta-analysis permits to focus
on the specific characteristics that most influence results.
4.4 The variables
Usually, it is necessary to convert the results from different studies into a single metric measure. It was
not required here since all the selected studies consider cumulative average abnormal returns (CAAR),
which are perfectly comparable from one evaluation to the next. The event window results from an ad
hoc decision and may vary from one study to the next. We mainly selected the CAAR for the [-1; +1]
period as an explanatory variable. Our tests then comprise 165 observations for 34 studies (panel A).
6 In the course of our research we came across a working paper on the relations between staff reductions and
company performance (Allouche, Laroche and Noël, 2006). This independent study from ours, adopted a
different methodological approach. Besides, that initial sample comprised 27 studies (as opposed to 41 in ours)
and the regressions concerned between 9 and 62 observations whereas we looked at between 165 and 434.
10
In order to maximize the number of observations, the CAARs calculated on the [-1; 0] and [0; +1]
interval are added. This then gives 228 observations for 34 studies (panel B). Finally, to serve as
robustness tests, we build another 3 panels with calculated CAARs for the [-10; +1] and [-1; +10] and
[-10; +10] intervals.
Nineteen explanatory variables have been retained (see table B in appendix for the usual
descriptive statistics). Like Stanley and Jarrell (1998), we decided to keep a large number of variables,
even though only a few of them will appear to have any significant impact.
Some authors focus on the change over time of the market reaction to redundancy announcements
([CRS], [FH04] or [MLC]). So we introduce two dummies: Period _80 = 1 when the middle of the
period is within the 1980’s decade, and 0 otherwise; Period_90 = 1 when the middle of the period is
within the 1990’s decade, and 0 otherwise; the 1970’s decade becomes the reference period when
taking these two variables into account.
Some analysts also propound the idea of some US, or more widely speaking, Anglo-American
specificity concerning markets’ reactions to layoffs announcements. This calls for the introduction of
yet another dummy variable: Non_Anglo = 1, when the sample comprises non Anglo-American
companies.
The great majority of studies seeking to explain stock markets’ reactions concentrates on the
reasons for redundancy plans. As each study draws up its own list of reasons, we need to put up a
reclassification structure to harmonize the different papers’ categories. Thus, in some studies,
profitable companies are opposed to those facing difficulties, while in others, the opposition is
between companies for which layoffs plans are part of an overall reorganization program and those for
which it is not.7 We simplify the issue by considering two possible attitudes for the firm, as is the case
both in the theoretical and empirical academic literature: a proactive, or voluntarist attitude —
although the company is not facing financial difficulties, it resorts to reorganization and redundancies
7 The selection process becomes easier when the authors decide to make the distinction between two categories,
although it is not always the case. [HMMW] is a telling example of the difficulties inherent in this type of
reclassification exercise. The authors distinguish five reasons: loss-making activities, fall in demand, cost
cutting, reorganization, plant closure. We put the first two items in the Reactive category, the following two in
the Proactive category and we decided to ignore the last.
11
to become more efficient and more profitable; a reactive attitude, which follows the tide of events —
the firm reacts to changes in its environment (a fall in demand, financial problems etc.) and lays off
workers under more or less high pressure. The Proactive dummy variable = 1 when the sample
comprises firms about which the authors of the studies think that they adopt a proactive attitude. The
zero value corresponds to two different types of observations. It is used both for the samples of firms
considered as “reactive” by the author of the study and for the samples that comprise firms for which
no specific information is provided. Besides, the Reactive dummy variable = 1 when the sample
comprises firms about which the authors of the study think they adopt a reactive attitude. As
previously stated, the zero value implies that the firms in the sample adopt a proactive attitude or that
no information is supplied about them.8
Furthermore, experts in company strategy have pointed out that several variables may influence
the markets’ interpretation of redundancy announcements. The following variables are worth
mentioning:
- The size of the redundancy: Strong_reduc = 1 when the sample comprises companies which
announce a redundancy plan involving a large number of workers, and 0 otherwise; Low_reduc =
1 when the sample comprises companies which announce a redundancy plan involving a small
number of workers, and 0 otherwise. It must again be added that different authors adopt different
criteria. For example [ESMS] or [HMMW] divide their initial sample into two parts on the basis
of the redundancy median rate; others decide on a ad hoc specific threshold — 12% for [CD] and
10% for [HMS02], for example.
- The fact that there is one or several plans: First_redund = 1 when the sample comprises firms
which announce a redundancy plan for the first time, and 0 otherwise; Second_redund = 1 when
the sample comprises firms which have already announced redundancy plans, and 0 otherwise.
8 It must be noted that this type of classification exercise knows one limitation. Most studies rely on the press for
their information on redundancy announcements. Yet, press articles may be influenced by the way markets
receive the announcements. A journalist who learns about a negative (or a positive) market reaction will then be
tempted to interpret the company’s attitude as defensive (or offensive). One solution to this problem consists in
considering only the press announcements released before market reactions become known, although this would
considerably decrease the number of events that can be exploited.
12
- The staff reduction mode: Volunt_depart = 1 when the sample comprises firms for which the
percentage of workers’ voluntary departures from the company is high, and 0 otherwise;
No_volunt = 1 when the sample comprises firms for which the percentage of workers’ voluntary
departures from the company is low or non-existent, and 0 otherwise — e.g. [MLC]. The
Temp_depart and Perm_depart as well as the TU and No_TU variables are added to take account
of the temporary or permanent nature of the staff reductions — e.g. [FH04], [Lee], [LR] — and
of the existence or absence of an agreement with trade union workers — e.g. [CD].
- The type of workers concerned: White_coll = 1 when the redundancy plan affects a large
proportion of the executive workers, and 0 otherwise — e.g. [CK] or [CMSY.]
- Closure = 1 when the staff reduction announcement involves a site closure, and 0 otherwise —
[CK] [FH99] [FH04] [HMMW] consider sub-samples for the firms concerned.
- Provisions = 1 when the firm announces that it is making financial provisions to complement the
redundancy plan, and 0 otherwise — e.g. [CK].
- Finally, we also add two extra variables relating not to the redundancies but to the studies.
Dum_WP = 1 when the study is a working paper, and 0 if it has been published in a peer-
reviewed journal. Nb_event variable corresponds simply to the number of events associated with
each observation, as a means to test the existence of any particular bias that may affect the studies
covering only few events.
Meta-analysis also requires the estimated standard deviation in addition to the average cumulative
abnormal return. Some studies provide: i) the standard deviation directly, ii) the associated t- or z-
statistics, iii) just the significativity threshold, iv) no indication at all. For case ii), it is easy to
recalculate the standard deviation. For case iii), when results are significant — at a 1%, 5% or 10%
threshold — we use the maximum standard deviation compatible with the significativity threshold.9 In
sum, we have, for panel A, the standard deviation associated with 130 CAAR [-1 ; +1] on 165. It must be
noticed that the majority of observations — 50.9% — are drawn from working papers although they
9 This is the case for eight CAAR; these implicit standard deviations are not used in the publication bias tests.
13
only make up 6 out of the 41 studies reviewed. As a rule, working papers have fewer constraints
regarding the number of regressions presented.
Table D in appendix gives the details of the matrix of crossed correlations between variables. It
must be noted that, except for couples Period_80 and Period_90 (= 0.79) as well as Dumm_WP and
Nb_event (=0.60), no correlation is over 40% in absolute value.10
5. The financial markets’ reaction to layoff announcements
5.1 The overall negative impact of redundancy announcements
Redundancy announcements have an overall negative impact on the stock price of the companies
involved. The main methodological elements and results study by study are given in table A in
appendix.
Let us first describe the main results for each study — the vote-counting method. For the time
being, only the results for full samples are considered, i.e. combining both reactive and proactive
firms. Out of the 41 studies reviewed, the average cumulative abnormal return over a three days period
around the announcement ranges from –3.61 for [CD] and 1.68% for [CC]. In 14 out of 36 cases, the
overall effect is significantly negative at a 10% threshold. In the other cases, the results are non-
significant — or supplied without any further detail. No study comes up with a significantly positive
CAAR[-1 ;+1] for a sample combining reactive and proactive firms.
Let us now consider the overall results from these studies, including those from the sub-samples
and let us weight the results with their respective specificities. We here follow the most common
approach, namely that which weight each result with the inverse of its variance. Table 1 gives the
weighted average of the average cumulative abnormal returns over the three days around the day of
the announcement — panel A. This ranges between –0.185% and –0.225% depending on whether one
10 When the model is estimated without the Dumm_WP variable, results are the same as those given below. The
results can be obtained from the authors.
14
uses an estimation with fixed or random effects for each study. In both cases, the reaction is
significantly negative.11
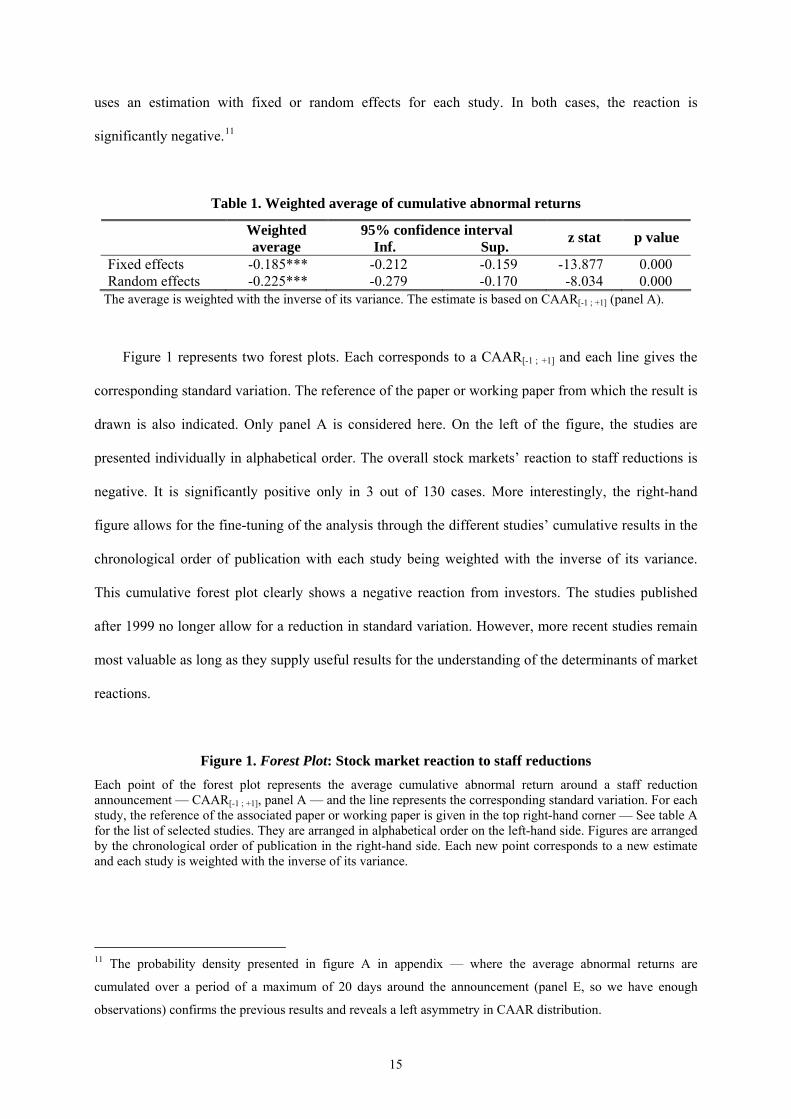
Table 1. Weighted average of cumulative abnormal returns
95% confidence interval
Weighted average Inf. Sup. z stat p value
Fixed effects -0.185*** -0.212 -0.159 -13.877 0.000 Random effects -0.225*** -0.279 -0.170 -8.034 0.000
The average is weighted with the inverse of its variance. The estimate is based on CAAR[-1 ; +1] (panel A).
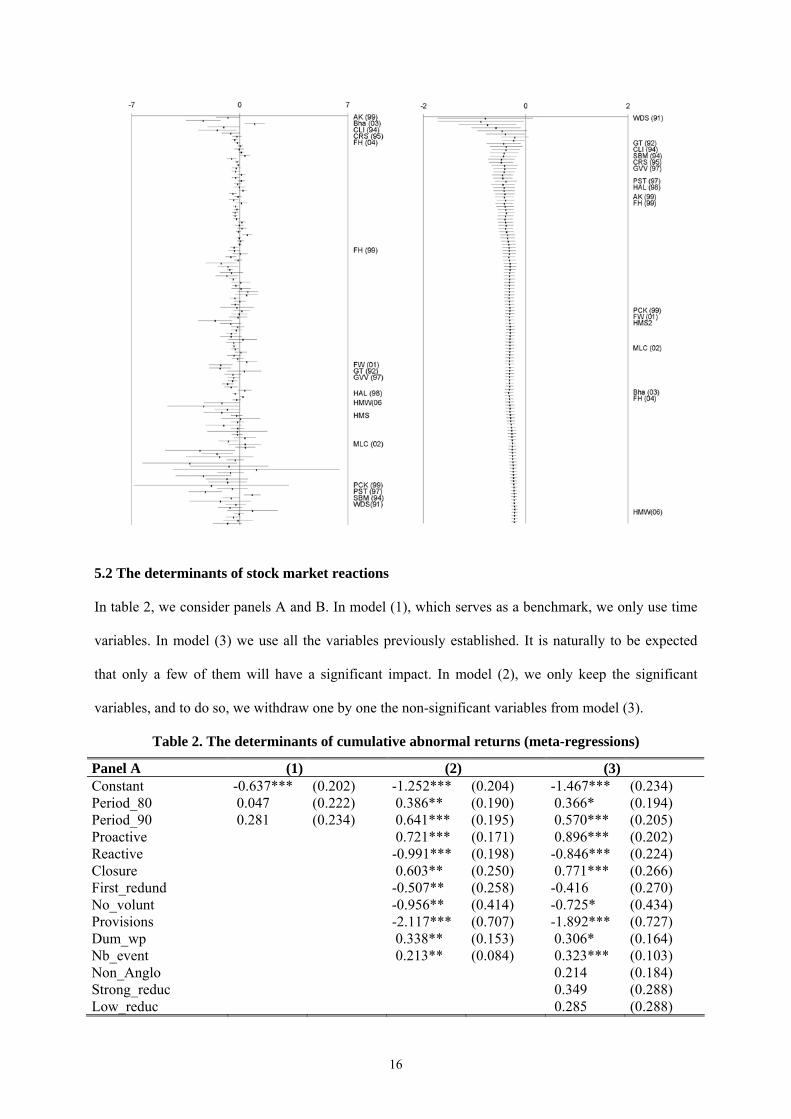
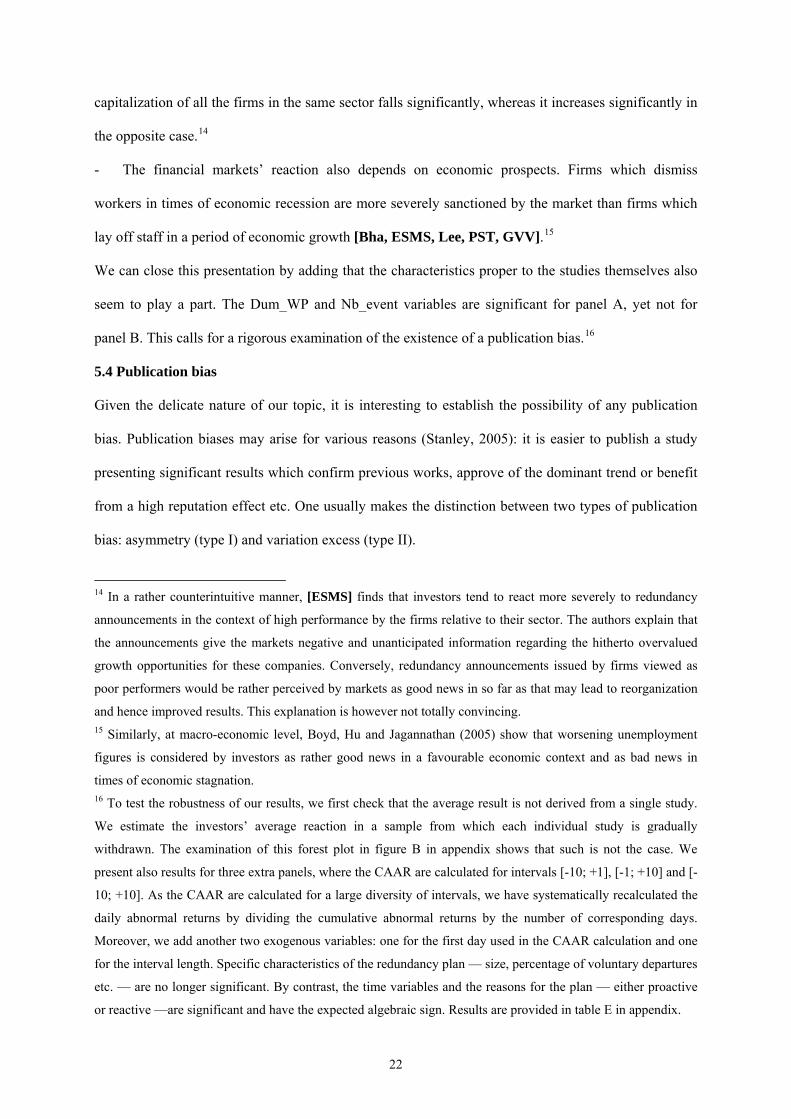
Figure 1 represents two forest plots. Each corresponds to a CAAR[-1 ; +1] and each line gives the
corresponding standard variation. The reference of the paper or working paper from which the result is
drawn is also indicated. Only panel A is considered here. On the left of the figure, the studies are
presented individually in alphabetical order. The overall stock markets’ reaction to staff reductions is
negative. It is significantly positive only in 3 out of 130 cases. More interestingly, the right-hand
figure allows for the fine-tuning of the analysis through the different studies’ cumulative results in the
chronological order of publication with each study being weighted with the inverse of its variance.
This cumulative forest plot clearly shows a negative reaction from investors. The studies published
after 1999 no longer allow for a reduction in standard variation. However, more recent studies remain
most valuable as long as they supply useful results for the understanding of the determinants of market
reactions.
Figure 1. Forest Plot: Stock market reaction to staff reductions Each point of the forest plot represents the average cumulative abnormal return around a staff reduction announcement — CAAR[-1 ; +1], panel A — and the line represents the corresponding standard variation. For each study, the reference of the associated paper or working paper is given in the top right-hand corner — See table A for the list of selected studies. They are arranged in alphabetical order on the left-hand side. Figures are arranged by the chronological order of publication in the right-hand side. Each new point corresponds to a new estimate and each study is weighted with the inverse of its variance.
11 The probability density presented in figure A in appendix — where the average abnormal returns are
cumulated over a period of a maximum of 20 days around the announcement (panel E, so we have enough
observations) confirms the previous results and reveals a left asymmetry in CAAR distribution.
15
5.2 The determinants of stock market reactions
In table 2, we consider panels A and B. In model (1), which serves as a benchmark, we only use time
variables. In model (3) we use all the variables previously established. It is naturally to be expected
that only a few of them will have a significant impact. In model (2), we only keep the significant
variables, and to do so, we withdraw one by one the non-significant variables from model (3).
Table 2. The determinants of cumulative abnormal returns (meta-regressions)
Panel A (1) (2) (3) Constant -0.637*** (0.202) -1.252*** (0.204) -1.467*** (0.234) Period_80 0.047 (0.222) 0.386** (0.190) 0.366* (0.194) Period_90 0.281 (0.234) 0.641*** (0.195) 0.570*** (0.205) Proactive 0.721*** (0.171) 0.896*** (0.202) Reactive -0.991*** (0.198) -0.846*** (0.224) Closure 0.603** (0.250) 0.771*** (0.266) First_redund -0.507** (0.258) -0.416 (0.270) No_volunt -0.956** (0.414) -0.725* (0.434) Provisions -2.117*** (0.707) -1.892*** (0.727) Dum_wp 0.338** (0.153) 0.306* (0.164) Nb_event 0.213** (0.084) 0.323*** (0.103) Non_Anglo 0.214 (0.184) Strong_reduc 0.349 (0.288) Low_reduc 0.285 (0.288)
16
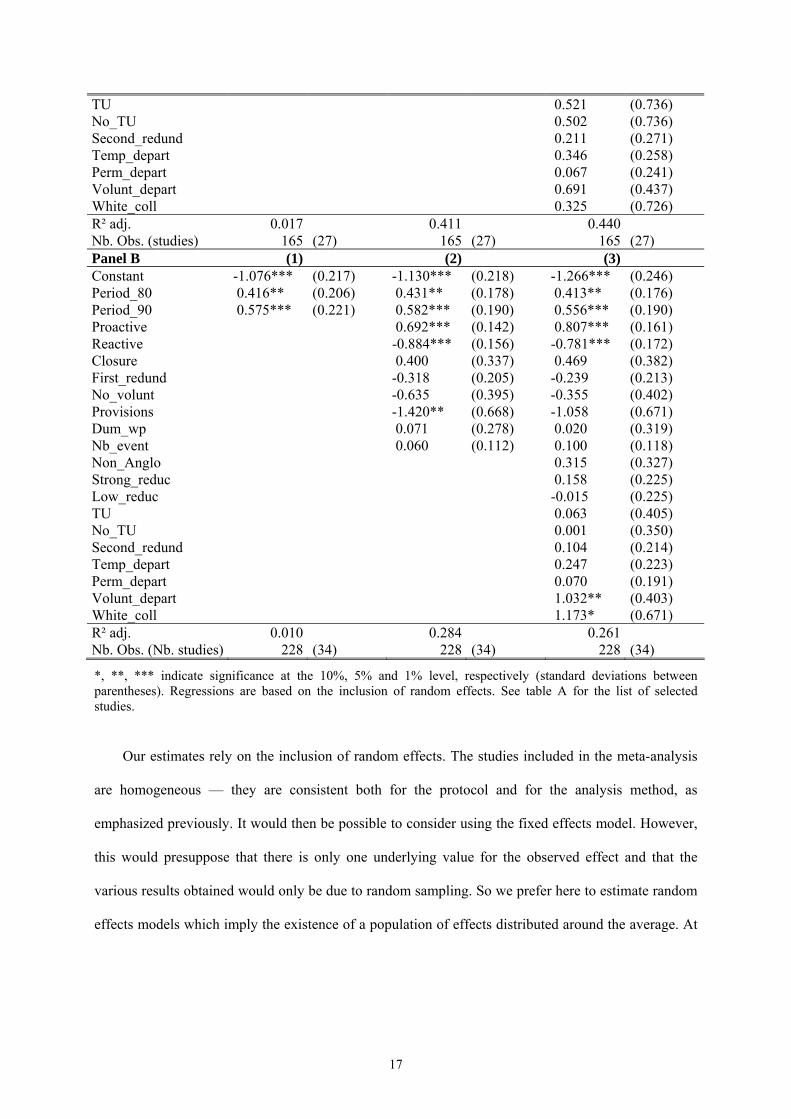
TU 0.521 (0.736) No_TU 0.502 (0.736) Second_redund 0.211 (0.271) Temp_depart 0.346 (0.258) Perm_depart 0.067 (0.241) Volunt_depart 0.691 (0.437) White_coll 0.325 (0.726) R² adj. 0.017 0.411 0.440 Nb. Obs. (studies) 165 (27) 165 (27) 165 (27) Panel B (1) (2) (3) Constant -1.076*** (0.217) -1.130*** (0.218) -1.266*** (0.246) Period_80 0.416** (0.206) 0.431** (0.178) 0.413** (0.176) Period_90 0.575*** (0.221) 0.582*** (0.190) 0.556*** (0.190) Proactive 0.692*** (0.142) 0.807*** (0.161) Reactive -0.884*** (0.156) -0.781*** (0.172) Closure 0.400 (0.337) 0.469 (0.382) First_redund -0.318 (0.205) -0.239 (0.213) No_volunt -0.635 (0.395) -0.355 (0.402) Provisions -1.420** (0.668) -1.058 (0.671) Dum_wp 0.071 (0.278) 0.020 (0.319) Nb_event 0.060 (0.112) 0.100 (0.118) Non_Anglo 0.315 (0.327) Strong_reduc 0.158 (0.225) Low_reduc -0.015 (0.225) TU 0.063 (0.405) No_TU 0.001 (0.350) Second_redund 0.104 (0.214) Temp_depart 0.247 (0.223) Perm_depart 0.070 (0.191) Volunt_depart 1.032** (0.403) White_coll 1.173* (0.671) R² adj. 0.010 0.284 0.261 Nb. Obs. (Nb. studies) 228 (34) 228 (34) 228 (34)
*, **, *** indicate significance at the 10%, 5% and 1% level, respectively (standard deviations between parentheses). Regressions are based on the inclusion of random effects. See table A for the list of selected studies.
Our estimates rely on the inclusion of random effects. The studies included in the meta-analysis
are homogeneous — they are consistent both for the protocol and for the analysis method, as
emphasized previously. It would then be possible to consider using the fixed effects model. However,
this would presuppose that there is only one underlying value for the observed effect and that the
various results obtained would only be due to random sampling. So we prefer here to estimate random
effects models which imply the existence of a population of effects distributed around the average. At
17
any rate, when using the hypothesis of homogeneous studies, the estimation results for the random
effects model are similar to that of fixed effects.12
The constant, which represents the cumulative average abnormal return on the day of the
announcement for the reference category, varies from –0.64% to –1.74% according to the various
models. Yet, whatever the model or panel considered, the effect is significantly negative at a 1%
threshold.
Meta-analysis suggests that the average market reaction subsides over time, while always
remaining significantly negative. The coefficients associated to variables Period_80 and Period_90 are
indeed always positive, with the value of the first always inferior to that of the second. It must be
noted that four studies examine more specifically how market reactions evolved over time by
considering different sub-periods: the effect is non significant in 1980 just as in 1987 for [AMH]. For
[CRS] the impact is non-significant from 1981 to 1983 and from 1984 to 1990, although positive in
1991-1992. [FH99, FH04] conclude that investors’ reaction is becoming less and less negative,
whereas [MLC] comes to the opposite conclusion. Our own results confirm those of [FH99, FH04].
The type of country considered does not affect market reaction. The Non_Anglo variable is never
significant. We have also introduced dummy variables by country, but none of them — taken as a
whole or individually — is significant. These results do not confirm those of [CD] which is the only
study that is based on a sample of companies from many different countries and which gets significant
results for Anglo-American countries only. However these results tend to go the way of a more
detailed analysis of our sample. Besides, in Canada [GVV, UAS], in Great-Britain [Co, HMMW,
MLC] and in Japan [Lee], market reaction to redundancy announcements is negative on average and
equivalent to that observed in the United States. In France, shareholders do not derive any advantage
from staff reductions [HMS04]. In South Africa, market reaction is neither systematically positive not
systematically negative [Bha].
We have seen, at a theoretical level, that investors may well react very differently to redundancy
announcements depending on whether the measure is defensive or offensive. Most empirical studies
12 It has been checked by using extra regressions, not presented here.
18
have tried to take account of that possibility by either analyzing market reaction in different sub-
samples or by examining the determinants of abnormal returns (see table C in appendix).
Unsurprisingly, our meta-regressions confirm that the reasons given by firms or due to the context
play an essential part in investors’ reactions. The coefficients associated with the Reactive and
Proactive variables are always significant at the 1% threshold. The first is negative — between –
0.99% and –0.78% — which clearly shows that companies facing difficulties are more severely
sanctioned by shareholders. The second is positive — between 0.69% and 0.90%. In other words,
proactive firms — i.e. those which make it known that they intend to restructure and reorganize their
company — are less severely sanctioned.13 Yet, does that automatically imply that firms with
restructuring plans gain from laying off staff? Our studies tend to point to a negative answer. If model
(2) and panel A are taken as an example, the average cumulative abnormal return for proactive
companies is not significantly positive, whatever the time period.
The signal sent by the redundancy plan has therefore full impact, with either softening or
amplifying effects depending on the company concerned. We have previously been careful to attract
attention on the difficulties inherent in creating Proactive and Reactive variables. These results can
also be complemented by a qualitative analysis which broadly confirms what has been stated above.
Hence, the sanction is more severe when the firm’s financial health is perceived as poor. [WDS]
reveals, for example, that if the announcement occurs at a time when the company is in financial
distress, the cumulative abnormal return reaches –5.6%. By contrast, if the announcement is part of a
restructuring and reorganization plan by the firm, the cumulative abnormal return is +3.6% for the
reference period. Abnormal returns reach more negative levels when the company’s stock market price
has been falling over several periods of time ([LR]), since redundancies caused by a fall in demand
become more likely and the claim that the company is seeking improved efficiency less credible.
Some features of staff reductions or the size of the redundancy plan do not provide much
information on the reasons for the layoffs. Investors remain nevertheless sensitive to such data as they
13 It must be noted that all the studies except one ([IA]) show that reactive firms — those which resort to
redundancies under the pressure of current financial difficulties — suffer from much more markedly reduced
stock prices than proactive ones — those which use redundancies as part of more general reorganization strategy.
19
help them to form some opinion as to the extent of the restructuring required or of the difficulties
encountered. It is then no wonder that markets sanction more severely a firm’s first redundancy plan
announcement than those that may follow. Accordingly, the coefficient is negative and significant for
panel A and yet non-significant for panel B.
When the redundancy plan includes the closure of a site or a factory [SBM, GT], or production
delocalization [CGW], the firm’s stock market price will fall. With the exception of [HMMW],
studies show that market reaction is less severe when firms close down sites — abnormal return is
non-significant for [CMK, GT, SBM], the coefficients are non-significant or positive in table C, in
appendix for [CK, CGW, FH04]. Meta-regressions show a positive and significant coefficient at a 5%
threshold for panel A.
Investors are also wary of the announcements of provisions associated with redundancies, since
they perceive them as the sign of high anticipated costs. The associated coefficient is negative and
significant in panel A.
It is also to be expected that investors will sanction less severely firms that have included many
voluntary worker departures in the layoffs plan — see [MLC]. The No_volunt variable is significant
and negative for panel A, whereas the Volunt_depart variable is positive, although only significant for
panel B.
All the studies dealing with the topic suggest that staff reduction announcements have a greater
impact when they are permanent rather than temporary [CK, ESMS, FH99, Lee], or recurrent rather
than exceptional [GVV, WDS]. However, these effects are never significant in our regressions.
According to these studies, the actual impact of the size of the redundancy plan — which is
measured as a percentage of the number of workers laid off out of the total payroll, or by the relative
size of the plan — remains ambiguous. [CK, CH, FW, GVV, Lee] obtain a significantly negative
coefficient, whereas [Co, PCK] get the opposed sign. The meta-analysis show that the impact is in
fact non-significant.
Among all these studies, [CK] must be considered separately because of the number of variables
studied — presence of an agreement with a workers’ trade union or not, redundancies affecting white
collar workers or not, etc. We have included these variables in our meta-analysis, yet it must be added
20
that they are used in a few studies only. For [CK], the impact of redundancies is more negative when
blue collar workers are hit than when white collar workers are affected. It may come from the fact that
efficiency gains are higher when the reorganization of clerical tasks is at stake rather than of
production. When one considers the aggregate result of several sub-samples of firms, the effect is not
significant — except for Model 3, panel B and at a 10% threshold only. Surprisingly, the impact of the
existence of a deal between the firm and the trade unions is again, non-significant.
Other variables could not be included in our meta-regressions, most often because they are used
by too few studies and/ or because the samples considered are too small. A qualitative review of the
effects then becomes necessary.
- Markets react differently depending on whether the firm has a new leader — the reaction is more
negative when companies have not changed leaders recently [CH, CMSY]. More precisely, the impact
of the redundancy announcements is significantly positive when the leader comes from outside the
firm, non-significant when the new leader is an insider and negative when companies have kept the
same leaders [CH]. It is indeed more likely that a recently appointed leader from outside the company
will find it easier to carry out extensive restructuring than a leader that has been entangled in the firm’s
problems for a longer period of time…
- The impact of redundancies is not as strongly negative in the case of capital-intensive
manufacturing firms as it is for services firms whose added value is closely reliant on human capital
[ESMS].
- One may wonder whether a redundancy plan by a given company creates a transfer effect that
benefits its competitors, or conversely, if it sends the markets a negative signal regarding the whole
sector’s growth opportunities. The results seem to be contradictory. The transfer effect is broadly
negative for [ST] while positive for [MAB] — which studied the US banking sector — but non-
significant for Bhabra, Bhabra and Boyle (2004). Yet the latter add that, when the redundancy
announcement is accompanied by the mention of losses incurred by the company, the stock market
21
capitalization of all the firms in the same sector falls significantly, whereas it increases significantly in
the opposite case.14
- The financial markets’ reaction also depends on economic prospects. Firms which dismiss
workers in times of economic recession are more severely sanctioned by the market than firms which
lay off staff in a period of economic growth [Bha, ESMS, Lee, PST, GVV].15
We can close this presentation by adding that the characteristics proper to the studies themselves also
seem to play a part. The Dum_WP and Nb_event variables are significant for panel A, yet not for
panel B. This calls for a rigorous examination of the existence of a publication bias.16
5.4 Publication bias
Given the delicate nature of our topic, it is interesting to establish the possibility of any publication
bias. Publication biases may arise for various reasons (Stanley, 2005): it is easier to publish a study
presenting significant results which confirm previous works, approve of the dominant trend or benefit
from a high reputation effect etc. One usually makes the distinction between two types of publication
bias: asymmetry (type I) and variation excess (type II).
14 In a rather counterintuitive manner, [ESMS] finds that investors tend to react more severely to redundancy
announcements in the context of high performance by the firms relative to their sector. The authors explain that
the announcements give the markets negative and unanticipated information regarding the hitherto overvalued
growth opportunities for these companies. Conversely, redundancy announcements issued by firms viewed as
poor performers would be rather perceived by markets as good news in so far as that may lead to reorganization
and hence improved results. This explanation is however not totally convincing. 15 Similarly, at macro-economic level, Boyd, Hu and Jagannathan (2005) show that worsening unemployment
figures is considered by investors as rather good news in a favourable economic context and as bad news in
times of economic stagnation. 16 To test the robustness of our results, we first check that the average result is not derived from a single study.
We estimate the investors’ average reaction in a sample from which each individual study is gradually
withdrawn. The examination of this forest plot in figure B in appendix shows that such is not the case. We
present also results for three extra panels, where the CAAR are calculated for intervals [-10; +1], [-1; +10] and [-
10; +10]. As the CAAR are calculated for a large diversity of intervals, we have systematically recalculated the
daily abnormal returns by dividing the cumulative abnormal returns by the number of corresponding days.
Moreover, we add another two exogenous variables: one for the first day used in the CAAR calculation and one
for the interval length. Specific characteristics of the redundancy plan — size, percentage of voluntary departures
etc. — are no longer significant. By contrast, the time variables and the reasons for the plan — either proactive
or reactive —are significant and have the expected algebraic sign. Results are provided in table E in appendix.
22
5.4.1 Type I and type II publication bias
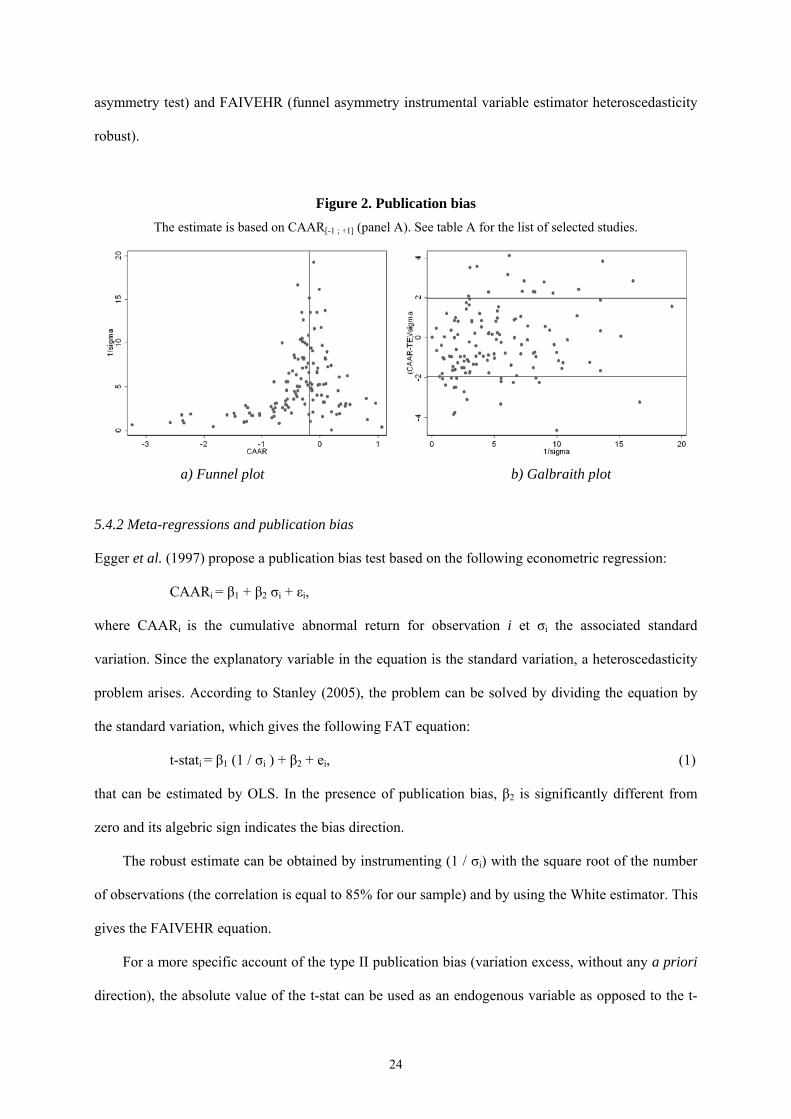
A graph is usually the simplest — and the most commonly used — method to detect the possibility of
a publication bias. A funnel plot must be built with the effect value on the x-axis — in our case, the
CAAR resulting from a staff reduction announcement — and a precision indicator on the y-axis — we
use here the inverse of the standard variation associated to the CAAR. In the absence of a type I
publication bias, the points on the graph must form a cloud of symmetrical points. If they do not, it
shows that authors, publishers, referees etc. tend to favour results that point in a specific direction.
Figure 2a represents the funnel plot built from panel A (the straight vertical line represents the average
value, weighted with the inverse of the variance). The shape is weakly skewed rather asymmetrically
to the left, which suggests the presence of a type I publication bias favouring a negative reaction to
massive redundancy plans on the part of investors.
In the absence of a type II publication bias, there should be no link between the coefficient given
by a study and its standard variation. Conversely, in the presence of a publication bias, the published
studies that have used only limited samples and which hence, have obviously wider standard
variations must post higher coefficients in absolute value so as to make up for this situation — these
higher coefficients can be obtained from the modification of the model’s specification, for example.
Like Stanley (2005), we use a Galbraith plot in order to detect the possibility of any variation excess.
We no longer plot the observed effects values but instead, those of the reduced centred values:
(CAARi – TE) / σi. where TE represents the « real » effect value, measured as the average weighted
with the inverse of the variance with fixed effects, namely TE = -0.185.
In the absence of a type II publication bias, the absolute values must not be over 1.96 in more
than 5% of cases. Yet, for panel A, these absolute values go over the 1.96 threshold in 33 out of 122
cases, which is way off the expected figure — see figure 2b. It therefore appears that for our topic,
same as for very many others, the studies with significant results (one way or the other) tend to be
over-represented.
Practical as they may be, these figures are subject to divergent interpretations. A more rigorous
method of dealing with publication biases requires the use of econometric tests, such as FAT (funnel
23
asymmetry test) and FAIVEHR (funnel asymmetry instrumental variable estimator heteroscedasticity
robust).
Figure 2. Publication bias The estimate is based on CAAR[-1 ; +1] (panel A). See table A for the list of selected studies.
a) Funnel plot b) Galbraith plot
5.4.2 Meta-regressions and publication bias
Egger et al. (1997) propose a publication bias test based on the following econometric regression:
CAARi = β1 + β2 σi + εi,
where CAARi is the cumulative abnormal return for observation i et σi the associated standard
variation. Since the explanatory variable in the equation is the standard variation, a heteroscedasticity
problem arises. According to Stanley (2005), the problem can be solved by dividing the equation by
the standard variation, which gives the following FAT equation:
t-stati = β1 (1 / σi ) + β2 + ei, (1)
that can be estimated by OLS. In the presence of publication bias, β2 is significantly different from
zero and its algebric sign indicates the bias direction.
The robust estimate can be obtained by instrumenting (1 / σi) with the square root of the number
of observations (the correlation is equal to 85% for our sample) and by using the White estimator. This
gives the FAIVEHR equation.
For a more specific account of the type II publication bias (variation excess, without any a priori
direction), the absolute value of the t-stat can be used as an endogenous variable as opposed to the t-
24
stat value. In our case, if a publication bias exists, it can move both ways. Authors are indeed, a priori,
as much tempted by results showing the investors’ negative reaction — when firms are thought as
reactive — as by results showing a positive reaction – when firms are thought as proactive. The
following equation can then be tested:
| t-stati | = β1 (1 / σi) + β2 + ui, (2)
In equation (1), the implicit hypothesis is that the « real » effect value is unique. In the absence of
publication bias, CAARi is only equal to β1 (average effect) plus sampling hazard. Yet in the previous
part, we highlighted a certain number of factors which influence significantly the markets’ reaction to
staff reduction announcements. Among other findings, we showed that the sample comprising reactive
firms produced a different effect from that of the sample comprising proactive firms. Thus it is
possible to consider a third equation to which the Reactive and Proactive dummy variables are
added.17
CAARi = β1 + β2 σi + β3 Reactive + β4 Proactive + ζi,
This equation can be modified like (1) and the model to be estimated now becomes:
t-stati = β1 (1 / σi ) + β2 + β3 Reactive + β4 Proactive + fi, (3)
The results for these various estimates are presented in table 3 (only the studies in panel A that
supply a standard deviation – that is 122 observations – are considered).
Table 3. Meta-regressions and publication bias
Model Estimate 1̂β 2β̂ R²
FAT -0.104*** (0.039)
-0.631*** (0.266) 0.055
Eq. (1) FAIVEHR -0.074
(0.075) -0.796*** (0.296) 0.050
FAT 0.089*** (0.028)
1.216*** (0.189) 0.077
Eq. (2) FAIVEHR 0.075
(0.060) 1.294*** (0.335) 0.075
17 The qualitative results are no different, when the other explanatory variables considered in the previous part
are also added.
25
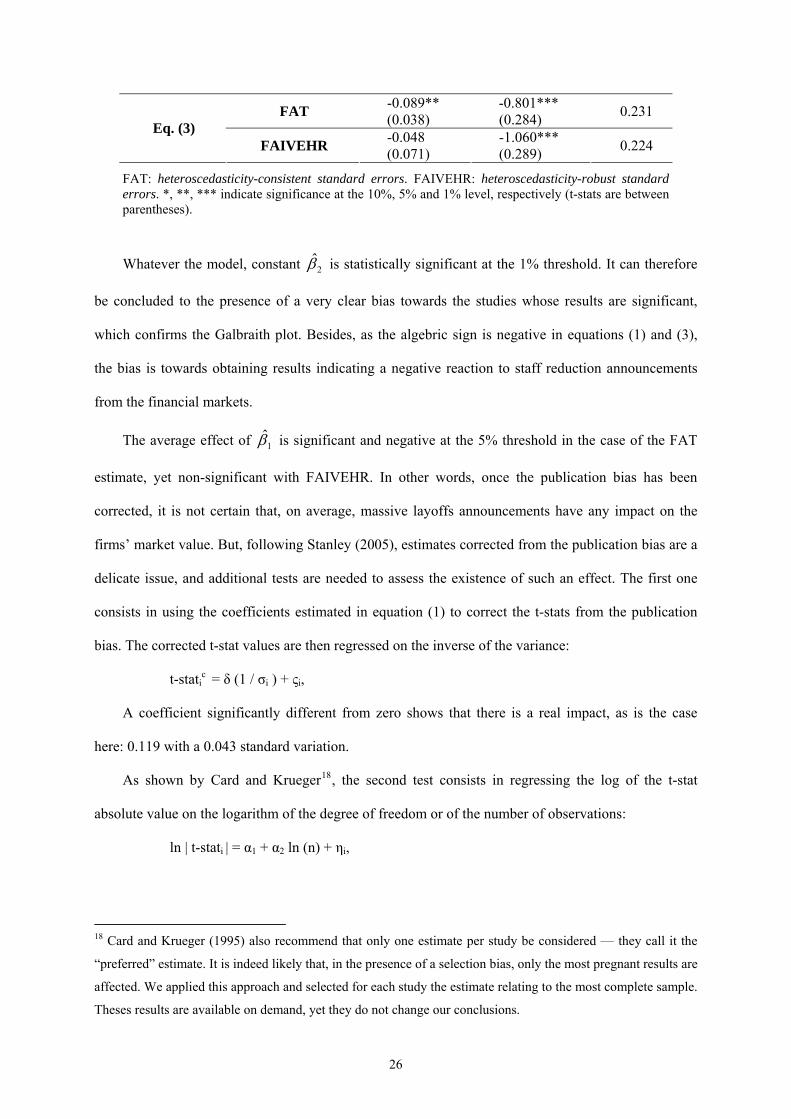
FAT -0.089** (0.038)
-0.801*** (0.284) 0.231
Eq. (3) FAIVEHR -0.048
(0.071) -1.060*** (0.289) 0.224
FAT: heteroscedasticity-consistent standard errors. FAIVEHR: heteroscedasticity-robust standard errors. *, **, *** indicate significance at the 10%, 5% and 1% level, respectively (t-stats are between parentheses).
Whatever the model, constant is statistically significant at the 1% threshold. It can therefore
be concluded to the presence of a very clear bias towards the studies whose results are significant,
which confirms the Galbraith plot. Besides, as the algebric sign is negative in equations (1) and (3),
the bias is towards obtaining results indicating a negative reaction to staff reduction announcements
from the financial markets.
2β̂
The average effect of is significant and negative at the 5% threshold in the case of the FAT
estimate, yet non-significant with FAIVEHR. In other words, once the publication bias has been
corrected, it is not certain that, on average, massive layoffs announcements have any impact on the
firms’ market value. But, following Stanley (2005), estimates corrected from the publication bias are a
delicate issue, and additional tests are needed to assess the existence of such an effect. The first one
consists in using the coefficients estimated in equation (1) to correct the t-stats from the publication
bias. The corrected t-stat values are then regressed on the inverse of the variance:
1̂β
t-static = δ (1 / σi ) + ςi,
A coefficient significantly different from zero shows that there is a real impact, as is the case
here: 0.119 with a 0.043 standard variation.
As shown by Card and Krueger18, the second test consists in regressing the log of the t-stat
absolute value on the logarithm of the degree of freedom or of the number of observations:
ln | t-stati | = α1 + α2 ln (n) + ηi,
18 Card and Krueger (1995) also recommend that only one estimate per study be considered — they call it the
“preferred” estimate. It is indeed likely that, in the presence of a selection bias, only the most pregnant results are
affected. We applied this approach and selected for each study the estimate relating to the most complete sample.
Theses results are available on demand, yet they do not change our conclusions.
26
The law of large numbers indeed suggests that the absolute value of the test statistic increases
with the number of observations. In the absence of selection bias, a significantly positive coefficient
can be expected. According to this test, there exists an effect of redundancy announcements on the
firms’ market value: coefficient α2 is significantly different from zero at the 10% threshold — 0.115
with a 0.065 standard variation.
To conclude, it must be said that the studies on the financial markets’ reaction to layoffs
announcements suffer from the publication biases mentioned — i.e. Types I and II. It nevertheless
remains true that the financial markets’ reaction is significant and negative, even after publication
biases have been included and corrected.
6. Conclusion
It is clear that redundancy announcements by firms whose major economic indicators are positive may
appear as unfair. They fuel the arguments of those who condemn the “dictatorship of markets”. This
view conjures up a picture of the financial sphere as totally disconnected from the real world and
entirely driven by its own logic, i.e. that of the constant fight of stock markets against employment. It
must be added that this debate takes place within a more general climate of defiance vis-à-vis the
financial markets. The financial sphere has indeed undergone several crises over the past few years
(Enron, the dotcom bubble, and so on) which have all contributed to aggravate public fears. Even
though these problems are real and serious enough and have rightly become the focus of attention, it
would be equally unfair to blame the financial markets for all evils.
The theoretical chain that connects redundancies and stock market prices is a complex structure,
without any a priori determined effect. Our results show that, contrary to a widely received idea,
layoffs announcements have an overall negative effect on stock market prices, and this remains true
whatever the country, the period of time or the type of firm considered. However some factors may
ease as well as worsen the stock market’s reaction to such announcements. The reason for the layoff
decision is among the most decisive factors and the market sanction will be more severe in the case of
27
defensive layoffs (taken by firms facing difficulties) than for offensive layoffs (when they are part of a
more general reorganization strategy on the part of the firm).
It demands that investors be convinced that the redundancy measures form an integral part of a
more global strategy, that they are dictated by a reorganization program and are not just the sign of
mere financial distress. Moreover, even when the firm vows to adopt a consistent and proactive policy,
redundancies can be interpreted as evidence of unsuspected difficulties or lacklustre ambition and the
sheer admission it entirely lacks any sense direction. The financial markets’ short-term reactions
therefore constitute by no means a reflexive decision and the reasons for the layoffs remain, by
contrast, most determinant.
Acknowledgments
The authors thank Jézabel Couppey-Soubeyran, Matthieu Crozet, Anne-Célia Disdier and Stéphanie
Monjon for their very wise remarks, as well as Betsy Annen and Ben Offerle for remarkable research
assistance. All remaining errors are the authors’.
References The codes in brackets refer to the summary tables and to the commentary.
Abowd J.M., G.T. Milkovich and J.M. Hannon (1990), The Effects of Human Resource Management
Decisions on Shareholder Value, Industrial and Labor Relations Review, 43(3), 203-236.
[AMH]
Abraham S.E. and D.-O. Kim (2004), Layoff and Employment Guarantee Announcements: How do
Shareholders Respond?, International Journal of Manpower, 25(8), 729-740. [AK]
Allouche J., P. Laroche and F. Noël (2006) Suppression d’emplois et performance de l’entreprise : une
méta-analyse, Cahiers du GREGOR.
Baumol W.J., A.S. Blinder and E.N. Wolff (2003) Downsizing in America: Reality, Causes, and
Consequences, Russell Sage Foundation, New York.
Becker B.E. and C.A. Olson (1986) The Impact of Strikes on Shareholder Equity, Industrial and
Labor Relations Review, 39(3), 425-438.
Bentolila S. and G. Bertola (1999) Firing Costs and Labour Demand: How Bad Is Eurosclerosis ?,
Review of Economic Studies, 57, 381-402.
28
Bhana N. (2002), Layoff announcements, share price reaction and long-term financial performance on
the JSE Securities Exchange, IASSA's Investment Analysts Journals, 56. [Bha]
Billger S.M. and K.F. Hallock (2005) Mass Layoffs and CEO Turnover, Industrial Relations, 44 (3),
463-489.
Blackburn R.M. (1999) The Vicious Circle of Competitive Unemployment, International Journal of
Sociology and Social Policy, 19(1/2), 1-26.
Blackwell D.W., M.W. Marr and M.F. Spivey (1990) Plant Closing Decisions and the Market Value of
the Firm, Journal of Financial Economics, 26(2), 277-288. [BMS]
Boyle G., G. Bhabra and H. Bhabra (2004) Competitive and Contagion Effects in Corporate Layoff
Announcements, New Zealand Institute for the Study of Competition and Regulation.
Boyd J.H. J. Hu and R. Jagannathan (2005) The Stock Market’s Reaction to Unemployment News:
Why Bad News Is Usually Good For Stocks, Journal of Finance, 60(2), 649-672(24).
Brockner J., S. Grover, T. F. Reed and R. L. Dewitt (1992) Layoffs, Job Security and Survivors' Work
Effort: Evidence of an Inverted U Relationship, Academy of Management Journal, 35, 413-
425.
Brockner J., S. Grover, T. F. Reed, R. L. Dewitt and M. O'Malley (1987) Survivors' Reaction to
Layoffs: We get by with A Little help for Our Friends, Administrative Science Quarterly, 32,
526-541.
Brookman J.T., S. Chang and C.G. Rennie (2005) CEO Incentives from Restricted Stock and Option
Portfolios and Shareholder Value: Evidence from Layoff Decisions, Working Paper. [BCR]
Brown C. and K. Ridgedell (1998) An empirical investigation of the long-term effects of permanent
layoff announcements, Proceedings of the Academy of Accounting and Financial Studies,
3(2), 101-106. [BR]
Cappelli P. (2000) Examining the Incidence of Downsizing and Its Effect on Establishment
Performance, NBER Working Paper, 7742.
Carroll G.R. (1994) Organizations... The Smaller They Get, Management Review, 37(1), Fall, 28-40.
Card D. and A.B. Krueger (1995) Time Series Minimum Wage Studies: A Meta-Analysis, American
Economic Review, 85(2), 238-243.
Caves R.E. and M.B. Krepps (1993) Fat: The Displacement of Nonproduction Workers and the
Efficiency of U.S. Manufacturing Industries, Brookings Papers on Economic Activity,
Microeconomics, 1993(2), 227-288. [CK]
Chalos P. and C. Chen (2002) Employee Downsizing Strategies: Market Reaction and Post
Announcement Financial Performance, Journal of Business Finance and Accounting, 29(5-6),
847-870. [CC]
Chandy P.R., W.N. Davidson and D.L. Worrell (1990) The effect of announcements of significant
layoffs on stockholder wealth, International Journal of Management, 7(1), 69-78. [CDW]
29
Chang S. and J.R. Hoffmeister (2002) Layoffs, CEO Turnover, and Shareholder Wealth, Working
Paper.[CH]
Charness G. and D. Levine (2000) When are Layoffs Acceptable? Evidence from a Quasi-experiment,
Industrial and Labor Relations Review, 53(3), Avril, 381-400.
Chatrath A., S. Ramchander and F. Song (1995) Are Market Perceptions of Corporate Layoffs
Changing?, Economics Letters, 47, 335-342. [CRS]
Chen P., V. Mehrotra, R. Sivakumar and W.W. Yu (2001) Layoffs, shareholders’ wealth, and
corporate performance, Journal of Empirical Finance, 8, 171-199. [CMSY]
Clarenbach L. and W. Davis (2001) Market perception of layoffs: Investor re-evaluation, Working
Paper. [CD]
Clinebell Sh.K. and J.M. Clinebell (1994) The effect of advance notice of plant closings on firm
value, Journal of Management, 20(3), 553-564. [Cli]
Collett N. (2002) Reactions of the International Stock Exchange to Company Employment
Announcements: Redundancies and New Jobs, Journal of Business Finance and Accounting,
29(9-10), 1181-1208. [Co]
Cox R., J. Mitchell and R. T. Kleiman (1993) The Stock Market Reaction to Plant Closings, Mid-
American Journal of Business, 8(1), Spring, 57-60. [CMK]
Datta S. and M. Iskandar-Datta (1996) A Financial Analysis of Corporate Downsizing: Evidence from
Employee Layoffs, mimeo, Bentley College. [DID]
Egger M., G. Smith, M. Schneider and C. Minder (1997), Bias in meta-analysis detected by a simple,
graphical test, British Medical Journal, 315, 629-634.
Elayan F., G. Swales, B. Maris and J. Scott (1998) Market reactions, characteristics, and the
effectiveness of corporate layoffs, Journal of business finance and accounting, 25(3), 329-351
[ESMS]
Fama E. (1970) Efficient Capital Markets: A Review of Theory and Empirical Work, Journal of
Finance, 25(2), 383-417
Fama E., L. Fisher, M.C. Jensen and R.W. Roll (1969) The adjustment of stock prices to new
information, International Economic Review, 10, 1-21.
Farber H.S. (2003) Job loss in the United States, 1981-2001, NBER working paper, 9707.
Farber H.S. and K.F. Hallock (1999) Changing stock market response to announcements of job loss,
evidence from 1970-1997, Proceedings of the Industrial Relations Research Association,
May, 26-34. [FH99]
Farber H.S. and K.F. Hallock (2004) The Changing Relationship Between Job Loss Announcements
and Stock Prices: 1970-1999, Working paper, Princeton University and University of Illinois.
[FH04]
30
Filbeck G. and S.E. Webb (2001) Information Asymmetries Managerial Ownership and the Impact of
Layoff Announcements on Shareholder Wealth, Quarterly Journal of Business and
Economics, 40(2), 31-47. [FW]
Foulkes F. K. and A. Whitman (1985) Marketing Strategies to Maintain Full Employment, Harvard
Business Review, 30-32.
Fowke G.K. (1998) Layoffs and Survivors' Career Motivation, Papers 24, Queen's at Kingston - Sch.
of Indus. Relat.
Franz D.R., D. Crawford and D.J. Dwyer (1998) Downsizing Corporate Performance, and Shareholder
Wealth, Mid-American Journal of Business, 13(1), 11-20. [FCD]
Glass G.V., B. McGaw and M.L. Smith (1981) Meta-analysis in Social Research, Sage Publications,
Thousand Oaks, CA.
Gombola M. and G. Tsetsekos (1992a) The information content of plant closing announcements:
Evidence from financial profiles and the stock market reaction, Financial management, 21(2),
31-40. [GT]
Gombola M.J. and G.P. Tsetsekos (1992b) Plant Closings forFinancially Weak and Financially Strong
Firms, Quarterly Journal of Business and Economics, 31(3), 69-83. [GT]
Gunderson M., S. Verma and A. Verma (1997) Job Loss Announcements and their Effect on Market
Value of the Firm: Canadian Evidence from the 1980s, Relations Industrielles, 52(2), 364-380.
[GVV]
Hallock K.F. (1998), Layoffs, top executive pay and firm performance, American Economic Review,
88(4), 711-723. [Hal]
Hendricks C.F. (1992), The Rightsizing Remedy, Business One Irwin.
Hillier D., A. Marshall, P. McColgan and S. Werema (2006), Employee Layoffs, Shareholder Wealth
and Firm Performance: Evidence from the UK, Working Paper, University of Leeds.
[HMMW]
Hubler J., P.-X. Meschi and G. Schmidt (2001) Annonces de suppressions d’emplois et valorisation
boursière des entreprises, in Schmidt G. (dir.), La gestion des sureffectifs : enjeux et pratiques,
Economica. [HMS01]
Hubler J., P.-X. Meschi et G. Schmidt (2004) Annonces de suppressions d’emplois et valeur boursière
de l’entreprise, Finance Contrôle Stratégie, 27(4), 107-142. [HMS04]
Iqbal Z. and A. Akhigbe (1997) Changes in Corporate Performance Associated with Layoffs, Journal
of Financial and Strategic Decisions, 10(2), 17-26. [IA]
Iqbal Z. and S. Shekhar (1995) Layoffs, stock price and financial condition of the firm, Journal of
Applied Business Research, Spring, 11(2), 67-73. [IS]
Kalra R., G.V. Henderson, M.C. Walker (1994) Share price reaction to plant-closing announcements,
Journal of Economics and Business, 46(5), 381-395. [KHW]
31

Kramer J.K. and G.M. Vasconcellos (1996) The Economic Effect on Strikes on the Shareholders of
Nonstruck Competitors, Industrial and Labor Relations Review, 49(2), 213-222.
Kramer J.K. and T. Hyclak (2002) Why Strikes Occur: Evidence from the Capital Markets, Industrial
Relations, 41(1), 80-93.
Lee P.M. (1997) A comparative Analysis of Layoff Annoucements and Stock Price Reactions in the
United States and Japan, Strategic Management Journal, 18, 879-894. [Lee]
Lin J.C. and M.S. Rozeff (1993) Capital market behavior and operational announcements of layoffs,
operation closings, and pay cuts, Review of Quantitative Finance and Accounting, 3(1), 29-45.
[LR]
MacKinlay A.C. (1997) Event studies in economics and finance, Journal of Economic Literature, 35,
13-39.
Madura J., A. Akhigbe and K. Bartunek (1995) Intra-industry Effects of Bank Layoff Announcements,
Review of Financial Economics, 4(2), 187-195. [MAB]
McKnight P., A. Lowrie and C. Coles (2002) Investor Reactions, Social Implications and Layoff
Announcements in the UK: A Comparison between Periods, Journal of Management and
Governance, 6, 83-100. [MLC]
Neinstedt P. R. (1989), Effectively Downsizing Management Structures, Human Resource Planning,
12, 155-164.
Nemec R.C. (1997) Firm Layoffs: An Analysis of Shareholder Value of the Firm Performance Stock
Prices, Ph. D., University of Kentucky.
Ofek E. (1993) Capital structure and firm response to poor performance: An empirical analysis,
Journal of Financial Economics, 34, 3-30.
Palmon O., H.-L. Sun and A.P. Tang (1997) Layoff announcements: Stock market impact and
financial performance, Financial Management, 26(3), 54-68. [PST]
Pfann G.A. (2001) Downsizing, Discussion Paper 307, IZA.
Pfann G.A. and F. Palm (1993) Asymmetric adjustment costs in non-linear labour demand models for
the Netherlands and UK manufacturing sectors, Review of Economic Studies, 60, 397-412.
Pouder R., R.S. Cantrell and S.P. Kulkarni (1999) The influence of corporate governance on investor
reactions to layoff announcements, Journal of Managerial Issues, 11(4), 475-492. [PCK]
Raj M and M. Forsyth (1999) Restructuring and Layoffs: Does the UK Market View them Positively?,
Journal of Global Business, 10(19), 55-64. [RF]
Raj M. and M Forsyth (2002) The Efficiency and Productivity Implications of Corporate Layoffs,
Economic Issues, 7(2), 59-69.
Rousseau D.M., 1989, Psychological and implied contracts in organizations, Employee
Responsibilities and Rights Journal, 2(2), 121-139.
Rousseau D.M., 1995, Psychological contracts in organizations, Thousand Oaks: Sage publications.
32
Ruback R.S. and M.B. Zimmerman (1984) Unionization and Profitability: Evidence from the Capital
Market, Journal of Political Economy, 92, 1134-1157.
Rust K.G., J.C. Edwards, W. McKinley and G. Moon, 2006, Ideological Foundations of Perceived
Contract Breach Associated With Downsizing: An Empirical Investigation, mimeo.
Spivey M.F., D.W. Blackwell and M.W. Marr (1994) Advance notice of plant closing and firm value,
Journal of Business Research, 31, 49-53. [SBM]
Stanley T.D. (2001) Wheat from Chaff: Meta-Analysis as Quantitative Literature Review, Journal of
Economic Perspectives, 15(3), 131-150.
Stanley T.D. (2005) Beyond Publication Bias, Journal of Economic Surveys, 19(3), 309-345.
Sun H.-L. and A.P. Tang (1998) The intra-industry information effect of downsizing announcements,
American Business Review, June, 68-76. [ST]
Ursel N. and M. Armstrong-Stassen (1995). The impact of layoff announcements on shareholders,
Industrial Relations, 50(3), 636-645. [UAS]
Womack J.P., D.T. Jones and D. Ross (1991) The Machine That Changed The World. The Story of
Lean Production, Harper Collins.
Worrell, D.L., W.N. Davidson and V. Sharma (1991) Layoff Announcements and Stockholder Wealth,
Academy of Management Journal, 34(3), 662-678. [WDS]
33