Embed Size (px)
Citation preview
Shared Capital Cooperative
Loan Modification
Presented by: Jim Shadko Date: July 26, 2017
Borrower Information / Loan Summary
Borrower name:
Clifton Cooperative
Market (CM) Project name: Loan Modification
Borrower address: 319 Ludlow Ave. Project Address:
Cincinnati, OH 45220
Membership status: Current Equity Amount: $3,000
Co-op Type: Consumer Loan product: Business
Loan Source
Loan Use Equipment
Loan purpose: Start-up
(brief project description) Start-up food co-op in CDFI and food desert areas.
Credit Action Requested: Extension of interest-only period for six months, beginning 7/25/17.
Loan Terms
Current:
New:
Approved:
Loan amount: $1,096,539 $0
Participant: Finance Fund $ 712,064 (64.9%) $0
Total: $1,096,539
Interest rate: 7.50% 7.50%
Term (draw/i-only/P&I): OI thru 6/25/17 IO thru 12/31/17
Amortization: Begins 7/25/17 Begins 1/25/18
Monthly payment amt: $6,993.00 $6,993.00
Credit Overview
Risk Rating Current: D - $38,448
Recommend: E - $57,671
Credit summary: CCM is illiquid, materially below projections with weak management & board
Coverage: Negative DSC ratio Collateral Value:
Additional Security Collateral Type: 1st equip.; 2nd REM
Impact Overview
CDFI Qualifying? Yes Food Desert?
Yes
Jobs (#FTE) 48 FTEs
Housing Units
Impact summary: Healthy food access project.
Strengths Weaknesses
• New board president expected to hold GM
accountable
• Board has approved new round of fundraising
•
•
• Recent weekly sales at 46% of original budget
• Extremely low cash reserves
• Over budget on pre-opening & construction expenses
• GM lacks financial mgt. skills/slow to cut labor costs
• Weak board
• Kroger recently remodeled store within a mile of CM
Clifton Cooperative Market Shared Capital Cooperative
2
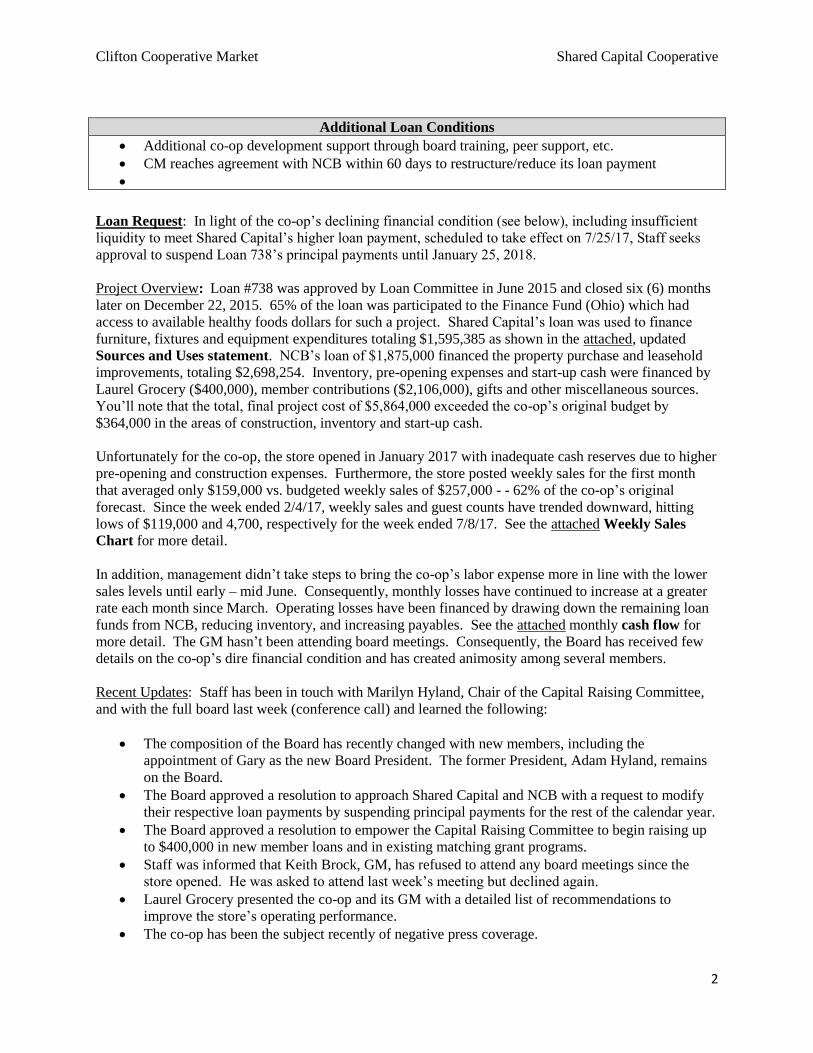
Additional Loan Conditions
• Additional co-op development support through board training, peer support, etc.
• CM reaches agreement with NCB within 60 days to restructure/reduce its loan payment
•
Loan Request: In light of the co-op’s declining financial condition (see below), including insufficient
liquidity to meet Shared Capital’s higher loan payment, scheduled to take effect on 7/25/17, Staff seeks
approval to suspend Loan 738’s principal payments until January 25, 2018.
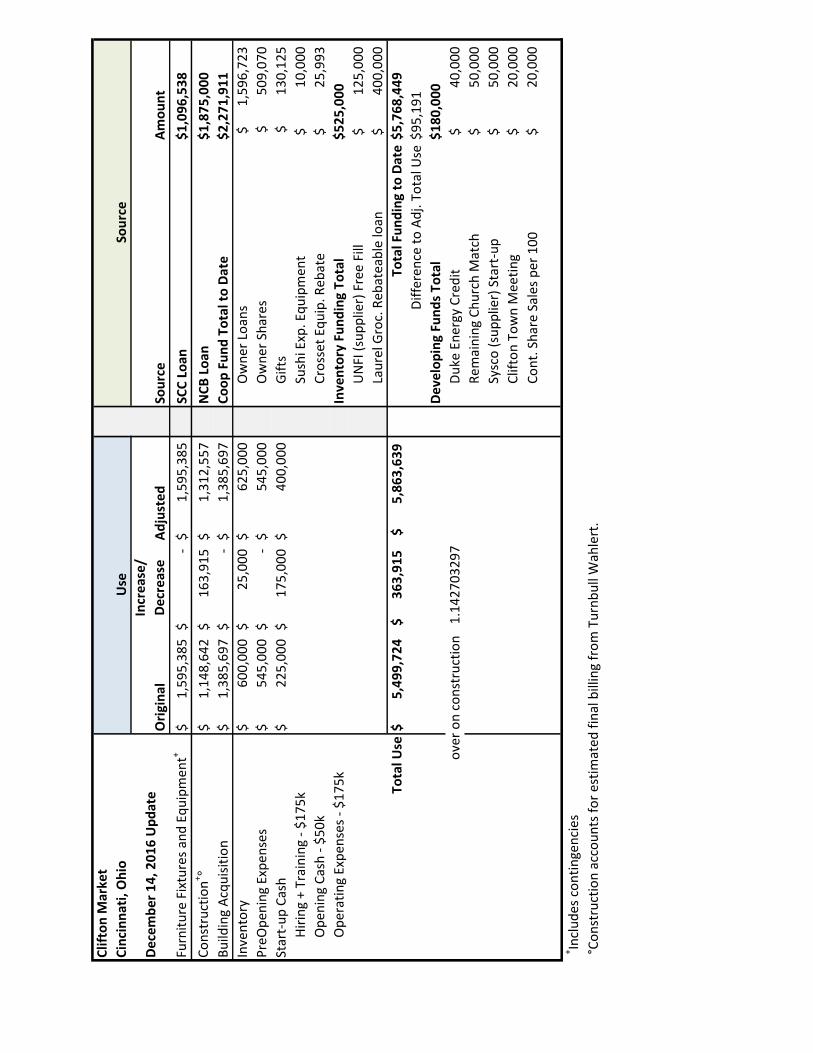
Project Overview: Loan #738 was approved by Loan Committee in June 2015 and closed six (6) months
later on December 22, 2015. 65% of the loan was participated to the Finance Fund (Ohio) which had
access to available healthy foods dollars for such a project. Shared Capital’s loan was used to finance
furniture, fixtures and equipment expenditures totaling $1,595,385 as shown in the attached, updated
Sources and Uses statement. NCB’s loan of $1,875,000 financed the property purchase and leasehold
improvements, totaling $2,698,254. Inventory, pre-opening expenses and start-up cash were financed by
Laurel Grocery ($400,000), member contributions ($2,106,000), gifts and other miscellaneous sources.
You’ll note that the total, final project cost of $5,864,000 exceeded the co-op’s original budget by
$364,000 in the areas of construction, inventory and start-up cash.
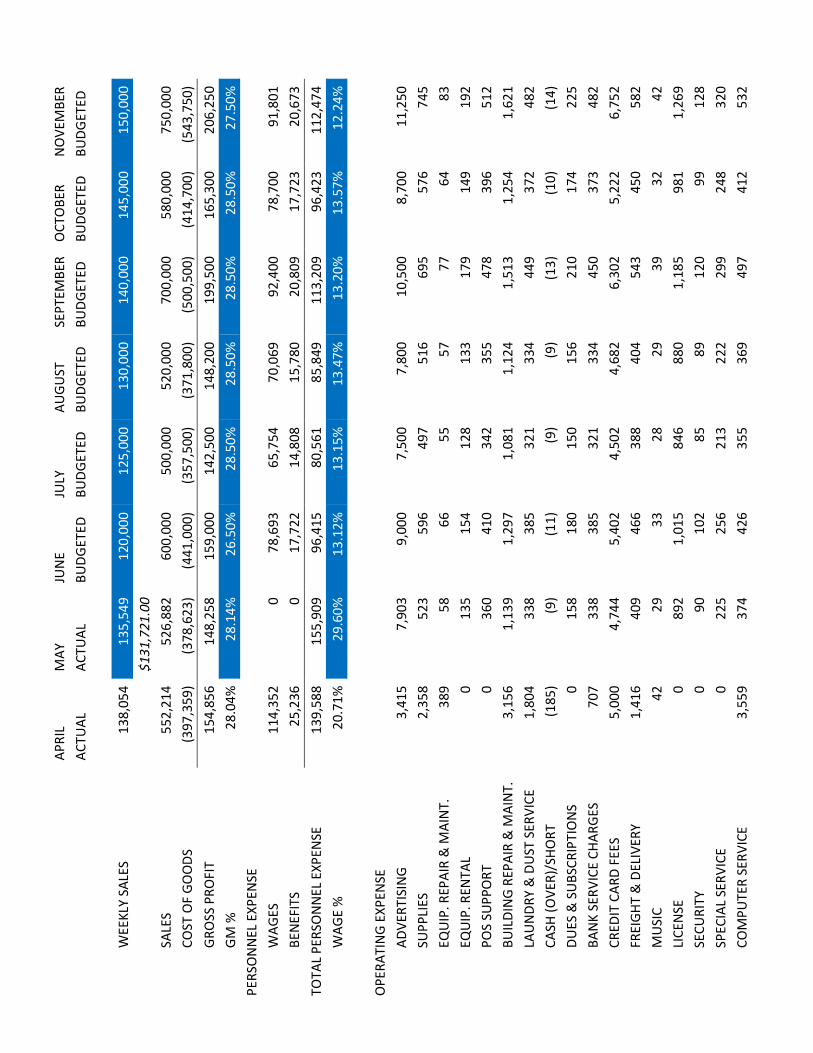
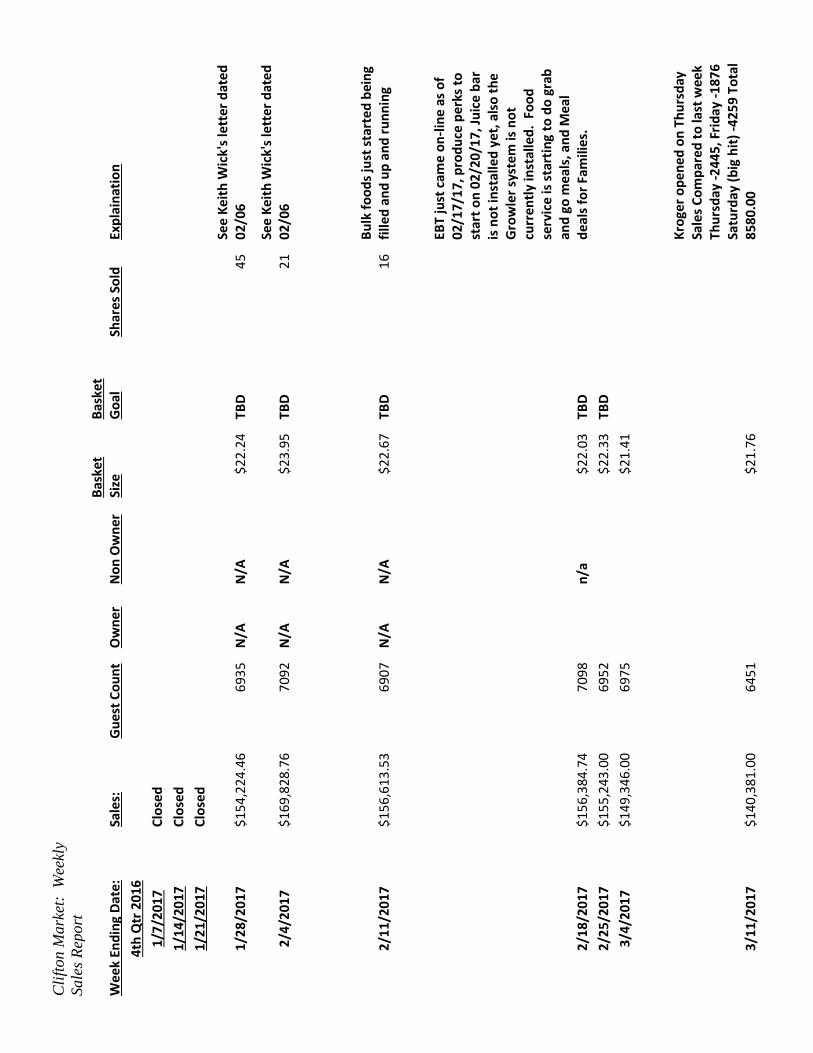
Unfortunately for the co-op, the store opened in January 2017 with inadequate cash reserves due to higher
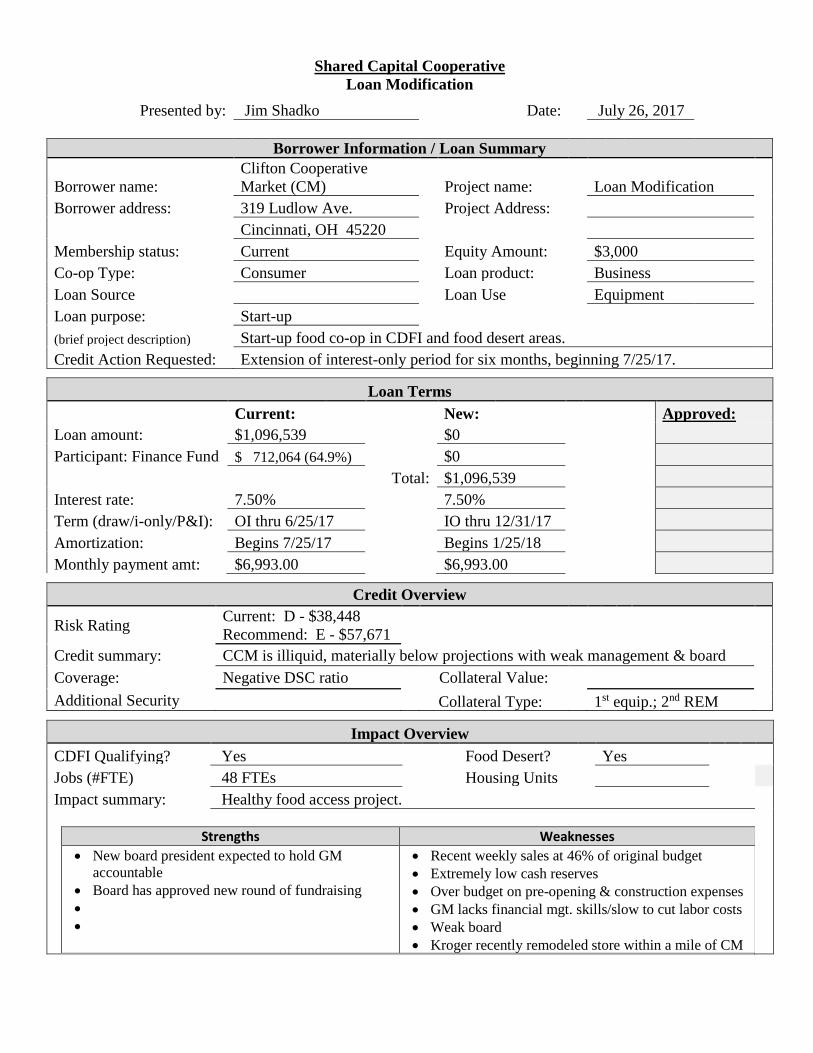
pre-opening and construction expenses. Furthermore, the store posted weekly sales for the first month
that averaged only $159,000 vs. budgeted weekly sales of $257,000 - - 62% of the co-op’s original
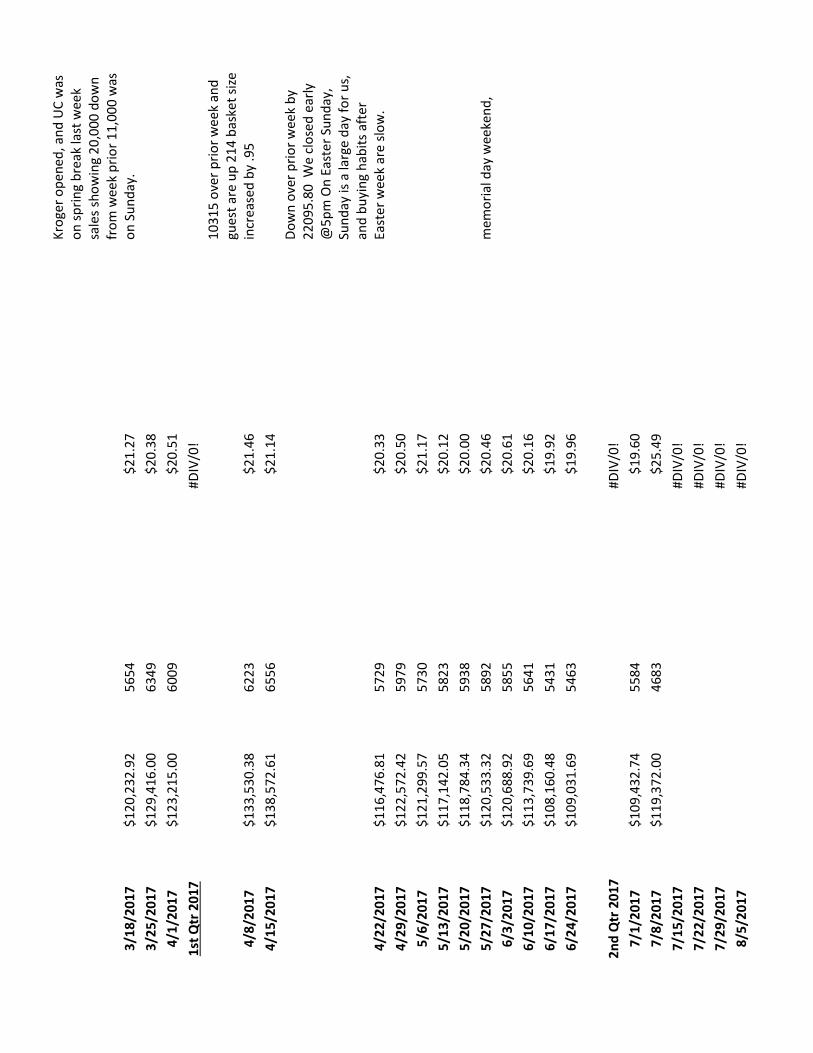
forecast. Since the week ended 2/4/17, weekly sales and guest counts have trended downward, hitting
lows of $119,000 and 4,700, respectively for the week ended 7/8/17. See the attached Weekly Sales
Chart for more detail.
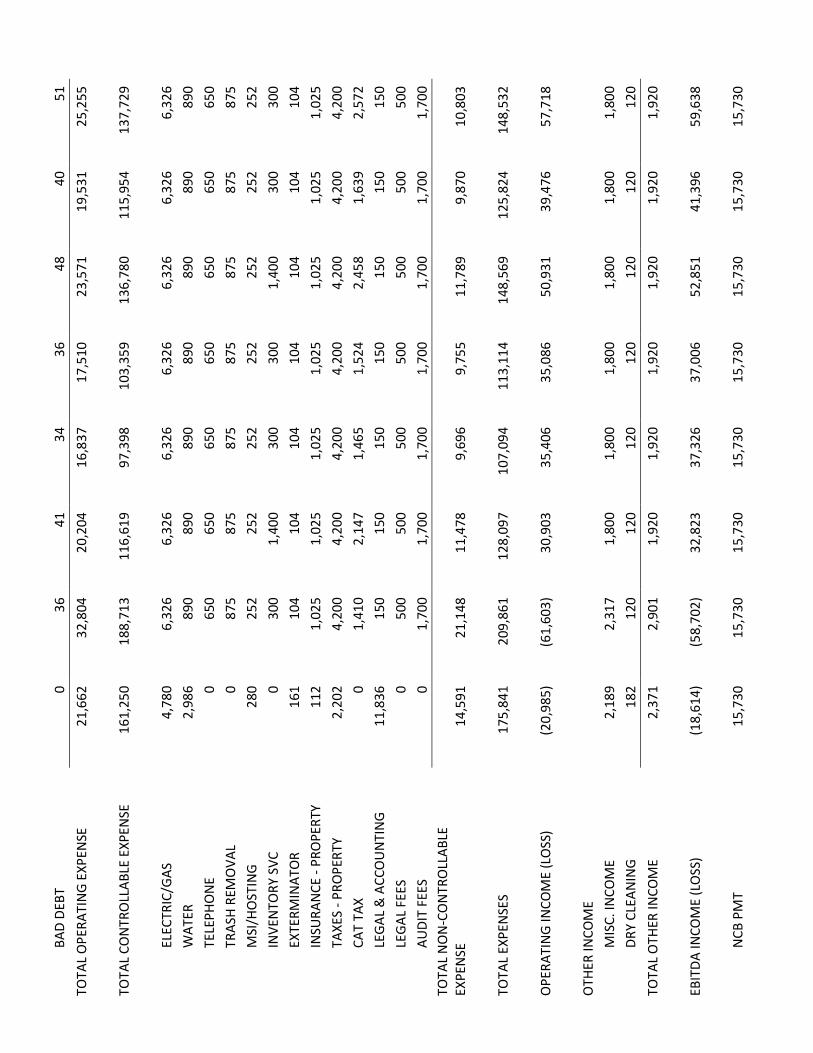
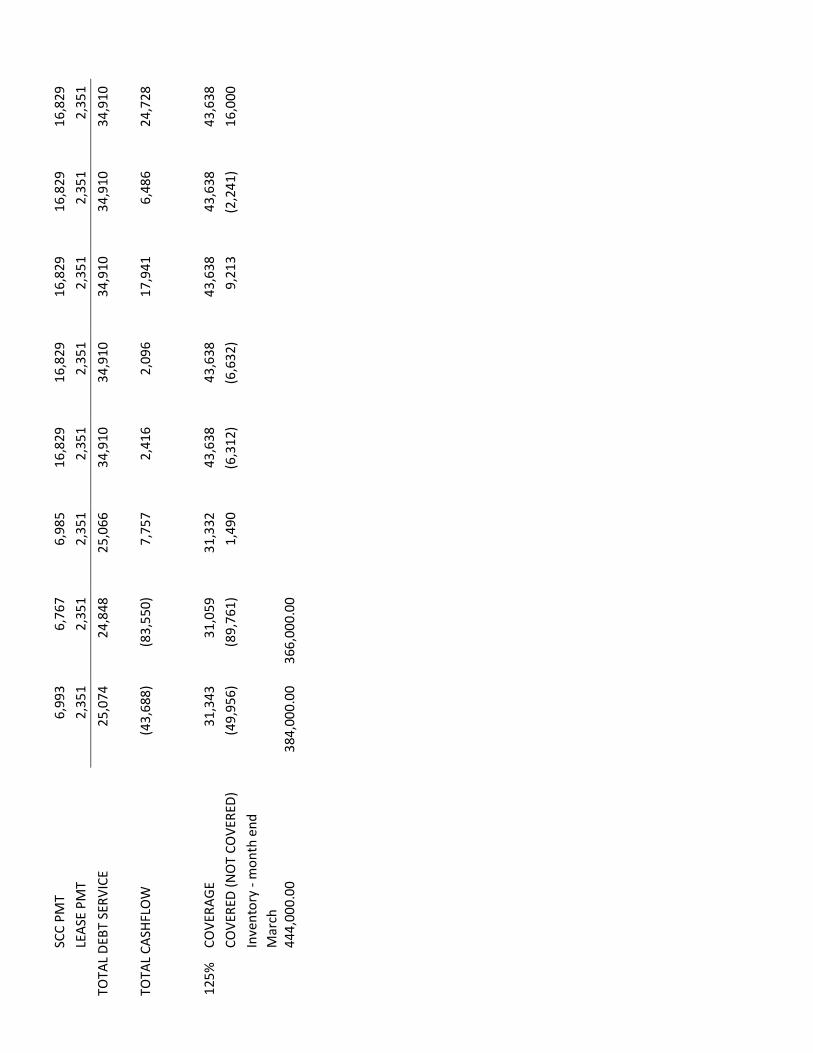
In addition, management didn’t take steps to bring the co-op’s labor expense more in line with the lower
sales levels until early – mid June. Consequently, monthly losses have continued to increase at a greater
rate each month since March. Operating losses have been financed by drawing down the remaining loan
funds from NCB, reducing inventory, and increasing payables. See the attached monthly cash flow for
more detail. The GM hasn’t been attending board meetings. Consequently, the Board has received few
details on the co-op’s dire financial condition and has created animosity among several members.
Recent Updates: Staff has been in touch with Marilyn Hyland, Chair of the Capital Raising Committee,
and with the full board last week (conference call) and learned the following:
• The composition of the Board has recently changed with new members, including the
appointment of Gary as the new Board President. The former President, Adam Hyland, remains
on the Board.
• The Board approved a resolution to approach Shared Capital and NCB with a request to modify
their respective loan payments by suspending principal payments for the rest of the calendar year.
• The Board approved a resolution to empower the Capital Raising Committee to begin raising up
to $400,000 in new member loans and in existing matching grant programs.
• Staff was informed that Keith Brock, GM, has refused to attend any board meetings since the
store opened. He was asked to attend last week’s meeting but declined again.
• Laurel Grocery presented the co-op and its GM with a detailed list of recommendations to
improve the store’s operating performance.
• The co-op has been the subject recently of negative press coverage.
Clifton Cooperative Market Shared Capital Cooperative
3
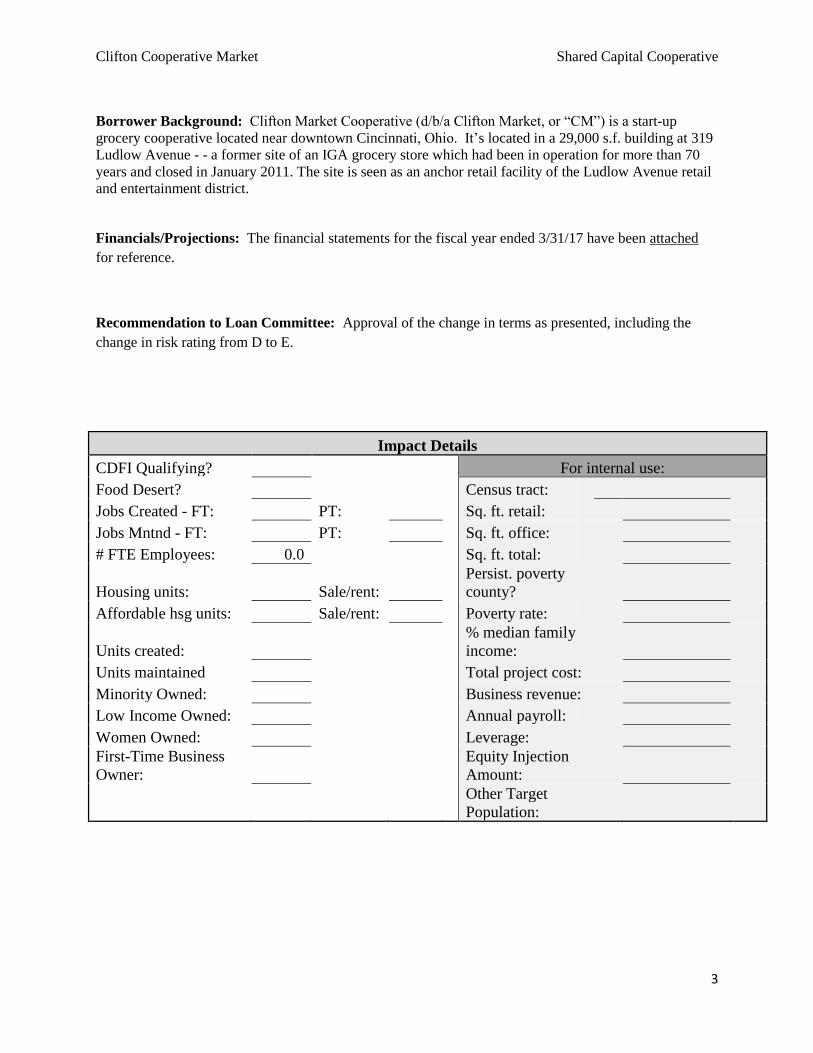
Borrower Background: Clifton Market Cooperative (d/b/a Clifton Market, or “CM”) is a start-up
grocery cooperative located near downtown Cincinnati, Ohio. It’s located in a 29,000 s.f. building at 319
Ludlow Avenue - - a former site of an IGA grocery store which had been in operation for more than 70
years and closed in January 2011. The site is seen as an anchor retail facility of the Ludlow Avenue retail
and entertainment district.
Financials/Projections: The financial statements for the fiscal year ended 3/31/17 have been attached
for reference.
Recommendation to Loan Committee: Approval of the change in terms as presented, including the
change in risk rating from D to E.
Impact Details
CDFI Qualifying? For internal use:
Food Desert? Census tract:
Jobs Created - FT: PT: Sq. ft. retail:
Jobs Mntnd - FT: PT: Sq. ft. office:
# FTE Employees: 0.0 Sq. ft. total:
Housing units: Sale/rent:
Persist. poverty
county?
Affordable hsg units: Sale/rent: Poverty rate:
Units created:
% median family
income:
Units maintained Total project cost:
Minority Owned: Business revenue:
Low Income Owned: Annual payroll:
Women Owned: Leverage:
First-Time Business
Owner:
Equity Injection
Amount:
Other Target
Population:
AP
RIL
M
AY
JUN
E JU
LY
AU
GU
ST
SEP
TEM
BER
O
CTO
BER
N
OV
EMB
ER
AC
TUA
L A
CTU
AL
BU
DG
ETED
B
UD
GET
ED
BU
DG
ETED
B
UD
GET
ED
BU
DG
ETED
B
UD
GET
ED
W
EEK
LY S
ALE
S 1
38,0
54
1
35
,54
9
12
0,0
00
1
25
,00
0
13
0,0
00
1
40
,00
0
14
5,0
00
1
50
,00
0
$
13
1,7
21
.00
SA
LES
552
,21
4
52
6,8
82
6
00
,00
0
50
0,0
00
5
20
,00
0
70
0,0
00
5
80
,00
0
75
0,0
00
C
OST
OF
GO
OD
S (3
97,3
59)
(37
8,6
23
) (4
41
,00
0)
(35
7,5
00
) (3
71
,80
0)
(50
0,5
00
) (4
14
,70
0)
(54
3,7
50
)
G
RO
SS P
RO
FIT
154
,85
6
14
8,2
58
1
59
,00
0
14
2,5
00
1
48
,20
0
19
9,5
00
1
65
,30
0
20
6,2
50
G
M %
2
8.0
4%
2
8.1
4%
2
6.5
0%
2
8.5
0%
2
8.5
0%
2
8.5
0%
2
8.5
0%
2
7.5
0%
PER
SON
NEL
EX
PEN
SE
W
AG
ES
114
,35
2
0
78
,69
3
65
,75
4
70
,06
9
92
,40
0
78
,70
0
91
,80
1
B
ENEF
ITS
25
,236
0
1
7,7
22
1
4,8
08
1
5,7
80
2
0,8
09
1
7,7
23
2
0,6
73
TOTA
L P
ERSO
NN
EL E
XP
ENSE
1
39,5
88
1
55
,90
9
96
,41
5
80
,56
1
85
,84
9
11
3,2
09
9
6,4
23
1
12
,47
4
W
AG
E %
2
0.7
1%
2
9.6
0%
1
3.1
2%
1
3.1
5%
1
3.4
7%
1
3.2
0%
1
3.5
7%
1
2.2
4%
OP
ERA
TIN
G E
XP
ENSE
A
DV
ERTI
SIN
G
3,4
15
7
,90
3
9,0
00
7
,50
0
7,8
00
1
0,5
00
8
,70
0
11
,25
0
SU
PP
LIES
2
,35
8
52
3
59
6
49
7
51
6
69
5
57
6
74
5
EQ
UIP
. REP
AIR
& M
AIN
T.
389
5
8
66
5
5
57
7
7
64
8
3
EQ
UIP
. REN
TAL
0
13
5
15
4
12
8
13
3
17
9
14
9
19
2
P
OS
SUP
PO
RT
0
36
0
41
0
34
2
35
5
47
8
39
6
51
2
B
UIL
DIN
G R
EPA
IR &
MA
INT.
3
,15
6
1,1
39
1
,29
7
1,0
81
1
,12
4
1,5
13
1
,25
4
1,6
21
LA
UN
DR
Y &
DU
ST S
ERV
ICE
1,8
04
3
38
3
85
3
21
3
34
4
49
3
72
4
82
C
ASH
(O
VER
)/SH
OR
T (1
85)
(9)
(11
) (9
) (9
) (1
3)
(10
) (1
4)
D
UES
& S
UB
SCR
IPTI
ON
S 0
1
58
1
80
1
50
1
56
2
10
1
74
2
25
B
AN
K S
ERV
ICE
CH
AR
GES
7
07
33
8
38
5
32
1
33
4
45
0
37
3
48
2
C
RED
IT C
AR
D F
EES
5,0
00
4
,74
4
5,4
02
4
,50
2
4,6
82
6
,30
2
5,2
22
6
,75
2
FR
EIG
HT
& D
ELIV
ERY
1,4
16
4
09
4
66
3
88
4
04
5
43
4
50
5
82
M
USI
C
42
2
9
33
2
8
29
3
9
32
4
2
LI
CEN
SE
0
89
2
1,0
15
8
46
8
80
1
,18
5
98
1
1,2
69
SE
CU
RIT
Y 0
9
0
10
2
85
8
9
12
0
99
1
28
SP
ECIA
L SE
RV
ICE
0
22
5
25
6
21
3
22
2
29
9
24
8
32
0
C
OM
PU
TER
SER
VIC
E 3
,55
9
37
4
42
6
35
5
36
9
49
7
41
2
53
2
B
AD
DEB
T 0
3
6
41
3
4
36
4
8
40
5
1
TOTA
L O
PER
ATI
NG
EX
PEN
SE
21
,662
3
2,8
04
2
0,2
04
1
6,8
37
1
7,5
10
2
3,5
71
1
9,5
31
2
5,2
55
TOTA
L C
ON
TRO
LLA
BLE
EX
PEN
SE
161
,25
0
18
8,7
13
1
16
,61
9
97
,39
8
10
3,3
59
1
36
,78
0
11
5,9
54
1
37
,72
9
EL
ECTR
IC/G
AS
4,7
80
6
,32
6
6,3
26
6
,32
6
6,3
26
6
,32
6
6,3
26
6
,32
6
W
ATE
R
2,9
86
8
90
8
90
8
90
8
90
8
90
8
90
8
90
TE
LEP
HO
NE
0
65
0
65
0
65
0
65
0
65
0
65
0
65
0
TR
ASH
REM
OV
AL
0
87
5
87
5
87
5
87
5
87
5
87
5
87
5
M
SI/H
OST
ING
2
80
25
2
25
2
25
2
25
2
25
2
25
2
25
2
IN
VEN
TOR
Y SV
C
0
30
0
1,4
00
3
00
3
00
1
,40
0
30
0
30
0
EX
TER
MIN
ATO
R
161
1
04
1
04
1
04
1
04
1
04
1
04
1
04
IN
SUR
AN
CE
- P
RO
PER
TY
112
1
,02
5
1,0
25
1
,02
5
1,0
25
1
,02
5
1,0
25
1
,02
5
TA
XES
- P
RO
PER
TY
2,2
02
4
,20
0
4,2
00
4
,20
0
4,2
00
4
,20
0
4,2
00
4
,20
0
C
AT
TAX
0
1
,41
0
2,1
47
1
,46
5
1,5
24
2
,45
8
1,6
39
2
,57
2
LE
GA
L &
AC
CO
UN
TIN
G
11
,836
1
50
1
50
1
50
1
50
1
50
1
50
1
50
LE
GA
L FE
ES
0
50
0
50
0
50
0
50
0
50
0
50
0
50
0
A
UD
IT F
EES
0
1,7
00
1
,70
0
1,7
00
1
,70
0
1,7
00
1
,70
0
1,7
00
TOTA
L N
ON
-CO
NTR
OLL
AB
LE
EXP
ENSE
1
4,5
91
21
,14
8
11
,47
8
9,6
96
9
,75
5
11
,78
9
9,8
70
1
0,8
03
TOTA
L EX
PEN
SES
175
,84
1
20
9,8
61
1
28
,09
7
10
7,0
94
1
13
,11
4
14
8,5
69
1
25
,82
4
14
8,5
32
OP
ERA
TIN
G IN
CO
ME
(LO
SS)
(20
,985
) (6
1,6
03
) 3
0,9
03
3
5,4
06
3
5,0
86
5
0,9
31
3
9,4
76
5
7,7
18
OTH
ER IN
CO
ME
M
ISC
. IN
CO
ME
2,1
89
2
,31
7
1,8
00
1
,80
0
1,8
00
1
,80
0
1,8
00
1
,80
0
D
RY
CLE
AN
ING
1
82
12
0
12
0
12
0
12
0
12
0
12
0
12
0
TOTA
L O
THER
INC
OM
E 2
,37
1
2,9
01
1
,92
0
1,9
20
1
,92
0
1,9
20
1
,92
0
1,9
20
EBIT
DA
INC
OM
E (L
OSS
) (1
8,6
14)
(58
,70
2)
32
,82
3
37
,32
6
37
,00
6
52
,85
1
41
,39
6
59
,63
8
N
CB
PM
T 1
5,7
30
15
,73
0
15
,73
0
15
,73
0
15
,73
0
15
,73
0
15
,73
0
15
,73
0
SC
C P
MT
6,9
93
6
,76
7
6,9
85
1
6,8
29
1
6,8
29
1
6,8
29
1
6,8
29
1
6,8
29
LE
ASE
PM
T 2
,35
1
2,3
51
2
,35
1
2,3
51
2
,35
1
2,3
51
2
,35
1
2,3
51
TOTA
L D
EBT
SER
VIC
E 2
5,0
74
24
,84
8
25
,06
6
34
,91
0
34
,91
0
34
,91
0
34
,91
0
34
,91
0
TOTA
L C
ASH
FLO
W
(43
,688
) (8
3,5
50
) 7
,75
7
2,4
16
2
,09
6
17
,94
1
6,4
86
2
4,7
28
125
%
CO
VER
AG
E 3
1,3
43
31
,05
9
31
,33
2
43
,63
8
43
,63
8
43
,63
8
43
,63
8
43
,63
8
C
OV
ERED
(N
OT
CO
VER
ED)
(49
,956
) (8
9,7
61
) 1
,49
0
(6,3
12
) (6
,63
2)
9,2
13
(2
,24
1)
16
,00
0
In
ven
tory
- m
on
th e
nd
Mar
ch
444
,00
0.0
0
384
,00
0.0
0
36
6,0
00
.00
Clif
ton
Mar
ket
Cin
cin
nat
i, O
hio
De
cem
ber
14
, 20
16
Up
dat
eO
rigi
nal
Incr
eas
e/
De
cre
ase
Ad
just
ed
Sou
rce
Am
ou
nt
Furn
itu
re F
ixtu
res
and
Eq
uip
men
t+1
,59
5,3
85
$
-
$
1,5
95
,38
5
$
SC
C L
oan
$1
,09
6,5
38
Co
nst
ruct
ion
+ °1
,14
8,6
42
$
1
63
,91
5
$
1,3
12
,55
7
$
N
CB
Lo
an$
1,8
75
,00
0
Bu
ildin
g A
cqu
isit
ion
1,3
85
,69
7
$
- $
1
,38
5,6
97
$
Co
op
Fu
nd
To
tal t
o D
ate
$2
,27
1,9
11
Inve
nto
ry6
00
,00
0
$
2
5,0
00
$
62
5,0
00
$
O
wn
er L
oan
s1
,59
6,7
23
$
Pre
Op
enin
g Ex
pen
ses
54
5,0
00
$
- $
5
45
,00
0
$
Ow
ner
Sh
ares
50
9,0
70
$
Star
t-u
p C
ash
22
5,0
00
$
17
5,0
00
$
4
00
,00
0
$
Gif
ts1
30
,12
5$
Hir
ing
+ T
rain
ing
- $
17
5k
Sush
i Exp
. Eq
uip
men
t1
0,0
00
$
Op
enin
g C
ash
- $
50
kC
ross
et E
qu
ip. R
ebat
e2
5,9
93
$
Op
erat
ing
Exp
ense
s -
$1
75
kIn
ven
tory
Fu
nd
ing
To
tal
$5
25
,00
0
UN
FI (
sup
plie
r) F
ree
Fill
12
5,0
00
$
Lau
rel G
roc.
Re
bat
eab
le lo
an4
00
,00
0$
Tota
l Use
5,4
99
,72
4
$
36
3,9
15
$
5
,86
3,6
39
$
Tota
l Fu
nd
ing
to D
ate
$5
,76
8,4
49
Dif
fere
nce
to
Ad
j. To
tal U
se$
95
,19
1
De
velo
pin
g Fu
nd
s T
ota
l$
18
0,0
00
ove
r o
n c
on
stru
ctio
n1
.14
27
03
29
7D
uke
En
ergy
Cre
dit
40
,00
0$
Rem
ain
ing
Ch
urc
h M
atch
50
,00
0$
Sysc
o (
sup
plie
r) S
tart
-up
5
0,0
00
$
Clif
ton
To
wn
Mee
tin
g2
0,0
00
$
Co
nt.
Sh
are
Sale
s p
er 1
00
20
,00
0$
+ Incl
ud
es c
on
tin
gen
cies
°C
on
stru
ctio
n a
cco
un
ts f
or
esti
mat
ed f
inal
bill
ing
fro
m T
urn
bu
ll W
ahle
rt.
Use
Sou
rce
Cli
fto
n M
ark
et:
Wee
kly
Sale
s R
eport
Wee
k En
din
g D
ate:
Sa
les:
G
ues
t C
ou
nt
Ow
ner
N
on
Ow
ne
r B
aske
t Si
ze
Bas
ket
Go
al
Shar
es S
old
Ex
pla
inat
ion
4th
Qtr
20
16
1/7
/201
7
Clo
sed
1/1
4/20
17
Clo
sed
1/2
1/20
17
Clo
sed
1/2
8/20
17
$15
4,2
24.4
6
693
5
N/A
N
/A
$2
2.2
4
TBD
4
5
See
Kei
th W
ick'
s le
tter
dat
ed
02
/06
2/4
/201
7
$16
9,8
28.7
6
709
2
N/A
N
/A
$2
3.9
5
TBD
2
1
See
Kei
th W
ick'
s le
tter
dat
ed
02
/06
2/1
1/20
17
$15
6,6
13.5
3
690
7
N/A
N
/A
$2
2.6
7
TBD
1
6
Bu
lk f
oo
ds
just
sta
rte
d b
ein
g fi
lled
an
d u
p a
nd
ru
nn
ing
2/1
8/20
17
$15
6,3
84.7
4
709
8
n
/a
$2
2.0
3
TBD
EBT
just
cam
e o
n-l
ine
as o
f 0
2/1
7/1
7, p
rod
uce
per
ks t
o
star
t o
n 0
2/2
0/1
7, J
uic
e b
ar
is n
ot
inst
alle
d y
et, a
lso
th
e G
row
ler
syst
em
is n
ot
curr
entl
y in
stal
led
. Fo
od
se
rvic
e is
sta
rtin
g to
do
gra
b
and
go
mea
ls, a
nd
Mea
l d
eals
fo
r Fa
mili
es.
2/2
5/20
17
$15
5,2
43.0
0
695
2
$2
2.3
3
TBD
3/4
/201
7
$14
9,3
46.0
0
697
5
$2
1.4
1
3/1
1/20
17
$14
0,3
81.0
0
645
1
$2
1.7
6
Kro
ger
op
ened
on
Th
urs
day
Sa
les
Co
mp
ared
to
last
wee
k Th
urs
day
-2
44
5, F
rid
ay -
18
76
Sa
turd
ay (
big
hit
) -4
25
9 T
ota
l 8
58
0.0
0
3/1
8/20
17
$12
0,2
32.9
2
565
4
$2
1.2
7
Kro
ger
op
ened
, an
d U
C w
as
on
sp
rin
g b
reak
last
wee
k sa
les
sho
win
g 2
0,0
00
do
wn
fr
om
wee
k p
rio
r 1
1,0
00
was
o
n S
un
day
.
3/2
5/20
17
$12
9,4
16.0
0
634
9
$2
0.3
8
4/1
/201
7
$12
3,2
15.0
0
600
9
$2
0.5
1
1st
Qtr
20
17
#DIV
/0!
4/8
/201
7
$13
3,5
30.3
8
622
3
$2
1.4
6
10
31
5 o
ver
pri
or
wee
k an
d
gues
t ar
e u
p 2
14
bas
ket
size
in
crea
sed
by
.95
4/1
5/20
17
$13
8,5
72.6
1
655
6
$2
1.1
4
4/2
2/20
17
$11
6,4
76.8
1
572
9
$2
0.3
3
Do
wn
ove
r p
rio
r w
eek
by
22
09
5.8
0 W
e c
lose
d e
arly
@
5p
m O
n E
aste
r Su
nd
ay,
Sun
day
is a
larg
e d
ay f
or
us,
an
d b
uyi
ng
hab
its
afte
r Ea
ste
r w
eek
are
slo
w.
4/2
9/20
17
$12
2,5
72.4
2
597
9
$2
0.5
0
5/6
/201
7
$12
1,2
99.5
7
573
0
$2
1.1
7
5/1
3/20
17
$11
7,1
42.0
5
582
3
$2
0.1
2
5/2
0/20
17
$11
8,7
84.3
4
593
8
$2
0.0
0
5/2
7/20
17
$12
0,5
33.3
2
589
2
$2
0.4
6
mem
ori
al d
ay w
eeke
nd
,
6/3
/201
7
$12
0,6
88.9
2
585
5
$2
0.6
1
6/1
0/20
17
$11
3,7
39.6
9
564
1
$2
0.1
6
6/1
7/20
17
$10
8,1
60.4
8
543
1
$1
9.9
2
6/2
4/20
17
$10
9,0
31.6
9
546
3
$1
9.9
6
2n
d Q
tr 2
017
#D
IV/0
!
7/1
/201
7
$10
9,4
32.7
4
558
4
$1
9.6
0
7/8
/201
7
$11
9,3
72.0
0
4
683
$
25
.49
7/1
5/20
17
#DIV
/0!
7/2
2/20
17
#DIV
/0!
7/2
9/20
17
#DIV
/0!
8/5
/201
7
#DIV
/0!

CLIF
TO
N C
OO
PE
RA
TIV
E M
AR
KE
T
CO
MP
ILE
D F
INA
NC
IAL S
TA
TE
ME
NT
S
AN
D S
UP
PLE
ME
NT
AR
Y I
NFO
RM
AT
ION
FIF
TY
TW
O
WE
EK
S E
ND
ING
MA
RC
H 3
1,
20
17
CO
NT
EN
TS
FIN
AN
CIA
L S
TA
TE
ME
NT
S
BA
LA
NC
E S
HE
ET
...
....
....
....
....
....
....
....
....
....
....
....
....
....
....
....
....
....
....
....
....
....
....
1
INC
OM
E S
TA
TE
ME
NT
...
....
....
....
....
....
....
....
....
....
....
....
....
....
....
....
....
....
....
....
....
. 6
CA
SH
FLO
W .
....
....
....
....
....
....
....
....
....
....
....
....
....
....
....
....
....
....
....
....
....
....
....
....
.. 7
ST
AT
EM
EN
T O
F R
ET
AIN
ED
EA
RN
ING
S .
....
....
....
....
....
....
....
....
....
....
....
....
....
....
.. 8
SU
PP
LE
ME
NT
AR
Y I
NFO
RM
AT
ION
SC
HE
DU
LE
OF O
PE
RA
TIO
NS
...
....
....
....
....
....
....
....
....
....
....
....
....
....
....
....
....
....
.. 9
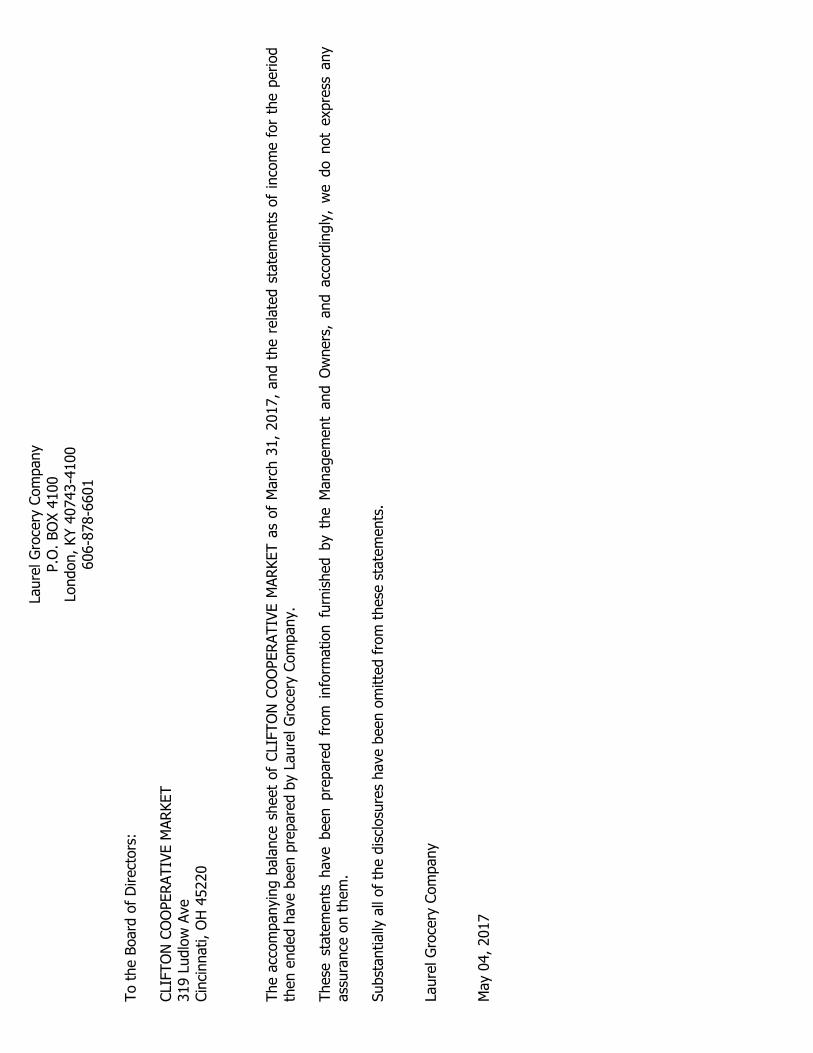
To t
he B
oard
of
Direct
ors
:
CLI
FTO
N C
OO
PERATIV
E M
ARKET
319 L
udlo
w A
veCin
cinnati, O
H 4
5220
The
acc
om
panyi
ng
bala
nce
sheet
of
CLI
FTO
NCO
OPERATIV
EM
ARKET
as
of
Marc
h31,
2017,
and
the
rela
ted
state
ments
of
inco
me
for
the
period
then e
nded h
ave
been p
repare
d b
y La
ure
l G
roce
ry C
om
pany.
These
state
ments
have
been
pre
pare
dfr
om
info
rmation
furn
ished
by
the
Managem
ent
and
Ow
ners
,and
acc
ord
ingly
,w
edo
not
exp
ress
any
ass
ura
nce
on t
hem
.
Subst
antially
all
of
the d
iscl
osu
res
have
been o
mitte
d f
rom
these
sta
tem
ents
.
Laure
l G
roce
ry C
om
pany
May
04, 2017
Laure
l G
roce
ry C
om
pany
P.O
. BO
X 4
100
London, KY 4
0743-4
100
606-8
78-6
601
Laure
l G
roce
ry C
om
pany
P.O
. BO
X 4
100
London, KY 4
0743-4
100
606-8
78-6
601
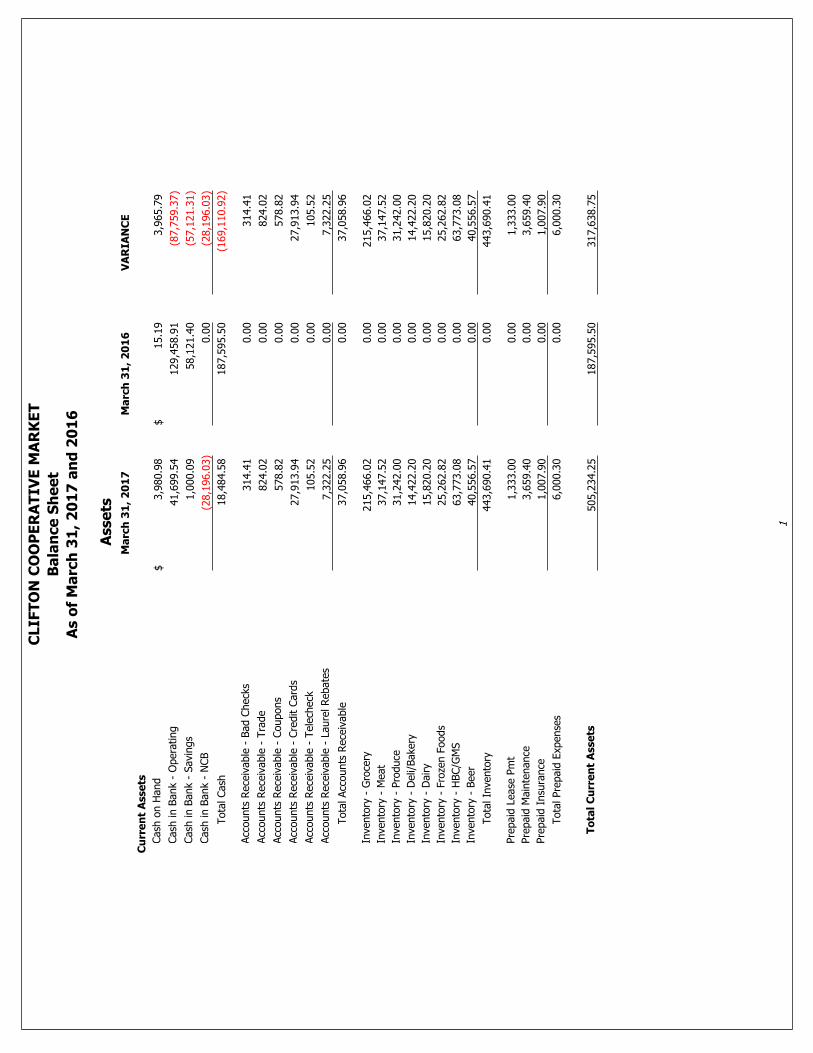
Asse
tsM
arc
h 3
1,
20
17
Ma
rch
31
, 2
01
6V
AR
IAN
CE
Cu
rre
nt
Asse
ts
Cash
on H
and
3,9
80.9
8$
15.1
9$
3,9
65.7
9
Cash
in B
ank
- O
pera
ting
41,6
99.5
4129,4
58.9
1(8
7,7
59.3
7)
Cash
in B
ank
- Savi
ngs
1,0
00.0
958,1
21.4
0(5
7,1
21.3
1)
Cash
in B
ank
- N
CB
(28,1
96.0
3)
0.0
0(2
8,1
96.0
3)
Tota
l Cash
18,4
84.5
8187,5
95.5
0(1
69,1
10.9
2)
Acc
ounts
Rece
ivable
- B
ad C
heck
s314.4
10.0
0314.4
1
Acc
ounts
Rece
ivable
- T
rade
824.0
20.0
0824.0
2
Acc
ounts
Rece
ivable
- C
oupons
578.8
20.0
0578.8
2
Acc
ounts
Rece
ivable
- C
redit C
ard
s27,9
13.9
40.0
027,9
13.9
4
Acc
ounts
Rece
ivable
- T
ele
check
105.5
20.0
0105.5
2
Acc
ounts
Rece
ivable
- L
aure
l Rebate
s7,3
22.2
50.0
07,3
22.2
5
Tota
l Acc
ounts
Rece
ivable
37,0
58.9
60.0
037,0
58.9
6
Inve
nto
ry -
Gro
cery
215,4
66.0
20.0
0215,4
66.0
2
Inve
nto
ry -
Meat
37,1
47.5
20.0
037,1
47.5
2
Inve
nto
ry -
Pro
duce
31,2
42.0
00.0
031,2
42.0
0
Inve
nto
ry -
Deli/
Bake
ry14,4
22.2
00.0
014,4
22.2
0
Inve
nto
ry -
Dairy
15,8
20.2
00.0
015,8
20.2
0
Inve
nto
ry -
Fro
zen F
oods
25,2
62.8
20.0
025,2
62.8
2
Inve
nto
ry -
HBC/G
MS
63,7
73.0
80.0
063,7
73.0
8
Inve
nto
ry -
Beer
40,5
56.5
70.0
040,5
56.5
7
Tota
l In
vento
ry443,6
90.4
10.0
0443,6
90.4
1
Pre
paid
Lease
Pm
t1,3
33.0
00.0
01,3
33.0
0
Pre
paid
Main
tenance
3,6
59.4
00.0
03,6
59.4
0
Pre
paid
Insu
rance
1,0
07.9
00.0
01,0
07.9
0
Tota
l Pre
paid
Exp
ense
s6,0
00.3
00.0
06,0
00.3
0
To
tal
Cu
rre
nt
Asse
ts505,2
34.2
5187,5
95.5
0317,6
38.7
5
CLIF
TO
N C
OO
PE
RA
TIV
E M
AR
KE
T
Ba
lan
ce
Sh
ee
t
As o
f M
arc
h 3
1,
20
17
an
d 2
01
6
1
Ma
rch
31
, 2
01
7M
arc
h 3
1,
20
16
VA
RIA
NC
E
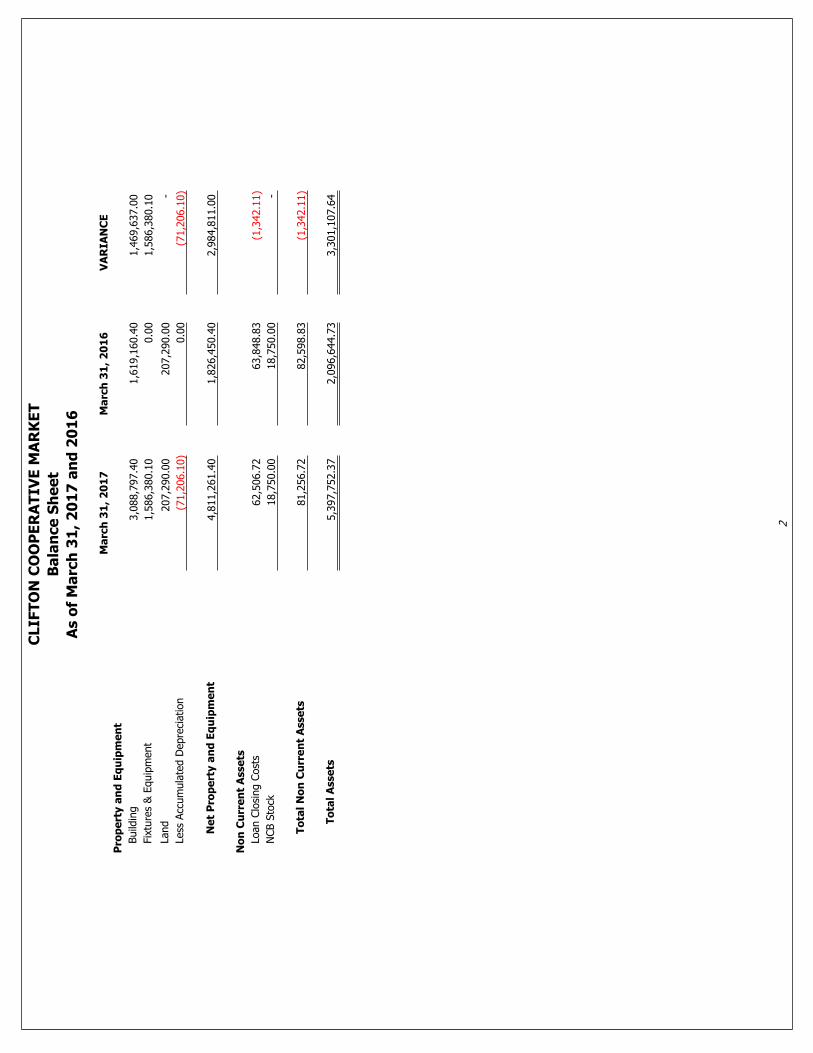
Pro
pe
rty a
nd
Eq
uip
me
nt
Build
ing
3,0
88,7
97.4
01,6
19,1
60.4
01,4
69,6
37.0
0
Fix
ture
s &
Equip
ment
1,5
86,3
80.1
00.0
01,5
86,3
80.1
0
Land
207,2
90.0
0207,2
90.0
0-
Less
Acc
um
ula
ted D
epre
ciation
(71,2
06.1
0)
0.0
0(7
1,2
06.1
0)
Ne
t P
rop
ert
y a
nd
Eq
uip
me
nt
4,8
11,2
61.4
01,8
26,4
50.4
02,9
84,8
11.0
0
No
n C
urr
en
t A
sse
ts
Loan C
losi
ng C
ost
s62,5
06.7
263,8
48.8
3(1
,342.1
1)
NCB S
tock
18,7
50.0
018,7
50.0
0-
To
tal
No
n C
urr
en
t A
sse
ts81,2
56.7
282,5
98.8
3(1
,342.1
1)
To
tal
Asse
ts5,3
97,7
52.3
72,0
96,6
44.7
33,3
01,1
07.6
4
CLIF
TO
N C
OO
PE
RA
TIV
E M
AR
KE
T
Ba
lan
ce
Sh
ee
t
As o
f M
arc
h 3
1,
20
17
an
d 2
01
6
2
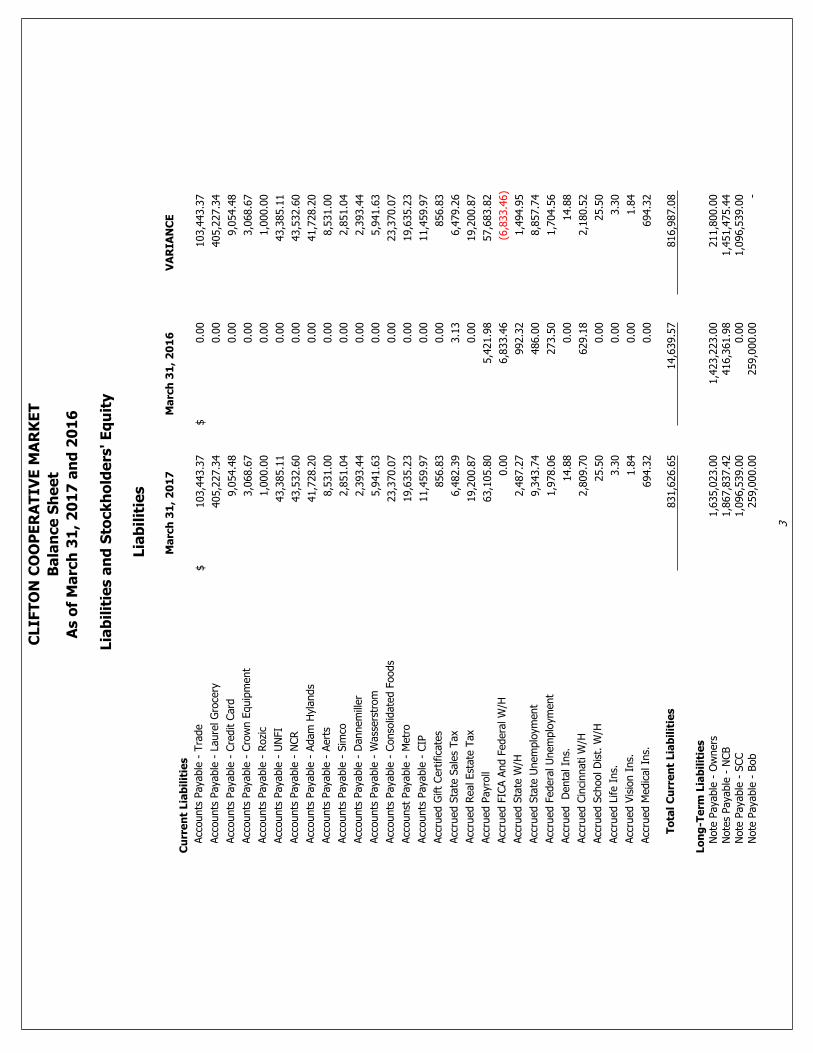
Lia
bil
itie
s a
nd
Sto
ck
ho
lde
rs' E
qu
ity
Lia
bil
itie
s
Ma
rch
31
, 2
01
7M
arc
h 3
1,
20
16
VA
RIA
NC
E
Cu
rre
nt
Lia
bil
itie
s
Acc
ounts
Paya
ble
- T
rade
103,4
43.3
7$
0.0
0$
103,4
43.3
7
Acc
ounts
Paya
ble
- L
aure
l G
roce
ry405,2
27.3
40.0
0405,2
27.3
4
Acc
ounts
Paya
ble
- C
redit C
ard
9,0
54.4
80.0
09,0
54.4
8
Acc
ounts
Paya
ble
- C
row
n E
quip
ment
3,0
68.6
70.0
03,0
68.6
7
Acc
ounts
Paya
ble
- R
ozi
c1,0
00.0
00.0
01,0
00.0
0
Acc
ounts
Paya
ble
- U
NFI
43,3
85.1
10.0
043,3
85.1
1
Acc
ounts
Paya
ble
- N
CR
43,5
32.6
00.0
043,5
32.6
0
Acc
ounts
Paya
ble
- A
dam
Hyl
ands
41,7
28.2
00.0
041,7
28.2
0
Acc
ounts
Paya
ble
- A
ert
s8,5
31.0
00.0
08,5
31.0
0
Acc
ounts
Paya
ble
- S
imco
2,8
51.0
40.0
02,8
51.0
4
Acc
ounts
Paya
ble
- D
annem
iller
2,3
93.4
40.0
02,3
93.4
4
Acc
ounts
Paya
ble
- W
ass
ers
trom
5,9
41.6
30.0
05,9
41.6
3
Acc
ounts
Paya
ble
- C
onso
lidate
d F
oods
23,3
70.0
70.0
023,3
70.0
7
Acc
ounst
Paya
ble
- M
etr
o19,6
35.2
30.0
019,6
35.2
3
Acc
ounts
Paya
ble
- C
IP11,4
59.9
70.0
011,4
59.9
7
Acc
rued G
ift
Cert
ific
ate
s856.8
30.0
0856.8
3
Acc
rued S
tate
Sale
s Tax
6,4
82.3
93.1
36,4
79.2
6
Acc
rued R
eal Est
ate
Tax
19,2
00.8
70.0
019,2
00.8
7
Acc
rued P
ayr
oll
63,1
05.8
05,4
21.9
857,6
83.8
2
Acc
rued F
ICA A
nd F
edera
l W
/H0.0
06,8
33.4
6(6
,833.4
6)
Acc
rued S
tate
W/H
2,4
87.2
7992.3
21,4
94.9
5
Acc
rued S
tate
Unem
plo
yment
9,3
43.7
4486.0
08,8
57.7
4
Acc
rued F
edera
l U
nem
plo
yment
1,9
78.0
6273.5
01,7
04.5
6
Acc
rued
Denta
l In
s.14.8
80.0
014.8
8
Acc
rued C
inci
nnati W
/H2,8
09.7
0629.1
82,1
80.5
2
Acc
rued S
chool D
ist.
W/H
25.5
00.0
025.5
0
Acc
rued L
ife I
ns.
3.3
00.0
03.3
0
Acc
rued V
isio
n I
ns.
1.8
40.0
01.8
4
Acc
rued M
edic
al In
s.694.3
20.0
0694.3
2
To
tal
Cu
rre
nt
Lia
bil
itie
s831,6
26.6
514,6
39.5
7816,9
87.0
8
Lo
ng
-Te
rm L
iab
ilit
ies
Note
Paya
ble
- O
wners
1,6
35,0
23.0
01,4
23,2
23.0
0211,8
00.0
0N
ote
s Paya
ble
- N
CB
1,8
67,8
37.4
2416,3
61.9
81,4
51,4
75.4
4N
ote
Paya
ble
- S
CC
1,0
96,5
39.0
00.0
01,0
96,5
39.0
0N
ote
Paya
ble
- B
ob
259,0
00.0
0259,0
00.0
0-
CLIF
TO
N C
OO
PE
RA
TIV
E M
AR
KE
T
Ba
lan
ce
Sh
ee
t
As o
f M
arc
h 3
1,
20
17
an
d 2
01
6
3
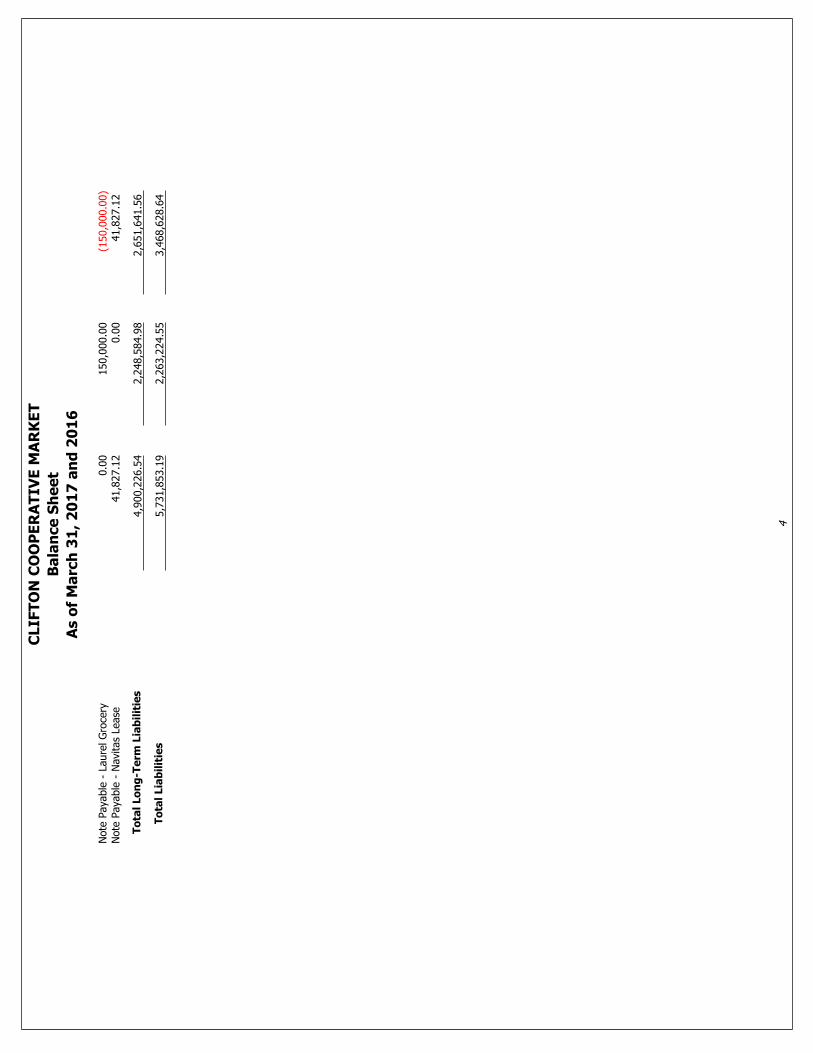
Note
Paya
ble
- L
aure
l G
roce
ry0.0
0150,0
00.0
0(1
50,0
00.0
0)
Note
Paya
ble
- N
avi
tas
Lease
41,8
27.1
20.0
041,8
27.1
2
To
tal
Lo
ng
-Te
rm L
iab
ilit
ies
4,9
00,2
26.5
42,2
48,5
84.9
82,6
51,6
41.5
6
To
tal
Lia
bil
itie
s5,7
31,8
53.1
92,2
63,2
24.5
53,4
68,6
28.6
4
CLIF
TO
N C
OO
PE
RA
TIV
E M
AR
KE
T
Ba
lan
ce
Sh
ee
t
As o
f M
arc
h 3
1,
20
17
an
d 2
01
6
4
Sto
ck
ho
lde
rs' E
qu
ity
Ma
rch
31
, 2
01
7M
arc
h 3
1,
20
16
VA
RIA
NC
E
Sto
ck
ho
lde
rs' E
qu
ity
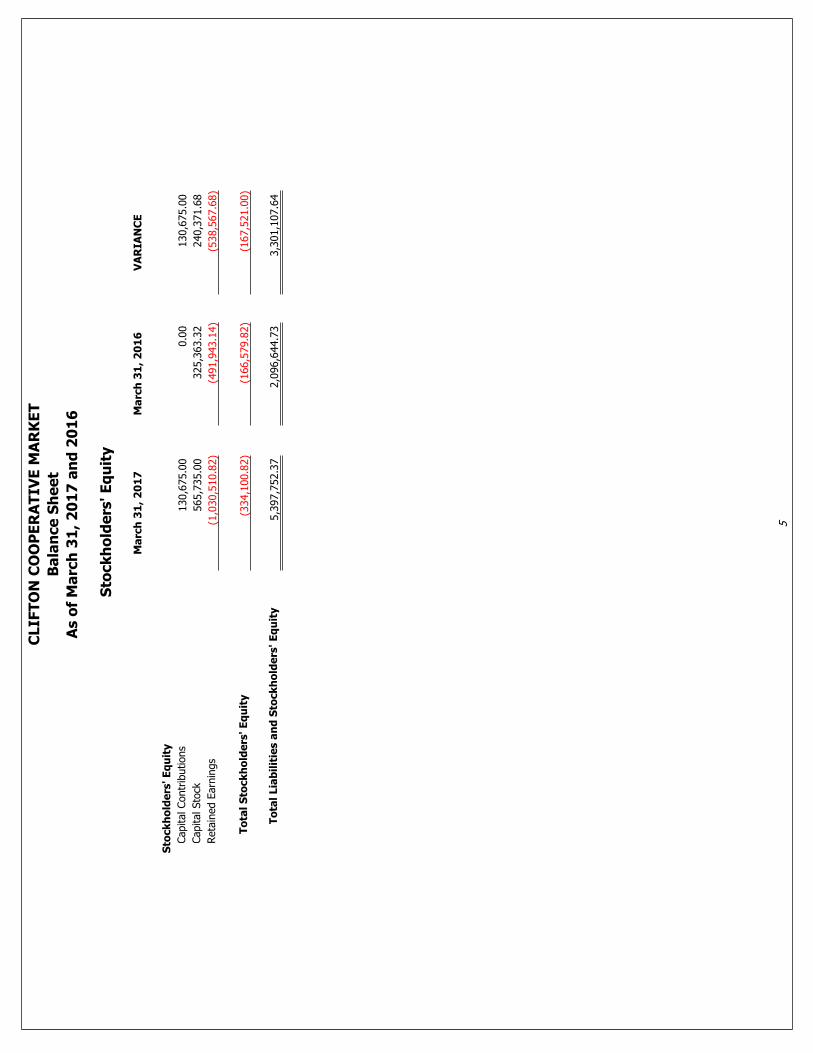
Capital Contr
ibutions
130,6
75.0
00.0
0130,6
75.0
0
Capital Sto
ck565,7
35.0
0325,3
63.3
2240,3
71.6
8
Reta
ined E
arn
ings
(1,0
30,5
10.8
2)
(491,9
43.1
4)
(538,5
67.6
8)
To
tal
Sto
ck
ho
lde
rs' E
qu
ity
(334,1
00.8
2)
(166,5
79.8
2)
(167,5
21.0
0)
To
tal
Lia
bil
itie
s a
nd
Sto
ck
ho
lde
rs' E
qu
ity
5,3
97,7
52.3
72,0
96,6
44.7
33,3
01,1
07.6
4
CLIF
TO
N C
OO
PE
RA
TIV
E M
AR
KE
T
Ba
lan
ce
Sh
ee
t
As o
f M
arc
h 3
1,
20
17
an
d 2
01
6
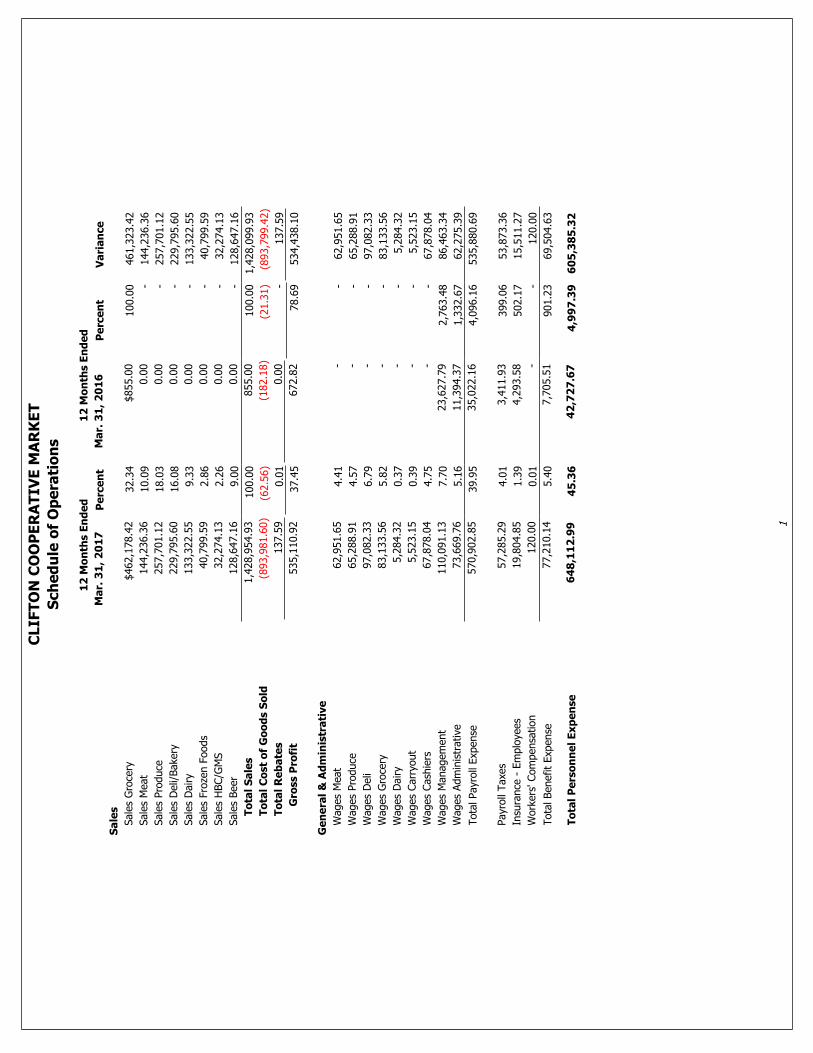
5
12
Mo
nth
s E
nd
ed
12
Mo
nth
s E
nd
ed
Ma
r. 3
1,
20
17
Pe
rce
nt
Ma
r. 3
1,
20
16
Pe
rce
nt
Va
ria
nce
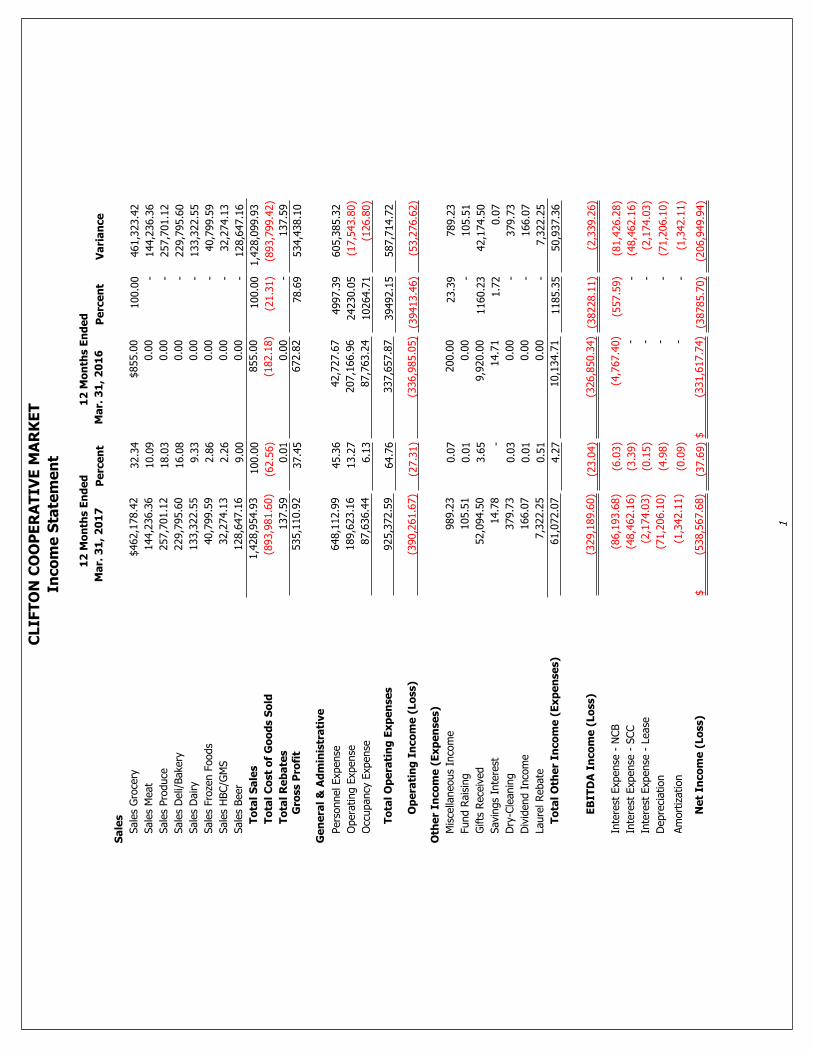
Sa
les
Sale
s G
roce
ry$462,1
78.4
232.3
4$855.0
0100.0
0461,3
23.4
2
Sale
s M
eat
144,2
36.3
610.0
90.0
0-
144,2
36.3
6
Sale
s Pro
duce
257,7
01.1
218.0
30.0
0-
257,7
01.1
2
Sale
s D
eli/
Bake
ry229,7
95.6
016.0
80.0
0-
229,7
95.6
0
Sale
s D
airy
133,3
22.5
59.3
30.0
0-
133,3
22.5
5
Sale
s Fro
zen F
oods
40,7
99.5
92.8
60.0
0-
40,7
99.5
9
Sale
s H
BC/G
MS
32,2
74.1
32.2
60.0
0-
32,2
74.1
3
Sale
s Beer
128,6
47.1
69.0
00.0
0-
128,6
47.1
6
To
tal
Sa
les
1,4
28,9
54.9
3100.0
0855.0
0100.0
01,4
28,0
99.9
3
To
tal
Co
st
of
Go
od
s S
old
(893,9
81.6
0)
(62.5
6)
(182.1
8)
(21.3
1)
(893,7
99.4
2)
To
tal
Re
ba
tes
137.5
90.0
10.0
0-
137.5
9G
ross P
rofi
t535,1
10.9
237.4
5672.8
278.6
9534,4
38.1
0
Ge
ne
ral
& A
dm
inis
tra
tive
Pers
onnel Exp
ense
648,1
12.9
945.3
642,7
27.6
74997.3
9605,3
85.3
2
Opera
ting E
xpense
189,6
23.1
613.2
7207,1
66.9
624230.0
5(1
7,5
43.8
0)
Occ
upancy
Exp
ense
87,6
36.4
46.1
387,7
63.2
410264.7
1(1
26.8
0)
To
tal
Op
era
tin
g E
xp
en
se
s925,3
72.5
964.7
6337,6
57.8
739492.1
5587,7
14.7
2
Op
era
tin
g I
nco
me
(Lo
ss)
(390,2
61.6
7)
(27.3
1)
(336,9
85.0
5)
(39413.4
6)
(53,2
76.6
2)
Oth
er
Inco
me
(E
xp
en
se
s)
Mis
cella
neous
Inco
me
989.2
30.0
7200.0
023.3
9789.2
3
Fund R
ais
ing
105.5
10.0
10.0
0-
105.5
1
Gifts
Rece
ived
52,0
94.5
03.6
59,9
20.0
01160.2
342,1
74.5
0
Savi
ngs
Inte
rest
14.7
8-
14.7
11.7
20.0
7
Dry
-Cle
anin
g379.7
30.0
30.0
0-
379.7
3
Div
idend I
nco
me
166.0
70.0
10.0
0-
166.0
7
Laure
l Rebate
7,3
22.2
50.5
10.0
0-
7,3
22.2
5
To
tal
Oth
er
Inco
me
(E
xp
en
se
s)
61,0
72.0
74.2
710,1
34.7
11185.3
550,9
37.3
6
EB
ITD
A I
nco
me
(Lo
ss)
(329,1
89.6
0)
(23.0
4)
(326,8
50.3
4)
(38228.1
1)
(2,3
39.2
6)
Inte
rest
Exp
ense
- N
CB
(86,1
93.6
8)
(6.0
3)
(4,7
67.4
0)
(557.5
9)
(81,4
26.2
8)
Inte
rest
Exp
ense
- S
CC
(48,4
62.1
6)
(3.3
9)
--
(48,4
62.1
6)
Inte
rest
Exp
ense
- L
ease
(2,1
74.0
3)
(0.1
5)
--
(2,1
74.0
3)
Depre
ciation
(71,2
06.1
0)
(4.9
8)
--
(71,2
06.1
0)
Am
ort
ization
(1,3
42.1
1)
(0.0
9)
--
(1,3
42.1
1)
Ne
t In
co
me
(Lo
ss)
(538,5
67.6
8)
$(3
7.6
9)
(331,6
17.7
4)
$(3
8785.7
0)
(206,9
49.9
4)
CLIF
TO
N C
OO
PE
RA
TIV
E M
AR
KE
T
Inco
me
Sta
tem
en
t
1
12
Mo
nth
s E
nd
ed
Ma
rch
31
, 2
01
7
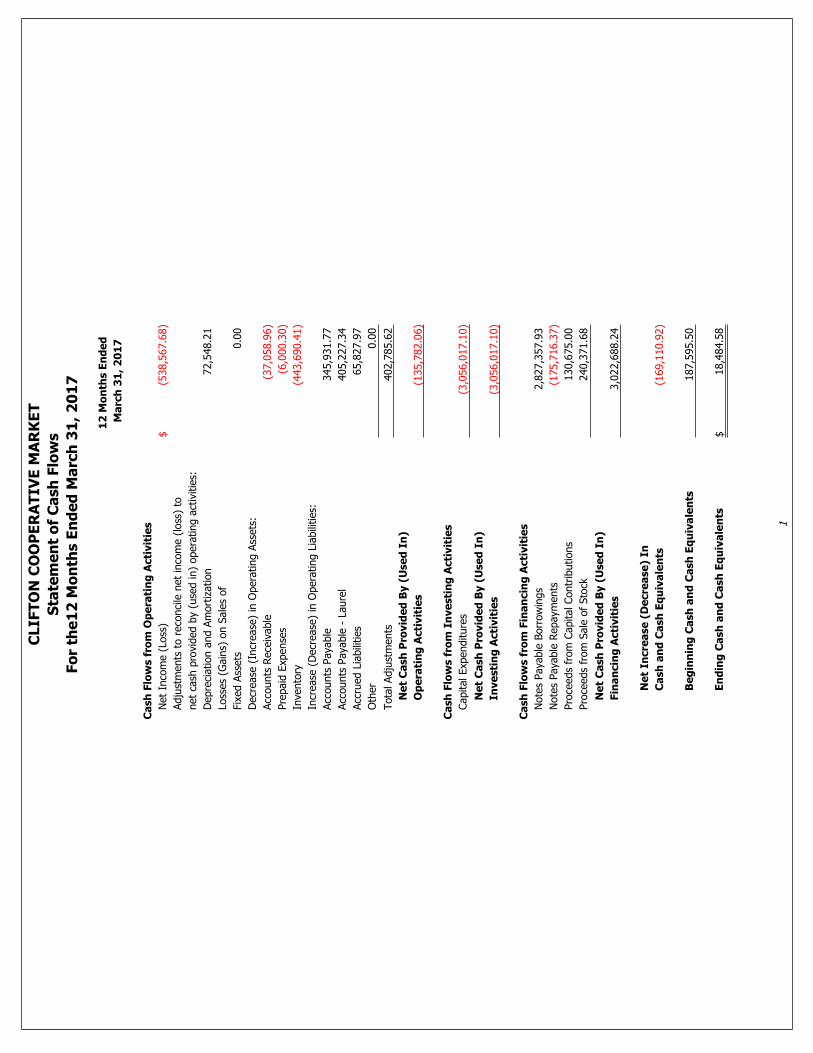
Ca
sh
Flo
ws f
rom
Op
era
tin
g A
cti
vit
ies
Net
Inco
me (
Loss
)(5
38,5
67.6
8)
$
Adju
stm
ents
to r
eco
nci
le n
et
inco
me (
loss
) to
net
cash
pro
vided b
y (u
sed in)
opera
ting a
ctiv
itie
s:
Depre
ciation a
nd A
mort
ization
72,5
48.2
1
Loss
es
(Gain
s) o
n S
ale
s of
Fix
ed A
ssets
0.0
0
Decr
ease
(In
crease
) in
Opera
ting A
ssets
:
Acc
ounts
Rece
ivable
(37,0
58.9
6)
Pre
paid
Exp
ense
s(6
,000.3
0)
Inve
nto
ry(4
43,6
90.4
1)
Incr
ease
(D
ecr
ease
) in
Opera
ting L
iabili
ties:
Acc
ounts
Paya
ble
345,9
31.7
7
Acc
ounts
Paya
ble
- L
aure
l405,2
27.3
4
Acc
rued L
iabili
ties
65,8
27.9
7
Oth
er
0.0
0
Tota
l Adju
stm
ents
402,7
85.6
2
Ne
t C
ash
Pro
vid
ed
By (
Use
d I
n)
Op
era
tin
g A
cti
vit
ies
(135,7
82.0
6)
Ca
sh
Flo
ws f
rom
In
ve
sti
ng
Acti
vit
ies
Capital Exp
enditure
s(3
,056,0
17.1
0)
Ne
t C
ash
Pro
vid
ed
By (
Use
d I
n)
Inve
sti
ng
Acti
vit
ies
(3,0
56,0
17.1
0)
Ca
sh
Flo
ws f
rom
Fin
an
cin
g A
cti
vit
ies
Note
s Paya
ble
Borr
ow
ings
2,8
27,3
57.9
3
Note
s Paya
ble
Repaym
ents
(175,7
16.3
7)
Pro
ceeds
from
Capital Contr
ibutions
130,6
75.0
0
Pro
ceeds
from
Sale
of
Sto
ck240,3
71.6
8
Ne
t C
ash
Pro
vid
ed
By (
Use
d I
n)
Fin
an
cin
g A
cti
vit
ies
3,0
22,6
88.2
4
Ne
t In
cre
ase
(D
ecre
ase
) In
Ca
sh
an
d C
ash
Eq
uiv
ale
nts
(169,1
10.9
2)
Be
gin
nin
g C
ash
an
d C
ash
Eq
uiv
ale
nts
187,5
95.5
0
En
din
g C
ash
an
d C
ash
Eq
uiv
ale
nts
18,4
84.5
8$
CLIF
TO
N C
OO
PE
RA
TIV
E M
AR
KE
T
Sta
tem
en
t o
f C
ash
Flo
ws
Fo
r th
e1
2 M
on
ths E
nd
ed
Ma
rch
31
, 2
01
7
1
12
Mo
nth
s E
nd
ed
12
Mo
nth
s E
nd
ed
Ma
rch
31
, 2
01
7M
arc
h 3
1,
20
16
Va
ria
nce
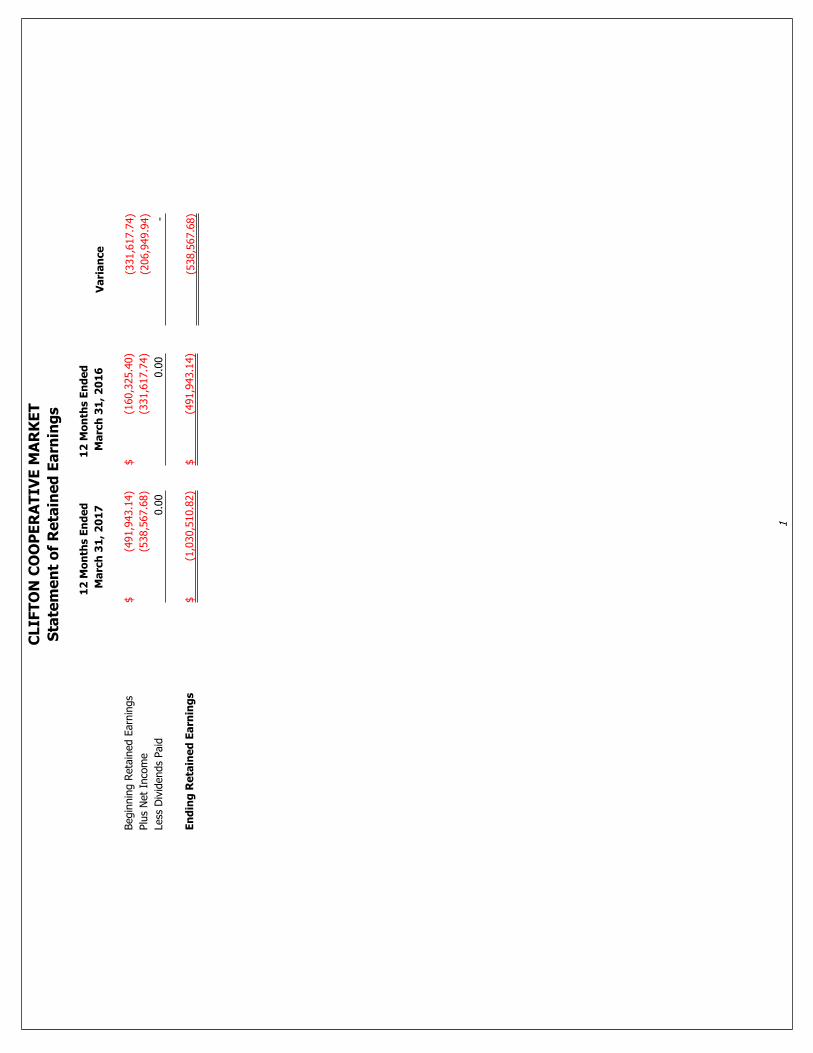
Begin
nin
g R
eta
ined E
arn
ings
(491,9
43.1
4)
$(1
60,3
25.4
0)
$(3
31,6
17.7
4)
Plu
s N
et
Inco
me
(538,5
67.6
8)
(331,6
17.7
4)
(206,9
49.9
4)
Less
Div
idends
Paid
0.0
00.0
0-
En
din
g R
eta
ine
d E
arn
ing
s(1
,030,5
10.8
2)
$(4
91,9
43.1
4)
$(5
38,5
67.6
8)
CLIF
TO
N C
OO
PE
RA
TIV
E M
AR
KE
T
Sta
tem
en
t o
f R
eta
ine
d E
arn
ing
s
1
12
Mo
nth
s E
nd
ed
12
Mo
nth
s E
nd
ed
Ma
r. 3
1,
20
17
Pe
rce
nt
Ma
r. 3
1,
20
16
Pe
rce
nt
Va
ria
nce
Sa
les
Sale
s G
roce
ry$462,1
78.4
232.3
4$855.0
0100.0
0461,3
23.4
2
Sale
s M
eat
144,2
36.3
610.0
90.0
0-
144,2
36.3
6
Sale
s Pro
duce
257,7
01.1
218.0
30.0
0-
257,7
01.1
2
Sale
s D
eli/
Bake
ry229,7
95.6
016.0
80.0
0-
229,7
95.6
0
Sale
s D
airy
133,3
22.5
59.3
30.0
0-
133,3
22.5
5
Sale
s Fro
zen F
oods
40,7
99.5
92.8
60.0
0-
40,7
99.5
9
Sale
s H
BC/G
MS
32,2
74.1
32.2
60.0
0-
32,2
74.1
3
Sale
s Beer
128,6
47.1
69.0
00.0
0-
128,6
47.1
6
To
tal
Sa
les
1,4
28,9
54.9
3100.0
0855.0
0100.0
01,4
28,0
99.9
3
To
tal
Co
st
of
Go
od
s S
old
(893,9
81.6
0)
(62.5
6)
(182.1
8)
(21.3
1)
(893,7
99.4
2)
To
tal
Re
ba
tes
137.5
90.0
10.0
0-
137.5
9
Gro
ss P
rofi
t535,1
10.9
237.4
5672.8
278.6
9534,4
38.1
0
Ge
ne
ral
& A
dm
inis
tra
tive
Wages
Meat
62,9
51.6
54.4
1-
-62,9
51.6
5
Wages
Pro
duce
65,2
88.9
14.5
7-
-65,2
88.9
1
Wages
Deli
97,0
82.3
36.7
9-
-97,0
82.3
3
Wages
Gro
cery
83,1
33.5
65.8
2-
-83,1
33.5
6
Wages
Dairy
5,2
84.3
20.3
7-
-5,2
84.3
2
Wages
Carr
yout
5,5
23.1
50.3
9-
-5,5
23.1
5
Wages
Cash
iers
67,8
78.0
44.7
5-
-67,8
78.0
4
Wages
Managem
ent
110,0
91.1
37.7
023,6
27.7
92,7
63.4
886,4
63.3
4
Wages
Adm
inis
trative
73,6
69.7
65.1
611,3
94.3
71,3
32.6
762,2
75.3
9
Tota
l Payr
oll
Exp
ense
570,9
02.8
539.9
535,0
22.1
64,0
96.1
6535,8
80.6
9
Payr
oll
Taxe
s57,2
85.2
94.0
13,4
11.9
3399.0
653,8
73.3
6
Insu
rance
- E
mplo
yees
19,8
04.8
51.3
94,2
93.5
8502.1
715,5
11.2
7
Work
ers
' Com
pensa
tion
120.0
00.0
1-
-120.0
0
Tota
l Benefit
Exp
ense
77,2
10.1
45.4
07,7
05.5
1901.2
369,5
04.6
3
To
tal
Pe
rso
nn
el
Ex
pe
nse
64
8,1
12
.99
45
.36
42
,72
7.6
74
,99
7.3
96
05
,38
5.3
2
CLIF
TO
N C
OO
PE
RA
TIV
E M
AR
KE
T
Sch
ed
ule
of
Op
era
tio
ns
1
12
Mo
nth
s E
nd
ed
12
Mo
nth
s E
nd
ed
Ma
r. 3
1,
20
17
Pe
rce
nt
Ma
r. 3
1,
20
16
Pe
rce
nt
Va
ria
nce
Auto
Exp
ense
--
5.0
00.5
8(5
.00)
Tra
vel &
Ente
rtain
ment
1,6
42.7
50.1
11,9
57.3
2228.9
3(3
14.5
7)
Contr
ibutions
300.0
00.0
2-
-300.0
0
Legal &
Acc
ounting
20,5
47.4
01.4
48,0
00.0
0935.6
712,5
47.4
0
Consu
ltants
52,9
83.6
43.7
1164,9
37.6
819,2
90.9
6(1
11,9
54.0
4)
Tax
& L
icense
s2,9
02.8
00.2
0360.0
042.1
12,5
42.8
0
Tele
phone
3,9
82.5
80.2
82,3
32.4
0272.8
01,6
50.1
8
Onlin
e S
erv
ices
7,7
00.3
90.5
42,8
69.8
6335.6
64,8
30.5
3
Dues
& S
ubsc
riptions
1,2
40.0
00.0
95,8
88.0
0688.6
5(4
,648.0
0)
Bank
Serv
ice C
harg
es
1,8
07.9
50.1
3111.0
012.9
81,6
96.9
5
Post
age
415.7
90.0
31,0
68.6
9124.9
9(6
52.9
0)
LGC T
ote
s(7
.00)
--
-(7
.00)
Laundry
& D
ust
Serv
ice
3,0
89.5
10.2
2-
-3,0
89.5
1
MSI/
Host
ing
340.0
00.0
2-
-340.0
0
Aderg
y85.9
70.0
1-
-85.9
7
Fre
ight
& D
eliv
ery
Charg
e4,2
06.0
00.2
9-
-4,2
06.0
0
Cash
(O
ver)
/Short
(165.0
7)
(0.0
1)
--
(165.0
7)
Eve
nts
Exp
ense
--
1,8
52.1
4216.6
2(1
,852.1
4)
Cre
dit C
ard
Dis
counts
& F
ees
9,3
28.0
60.6
5998.1
3116.7
48,3
29.9
3
Sale
s Tax
Exp
ense
--
147.6
117.2
6(1
47.6
1)
110,4
00.7
77.7
3190,5
27.8
322,2
83.9
6(8
0,1
27.0
6)
Supplie
s M
eat
14,6
38.9
31.0
2-
-14,6
38.9
3
Supplie
s D
eli
1,8
76.1
30.1
3-
-1,8
76.1
3
Off
ice S
upplie
s5,2
80.9
30.3
788.3
010.3
35,1
92.6
3
Supplie
s Sto
re29,6
74.1
32.0
82,1
94.8
6256.7
127,4
79.2
7
Tota
l Supplie
s51,4
70.1
23.6
02,2
83.1
6267.0
449,1
86.9
6
Equip
ment
Repairs
& M
ain
tenance
823.6
00.0
6-
-823.6
0
Tota
l Repairs
& M
ain
tenance
823.6
00.0
6-
-823.6
0
Dis
counts
1,6
16.5
60.1
1-
-1,6
16.5
6
Adve
rtis
ing
21,5
12.7
91.5
114,3
55.9
71,6
79.0
67,1
56.8
2
Adve
rtis
ing L
aure
l G
roce
ry3,4
58.9
30.2
4-
-3,4
58.9
3
Adve
rtis
ing -
Pro
motions
340.3
90.0
2-
-340.3
9
Tota
l Adve
rtis
ing
26,9
28.6
71.8
814,3
55.9
71,6
79.0
612,5
72.7
0
To
tal
Op
era
tin
g E
xp
en
se
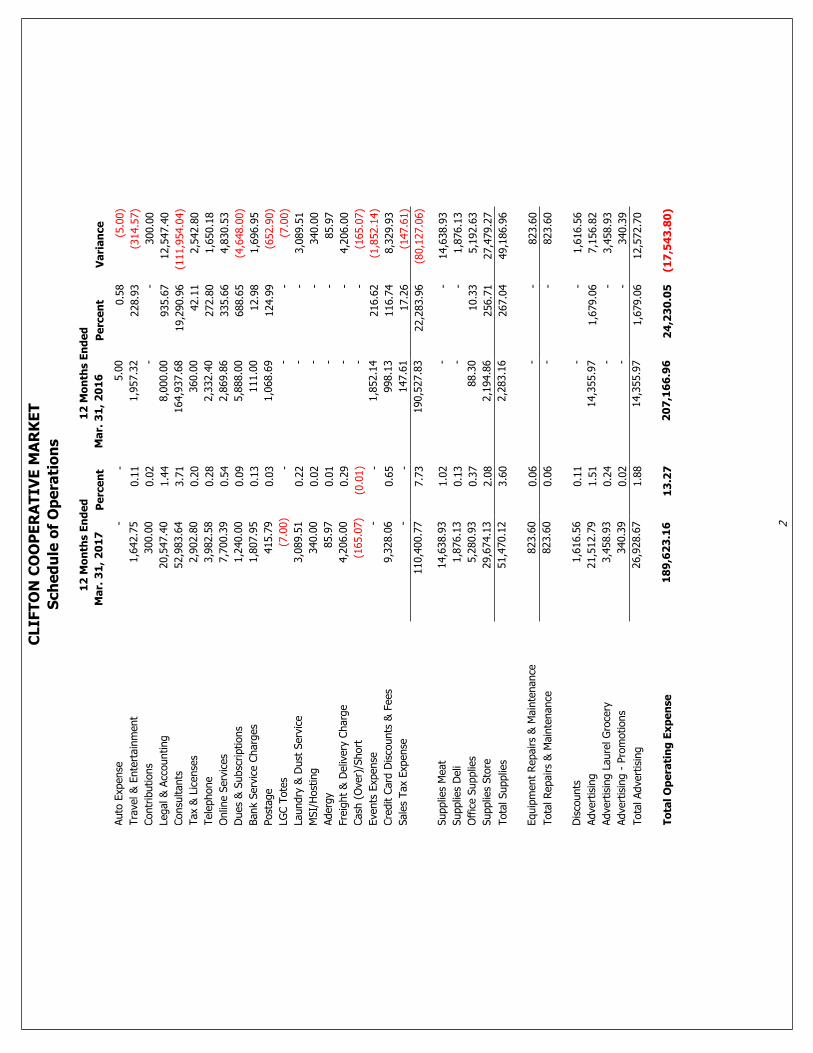
18
9,6
23
.16
13
.27
20
7,1
66
.96
24
,23
0.0
5(1
7,5
43
.80
)
CLIF
TO
N C
OO
PE
RA
TIV
E M
AR
KE
T
Sch
ed
ule
of
Op
era
tio
ns
2
12
Mo
nth
s E
nd
ed
12
Mo
nth
s E
nd
ed
Ma
r. 3
1,
20
17
Pe
rce
nt
Ma
r. 3
1,
20
16
Pe
rce
nt
Va
ria
nce
Build
ing R
epairs
& U
pke
ep
10,6
34.0
50.7
42,0
59.4
9240.8
88,5
74.5
6
Ext
erm
inato
r321.0
00.0
2-
-321.0
0
Insu
rance
- P
ropert
y11,0
81.0
00.7
86,8
98.0
0806.7
84,1
83.0
0
Taxe
s -
Pro
pert
y45,7
79.7
93.2
064,0
54.2
57,4
91.7
3(1
8,2
74.4
6)
Wate
r14,2
34.4
11.0
0873.9
1102.2
113,3
60.5
0
Ele
ctric
1,1
80.3
80.0
88,2
18.2
3961.2
0(7
,037.8
5)
Gas
4,4
05.8
10.3
15,6
59.3
6661.9
1(1
,253.5
5)
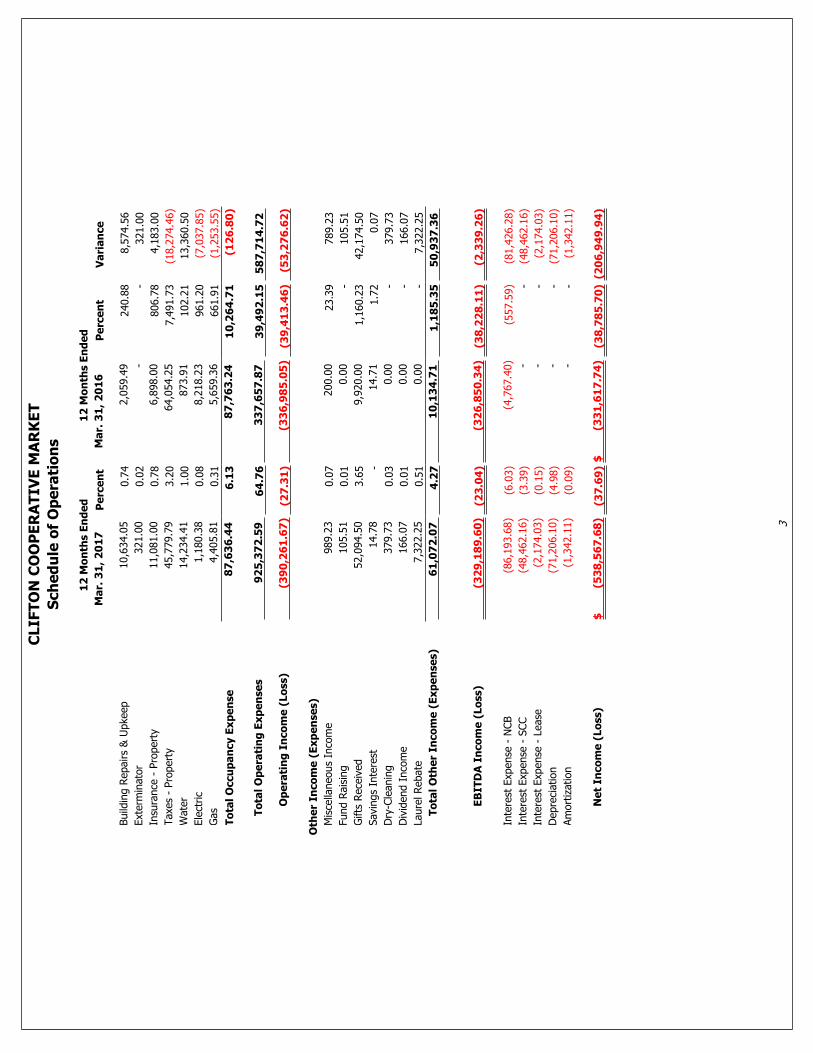
To
tal
Occu
pa
ncy E
xp
en
se
87
,63
6.4
46
.13
87
,76
3.2
41
0,2
64
.71
(12
6.8
0)
To
tal
Op
era
tin
g E
xp
en
se
s9
25
,37
2.5
96
4.7
63
37
,65
7.8
73
9,4
92
.15
58
7,7
14
.72
Op
era
tin
g I
nco
me
(Lo
ss)
(39
0,2
61
.67
)(2
7.3
1)
(33
6,9
85
.05
)(3
9,4
13
.46
)(5
3,2
76
.62
)
Oth
er
Inco
me
(E
xp
en
se
s)
Mis
cella
neous
Inco
me
989.2
30.0
7200.0
023.3
9789.2
3
Fund R
ais
ing
105.5
10.0
10.0
0-
105.5
1
Gifts
Rece
ived
52,0
94.5
03.6
59,9
20.0
01,1
60.2
342,1
74.5
0
Savi
ngs
Inte
rest
14.7
8-
14.7
11.7
20.0
7
Dry
-Cle
anin
g379.7
30.0
30.0
0-
379.7
3
Div
idend I
nco
me
166.0
70.0
10.0
0-
166.0
7
Laure
l Rebate
7,3
22.2
50.5
10.0
0-
7,3
22.2
5
To
tal
Oth
er
Inco
me
(E
xp
en
se
s)
61
,07
2.0
74
.27
10
,13
4.7
11
,18
5.3
55
0,9
37
.36
EB
ITD
A I
nco
me
(Lo
ss)
(32
9,1
89
.60
)(2
3.0
4)
(32
6,8
50
.34
)(3
8,2
28
.11
)(2
,33
9.2
6)
Inte
rest
Exp
ense
- N
CB
(86,1
93.6
8)
(6.0
3)
(4,7
67.4
0)
(557.5
9)
(81,4
26.2
8)
Inte
rest
Exp
ense
- S
CC
(48,4
62.1
6)
(3.3
9)
--
(48,4
62.1
6)
Inte
rest
Exp
ense
- L
ease
(2,1
74.0
3)
(0.1
5)
--
(2,1
74.0
3)
Depre
ciation
(71,2
06.1
0)
(4.9
8)
--
(71,2
06.1
0)
Am
ort
ization
(1,3
42.1
1)
(0.0
9)
--
(1,3
42.1
1)
Ne
t In
co
me
(Lo
ss)
(53
8,5
67
.68
)$
(37
.69
)(3
31
,61
7.7
4)
$(3
8,7
85
.70
)(2
06
,94
9.9
4)
CLIF
TO
N C
OO
PE
RA
TIV
E M
AR
KE
T
Sch
ed
ule
of
Op
era
tio
ns
3