Embed Size (px)
Citation preview
1
Share of Children in the Assam Budget
Share of Children in the Assam Budget An Analysis of the Allocations 2004-05 to 2007-08
Pranami GargMadhumita Purkayastha
North Eastern Social Research Centre, GuwahatiAnd
HAQ: Centre for Child Rights, New Delhi2008
2
Share of Children in the Assam Budget
© 2008, North Eastern Social Research Centre, Guwahati and HAQ Centre for Child Rights, New Delhi
Permission to produce any part of the project is required from:
North Eastern Social Research Centre110, Kharghuli Road (1st floor)Guwahati-781004, Assam, IndiaTelephone: 91-361-2602819Telefax: 91-361-2732629 (Attn NESRC)Email: [email protected]/CollaborativeMinistry/NESRC
AND
HAQ: Centre for Child Rights208 Shahpur JatNew Delhi 110049, IndiaTelephone: 91-11-26490136Telefax: 91-11-26492551www.haqcrc.org
Research Team
NESRCPranami GargWalter Fernandes
HAQ: Centre for Child RightsMadhumita PurkayasthaEnakshi Ganguly Thukral
Supported by: Sir Dorabjee Tata Trust
PRINTED BY : UDITA OFFSETLakhtakia, Guwahati -1Ph. No. : 0361-2545251
3
Share of Children in the Assam Budget
Content
Preface
1. Chapter-1 : Introduction 2-3
2. Chapter-2 : Budget for children in the Assam Budget :An Overview
3. Chapter-3 : Development
4. Chapter-4 : Health
5. Chapter-5 : Education
6. Chapter-6 : Protection
7. Chapter-7 : Conclusion
8. References
4
Share of Children in the Assam Budget
Preface
Over the last decade, countries across the world have embarked on changing existingeconomic models in favour of ones driven by the free market, incorporating processes of
liberalisation, privatisation and globalisation.While the markets boom, and some becomericher, at the other end of the spectrumare growing disparities between the rich andthe poor, depletion of natural resources andloss of traditional livelihoods, forcedmigration, consumerism and violence. It hasalso meant privatisation of services,
cutbacks in some services lending them inaccessible to the poor. India too has witnessed thesechanges.
Recognising that budgets are an important tool for monitoring the government’simplementation of child rights, HAQ undertook a decadal analysis of the Union Budget from achild rights perspective, which was published in 2002. This was the first endeavour of its kind inthe country and it helped in understanding the process of budgeting and establishing the need forsuch analysis along with developing a methodology for the same. Recognising that since a largeshare of the allocation and expenditure is made in the states, a study of the state budgets isessential to enable a holistic understanding, HAQ initiated a similar analysis in three states - AndhraPradesh, Orissa and Himachal Pradesh. However, if children’s budget work at the state level is tobecome a reality, it is important to empower local NGOs to undertake such initiatives, develop acommon methodology and provide requisite technical assistance. Once the ground is set, usingthe findings effectively for advocacy at the state, district and local levels of governance is a naturalprocess, especially if such analysis is carried out by an agency/organisation based in the state.HAQ began child budget analysis work in three states in 2002 in partnership with state levelNGOs - Andhra Pradesh (with M.V. Foundation), Orissa (with Open Learning Systems) andHimachal Pradesh (with Himachal Pradesh Voluntary Health Association-HPVHA).
In the current phase of this partnership initiative between HAQ and state partners, it hasinitiated budget for children (BfC) analysis in Assam in partnership with North Eastern SocialResearch Centre (NESRC), Guwahati. This is the first report from the state.
In all Budget for Children work is being carried on in 6 states- Andhra Pradesh, HimachalPradesh, West Bengal (with support from Ford Foundation), Assam and Uttar Pradesh (withsupport from Sir Dorabjee Tata Trust) and Jharkhand (with support from CRY).
Budget for children is not a separate budget.It is merely an attempt to disaggregate fromthe overall budget the allocations madespecifically for programmes that benefitchildren.
5
Share of Children in the Assam Budget
Budget analysis will only continue to be numbers unless it is used for effective advocacy.Our experience has shown that child budgets can be an effective monitoring and advocacy tool.While advocacy and lobbying with the Government of India has institutionalised child budgetingat the national level, HAQ’s partner organizations, as well as other human rights networks andcampaigns have also used it for advocacy. For example, HAQ’s child budget analysis has been usedto file legal petitions, for strengthening arguments of various campaigns such as the Right to Foodcampaign, for raising questions in the Parliament and debating on various pending bills, includingthe 93rd Constitutional Amendment. At the international level, findings from child budget analysiswork have been used to make submissions and prepare shadow reports to the UN Committee onthe Rights of the Child.
It is hoped that this analysis will help in getting a better understanding of the nature ofresources required for children in Assam, and help child rights activists and advocates, plannersand policy makers.
This study would not have been possible without the support of Sir Dorabjee Tata Trustfor supporting us in our endeavour in Assam.
This report owes its life to Pranami Garg of NESRC and Madhumita Purkayastha ofHAQ, who have waded through the mountains of budget documents in an effort to identify anddisaggregate what was meant for children. At the same time it is important to realise that budgetfor children work is still at a very nascent stage and hence evolving. We are all in the process ofdeveloping the methodology and fine- tuning our conclusions.
Dr.Walter Fernandes Enakshi Ganguly Thukral Bharti AliNESRC HAQ: Centre For Child Rights HAQ: Centre For Child Rights
6
Share of Children in the Assam Budget
Chapter 1Introduction
Children are the present as well as the future assets of the nation. They comprise 42 per cent ofIndia’s population. They are the citizens of the country and are the adults of tomorrow but they continueto be undervalued entities. They are often regarded as ‘not yet person’, ‘not yet knowing’ and ‘not yetresponsible’. The mandate of the Constitution of India and of the UN Convention on children is that everychild should have the right to life and well being, health care, nutritious food, clean water and shelter,protection from conflict, neglect and injustice, education to acquire knowledge, develop confidence andenjoy opportunities. Other rights included are free access to information and freedom of thought, expression,conscience, religion and cultural identity.
India has reaffirmed these commitments by ratifying the UN Convention on the Rights of theChild in 1992 but these rights continue to be dreams to be realised in the future. It is largely becausechildren are still not a complete political entity in the true sense of the term. They are physically, mentallyand economically defenceless. Besides, the present era of globalisation where life is judged almost exclusivelyfrom a commodity perspective, taking care of child rights at every stage has taken a back seat. Theirmarginalisation takes a turn for the worse if a child is an orphan, destitute, homeless, child or bondedlabourers, domestic help, street child, or physically or mentally challenged. It is worse when such a childlives in a developing country.
In 1992, the Government of India affirmed its commitment to the children through the ‘NationalPlan of Action: A commitment to the Child’. Consequent upon it in 1999 the Government of Assamprepared a State Plan of Action, setting out the specific goals for the survival, protection and developmentof Children. Thus, it reaffirms the commitment of the State towards the cause of children. The plan alsospells out the strategies and details relating to the various activities for the implementation and achievementof the goals endorsed by the state.
All commitments made in law and policy must be backed by implementation through programmesand schemes that are further resourced through financial allocations. Regular analysis and monitoring ofthe State Budget in so far as it makes specific and special allocations for the benefit of children, enablesus, first of all, to observe the match and mismatch between rhetoric and reality.
At the beginning of each (financial) year, (the) budget is the most important document, as resourceshave to be raised to the extent indicated therein and these are to be applied for the desired purposesindicated in the budget. When, however, the financial year is over, the accounts reflect the actualimplementation of the financial planning…the figures speak for themselves, much more than verboseexplanations…. (Ganguly 2000: 5).
1
7
Share of Children in the Assam Budget
Commitment to any section of the population in a country such as India is realised through budgetallocations made at the Union as well as State levels. It is, therefore, important to undertake an analysis ofboth. Besides, in its objectives, the State Plan of Action 1999 has included a clause incorporating ChildRights into the state laws, policies, plans and budgets. That makes the study of budgets more significant.
The present book is an attempt to examine the State’s concern for realising the rights of all children.
Methodology
Defining A ChildIn consonance with the UN Convention on Child Rights (CRC) and The Juvenile Justice (Care
and Protection) Act, 2000, child in this study includes all persons in the 0-18 age group.
Study PeriodThe present analysis is for the Assam Budget 2004-05 to 2007-08 though its focus is on 2007-08.
Sources of Dataa) Detailed Demands for Grants: The estimates for expenditure are presented to the Assembly as Demandsfor Grants. Generally one demand for Grants is presented for each Department. However, in case of largeDepartments more than one demand is presented. The Demands for Grants are submitted to the Assemblyalong with the Annual Financial Statement. The Detailed Demands for Grants follow these sometimeafter the presentation of the Budget to the Assembly but before the discussion on Demands for Grantscommences. The Detailed Demands for Grants show further details of the provisions included in theDemands for Grants and the actual expenditure during the previous year. Each Demand normally includesthe total provisions required for a service, that is, provisions on account of revenue expenditure, capitalexpenditure, grants to autonomous councils and also loans and advances relating to the service.
b) Budget Estimates, Revised Estimates and Actual Expenditure: To understand budgets in India, onemust look at three levels in the budget-making process: Budget Estimates (BE), Revised Estimates (RE)and Actual Expenditure (AE).
The Budget Estimates (BE) are prepared by the estimating authorities according to their assessment ofrequirements for the ensuing year, keeping in view the actual expenditure of the past years, trend ofexpenditure in the current year and the arrears of previous years.
The Revised Estimates (RE) of the current year are prepared before the Budget Estimates of the forthcomingyear. In other words, in a given financial year, both Revised Estimates for that year and Budget Estimatesfor the next year are finalised. The former precedes the latter. The Revised Estimates are based on thelatest actuals during the current year, actuals for the same period in the preceding year, actuals during the
2
8
Share of Children in the Assam Budget
past year and also previous years, appropriations or re-appropriations already ordered or which arecontemplated during the remaining part of the year or, any sanction to expenditure already issued orproposed to be issued during the remaining part of the year.
The Actual Expenditure (AE) figures are got only after the final accounts are submitted. The finalaccounts of any given year are available to the public only two years after the given financial year.The same pattern is followed in Assam. The estimates reflect the government’s intended and the actualexpenditure. An analysis of the changes that take place form one level to the other is quite revealing andtherefore necessary to understand any budget. The difference between the Estimates and the ActualExpenditure shows how much of the budget has been spent in a given financial year. This study does notgo into the reasons for under-utilisation/non-spending of the budgets. It concentrates only on the budget asa commitment to children and the trends arising thereof.
c) Plan and Non-Plan: The analysis has covered both the plan and non-plan allocation and expenditure ofthe Government on various programmes. Plan allocation and expenditure are those, which are planned forin the Five-Year Plans. These are subsequently divided into yearly plans. The plan component of allocationis to be utilised within the time period set by the plan. If, however, the schemes or programmes extendbeyond the time provided for in the Plan, then the further expenditure to be incurred on the project iscategorised as non-plan expenditure.
d) General and Sixth Schedule: Assam is unique in having North Cachar Hills and Karbi Anglongdistricts as its Sixth Scheduled areas. In addition, the six districts under the Bodo Territorial Councilcome under a modified form of the Sixth Schedule. The rest of Assam is considered general area. TheState Budget reflects special allocations for the Sixth Schedule areas. Along with the General areas theState government presents a separate statement of receipt and expenditure for these areas. Therefore,allocations for both the areas have been taken into consideration.
Sectors
The four basic rights of children according to CRC include the right to survival, development,protection and participation. While schemes or programmes addressing the right to participation are yetto find a place in the Government of India’s mandate, several schemes in the social sector fall within theambit of the other three rights. The State Budget of Assam also follows a similar trend. For purposes ofthe present analysis, all the existing programmes and schemes of the Government of Assam involvingchildren have been clubbed under four heads:
Development : Includes programmes and schemes for early childhood care and education; and othergeneral schemes and programmes that do not fit into any particular sector, but are aimed at the overalldevelopment of children.
3
9
Share of Children in the Assam Budget
Health : Includes programmes and schemes related to the health care needs of children. Given that anumber of health services for children are part of the larger health programmes, it is really difficult toidentify those that are specifically for children. Programmes like reproductive child health (RCH) andchild and maternal care (MCH) are both for the mother and the child. In such cases we take the totalallocation for the programmes, as it is difficult to disaggregate the allocations only for children, therebyerring on the side of excess.
Education : Includes elementary and secondary education. Also allocations for schemes like technical,non-formal and special education for handicapped children are included in these two broad categories.
Protection : Includes interventions aimed at disadvantaged children i.e. child labourers, children in needof adoption, child sex-workers, physically or mentally challenged children, homeless or street children,neglected children or those who are treated as juvenile delinquents.
Challenges :
The study also poses certain challenges and complications. An effort was made to resolve them,particularly the following:
• The very first challenge came in the form of the budget documents of the state. The documentspresented by the Finance Minister (at present this portfolio is held by the Chief Minister himself)are very confusing. The Budget document of Assam generally contains two separate sections onallotment for the General and for the Sixth Schedule areas. Though the allocations for the SixthSchedule did exist in the preceding few years’ they are absent in the budget for 2007-08. Since thereasons for it were not clear to us, after discussion with officials and economists, we resorted tothe budget documents of the autonomous councils for the allocation made for the Sixth Scheduledareas. This sudden failure to show the allocations to the Sixth Scheduled areas remained unclearto us.
• The second obstacle is that the figures given by different documents accompanying demands forgrants do not tally at times. For example, the figures given by ‘Summary of Financial Position’and ‘Annual Statement of Accounts’ for 2006-07 are different.
• The third obstacle came with the absence of Annual Reports and Programme documents in mostdepartments though they are essential for the selection of programmes for analysis.
• Non-availability of accounts of certain schemes was another constraint. Lack of proper maintenanceof documents and lack of transparency were also observed during the study.
• For getting the information required we had to file applications under the Right to Information(RTI). But the departments concerned took the longest possible time to reply and their replies
4
10
Share of Children in the Assam Budget
were not always convincing. So we had to file two or three applications under RTI with the samedepartment.
• Because of it we also had to depend on personal meetings with officials. That delayed the processfurther since the official concerned was not always available. Some of those who were availablewere not willing to part with the information required.
• The Assam State Budget allocation for the Social Sector is not very clear. The Economic Surveyof the state gives some data under the head called Social and Community Services. It also dealswith the Social Sector separately, which includes an additional programme called the Char AreasDevelopment Programme. It is, therefore, not quite clear which can be considered the exactallocation for the social sector. Since the Government has included the Social and CommunityServices in its main chapter on the distribution of resources, the study too has taken this figure.
5
11
Share of Children in the Assam Budget
Chapter 2Budget for Children in the Assam Budget: An Overview
Our little child will fall asleepWill nurture berry trees
Will enlighten the world with new learningsOur child will become a human being
- Dr. Bhupen Hazarika
The Status of Children in Assam
• There are 1,25,81,135 children in Assam (0-19 yrs) according to Census 2001. They are 47.2percent of the State population (Calculated from Director of Economics and Statistics 2006: 35).The number of children in the age group of 0-14 years is 99,70,342 or 37.4 per cent of the State’spopulation (Director of Economics and Statistics, 2006: 35). Based on it one can put the numberof children in the 0-18 age group which is the subject of the present study, at 43.3 per cent i.e.1,20,58,976 or whom 69,36,344 would be in the 6-14 age group.
• The 0-14 age group has more male (50,95,495) than female children (48,74,847). So the sex ratioin this age group is 957. It was 967 in the 0-6 age group in 2001 against 975 in 1991 (Director ofEconomics and Statistics 2006: 7). Thus, there is a slight decline in the sex ratio. The reasons forit are not very clear. The decline is not as sharp as in the prosperous states of Punjab, Haryanaand some districts of Gujarat, Maharashtra and Tamil Nadu where it is dowry-related (Bose2001: 46). One does not know whether it is because dowry has entered Assam in a stronger formor because of other reasons such as poor health status. In case of the former, there may even befemale foeticide.
• Both the birth rate and the infant mortality rate (IMR) of Assam are higher than those of India asa whole. The birth rate was 27 in 2001 against 25.4 in India as a whole. It declined to 25 in Assamin 2005 but it has come down to 23.8 in India as a whole (Director of Economics and Statistics2006: 9).
• IMR in the state was 74 per 1,000 in 2001 against the All India rate of 67. It declined to 68 in2005 against 58 in the country (Director of Economics and Statistics 2006: 9). Thus the AssamIMR was 10 percent higher than the All India average in 2001 and 17 percent in 2005.
• According to Sarba Shikshya Abhijan (ASSAM 2002) 13.4 lakhs or 24.39 percent of the childrenin the 6-14 age group were out of school in 2001. A separate study shows 43 per cent of the
6
12
Share of Children in the Assam Budget
present and past tea garden labourers are out of school (Fernandes, Barbora and Bharali 2003).• Assam has the highest incidence of child abuse in India (Ministry of Women and Child Development
2007: 78).
The State Budget for Children
Of every hundred rupees allocated in the State Budget of Assam for theYear 2007-08, 5 Rupees and 38 paisa have been provided for children,
who constitute 43.3 percent of the population.
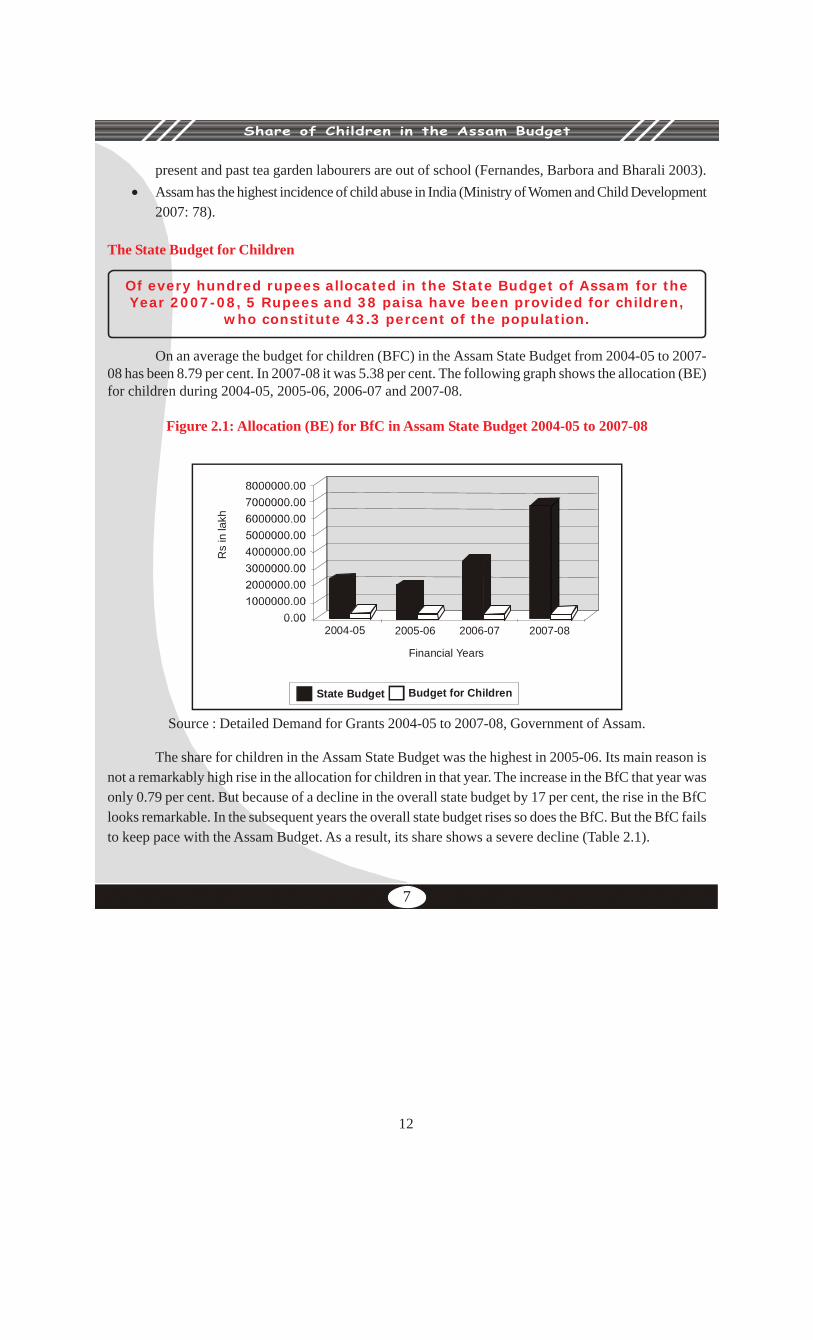
On an average the budget for children (BFC) in the Assam State Budget from 2004-05 to 2007-08 has been 8.79 per cent. In 2007-08 it was 5.38 per cent. The following graph shows the allocation (BE)for children during 2004-05, 2005-06, 2006-07 and 2007-08.
Figure 2.1: Allocation (BE) for BfC in Assam State Budget 2004-05 to 2007-08
2004-05 2005-06 2006-07 2007-08
Financial Years
Rs
in la
kh
State Budget Budget for Children
The share for children in the Assam State Budget was the highest in 2005-06. Its main reason isnot a remarkably high rise in the allocation for children in that year. The increase in the BfC that year wasonly 0.79 per cent. But because of a decline in the overall state budget by 17 per cent, the rise in the BfClooks remarkable. In the subsequent years the overall state budget rises so does the BfC. But the BfC failsto keep pace with the Assam Budget. As a result, its share shows a severe decline (Table 2.1).
7
Source : Detailed Demand for Grants 2004-05 to 2007-08, Government of Assam.
13
Share of Children in the Assam Budget
Source: Detailed Demand for Grants 2004-05 to 2007-08, Government of Assam.
In 2007-08, while the BfC rose by 3.9 per cent the State Budget went up by 93.12 per cent ascompared to the 2006-07 BE. This gap between the two has led to a decline in the BfC in comparison withthe overall state budget by 4.61 per cent. At first glance itself it becomes clear that in 2007-08, the outlayon two of the most important sectors viz. education and nutrition has been reduced. The outlay on educationhas declined by 3 per cent while that on social welfare and nutrition has been cut drastically by 45 per centto Rs. 384 crores from Rs. 833 crores in 2006-07 (The Assam Tribune, 23rd March, 2007).
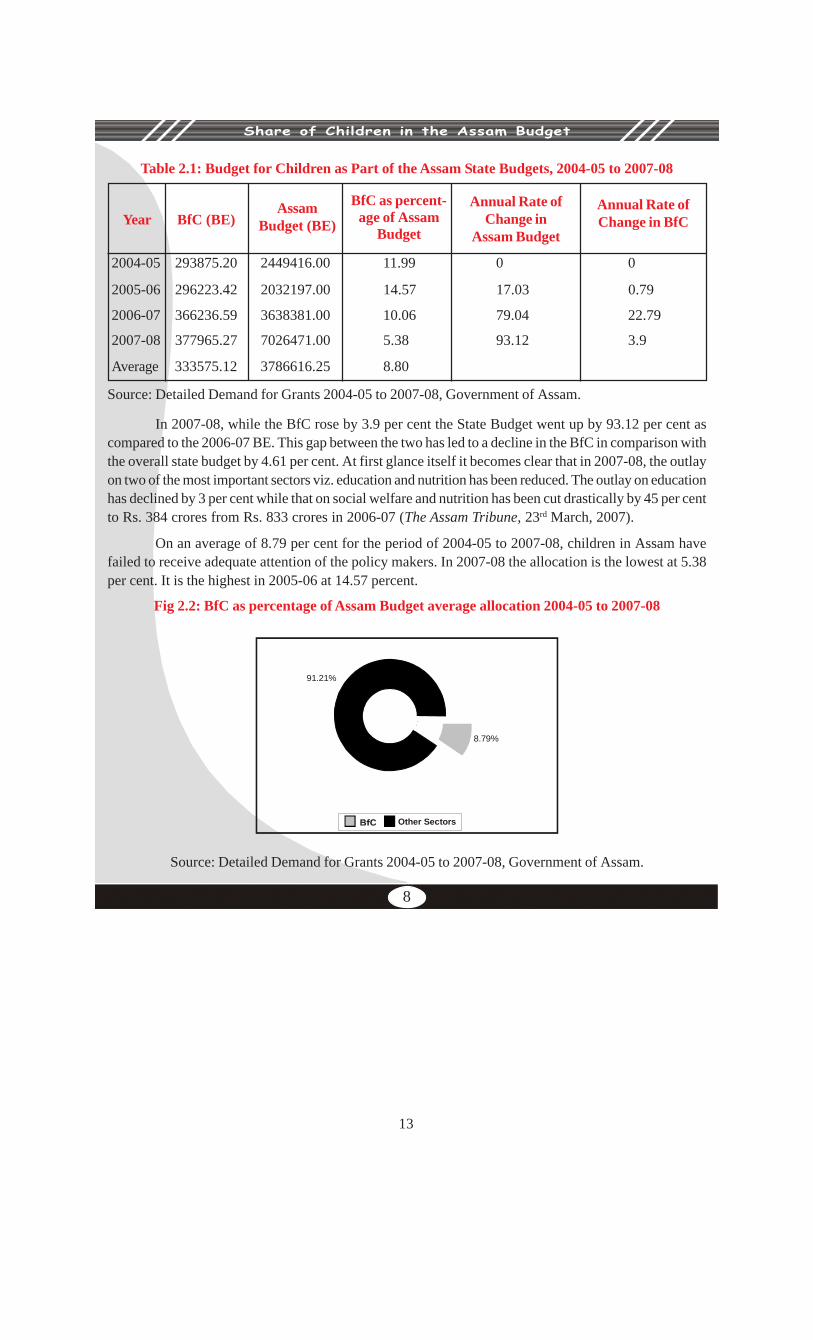
On an average of 8.79 per cent for the period of 2004-05 to 2007-08, children in Assam havefailed to receive adequate attention of the policy makers. In 2007-08 the allocation is the lowest at 5.38per cent. It is the highest in 2005-06 at 14.57 percent.
Fig 2.2: BfC as percentage of Assam Budget average allocation 2004-05 to 2007-08
91.21%
8.79%
Other Sectors
Source: Detailed Demand for Grants 2004-05 to 2007-08, Government of Assam.
2004-05 293875.20 2449416.00 11.99 0 0
2005-06 296223.42 2032197.00 14.57 17.03 0.79
2006-07 366236.59 3638381.00 10.06 79.04 22.79
2007-08 377965.27 7026471.00 5.38 93.12 3.9
Average 333575.12 3786616.25 8.80
Year BfC (BE)Assam
Budget (BE)
BfC as percent-age of Assam
Budget
Annual Rate ofChange in
Assam Budget
Annual Rate ofChange in BfC
Table 2.1: Budget for Children as Part of the Assam State Budgets, 2004-05 to 2007-08
8
14
Share of Children in the Assam Budget
Source: Detailed Demand for Grants 2004-05 to 2007-08, Government of Assam.Note: Figures for AE of 2006-07 and RE and AE of 2007-08 will come only with the budget of 2008-09. Hence could not be calculated
Source: Detailed Demand for Grants 2004-05 to 2007-08, Government of Assam.Note: Figures for AE of 2006-07 and RE and AE of 2007-08 will come only with the budget of 2008-09.Hence could not be calculated.
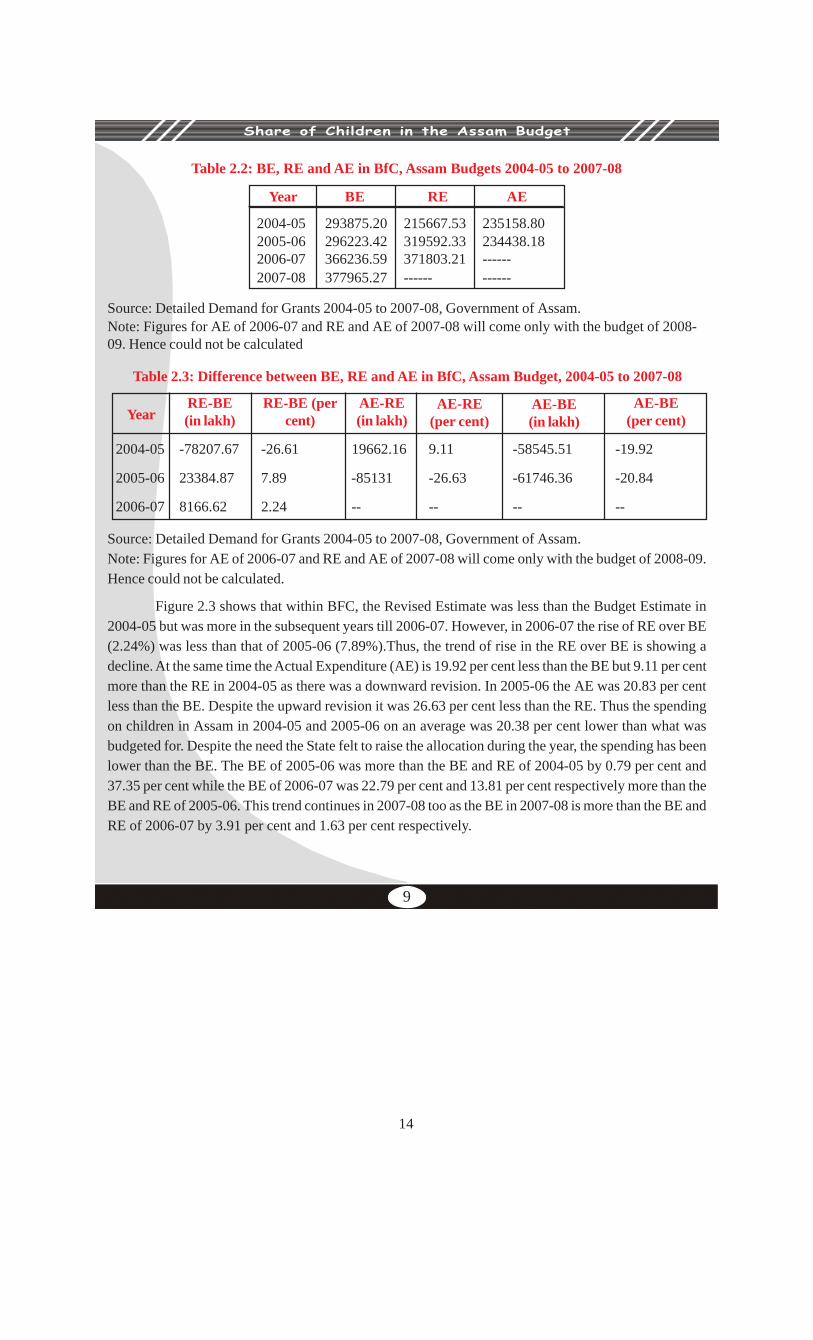
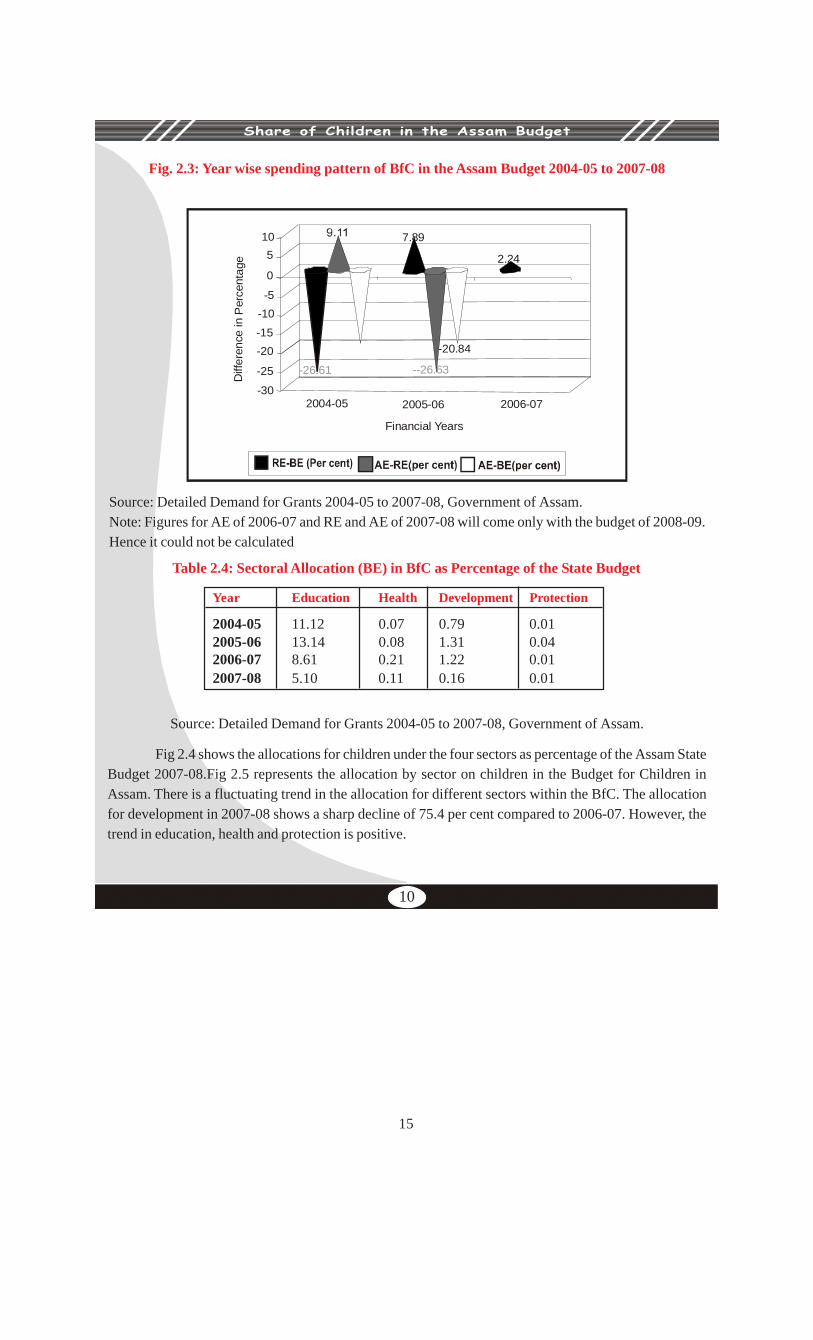
Figure 2.3 shows that within BFC, the Revised Estimate was less than the Budget Estimate in2004-05 but was more in the subsequent years till 2006-07. However, in 2006-07 the rise of RE over BE(2.24%) was less than that of 2005-06 (7.89%).Thus, the trend of rise in the RE over BE is showing adecline. At the same time the Actual Expenditure (AE) is 19.92 per cent less than the BE but 9.11 per centmore than the RE in 2004-05 as there was a downward revision. In 2005-06 the AE was 20.83 per centless than the BE. Despite the upward revision it was 26.63 per cent less than the RE. Thus the spendingon children in Assam in 2004-05 and 2005-06 on an average was 20.38 per cent lower than what wasbudgeted for. Despite the need the State felt to raise the allocation during the year, the spending has beenlower than the BE. The BE of 2005-06 was more than the BE and RE of 2004-05 by 0.79 per cent and37.35 per cent while the BE of 2006-07 was 22.79 per cent and 13.81 per cent respectively more than theBE and RE of 2005-06. This trend continues in 2007-08 too as the BE in 2007-08 is more than the BE andRE of 2006-07 by 3.91 per cent and 1.63 per cent respectively.
Year BE RE AE
2004-05 293875.20 215667.53 235158.802005-06 296223.42 319592.33 234438.182006-07 366236.59 371803.21 ------2007-08 377965.27 ------ ------
Table 2.2: BE, RE and AE in BfC, Assam Budgets 2004-05 to 2007-08
9
Table 2.3: Difference between BE, RE and AE in BfC, Assam Budget, 2004-05 to 2007-08
2004-05 -78207.67 -26.61 19662.16 9.11 -58545.51 -19.92
2005-06 23384.87 7.89 -85131 -26.63 -61746.36 -20.84
2006-07 8166.62 2.24 -- -- -- --
YearRE-BE(in lakh)
RE-BE (percent)
AE-RE(in lakh)
AE-RE(per cent)
AE-BE(per cent)
AE-BE(in lakh)
15
Share of Children in the Assam Budget
Fig. 2.3: Year wise spending pattern of BfC in the Assam Budget 2004-05 to 2007-08
2.24
-20.84
--26.63
2006-072005-06
Financial Years
2004-05
Diff
eren
ce in
Per
cen t
age
7.89
-26.61
105
0
-5-10
-15-20
-25
-30
Source: Detailed Demand for Grants 2004-05 to 2007-08, Government of Assam.
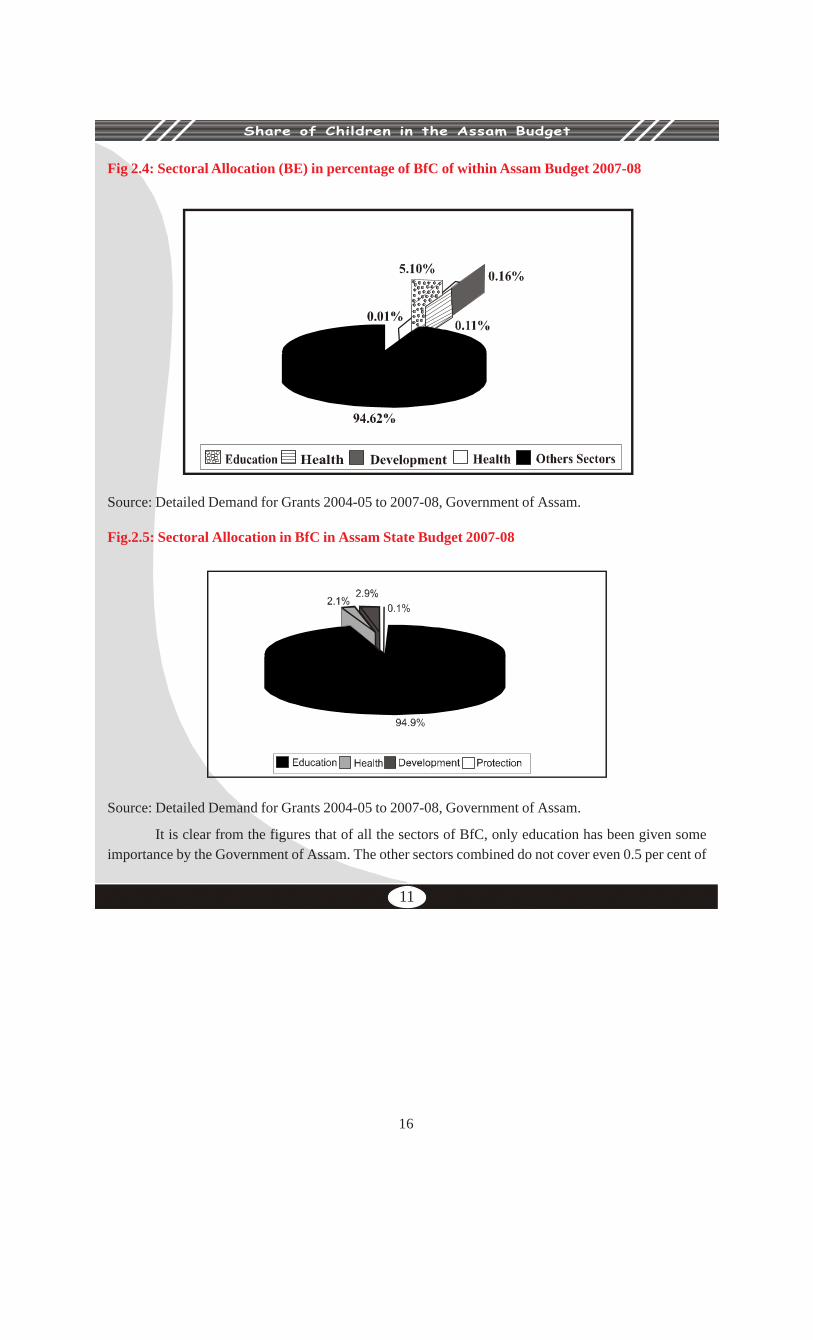
Fig 2.4 shows the allocations for children under the four sectors as percentage of the Assam StateBudget 2007-08.Fig 2.5 represents the allocation by sector on children in the Budget for Children inAssam. There is a fluctuating trend in the allocation for different sectors within the BfC. The allocationfor development in 2007-08 shows a sharp decline of 75.4 per cent compared to 2006-07. However, thetrend in education, health and protection is positive.
10
Source: Detailed Demand for Grants 2004-05 to 2007-08, Government of Assam.Note: Figures for AE of 2006-07 and RE and AE of 2007-08 will come only with the budget of 2008-09.Hence it could not be calculated
Table 2.4: Sectoral Allocation (BE) in BfC as Percentage of the State Budget
Year Education Health Development Protection
2004-05 11.12 0.07 0.79 0.012005-06 13.14 0.08 1.31 0.042006-07 8.61 0.21 1.22 0.012007-08 5.10 0.11 0.16 0.01
16
Share of Children in the Assam Budget
Fig 2.4: Sectoral Allocation (BE) in percentage of BfC of within Assam Budget 2007-08
Source: Detailed Demand for Grants 2004-05 to 2007-08, Government of Assam.
Fig.2.5: Sectoral Allocation in BfC in Assam State Budget 2007-08
Source: Detailed Demand for Grants 2004-05 to 2007-08, Government of Assam.
It is clear from the figures that of all the sectors of BfC, only education has been given someimportance by the Government of Assam. The other sectors combined do not cover even 0.5 per cent of
11
17
Share of Children in the Assam Budget
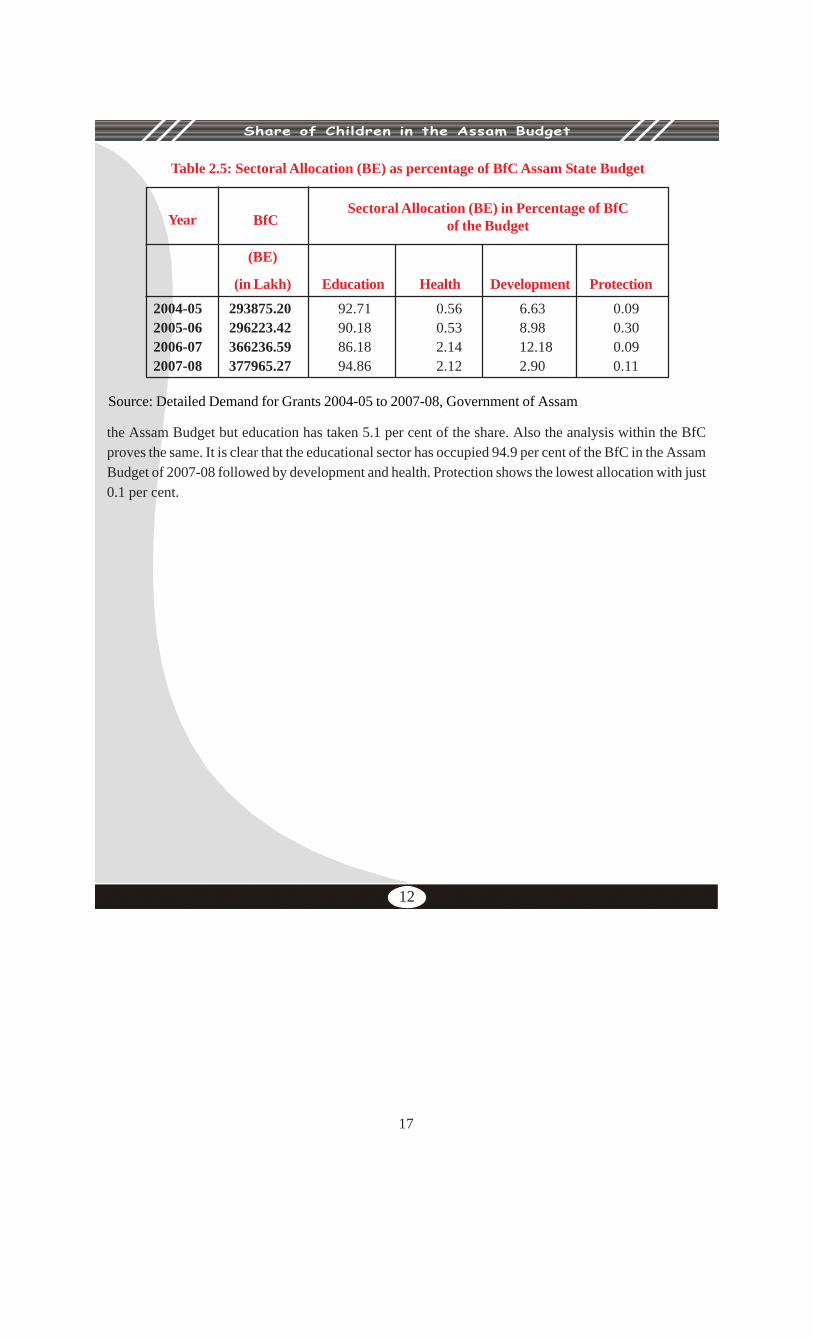
the Assam Budget but education has taken 5.1 per cent of the share. Also the analysis within the BfCproves the same. It is clear that the educational sector has occupied 94.9 per cent of the BfC in the AssamBudget of 2007-08 followed by development and health. Protection shows the lowest allocation with just0.1 per cent.
Sectoral Allocation (BE) in Percentage of BfCof the Budget BfCYear
Table 2.5: Sectoral Allocation (BE) as percentage of BfC Assam State Budget
(BE)
(in Lakh) Education Health Development Protection
2004-05 293875.20 92.71 0.56 6.63 0.092005-06 296223.42 90.18 0.53 8.98 0.302006-07 366236.59 86.18 2.14 12.18 0.092007-08 377965.27 94.86 2.12 2.90 0.11
12
Source: Detailed Demand for Grants 2004-05 to 2007-08, Government of Assam
18
Share of Children in the Assam Budget
Chapter 3Development
In the Development sector, allocations for the schemes meant for early childhood care anddevelopment and some other schemes for children’s all round development have been studied. Programmeslike Nutrition, ICDS etc have been included in this sector. In this section, the scene of child developmentin the state has been discussed in the light of existing programmes and allocation made for them.
To keep aggregate expenditure down to a manageable level in the face of huge budgetary gap, theChief Minister has taken to an expenditure cut amounting to Rs 1128 crore in his Budget plan.The axe has naturally fallen mostly on the softer option, the social sector development, where wefind the Budget allocation declining by as much as 45 per cent to social welfare and nutrition fromRs 833 crore in the current year to Rs 384 crore in 2007-08.
-Dr. Rabindra Kr Choudhury, former Head Of Department, Department of Economics,Gauhati University commenting on the Assam State Budget 2007-08
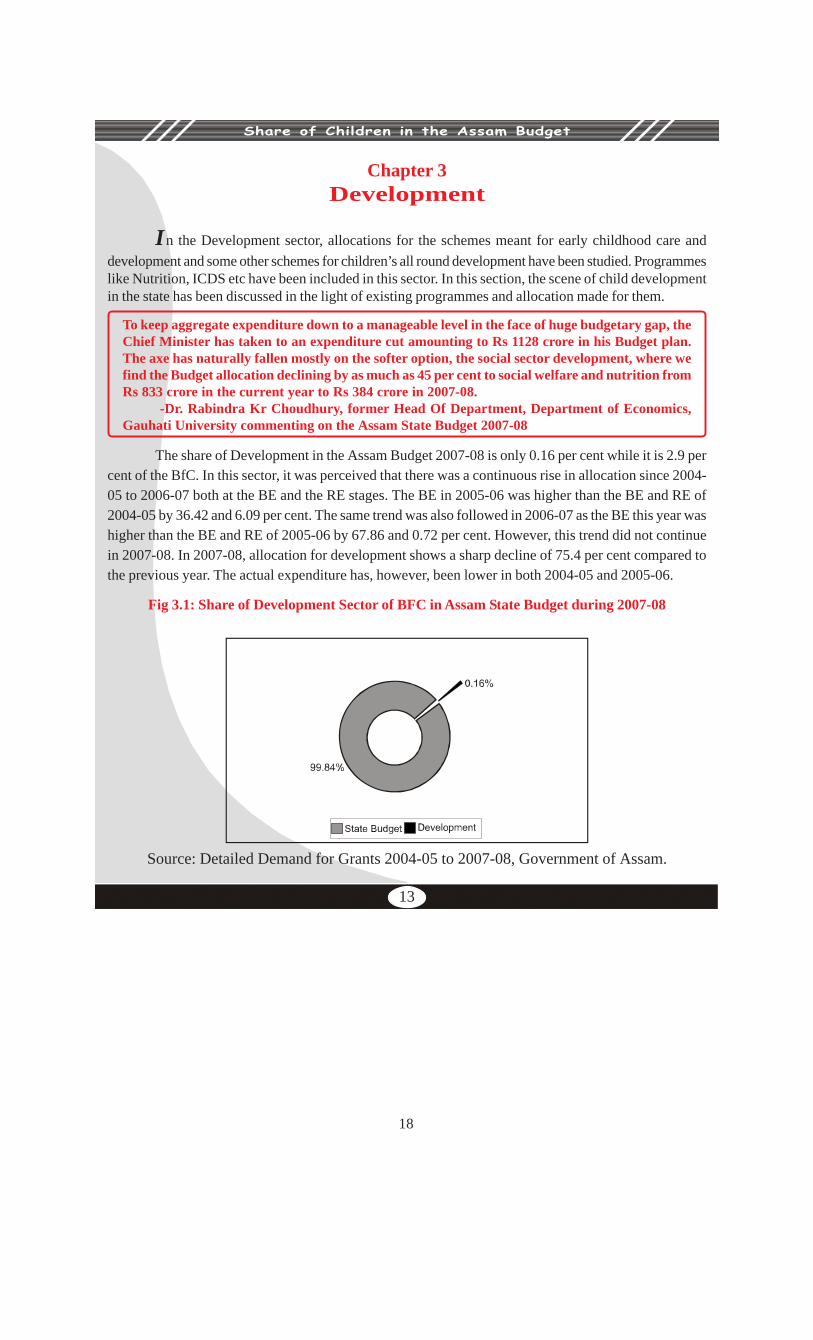
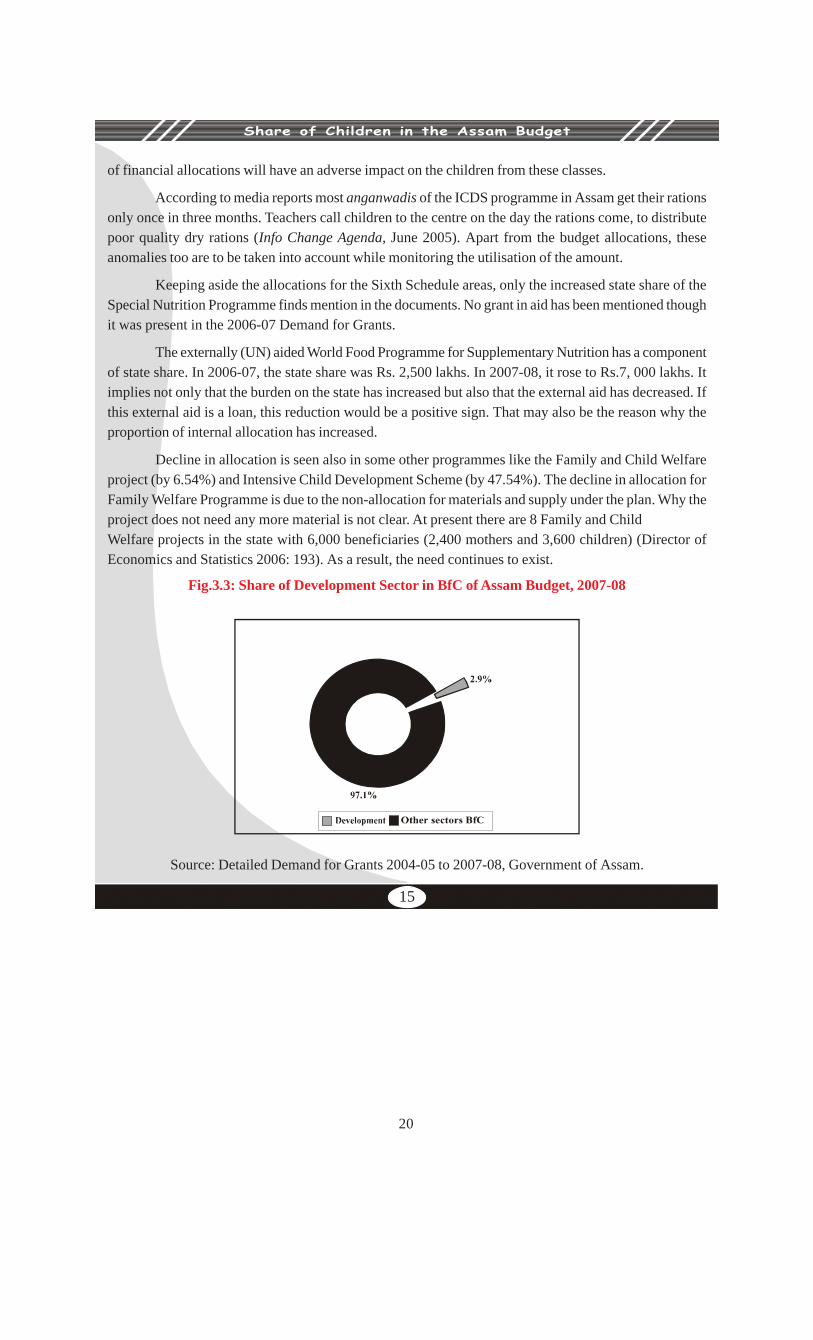
The share of Development in the Assam Budget 2007-08 is only 0.16 per cent while it is 2.9 percent of the BfC. In this sector, it was perceived that there was a continuous rise in allocation since 2004-05 to 2006-07 both at the BE and the RE stages. The BE in 2005-06 was higher than the BE and RE of2004-05 by 36.42 and 6.09 per cent. The same trend was also followed in 2006-07 as the BE this year washigher than the BE and RE of 2005-06 by 67.86 and 0.72 per cent. However, this trend did not continuein 2007-08. In 2007-08, allocation for development shows a sharp decline of 75.4 per cent compared tothe previous year. The actual expenditure has, however, been lower in both 2004-05 and 2005-06.
Fig 3.1: Share of Development Sector of BFC in Assam State Budget during 2007-08
13
Source: Detailed Demand for Grants 2004-05 to 2007-08, Government of Assam.
19
Share of Children in the Assam Budget
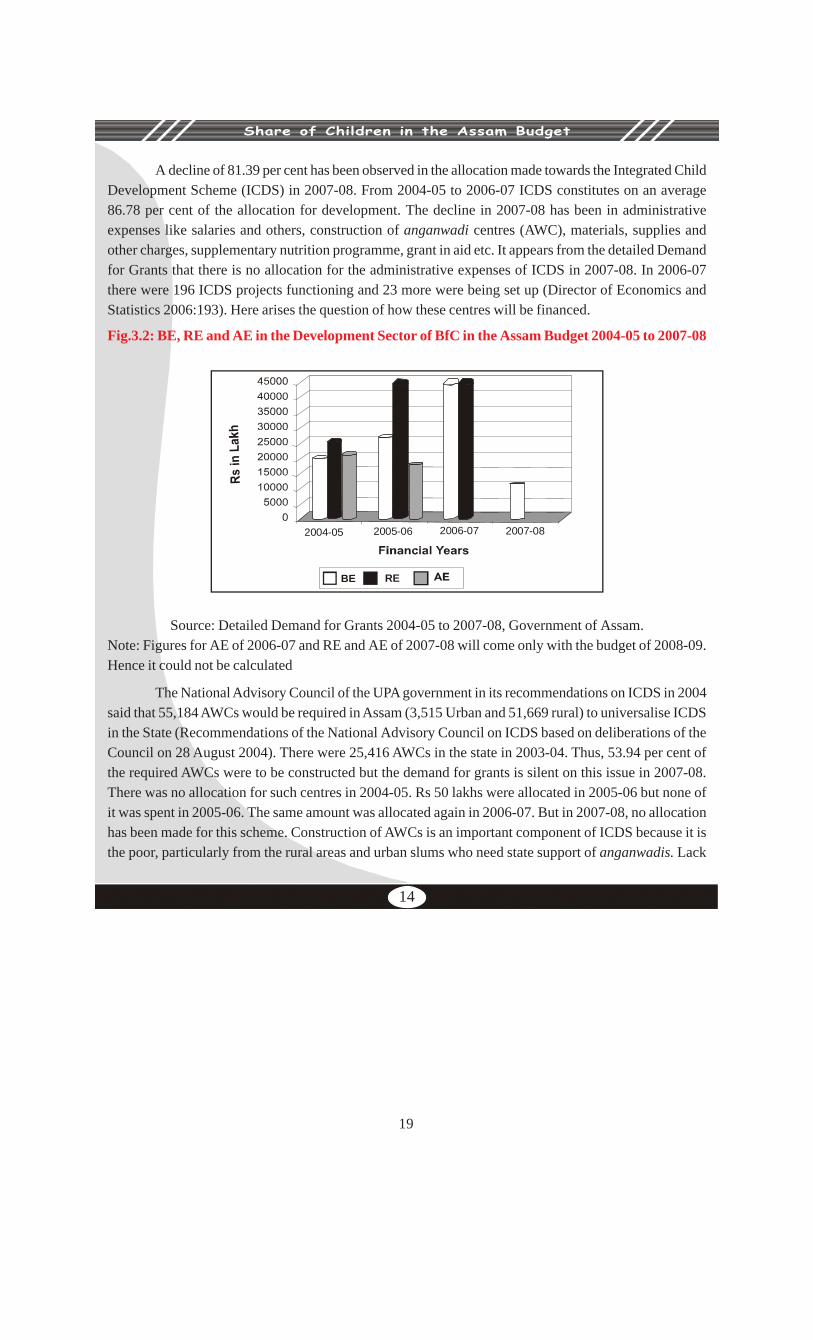
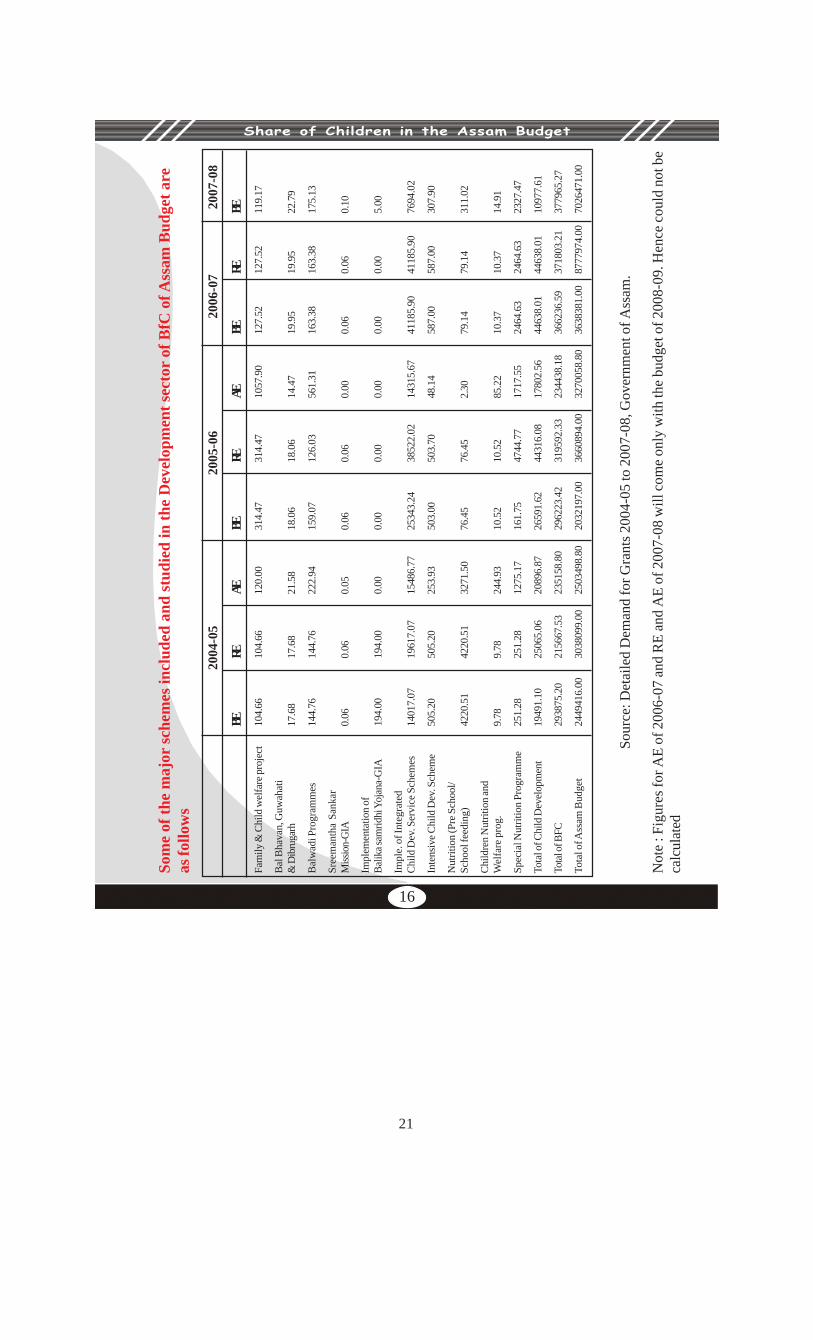
A decline of 81.39 per cent has been observed in the allocation made towards the Integrated ChildDevelopment Scheme (ICDS) in 2007-08. From 2004-05 to 2006-07 ICDS constitutes on an average86.78 per cent of the allocation for development. The decline in 2007-08 has been in administrativeexpenses like salaries and others, construction of anganwadi centres (AWC), materials, supplies andother charges, supplementary nutrition programme, grant in aid etc. It appears from the detailed Demandfor Grants that there is no allocation for the administrative expenses of ICDS in 2007-08. In 2006-07there were 196 ICDS projects functioning and 23 more were being set up (Director of Economics andStatistics 2006:193). Here arises the question of how these centres will be financed.
Fig.3.2: BE, RE and AE in the Development Sector of BfC in the Assam Budget 2004-05 to 2007-08
2004-05
BE RE
2005-06 2006-07 2007-08
Source: Detailed Demand for Grants 2004-05 to 2007-08, Government of Assam.Note: Figures for AE of 2006-07 and RE and AE of 2007-08 will come only with the budget of 2008-09.Hence it could not be calculated
The National Advisory Council of the UPA government in its recommendations on ICDS in 2004said that 55,184 AWCs would be required in Assam (3,515 Urban and 51,669 rural) to universalise ICDSin the State (Recommendations of the National Advisory Council on ICDS based on deliberations of theCouncil on 28 August 2004). There were 25,416 AWCs in the state in 2003-04. Thus, 53.94 per cent ofthe required AWCs were to be constructed but the demand for grants is silent on this issue in 2007-08.There was no allocation for such centres in 2004-05. Rs 50 lakhs were allocated in 2005-06 but none ofit was spent in 2005-06. The same amount was allocated again in 2006-07. But in 2007-08, no allocationhas been made for this scheme. Construction of AWCs is an important component of ICDS because it isthe poor, particularly from the rural areas and urban slums who need state support of anganwadis. Lack
14
20
Share of Children in the Assam Budget
of financial allocations will have an adverse impact on the children from these classes.
According to media reports most anganwadis of the ICDS programme in Assam get their rationsonly once in three months. Teachers call children to the centre on the day the rations come, to distributepoor quality dry rations (Info Change Agenda, June 2005). Apart from the budget allocations, theseanomalies too are to be taken into account while monitoring the utilisation of the amount.
Keeping aside the allocations for the Sixth Schedule areas, only the increased state share of theSpecial Nutrition Programme finds mention in the documents. No grant in aid has been mentioned thoughit was present in the 2006-07 Demand for Grants.
The externally (UN) aided World Food Programme for Supplementary Nutrition has a componentof state share. In 2006-07, the state share was Rs. 2,500 lakhs. In 2007-08, it rose to Rs.7, 000 lakhs. Itimplies not only that the burden on the state has increased but also that the external aid has decreased. Ifthis external aid is a loan, this reduction would be a positive sign. That may also be the reason why theproportion of internal allocation has increased.
Decline in allocation is seen also in some other programmes like the Family and Child Welfareproject (by 6.54%) and Intensive Child Development Scheme (by 47.54%). The decline in allocation forFamily Welfare Programme is due to the non-allocation for materials and supply under the plan. Why theproject does not need any more material is not clear. At present there are 8 Family and ChildWelfare projects in the state with 6,000 beneficiaries (2,400 mothers and 3,600 children) (Director ofEconomics and Statistics 2006: 193). As a result, the need continues to exist.
Fig.3.3: Share of Development Sector in BfC of Assam Budget, 2007-08
Source: Detailed Demand for Grants 2004-05 to 2007-08, Government of Assam.
15
21
Share of Children in the Assam Budget
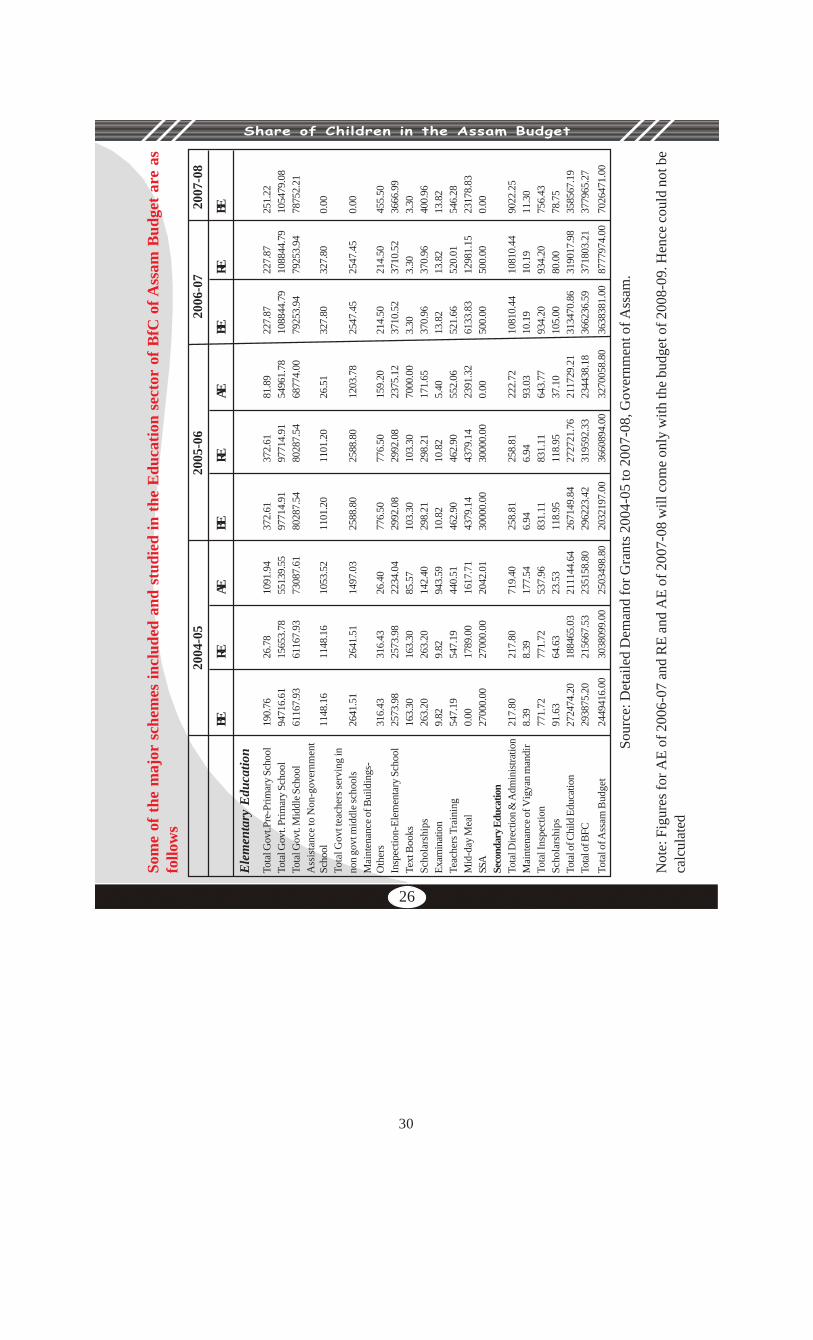
Som
e of
the
maj
or sc
hem
es in
clud
ed a
nd st
udie
d in
the
Dev
elop
men
t sec
tor
of B
fC o
f Ass
am B
udge
t are
as fo
llow
s
2004
-05
2005
-06
2006
-07
2007
-08
BERE
AEBE
REAE
BERE
BEFa
mily
& C
hild
wel
fare
pro
ject
104.
6610
4.66
120.
0031
4.47
314.
4710
57.9
012
7.52
127.
5211
9.17
Bal
Bha
van,
Guw
ahat
i&
Dib
ruga
rh17
.68
17.6
821
.58
18.0
618
.06
14.4
719
.95
19.9
522
.79
Bal
wad
i Pro
gram
mes
144.
7614
4.76
222.
9415
9.07
126.
0356
1.31
163.
3816
3.38
175.
13
Sree
man
tha
Sank
arM
issio
n-G
IA0.
060.
060.
050.
060.
060.
000.
060.
060.
10
Impl
emen
tatio
n of
Balik
a sam
ridhi
Yoj
ana-
GIA
194.
0019
4.00
0.00
0.00
0.00
0.00
0.00
0.00
5.00
Impl
e. o
f Int
egra
ted
Chi
ld D
ev. S
ervi
ce S
chem
es14
017.
0719
617.
0715
486.
7725
343.
2438
522.
0214
315.
6741
185.
9041
185.
9076
94.0
2
Inte
nsiv
e Chi
ld D
ev. S
chem
e50
5.20
505.
2025
3.93
503.
0050
3.70
48.1
458
7.00
587.
0030
7.90
Nut
ritio
n (P
re S
choo
l/Sc
hool
feed
ing)
4220
.51
4220
.51
3271
.50
76.4
576
.45
2.30
79.1
479
.14
311.
02
Child
ren
Nut
ritio
n an
dW
elfa
re p
rog.
9.78
9.78
244.
9310
.52
10.5
285
.22
10.3
710
.37
14.9
1
Spec
ial N
utrit
ion
Prog
ram
me
251.
2825
1.28
1275
.17
161.
7547
44.7
717
17.5
524
64.6
324
64.6
323
27.4
7
Tota
l of C
hild
Dev
elop
men
t19
491.
1025
065.
0620
896.
8726
591.
6244
316.
0817
802.
5644
638.
0144
638.
0110
977.
61
Total
of B
FC29
3875
.20
2156
67.5
323
5158
.80
2962
23.4
231
9592
.33
2344
38.1
836
6236
.59
3718
03.2
137
7965
.27
Tota
l of A
ssam
Bud
get
2449
416.
0030
3809
9.00
2503
498.
8020
3219
7.00
3660
894.
0032
7005
8.80
3638
381.
0087
7797
4.00
7026
471.
00
Sour
ce: D
etai
led
Dem
and
for G
rant
s 200
4-05
to 2
007-
08, G
over
nmen
t of A
ssam
.
Not
e : F
igur
es fo
r AE
of 2
006-
07 a
nd R
E an
d A
E of
200
7-08
will
com
e on
ly w
ith th
e bu
dget
of 2
008-
09. H
ence
cou
ld n
ot b
eca
lcul
ated
16
22
Share of Children in the Assam Budget
There is a 7.19 per cent rise in the allocation for Balwadi programmes. The allocation for thegeneral areas has increased by 18.72 per cent and it is under the non-plan category while a 24 per centdecline has been observed in the allocation for the Sixth Schedule areas. Transfer of planned expendituresto the non-plan category is the reason for it. On one hand it implies a higher state burden. On the other itreflects sustenance of the programme without Central Government support. The State at present has 60Balwadis with 2,400 children (Director of Economics and Statistics 2006: 193). It is obvious then that theState needs more of them.In the budget documents of all four years, a programme called Applied Nutrition was found but with noallocation. The reason for mentioning a programme without any allocation is not clear.
Conclusion :
The share of development in the Assam budget, 2007-08 is very small i.e. only 0.16 per cent. It is2.9 per cent of the BfC. The trend of higher BE and RE for child development over that of previous yearshas not been followed in 2007-08. It has sharply declined by 75.4 per cent. This decline is attributed to adecline in major schemes like ICDS, Family and Child Welfare and Intensive Development Scheme.ICDS which comprises 86.78 per cent of the allocation for development has shown the severest decline(81.39 per cent) while the Family Welfare Project and Intensive Child Development Scheme have followedwith 6.54 and 47.54 per cent. In view of the observation that only 46.06 per cent of the required Anganwadicentres have been set up in the state, the reduced allocation for the same has become a subject of concern.However, there is also change on the positive side. Allocation has increased in 2007-08 to schemes likeFood Programme for Supplementary Nutrition and Balwadi programmes. In addition, a scheme calledApplied Nutrition has been mentioned in the budget but it has remained without any allocation.
17
23
Share of Children in the Assam Budget
Chapter 4Health
This sector includes programmes and schemes related to the health care needs of children. In thissector all those schemes have been included which are directly or indirectly related to children’s health inthe state. Also programmes like Reproductive Child Health (RCH) and Child and Maternal Care (MCH),which are both for the mother and the child are included in the study
Reiterating the Government’s “commitment” towards ushering in drastic changes in the healthcaresector, Chief Minister Tarun Gogoi said that definite steps had been taken to implement the thehealth care related schemes under the National Rural Health Care Mission on a wide scale in thesState. (The Assam Tribune 19th March,2007)
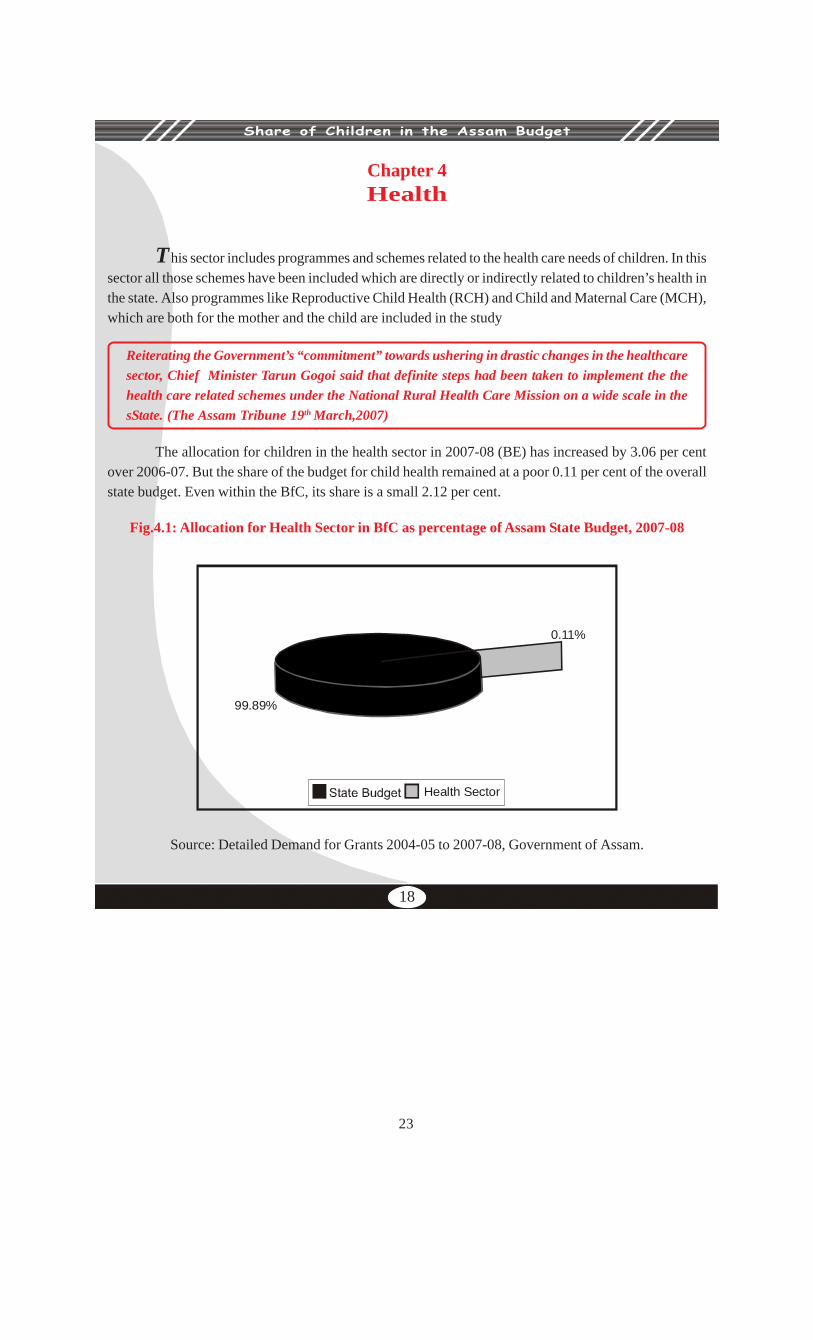
The allocation for children in the health sector in 2007-08 (BE) has increased by 3.06 per centover 2006-07. But the share of the budget for child health remained at a poor 0.11 per cent of the overallstate budget. Even within the BfC, its share is a small 2.12 per cent.
Fig.4.1: Allocation for Health Sector in BfC as percentage of Assam State Budget, 2007-08
99.89%
Health Sector
0.11%
Source: Detailed Demand for Grants 2004-05 to 2007-08, Government of Assam.
18
24
Share of Children in the Assam Budget
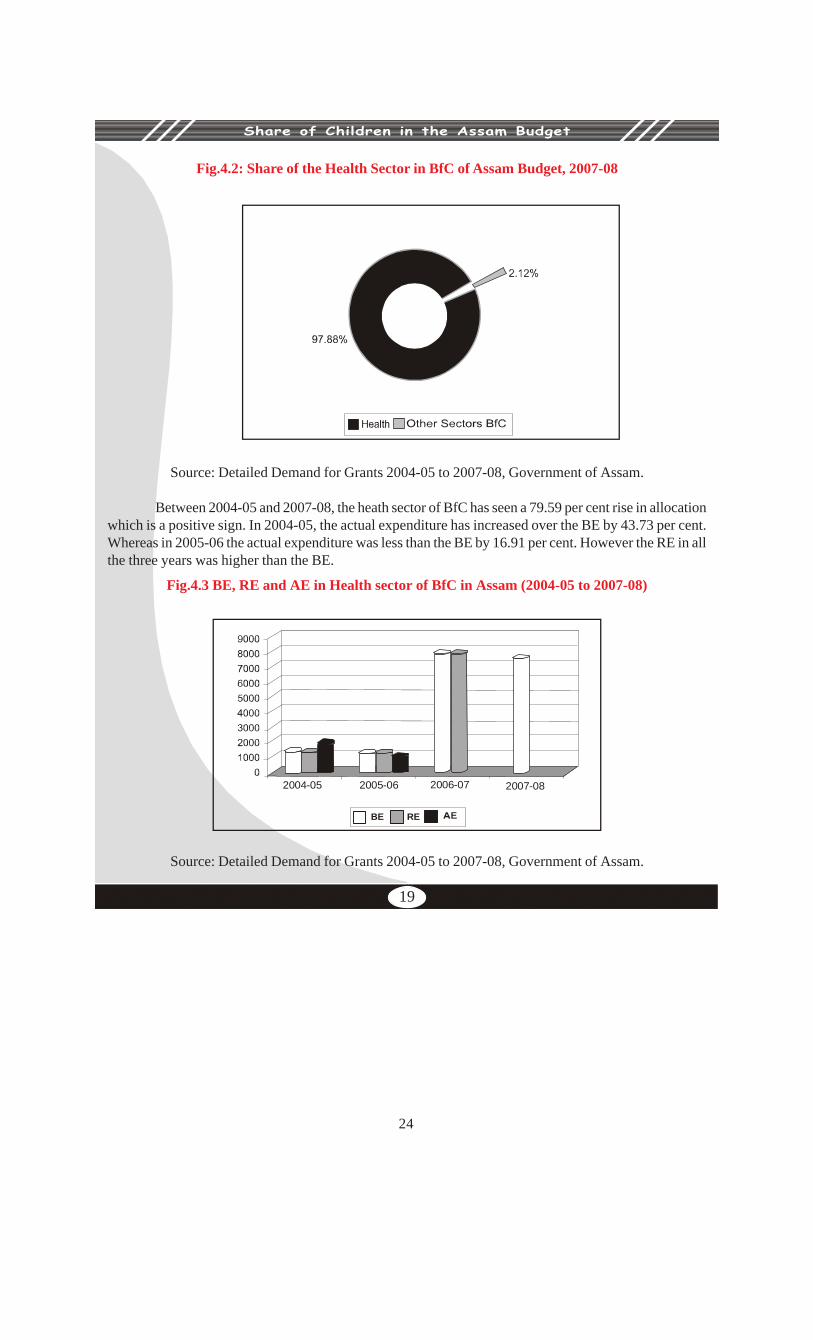
Fig.4.2: Share of the Health Sector in BfC of Assam Budget, 2007-08
Source: Detailed Demand for Grants 2004-05 to 2007-08, Government of Assam.
Between 2004-05 and 2007-08, the heath sector of BfC has seen a 79.59 per cent rise in allocationwhich is a positive sign. In 2004-05, the actual expenditure has increased over the BE by 43.73 per cent.Whereas in 2005-06 the actual expenditure was less than the BE by 16.91 per cent. However the RE in allthe three years was higher than the BE.
Fig.4.3 BE, RE and AE in Health sector of BfC in Assam (2004-05 to 2007-08)
2004-05
BE RE
2005-06 2006-07 2007-08
Source: Detailed Demand for Grants 2004-05 to 2007-08, Government of Assam.
19
25
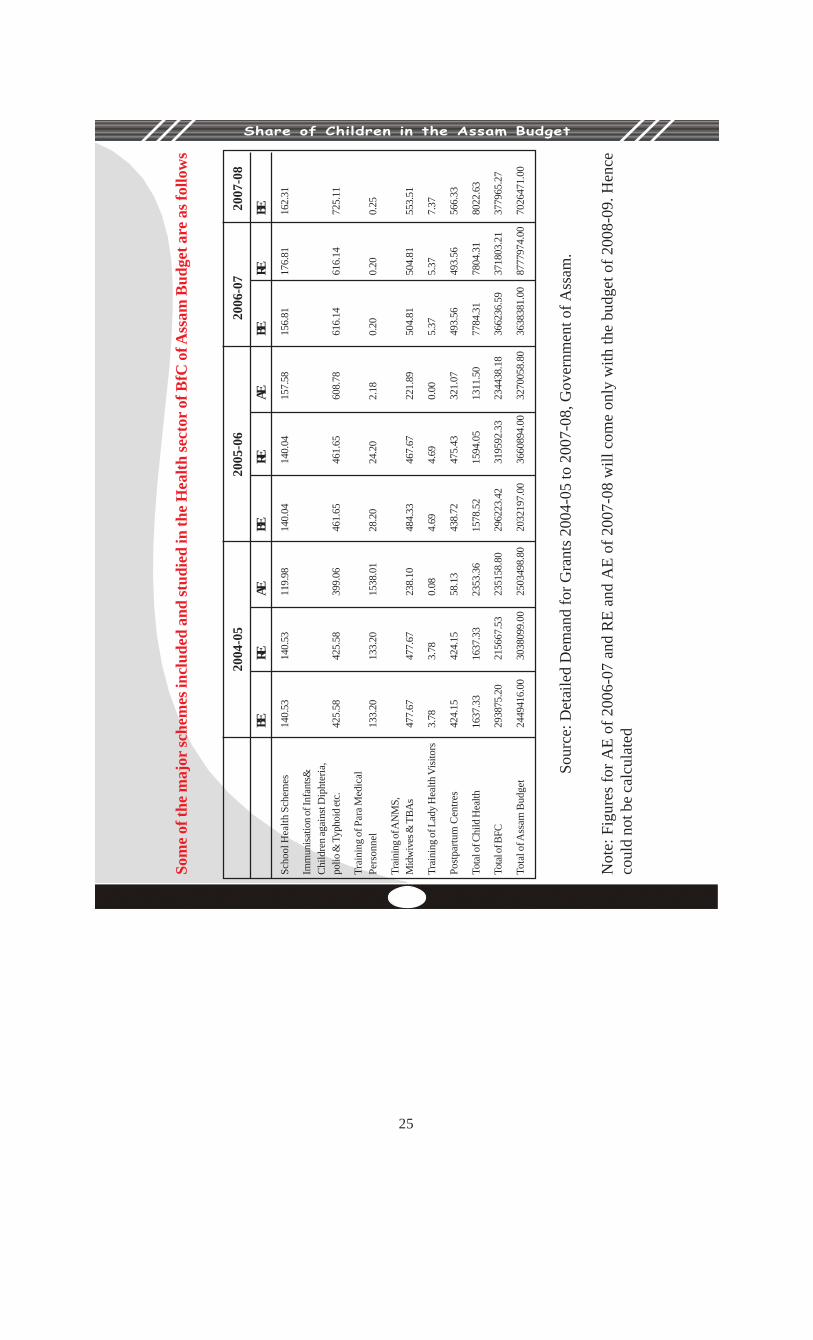
Share of Children in the Assam Budget
Som
e of
the
maj
or sc
hem
es in
clud
ed a
nd st
udie
d in
the
Hea
lth se
ctor
of B
fC o
f Ass
am B
udge
t are
as f
ollo
ws
2004
-05
2005
-06
2006
-07
2007
-08
BERE
AEBE
REAE
BERE
BE
Scho
ol H
ealth
Sch
emes
140.
5314
0.53
119.
9814
0.04
140.
0415
7.58
156.
8117
6.81
162.
31
Imm
unisa
tion o
f Inf
ants&
Chi
ldre
n ag
ains
t Dip
hter
ia,
polio
& T
ypho
id et
c.42
5.58
425.
5839
9.06
461.
6546
1.65
608.
7861
6.14
616.
1472
5.11
Trai
ning
of P
ara M
edic
alPe
rson
nel
133.
2013
3.20
1538
.01
28.2
024
.20
2.18
0.20
0.20
0.25
Trai
ning
of A
NM
S,M
idw
ives
& T
BAs
477.
6747
7.67
238.
1048
4.33
467.
6722
1.89
504.
8150
4.81
553.
51
Trai
ning
of L
ady
Hea
lth V
isito
rs3.
783.
780.
084.
694.
690.
005.
375.
377.
37
Post
partu
m C
entre
s42
4.15
424.
1558
.13
438.
7247
5.43
321.
0749
3.56
493.
5656
6.33
Tota
l of C
hild
Hea
lth16
37.3
316
37.3
323
53.3
615
78.5
215
94.0
513
11.5
077
84.3
178
04.3
180
22.6
3
Total
of B
FC29
3875
.20
2156
67.5
323
5158
.80
2962
23.4
231
9592
.33
2344
38.1
836
6236
.59
3718
03.2
137
7965
.27
Tota
l of A
ssam
Bud
get
2449
416.
0030
3809
9.00
2503
498.
8020
3219
7.00
3660
894.
0032
7005
8.80
3638
381.
0087
7797
4.00
7026
471.
00
Sour
ce: D
etai
led
Dem
and
for G
rant
s 200
4-05
to 2
007-
08, G
over
nmen
t of A
ssam
.
Not
e: F
igur
es fo
r AE
of 2
006-
07 a
nd R
E an
d A
E of
200
7-08
will
com
e on
ly w
ith th
e bu
dget
of 2
008-
09. H
ence
coul
d no
t be
calc
ulat
ed
26
Share of Children in the Assam Budget
Note: Figures for AE of 2006-07 and RE and AE of 2007-08 will come only with the budget of 2008-09.Hence it could not be calculated
The state as a whole has very few schemes for child health. The major schemes are centrallysponsored. In fact, the National Rural Health Mission (NRHM) has taken all major schemes into its fold.Table 4.2 gives details of schemes in the health sector of BFC in the Assam Budget.In the School Health Scheme, the allocation has increased by 3.5 per cent over the previous year. All thesalary, which used to be divided between the plan and non-plan sectors has been included in the non-plansector during 2007-08. This transfer from the plan to non-plan sector seems to be one of the reasons forthe rise.
A 17.68 per cent rise is also seen in the scheme of Immunisation of Infants and Children againstdiphtheria, polio, typhoid etc. This increase is due to a rise in salaries and other administrative expenses.No rise is noticed in materials and supplies.
Increase in the allocation for centrally sponsored schemes like postpartum centres and training ofauxiliary nurse midwives (ANM) is a positive sign. However, there is doubt about their continuity sinceno non-plan expenditure has been mentioned for these programmes. Besides, though the total budget fortraining ANMs and Trained Birth Attendants (TBA) has increased, that for the Sixth Schedule areas hasdecreased by 34.81 per cent.
Only four state schemes even with a rise in allocations are not enough in a state where IMR andbirth rates are higher than the national average. In the Child Health sector, too much dependence is visibleon centrally sponsored schemes. That can pose a threat to the sustenance of the scheme. If the Centrechanges its policy or fails to allocate funds for it, overall child health in the state will suffer.
Conclusion :
Though the allocation for children in the health sector in 2007-08 (BE) has increased by 3.06 percent over that of 2006-07, the share of the budget for child health remains at a poor 0.11 per cent of theoverall state budget. Within the BFC, its share is a small 2.12 per cent. However, the allocation for childhealth has been following a rising trend. Between 2004-05 and 2007-08 it has increased by 79.59 per cent.But the health sector of the children in the state has been looked after by the major Central Sector Schemeof NRHM. Among the schemes mentioned in the Assam budget 2007-08, rise has been observed in theSchool Health Scheme, Immunisation of Infants & Children against diphtheria, polio, typhoid etc andtraining of ANMs and TBAs. In the two years for which figures of actual expenditure are available, it washigher in 2004-05 but lower in the following year. The revised allocation was higher than the BE in all thepast four years.
20
27
Share of Children in the Assam Budget
Chapter 5Education
T he Education sector encompasses within its ambit elementary and secondary education involvingthe children of 6-18 years. The allocations for schemes like technical, non-formal and special educationfor handicapped, SC, ST and OBC children too are included in these two broad categories.
“The announcement of two new scholarships for poor and physically challenged students,…….special library grants to colleges and government aided schools are remarkable features ofthe budget. Distribution of computers to students getting first division in High School LeavingCertificate Examination has become a regular feature of the present government.”
-Dr. Subhrangshu Sekhar Sarkar, Faculty Member, Department of Management, Tezpur University,Assam commenting on the Assam State Budget 2007-08
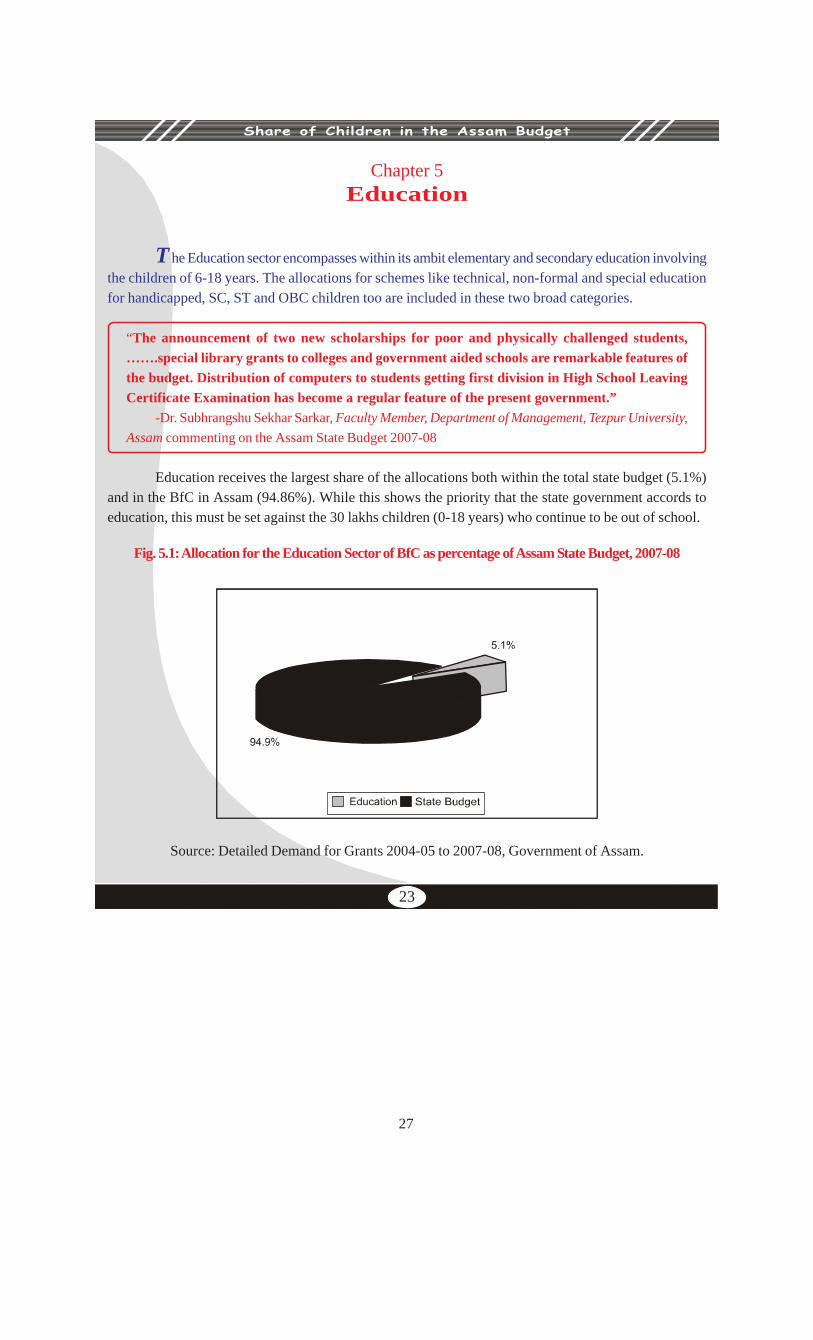
Education receives the largest share of the allocations both within the total state budget (5.1%)and in the BfC in Assam (94.86%). While this shows the priority that the state government accords toeducation, this must be set against the 30 lakhs children (0-18 years) who continue to be out of school.
Fig. 5.1: Allocation for the Education Sector of BfC as percentage of Assam State Budget, 2007-08
Source: Detailed Demand for Grants 2004-05 to 2007-08, Government of Assam.
23
28
Share of Children in the Assam Budget
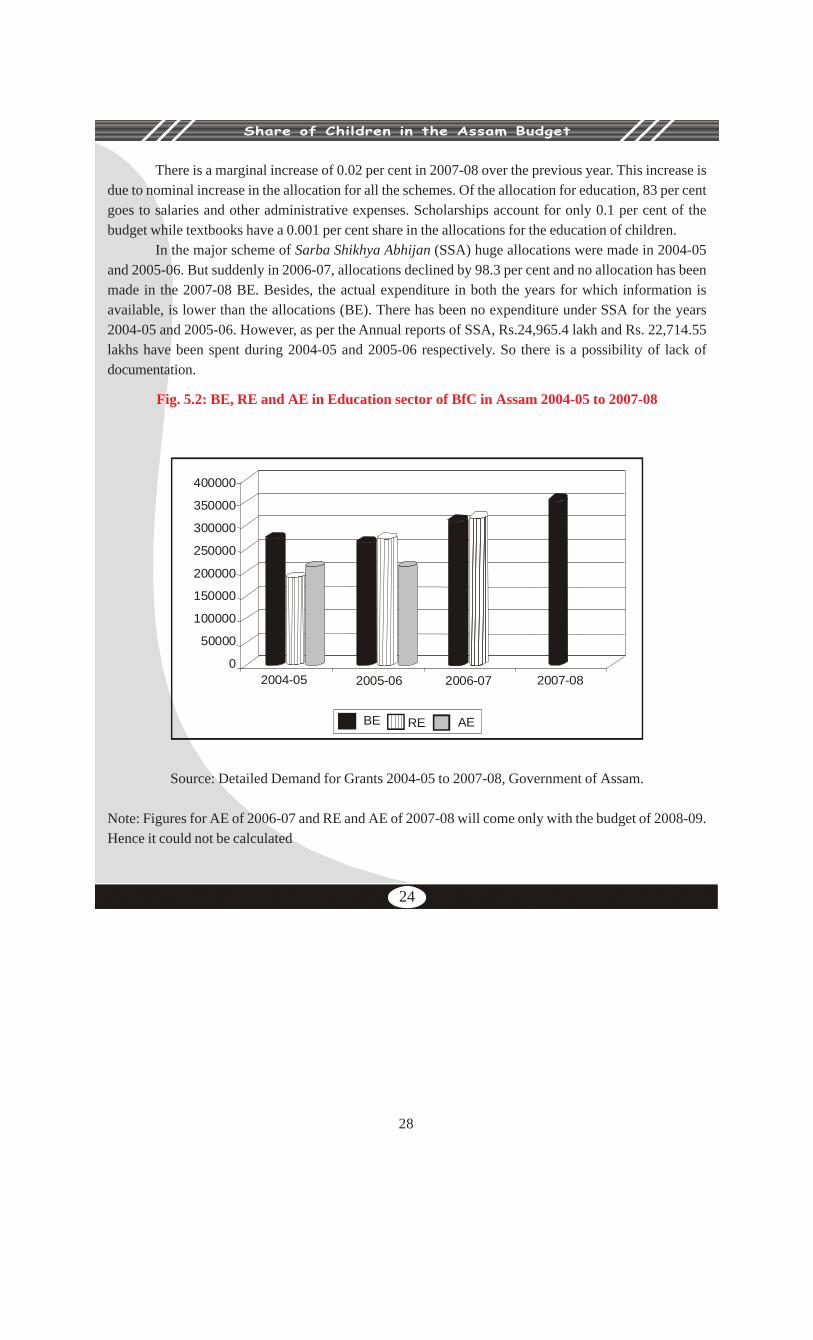
There is a marginal increase of 0.02 per cent in 2007-08 over the previous year. This increase isdue to nominal increase in the allocation for all the schemes. Of the allocation for education, 83 per centgoes to salaries and other administrative expenses. Scholarships account for only 0.1 per cent of thebudget while textbooks have a 0.001 per cent share in the allocations for the education of children.
In the major scheme of Sarba Shikhya Abhijan (SSA) huge allocations were made in 2004-05and 2005-06. But suddenly in 2006-07, allocations declined by 98.3 per cent and no allocation has beenmade in the 2007-08 BE. Besides, the actual expenditure in both the years for which information isavailable, is lower than the allocations (BE). There has been no expenditure under SSA for the years2004-05 and 2005-06. However, as per the Annual reports of SSA, Rs.24,965.4 lakh and Rs. 22,714.55lakhs have been spent during 2004-05 and 2005-06 respectively. So there is a possibility of lack ofdocumentation.
Fig. 5.2: BE, RE and AE in Education sector of BfC in Assam 2004-05 to 2007-08
400000
350000
300000
250000
200000
150000
100000
50000
02004-05
BE RE AE
2005-06 2006-07 2007-08
Source: Detailed Demand for Grants 2004-05 to 2007-08, Government of Assam.
Note: Figures for AE of 2006-07 and RE and AE of 2007-08 will come only with the budget of 2008-09.Hence it could not be calculated
24
29
Share of Children in the Assam Budget
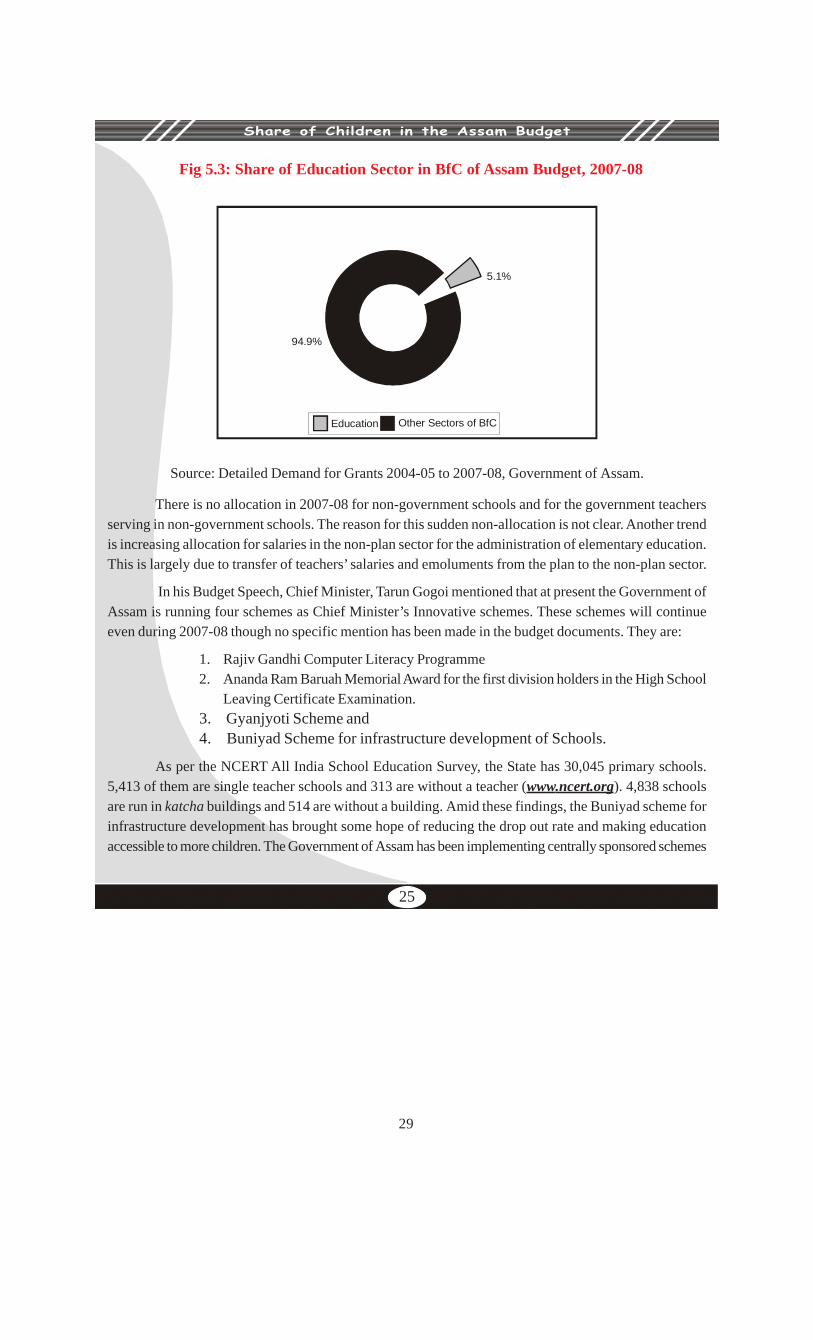
Fig 5.3: Share of Education Sector in BfC of Assam Budget, 2007-08
5.1%
94.9%
Education Other Sectors of BfC
Source: Detailed Demand for Grants 2004-05 to 2007-08, Government of Assam.
There is no allocation in 2007-08 for non-government schools and for the government teachersserving in non-government schools. The reason for this sudden non-allocation is not clear. Another trendis increasing allocation for salaries in the non-plan sector for the administration of elementary education.This is largely due to transfer of teachers’ salaries and emoluments from the plan to the non-plan sector.
In his Budget Speech, Chief Minister, Tarun Gogoi mentioned that at present the Government ofAssam is running four schemes as Chief Minister’s Innovative schemes. These schemes will continueeven during 2007-08 though no specific mention has been made in the budget documents. They are:
1. Rajiv Gandhi Computer Literacy Programme2. Ananda Ram Baruah Memorial Award for the first division holders in the High School
Leaving Certificate Examination.3. Gyanjyoti Scheme and4. Buniyad Scheme for infrastructure development of Schools.
As per the NCERT All India School Education Survey, the State has 30,045 primary schools.5,413 of them are single teacher schools and 313 are without a teacher (www.ncert.org). 4,838 schoolsare run in katcha buildings and 514 are without a building. Amid these findings, the Buniyad scheme forinfrastructure development has brought some hope of reducing the drop out rate and making educationaccessible to more children. The Government of Assam has been implementing centrally sponsored schemes
25
30
Share of Children in the Assam Budget
Som
e of
the
maj
or s
chem
es in
clud
ed a
nd s
tudi
ed in
the
Edu
catio
n se
ctor
of B
fC o
f Ass
am B
udge
t are
as
follo
ws
2004
-05
2005
-06
2006
-07
2007
-08
BERE
AEBE
REAE
BERE
BE
Ele
men
tary
Edu
catio
nTo
tal G
ovt.P
re-P
rimar
y Sch
ool
190.
7626
.78
1091
.94
372.
6137
2.61
81.8
922
7.87
227.
8725
1.22
Tota
l Gov
t. Pr
imar
y Sch
ool
9471
6.61
1565
3.78
5513
9.55
9771
4.91
9771
4.91
5496
1.78
1088
44.7
910
8844
.79
1054
79.0
8To
tal G
ovt.
Mid
dle S
choo
l61
167.
9361
167.
9373
087.
6180
287.
5480
287.
5468
774.
0079
253.
9479
253.
9478
752.
21A
ssis
tanc
e to
Non
-gov
ernm
ent
Scho
ol11
48.1
611
48.1
610
53.5
211
01.2
011
01.2
026
.51
327.
8032
7.80
0.00
Tota
l Gov
t tea
cher
s ser
ving
inno
n go
vt m
iddl
e sch
ools
2641
.51
2641
.51
1497
.03
2588
.80
2588
.80
1203
.78
2547
.45
2547
.45
0.00
Mai
nten
ance
of B
uild
ings
-O
ther
s31
6.43
316.
4326
.40
776.
5077
6.50
159.
2021
4.50
214.
5045
5.50
Insp
ectio
n-El
emen
tary
Sch
ool
2573
.98
2573
.98
2234
.04
2992
.08
2992
.08
2375
.12
3710
.52
3710
.52
3666
.99
Text
Boo
ks16
3.30
163.
3085
.57
103.
3010
3.30
7000
.00
3.30
3.30
3.30
Scho
lars
hips
263.
2026
3.20
142.
4029
8.21
298.
2117
1.65
370.
9637
0.96
400.
96Ex
amin
atio
n9.
829.
8294
3.59
10.8
210
.82
5.40
13.8
213
.82
13.8
2Te
ache
rs T
rain
ing
547.
1954
7.19
440.
5146
2.90
462.
9055
2.06
521.
6652
0.01
546.
28M
id-d
ay M
eal
0.00
1789
.00
1617
.71
4379
.14
4379
.14
2391
.32
6133
.83
1298
1.15
2317
8.83
SSA
2700
0.00
2700
0.00
2042
.01
3000
0.00
3000
0.00
0.00
500.
0050
0.00
0.00
Seco
ndar
y Edu
catio
nTo
tal D
irect
ion &
Adm
inist
ratio
n21
7.80
217.
8071
9.40
258.
8125
8.81
222.
7210
810.
4410
810.
4490
22.2
5M
aint
enan
ce o
f Vig
yan
man
dir
8.39
8.39
177.
546.
946.
9493
.03
10.1
910
.19
11.3
0To
tal I
nspe
ctio
n77
1.72
771.
7253
7.96
831.
1183
1.11
643.
7793
4.20
934.
2075
6.43
Scho
lars
hips
91.6
364
.63
23.5
311
8.95
118.
9537
.10
105.
0080
.00
78.7
5To
tal o
f Chi
ld E
duca
tion
2724
74.2
018
8465
.03
2111
44.6
426
7149
.84
2727
21.7
621
1729
.21
3134
70.8
631
9017
.98
3585
67.1
9To
tal of
BFC
2938
75.2
021
5667
.53
2351
58.8
029
6223
.42
3195
92.3
323
4438
.18
3662
36.5
937
1803
.21
3779
65.2
7To
tal o
f Ass
am B
udge
t24
4941
6.00
3038
099.
0025
0349
8.80
2032
197.
0036
6089
4.00
3270
058.
8036
3838
1.00
8777
974.
0070
2647
1.00
Sour
ce: D
etai
led
Dem
and
for G
rant
s 200
4-05
to 2
007-
08, G
over
nmen
t of A
ssam
.
Not
e: F
igur
es fo
r AE
of 2
006-
07 a
nd R
E an
d A
E of
200
7-08
will
com
e on
ly w
ith th
e bu
dget
of 2
008-
09. H
ence
cou
ld n
ot b
eca
lcul
ated
26
31
Share of Children in the Assam Budget
like Sarba Shikhya Abhijan and the Mid-Day Meal scheme. The State government has neither startedsuch schemes of its own to supplement the Central efforts nor has it allocated funds for SSA in 2007-08.Besides, in the process of implementing these schemes anomalies have come to light and the media havehighlighted some of them. Even the CAG report (Report 15 of 2006) mentions huge amounts of moneyspent on items not permitted in the SSA budget. That may make the attainment of the objectives of thescheme difficult.
Last but not the least; the 2007-08 budget has made specific allocations for handicapped andfor SC, ST and OBC children. But all of them taken together account for only 1.59 per cent of the totalallocations made for child education.
Conclusion :
The chapter reveals that the largest share of the BFC goes to the sector of education. It attributes5.1 per cent to the State budget as a whole. This implies higher priority accorded to child education. Therise in 2007-08 as compared to 2006-07 is a marginal 0.02 per cent. The major scheme in this sector is thecentrally sponsored Sarba Shikhya Abhijan. In this scheme, huge allocations were made in 2004-05 and2005-06. They declined suddenly by 98.3 per cent in 2006-07 and nothing is allocated in the 2007-08 BE.Lack of Proper documentation and non-allocation are visible in 2007-08 for schemes like non-governmentschools and for the government teachers serving in non-government schools. Some other anomalies likeexpenditure outside the budget, non-utilisation of funds etc are also clear from sources. A relatively smallamount is allocated for handicapped, SC, ST and OBC children of the State.
27
32
Share of Children in the Assam Budget
Chapter 6Protection
In this sector, the interventions aimed at the disadvantaged groups of children i.e. child labourers;children in need of adoption; child sex-workers; physically or mentally challenged children; homeless orstreet children; neglected children or those who are treated as juvenile delinquents are taken care of.
Our government is determined to help the physically challenged children grow as healthy citizens.And for this matter, it is considering special schemes of providing qualitative education,employment along with care and protection-Chie Minister Mr. Tarun Gogoi addressing a publicmeeting organised as part of the inauguration of a Juvenile Justice Home at Boko. (DainikJanambhumi, 23rd November, 2007)
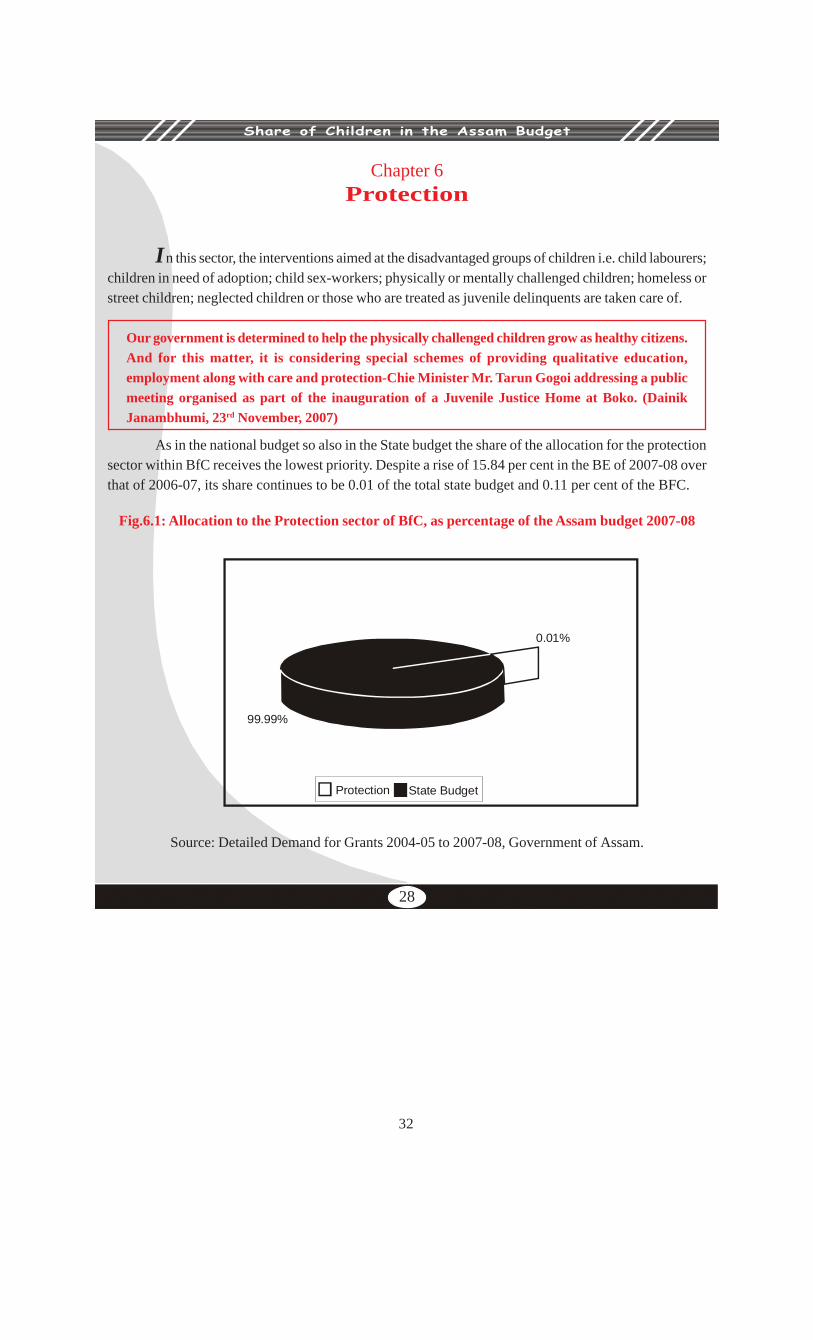
As in the national budget so also in the State budget the share of the allocation for the protectionsector within BfC receives the lowest priority. Despite a rise of 15.84 per cent in the BE of 2007-08 overthat of 2006-07, its share continues to be 0.01 of the total state budget and 0.11 per cent of the BFC.
Fig.6.1: Allocation to the Protection sector of BfC, as percentage of the Assam budget 2007-08
99.99%
Protection State Budget
0.01%
Source: Detailed Demand for Grants 2004-05 to 2007-08, Government of Assam.
28
33
Share of Children in the Assam Budget
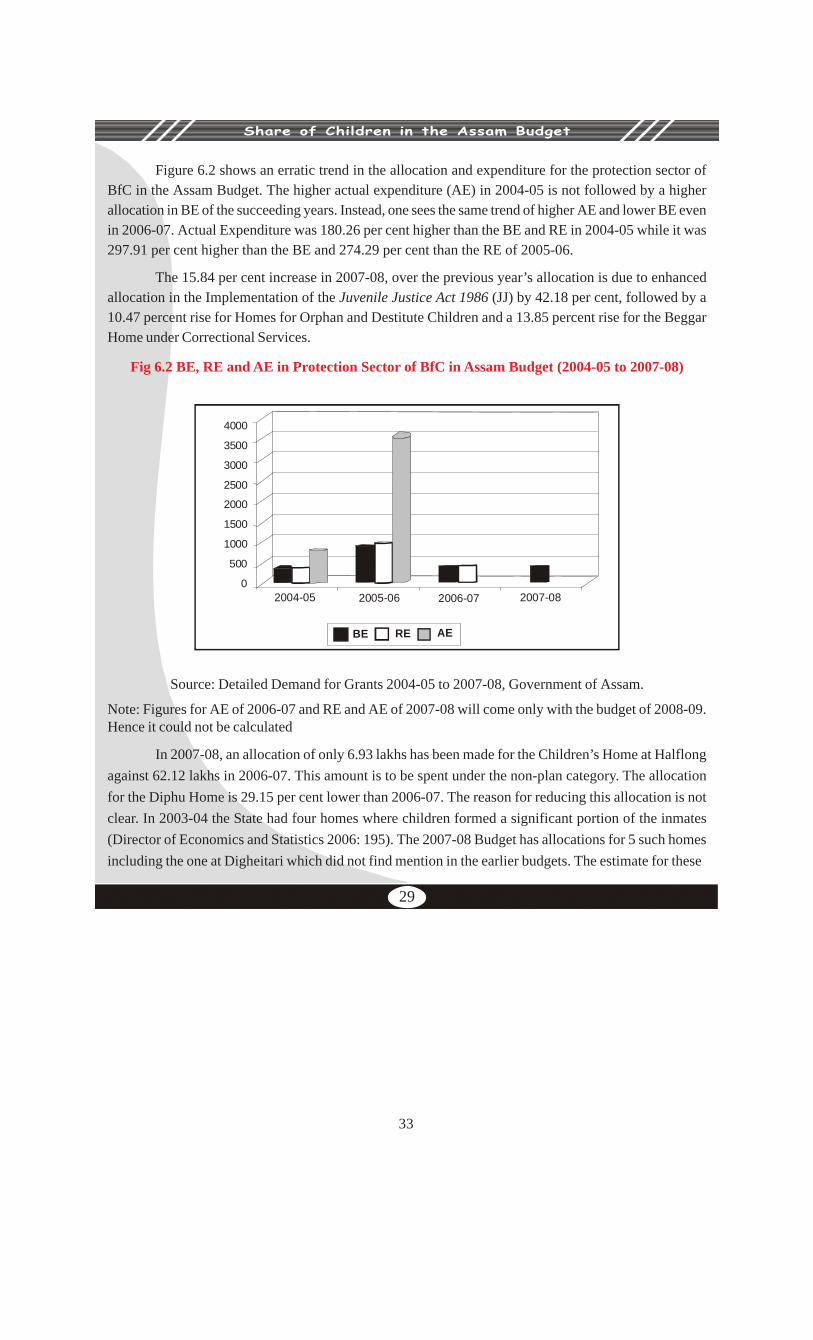
Figure 6.2 shows an erratic trend in the allocation and expenditure for the protection sector ofBfC in the Assam Budget. The higher actual expenditure (AE) in 2004-05 is not followed by a higherallocation in BE of the succeeding years. Instead, one sees the same trend of higher AE and lower BE evenin 2006-07. Actual Expenditure was 180.26 per cent higher than the BE and RE in 2004-05 while it was297.91 per cent higher than the BE and 274.29 per cent than the RE of 2005-06.
The 15.84 per cent increase in 2007-08, over the previous year’s allocation is due to enhancedallocation in the Implementation of the Juvenile Justice Act 1986 (JJ) by 42.18 per cent, followed by a10.47 percent rise for Homes for Orphan and Destitute Children and a 13.85 percent rise for the BeggarHome under Correctional Services.
Fig 6.2 BE, RE and AE in Protection Sector of BfC in Assam Budget (2004-05 to 2007-08)
4000
3500
3000
2500
2000
1500
1000
500
02004-05
BE RE AE
2005-06 2006-07 2007-08
Source: Detailed Demand for Grants 2004-05 to 2007-08, Government of Assam.
Note: Figures for AE of 2006-07 and RE and AE of 2007-08 will come only with the budget of 2008-09.Hence it could not be calculated
In 2007-08, an allocation of only 6.93 lakhs has been made for the Children’s Home at Halflongagainst 62.12 lakhs in 2006-07. This amount is to be spent under the non-plan category. The allocationfor the Diphu Home is 29.15 per cent lower than 2006-07. The reason for reducing this allocation is notclear. In 2003-04 the State had four homes where children formed a significant portion of the inmates(Director of Economics and Statistics 2006: 195). The 2007-08 Budget has allocations for 5 such homesincluding the one at Digheitari which did not find mention in the earlier budgets. The estimate for these
29
34
Share of Children in the Assam Budget
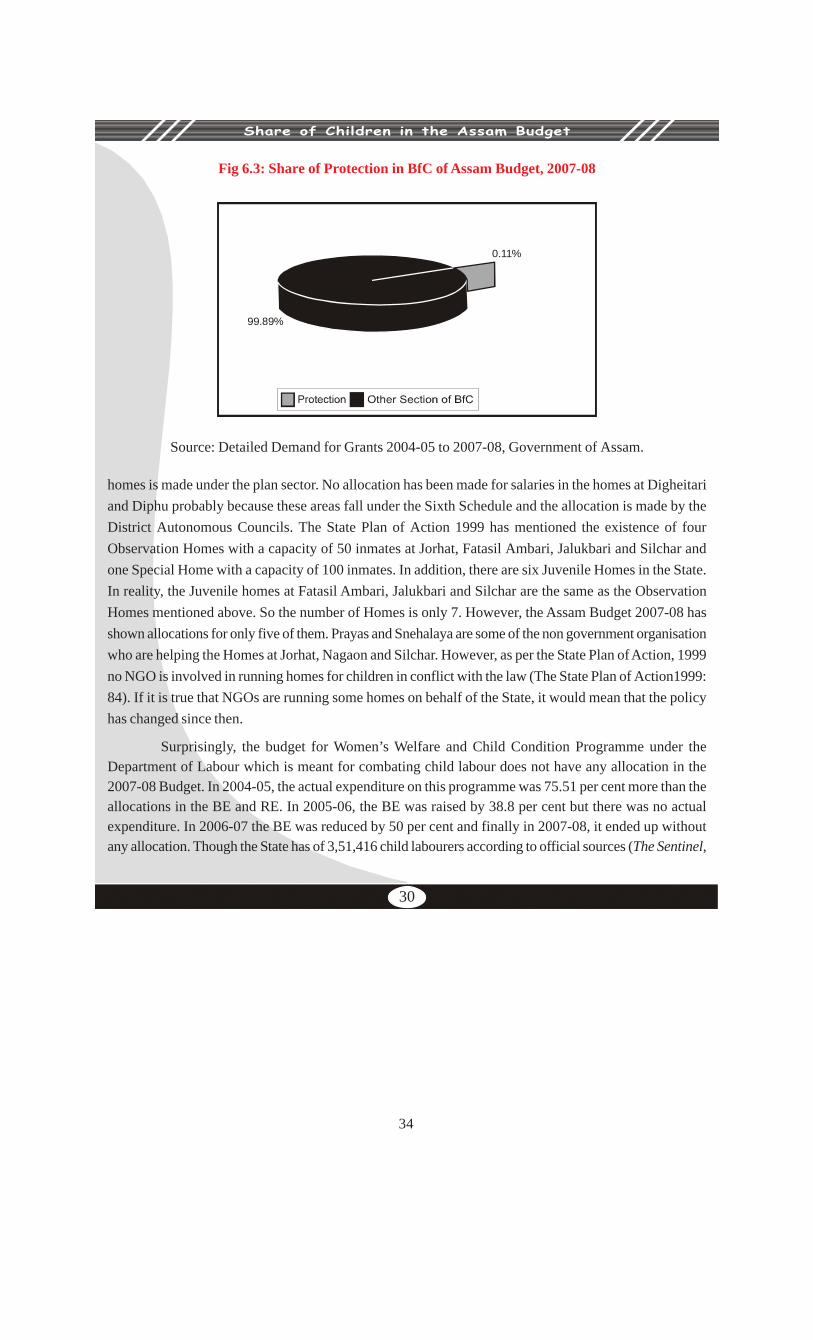
Fig 6.3: Share of Protection in BfC of Assam Budget, 2007-08
99.89%
0.11%
Source: Detailed Demand for Grants 2004-05 to 2007-08, Government of Assam.
homes is made under the plan sector. No allocation has been made for salaries in the homes at Digheitariand Diphu probably because these areas fall under the Sixth Schedule and the allocation is made by theDistrict Autonomous Councils. The State Plan of Action 1999 has mentioned the existence of fourObservation Homes with a capacity of 50 inmates at Jorhat, Fatasil Ambari, Jalukbari and Silchar andone Special Home with a capacity of 100 inmates. In addition, there are six Juvenile Homes in the State.In reality, the Juvenile homes at Fatasil Ambari, Jalukbari and Silchar are the same as the ObservationHomes mentioned above. So the number of Homes is only 7. However, the Assam Budget 2007-08 hasshown allocations for only five of them. Prayas and Snehalaya are some of the non government organisationwho are helping the Homes at Jorhat, Nagaon and Silchar. However, as per the State Plan of Action, 1999no NGO is involved in running homes for children in conflict with the law (The State Plan of Action1999:84). If it is true that NGOs are running some homes on behalf of the State, it would mean that the policyhas changed since then.
Surprisingly, the budget for Women’s Welfare and Child Condition Programme under theDepartment of Labour which is meant for combating child labour does not have any allocation in the2007-08 Budget. In 2004-05, the actual expenditure on this programme was 75.51 per cent more than theallocations in the BE and RE. In 2005-06, the BE was raised by 38.8 per cent but there was no actualexpenditure. In 2006-07 the BE was reduced by 50 per cent and finally in 2007-08, it ended up withoutany allocation. Though the State has of 3,51,416 child labourers according to official sources (The Sentinel,
30
35
Share of Children in the Assam Budget
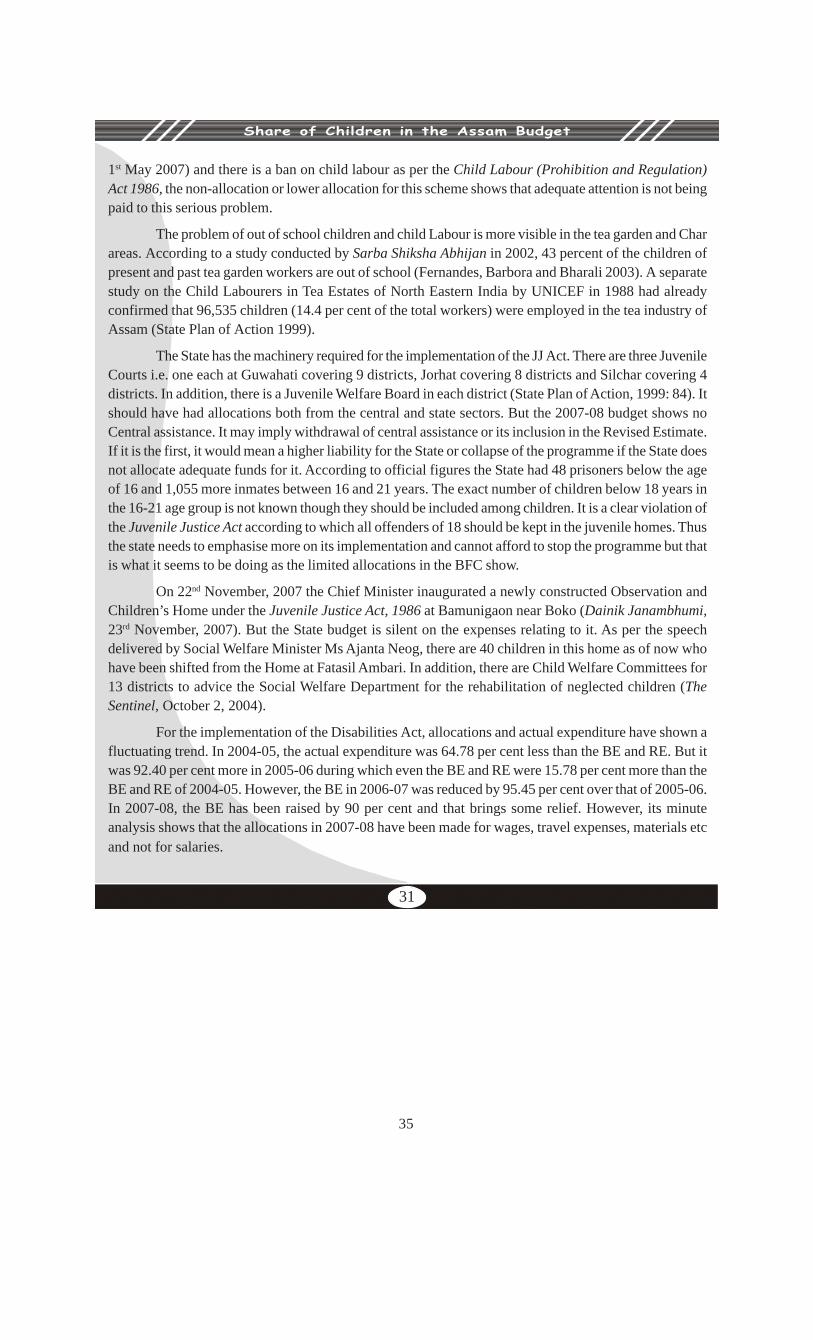
1st May 2007) and there is a ban on child labour as per the Child Labour (Prohibition and Regulation)Act 1986, the non-allocation or lower allocation for this scheme shows that adequate attention is not beingpaid to this serious problem.
The problem of out of school children and child Labour is more visible in the tea garden and Charareas. According to a study conducted by Sarba Shiksha Abhijan in 2002, 43 percent of the children ofpresent and past tea garden workers are out of school (Fernandes, Barbora and Bharali 2003). A separatestudy on the Child Labourers in Tea Estates of North Eastern India by UNICEF in 1988 had alreadyconfirmed that 96,535 children (14.4 per cent of the total workers) were employed in the tea industry ofAssam (State Plan of Action 1999).
The State has the machinery required for the implementation of the JJ Act. There are three JuvenileCourts i.e. one each at Guwahati covering 9 districts, Jorhat covering 8 districts and Silchar covering 4districts. In addition, there is a Juvenile Welfare Board in each district (State Plan of Action, 1999: 84). Itshould have had allocations both from the central and state sectors. But the 2007-08 budget shows noCentral assistance. It may imply withdrawal of central assistance or its inclusion in the Revised Estimate.If it is the first, it would mean a higher liability for the State or collapse of the programme if the State doesnot allocate adequate funds for it. According to official figures the State had 48 prisoners below the ageof 16 and 1,055 more inmates between 16 and 21 years. The exact number of children below 18 years inthe 16-21 age group is not known though they should be included among children. It is a clear violation ofthe Juvenile Justice Act according to which all offenders of 18 should be kept in the juvenile homes. Thusthe state needs to emphasise more on its implementation and cannot afford to stop the programme but thatis what it seems to be doing as the limited allocations in the BFC show.
On 22nd November, 2007 the Chief Minister inaugurated a newly constructed Observation andChildren’s Home under the Juvenile Justice Act, 1986 at Bamunigaon near Boko (Dainik Janambhumi,23rd November, 2007). But the State budget is silent on the expenses relating to it. As per the speechdelivered by Social Welfare Minister Ms Ajanta Neog, there are 40 children in this home as of now whohave been shifted from the Home at Fatasil Ambari. In addition, there are Child Welfare Committees for13 districts to advice the Social Welfare Department for the rehabilitation of neglected children (TheSentinel, October 2, 2004).
For the implementation of the Disabilities Act, allocations and actual expenditure have shown afluctuating trend. In 2004-05, the actual expenditure was 64.78 per cent less than the BE and RE. But itwas 92.40 per cent more in 2005-06 during which even the BE and RE were 15.78 per cent more than theBE and RE of 2004-05. However, the BE in 2006-07 was reduced by 95.45 per cent over that of 2005-06.In 2007-08, the BE has been raised by 90 per cent and that brings some relief. However, its minuteanalysis shows that the allocations in 2007-08 have been made for wages, travel expenses, materials etcand not for salaries.
31
36
Share of Children in the Assam Budget
Som
e of
the
maj
or s
chem
es in
clud
ed a
nd s
tudi
ed in
the
Prot
ectio
n se
ctor
of B
fC o
f Ass
am B
udge
t are
as
follo
ws
2004
-05
2005
-06
2006
-07
2007
-08
BERE
AEBE
REAE
BERE
BE
Hom
es fo
r Des
titut
es &
Vagr
ant C
hild
ren
48.2
650
.76
588.
7380
.92
80.9
264
.31
81.1
881
.18
32.0
6
Tota
l Im
plem
enta
tion
of JJ
Act
150.
0015
0.00
106.
9850
.00
100.
0033
81.1
021
1.00
211.
0030
0.00
Wel
fare
of A
ged,
Infir
m an
dD
estit
ute
Wom
en18
.69
18.6
921
.95
15.0
622
.06
16.5
616
.72
16.7
218
.47
Cor
rect
iona
l Ser
vice
s12
.28
12.2
810
.48
11.6
811
.68
13.8
912
.80
12.8
014
.62
Ass
ista
nce t
o V
O fo
r Wel
fare
of
Chi
ldre
n in
and
care
of P
rote
ctio
n8.
084.
080.
0070
8.08
708.
0837
.87
7.33
7.33
8.00
Impl
emen
tatio
n of
Disa
bilit
ies A
ct19
.00
19.0
06.
6922
.00
22.0
042
.33
1.00
1.00
10.1
2
Wom
en W
elfa
re a
ndCh
ild C
ondi
tion
0.72
0.72
2.99
1.00
1.00
0.00
0.50
0.00
0.00
Tota
l of C
hild
Pro
tect
ion
272.
5727
2.57
763.
9390
3.44
960.
4435
94.9
134
3.41
342.
9139
7.84
Total
of B
FC29
3875
.20
2156
67.5
323
5158
.80
2962
23.4
231
9592
.33
2344
38.1
836
6236
.59
3718
03.2
137
7965
.27
Tota
l of A
ssam
Bud
get
2449
416.
0030
3809
9.00
2503
498.
8020
3219
7.00
3660
894.
0032
7005
8.80
3638
381.
0087
7797
4.00
7026
471.
00
Sour
ce: D
etai
led
Dem
and
for G
rant
s 200
4-05
to 2
007-
08, G
over
nmen
t of A
ssam
.
Not
e: F
igur
es fo
r AE
of 2
006-
07 a
nd R
E an
d A
E of
200
7-08
will
com
e on
ly w
ith th
e bu
dget
of 2
008-
09. H
ence
cou
ld n
ot b
eca
lcul
ated
32
37
Share of Children in the Assam Budget
Conclusion :
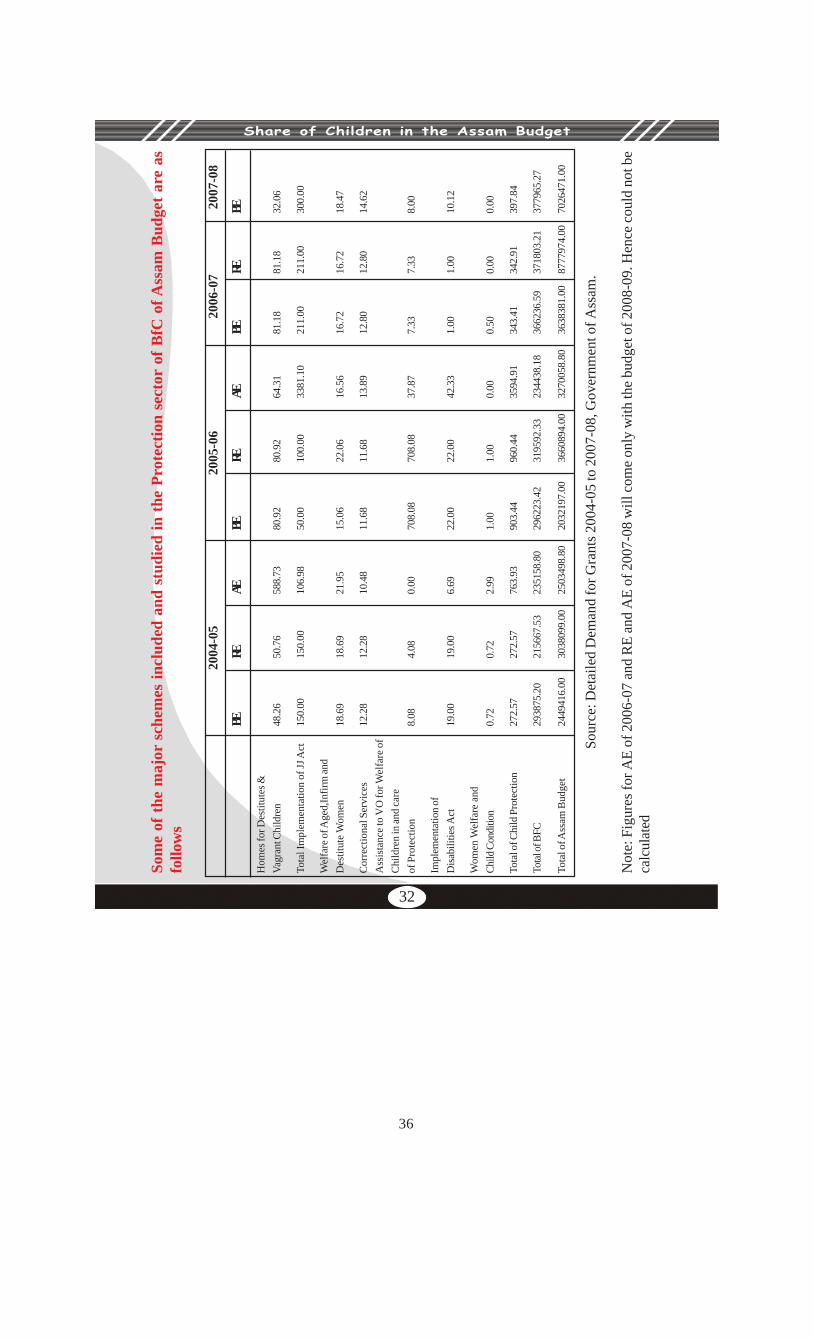
Child Protection is the least prioritised part in the Budget for Children in Assam. The allocation(BE) for this sector in 2007-08 has increased over that of 2006-07. But still it is very low in both the BFCand the State Budget. Though a number of Acts have been passed to prove the nation’s commitmenttowards the protection of children these commitment have not found expression in the State Budget ofAssam. The expenditure is higher in both the years for which data is available but the correspondingbudget and revised estimate is not so high. Some existing interventions like Children’s Homes have notfound place in the budget while some others like the one for eradication of child labour are without anyallocation. Hence the need for proper monitoring of the implementation and fund flow of the programmesseems to be an urgent necessity.
33
38
Share of Children in the Assam Budget
Chapter 7Conclusion
T he State Plan of Action 1999, in its goals and objectives has mentioned the need to build uppublic and official awareness on child rights in order to increase social and political commitment to thecause of children. It also set the objective of incorporating Child Rights goals into state laws, policies,plans and budgets. A loss at the budget for the children in Assam shows that this objective is still far frombeing realised. Many of the proposed interventions which set 2002 as the deadline have not been implementedtill today.
The Assam Budget has on an average allocated 8.79 per cent of the total to children during 2004-05 to 2007-08. Out of this a major share goes to child education followed by development and health.Protection receives the lowest share among the four sectors. Four major all encompassing flagshipprogrammes sponsored by the central government are being run in the state. The schemes are SarbaShikhya Abhijan and Mid-Day Meal Scheme in education, NRHM in health and ICDS in development.Both SSA and ICDS show a huge decline in allocation. Some other major schemes showing a decline inallocation are the Family Welfare Project, the Intensive Child Development Scheme, non-governmentschools and the government teachers’ serving in non-government schools. Alongside, there are also certainschemes like the health related state funding schemes, Balwadi Programme, World Food Programme forSupplementary Nutrition etc having higher allocation. The major lacunae observed in the Budget ForChildren of Assam during 2004-05 to 2007-08 can be summarised as follows:
• Non allocation or decreased allocation for certain schemes which may pose threat to the childsurvival and development in the state.
• Over expenditure not kept in mind during the preparation of next years’ budget.
• Expenditure incurred outside the budget estimate.
• Non utilisation of funds.
• Proper documentation of the existing interventions in all the four sectors.
• Relatively lower allocation for handicapped, SC, ST and OBC children of the State.
• Fewer schemes and lower allocation for schemes meant for girl children of the state.
• Implementation of the Legislations enacted in favour of children and mention thereof in the statebudget.
• Maintenance of existing programmes and monitoring thereof.
34
39
Share of Children in the Assam Budget
The Government of Assam has expressed its commitment towards children’s welfare through theState Plan of Action and interventions like observation homes, Intensive Child Development scheme etc.A number of acts have been passed to safeguard the cause of children. Also the implementation machineryhas been set up. Some of these commitments are being realised but much more has to be done and that hasto be accorded adequate space in the State Budget. Non-allocation or lower allocation than required forschemes of child welfare compromise the state’s efforts and commitment for the cause. Lower allocationfor specific groups of children like the disabled, Dalit, tribal and girls will result in further deterioration.At the same time in the absence of strong monitoring and vigilance systems, doubts are being expressedabout the implementation of the programmes. Higher or lower actual expenditure against the estimatedand revised estimates needs to be kept in mind while preparing a scheme or allocating funds for it. Besides,depending on the situation state specific measures need to be adopted for child victims of militancy andcounter-militancy operations. In these circumstances, the government needs to be more focused and objectivewhile preparing the financial statement and implementing them.
35
40
Share of Children in the Assam Budget
References:
Bose, Ashish.2001”Black Holes in India’s Demographic Transition: Collapse of a Civilisation”Health for the Millions 27 (n.3 May-June),pp.45-48.
Comptroller and Auditor General of India. 2006. CAG Report 15 of 2006. New Delhi:Government of India
Director of Economics and Statistics. 2005,2006 and 2007, Economic Survey 2004-05, 2005-06and 2007-08. Guwahati: Government of Assam.
Director of Economics and Statistics 2006, Statistical Handbook of Assam 2006, Guwahati:Government of Assam.
Fernandes, Walter, Sanjay Barbora and Gita Bharali. 2003. Children of the Plantation Labourers…And Their Right to Education…, Guwahati: North Eastern Social Research Centre.
Ganguly, S.P, 2000. Central Government Budgets in India, An Analysis. New Delhi:Concept Publishing House.
Government of Assam, 1999: The State Plan of Action 1999. Guwahati: Government of Assam.
Kacker, Loveleen, Srinivas Varadan and Pravesh Kumar. 2007. Study on Child Abuse: India 2007.New Delhi: Union Ministry of Women and Child Development.
Ministry of Finance. Assam. 2004 to 2007. Detailed Demand for Grants for the Departments ofSocial Welfare, Elementary Education, Secondary Education, Technical Education, Labour, Healthand Family Welfare, Panchayat and Rural Development, Urban Development. Guwahati:Government of Assam.
UNESCO. 2007. EFA Global Monitoring Report 2008. Paris: Oxford University Press.www.ncert.org
36
41
Share of Children in the Assam Budget
Back Cover
Children who are the future of the country and of Assam are 43 percent of the State’s population but getonly 8.8 percent of the State’s budgetary allocations. In such a situation, the urban and rural poor childrentend to get neglected. Though clear information could not be collected on some of these aspects, this studyof the Assam Budget 2004-05 to 2007-08 shows that children do not get their due share of the State’sresources. This study, the first of its kind in Assam, is a contribution to awareness building on issuesconcerning the future of Assam. It is an appeal to the State Government to take a new look at theseallocations and at the implementation of the schemes meant for children.
North Eastern Social Research Centre110 Kharghuli Road (1st floor)
Guwahati 781004Assam, India
Tel. +91-361-2602819Fax: +91-361-2732629 (Attn NESRC)
Email: [email protected]
PriceINR 25.00
USD 3Euro 2
North Eastern Social Research Centre (NESRC) started on 1st March 2000 is a centreof research, documentation and networking in Northeast India. Its mandate is tocombine serious intellectual pursuits with involvement with civil society groups activeamong the marginalized in the region. NESRC has a library and a documentationcentre for the use of students, scholars and social activists. It has done research ongender issues, tribal issues and livelihood issues in the region with special importancegiven to development-induced displacement in the Northeast 1947-2000. It wouldlike to support movements that work with the groups to which it accords priority.