Embed Size (px)
Citation preview
Traffic Simulation and Visualization
By
Shankar Ramasamy, P.E.
Research Associate
Department of Civil, Environmental and
Construction Engineering
Traffic Simulation
Definition: Simulation is the art/science of reproducing the behavior of a system without actually operating that system. One manipulates a model of the system to gain insight into its operating characteristics.
-Deterministic or Stochastic
-Computational and Simulation tool
-Microscopic, Mesoscopic and Macroscopic
Uses of Simulation Models
-Evaluation of alternate treatments
The engineer can control the experimental
environment and the range of conditions to be explored.
-Testing new designs
Quantify traffic performance responding to different
geometric designs.
-As an element of design process
Model can be used for evaluation; the detailed
statistics provided can form the basis for identifying design flaws and limitations.
Uses of Simulation Models
- Embed in other tools
Can be integrated within software tools designed to perform other functions.
- Training personnel
Real-time laboratory to train operators.
- Safety analysis
Recreate accident scenarios.
- Emission analysis
When should we use?
- Mathematical treatment of a problem is infeasible or inadequate
- Mathematical formulation represents the dynamic traffic/control environment
- Need to view vehicle animation to see how the system behaves
- Congested conditions persists over a significant time
Limitations of Simulation Modeling
- Time consuming
- Requires considerable input data
- Requires verification, calibration and validation
- Modeler has to fully understand the system
- Most models ignore cyclists or pedestrians
Applications
Traffic Operations
Signals
Transit Operations
Light Rail
Pedestrians and Cyclists
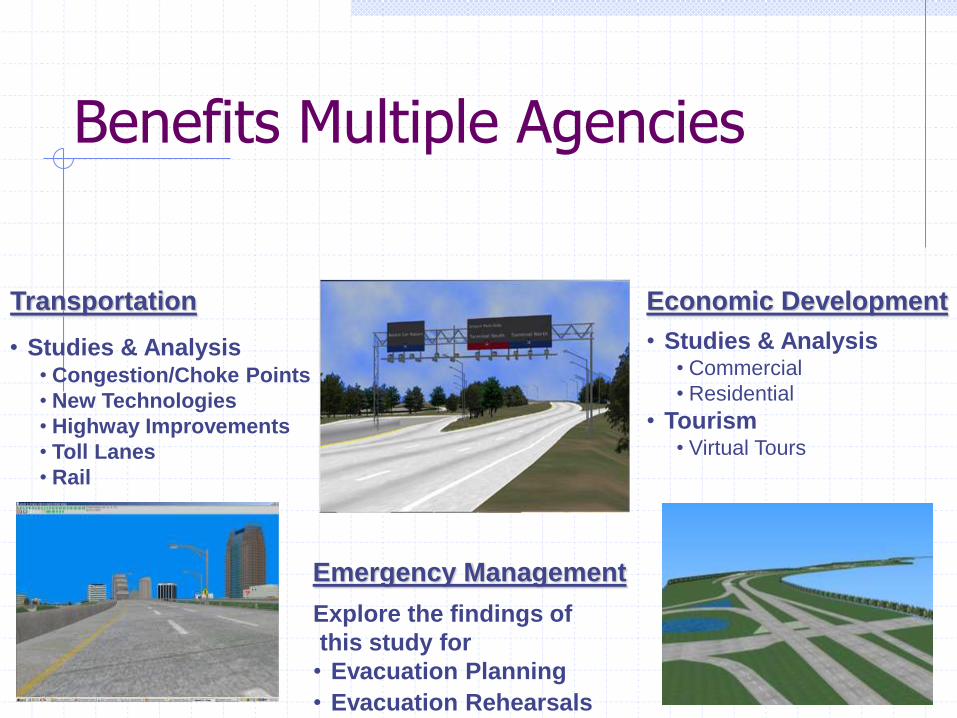
Benefits Multiple Agencies
Transportation
• Studies & Analysis • Congestion/Choke Points
• New Technologies
• Highway Improvements
• Toll Lanes
• Rail
Emergency Management
Explore the findings of
this study for
• Evacuation Planning
• Evacuation Rehearsals
Economic Development
• Studies & Analysis • Commercial
• Residential
• Tourism • Virtual Tours
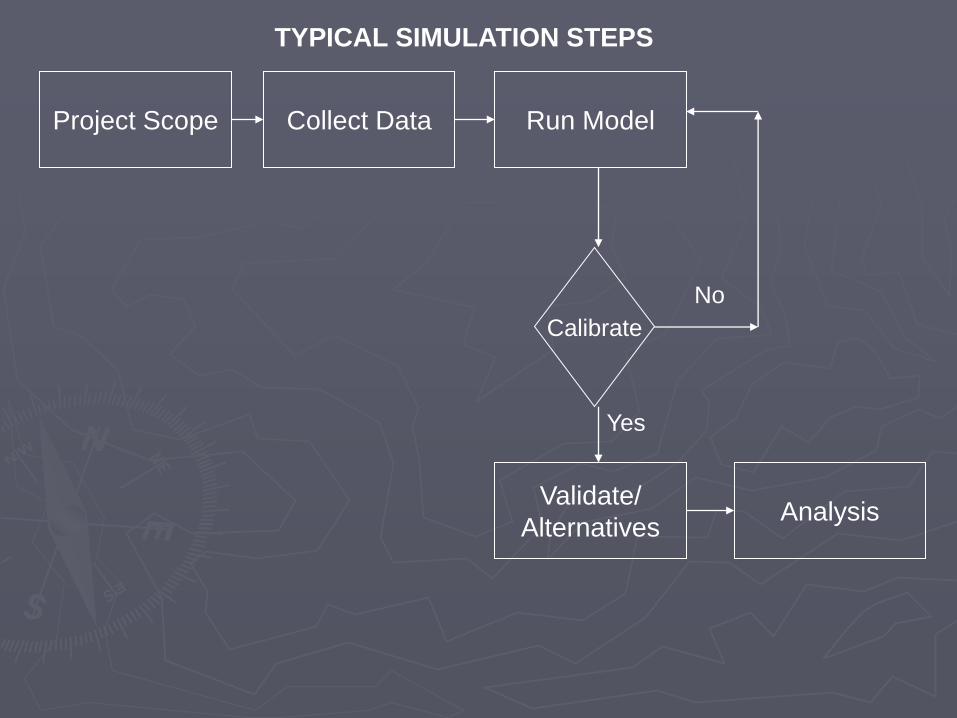
Project Scope Collect Data Run Model
Calibrate
Validate/
Alternatives Analysis
No
Yes
TYPICAL SIMULATION STEPS
Popular Traffic Simulation Models
CORSIM
PARAMICS
VISSIM
AIMSUN
WATSIM
DYNASMART
Coded as background on:
GIS file
Google Earth
AutoCAD files
Microstation files
BMP or JPEG files
Network Coding
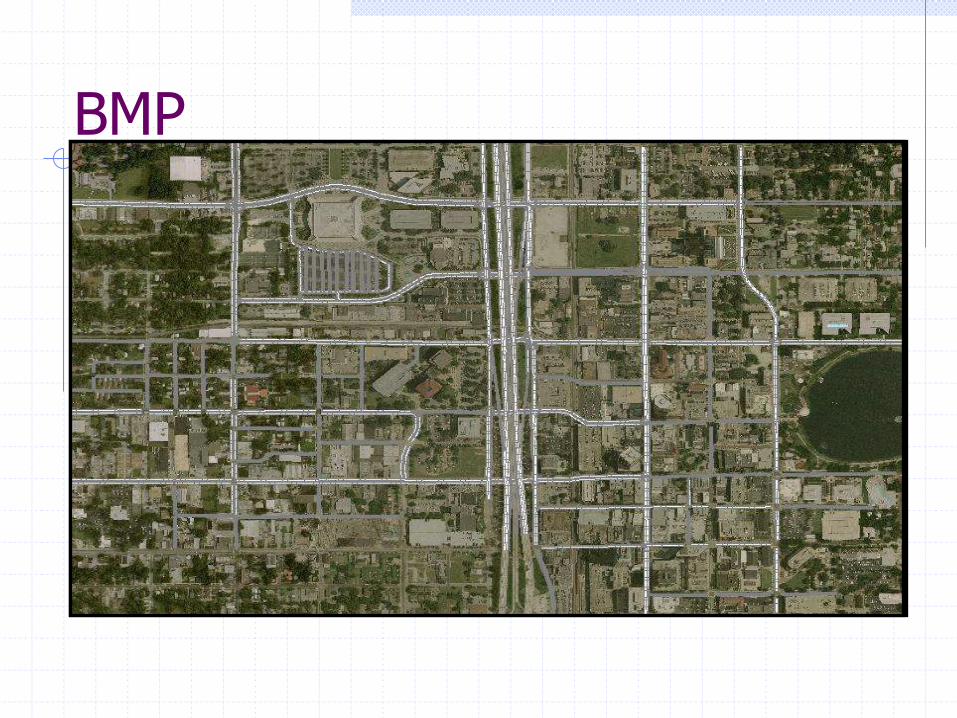
BMP
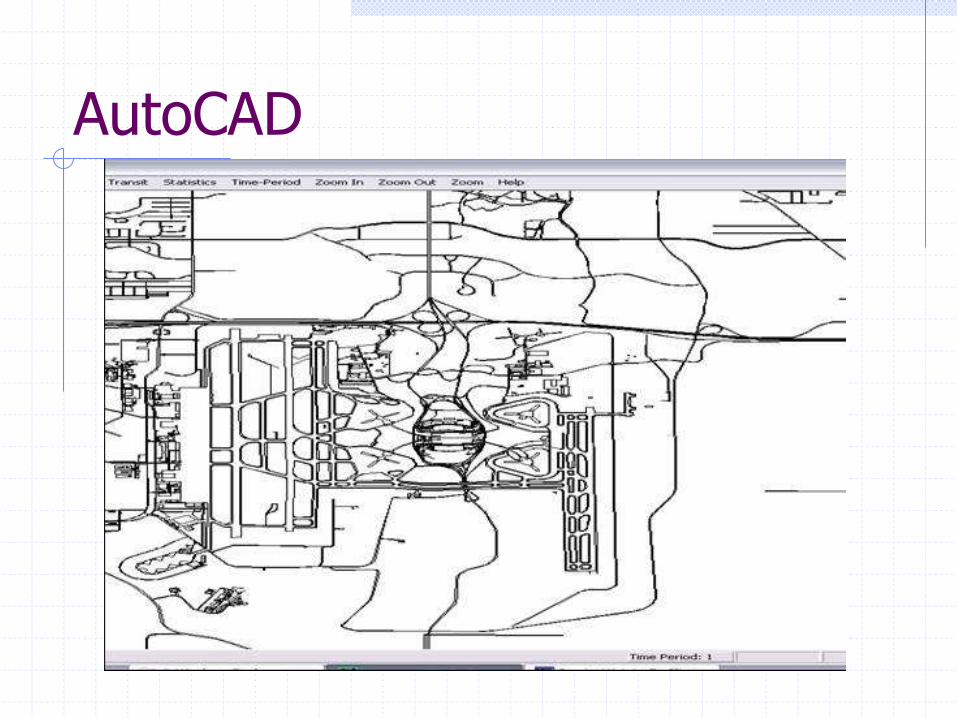
AutoCAD
Data Needed and Sources Traffic counts
Signal timings
Truck data
Road Geometrics
Pedestrian data
Transit data
Florida DOT
City of Orlando transportation department
Counties
Metroplan
Field data collection
To accurately replicate actual traffic flow and conditions
Check input and coding accuracy
Compare field counts to simulated counts
Model Calibration
Parameters changed:
Capacity
Speed
Signal timings
Turn percentage
Lane change
Driver behavior
Validated using different set of data
Travel time
Queue length
Speed
Volumes
Other parameters
Model Validation
Delay
Travel time
Queue length
Clearance time
LOS
Measures of Effectiveness
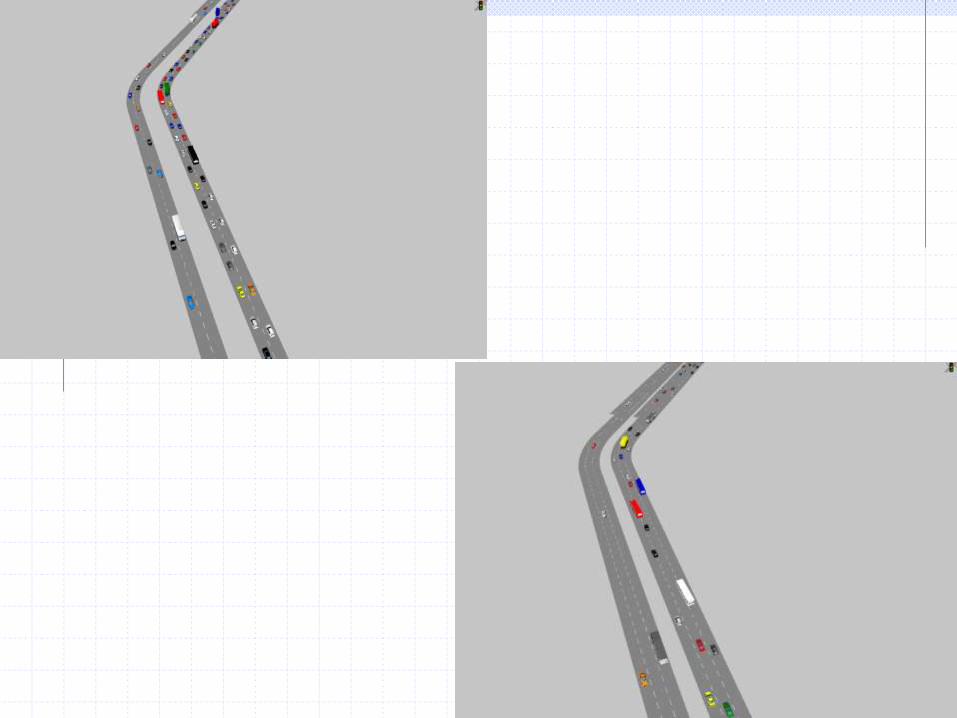
Demo
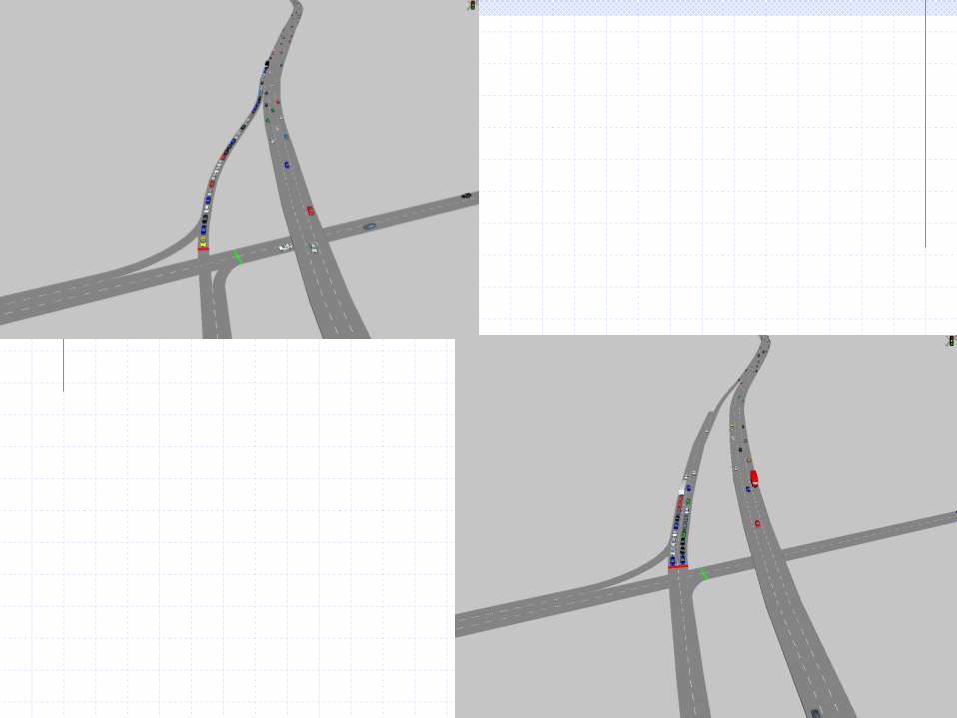
Demo
I4 Corridor 3D Visualization and Simulation
Central Florida Commuter Rail 3D Visualization and Simulation
LYNX Evacuation
Airport Emergency Planning
Orlando Downtown Analysis
Port of Jacksonville
Related Research Projects
Dynamic Workzone Analysis
Toll Plaza Simulation (SHAKER)
Red Light Running Study
Emergency Evacuation Analysis
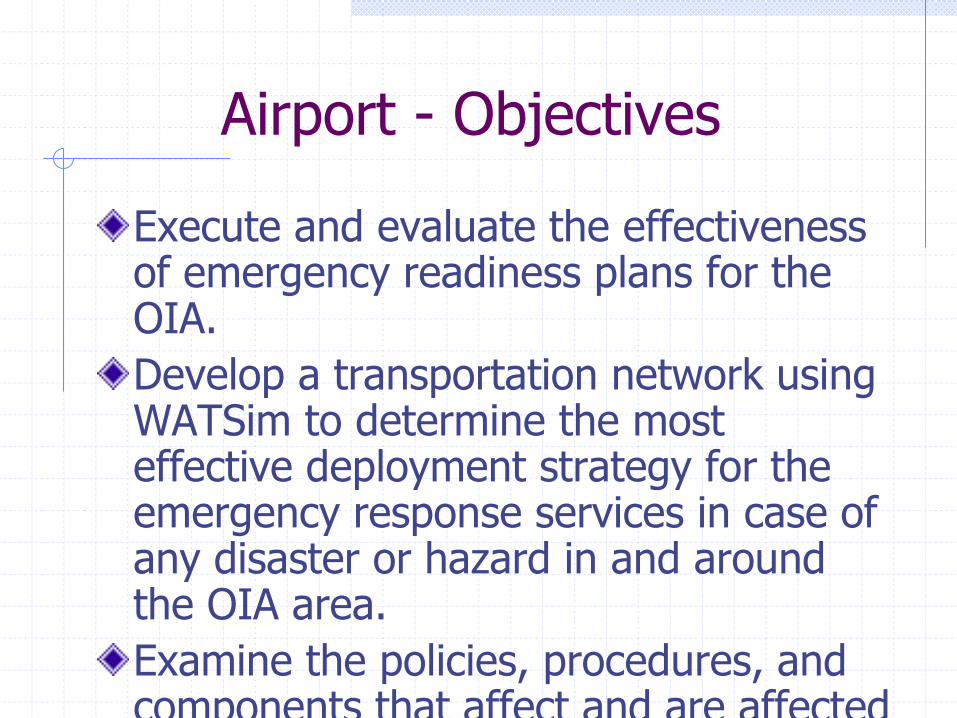
Airport - Objectives
Execute and evaluate the effectiveness of emergency readiness plans for the OIA.
Develop a transportation network using WATSim to determine the most effective deployment strategy for the emergency response services in case of any disaster or hazard in and around the OIA area.
Examine the policies, procedures, and components that affect and are affected by emergency preparedness events.
198.9 210166.92231.09
619.38
0
100
200
300
400
500
600
700
Base Incident without
diversion
Incident with
diversion
Security Check 90% increase in
demand
Event
De
lay
(s
ec
/ve
h)
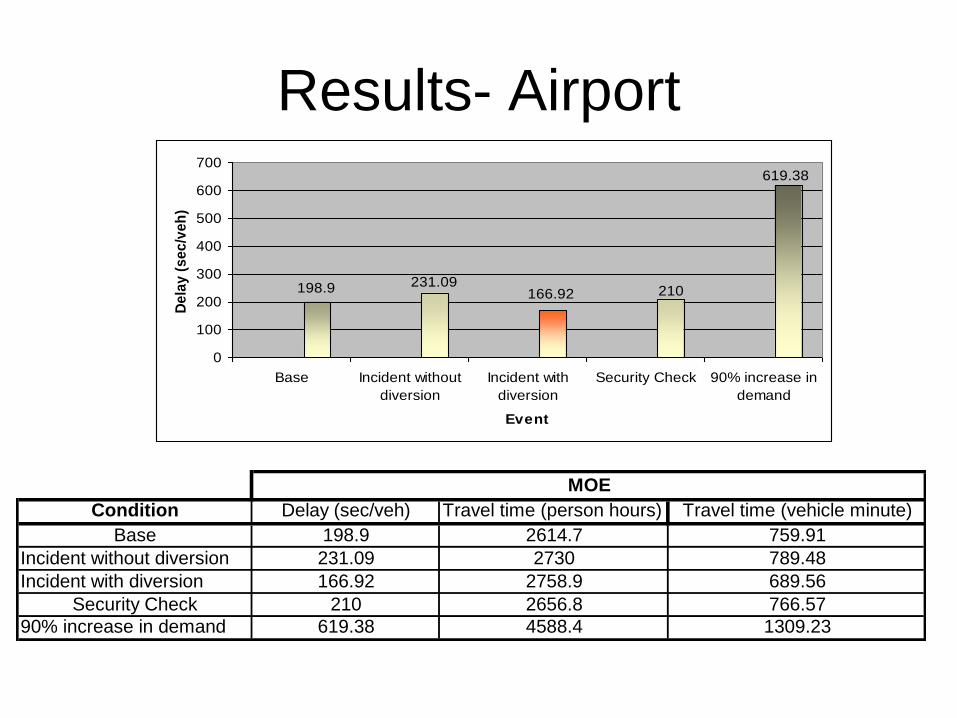
Results- Airport
Delay (sec/veh) Travel time (person hours)
198.9 2614.7
Incident without diversion 231.09 2730
Incident with diversion 166.92 2758.9
210 2656.8
90% increase in demand 619.38 4588.4 1309.23
Base
Security Check
Travel time (vehicle minute)
759.91
789.48
689.56
766.57
Condition
MOE
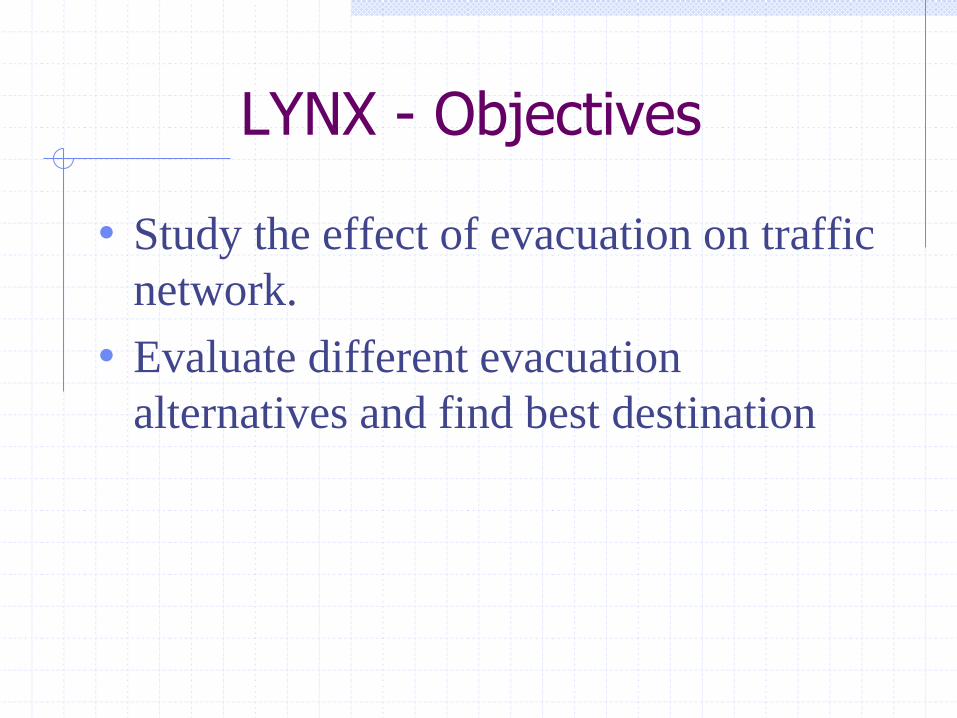
LYNX - Objectives
• Study the effect of evacuation on traffic
network.
• Evaluate different evacuation
alternatives and find best destination
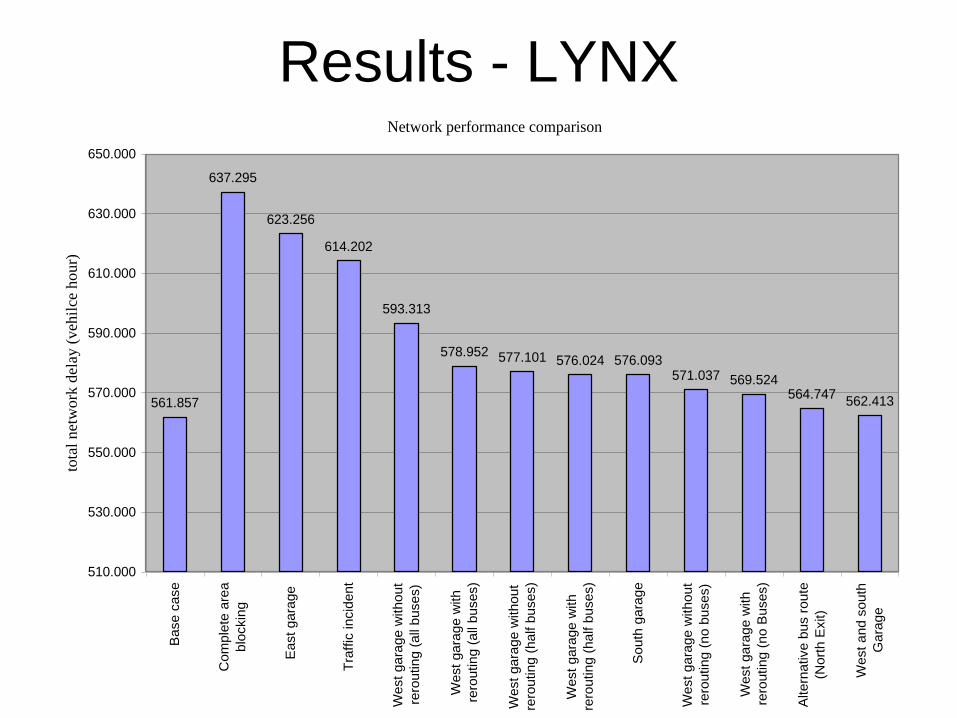
Results - LYNX Network performance comparison
561.857
637.295
623.256
614.202
593.313
578.952 577.101 576.024 576.093571.037 569.524
564.747562.413
510.000
530.000
550.000
570.000
590.000
610.000
630.000
650.000
Base c
ase
Com
ple
te a
rea
blo
ckin
g
East
gara
ge
Tra
ffic
in
cid
ent
West
gara
ge w
ithout
rero
utin
g (
all
buses)
West
gara
ge w
ith
rero
utin
g (
all
buses)
West
gara
ge w
ithout
rero
utin
g (
half b
uses)
West
gara
ge w
ith
rero
utin
g (
half b
uses)
South
gara
ge
West
gara
ge w
ithout
rero
utin
g (
no b
uses)
West
gara
ge w
ith
rero
utin
g (
no B
uses)
Altern
ative b
us r
oute
(Nort
h E
xit)
West
and s
outh
Gara
ge
tota
l n
etw
ork
del
ay (
veh
ilce
ho
ur)
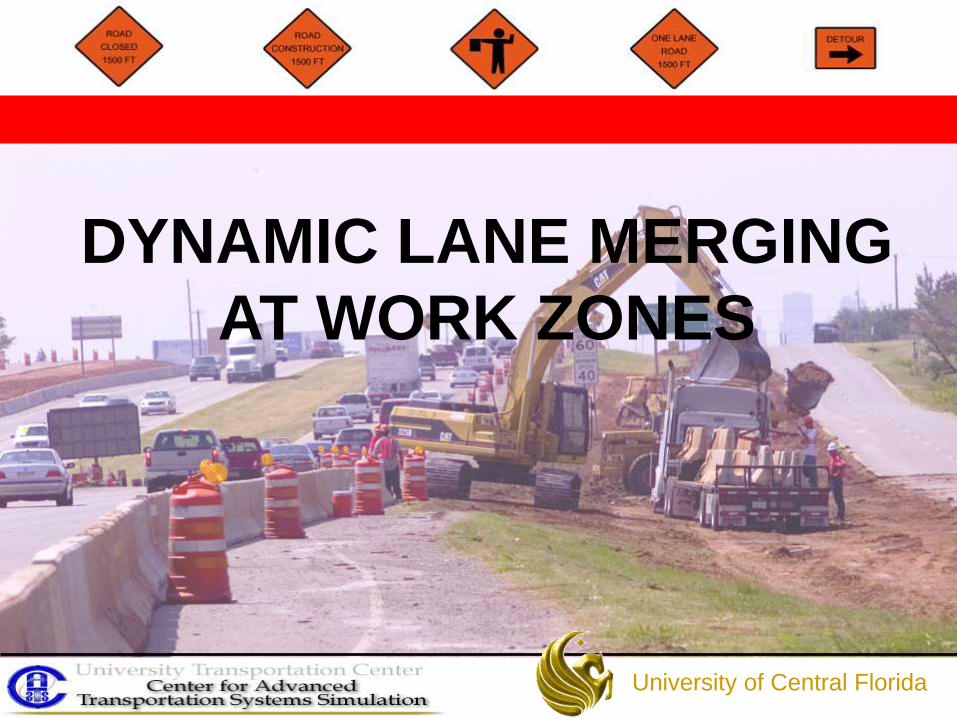
DYNAMIC LANE MERGING
AT WORK ZONES
University of Central Florida
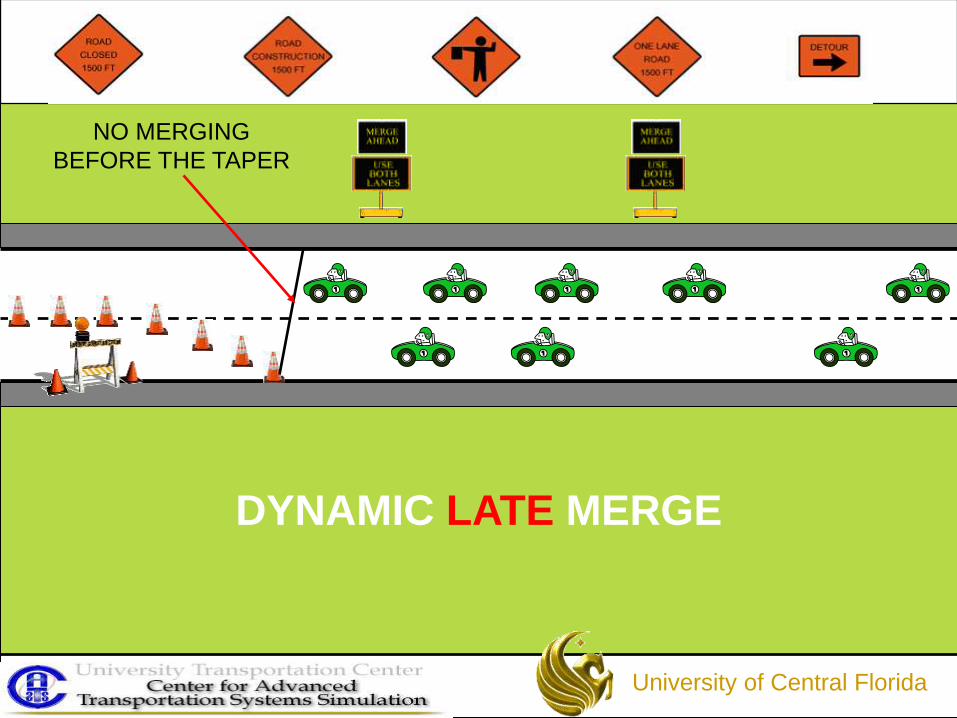
DYNAMIC LATE MERGE
NO MERGING
BEFORE THE TAPER
University of Central Florida
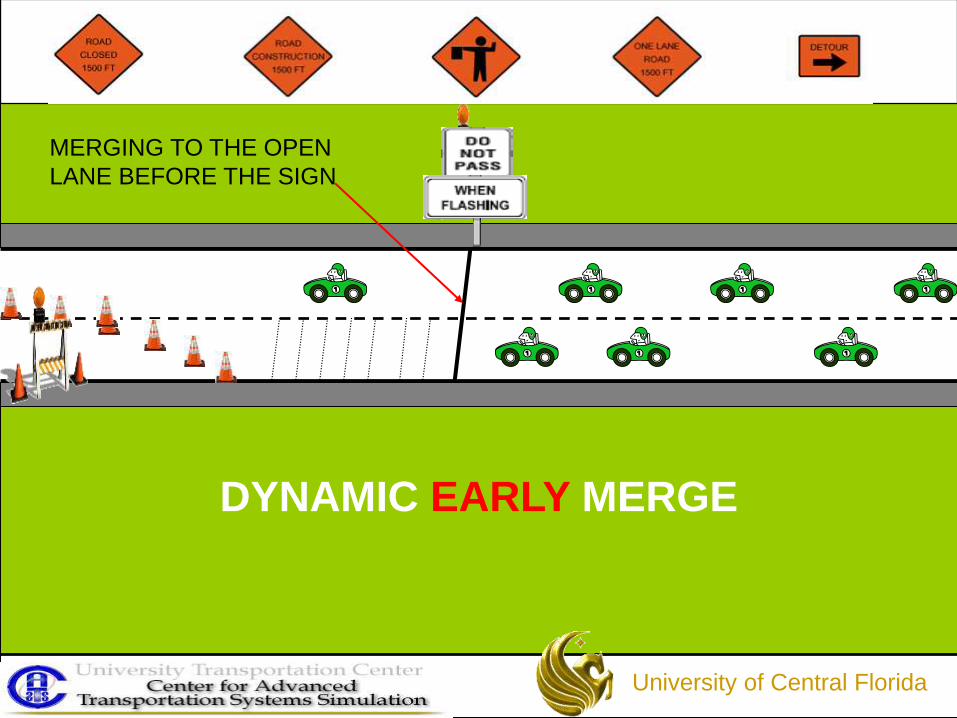
DYNAMIC EARLY MERGE
MERGING TO THE OPEN
LANE BEFORE THE SIGN
University of Central Florida
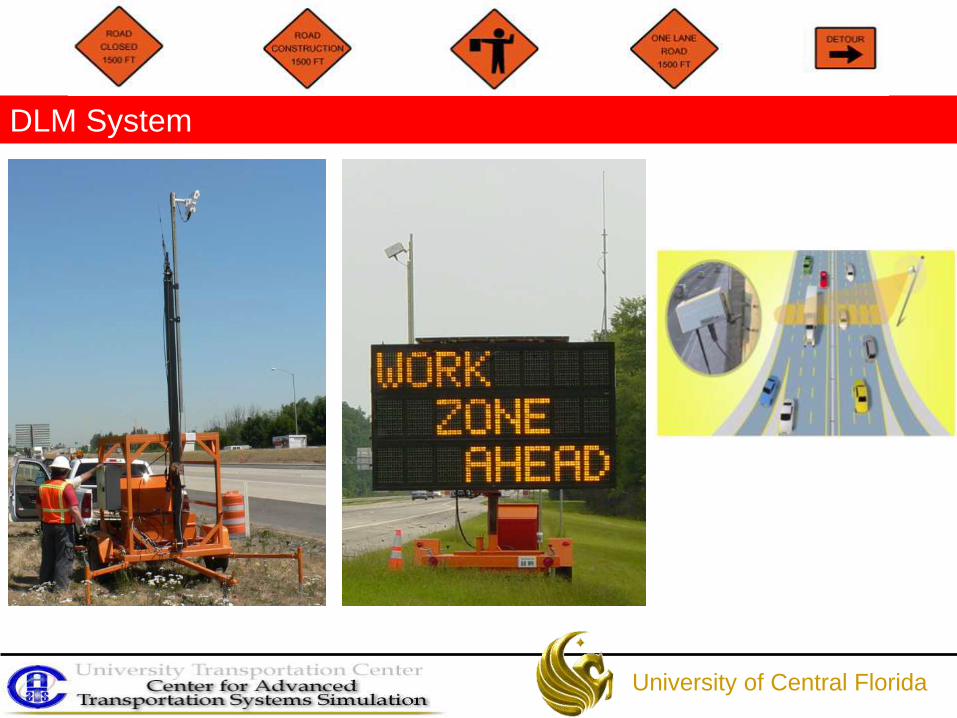
DLM System
University of Central Florida
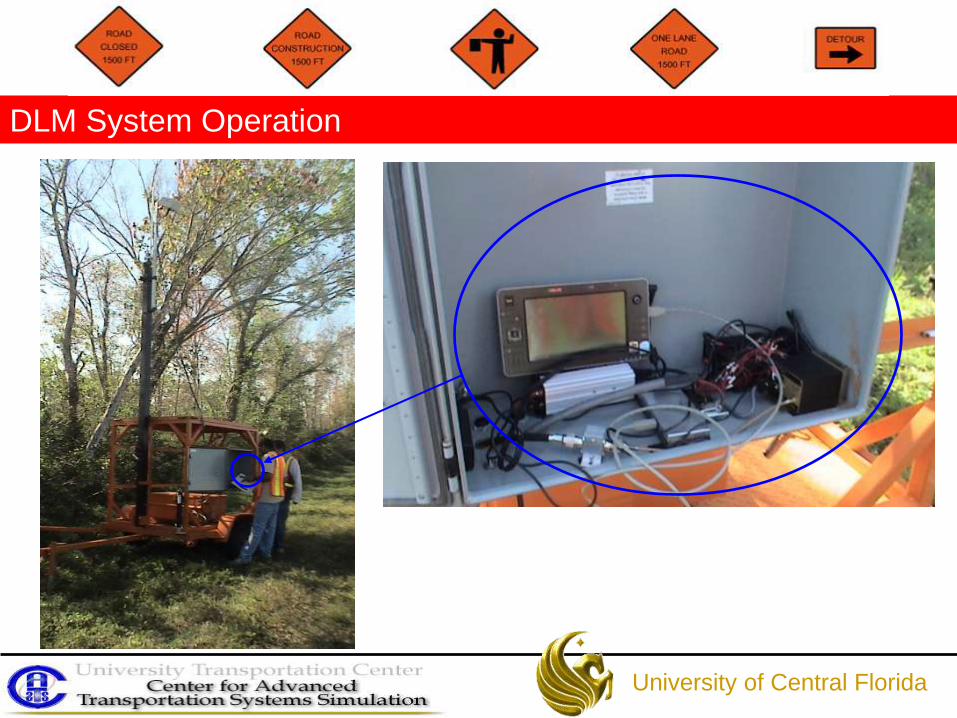
DLM System Operation
University of Central Florida
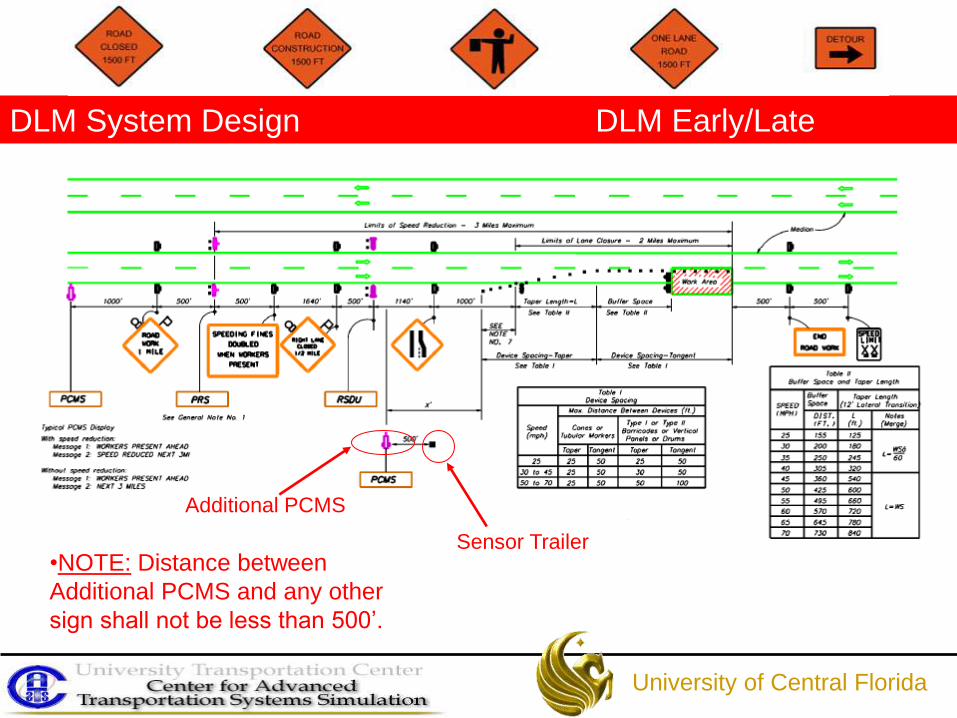
DLM System Design DLM Early/Late
University of Central Florida
•NOTE: Distance between
Additional PCMS and any other
sign shall not be less than 500’.
Additional PCMS
Sensor Trailer
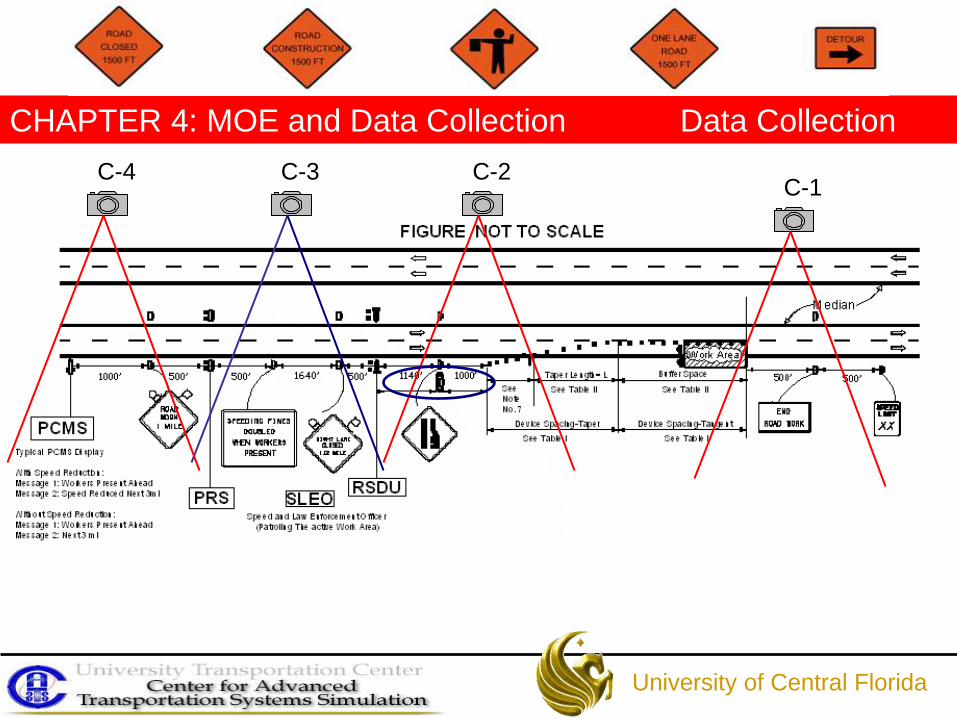
CHAPTER 4: MOE and Data Collection Data Collection
University of Central Florida
C-1 C-2 C-3 C-4
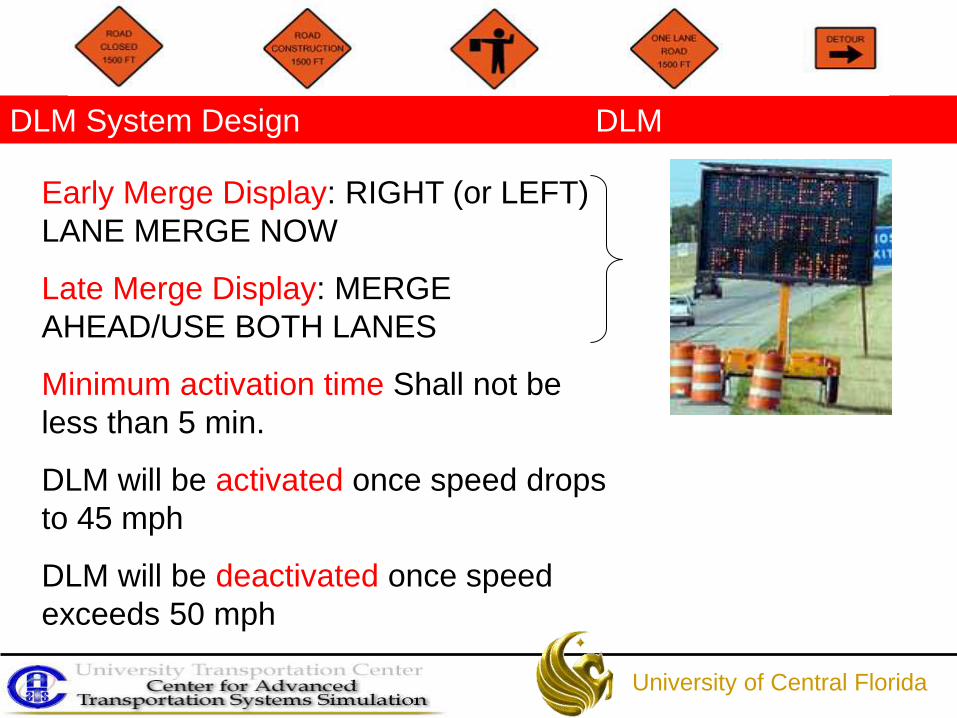
DLM System Design DLM
University of Central Florida
Early Merge Display: RIGHT (or LEFT)
LANE MERGE NOW
Late Merge Display: MERGE
AHEAD/USE BOTH LANES
Minimum activation time Shall not be
less than 5 min.
DLM will be activated once speed drops
to 45 mph
DLM will be deactivated once speed
exceeds 50 mph
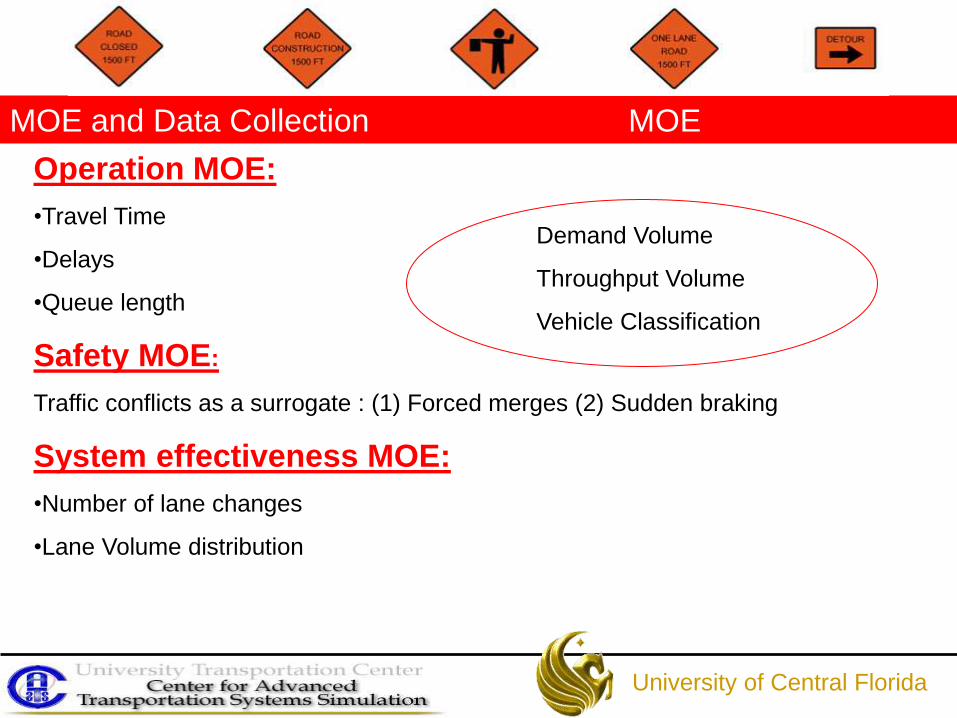
MOE and Data Collection MOE
University of Central Florida
Operation MOE:
•Travel Time
•Delays
•Queue length
Safety MOE:
Traffic conflicts as a surrogate : (1) Forced merges (2) Sudden braking
System effectiveness MOE:
•Number of lane changes
•Lane Volume distribution
Demand Volume
Throughput Volume
Vehicle Classification
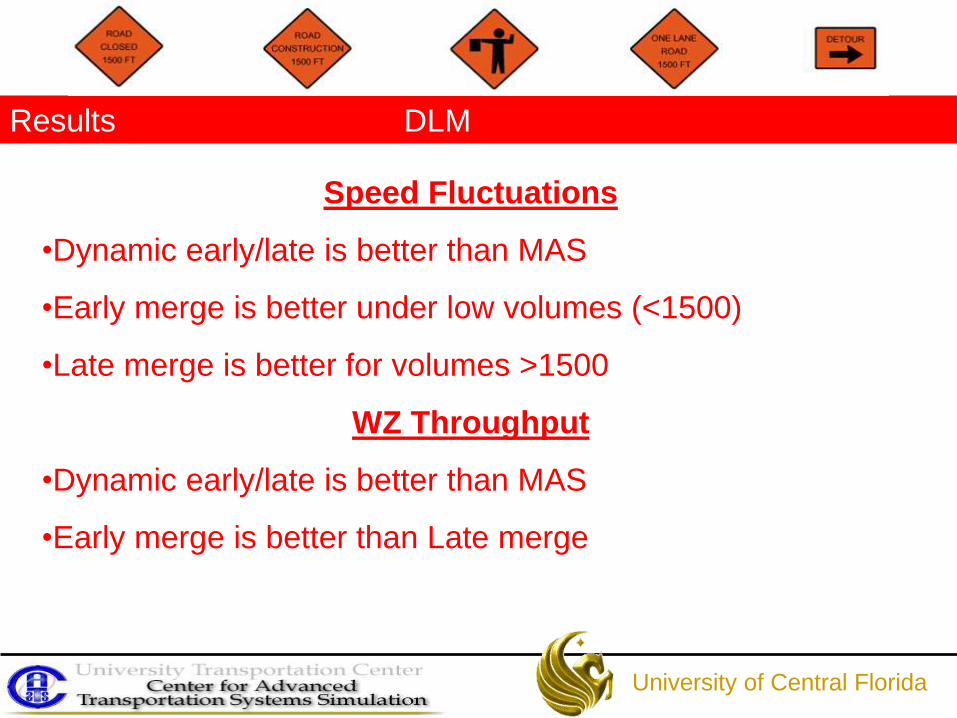
Results DLM
University of Central Florida
Speed Fluctuations
•Dynamic early/late is better than MAS
•Early merge is better under low volumes (<1500)
•Late merge is better for volumes >1500
WZ Throughput
•Dynamic early/late is better than MAS
•Early merge is better than Late merge
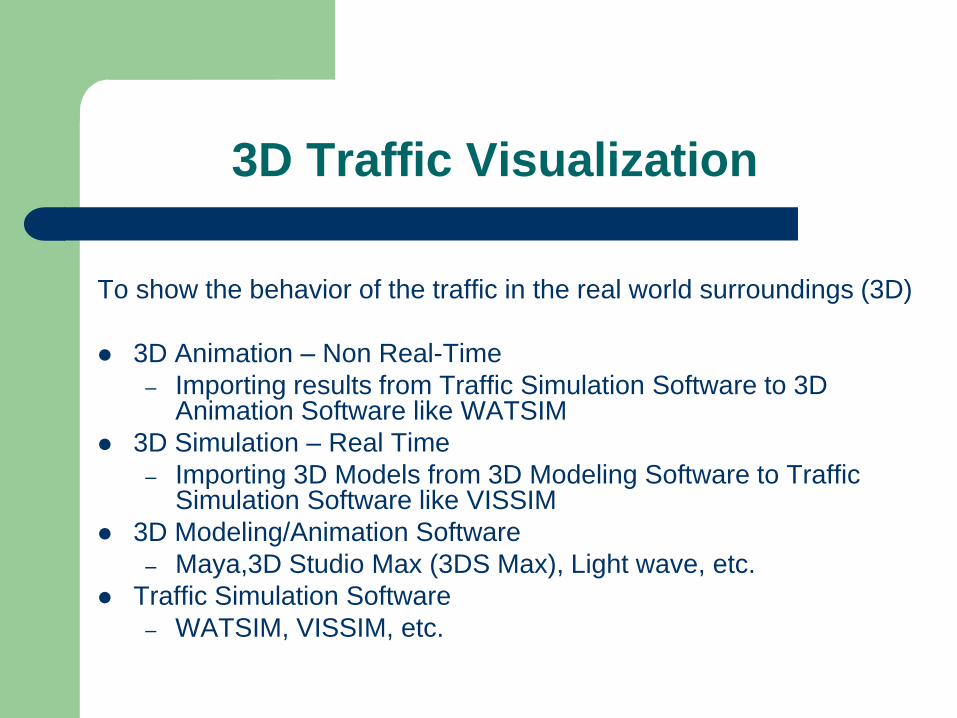
3D Traffic Visualization
To show the behavior of the traffic in the real world surroundings (3D)
3D Animation – Non Real-Time
– Importing results from Traffic Simulation Software to 3D Animation Software like WATSIM
3D Simulation – Real Time
– Importing 3D Models from 3D Modeling Software to Traffic Simulation Software like VISSIM
3D Modeling/Animation Software
– Maya,3D Studio Max (3DS Max), Light wave, etc.
Traffic Simulation Software
– WATSIM, VISSIM, etc.
3D MODELING
Model any 3D object – Grass, Trees, Buildings, Bus stops, Poles, Street
Lights
Build fresh from the scratch
Build on top of AutoCAD files
Build on top of pictures
Exports as .3ds file
COLORING and TEXTURING
Gives life to the models
High level texturing
– Gives the look of the real object
Ways of Texturing
– Giving colors to the objects
– Applying textures from a bitmap file
– Paste the textures in Photoshop file using Adobe Photoshop
based on co-ordinates
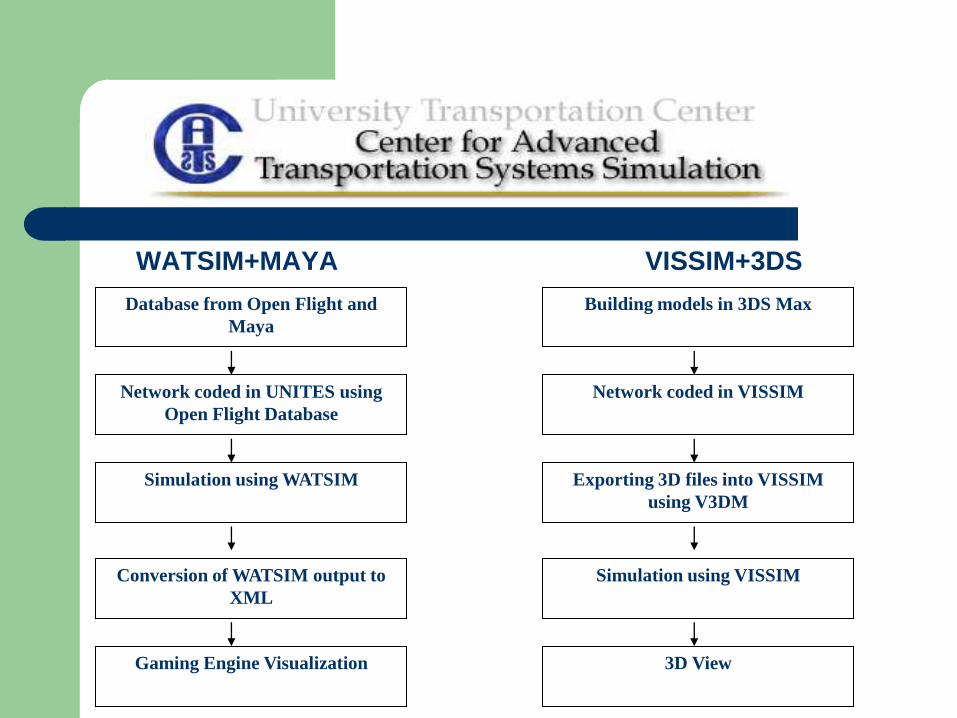
WATSIM+MAYA VISSIM+3DS
Database from Open Flight and
Maya
Network coded in UNITES using
Open Flight Database
Simulation using WATSIM
Gaming Engine Visualization
Conversion of WATSIM output to
XML
Building models in 3DS Max
Network coded in VISSIM
Exporting 3D files into VISSIM
using V3DM
Simulation using VISSIM
3D View
Procedure Commercial gaming technologies communicates
with the simulation software
Simulation feeds traffic flow into the gaming visualization system
Vehicular models populate the database and are controlled via parallel discrete event simulation engine
Visualization is developed from "as-built" CAD data and can realistically represent the “true” surroundings of the area being viewed
Benefits
simulation repeatability to be used for after-action
reviews, that can further determine causality of
impacts of transportation systems
Immerses users into the simulated environment to
provide real-time feedback and multi-view
perspective
Cost effective solution to support “what if” analysis
and research for a variety of traffic conditions
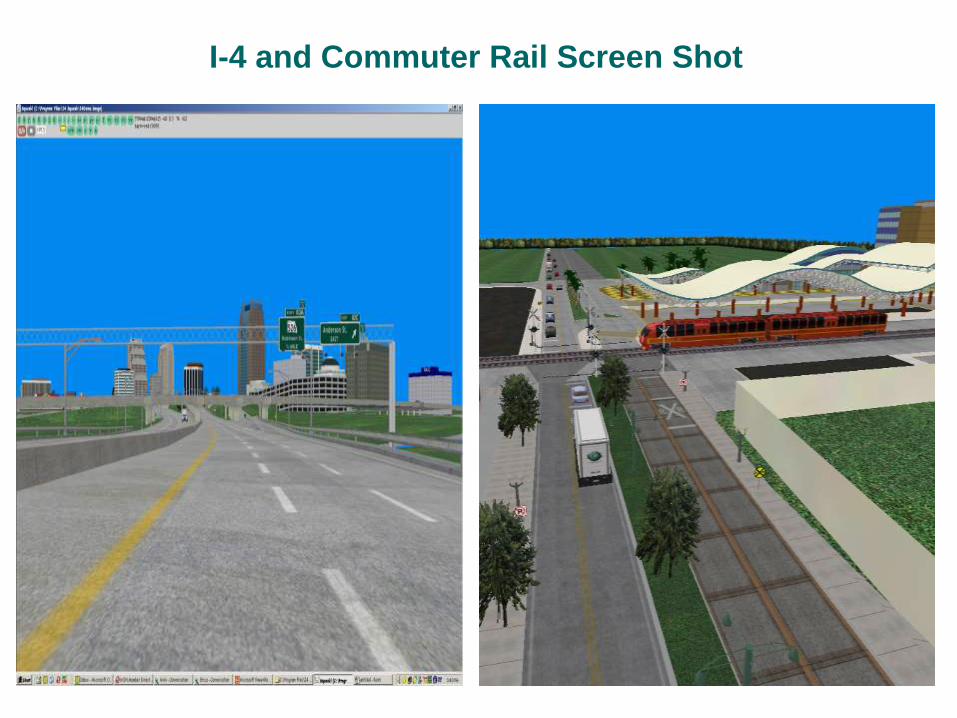
I-4 and Commuter Rail Screen Shot
3D DEMO


![[Ramasamy Natarajan] Computer-Aided Power System a(BookFi.org)](https://img.pdfslide.us/doc/110x75/577cb5f91a28aba7118d3df2/ramasamy-natarajan-computer-aided-power-system-abookfiorg.jpg)