Embed Size (px)
Citation preview

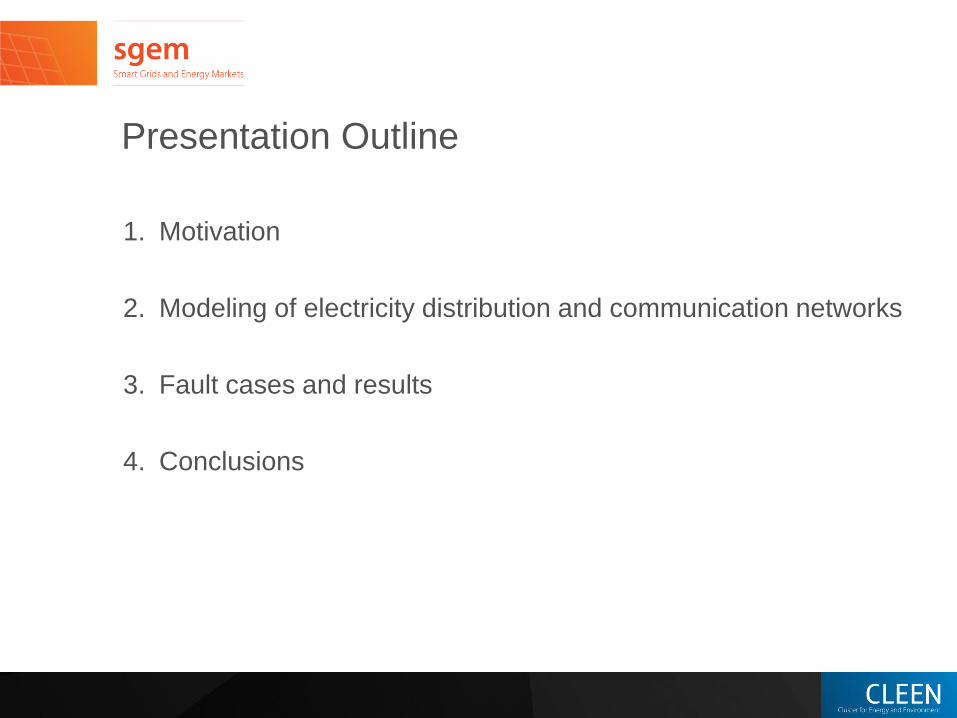
Presentation Outline
1. Motivation
2. Modeling of electricity distribution and communication networks
3. Fault cases and results
4. Conclusions
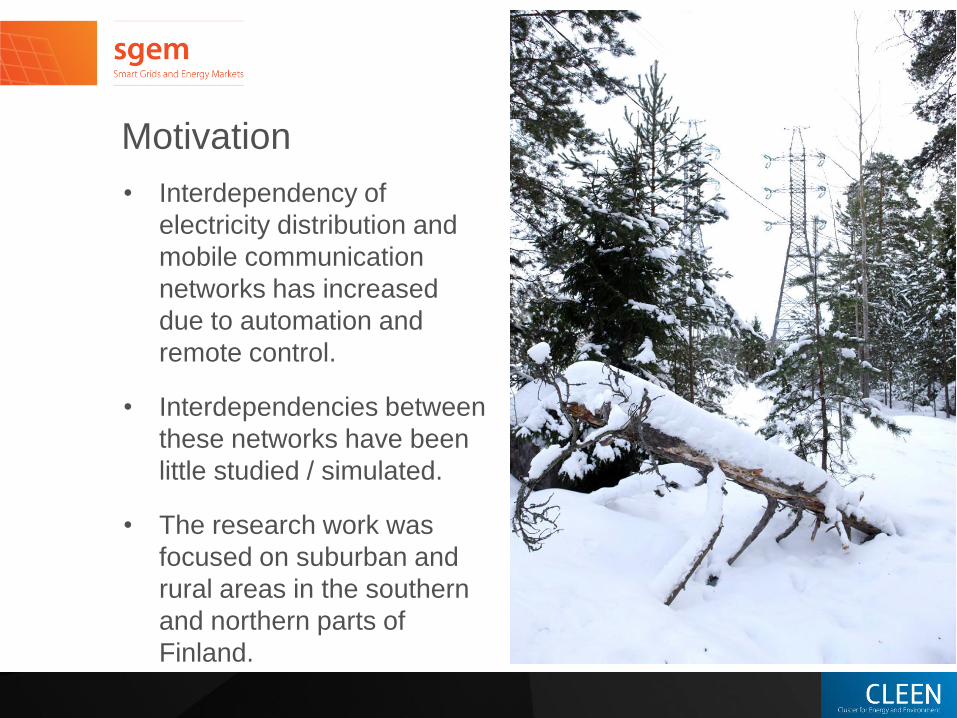
Motivation
• Interdependency of
electricity distribution and
mobile communication
networks has increased
due to automation and
remote control.
• Interdependencies between
these networks have been
little studied / simulated.
• The research work was
focused on suburban and
rural areas in the southern
and northern parts of
Finland.
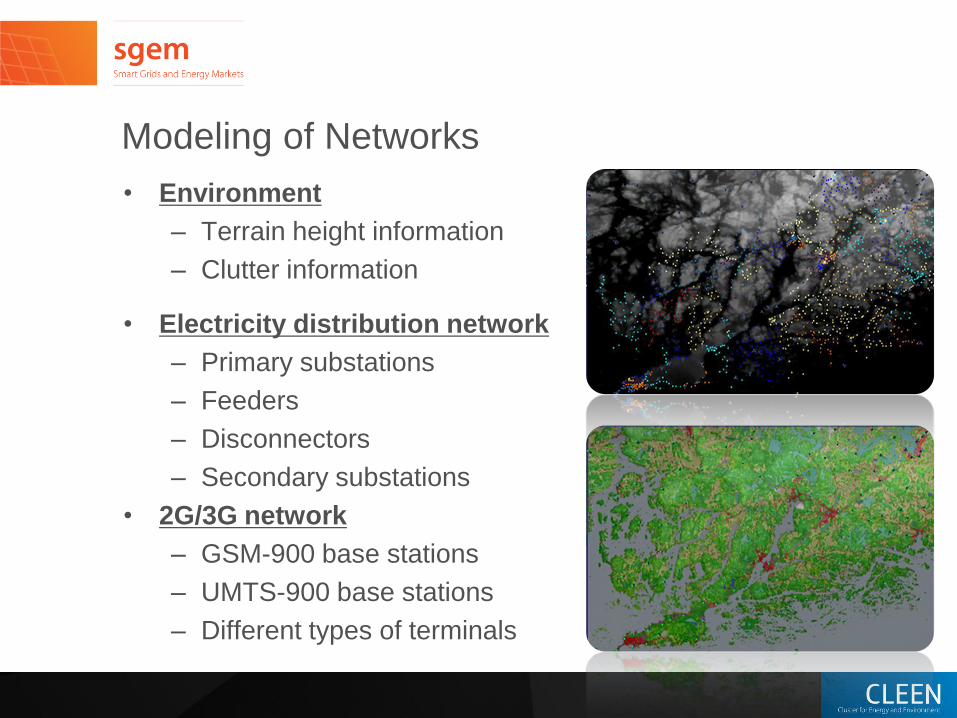
Modeling of Networks
• Environment
– Terrain height information
– Clutter information
• Electricity distribution network
– Primary substations
– Feeders
– Disconnectors
– Secondary substations
• 2G/3G network
– GSM-900 base stations
– UMTS-900 base stations
– Different types of terminals
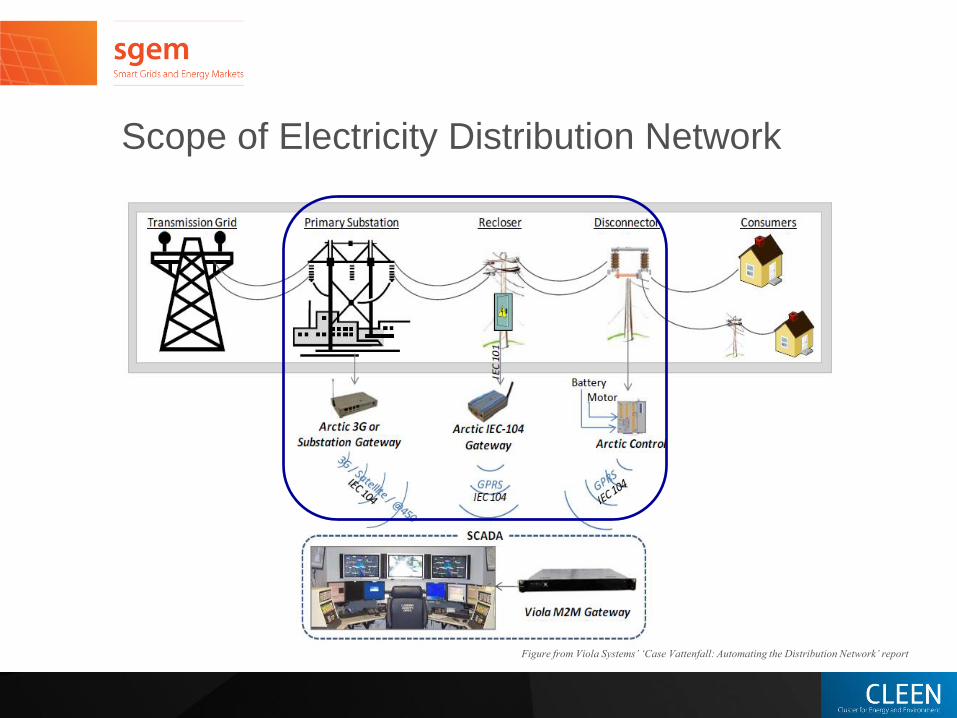
Scope of Electricity Distribution Network
Figure from Viola Systems’ ‘Case Vattenfall: Automating the Distribution Network’ report
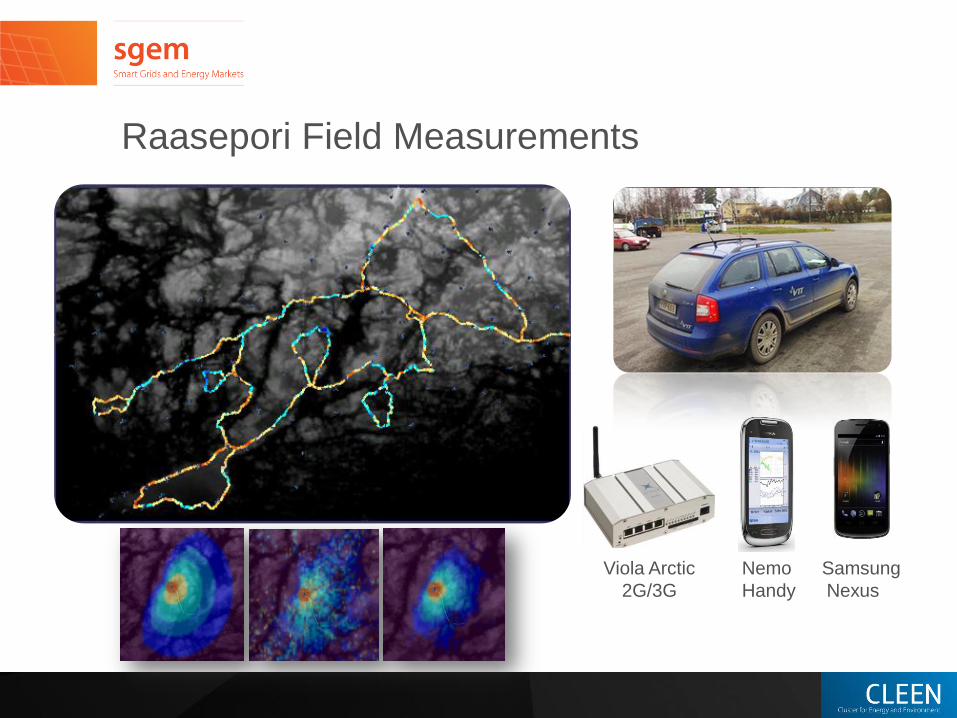
Raasepori Field Measurements
Nemo
Handy
Viola Arctic
2G/3G
Samsung
Nexus
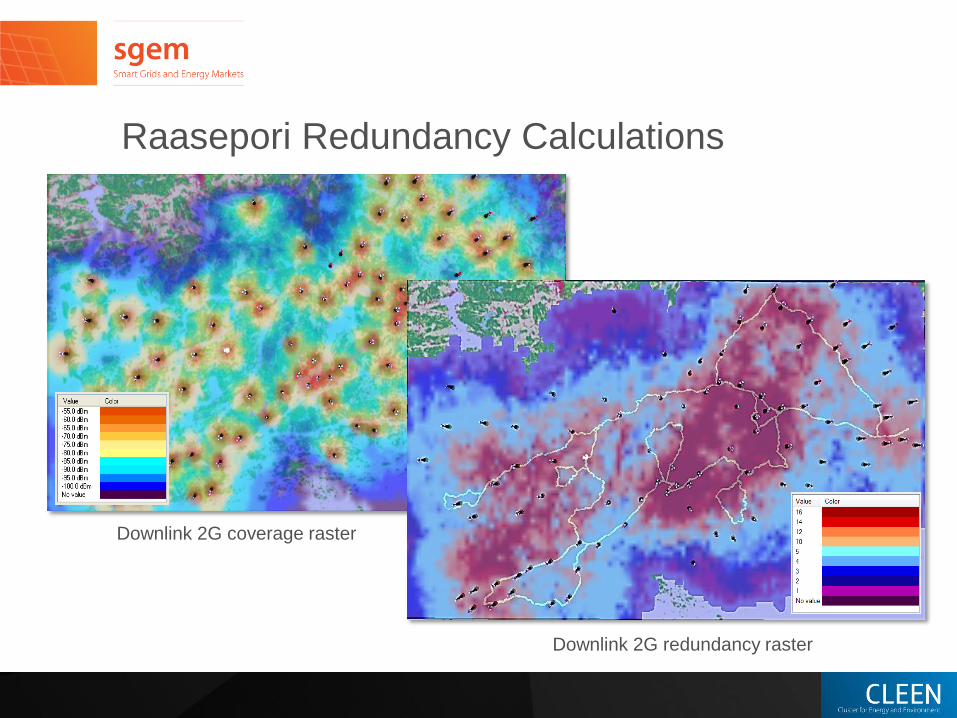
Raasepori Redundancy Calculations
Downlink 2G coverage raster
Downlink 2G redundancy raster
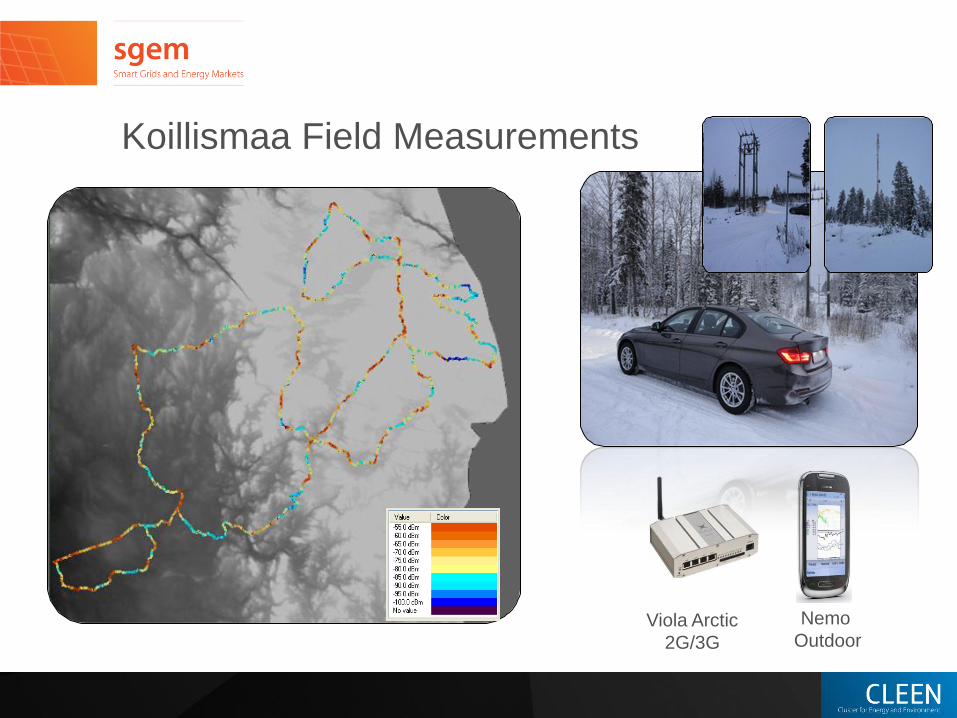
Koillismaa Field Measurements
Nemo
Outdoor Viola Arctic
2G/3G
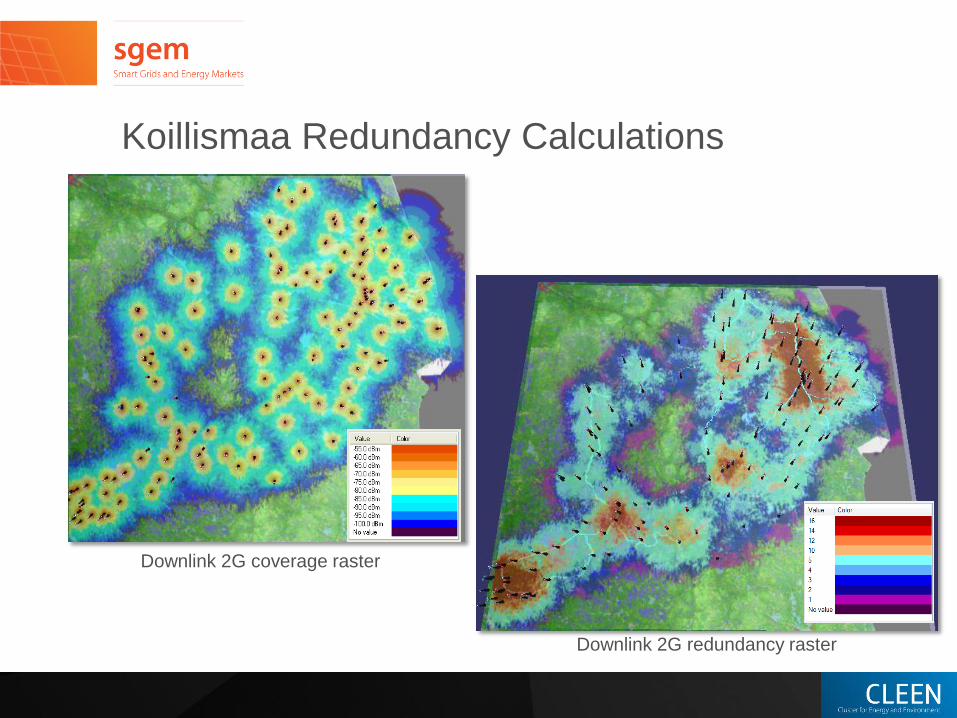
Koillismaa Redundancy Calculations
Downlink 2G coverage raster
Downlink 2G redundancy raster
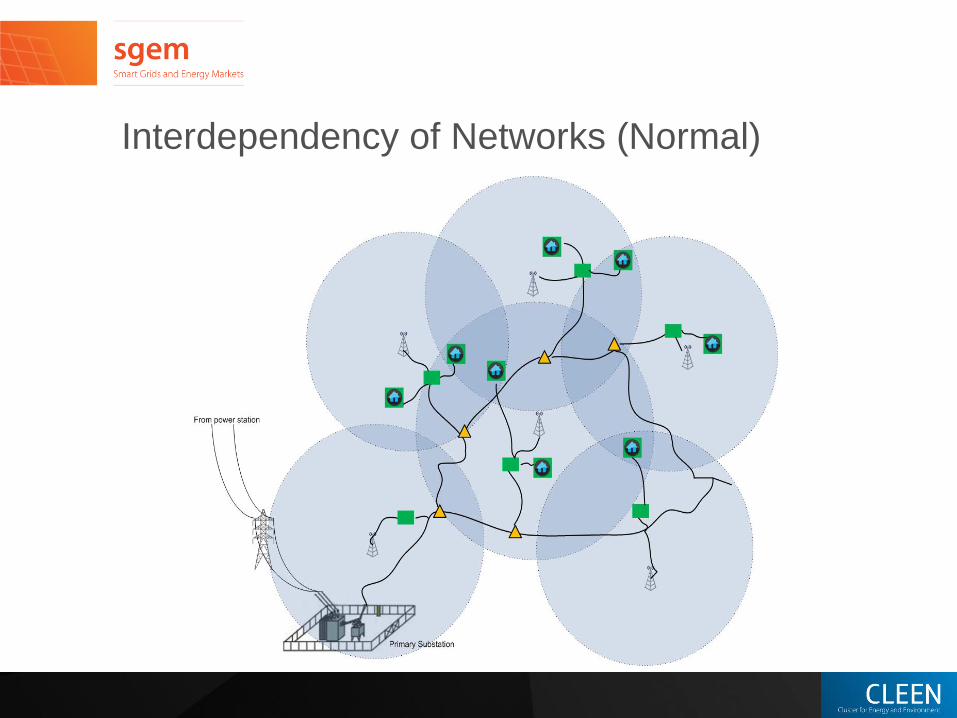
Interdependency of Networks (Normal)
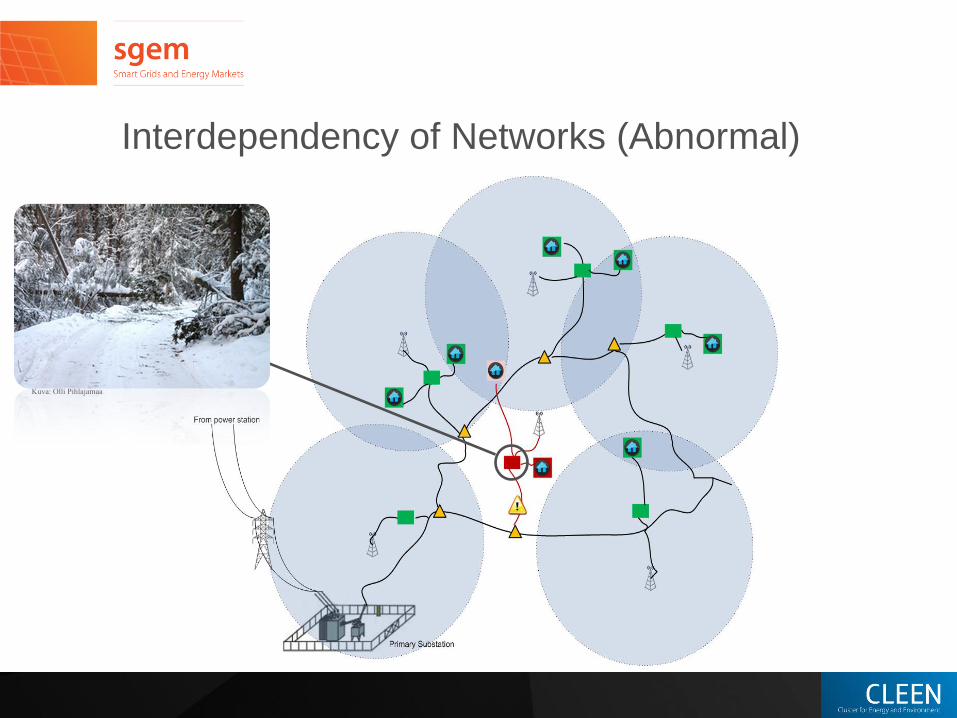
Interdependency of Networks (Abnormal)
Kuva: Olli Pihlajamaa
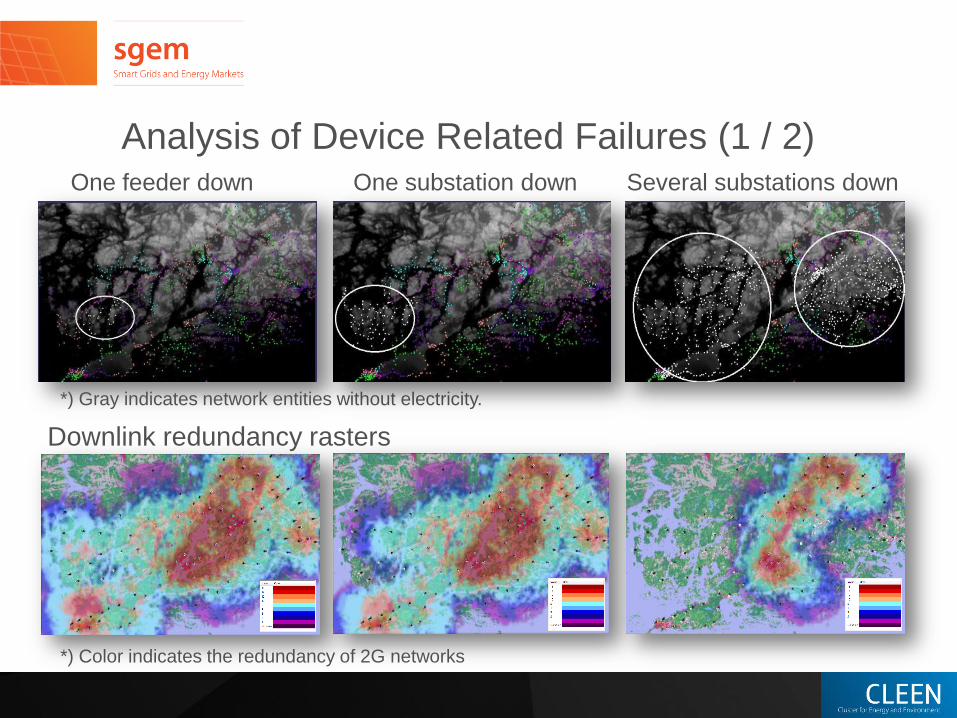
Analysis of Device Related Failures (1 / 2) One feeder down
*) Gray indicates network entities without electricity.
Downlink redundancy rasters
One substation down Several substations down
*) Color indicates the redundancy of 2G networks
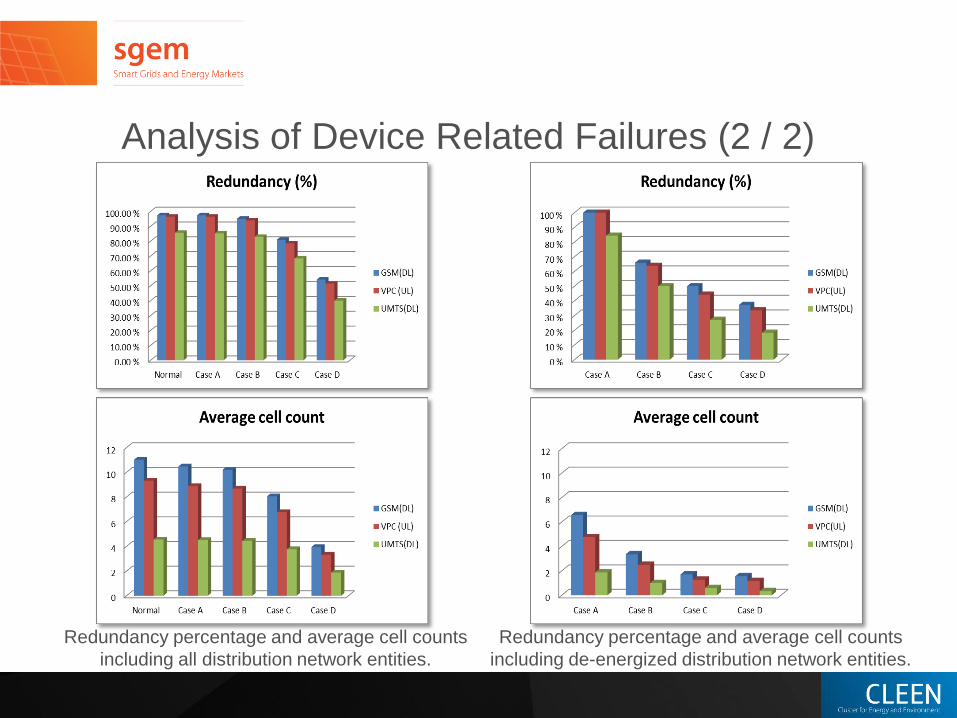
Analysis of Device Related Failures (2 / 2)
Redundancy percentage and average cell counts
including all distribution network entities.
Redundancy percentage and average cell counts
including de-energized distribution network entities.
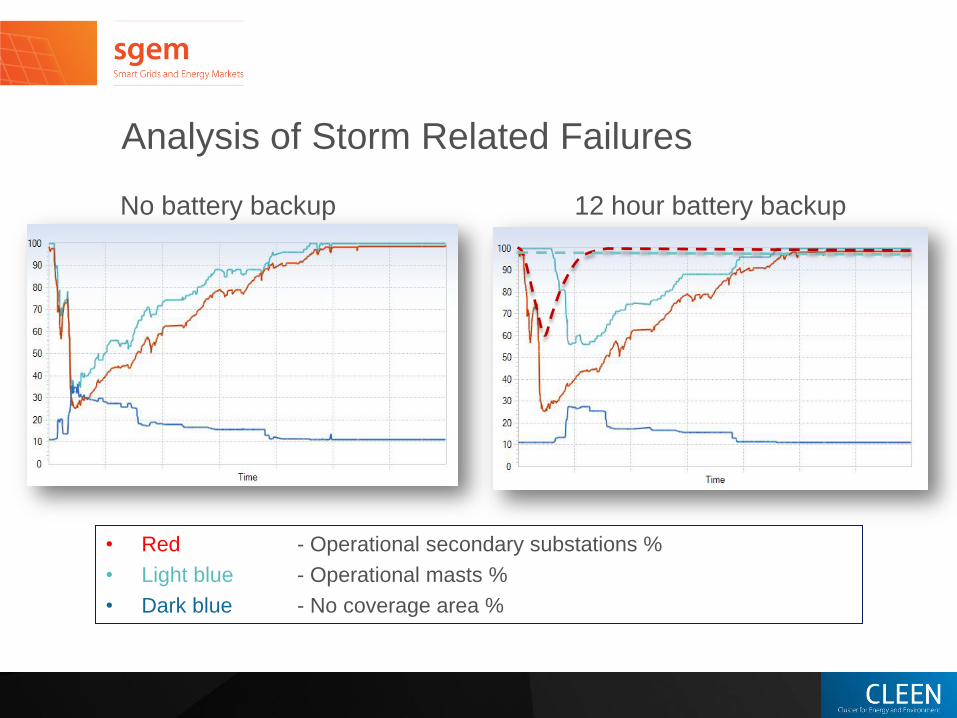
Analysis of Storm Related Failures
No battery backup 12 hour battery backup
• Red - Operational secondary substations %
• Light blue - Operational masts %
• Dark blue - No coverage area %
Conclusions
• The simulation tool enables analysis of interdependencies between electricity distribution and mobile communication networks
– Detailed information from both networks are needed
– Field measurements for fine-tuning and validation
• 2G and 3G networks have good redundancy and can tolerate small and medium size faults in suburban and rural areas
– Large-scale faults cause coverage gaps especially near the coast
• Results indicated that there are no significant differences between networks in the Southern and Northern parts of Finland
– Both networks are dense in residential areas and along main roads
• Fault reports from storms were found very essential for failure and recovery analysis of both networks
– Detection of critical network entities
– Comparison of pre-emptive techniques