Embed Size (px)
Citation preview

Report
2016 Technology Demonstration Workshop (TDW) on Gamma Imaging-External
Version Date: 2017-03-02
Version No.: 1
Department of Safeguards Page: 1 of 123
Report
2016 Technology Demonstration Workshop (TDW) on Gamma
Imaging-External
Summary: This document is an edited version of the restricted technical report SG-
EX-14311 Technology Demonstration Workshop on Gamma-Ray
Imaging prepared by the Joint Research Centre, the European
Commission's in-house science service. The scientific output expressed
does not imply a policy position of the European Commission. This
document summarizes the results from the IAEA’s Technology
Demonstration Workshop (TDW) on gamma imaging held at the IAEA
19-23 October 2015. This technical report was originally prepared by
Mr. A. Rozite.

Report
2016 Technology Demonstration Workshop (TDW) on Gamma Imaging-External
Version Date: 2017-03-02
Version No.: 1
Department of Safeguards Page: 2 of 123
Figure 1 - Gamma Imaging systems being tested

Report
2016 Technology Demonstration Workshop (TDW) on Gamma Imaging-External
Version Date: 2017-03-02
Version No.: 1
Department of Safeguards Page: 3 of 123

Report
2016 Technology Demonstration Workshop (TDW) on Gamma Imaging-External
Version Date: 2017-03-02
Version No.: 1
Department of Safeguards Page: 4 of 123
Table of Contents
1 Purpose and Scope .......................................................................................................................... 5 2 Executive summary ......................................................................................................................... 5 3 Background ..................................................................................................................................... 7 4 Participating systems at the workshop .......................................................................................... 11
4.1 GeGI ...................................................................................................................................... 15 4.2 HEMI .................................................................................................................................... 18 4.3 HiSpect .................................................................................................................................. 19 4.4 iPIX ....................................................................................................................................... 20 4.5 N-Visage ............................................................................................................................... 21 4.6 ORNL HPGe Imager ............................................................................................................. 21 4.7 Polaris-H ............................................................................................................................... 24 4.8 RadSearch ............................................................................................................................. 26
5 Experiments .................................................................................................................................. 28 5.1 Experiment 1: Sensitivity ...................................................................................................... 30
5.1.1 Comparison of spectra and images measured ............................................................... 30 5.1.2 Summary of the results ................................................................................................. 37
5.2 Experiment 2: Overnight Localization .................................................................................. 40 5.2.1 Comparison of the results ............................................................................................. 41 5.2.2 Summary of results ....................................................................................................... 43
5.3 Experiment 3: Sensitivity to Nuclear Materials .................................................................... 44 5.3.1 Plutonium measurements .............................................................................................. 44 5.3.2 Uranium measurements ................................................................................................. 52 5.3.3 Simultaneous U and Pu measurements ......................................................................... 60
5.4 Experiment 4 and 5: Angular Resolution .............................................................................. 70 5.5 Experiment 6: Extended Source ............................................................................................ 83 5.6 Experiment 7a: False Alarm Rate ......................................................................................... 88 5.7 Experiment 7b: High Background ........................................................................................ 91 5.8 Experiment 8a: Angular Resolution for Extended Sources ................................................ 100
5.8.1 Experiment E8 – extended HEU sources .................................................................... 100 5.8.2 Experiment E8 – HBPu sources .................................................................................. 101
5.9 Experiment 8b: Glovebox Scenarios ................................................................................... 102 5.9.1 Low-activity scenario .................................................................................................. 102 5.9.2 High-activity scenario ................................................................................................. 103 5.9.3 Fumehood high activity scenario ................................................................................ 104
6 Performance vs. Contextual Usage Scenarios ............................................................................. 105 7 Conclusion .................................................................................................................................. 117
7.1 Conclusion to measurement campaign................................................................................ 119 8 References ................................................................................................................................... 122 9 Technical Contacts ...................................................................................................................... 123 10 Document Revision History .................................................................................................... 123

Report
2016 Technology Demonstration Workshop (TDW) on Gamma Imaging-External
Version Date: 2017-03-02
Version No.: 1
Department of Safeguards Page: 5 of 123
1 Purpose and Scope
Purpose: Technology Demonstration Workshop (TDW) on gamma imaging was organized by the
IAEA at the IAEA’s Seibersdorf laboratories from 19 to 23 October 2015. The goal of
workshop was to evaluate technologies utilized in gamma imaging systems and to
complete a status review of the currently available methods and perspectives of the
development of this emerging field with an emphasis to nuclear safeguards.
Scope: This report is intended to document and inform interested (external) parties of the results
of the workshop.
2 Executive summary
During the past decade, major improvements in growth of compound semiconductor crystals for
radiation detectors and in segmentation of high-purity germanium detectors, as well as a deep
understanding of the advantages of using of semiconductor detectors in the context of coded-aperture
and Compton imaging occurred.
This document summarizes research and development results, which were demonstrated at the
workshop by participants on the creation of new generation of gamma-ray imagers applicable for
nuclear safeguards and other closely related applications.
At the workshop the following eight gamma ray imagers were presented:
GeGi – Compton/pinhole imager based on HPGe detector
HEMI – Compton 3D volumetric imager based on room temperature CZT detectors
HiSpect – coded-mask imager based on room temperature CZT detectors
iPIX– coded-mask imager based on room temperature CdTe detector
ORNL HPGe Imager – coded-mask imager based on HPGe detector
N-Visage– proximity 3D volumetric imager based on room temperature CZT detector
Polaris-H – Compton imager based on room temperature CZT detector
RadSearch – 2D scanner based on LaBr3 detector
Two mature imaging technologies, coded-mask or Compton imaging, are deployed in six systems.
Five systems are based on segmented semiconductor detectors and four systems are based on 3D
position sensitive detectors.
The goal of the workshop was to evaluate technologies utilized in gamma-ray imaging systems and
make a review and conclusion about current status and perspectives of the development of this
emerging field with an emphasis to nuclear safeguards. In order to achieve this goal, different types of
static measurements with radioactive sources and nuclear materials were conducted.
The following eight experiments were conducted with the systems:
Experiment 1 – Measurements of sensitivity in wide energy range of imager operation
Experiment 2 – Overnight localization and identification of weak source in the presence of a
masking source
Experiment 3 – Measurements of sensitivity to nuclear materials, time to detect, identify and
localize nuclear materials

Report
2016 Technology Demonstration Workshop (TDW) on Gamma Imaging-External
Version Date: 2017-03-02
Version No.: 1
Department of Safeguards Page: 6 of 123
Experiment 4 – Angular resolution
Experiment 5 – Field of view
Experiment 6 – Localization performance for extended source
Experiment 7 (a) – False alarm rate
Experiment 7 (b) – High-background masking scenario
Experiment 8 (a) – Angular resolution for extended sources
Experiment 8 (b) – Glove box scenarios
In addition, dynamic measurements have been made to reveal performance characteristics of 3D
volumetric Compton imager.
Compared to conventional gamma-ray spectrometry imaging of a radioactive source, it is done at a
cost of losing some sensitivity. For example, in Compton imaging only a fraction of full-energy peak
events are suitable for imaging purposes and in coded aperture imaging just a portion of photons reach
the detector due to absorption in the mask material; moreover sufficient statistics is needed to create
shadow of mask pattern projected on the detector. In other words, source localization time in the form
of image may take minutes compared to seconds required to achieve the necessary number of
standard deviations in a full energy range or in full-energy peak, which may be referred to detection
or identification time in conventional gamma-ray spectrometry. However, statistical principles of data
processing are quite similar.
Therefore, tests under experiments 1 and 3 were focused on the estimation of total sensitivity and
sensitivity in full-energy peaks. Experiments were conducted with Am 241, Cs-137 and Co-60 to
cover wide energy range of imager operation and with HBPu, LBPu, HEU and LEU to evaluate
sensitivity to nuclear materials.
Four gamma-ray imagers presented at the workshop, are based on 3D position sensitive
semiconductor radiation detectors, which makes the application of combined coded aperture/Compton
imaging methods possible. Sensitivity measurements, allowed the IAEA to evaluate and compare the
suitability of gamma-ray imagers for both imaging modes.
Test under Experiment 2 and 7 (b) have revealed, the importance of having spectrometric information
for coded-aperture imaging, in order to enhance imaging capabilities, which is achieved by imaging
the events from the selected region of interest in the spectrum. In Compton imaging full-energy peak
events are imaged, therefore Compton imager shall be spectrometric.
As soon as nuclear materials such as, HEU and LBPu are characterized by relatively low energies of
emitted photons coded-aperture imaging, it could be considered as a necessary mode of imager
operation for the tasks associated with activities of nuclear safeguards.
Angular resolution and field of view of coded aperture imaging is is impacted by the choice of a mask
pattern, by the distance between mask and a detector, and by the spatial resolution of the detector.
Therefore, basic tests under experiments 4 and 5 were aimed to reveal performance of coded-aperture
imagers and in particular to evaluate level of segmentation of semiconductor radiation detectors,
whether it is appropriate to address safeguards tasks or not.
Tests under Experiment 6 have demonstrated, an advantage of using mask-anti mask imaging method
for imaging of a pattern of extended sources, which is widely distributed across the field of view.

Report
2016 Technology Demonstration Workshop (TDW) on Gamma Imaging-External
Version Date: 2017-03-02
Version No.: 1
Department of Safeguards Page: 7 of 123
Tests under Experiment 7 (b) and Experiment 8 (b), have demonstrated advantage of having
combined coded-aperture/Compton imager.
Tests under Experiment 2 and 8 (a), have demonstrated independence of gamma-ray imagers in their
ability to detect and localize radioactive source from necessity in having background measurements.
As a result of the analysis of experimental results, it can be concluded that new generation of gamma-
ray imagers possess the following essential features already demonstrated by participants at this
workshop:
Application of semiconductor radiation detectors
High-level of segmentation of CdTe, CZT and HPGe detectors
Application of 3D position sensitive semiconductor detectors
Combination of coded-mask/Compton imaging methods
Performing dynamic gamma-ray imaging – 3D volumetric Compton imager has been
successfully demonstrated.
3 Background
Photons emitted by nucleus as a result of decay or spontaneous fission, are not visible by the human
eye. The primary concept behind any gamma-ray imaging system is in visualization of the distribution
of radioactive sources in space. This goal is achieved by different imaging methods and at the final
step, by overlaying obtained gamma-ray image with the visual image of the inspected object.
Historically, gamma-ray imaging has been pioneered in other fields, and now, Compton and coded-
mask methods have been proposed for nuclear safeguards.
For applications which are close to nuclear safeguards by their nature, transportable instruments such
as, Gamma-Visor [1] and CARTOGAM [2] have been developed and deployed at nuclear facilities in
the past. The latter one was successful in terms of commercialization, and both went through two
evolutionary steps, initially a pinhole was used to generate gamma-ray image and then a single
aperture was replaced by coded-mask [3][4]. In these systems application of array of scintillation
radiation detectors, allowed to create gamma-ray images within certain field of view using single
measurement and achieving good spatial resolution.
Another approach has been implemented in the development of gamma-ray scanner [5], based on well
collimated radiation detector, which can be focused on a particular area by means of automated
positioning mechanism. An imaging area can be divided into consequent scan elements. Spectrum of
each scan element can be recorded. Depending on the variations of amplitude of signal between
scanning elements gamma-ray image of the whole area can be created, but many measurements are
needed.
Modern gamma-ray imaging systems are progressing to small, portable and preferably hand-held
systems. As soon as no visual information on source distribution in space is available for the operator
prior to gamma-ray imaging, the device shall have relatively wide field of view in order to minimize
the number of measurements during the search for the source. In the meantime, the instrument should
have good spatial resolution to find anomalies in the radiation field, which may be created by several
sources or by an extended source. Inherent property of the instrument, should have the ability to

Report
2016 Technology Demonstration Workshop (TDW) on Gamma Imaging-External
Version Date: 2017-03-02
Version No.: 1
Department of Safeguards Page: 8 of 123
identify source type. Detection efficiency in combination with used imaging methods, should allow
the operator to perform his analysis tasks within a reasonable timeframe, typically minutes for non-
complex task, such as localization of point source, which creates a dose-rate at an imager position
comparable to the fraction of background dose rate.
Imaging is done at a cost of losing some sensitivity, it could be illustrated by a pinhole imaging
method (Figure 2), where a passive screen with a single aperture in the centre is placed between the
detector and the source of radiation. Material, density and thickness of the screen are selected so
radiation could typically pass only through the hole in the screen. Radiation passing through this hole
is projected on the detector and an inverted gamma-ray image of the source pattern is generated.
Position sensitive detectors, shall be used to generate an image. Location of the radiation pattern on a
detector reflects the location of the source in space. Signal measured by the detector is less intense
compared to the signal, which could be measured in case, if there would be no passive screen in front,
but at a cost of losing detection efficiency, imaging capability is obtained.
Figure 2. Illustration of pinhole imaging method
Sensitivity of pinhole imagers could be improved by using a coded-mask[6][7], where radiation could
pass through multiple apertures, which form a certain pattern. Open area of a mask could reach 50%.
Radiation passing through the mask creates a shadow on the surface of position sensitive detector
(Figure 3).. Multiple sources will create a common shadow, which has to be subdivided in multiple
shadows or in other words de-convoluted; therefore, a special mask pattern shall be used. Results can
be improved by using a mask/anti-mask procedure. Anti-mask has an inverted pattern of apertures
compared to the mask, so the measurement cycle composed from two measurements should be done.

Report
2016 Technology Demonstration Workshop (TDW) on Gamma Imaging-External
Version Date: 2017-03-02
Version No.: 1
Department of Safeguards Page: 9 of 123
Figure 3. Illustration of coded-mask imaging method [8]
Coded aperture imaging, is more effective for low energies than high energies, since high energy
photons may tend to pass through the mask [8].
Since Compton scattering is predominant photon energy, the absorption process is already at energies
of photons of several hundred keV even for high-Z detector materials, another imaging method which
can be used is Compton imaging.
In Compton imaging, two position sensitive detectors could be used. As shown in Figure 3 below [8],
a photon scatters in the first detector and is absorbed in the second detector. Using energy and
position measurements, the scattering angle of the photon can be estimated, and its original source
location can be isolated to a cone with a vertex at the first measurement point. The intersection of
many such rings (Figure 4), produced by a single source, projected on to an imaging plane, identifies
the position of that source [8].
Figure 4. Illustration of Compton imaging method [8]
Compton imaging and coded aperture are most effective in different energy ranges, it is natural to
consider the application of both modalities, when seeking to image sources, which range in energy
from 100 keV to 2.5 MeV [8].
Another imaging method under development in one of the systems is the usage of active coded mask
and potentially combination of two imaging modes; Photons which interact in both an active mask
element and the absorbing back detector are treated as Compton imaging events, while photons
interacting only in the back detector are treated as coded aperture events [8]. This is of interest for

Report
2016 Technology Demonstration Workshop (TDW) on Gamma Imaging-External
Version Date: 2017-03-02
Version No.: 1
Department of Safeguards Page: 10 of 123
many applications including nuclear safeguards to perform dynamic gamma-ray imaging. Gamma-ray
imaging and detection technologies are summarized in Table 3 and Table 4.

Report
2016 Technology Demonstration Workshop (TDW) on Gamma Imaging-External
Version Date: 2017-03-02
Version No.: 1
Department of Safeguards Page: 11 of 123
4 Participating systems at the workshop
The following (Table 1, Table 2, Table 3, and Table 4) summarize the technical specifications of each
system that was demonstrated at the workshop.
Table 1. Description of gamma-ray imagers
Gamma imaging system Dimensions Weight
GeGI 31 x 15 x 23 cm 14 kg
HEMI 28 x 18 x 18 cm 4.5 kg
HiSpect 20 x 21 x 23 cm 8 kg
iPIX 19 x 11 x 11 cm 2.5 kg
N-Visage Prototype Prototype
ORNL HPGe Imager 31 x 15 x 23 cm 14 kg
Polaris-H 21 x 19 x 13 cm 4 kg
RadSearch 66 x21 x 18 cm 44 kg (with tripod)
Table 2. Field of view, energy range of operation and energy resolution of imagers
Imager Field of view,
degrees
Imaging energy range of
operation, keV
Energy resolution at 662
keV, %
GeGI 4π (Compton)
60° (pinhole)
140 – 3000 (Compton)
30 – 600 (pinhole)
0.28 (E1M2)
HEMI 4π 250 - 3000 3.7 (E1M2) for coincident
events
HiSpect 35° 30 - 1300 2.0
iPIX 41.4° – 44.8° 30 - 1200 N/A
N-Visage 4π 30 - 1800 N/D
ORNL
HPGe
Imager
12° - 110° (coded-
mask)
4π (Compton)
30 – 650 (coded-aperture)
650 – 2050 (Compton)
0.28
Polaris-H 4π 250 - 8000 1.0
RadSearch 4° (single scan)
4π (multiple
scans)
30 - 2000 3
Table 3. Summary of imaging technologies utilized in gamma-ray imagers
Imager Detector type Imaging
technology 1
Imaging
technology 2
Imaging technology
3

Report
2016 Technology Demonstration Workshop (TDW) on Gamma Imaging-External
Version Date: 2017-03-02
Version No.: 1
Department of Safeguards Page: 12 of 123
Imager Detector type Imaging
technology 1
Imaging
technology 2
Imaging technology
3
GeGI Semiconductor Compton
imaging
Pinhole imaging
HEMI Semiconductor Compton
imaging
3D Volumetric
Compton
imaging
Active coded-aperture
imaging
HiSpect Semiconductor Coded-aperture
imaging
iPIX Semiconductor Coded-aperture
imaging
N-Visage Semiconductor 3D proximity
imaging
ORNL HPGe
Imager
Semiconductor Coded-aperture
imaging
Compton
imaging
Polaris-H Semiconductor Compton
imaging
RadSearch Scintillation 2D scanning*
* By bold are marked technologies which are fully implemented

Report
2016 Technology Demonstration Workshop (TDW) on Gamma Imaging-External
Version Date: 2017-03-02
Version No.: 1
Department of Safeguards Page: 13 of 123
Table 4. Summary of detection technologies utilized in gamma-ray imagers
Imager Detector
material
Detector type Detector size Number of detector sensing
elements
GeGI HPGe 3D position
sensitive
90 x 10 mm
16 x 16 orthogonal strips
HEMI CZT Two arrays
based on 96
single crystal
detectors
32 x 1 cm3 –
front plane
64 x 1 cm3 –
back plane
96 coplanar grid CZT
detectors
HiSpect CZT 3D Position
sensitive
40 x 40 x 5 mm
16 x 16 pixels
iPIX CdTe 2D Position
sensitive
14 x 14 x 1 mm 256 x 256 pixels
N-Visage CZT Single crystal 10 x 10 x 5 mm 1
ORNL
HPGe
Imager
HPGe 3D position
sensitive
90 x 10 mm 16 x 16 orthogonal strips
Polaris-H CZT 3D position
sensitive
20 x 20 x 15 mm 11 x 11 pixels
RadSearch LaBr3 Single crystal Ø25.4 x 25.4 mm 1

Report
2016 Technology Demonstration Workshop (TDW) on Gamma Imaging-External
Version Date: 2017-03-02
Version No.: 1
Department of Safeguards Page: 14 of 123
Table 5. Summary of software features of gamma-ray imagers which could be essential for operator
Software features GeGI HEMI HiSpect iPIX N-Visage
ORNL
HPGe
Imager Polaris-H RadSearch
Is it possible to acquire an overall spectra of the entire target Yes Yes Yes No Yes Yes Yes Yes
Isotope and energy ROI, is it possible to:
Select a specific isotope (and study the spectra/count profile on the image) Yes Yes No No No Yes Yes Yes
Select a several isotopes (and study the spectra/count profile on the image) No Yes No No No Yes Yes Yes
Select 1 ROI in the energy (and study the spectra/count profile on the image) Yes Yes Yes No Yes Yes Yes Yes
Selects several ROI in the energy (and study the spectra/count profile on the image) Yes Yes Yes No No Yes Yes Yes
See the spectra associated with a specific zone of the image Yes No No No No Yes No No
Acquisition grouping and reconstitution, is it possible to:
“Combine/cumulate” counts from different measurements (for example if we have two 30-
minute acquisitions, is it possible to merge them into one 1-hour measurement?) No No Yes No No Yes No No
Make “backward reconstitution” from a long acquisition (for example if we have 1-hour
acquisition, is it possible to see the picture as after 10 minutes from the beginning?) No Yes Yes Yes Yes Yes Yes No
Result export, is it possible to:
Export overlaid image and visual/gamma images separately? Yes Yes Yes Yes Yes Yes Yes Yes
Is the output spectra format is human readable or compatible with some standard spectra
viewing software? Yes No Yes No No Yes Yes Yes
Is it possible to program the camera to take automatic scheduled measurements? Yes No No Yes No Yes Yes Yes

Report
2016 Technology Demonstration Workshop (TDW) on Gamma Imaging-External
Version Date: 2017-03-02
Version No.: 1
Department of Safeguards Page: 15 of 123
4.1 GeGI
HPGe detectors are a good choice for a Compton camera, not only because of the energy resolution,
but that they can be made relatively large, providing good detection efficiency. A break-through in the
detector technology was the introduction of the planar HPGe detectors using the amorphous
germanium contact technology [12]. This technology has replaced the difficult to segment lithium
diffused p+ contacts, and in some instances even the standard boron implanted n+ contacts, so that
high levels of electrode segmentation have become reliable.
There is an objective difficulty towards making hand-held HPGe-based gamma-ray imager, which is
associated with necessity in cryogenic cooling of HPGe detector. During past decade, miniature
Stirling-cycle cryocoolers suitable for HPGe detector cooling, became available from various vendors.
Currently, HPGe detectors could be cooled down to operating temperature using compact cryocoolers
with cooling power ranging from couple of watts up to dozens of watts at 80K.
For this instrument, a cryocooler has been selected so it could provide fast cool down time from room
to operating temperature even for large volume HPGe detector.
The system tested during the workshop is the GeGi-4 (a fifth generation has in the meantime been
released, with a smaller footprint). GeGI is based on segmented HPGe detector having diameter 90
mm and thickness 10 mm. HPGe detector is cooled by means of Stirling-cycle cryocooler. Detector
cryostat is sealed with metal gaskets; the vacuum support system is based on hydrogen/water getter
pumps and on the ion pump for removal of non-active gases. The Ion pump can be switched on
independently from a cryocooler. Cool-down time of a HPGe detector from room to operating
temperature demonstrated at the workshop was three hours.
Figure 5. Segmented HPGe detector in the holder [17]

Report
2016 Technology Demonstration Workshop (TDW) on Gamma Imaging-External
Version Date: 2017-03-02
Version No.: 1
Department of Safeguards Page: 16 of 123
HPGe detector is 3D position sensitive. X, Y – position of photon energy deposition in detector is
measured by 16x16 orthogonal strips. Strip pitch is 5 mm and gap is 0.5 mm [15]. Z position is
measured using differences in time arrival of charge carriers to electrodes.
First mode of operation of an imager is a Compton mode. In this mode, energy spectrum is measured
in the whole energy range, full energy peaks are identified and radioactive source emitting photons
with energies ranging from 140 keV to 3 MeV could be localized. To be imaged, photons need to
scatter in the detector first and then have to be absorbed, so that a low energy threshold is basically
determined by the properties of germanium i.e. predominance of full-energy absorption of incoming
photon at energies below 140 keV. Field of view of a Compton imager is 4π. Scientific plot of basic
operator window shows, the intersection of Compton cones on the globe, so the operator could reveal
presence of the source behind gamma-ray imager.
In case low-energetic full-energy peaks are identified, localization of radioactive source could be done
by using pinhole mode of operation and new measurement needs to be performed. GeGI was equipped
with two removable 25 mm thick blocks made from lead with 1 mm and 5 mm pinholes having 60°
opening cone.
For imaging geometries of extended sources, the pinhole mode of operation is considered as a default
and more contrast images can be obtained with a 1mm pinhole compared to the images obtained with
a 5mm pinhole. In this mode apart from basic gamma-ray image, energy spectrum and 3D-diagram of
events deposition across field of view are available. The main window of the graphical user interface
is shown in Figure 6 below.
At the workshop two identical systems were used, one operating basically in Compton mode and the
second one in pinhole mode.

Report
2016 Technology Demonstration Workshop (TDW) on Gamma Imaging-External
Version Date: 2017-03-02
Version No.: 1
Department of Safeguards Page: 17 of 123
Figure 6. GeGI operator window, advanced mode.
Summary of technologies utilized in GeGI:
Electrical cooling of HPGe detector with little compromise on energy resolution
Reliable vacuum support system
Amorphous Ge contacts with high level of segmentation
3D position sensitive HPGe detector
Compton imaging
Pinhole imaging

Report
2016 Technology Demonstration Workshop (TDW) on Gamma Imaging-External
Version Date: 2017-03-02
Version No.: 1
Department of Safeguards Page: 18 of 123
4.2 HEMI
HEMI is a prototype hand-portable gamma-ray imaging system. It consists of 96 individual 1 cm3
CZT crystals, each with a coplanar grid electrode configuration and low-power ASIC readout. The
detector elements are arranged in a two-plane active-mask configuration with the front plane half
populated (32 elements) and the back-plane fully populated (64 elements).
Imaging results for HEMI and analysis of the imaging results in the course of this report were
provided by the developers, as well as information below with description of the imager operating
principles and hardware.
The active mask configuration was selected to allow both coded aperture and Compton imaging
modalities, principally providing gamma-ray imaging capabilities for energies ranging from below 100
keV to several MeV. HEMI has a modular design that enables it to be packaged with different sensors
and in different deployment modes, such as hand-held or unmanned aerial platforms.
When fully assembled in the hand-held configuration, HEMI, including an on-board battery and all
auxiliary sensors, weigh less than 4.5 kg. The battery is sufficient to operate continuously for about
four hours. As is, HEMI is capable of traditional 2D directional gamma-ray imaging, without any
additional sensors. Currently, only the Compton modality has been implemented in real-time. The
coded-aperture capability, while demonstrated conceptually, is an area of active research.
HEMI leverages a new ability to integrate gamma-ray and contextual information in 3D in real-time.
This is accomplished by combining the system with a visual sensor, that is used to track the location
and orientation (or pose) of the detector, while also creating a 3D map of the scene via a technique
known as simultaneous localization and mapping. The 3D model and tracking information are then
combined with the gamma-ray data to localize gamma-ray sources within the reconstructed scene in
all three spatial dimensions. The 3D model, not only provides context for the gamma-ray image
(analogous to overlaying a 2D gamma-ray image onto an RGB image), but can also be incorporated in
the gamma-ray image reconstruction. Simple data fusion techniques have been shown to improve the
tractability of the imaging problem; improving localization capability and reducing image noise, while
greatly reducing the computation time. The visual sensor used in this case is a Microsoft Kinect, which
provides, both RGB images and dense point cloud models in the field of view at up to 30 Hz frame
rate.
The most obvious advantage of the volumetric imaging approach, is the ability to reconstruct the
spatial distribution of radiation sources in all three spatial dimensions.
Having a real-time mobile imaging platform confers other advantages as well. For example, the 3D
measurements require runs on the order of one minute (30-90 seconds long). A limiting component in
measuring gamma-rays is the inverse r-squared geometric factor that greatly reduces counts and is an
inherent limitation for the static mode. Moving the detector throughout the scene can reduce the
distance to objects, which helps to overcome the geometric factor thus reducing localization time or
increasing sensitivity to weaker or shielded sources.

Report
2016 Technology Demonstration Workshop (TDW) on Gamma Imaging-External
Version Date: 2017-03-02
Version No.: 1
Department of Safeguards Page: 19 of 123
Summary of technologies utilized in HEMI:
Two large volume room temperature CZT detector arrays
Volumetric Compton Imager
Active coded-mask (under research and development)
4.3 HiSpect
HiSpect is based on array of 4 room temperature CZT detectors. Dimensions of each detector are
20x20x5mm. Each detector has 64 pixels, energy resolution for Co-57 obtained with detectors array is
about 2.5%. The software has a simple graphical user interface, which allows the operator to control
measurements, see alarms, identification and localization flags, get gamma-ray images along with
spectrum, as well as get image from particular ROI or dynamic range image based on the ratio of
ROIs.
Figure 7. HiSpect main user interface window
Software is written in LabView and the main user interface tab shows:
Blended image of optical and gamma ray views. Each color channel (red, green, blue) is
attributed to a certain isotope.
Total spectrum acquired by the detector (human readable export format)
Control slides allowing to control relative intensities and contrast of the 3 gamma channel, and
of the optical image
Flags at time to alarm, time to identify and time to localize
Summary of technologies utilized in HiSpect:
Coded-aperture imaging with HURA mask
3D position sensitive semiconductor radiation detector

Report
2016 Technology Demonstration Workshop (TDW) on Gamma Imaging-External
Version Date: 2017-03-02
Version No.: 1
Department of Safeguards Page: 20 of 123
4.4 iPIX
iPIX is a coded-aperture imager based on a room temperature CdTe detector that is 2D position
sensitive and highly pixilated. While spectrometric information from room temperature of the CdTe
detector could be obtained, the iPIX imager demonstrated at workshop does not have any
spectrometric capabilities. There are three basic reasons, why the imager is not spectrometric:
a) Operation at room temperature does not fully explore spectrometric capabilities of CdTe
detector
b) Thickness of the detector is 1mm, which limits full-energy peak efficiency even at relatively
low energies (about 10% of intrinsic photoelectric efficiency at energy 200 keV and about 1%
at energy 500 keV)
c) Spectrometry is not a requirement for coded-mask imaging method.
iPIX is based on a Timepix photon counting chip, hybridized with 14x14x1mm CdTe substrate. The
active area is divided into 256x256 pixels (55μm side) working in single photon counting mode. Each
pixel is divided into an analog and a digital part and can be considered as an individual counter. The
hybridization of Timepix with a semiconductor enables a direct conversion from gamma-ray into
electrical signal, which removes multiple conversion steps occurring in scintillation detectors [28].
The masks used, are machined from a tungsten alloy and identified by their rank and thickness. Three
different masks (R7e4, R7e8 and R13e2) are currently available for this platform, providing two
different mask ranks and three different thicknesses. The benefit to the higher mask rank is that it is
more precise with angular resolution, albeit with a decrease in efficiency (due to less open area).
Increasing the mask thickness, provides more gamma filtering in order to enhance the signal-to-noise
ratio, albeit with an increase of weight and a decrease the off-axis response due to the local photon
collimation.
The iPIX mask design is based on the MURA (Modified Uniformly Redundant Array) pattern, which
can be inverted by a 90° rotation to perform “anti-mask” measurements. By using such masks with a
stream of incident photons (from a remote radioactive source within the system field-of-view), the
detected events of interest can be discriminated, without the use of additional shielding as a shadow of
the part of the mask pattern illuminated by the radioactive source is directly cast onto the Timepix
sensor.
Summary of technologies utilized in iPIX:
2D position sensitive CdTe detector with high level of segmentation
Coded-mask imaging
Mask/anti-mask imaging approach with the R7e4 and R7e8 masks

Report
2016 Technology Demonstration Workshop (TDW) on Gamma Imaging-External
Version Date: 2017-03-02
Version No.: 1
Department of Safeguards Page: 21 of 123
4.5 N-Visage
This instrument is based on proximity gamma-ray imaging. It utilizes room temperature and a
spectrometric CZT detector for measurements of gamma-radiation and 3D laser-based system for
reconstruction of imaging scene. Sensitive volume of CZT detector is 0.5 cm3. In order to obtain 3D
volumetric a gamma-ray image, the instrument needs to be moved in the space along all 3-dimensional
coordinates. The instrument is at a prototyping stage and proof of imaging concept needs to be
performed.
Figure 8. N-Visage proximity gamma-ray imaging of U source. Spectrum (left), offline reconstruction of imaging scene
along with gamma-ray image (right)
4.6 ORNL HPGe Imager
In terms of hardware, ORNL HPGe Imager is similar to a GeGI completed by a coded-mask with 50%
open area, thus improving the imaging efficiency of pinhole imaging method.
ORNL HPGe Imager uses mask / anti-mask data-acquisition strategy. MURA mask with 90° anti-
mask is positioned on a software controlled mask positioning and rotating system, so distance between
detector and mask could change and a higher field of view or better angular resolution of an image
could be achieved, as well as the mask could be rotated by 90° to perform mask/anti-mask measuring
cycles. Mask is 3 mm thick and is composed from Tantalum. Spectrum of each imaged pixel is
available for operator.
The first figure below shows the setup window for point source alarms (upper window). There is a
global alarm for all energy bands and three separate alarms, which can be user-defined. Each user-
defined alarms, allow up-to three spectral regions of interest. In addition, a text identifier for the alarm
and the threshold level can be set for each alarm. The alarms are displayed on the upper right of the
acquisition display window (bottom left), and can be activated from that window via a check box. The
indicator turns red when an alarm occurs. The acquisition display window includes a false-color
picture of the gamma-ray image. To the right and below that image are one-dimensional histograms
showing lineouts of the counts in the pixels in a row and column with the x and y for those histograms
selected by clicking the mouse cursor. Each acquisition window can have up to four spectral windows
associated with it. In the figure below, two spectral windows are open, the upper one showing the total

Report
2016 Technology Demonstration Workshop (TDW) on Gamma Imaging-External
Version Date: 2017-03-02
Version No.: 1
Department of Safeguards Page: 22 of 123
spectrum seen by the detector from a Cs-137 source, while the lower one shows the spectrum from the
hot pixel in image.
Figure 9. ORNL HPGe Imager basic operator setup windows.
The next figure below shows two setup windows, one for the acquisition time, and the other for the
source distance and focal length (zoom). The acquisition window on the left shows the image obtained
from several Pu blocks.
Figure 10. ORNL HPGe Imager additional operator setup windows.
The following figure shows some of the on-line analysis capabilities of the code. The data are stored
as full hyperspectral data cubes and spectra can be viewed from regions selected in the image with the
cursor (the lower spectrum is based on the pixels that are turned on in the false-color image). The
image displayed can also be based on up-to three spectral regions of interest. A user selectable
threshold allows one to turn pixels with low significance transparent to show where the hot spots fall
on a scaled, visible-light image obtained with a stereo camera aligned with the system. The point cloud

Report
2016 Technology Demonstration Workshop (TDW) on Gamma Imaging-External
Version Date: 2017-03-02
Version No.: 1
Department of Safeguards Page: 23 of 123
data from the stereo imager can be used to map the gamma-ray data onto higher resolution point cloud
data such as might be obtained with a laser scanner.
Figure 11. ORNL HPGe Imager online analysis capabilities.
The processing software used by the instrument is developed in the Microsoft Visual Studio.Net
environment. It will easily handle kilohertz data rates, generating on-line gamma-ray images as the
data are collected. Data acquisition is fully automated and uses a balanced mask / anti-mask
acquisition cycle. This approach overcomes any issues with non-uniform radiation fields at the
detector and makes the imaging very robust. The modified uniformly redundant array mask patterns
used are antisymmetric on a 90° rotation. Such rotations are automatically performed by the software.
The images are best with balanced mask / anti-mask sets, the system is generally operated by breaking
long integration intervals into shorter individual mask / anti-mask sets. The rotations are handled by
the software and this approach minimizes any artifacts that may occur due to the local radiation
environment as the image is collected.
Overall, the software includes a full GUI that is part of the custom software. The GUI allows the user
to enter the parameters for a given data acquisition (distance to the source, dwell time per mask
configuration, the number of mask/anti-mask cycles, etc.), start and stop an acquisition, replay data
files, and perform on- and off-line analysis. The code interfaces to the detector by sending commands
via a memory pipe to the manufacturer’s control software that runs in parallel with the code. Data are
obtained via a separate memory pipe. The code will save list-mode data files that can be used to replay
the data with corrected or updated parameters. In addition, the full hyperspectral data cubes can be
saved in a compressed format so that the data can be explored in a simplified data viewer that does not
include all of the instrument control functionality. Spectra and images can also be exported in text
mode.
Summary of technologies utilized in ORNL HPGe Imager:
3D position sensitive semiconductor detector
Coded-mask imaging
MURA mask with 90° anti-mask
Spectra on a pixel-by-pixel basis
Variable focal length (variable field of view and angular resolution)

Report
2016 Technology Demonstration Workshop (TDW) on Gamma Imaging-External
Version Date: 2017-03-02
Version No.: 1
Department of Safeguards Page: 24 of 123
4.7 Polaris-H
Polaris-H integrates a 3D-position-sensitive pixilated CZT detector (20x20x15mm), associated readout
electronics, an embedded computer, a 5h battery, and an optical camera in a portable water-proof
enclosure. The total mass of the instrument is about four kilograms, and the system start up time is two
minutes. Additionally, it has a connection for a tablet, which displays a gamma-ray spectrum and
isotope-specific images of the gamma-ray distribution in all directions in real time. List-mode data is
saved to an external USB memory stick. Based on pixilated depth-sensing technology, spectroscopy is
routinely better than 1.1% FWHM at 662keV, and imaging efficiency at 662 keV varies less than a
factor of two for all directions, except through the battery.
In the Polaris-H system, electron clouds produced by gamma-ray interactions in a CZT crystal drift in
an applied electric field, inducing a signal on the planar cathode and on one of the 1.72-mm-pitch
pixels on the anode surface (part of an array of 11-by-11pixels). The lateral position of the interaction
is determined by the anode pixel that sees the signal. The interaction depth is determined by drift time
of the electron cloud and/or the ratio of the cathode to the anode signal amplitude. As long as
interactions occur under different pixels, multiple interaction positions – and the energy deposited at
each – can be recorded simultaneously. This 3D position sensitivity allows calibration on a voxel-by-
voxel basis (producing energy resolution often below 1% FWHM at 662keV) [23] and localization of
gamma-ray interactions in the crystal permitting Compton imaging.
Low-energy Compton imaging threshold is about 250 keV please see Figure 12, however coded-mask
imaging method is under development, which will allow to make imaging based on low-energy photon
emissions such as 185.7 keV (U-235) and 208 keV (HBPu).
The instrument has a fully developed graphical user interface for recording spectra and creation of
gamma-ray images online as well as useful post processing tool which allows operator to:
reconstruct gamma-ray images based on the saved spectra
save spectra in human readable format
automatically identify radionuclides
create images for particular full-energy peaks or sum of peaks
generate files with 3D diagrams of gamma-ray imaging data
reconstruct images for selected time interval
Basic window of software tool is shown on the Figure 13.

Report
2016 Technology Demonstration Workshop (TDW) on Gamma Imaging-External
Version Date: 2017-03-02
Version No.: 1
Department of Safeguards Page: 25 of 123
Figure 12. Polaris-H fraction of useful imaging events vs. energy of photo peak
Figure 13. Polaris-H main window of software tool
Summary of technologies utilized in Polaris-H:
Compton imaging
Large volume single crystal CZT detector
0.00
0.10
0.20
0.30
0.40
0.50
0.60
0 200 400 600 800 1000 1200 1400
Energy, keV
Fra
cti
on
of
imag
ed
even
ts
H3D experimental data

Report
2016 Technology Demonstration Workshop (TDW) on Gamma Imaging-External
Version Date: 2017-03-02
Version No.: 1
Department of Safeguards Page: 26 of 123
3D position sensitive semiconductor radiation detector
Excellent energy resolution for room temperature CZT detector
Excellent full-energy peak events to imaging events ratio for Cs-137 and Co-60
High-level of segmentation of CZT detector
4.8 RadSearch
RadSearch is a 2D scanner based on a collimated single crystal scintillation detector. Gamma-ray
image is obtained by comparison of amplitudes of radiation signal between individual scan elements
of inspection area. In order to achieve good contrast of the image, the detector must be well
collimated, shall have limited field of view and multiple measurements needs to be performed.
The instrument combines in one detector head collimated, one by one inch LaBr3 scintillation detector
with an optical (video) camera with controllable zoom and focus and a laser range finder. The detector
head is mounted on a pan/tile mechanism with a range of motion of 360 degrees (pan) and ±90 degrees
(tilt). The detector head with pan/tilt is normally mounted on a tripod, but can also be mounted on
vehicles or a mobile robot for access to high dose-rate areas.
The detector is housed in a tungsten shield, which provides a shielding ratio of 50:1 in the forward
direction and 10:1 on the sides and to the rear for incident 1500 keV gamma-rays. The detector is
collimated in two configurations. With the stainless steel and tungsten detachable barrel fitted, the
detector has a 4-degree field of view (FOV). With the barrel detached the detector FOV is 18 degrees
[10].
Using the pan and tilt mechanism, RadSearch operates by scanning an object or surface in a
rectangular grid pattern. The scan pitch is user adjustable; however, better results are obtained with a
degree of over-scanning. In practice a scan pitch of 3.5 degrees (barrel fitted) and of 15 degrees (barrel
detached) work effectively.
Each individual component of the scanned area is called a Scan Element, and corresponds to the
detector field of view. A rectangular array or grid of Scan Elements comprises the Scan Area. As part
of the measurement process, the camera zoom feature allows close-up images to be recorded of
individual Scan Elements.
When a measurement is completed, RadSearch provides a video image of the object or surface being
measured divided up into the rectangular grid of Scan Elements each with a colored overlay showing
the intensity of radioactivity detected in the Scan Element. 8K-channels gamma-ray spectrum is
obtained for each Scan Element. From each measured spectrum, a number of different radionuclides
can be identified. A different overlay can be produced for each radionuclide that has been identified.
Software allows both automatic and manual operation and an operator can specify coordinates to
search a specific position or area or a search can be conducted automatically in 4π steradians, using the
full capabilities of the pan/tilt mechanism. The unit reports the intensity (cps) and activity (μCi) for a
variety of pre-selected radionuclides at different positions in relation to a video image.
Based on the measured dose-rate at the detector position, the operator could make a decision about
number of scan elements and measurement time. In case, if insufficient contrast of the image is

Report
2016 Technology Demonstration Workshop (TDW) on Gamma Imaging-External
Version Date: 2017-03-02
Version No.: 1
Department of Safeguards Page: 27 of 123
obtained, then a new measurement cycle with higher zoom and higher measurement time needs to be
performed.
Figure 14. RadSearch basic operator window, resulting image and spectrum of green scan element (05, 03) are shown.

Report
2016 Technology Demonstration Workshop (TDW) on Gamma Imaging-External
Version Date: 2017-03-02
Version No.: 1
Department of Safeguards Page: 28 of 123
5 Experiments
All systems were set in far-field condition. The gamma-ray source have been placed behind target
screen, not to disclose details of measurement setup to participants. The distance between the gamma-
ray imagers and target screen was in range between 2.5 and 5 meters depending on the experiment.
Systems were positioned on a shared rack equidistantly to the target sources and pointed towards them
or on dedicated tripods.
Figure 15. Illustration of experimental setup; from left to the right: gamma-ray imagers on the rack – target screen –
radioactive source
Figure 16. Gamma-ray imagers positioned on the rack and tripods and the target screen with sources behind screen.

Report
2016 Technology Demonstration Workshop (TDW) on Gamma Imaging-External
Version Date: 2017-03-02
Version No.: 1
Department of Safeguards Page: 29 of 123
Table 6. Description of sources used for measurements.
Source Most prominent gamma-ray
energies, keV
Activity or Mass
Am-241 59.5 24.5 GBq
Cs-137 661.6 (Ba-133m) 18.3 MBq
Co-60 1173.2
1332.5
65 MBq
LBPu
CBNM Pu93
CBNM Pu84
59.5 (Am-241)
332.8 (Pu-239)
375 (Pu-239)
413.7 (Pu-239)
6.6 g
HBPu
CBNM Pu70
CBNM Pu61
59.5 (Am-241)
160.3 (Pu-240)
164.6 (U-237)
208 (U-237)
332.4 (U-237)
6.6 g
LEU 185.7 (U-235)
1001 (Pa-234m)
Total U: 847 g (U-235: 169 g)
HEU (MTR plate) 185.7 (U-235) Total U: 218 g (U-235: 193 g)
(in one plate; up to 12 plates were used
in single measurement)
The following eight experiments were conducted during the course of the workshop:
Experiment 1 – Measurements of sensitivity in wide energy range of imager operation
Experiment 2 – Overnight localization and identification of weak source in the presence of
masking source
Experiment 3 – Measurements of sensitivity to nuclear materials, time to detect, identify and
localize nuclear materials
Experiment 4 – Angular resolution
Experiment 5 – Field of view
Experiment 6 – Localization performance for extended sources
Experiment 7 (a) – False alarm rate
Experiment 7 (b) – High-background masking scenario
Experiment 8 (a) – Angular resolution for extended sources
Experiment 8 (b) – Glove box scenarios
The results in the reports have been anonymised, actual names of the systems being replaced by a
System# (where # is a number).

Report
2016 Technology Demonstration Workshop (TDW) on Gamma Imaging-External
Version Date: 2017-03-02
Version No.: 1
Department of Safeguards Page: 30 of 123
5.1 Experiment 1: Sensitivity
In Experiment 1 the total sensitivity and detection efficiency in full-energy peaks, has been measured.
Am-241, Cs-137 and Co-60 sources were used to cover wide energy range of imager operation. Basic
spectrometric and imaging characteristics were studied. Sources were placed in the center and behind
a target screen.
5.1.1 Comparison of spectra and images measured
Figure 17. System3 spectra measured in Experiment 1
Currently multichannel analyzer with 1024 channels readout is integrated in System3, what limits
ability to extend spectrometric energy range up to 1.4 MeV, so full-energy peaks of Co-60 will be
visible.
HiSpect
0.01
0.1
1
10
100
1000
10000
0 100 200 300 400 500 600 700 800
Energy, keV
Co
un
t ra
te, c
pm
/ke
V
E3M7 (BKG)
E1M2 (Cs-137)
E1M3 (Am-241)
E1M4 (Co-60)

Report
2016 Technology Demonstration Workshop (TDW) on Gamma Imaging-External
Version Date: 2017-03-02
Version No.: 1
Department of Safeguards Page: 31 of 123
Figure 18. System3 imaging results for Experiment 1
With increase of energies of incoming photons coded-mask becomes more and more transparent. Co-
60 source requires more time to be imaged compared to Cs-137 source. Also quality of image suffers.
Figure 19. System1 spectra measured in Experiment 1
Polaris-H
0.1
1
10
100
1000
0 200 400 600 800 1000 1200 1400 1600
Energy, keV
Co
un
t ra
te,
cp
m/k
eV
BKG
E1M2 (Cs-137)
E1M3 (Am-241)
E1M4 (Co-60)

Report
2016 Technology Demonstration Workshop (TDW) on Gamma Imaging-External
Version Date: 2017-03-02
Version No.: 1
Department of Safeguards Page: 32 of 123
Figure 20. System1 imaging results for Experiment 1
Am-241 source cannot be imaged. Low energy thresholds for System1 is about 250 keV, below this
energy threshold full-energy absorption of incoming photons is predominant process. Energy
resolution in full energy peaks is of importance. For a Compton imager it is an indicator of imaging
quality due to necessity in measurement of energies of Compton events in the detector with good
precision.
Figure 21. System4 spectra measured in Experiment 1.
GeGI
0.1
1
10
100
1000
10000
100000
1000000
0 200 400 600 800 1000 1200 1400 1600
Energy, keV
Co
un
t ra
te,
cp
m/k
eV
E1M1 (BKG, Compton)
E1M2 (Cs-137)
E1M3 (Am-241)
E1M4 (Co-60)
E1M3 (Am-241, pinhole)

Report
2016 Technology Demonstration Workshop (TDW) on Gamma Imaging-External
Version Date: 2017-03-02
Version No.: 1
Department of Safeguards Page: 33 of 123
Figure 22. System4 imaging results for Experiment 1
Cs-137 and Co-60 are imaged in Compton mode of operation based on full-energy peak events. Two
signs of Co-60 on the right picture correspond to 1773 keV and 1333 keV full-energy peak events.
Am-241 is imaged in pinhole mode of operation. Red circle indicates field of view.
Figure 23. System8 spectra measured in Experiment 1.
Spectra are shown for detector focused on the source (red scan element on the images below).
RadSearch
0.1
1
10
100
1000
10000
0 200 400 600 800 1000 1200 1400 1600
Energy, keV
Co
un
t ra
te,
cp
m/k
eV
E1M1 (BKG)
E1M2 (Cs-137)
E1M3 (Am-241)
E1M4 (Co-60)

Report
2016 Technology Demonstration Workshop (TDW) on Gamma Imaging-External
Version Date: 2017-03-02
Version No.: 1
Department of Safeguards Page: 34 of 123
Figure 24. System8 imaging results for Experiment 1
5.1.1.1 Static measurements
Figure 25. System5 comparison of 1000 seconds spectrum of total interaction events with spectrum of double interaction
events under experiment E1M2 (Cs-137)
Compton imaging is based on the registration of energies and positions of double interaction events
(scattering event followed by absorption event). Scattering must occur in one CZT detector array and

Report
2016 Technology Demonstration Workshop (TDW) on Gamma Imaging-External
Version Date: 2017-03-02
Version No.: 1
Department of Safeguards Page: 35 of 123
absorption in another one. Figure below shows improvement of angular resolution with measurement
time, after 300 seconds angular resolution of 9.5 degrees was measured.
Figure 26. System5 angular resolution for Cs-137 source (E1M2)
5.1.1.2 Dynamic measurements
Cs-137, low activity
In this measurement, a weak Cs-137 source was hidden in one of the several boxes. The operator was
asked to inspect a potentially contaminated area. The left image (Figure 27) shows the reconstruction
scene by the operator during the real time acquisition. This image was acquired by taking a picture of
the tablet. The result on the right is from the same data rerun through the code with a different color
map and a grayscale version of the scene model. These images are shown side-by-side to emphasize
the real-time nature of the volumetric results. The measurement time was 74 seconds, and 78 cones
within the Cs-137 ROI were collected.

Report
2016 Technology Demonstration Workshop (TDW) on Gamma Imaging-External
Version Date: 2017-03-02
Version No.: 1
Department of Safeguards Page: 36 of 123
Figure 27. System5 real-time volumetric Compton imaging with a weak Cs-137 source
Co-60, high activity
In this measurement, a strong Co-60 source (65 MBq) was placed in the centre of the room (same
source was used in static measurements E1M4). During a 50 seconds measurement, System5 was
walked along a roughly linear path past the source and 1260 cones were acquired in the ROI about
1173 keV. The image reconstruction (Figure 37) is given by the red color map. This result
demonstrates volumetric capability for scenarios with high energy and highly active sources.
Figure 28. System5 real-time volumetric Compton imaging with a strong Co-60 source

Report
2016 Technology Demonstration Workshop (TDW) on Gamma Imaging-External
Version Date: 2017-03-02
Version No.: 1
Department of Safeguards Page: 37 of 123
5.1.2 Summary of the results
Due to different principles of operation of coded-aperture and Compton gamma-ray imagers, the value of total sensitivity (Table 7) could be
used for estimation of imaging efficiency for coded-aperture imager or for cross-comparison of imaging efficiency between coded-aperture
and Compton modes of imager operation when compared with sensitivity in full-energy peak (Table 8).
Total sensitivity (TS) is expressed by the following equation
]/[, 1
hnSvcpmDR
BCRTCRTS
where
TCR – total count rate in the whole energy range [cpm]
BCR – background count rate in the whole energy range [cpm]
DR – dose rate at detector position [nSv∙h-1]
Table 7. Experiment 1: Summary of the results of total sensitivity measurements
Experiment
Source
Source
dose rate,
nSv∙h-1
Total sensitivity, cpm/nSv∙h-1
System3 System1 System4 System8 System5 System6 System7 System2
E1M2 Cs-137 175 16.0 17.2 135.8 5.4 ND NP NP 0.1
E1M3 Am-241 315 95.0 21.4
1433.5
(3.2) 66.9 ND NP NP 42.3
E1M4 Co-60 805 13.2 12.7 68.4 4.2 ND NP NP 0.1
Dose-rates were measured with Thermo FH 40GL10 dose-rate meter positioned on the shelf in the middle of the rack populated with
instruments. Measured background dose-rate was 65 nSv/h. Source dose-rate is obtained by subtracting the background dose-rate.

Report
2016 Technology Demonstration Workshop (TDW) on Gamma Imaging-External
Version Date: 2017-03-02
Version No.: 1
Department of Safeguards Page: 38 of 123
System6 and 7 were not able to participated (NP) in the first day of measurement campaign due to their late arrival to Seibersdorf
No data (ND) with regard to total sensitivity were provided for System5 but sensitivity is clearly high since total sensitive volume of two CZT
detector arrays is approximately 96 cm3.
System7 total sensitivity for Am-241 is about half of System4 since it has similar detector and 3 mm thick tantalum mask is used with 50% of
the mask is open area.
Table 8. Experiment 1: Summary of the results of sensitivity in full-energy peaks
Experiment Description
Source
dose
rate,
nSv∙h-1
Sensitivity in full-energy peak, cpm/nSv∙h-1
System
3
System
1
System
4
System
8
System
5
System
6
System
7
System
2
E1M2
Cs-137
(662 keV) 175 0.2 0.9 6.4 1.3 ND NP NP ND
E1M4
Co-60
(1173+1333
keV) 805 NA 0.2 1.3 0.2 ND NP NP ND
NP – not participated
ND – no data
NA – not available

Report
2016 Technology Demonstration Workshop (TDW) on Gamma Imaging-External
Version Date: 2017-03-02
Version No.: 1
Department of Safeguards Page: 39 of 123
Table 9. Experiment 1: Comparison of detection and imaging sensitivity of Compton imagers
System1
Total
events,
cps
NET total
events, cps
Full-energy peak
events*, cps
Imaged
events, cps
Full-energy
peak/NET total
Imaged/Full-
energy peak
E1M1 BKG 11.7
E1M2 Cs-137 61.8 50.1 2.5 0.8 0.049 0.32
E1M4 Co-60 181.2 169.6 2.7 1.2 0.016 0.43
System4
Total
events,
cps
NET total
events, cps
Full-energy peak
events, cps
Imaged
events, cps
Full-energy
peak/NET total
Imaged/Full-
energy peak
E1M1 BKG 72.4
E1M2 Cs-137 450.8 378.4 18.8 1.9 0.050 0.10
E1M4 Co-60 1199.4 1127.0 17.8 1.6 0.016 0.09
* Cs-137 – events in 662 keV peak, Co-60 events in 1173 and 1333 keV peaks
Table 10. Experiment 1: Comparison of imaging efficiency of Compton imagers
E1M2
(Cs-137)
Imaged events
rate, cps
System1 0.8
System4 1.9
System5 7.2

Report
2016 Technology Demonstration Workshop (TDW) on Gamma Imaging-External
Version Date: 2017-03-02
Version No.: 1
Department of Safeguards Page: 40 of 123
5.2 Experiment 2: Overnight Localization
The goal of experiment E2M6 was to evaluate the capability of gamma-ray imagers to detect, identify
and localize:
a) relatively weak point gamma-ray sources of same radionuclide composition; and
b) Co-57 source masked by Compton continuum induced by Cs-137 sources.
The grid attached to the target screen, was used as a coordinate map. Each cell on the grid is 5 x 5 cm.
The notation [X, Y] was used for pointing positions of sources. Negative X number corresponds to a
shift to the left from [0, 0] coordinate with reference to gamma-ray imagers. Negative Y number
corresponds to a shift below the central point. For some measurements with complex set of sources a
photo is given; note that the photo is taken from behind the screen, so source location is mirrored from
the gamma cameras’ point of view.
Coordinates with reference to gamma-ray imagers (E2M6):
Cs-137 point sources at (0, 0), (6, 0), (10, 0), (3, -4), (0, 4.5)
Co-57 point source at (-5, -4) (position is marked by red circle)
U3O8 point source at (-1.5, -3)
Figure 29. Experiment 2: Photograph of overnight measurement setup with multiple sources. Note the results from each
camera will mirror the location of these sources.

Report
2016 Technology Demonstration Workshop (TDW) on Gamma Imaging-External
Version Date: 2017-03-02
Version No.: 1
Department of Safeguards Page: 41 of 123
5.2.1 Comparison of the results
Figure 30. System4 (E2M6): 1 hour of measurements in Compton mode, Co-57 and Cs 137 are identified; Cs 137 is imaged.
Figure 31. System1 (E2M6): 17 hours of measurement, Cs-137 is identified and imaged.
Co-57 peak is visible, but was not detected. Angular resolution does not allow separate Cs-137 sources
which however have different activities.

Report
2016 Technology Demonstration Workshop (TDW) on Gamma Imaging-External
Version Date: 2017-03-02
Version No.: 1
Department of Safeguards Page: 42 of 123
Figure 32. System3 (E2M6): 17 hours spectra in linear and logarithmic scale. Cs-137 is identified and peak in 120 – 130 keV
ROI is detected.
Figure 33 System3 (E2M6): 17 hours gamma-ray images from left to right (whole energy window – high energy window
600-800 keV and low energy window from 90-130 keV).
Relatively thin CZT detector (5mm), but with relatively large area (40x40mm) has improved signal to
background ratio at relatively low energies compared to thicker detector having same sensitive
volume. Energy resolution does not allow make definite conclusion about identification of Co-57,
however peak in 120 – 130 keV ROI is detected and low-energy source is imaged based on the low-
energy window.
Figure 34. System8 (E2M6): 1 hour gamma-ray image and spectrum of scan element.
Image area was automatically divided into 12 scan elements. Each scan element was measured for 300
seconds. Total measurement time was 1 hour. 300 seconds spectrum of scan element (03, 02) is
shown, Cs-137 is identified. Angular resolution does not allow separate Cs-137 sources which
however have different activities.

Report
2016 Technology Demonstration Workshop (TDW) on Gamma Imaging-External
Version Date: 2017-03-02
Version No.: 1
Department of Safeguards Page: 43 of 123
5.2.2 Summary of results
Table 11. Experiment 2: Summary of the results
Imager
Detected Identified Localized
Cs-137 Co-57 Cs-137 Co-57 Cs-137 Co-57
System3 Yes Yes Yes Yes** Yes Yes**
System1 Yes No Yes No Yes* No
System4 Yes Yes Yes Yes Yes* No
System8 Yes No Yes No Yes* No
System5 ND ND ND ND ND ND
System6 NP NP NP NP NP NP
System7 NP NP NP NP NP NP
System2 NP NP NP NP NP NP
* Hotspot is localized but sources are not separated
** Peak is identified in 120-130 keV region of interest and is localized not in 1 hour but in 17 hours of
acquisition
NP – not participated due to the late arrival to Seibersdorf
NA – not applicable for proximity imaging as dynamic measurements shall be done
ND – no data
Report
2016 Technology Demonstration Workshop (TDW) on Gamma Imaging-External
Version Date: 2017-03-02
Version No.: 1
Department of Safeguards Page: 44 of 123
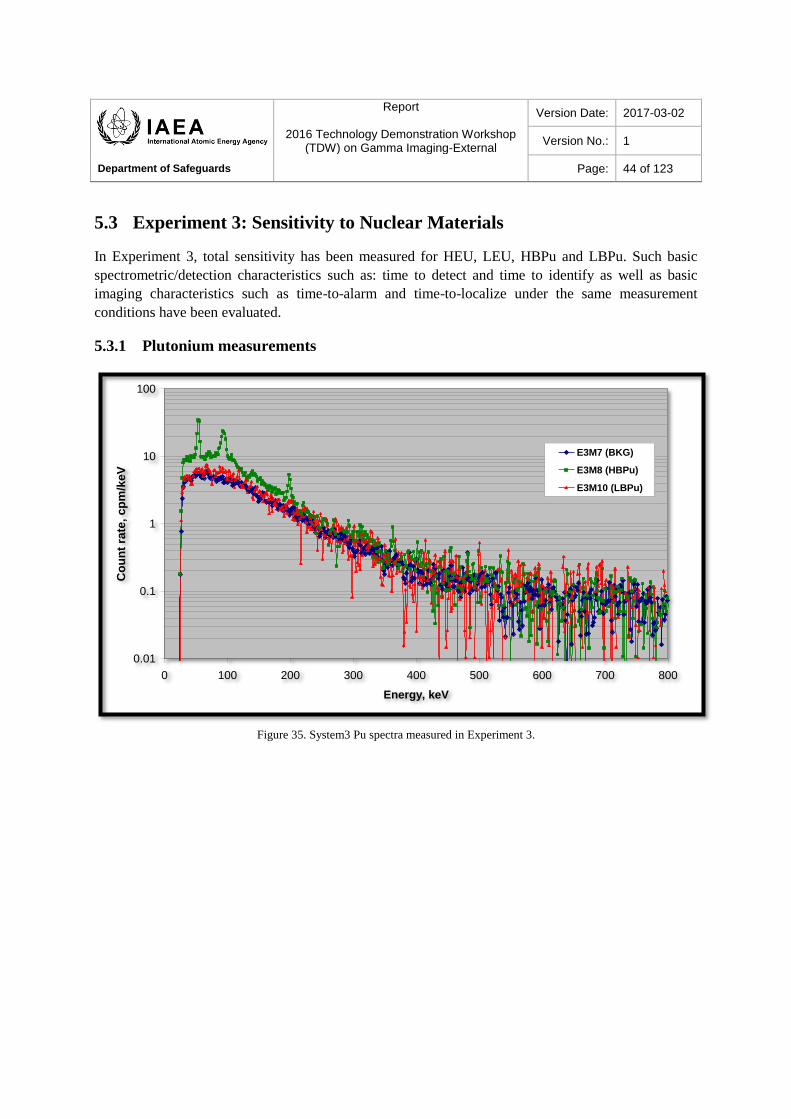
5.3 Experiment 3: Sensitivity to Nuclear Materials
In Experiment 3, total sensitivity has been measured for HEU, LEU, HBPu and LBPu. Such basic
spectrometric/detection characteristics such as: time to detect and time to identify as well as basic
imaging characteristics such as time-to-alarm and time-to-localize under the same measurement
conditions have been evaluated.
5.3.1 Plutonium measurements
Figure 35. System3 Pu spectra measured in Experiment 3.
HiSpect
0.01
0.1
1
10
100
0 100 200 300 400 500 600 700 800
Energy, keV
Co
un
t ra
te,
cp
m/k
eV
E3M7 (BKG)
E3M8 (HBPu)
E3M10 (LBPu)

Report
2016 Technology Demonstration Workshop (TDW) on Gamma Imaging-External
Version Date: 2017-03-02
Version No.: 1
Department of Safeguards Page: 45 of 123
Figure 36. System3 imaging results for Experiment 3 (plutonium)
Figure 37. System1 comparison of Pu spectra measured in Experiment 3.
Polaris-H
0.1
1
10
100
0 100 200 300 400 500
Energy, keV
Co
un
t ra
te, c
pm
/ke
V
E3M7 (BKG)
E3M8 (HBPu)
E3M10 (LBPu)

Report
2016 Technology Demonstration Workshop (TDW) on Gamma Imaging-External
Version Date: 2017-03-02
Version No.: 1
Department of Safeguards Page: 46 of 123
Figure 38. System1 imaging results for Experiment 3 (plutonium).
Based on the 208 keV peak, the image cannot be created by System1 due to properties of CdZnTe
detector material (relatively high density and atomic number of CZT crystal and therefore
predominance of full-energy absorption of photons with 208 keV energies). Plutonium source could be
imaged using 336 keV peak. For imaging purposes a fraction of events in full-energy peak is useful
(about 1/6).

Report
2016 Technology Demonstration Workshop (TDW) on Gamma Imaging-External
Version Date: 2017-03-02
Version No.: 1
Department of Safeguards Page: 47 of 123
Figure 39. System4 comparison of Pu spectra measured in Experiment 3.
Basic energy peaks of interest for imaging purposes are 208 keV (HBPu) and 414 keV (Pu-239).
Image can be created by System4 imager running in Compton mode. A fraction of events in 208 keV
full-energy peak can be imaged (about 1/10).
Figure 40. System4 imaging results for Experiment 3 (plutonium).
GeGI (Compton)
0.1
1
10
100
1000
10000
0 50 100 150 200 250 300 350 400 450 500
Energy, keV
Co
un
t ra
te,
cp
m/k
eV
E3M7 (BKG)
E3M8 (HBPu)
E3M10 (LBPu)

Report
2016 Technology Demonstration Workshop (TDW) on Gamma Imaging-External
Version Date: 2017-03-02
Version No.: 1
Department of Safeguards Page: 48 of 123
Figure 41. System4 imaging results for Experiment 3 (plutonium).
In measurement E3M8, the total balanced mask / anti-mask data for this run included two mask cycles
of 200 s duration, for a total of 400 s of data. This resulted in the false-color images shown in Figure
42. The histograms below and to the right of the image are the counts in the pixels under the horizontal
and vertical cursor lines, respectively. These together with the false color allow one to judge the
signal-to-noise ratio (SNR) in the image.
Figure 42. System7 false-color gamma-ray image from run E3M8.

Report
2016 Technology Demonstration Workshop (TDW) on Gamma Imaging-External
Version Date: 2017-03-02
Version No.: 1
Department of Safeguards Page: 49 of 123
In the image on the right all gamma-ray image pixels below 50% of the maximum are set clear to
allow one to see the overlay of the gamma-ray on the video data. This data was collected with the
widest field of view, which is considerably larger than the field of view of the video camera.
The total spectrum for the run is shown in Figure 43. As can be seen the spectrum is commensurate
with HBPu. This is evidenced by the weak 60-kev line from 241Am, prominent U K lines (around 100
keV) and the strong 208-keV line.
Figure 43. System7 total spectrum from run E3M8.
The system can also generate spectra from selected regions of the image and these are inherently
background subtracted (Figure 44).
Figure 44. System7 spectrum from the source region indicated by the false color overlay in the image on the right. The
whole-detector spectrum is shown in Figure 43 and is also plotted (blue).

Report
2016 Technology Demonstration Workshop (TDW) on Gamma Imaging-External
Version Date: 2017-03-02
Version No.: 1
Department of Safeguards Page: 50 of 123
The time to achieve a 50% alarm rate was just 3.5 s, while the 90% alarm time was reached in 6 s.
Measurement run E3M10 was similar to the E3M8, but obviously used a weaker source. There are a
total of 3 min. of balanced mask/anti-mask data. The log file from the run shows an alarm at 44 s. The
-ray image and spectra, which are now commensurate with 239Pu, are shown in Figure 53. The Pu ID
is based on the presence of the 375 and 414-keV lines and the absence of the 208-keV line. The
spectrum masked to the source shows only the K-shell lines and the 60 keV 241Am peak, the others are
lost in the noise.
Figure 45. System7 source image (left) and spectra (right) for run E3M10.
The median detection time is 91 s (4,970 counts) while 90% detection occurs just at the 10,000 count
limit for a time of 172 s.
Figure 46. System6 imaging results for Experiment 3 (plutonium).
Source is localized in measurement E3M8, basically due to strong low-energy emissions from Am-
241.

Report
2016 Technology Demonstration Workshop (TDW) on Gamma Imaging-External
Version Date: 2017-03-02
Version No.: 1
Department of Safeguards Page: 51 of 123
Figure 47. System8 imaging results for E3M9.
Measurement time of individual scan element was 50 seconds. Source is localized; Am-241 was
identified; however U-235 instead of Pu was identified. In E3M9 run the same source was used as in
E3M8 run.
Figure 48. System8 imaging results for E3M10
In measurement E3M10, the measurement time of individual scan element was 30 seconds. Source is
localized; however U-235 (186 keV) instead of Pu was identified.
Figure 49. System5 3D volumetric Compton imaging of plutonium and Cs-137 sources, workshop dynamic experiment.

Report
2016 Technology Demonstration Workshop (TDW) on Gamma Imaging-External
Version Date: 2017-03-02
Version No.: 1
Department of Safeguards Page: 52 of 123
System5 is based on CZT detectors. Low-energy imaging threshold for Compton mode of operation is
about 250 keV. This limits possibility of HEU and HBPu imaging. LEU and HEU sources could be
imaged based on 1001 keV spectral line and LBPu and HBPu sources could be imaged based on
spectral lines characteristic for Pu-239 (Figure 58). The green color map corresponds to the
reconstruction about the ROI around 414 keV (Pu-239), while the red color map corresponds to the
ROI around 662 keV (Cs-137).
5.3.2 Uranium measurements
The goal of measurement was to study capabilities of gamma-ray imagers to image non-complex
geometries of U sources. Experimental setup is illustrated on Figure 58. Such characteristics as time to
alarm and time to localize have been evaluated.
Figure 50. Experiment 3: Illustration of geometry of experimental setup for U measurements E3M12 (left) and E3M17 (right)

Report
2016 Technology Demonstration Workshop (TDW) on Gamma Imaging-External
Version Date: 2017-03-02
Version No.: 1
Department of Safeguards Page: 53 of 123
Figure 51. System3 comparison of U spectrum (E3M12) vs. background spectrum.
Figure 52. System3 imaging results for Experiment 3 (uranium).
HiSpect
0.01
0.1
1
10
100
0 100 200 300 400 500 600 700 800
Energy, keV
Co
un
t ra
te,
cp
m/k
eV
E3M7 (BKG)
E3M12 (LEU)

Report
2016 Technology Demonstration Workshop (TDW) on Gamma Imaging-External
Version Date: 2017-03-02
Version No.: 1
Department of Safeguards Page: 54 of 123
Figure 53. System1 comparison of U spectra measured in Experiment 3.
Based on 186 keV, the full-energy peak image can’t be created. 1001 keV peak (Pa-234m) cannot be
identified; measurement time was limited to 300 seconds, more long measurement needs to be
conducted.
Figure 54. System4 comparison of U spectra measured in Experiment 3.
Polaris-H
0.1
1
10
100
0 200 400 600 800 1000 1200
Energy, keV
Co
un
t ra
te,
cp
m/k
eV
E3M7 (BKG)
E3M12 (LEU)
E3M17 (HEU)
GeGI (Compton)
0.1
1
10
100
1000
10000
0 200 400 600 800 1000 1200
Energy, keV
Co
un
t ra
te,
cp
m/k
eV
E3M7 (BKG)
E3M12 (LEU)
E3M17 (HEU)

Report
2016 Technology Demonstration Workshop (TDW) on Gamma Imaging-External
Version Date: 2017-03-02
Version No.: 1
Department of Safeguards Page: 55 of 123
Figure 55. System4 imaging results in Compton mode for Experiment 3 (uranium).
Figure 56. System4 imaging results in pinhole mode for Experiment 3 (uranium).
Basic energy peak of interest for imaging purposes is 186 keV (U-235). Image can be created by
System4 in Compton mode. A fraction of full-energy peak events can be imaged (about 1/20).

Report
2016 Technology Demonstration Workshop (TDW) on Gamma Imaging-External
Version Date: 2017-03-02
Version No.: 1
Department of Safeguards Page: 56 of 123
1001 keV peak (Pa-234m) can be identified and as soon as certain N*sigma value is achieved LEU
could be categorized. 1001 keV peak in practice is not useful for imaging purposes unless 186keV and
204keV peaks are suppressed by a shield.
Imaging of plutonium and uranium in Compton mode is limited to localization of a source; a source
pattern cannot be correctly imaged.
During measurement E3 M12, the base distance is 260 cm and the information was provided that an
extended source could be expected. Based on this, the focal length was set to 7 cm, providing a
resolution of 7.46 cm with a pixel size of 3.73 cm. The image (Figure 65) shows an extended object
that is stronger at either end. This is likely two side-by-side point sources separated by just more than
the spatial resolution of the imager at this zoom.
Figure 57. System7 gamma-ray image obtained for E3M12.
Figure 58. System7 total spectrum and masked spectrum for E3M12.

Report
2016 Technology Demonstration Workshop (TDW) on Gamma Imaging-External
Version Date: 2017-03-02
Version No.: 1
Department of Safeguards Page: 57 of 123
The total spectrum (Figure 58) indicates the presence of enriched uranium (EU) with both the 186-keV
and 1-MeV lines visible. The masked spectrum has too few counts in the MeV line to generate reliable
enrichment information. Spectra obtained by masking the individual sources (Figure 59) shows that
they are both EU and of comparable magnitudes.
Figure 59. System7 masked spectra from the left and right sources compared to the entire source region for E3M12.
To determine the distance between the two point sources, a 2D Gaussian fit with the bounding box
between the two sources is used. This is not as good as having a function that fits 2 point sources
simultaneously. The net result is that the fit gives the centre of the right source at (20.48, 18.62) and
the left source at (16.18, 18.77) for an x-spacing of 4.3 pixels or 16.0 cm. Note that the result changes
linearly with the true distance to the image plane so any error in this number directly impacts the
results.
The 90% alarm event count is at 10,926 counts or 49 s. A look at the alarm location shows a wide
spread in x as one might expect given the distribution of the source. The x vs y plot shows 2 outliers
that are flagged as false alarms. Due to the extended source, valid alarm pixels cover a wide area.

Report
2016 Technology Demonstration Workshop (TDW) on Gamma Imaging-External
Version Date: 2017-03-02
Version No.: 1
Department of Safeguards Page: 58 of 123
Figure 60. System7 bootstrap results for E3M12.
Measurement E3M17 was at a source distance of 240 cm and used a 7-cm focal length for a spatial
resolution of 6.9 cm and a pixel size of 3.45 cm. There were some issues with starting the system, but
it still managed to record a total of 4 mask cycles of 200 s per cycle, for a total of 800 s of data. The
images (Figure 69) show a horizontal extended source. Note that with the imager offset from the
experimental centreline (estimated at 1 m) the almost 23° view angle will add some distortion and
clearly means any length estimate must be adjusted. The fact the system is at an angle (~ 23°) with the
centreline is clearly evident.
Figure 61. System7 images for measurement E3M17.

Report
2016 Technology Demonstration Workshop (TDW) on Gamma Imaging-External
Version Date: 2017-03-02
Version No.: 1
Department of Safeguards Page: 59 of 123
The spectra (Figure 70) are commensurate with EU. There is no evidence of the 1-MeV line, while
there is some evidence for the Th K-shell fluorescence lines. Trying different energy cuts does not
significantly enhance the image, but it does improve the calculated significance of some of the on-
source pixels.
Figure 62. System7 spectra for run E3M17.
While the image appears to be “hotter” on the left side, this is presumably an artifact of how the image
falls on the pixels, although the left side is also closer to the imager and there will be a small solid
angle effect as well. The alarming algorithm in the software is currently poorly suited to detect a
distributed source. It calculates an initial variance based on all of the pixels. Nevertheless, the system
did alarm while the data were being collected at 361 s after the data collection started. Using the event
rate for the run of 363 cps, the 50% alarm time was 268 s while the 90% alarm time was 551 s.

Report
2016 Technology Demonstration Workshop (TDW) on Gamma Imaging-External
Version Date: 2017-03-02
Version No.: 1
Department of Safeguards Page: 60 of 123
Figure 63. System3 imaging results for Experiment 3 (uranium).
Figure 64. System8 imaging results for E3M12 (left) and E3M17 (right).
Sources are localized but not separated (E3M12). Pitch between scan elements is 3.5° and U-235 is
identified. The extended source is localized (E3M17) and U-235 is identified.
5.3.3 Simultaneous U and Pu measurements
The goal of this experiment (E3M15) was to evaluate capabilities of gamma-ray imagers to localize U
and Pu sources simultaneously. Ability of imagers to separate U and Pu sources was studied.
Geometry of the measurements is described below and illustrated on Figure 65.
Geometry of measurements
Two LEU extended cylindrical sources with different thickness of the shielding; centres at (-2;
-1) and (2; -1); diameter of the sources is about 15 cm.
Point HBU Pu source at (0; 3)
Point LBU Pu source at (5; -2)
Empty box with the centre at (-6; -1)

Report
2016 Technology Demonstration Workshop (TDW) on Gamma Imaging-External
Version Date: 2017-03-02
Version No.: 1
Department of Safeguards Page: 61 of 123
Figure 65. Photograph of the geometry of measurements (E3M15)
Figure 66. System3 imaging results (E3M15)
Sources are localized, separated and identified in 22 seconds (left). Resulting image with the U source
in green and Pu source in white (right).
In System1 the 186 keV and 208 keV peals are identified, although it was not possible to get an image
in Compton mode of operation.

Report
2016 Technology Demonstration Workshop (TDW) on Gamma Imaging-External
Version Date: 2017-03-02
Version No.: 1
Department of Safeguards Page: 62 of 123
Figure 67. System6 imaging results (E3M15)
Two major sources are localized, but not separated (Figure 67). Availability of spectrometric
information would be helpful in terms of sources separation based on ROIs.
Sources are localized (Figure 68) and separated based on the analysis of spectra (Figure 68 and Figure
69).
Figure 68. System8 imaging results (E3M15)
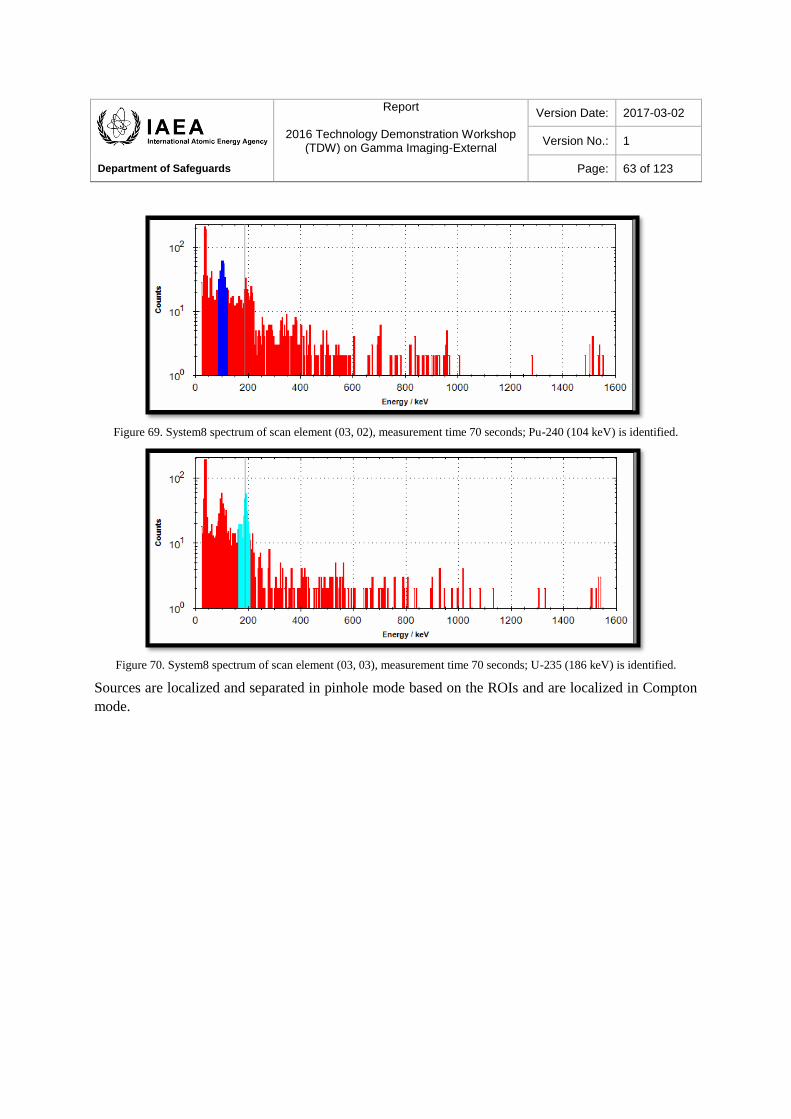
Report
2016 Technology Demonstration Workshop (TDW) on Gamma Imaging-External
Version Date: 2017-03-02
Version No.: 1
Department of Safeguards Page: 63 of 123
Figure 69. System8 spectrum of scan element (03, 02), measurement time 70 seconds; Pu-240 (104 keV) is identified.
Figure 70. System8 spectrum of scan element (03, 03), measurement time 70 seconds; U-235 (186 keV) is identified.
Sources are localized and separated in pinhole mode based on the ROIs and are localized in Compton
mode.

Report
2016 Technology Demonstration Workshop (TDW) on Gamma Imaging-External
Version Date: 2017-03-02
Version No.: 1
Department of Safeguards Page: 64 of 123
Figure 71. System4 imaging results (E3M15)
The results (Figure 72) clearly show two distinct sources, a point source near the top of the image with
a HB Pu spectrum and an extended disc with an EU spectrum (Figure 73).
Figure 72. System7 Gamma-ray image for run E3M15. Measurement time 600 seconds.

Report
2016 Technology Demonstration Workshop (TDW) on Gamma Imaging-External
Version Date: 2017-03-02
Version No.: 1
Department of Safeguards Page: 65 of 123
Figure 73. System7 Spectra from the two source regions in the image E3M15

Report
2016 Technology Demonstration Workshop (TDW) on Gamma Imaging-External
Version Date: 2017-03-02
Version No.: 1
Department of Safeguards Page: 66 of 123
Table 12. Experiment 3. Summary of the results: total sensitivity
Experiment
Source
Source dose
rate, nSv∙h-1
Total sensitivity, cpm/nSv∙h-1
System1 System3 System4 System8 System6 System7 System5 System2
E3M8 HBPu 20 33.2 45.9 600.4 28.7 15.0 258.0 ND 0.21
E3M10 LBPu 10 4.2* 13.8 174 17.8 2.4 90.0 ND 0.06
E3M12 LEU 20 59.8 81.9 1001.9 44.8 ND 570.0 ND 0.81
E3M17 HEU 40 51.1 62.0 793.6 26.3 ND 480.0 ND ND
* Data are representative only as imager was shielded by somebody standing in front.
ND – no data
Table 13. Experiment 3. Summary of the results: sensitivity in full-energy peaks
Experiment Source (peak energy)
Source dose
rate, nSv∙h-1
Sensitivity in full-energy peak*, cpm/nSv∙h-
1
System1 System3 System4
E3M8 HBPu (208 keV) 20 2.3 1.4 12.5
E3M12 LEU (186 keV) 20 15.5 9.6 87.8
* Sensitivity was calculated substracting background in the ROI corresponding to the full-energy peak. For CZT-based gamma-ray imagers
width of ROIs was 20 keV, for HPGe-based gamma-ray imager width of ROIs was 5 keV.

Report
2016 Technology Demonstration Workshop (TDW) on Gamma Imaging-External
Version Date: 2017-03-02
Version No.: 1
Department of Safeguards Page: 67 of 123
Table 14. Experiment 3. Summary of the results: time to alarm /identify /localize (in seconds)
Measurement
Imager
E3M8 E3M10 E3M12 E3M17 E3M15
HBPu LBPu 2 x LEU MTR plate U+Pu
TTA TTI TTL TTA TTI TTL TTA TTI TTL TTA TTI TTL TTA TTI TTL
System3 12 54 60 300 300 300 7 7 30** 15 20 32** 8 8 22**
System1 252 252 600 NR NR NR 12 12 NR 18 18 NR 72 468 NR
System4 3 3 38 48 48 290 0.1 0.1 7 1 1 12 0.1 0.1 5
System8 200 200 200 270 270 270 540 540 540 810 810 810 1660 1660 1660
System5 ND ND ND ND ND ND ND ND ND ND ND ND ND ND ND
System6 ND NA 100 ND NA NR ND NA 60* ND NA 70* ND NA 1800*
System7 6 6 6 86 86 86 47 47 47** 551 551 551** 200 200 200**
* Source geometry is visible
** Source geometry is clear
NA – not applicable, no spectrum available
NR – not reached within measurement time
ND – no data
TTA – time to alarm
TTI – time to identify
TTL – time to localize

Report
2016 Technology Demonstration Workshop (TDW) on Gamma Imaging-External
Version Date: 2017-03-02
Version No.: 1
Department of Safeguards Page: 68 of 123
System3
Time to alarm is determined from gamma-ray image. As soon as signal value (in pre-defined energy
range) in any imaged pixel exceeds mean signal value calculated from all imaging pixels for certain
threshold, an alarm is generated. Time to identify, is determined from cross-comparison of amplitudes
of radiation signal in pre-defined ROIs, which correspond to full-energy absorption peaks. In case, if
the amplitude of signal in one of the ROIs is clearly higher than in the others, an identification flag is
raised. Identification cannot be triggered in case, if alarm flag was not raised. Time to localize is
determined from gamma-ray image. As soon as mean signal value (in pre-defined energy range) in the
cluster of imaged pixels exceeds mean signal value calculated from all imaging pixels for certain
threshold, a localization flag is raised.
System1
Time to identify is determined from spectrum. In case if the net full-energy absorption peak area
exceeds background area under the peak for certain N-sigma value, identification is made. Time to
localize was reached in E3M8 and was determined visually based on the contrast of gamma-ray image,
which however had some artefacts. In E3M15 185.7 keV peak was identified in 72 seconds and 208
keV peak in 468 seconds.
System4
Time to identify is determined from spectrum. In case, if the net full-energy absorption peak area
exceeds background area under the peak for 8-sigma identification is made. Time to localize was
determined visually depending on the contrast of gamma-ray image. Background calculations are
performed by averaging the counts in windows on the low side and high side of a peak. The average of
these counts multiplied by number of peak channels is subtracted from total peak area in order to
obtain the net peak value. N-sigma value could be adjusted by operator. Time to alarm is equal to time
to identify and not linked to imaging data. Values are reported for Compton mode of imager operation.
Extended sources geometries were not clear.
System8
Actual time required to scan area of interest is reported. From one side value could be improved
making shorter scans; from the other side measurement time could be increased in case if better
angular resolution is needed.
System6
Time to localize was determined visually depending on the contrast of gamma-ray image.
System7
Time to alarm is determined from gamma-ray image. As soon as signal value (in the whole energy
range) in any imaged pixel exceeds mean signal value calculated from all imaging pixels for 5-sigma,
an alarm is generated. Values reported in the table correspond to 0.9 probability of alarm at 0.95
confidence level. Extended sources geometry at alarm time in all cases was clear. To generate a
gamma-ray image more energy windows could be defined by the operator and each could have up to 3

Report
2016 Technology Demonstration Workshop (TDW) on Gamma Imaging-External
Version Date: 2017-03-02
Version No.: 1
Department of Safeguards Page: 69 of 123
ROIs. Alarm comparisons could be made for each energy window and N-sigma value could be
adjusted by the operator. As soon as a high-resolution spectrum of each imaged pixel is available, the
time for the operator to identify is within TTL.

Report
2016 Technology Demonstration Workshop (TDW) on Gamma Imaging-External
Version Date: 2017-03-02
Version No.: 1
Department of Safeguards Page: 70 of 123
5.4 Experiment 4 and 5: Angular Resolution
5.4.1.1 Angular resolution – same radionuclides
The goal of this experiment was to measure angular resolution. 2 Am-Li sources having similar
activity were used. Distance between sources for the measurements M19, M20, M21 and M22 was 50,
30, 20 and 10 cm correspondingly. Sources were placed symmetrically with reference to the centre of
the screen and distance from the screen to the rack populated with gamma-ray imagers was 4 m. The
geometry of measurements is illustrated on the Figure 74 and is defined in Figure 75. Sources had
cylindrical shape.
Figure 74. Illustration of the geometry of angular resolution measurements. Distance between two Am-Li sources is 50 cm.
Figure 75. E4/5M19 – E4/5M22, geometry of measurements, dimensions are in centimetres.
For the measurements M23, M24 and M25 screen was moved to the side, so the centre of the screen
was 1 meter away from the centre of the field of view of gamma-ray imagers. Distance between
sources was 10, 20 and 30 cm correspondingly. Dependence of angular from the field of view was
qualitatively studied.
Results of measurements of angular resolution under measurements E4/5M19–E4/5M22 are
summarized in Table 15. Resulting images for measurements E4/5M19–E4/5M25 are shown on the

Report
2016 Technology Demonstration Workshop (TDW) on Gamma Imaging-External
Version Date: 2017-03-02
Version No.: 1
Department of Safeguards Page: 71 of 123
Figure 76-Figure 80. Results of comparison of sensitivity under measurements M22 and M23 for
System3 and System7 are summarized in Table 16.
Table 15. Experiment 4 and 5: Angular resolution. Summary of the results
Imager
Measured angular resolution, degrees
E4/5M19 – E4/5M22
2 x Am-Li sources
System3 2.9
System1 NA
System4 4.3
System8 4.3
System5 NA
System6 4.3
System7 1.4

Report
2016 Technology Demonstration Workshop (TDW) on Gamma Imaging-External
Version Date: 2017-03-02
Version No.: 1
Department of Safeguards Page: 72 of 123
Figure 76. System3 imaging results (E4/5M19 – E4/5M25)
Angular resolution is 2.9 degrees (20 cm distance between sources) for the sources in the centre of the
field of view and 4.3 degrees (30 cm distance between sources) for the sources moved for 1 meter out
from the centre of the field of view.

Report
2016 Technology Demonstration Workshop (TDW) on Gamma Imaging-External
Version Date: 2017-03-02
Version No.: 1
Department of Safeguards Page: 73 of 123
Figure 77. System7 imaging results (E4/5M19 – E4/5M24)
Angular resolution is 1.4 degrees (10 cm distance between sources) for the sources in the centre of the
field of view and 2.9 degrees (20 cm distance between sources) for the sources moved for 1 meter
away from the centre of the field of view.
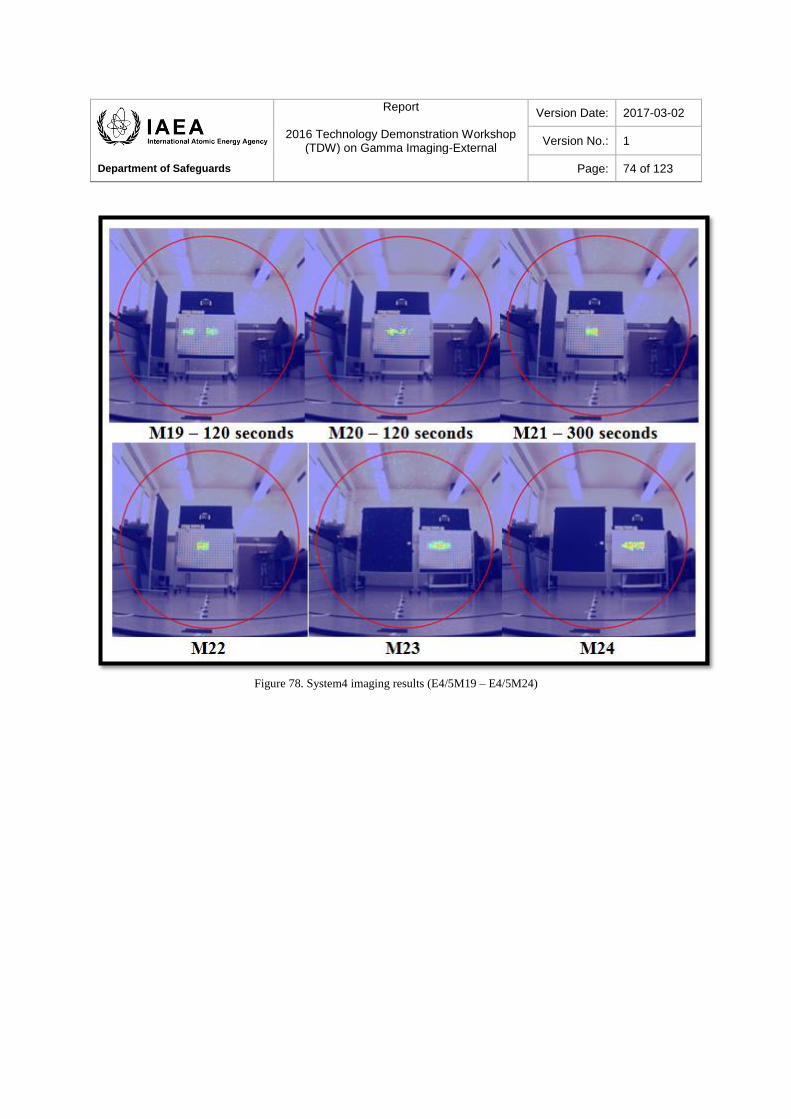
Report
2016 Technology Demonstration Workshop (TDW) on Gamma Imaging-External
Version Date: 2017-03-02
Version No.: 1
Department of Safeguards Page: 74 of 123
Figure 78. System4 imaging results (E4/5M19 – E4/5M24)

Report
2016 Technology Demonstration Workshop (TDW) on Gamma Imaging-External
Version Date: 2017-03-02
Version No.: 1
Department of Safeguards Page: 75 of 123
Figure 79. System6 imaging results (E4/5M19 – E4/5M21)
Figure 80. System6 imaging results (E4/5M19 and E4/5M21)
Table 16. Comparison of sensitivity for measurements M22 and M23
Count rate, cps Ratio
Imager M22 M23 M22/M23
System3 499 278 1.82
System7 12727 8937 1.42

Report
2016 Technology Demonstration Workshop (TDW) on Gamma Imaging-External
Version Date: 2017-03-02
Version No.: 1
Department of Safeguards Page: 76 of 123
For System7, a 40% decrease in sensitivity was partly associated with an increase of distance to the
sources as imager was positioned at an angle to the target screen and sources for measurement M23
were moved to the opposite corner.
For System3, an 80% decrease in sensitivity is related to the drop of sensitivity across field of view. In
M22 measurement sources were in the centre of the field of view (FOV) and in M23 measurement
sources were close to the edge of the FOV.
5.4.1.2 Angular separation – different radionuclides
In terms of angular resolution ability to separate different radionuclides, is an inherent property of
Compton imagers as imaging is made based on full-energy peak events. For coded-aperture imagers
ability to separate different radionuclides could be enhanced creating images based on the different
ROIs characteristic for these radionuclides.
In measurements E4/5M26 - E4/5M28 unshielded Cs-137 and shielded Co-60 sources were used.
Geometry of measurements is described in Table 17 and illustrated on Figure 81.
Table 17. Experiment on Angular separation, geometry of measurements
Measurement Description of experimental setup Distance between
sources, cm
E4/5M26 Cs-137 point source at (-2; -1)
Shielded Co-60 source at (2; -1)
20 (X-axis)
E4/5M27 Shielded Co-60 source at (-2; -1)
Cs-137 point source at (4; -1)
30 (X-axis)
E4/5M28 Shielded Co-60 source at (0; -1)
Cs-137 point source directly on it, at (0; 0)
5 (Y-axis)
Figure 81. Angular separation, illustration of experimental setup.
Imaging results are shown in Figure 82- Figure 92.

Report
2016 Technology Demonstration Workshop (TDW) on Gamma Imaging-External
Version Date: 2017-03-02
Version No.: 1
Department of Safeguards Page: 77 of 123
Figure 82. System3 imaging results for E4/5M26-E4/5M28.
Figure 83. System1 imaging results for E4/5M26

Report
2016 Technology Demonstration Workshop (TDW) on Gamma Imaging-External
Version Date: 2017-03-02
Version No.: 1
Department of Safeguards Page: 78 of 123
On the Figure below 3D diagrams of intersections of Compton cones are shown for Cs-137 and Co-60.
Localization of Co-60 is more precise since 3D peak is sharper (better FWHM). This could be
attributed to better space separation of the events at higher energies.
Figure 84. System1, 3D Diagrams of Compton cones intersections for E4/5M26; Cs-137 (left), Co-60 (right)
Figure 85. System1 imaging results for E4/5M27 and E4/5M28
Measurement run E4/5M26 used isotopes with emissions at or above the upper end of the imaging
energy range for this instrument. The spectrum indicates the presence of 137Cs and 60Co and at the
emission energies of these isotopes both the 1-cm-thick Ge and the 3-mm-thick Ta mask become
relatively transparent. Nevertheless data were collected and reveal a source at (20.0, 18.1) (Figure 86).
For this run the focal length was set to 12 cm giving a spatial resolution of 7.57 cm and a pixel size of
3.78 cm.
Cutting on the weak 662-keV line reveals a weak source with a 3.8 sigma significance. It is to the left
of the other source and can be made somewhat more significant (5.5 sigma) by using all of the energy
in the 662-keV peak plus the data from 100 keV up to the bottom of the 662-keV Compton edge at
486 keV (Figure 87).

Report
2016 Technology Demonstration Workshop (TDW) on Gamma Imaging-External
Version Date: 2017-03-02
Version No.: 1
Department of Safeguards Page: 79 of 123
Figure 86. System7 gamma-ray image (left) made from the entire gamma-ray spectrum (right) from run E4/5M26.
Figure 87. System7 E4/5M26 (Left) image cut on the Cs-137 photopeak, and (right) the image including the photopeak plus
energy below the base of the Compton edge at 486 keV.
Measurement E4/5M27 run was the same basic configuration as the last one. However, with the time
pressure between running the system, logging results, and getting video images, the system was only
able to complete 3 full mask/anti-mask cycles for 3 minutes of data. That said, the overall spectrum
looks very similar with clear photopeaks from 137Cs and 60Co. There is again a single source evident in
the total image (13.2, 17.9) and it looks to be at approximately the location of the 137Cs source last
time.

Report
2016 Technology Demonstration Workshop (TDW) on Gamma Imaging-External
Version Date: 2017-03-02
Version No.: 1
Department of Safeguards Page: 80 of 123
Figure 88. System7 gamma-ray image and spectrum from run E4/5M27.
Placing a tight cut on the 662-keV line does not reveal a single source location. This is not surprising
given that there is only three-fourths of the data available last time. Taking the full spectral band
below the Compton edge, plus the 662-keV peak does accentuate a second region to the right of the
source (approximately where the 60Co was located last time). A fit to the right region gives a location
of (21.6, 16.8) for a source separation of 31.8 cm (33.7 with angular correction) with an uncertainty
that has to be at least one pixel (3.8 cm).
Figure 89. System7 gamma-ray image obtained using an energy window optimized for Cs 137.

Report
2016 Technology Demonstration Workshop (TDW) on Gamma Imaging-External
Version Date: 2017-03-02
Version No.: 1
Department of Safeguards Page: 81 of 123
Figure 90. System4 imaging results for E4/5M26 and E4/5M27.
Figure 91. System6 imaging results E4/5M26 (left) and E4/5M27 (right)
For dynamic measurements, different geometry and less strong sources were used. Results of
Volumetric Compton imaging are shown on Figure 92. Imaging results are followed by the comments
from participants.

Report
2016 Technology Demonstration Workshop (TDW) on Gamma Imaging-External
Version Date: 2017-03-02
Version No.: 1
Department of Safeguards Page: 82 of 123
Figure 92. System5 real-time volumetric imaging results, two sources of different composition.
3D model is plotted in grayscale, while the gamma-ray source distributions are given by the colored
maps: red for Cs-137 and blue for Co-60. ROI around 662 keV reconstructs a horizontal spread of
sources near the top of the target screen board. One interesting result from this measurement is the Co-
60 reconstruction, which identifies a hot spot near the black container. From subsequent
measurements, we know this is the container in which the Co-60 source is transported. This result
suggests the source may be present here as well, though if so, it must be heavily shielded. In a true
unguided-search scenario, such a result could prompt an inspector to investigate the container. This
result demonstrates the value of mobile imaging systems, which are able to overcome inverse
r-squared and use proximity to increase the sensitivity of the imaging system.

Report
2016 Technology Demonstration Workshop (TDW) on Gamma Imaging-External
Version Date: 2017-03-02
Version No.: 1
Department of Safeguards Page: 83 of 123
5.5 Experiment 6: Extended Source
The goal of the experiment was to evaluate the capability of gamma-ray imagers to image detailed
pattern of extended source distributed across wide area. 12 MTR plates were used to create basic
geometry illustrated in Figure 93. In addition, point U sources were hidden behind target screen in the
top and many high-energy point sources were added randomly. Geometry of measurements was not
disclosed to the participants. Many high-energy sources had weak activity and it was not possible to
image them.
Figure 93. Photograph of the geometry of measurements for E6M31.
Basic source geometry is imaged based on 150-200 keV (U-235) ROI. Source geometry is not clear
(Figure 94).
Figure 94. System3 imaging results for E6M31 – 11000 seconds.

Report
2016 Technology Demonstration Workshop (TDW) on Gamma Imaging-External
Version Date: 2017-03-02
Version No.: 1
Department of Safeguards Page: 84 of 123
Detailed extended source patter has been imaged (Figure 95) along with 3 point sources localized at
the top of the screen (Figure 96).
Figure 95. System7 wide field of view (left) and zoom image (right) for E6M31.
The line-out of intensity below the horizontal cursor shows a structure commensurate with 3 point
sources of increasing strength from left to right. A spectrum from the peak pixel along the cursor is
shown for each source, clearly showing each is EU. Examination of the high-energy portion of the
spectrum shows no evidence of the 1-MeV line from 238U daughters, indicating that this either very
new low enriched 235U, or it is highly enriched.
Figure 96. System7 video / gamma overlay image (left) and related spectra (right) for top sources of zoom-run E6M31. The
mid and right spectra have been offset vertically by 500 and 1000 counts, respectively, to improve clarity.
Image in pinhole mode of operation (Figure 106) is generated based on 185.7 keV peak. Measurement
time was 3605 seconds and 3721 events are imaged. Basic source geometry is clear.

Report
2016 Technology Demonstration Workshop (TDW) on Gamma Imaging-External
Version Date: 2017-03-02
Version No.: 1
Department of Safeguards Page: 85 of 123
Figure 97. System4 (pinhole) imaging results for E6M31.
Image in Compton mode (Figure 107) is generated based on 185.7 keV (left), 661.6 keV (mid.) and
1173.2 keV (right) full-energy peaks. Measurement time was 5116 seconds. Images in inverted RGB
color scheme are shown to improve contrast. Cs-137 and Co-60 sources are separated.
Figure 98. System4 imaging results in Compton mode for E6M31.
Images based on integral count rate (left) and on count rate in 185.7 keV peak (right) are shown on the
Figure 99. 26x14 scans x 15 seconds were made.
Figure 99. System8 imaging results for E6M31.

Report
2016 Technology Demonstration Workshop (TDW) on Gamma Imaging-External
Version Date: 2017-03-02
Version No.: 1
Department of Safeguards Page: 86 of 123
In this experiment to generate image (Figure 100) a mask was used. Data collected is near background
/ uniform activity levels. The use of other masks may have improved the collected data. System6
overheated after 21% of the acquisition time and automatically shut down.
Figure 100. System6 imaging results for E6M31.
System1 was only able to image high-energy sources. Cs-137 sources are separated and Co-60
sources are not separated (Figure 101Error! Reference source not found.).
Figure 101. System1 imaging results for E6M31.

Report
2016 Technology Demonstration Workshop (TDW) on Gamma Imaging-External
Version Date: 2017-03-02
Version No.: 1
Department of Safeguards Page: 87 of 123
Table 18. Experiment 6: Summary of measurements results
Imager Extended source (pattern
from MTR plates)
Uranium point
sources (at the top)
Cs-137 and Co-60
point sources
System3 Source area is correctly
defined, missing part is not
visible, detailed geometry is not
clear
Not localized Cs-137 sources are
localized but not
separated
Co-60 sources do not
localized
System1 Source area is not defined Not localized Co-60 sources are
localized and
separated
Cs-137 sources are
localized but not
separated
System 3
(Compton)
Source area is correctly
defined, missing part is not
visible, detailed geometry is not
clear
Sources are not
localized
Sources are localized
and separated
System4
(Pinhole)
Source area is correctly
defined, missing part is visible,
detailed geometry is not clear
Sources are localized
but not separated
Not localized
System8 Source area is correctly
defined, missing part is visible,
detailed geometry is not clear
Area was not scanned Not localized
System5 NP NP NP
System6 Source area is not defined Not localized Not localized
System7 Source area is correctly
defined, missing part is visible,
detailed geometry is clear
Sources are localized
and separated
Not localized

Report
2016 Technology Demonstration Workshop (TDW) on Gamma Imaging-External
Version Date: 2017-03-02
Version No.: 1
Department of Safeguards Page: 88 of 123
5.6 Experiment 7a: False Alarm Rate
Overnight measurement (E7M37) was made without sources placed behind target screen. Information
about presence (or absence) of sources was not disclosed to participants. The results are shown in the
following figures.
For System8, the scan area was divided into 20 x 17 scan elements with a pitch 1.0°. Measurement
time of each scan element was 170 seconds. Imaging results are shown in Figure 102.
Figure 102. System8 imaging results for E7M37
System1 produced the following spectrum in approximately 17 hours of measurements (Figure 103).
Nothing apart from K-40 and Radon daughters (Pb-214 and Bi-214, peaks are marked by “unknown”)
was detected.
Figure 103. System1 spectrum results for E7M37
Overnight measurements were made in Compton mode of imager operation. Total measurements time
was about 16 hours. U-235 was identified in the spectrum on the 3rd hour and localized on the 12th

Report
2016 Technology Demonstration Workshop (TDW) on Gamma Imaging-External
Version Date: 2017-03-02
Version No.: 1
Department of Safeguards Page: 89 of 123
hour (Figure 104). In the result of examination of localization image in scientific operator window
(Figure 105, it is clear that source distribution is diffused all around imager.
Figure 104. System4 spectrum results and image for E7M37
Figure 105. System4 resulting image in a different viweing mode for E7M37
System3 did not detect anything in the spectrum and there was no alarm on the image.
A total of 16 one-hour-long dwell periods were used. There is nothing obvious in the normalized
image (Figure 106). A look at the low energy part of the spectrum (Figure 107) shows what appears to
be a weak 186-keV line. There is no evidence of the 1-MeV line from 238U daughters, nor is there
evidence of Pu. A spectral cut on the 186-keV line (184-188 keV) reveals a hot spot with a
significance of 4.6 sigma, which is below the normal alarm threshold.

Report
2016 Technology Demonstration Workshop (TDW) on Gamma Imaging-External
Version Date: 2017-03-02
Version No.: 1
Department of Safeguards Page: 90 of 123
Figure 106. System7 measurement run E7M37; Total image (left) and images cut on the 186 keV line (center and right).
Figure 107. System7 spectrum for E7M37

Report
2016 Technology Demonstration Workshop (TDW) on Gamma Imaging-External
Version Date: 2017-03-02
Version No.: 1
Department of Safeguards Page: 91 of 123
5.7 Experiment 7b: High Background
The goal of experiment was to evaluate ability of gamma-ray imagers to localize source masked by
other sources of similar composition (E7M32) and to localize Pu source masked by high-energy Co-60
source located in the field of view (E7M35) and behind gamma-ray imagers (E7M36). Results are
shown in the figures below.
Geometry of measurements is illustrated on the Figure 108 and experimental setup is described in
Table 19 below.
Figure 108. E7M32 – geometry of measurements (left), CBNM Pu84 source geometry (right)
Table 19. Description of experimental setup for E7M32
Position of source Description of source type Notes
HBPu source at (0; 0) Steel cover towards gamma-ray
imagers
CBNM Pu64 source
Weak 59.5 keV emission in
direction towards gamma-ray
imagers
HBPu source at (-5; 0) Entrance window with plastic
cover towards gamma-ray
imagers
CBNM Pu70 source
Strong 59.5 keV emission in
direction towards gamma-ray
imagers
LBPu source at (5; 0) Steel cover towards gamma-ray
imagers
CBNM Pu82 source
LBPu source at (0; -6) Entrance window with plastic
cover towards gamma-ray
imagers
CBNM Pu93 source
One of the sources used in this run had a fairly high rate and there were some issues in getting
System7 started. This was resolved by using energy cuts to exclude the intense 60-keV line from the
on-line image generation. For this configuration, the source-to-detector distance was 280 cm and focal
length of 5 cm was used for a resolution and pixel size of 9.74 cm and 4.87 cm, respectively. A total of
4 60-s cycles of data were recorded and the final, normalized image is shown in Figure 109. From the
video / gamma overlay image, it is clear that the imager aim was not optimal.

Report
2016 Technology Demonstration Workshop (TDW) on Gamma Imaging-External
Version Date: 2017-03-02
Version No.: 1
Department of Safeguards Page: 92 of 123
Figure 109. System7 E7M32 full-energy range image.
Figure 110. System7 total spectrum obtained from run E7M32.
Looking at the spectrum (Figure 110) there is clearly some Pu present. Based on the 208-keV line,
some of this is from a HB source. If one looks at the spectra from the two obvious sources, then one
sees that the weaker source has no 208-keV emissions. In fact, there are only 6 counts in the 208-keV
line from that source region. On the other hand, the bright source has 337 counts for 569,824, 60-keV
counts. The weak source has 98,961 60-keV counts so that one might expect 58 counts in the 208-keV
peak. The uncertainty in counts per pixel in the peak ROI is 5.3 cnts so one would expect to see more
events. In addition, if one generates an image based on a ROI for the 208-keV line, then a third source
to the right of the strong peak and above the weak peak appears (Figure 111).

Report
2016 Technology Demonstration Workshop (TDW) on Gamma Imaging-External
Version Date: 2017-03-02
Version No.: 1
Department of Safeguards Page: 93 of 123
Figure 111. System7 image showing the location of the “hidden” source (left), and the spectra from the three different
sources (right) from run E7M32.
This source has 197 208-keV counts with 27,607 counts in the 60-keV line indicating that the isotope
responsible for the 208-keV line is present in greater abundance. All three sources do show K lines
from Pu, although the mid-strength source has the weakest relative emissions from these lines.
The source locations are (5.16, 27.54), (10.92, 34.86), and (10.70, 27.93) for the strong, weak, and
hidden sources, respectively. Assuming that the hidden source is in line with the strong and the weak
sources this gives an x separation between the sources of 29.0 cm and a y separation of 36.2 cm; both
after correction for angular projection.
Figure 112. System3 resulting image with the strong Am-241 source in white and the weak Pu source in blue (E7M32)

Report
2016 Technology Demonstration Workshop (TDW) on Gamma Imaging-External
Version Date: 2017-03-02
Version No.: 1
Department of Safeguards Page: 94 of 123
Figure 113. System6 resulting image for E7M32
Figure 114. System4 resulting image for E7M32
Figure 115. System8 resulting image for E7M32
The next set of figures is from the results received from measurements E7M35 and E7M36.
Two sources Pu (red) and Co-60 (green) are identified in 14 seconds and localized in 40 seconds
(Figure 116).

Report
2016 Technology Demonstration Workshop (TDW) on Gamma Imaging-External
Version Date: 2017-03-02
Version No.: 1
Department of Safeguards Page: 95 of 123
Figure 116. System3 resulting image for E7M35.
Pu source is identified (14 seconds) and localized in 140 seconds (Figure 117). Artifacts coming from
Co-60 outside field of view are removed when image is built on a limited range (40-220keV).
Figure 117. System3 full range image (left) and 40-220keV image (right) for E7M36
Figure 118. System6 imaging results for E7M35 (left) and E7M36 (right)

Report
2016 Technology Demonstration Workshop (TDW) on Gamma Imaging-External
Version Date: 2017-03-02
Version No.: 1
Department of Safeguards Page: 96 of 123
In the first scan conducted by System8, under E7M35, a Pu source was localized near localization
threshold (blue square left image in Figure 119), so second scan was made to confirm localization of
the source (red square right image in Figure 119).
Figure 119. System8 imaging results for E7M35; first scan (left) second scan (right)
In E7M35 experiment (Figure 120) Pu source was imaged based on Am emissions in pinhole mode
(left) and Co-60 source was imaged in front of gamma-ray imager in Compton mode (right).
Measurement time was 600 seconds.
Figure 120. System4 imaging results for E7M35
In E7M36 experiment (Figure 121) Pu source was imaged based on Am emissions in pinhole mode
(left) and Co-60 source was imaged behind gamma-ray imager in Compton mode (second
hemisphere). Measurement time was 600 seconds.

Report
2016 Technology Demonstration Workshop (TDW) on Gamma Imaging-External
Version Date: 2017-03-02
Version No.: 1
Department of Safeguards Page: 97 of 123
Figure 121. System4 imaging results for E7M36
Gamma-ray images from run E7M35 are shown on the Figure 132. Left image is based on all energies,
middle on spectral cuts for HBPu (58-62, 98-106, and 207-210 keV), and right on spectral cut for Co-
60 (above 500 keV).
Figure 122. System7 imaging results for E7M35
Gamma-ray images from run E7M35 are shown on the Figure 123. The image on the left uses all of
the data while the one on the right is generated with data in ROIs commensurate with the HBPu
source. (58-62, 98-106, and 207-210 keV). This clearly improves the contrast.

Report
2016 Technology Demonstration Workshop (TDW) on Gamma Imaging-External
Version Date: 2017-03-02
Version No.: 1
Department of Safeguards Page: 98 of 123
Figure 123. System7 imaging results for E7M36
Figure 124 shows total spectrum (left) and the low energy portion of the total spectrum compared to
the spectrum from the source region of the image (right).
Figure 124. System7 spectrometric results for E7M36.

Report
2016 Technology Demonstration Workshop (TDW) on Gamma Imaging-External
Version Date: 2017-03-02
Version No.: 1
Department of Safeguards Page: 99 of 123
Table 20. Summary of measurements results for Experiment 7.
Imager CBNM Pu sources Pu source masked by Co-60
System4
(pinhole)
Two Pu sources are localized
based on Am-241 emissions
Target source is localized in both cases
System5 NP NP
System3 Two Pu sources are localized,
one based on Am-241
emissions and second one based
on Pu emissions
Target source is localized in both cases
System6 Two Pu sources are localized
based on Am-241 emissions
Target source is localized in both cases
System7 Three Pu sources are localized
and separated based on Pu
emissions
Target source is localized in both cases
System1 NP NP
System8 Major source is localized, other
sources may present more
detailed scan is needed
Target source is localized in both cases,
additional scan was made

Report
2016 Technology Demonstration Workshop (TDW) on Gamma Imaging-External
Version Date: 2017-03-02
Version No.: 1
Department of Safeguards Page: 100 of 123
5.8 Experiment 8a: Angular Resolution for Extended Sources
The following figures illustrate the results for gamma-ray images for E8M39 and E8M40 from several
systems.
5.8.1 Experiment E8 – extended HEU sources
Figure 125. System7 imaging results after 900 seconds
Figure 126. System4 imaging results after 600 seconds

Report
2016 Technology Demonstration Workshop (TDW) on Gamma Imaging-External
Version Date: 2017-03-02
Version No.: 1
Department of Safeguards Page: 101 of 123
Figure 127. System8 imaging results after 600 seconds
5.8.2 Experiment E8 – HBPu sources
Figure 128. System7 gamma-ray images for E8M41 and E8M42 after 600 seconds (left), 400 seconds (right)

Report
2016 Technology Demonstration Workshop (TDW) on Gamma Imaging-External
Version Date: 2017-03-02
Version No.: 1
Department of Safeguards Page: 102 of 123
Figure 129. System4 gamma-ray images for E8M41 and E8M42 after 775 seconds (left), 680 seconds (right)
Figure 130. System8 gamma-ray images for E8M41 and E8M42 after 480 seconds (left), 528 seconds (right)
5.9 Experiment 8b: Glovebox Scenarios
5.9.1 Low-activity scenario
The following figures compare the results from several systems in the glovebox low-activity scenario.
Figure 131. System3 (left), System6 (center), and System4 (right) gamma-ray images from the glovebox low-activity
scenario.

Report
2016 Technology Demonstration Workshop (TDW) on Gamma Imaging-External
Version Date: 2017-03-02
Version No.: 1
Department of Safeguards Page: 103 of 123
Pu and Cs-137 were identified but localization is diffuse. A high part of the activity comes from
outside the field of view. In the field of view, most of the activity seems to come from centre-left area.
5.9.2 High-activity scenario
The following figures compare the results from several systems in the glovebox high-activity scenario.
Figure 132. System3 gamma-ray images from the glovebox high-activity scenario.
Image based on 59.5 keV peak only (left) and dynamic range image based on 208 keV to 59.5 keV
ratio (right); HBPu is imaged by green color.
Figure 133. System6 gamma-ray images from the glovebox high-activity scenario, where two hot spots are localized.

Report
2016 Technology Demonstration Workshop (TDW) on Gamma Imaging-External
Version Date: 2017-03-02
Version No.: 1
Department of Safeguards Page: 104 of 123
Figure 134. System4 gamma-ray images from the glovebox high-activity scenario, where one spot was localized based on the
Am-241 low energy emission.
5.9.3 Fumehood high activity scenario
The following figures compare the results from several systems in the fumehood high-activity
scenario.
Figure 135. System3 (left), System6 (center), and System4 gamma-ray images for Fumehood high-activity scenario.
System4 identified Am-241 and Plutonium. A notable part of 59.5 keV emission comes from the
round-bottom bottle. Peak around 310 keV is visible but his origin is unknown.
System6 identified one hot spot. System4, using the pinhole mode of operation identified one hot spot
and extended source. Np-237 (311 keV) is localized behind gamma-ray imager in Compton mode of
operation.

Report
2016 Technology Demonstration Workshop (TDW) on Gamma Imaging-External
Date: 2017-03-02
Version No.: 1
Department of Safeguards SG-RP-14926
Page: 105 of 123
6 Performance vs. Contextual Usage Scenarios
In order to understand applicability of modern gamma-ray imagers to the nuclear safeguards applications, a set of Contextual Usage Scenarios (CUS) has
been defined by the IAEA. General requirements for gamma-ray imagers are summarized in Table 21. Performance of the imagers against 18 IAEA CUS is
summarised in Table 22. Evaluation of performance is based on the experimental results obtained at workshop.
Table 21. General requirements to gamma-ray imagers.
General requirements System4 System5 System3 System6 System7 System1 System8
1. Good imaging efficiency for nuclear materials Yes No* Yes Yes Yes No* Yes
2. Identification of nuclear materials Yes Yes Yes No Yes Yes Yes
3. Wide field of view Yes Yes No No Yes Yes No
4. Low-weight portable, preferably hand-held operation No Yes Yes Yes No Yes No
5. Possibility to perform dynamic measurements No Yes No No No No No
6. Good imaging separation for different radionuclides Yes Yes Yes No Yes Yes Yes
7. Good angular resolution for the same radionuclides Yes No Yes Yes Yes No Yes
* Uranium can’t be imaged based on 185.7 keV photon emissions; HBPu can’t be imaged based on 208 keV photon emissions.

Report
2016 Technology Demonstration Workshop (TDW) on Gamma Imaging-External
Version Date: 2017-03-02
Version No.: 1
Department of Safeguards Page: 106 of 123
Table 22. Performance vs. contextual user scenarios (CUS).
System3 System1 System4 System8 System5
System6 System7
CUS 01
The inspector enters room/lab full of cupboards, containing several radioactive sources. While carrying out interviews, he captures a
gamma image of the room. He is able to verify the presence of SNM that may be masked by other radioactive sources before leaving the
room, and reorient his inspection accordingly.
Only static
measurements
could be done.
Can determine
presence of
SNM.
Can determine
location of the
SNM.
Several
measurements
shall be done.
Only static
measurements
could be done.
Can determine
presence of
SNM.
Can’t determine
location of HEU
based on 185.7
keV emission.
One
measurement
could be
sufficient.
Only static
measurements
could be done.
Can determine
presence of SNM
as spectrometric
HPGe detector is
used.
Can determine
location of the
SNM.
One measurement
could be
sufficient.
Imager is quite
heavy.
Only static
measurements
could be done.
Imager is not
portable.
Dynamic
measurements
can be done.
Can determine
presence of
SNM.
Can determine
location of Pu
source.
Can’t localize U
source based on
185.7 keV
emissions.
One
measurement
could be
sufficient.
Only static
measurements
could be done.
Imager is not
spectrometric.
Only static
measurements
could be done.
Can determine
presence of
SNM.
Can’t determine
location of the
SNM as
instrument shall
not be in
movement.
Couple of
measurements
could be
sufficient.
Imager is not
portable.
CUS 02
The inspector enters room/lab full of cupboards. He leaves the camera operating during the rest of the CA and captures a gamma image of
the room. He is able to verify the presence of NM before the end of the CA, and reorient his inspection accordingly.
Can determine
presence of
SNM.
Can determine
location of the
SNM.
Can determine
presence of
SNM.
Can’t determine
location of HEU
based on 185.7
Can determine
presence of SNM.
Can determine
location of the
SNM.
One measurement
Imager is not
portable.
Can determine
presence of
SNM.
Can determine
location of Pu
source.
Imager is not
spectrometric.
Can determine
presence of
radioactive
material.
Can determine
presence of SNM
as spectrometric
HPGe detector is
used.
Can’t determine

Report
2016 Technology Demonstration Workshop (TDW) on Gamma Imaging-External
Version Date: 2017-03-02
Version No.: 1
Department of Safeguards Page: 107 of 123
System3 System1 System4 System8 System5
System6 System7
Several
measurements
shall be done.
keV emissions.
One
measurement
could be
sufficient.
could be
sufficient.
Imager is quite
heavy.
Can’t localize U
source based on
185.7 keV
emissions.
One
measurement
could be
sufficient.
Several
measurements
shall be done.
location of the
SNM as
instrument shall
not be in
movement.
Couple of
measurements
could be
sufficient.
Imager is too big
and heavy.
CUS 03 A gamma camera is used over a cascade hall, monitoring the centrifuges cylinders from the top, with a wide angle view, and possibly
setup on rails so that it can randomly be moved across the warehouse. A gamma picture is taken, possibly with a very long integration
time (24h). The visual imaging is optimally removed (to minimize the amount of information captured by the IAEA). The IAEA is able to
visually confirm the presence of the absence of the accumulation of NM inside the enrichment process.
Capable.
Good detection
efficiency and
relatively low
background at
185.7 keV. Low
detection
efficiency at
1001 keV.
Not capable to
make image
based on 185.7
keV photon
emissions.
Capable to
measure spectra.
Good detection
efficiency at
185.7 keV and at
1001 keV.
Optimal energy
resolution for
room
temperature.
Capable.
Can be done.
Good detection
efficiency at
185.7 keV and
relatively low
detection
efficiency at 1001
keV. Excellent
energy resolution.
Capable.
Good efficiency
at 185.7 keV and
good detection
efficiency at
1001 keV.
Not capable to
make image
based on 186
keV emissions.
Capable to
measure spectra.
Good efficiency
at 185.7 keV and
good detection
efficiency at
1001 keV.
Imager is not
spectrometric.
Capable.
Good detection
efficiency at
185.7 keV and
relatively low
detection
efficiency at
1001 keV.
Excellent energy
resolution.

Report
2016 Technology Demonstration Workshop (TDW) on Gamma Imaging-External
Version Date: 2017-03-02
Version No.: 1
Department of Safeguards Page: 108 of 123
System3 System1 System4 System8 System5
System6 System7
CUS 04 UF6 tail cylinders are stored in multiple layers. A gamma camera is setup on an automated robot that is able to automatically navigate
between the cylinders. A gamma picture is captured for each cylinder while the inspector carries out other activities. An automated,
recognition-software analyses the images, confirms the presence of UF6 material in each cylinder and identifies any potential anomaly for
further manual verification.
Capable to image
source pattern.
Good detection
efficiency and
relatively low
background a
185.7 keV. Low
detection
efficiency at
1001 keV.
Not capable to
make image
based on 185.7
keV photon
emissions.
Good detection
efficiency at
185.7 keV and at
1001 keV.
Optimal energy
resolution for
room
temperature.
Capable to image
source pattern.
Low intrinsic
detection
efficiency at
185.7 keV and
low detection
efficiency at 1001
keV.
Excellent energy
resolution.
Capable to image
source pattern.
Multiple
measurements
are needed.
Not capable to
make image
based on 185.7
keV photon
emissions.
Good efficiency
detection
efficiency at
1001 keV.
Imager is not
spectrometric.
Capable to image
source pattern.
Capable to image
source pattern.
Good detection
efficiency at
185.7 keV and
relatively low
detection
efficiency at
1001 keV.
Excellent energy
resolution
CUS 05 An inspector captures a gamma image from the top of a fresh fuel assembly (in air). He is able to pinpoint which assembly contain LEU at
a pin level (partial defect, or H+ verification method).
Capable.
Good detection
efficiency at
185.7 keV.
Good angular
resolution.
Capable based
on 1001 keV
photon
emissions.
Limited angular
resolution.
Capable.
Low intrinsic
detection
efficiency at
185.7 keV.
Good angular
resolution.
Capable.
Multiple
measurements
(scan elements)
are needed to
achieve good
angular
resolution.
Capable based
on 1001 keV
photon
emissions.
Good detection
efficiency at
1001 keV.
Limited angular
resolution.
Imager is not
spectrometric.
Capable to image
source pattern.
Capable.
Excellent
detection
efficiency at
185.7 keV.
Excellent angular
resolution.
CUS 06 An inspector captures a gamma image from the side of a group of fresh fuel assemblies. He is able to pinpoint which assembly contains
LEU.

Report
2016 Technology Demonstration Workshop (TDW) on Gamma Imaging-External
Version Date: 2017-03-02
Version No.: 1
Department of Safeguards Page: 109 of 123
System3 System1 System4 System8 System5
System6 System7
Capable to image
extended
sources.
Good detection
efficiency at
185.7 keV.
Good angular
resolution.
Capable based
on 1001 keV
photon
emissions.
Limited angular
resolution.
Capable.
Due to pinhole
usage low
intrinsic detection
efficiency at
185.7 keV.
Good angular
resolution.
Capable.
Multiple
measurements
(scan elements)
are needed to
achieve good
angular
resolution.
Capable based
on 1001 keV
photon
emissions.
Good detection
efficiency at
1001 keV.
Limited angular
resolution.
Imager is not
spectrometric.
Capable to image
source pattern.
Acceptable
detection
efficiency at
185.7 keV.
Good angular
resolution.
Capable to image
extended
sources.
Excellent
detection
efficiency at
185.7 keV.
Excellent angular
resolution.
CUS 07 An inspector captures a gamma image lengthwise of an assembly/of several assemblies. He is able to measure and record in the report the
actual active length of the assembly.
Capable to image
extended
sources.
Good detection
efficiency at
185.7 keV.
Good angular
resolution.
Limited field of
view.
Capable based
on 1001 keV
photon
emissions.
Limited angular
resolution.
Capable.
Long acquisition
time.
Capable.
Multiple
measurements
(scan elements)
are needed to
achieve good
angular
resolution.
Capable based
on 1001 keV
photon
emissions.
Good detection
efficiency at
1001 keV.
Limited angular
resolution.
Imager is not
spectrometric.
Capable to image
source pattern.
Acceptable
detection
efficiency at
185.7 keV.
Good angular
resolution.
Limited field of
view.
Capable to image
extended
sources.
Excellent
detection
efficiency at
185.7 keV.
Excellent angular
resolution.
Wide field of
view. Image can
be zoomed if
necessary.
Lengths of
extended source
can be calculated
(demonstrated at
workshop).

Report
2016 Technology Demonstration Workshop (TDW) on Gamma Imaging-External
Version Date: 2017-03-02
Version No.: 1
Department of Safeguards Page: 110 of 123
System3 System1 System4 System8 System5
System6 System7
CUS 08 Nuclear material is stored in a big difficult to access vessel. A gamma picture is taken, fill level is determined, geometry of different
material layers inside the vessel are identified (e.g. sediment vs. liquid), or emptiness is verified.
Capable.
Limited field of
view.
Many
measurements
could be needed.
Limited
performance at
1001 keV.
Limited
performance in
imaging source
pattern when
source is
distributed
across the whole
field of view.
Not capable to
image U-235
based on 185.7
keV photon
emissions.
Capable based
on 1001 keV
photon
emissions.
Limited angular
resolution.
Capable.
Long acquisition
time.
Several
measurements
could be needed.
Multiple
measurements
(scan elements)
are needed to
achieve good
angular
resolution.
Optimal for
characterisation
of vessel.
One volumetric
measurement
could be
sufficient.
Not capable to
image U-235
based on 185.7
keV photon
emissions.
Imager is not
spectrometric.
Not able to
resolve different
nuclear
materials.
Capable.
Several
measurements
could be needed.
Limited
performance at
1001 keV.
Good
performance in
imaging source
pattern when
source is
distributed across
the whole field.
CUS 09 Multiple pipes/equipment may contain hold-up or in process nuclear material. A wide-angle gamma measurement is taken. The inspector
looks at the superimposition of gamma and visual image, and is able to define the key spots where detailed measurement shall be made
(ISOCS).
Capable.
Limited field of
view.
Not capable to
image U-235
based on 185.7
keV photon
emissions.
Not capable to
image HBPu
Capable.
Multiple
measurements
(scan elements)
are needed to
achieve good
angular
resolution.
Dynamic
measurement
could be made,
distance between
source and
imager therefore
could be greatly
Capable. Limited
field of view.
Capable.
Wide field of
view.

Report
2016 Technology Demonstration Workshop (TDW) on Gamma Imaging-External
Version Date: 2017-03-02
Version No.: 1
Department of Safeguards Page: 111 of 123
System3 System1 System4 System8 System5
System6 System7
based on 208
keV photon
emissions.
Capable to image
U based on 1001
keV photon
emissions.
Capable to image
Pu based on 336
keV, 375 keV
and 414 keV
photon
emissions.
Limited angular
resolution.
Good separation
of different
radionuclides.
reduced and
detection
sensitivity
increased.
Not capable to
image U-235
based on 185.7
keV photon
emissions.
Not capable to
image HBPu
based on 208
keV photon
emissions.
Capable to image
U based on 1001
keV photon
emissions.
Capable to image
Pu based on 336
keV, 375 keV
and 414 keV
photon
emissions.
Limited angular
resolution.
Good separation
of different
radionuclides.
CUS 10 The inspector captures a gamma image from behind the curtain, in an area where the access has been managed by the operator. Without

Report
2016 Technology Demonstration Workshop (TDW) on Gamma Imaging-External
Version Date: 2017-03-02
Version No.: 1
Department of Safeguards Page: 112 of 123
System3 System1 System4 System8 System5
System6 System7
capturing sensitive visual information, he is still able to verify the presence (or confirm absence) of nuclear material.
Capable to detect
presence or
confirm absence
of nuclear
material.
Capable to detect
presence or
confirm absence
of nuclear
material.
Capable to detect
presence or
confirm absence
of nuclear
material.
Multiple
measurements
(scan elements)
are needed to
achieve good
angular
resolution.
Capable to detect
presence or
confirm absence
of nuclear
material.
Imager is not
spectrometric.
Capable to detect
presence or
confirm absence
of radioactive
material.
Capable to detect
presence or
confirm absence
of nuclear
material.
CUS 11 The inspector captures a gamma image from a room containing sensitive equipment that is not safeguards relevant, or from a room that he
cannot/ does not necessarily need to enter (clean room). He makes a gamma image, without capture sensitive visual information, or
without entering the room. Inspector able to verify the presence (or confirm absence) of nuclear material.
Capable and well
suited for
localization of
unshielded
nuclear
materials.
Limited field of
view, several
measurements
could be needed.
Capable
Localization
based on low-
energy photon
emissions can’t
be done.
Imaging low-
energy threshold
is about 250
keV.
Capable with
localization.
limited angular
resolution.
Imaging low-
energy threshold
for Compton
mode is about 150
keV.
Capable.
Localization
based on low-
energy photon
emissions can’t
be done.
Imaging low-
energy threshold
is about 250
keV.
Imager is not
spectrometric.
Capable and well
suited for
localization of
unshielded
nuclear
materials.
Wide field of
view.
CUS 12 A gamma image of a whole glove box containing multiple small size containers is captured to assess the presence of special nuclear
material.
Capable.
Localization of
unshielded SNM
is optimal. Short
counting time.
Localization of
HEU based on
185.7 keV
photon emissions
is not possible.
Capable.
Long counting
time.
Localization of
shielded HEU
Multiple
measurements
(scan elements)
are needed to
achieve good
Localization of
HEU based on
185.7 keV
photon emissions
is not possible.
Imager is not
spectrometric.
Capable.
Localisation of
unshielded SNM
is optimal. Short
counting time.

Report
2016 Technology Demonstration Workshop (TDW) on Gamma Imaging-External
Version Date: 2017-03-02
Version No.: 1
Department of Safeguards Page: 113 of 123
System3 System1 System4 System8 System5
System6 System7
Localization of
shielded HEU
based on 1001
keV photon
emissions is
possible.
Limited field of
view.
Localization of
shielded HEU
based on 1001
keV photon
emissions is
possible.
Localisation of
LBPu is possible.
Limited angular
resolution.
based on 1001
keV photon
emissions is
possible.
angular
resolution.
Localization of
HEU based on
1001 keV photon
emissions is
possible.
Localisation of
LBPu is possible.
Limited angular
resolution.
Localization of
shielded HEU
based on 1001
keV photon
emissions is
possible.
CUS 13 During briefing or training, an image of the room along with the gamma sources is shown to inspectors. A map of the gamma radiation is
provided to the inspectors. During site activities, inspectors remember more vividly the safe areas and are able to limit their dose rates.
Capable to
generate image
with hot spots
(distributed
sources).
Capable to
generate image
with hot spots
(distributed
sources) for
energies of
photons above
250 keV.
Capable to
generate image
with hot spots
(distributed
sources). Capable
to estimate
activities of
localized sources.
Capable to image
detailed dose-
rate map.
Capable to
generate 3D map
with hot spots.
Capable to
generate image
with hot spots
(distributed
sources).
Capable to
generate image
with hot spots
(distributed
sources).
Capable to
estimate
activities of
localized
sources.
CUS 14 A gamma camera is setup to monitor SF rods (Fukushima…), or any high activity sources. If one of the gamma sources disappear and
alarm is raised.
Capable Capable Capable Capable Capable Capable Capable
CUS 15 A gamma camera is setup to monitor an entry/exit point. In the case of the appearance of a high-activity gamma source (Fukushima), an
alarm is raised.
Capable Capable Capable Capable Capable Capable Capable
CUS 16 Various wastes containing nuclear material have been stored in a pit. A gamma picture is taken; spots with items containing nuclear

Report
2016 Technology Demonstration Workshop (TDW) on Gamma Imaging-External
Version Date: 2017-03-02
Version No.: 1
Department of Safeguards Page: 114 of 123
System3 System1 System4 System8 System5
System6 System7
material are identified, enabling a general verification of nuclear material declarations. Further detailed verifications are then carried out.
Capable.
Limited field of
view.
Not capable to
image U-235
based on 185.7
keV photon
emissions.
Not capable to
image HBPu
based on 208
keV photon
emissions.
Capable to image
U based on 1001
keV photon
emissions.
Capable to image
Pu based on 336
keV, 375 keV
and 414 keV
photon
emissions.
Limited angular
resolution.
Good separation
of different
radionuclides.
Capable.
Multiple
measurements
(scan elements)
are needed to
achieve good
angular
resolution.
Not capable to
image U-235
based on 185.7
keV photon
emissions.
Not capable to
image HBPu
based on 208
keV photon
emissions.
Capable to image
U based on 1001
keV photon
emissions.
Capable to image
Pu based on 336
keV, 375 keV
and 414 keV
photon
emissions.
Limited angular
resolution.
Good separation
of different
radionuclides.
Imager is not
spectrometric
Capable.
Wide field of
view.
CUS 17 Wastes containing nuclear material have been stored in a pit. A gamma picture is taken establishing a reference fingerprint used as a
containment and surveillance measure; the image is compared to a previous one and documents any significant change that occurred
between the inspections.
Capable. Not capable to Capable. Multiple Not capable to Imager is not Capable.

Report
2016 Technology Demonstration Workshop (TDW) on Gamma Imaging-External
Version Date: 2017-03-02
Version No.: 1
Department of Safeguards Page: 115 of 123
System3 System1 System4 System8 System5
System6 System7
Limited field of
view.
image U-235
based on 185.7
keV photon
emissions.
Not capable to
image HBPu
based on 208
keV photon
emissions.
Capable to image
U based on 1001
keV photon
emissions.
Capable to image
Pu based on 336
keV, 375 keV
and 414 keV
photon
emissions.
Limited angular
resolution.
Good separation
of different
radionuclides.
measurements
(scan elements)
are needed to
achieve good
angular
resolution.
image U-235
based on 185.7
keV photon
emissions.
Not capable to
image HBPu
based on 208
keV photon
emissions.
Capable to image
U based on 1001
keV photon
emissions.
Capable to image
Pu based on 336
keV, 375 keV
and 414 keV
photon
emissions.
Limited angular
resolution.
Good separation
of different
radionuclides.
spectrometric Wide field of
view.
CUS 18 An inspector captures a gamma image profile of a transport container of fresh fuel assemblies. He is able to visually confirm the presence
(or absence) and number of fresh fuel assemblies.

Report
2016 Technology Demonstration Workshop (TDW) on Gamma Imaging-External
Version Date: 2017-03-02
Version No.: 1
Department of Safeguards Page: 116 of 123
System3 System1 System4 System8 System5
System6 System7
Capable, but
performance is
limited by the
relatively narrow
field of view.
Not capable Capable.
Long acquisition
time.
Capable, but
multiple
measurements
are needed to
achieve good
angular
resolution.
Not capable Capable.
Capable.

Report
2016 Technology Demonstration Workshop (TDW) on Gamma Imaging-External
Version Date: 2017-03-02
Version No.: 1
Department of Safeguards Page: 117 of 123
7 Conclusion
In the result of research and development work over the past decade, a technology breakthrough in
gamma-ray imaging has happened. It is associated with application of position sensitive
semiconductor radiation detectors, which are combined with coded-aperture and Compton imaging
methods. Gamma-ray imagers presented at workshop could be suitable for nuclear safeguards and
closely related applications.
The following features of modern gamma-ray imagers have been demonstrated:
Application of semiconductor radiation detectors
High-level of segmentation of CZT, CdTe and HPGe detectors
Application of coded-aperture and Compton imaging methods
In most gamma-ray imagers presented at the workshop, 3D-position sensitive semiconductor radiation
detectors are deployed making the application of both coded-aperture and Compton imaging
technologies in a single device possible. Due to relatively low energies of photons emitted by U and
Pu coded-aperture imaging, it could be considered as a necessary mode of operation of gamma-ray
imager for nuclear safeguards, however Compton mode may be useful as well. 3D volumetric
Compton imaging has been demonstrated and it provides the possibility of making dynamic
measurements for what is of importance for a variety of safeguards contextual usage scenarios.
Features of individual gamma-ray images demonstrated at workshop are summarized below.
System4
This system combines pinhole/Compton imaging methods. U and Pu sources could be successfully
imaged in Compton mode of operation, however angular resolution in this operation mode is limited.
For imaging of a pattern of extended sources pinhole mode of operation is used. For a detector having
diameter 90mm sensitivity of pinhole imaging method could be greatly improved in case, if single
pinhole will be replaced with coded aperture. Short system start-up time for electrically cooled HPGe
detector has been demonstrated. Excellent values of energy resolution have been measured. In order to
decrease weight of the instrument development of the version of portable imager with conventional
liquid nitrogen cooling system may be considered.
System5
3D volumetric Compton imaging has been successfully demonstrated and it provides possibility of
making dynamic gamma-ray imaging, which is essential for nuclear safeguards and close related
application. As soon as CZT detector is used U Compton imaging based on registration of scattering
and absorption of 186 keV photons is not possible, so U imaging is limited to the imaging of incident
photons with energies 1001 keV (Pa-234m) however Pu Compton imaging has been successfully
demonstrated. Active coded mask imaging is under development. Volumetric active coded-mask
imaging would be of interest for nuclear safeguards and would solve problem U imaging based on low

Report
2016 Technology Demonstration Workshop (TDW) on Gamma Imaging-External
Version Date: 2017-03-02
Version No.: 1
Department of Safeguards Page: 118 of 123
energy emissions. Another alternative could be in the development of Volumetric Compton Imager
based on relatively low-Z detector such as HPGe detector.
System6
Current version of the System6 coded-aperture imager utilizes a non-spectrometric CdTe detector.
Good results have been demonstrated in terms of localization of U and localization of Pu based on
Am-241 emissions. Localization capabilities could be improved if spectrometric information will be
available, so the image could be constructed based on the particular ROI. Real benefit of usage of
CdTe detector could be associated with its spectrometric characteristics, but the detector should be
cooled. As it was demonstrated here for a highly pixelated CdTe detector already at detector
temperature -10 °C good values of energy resolution could be achieved and in general thermoelectric
cooler could be used. Relatively high operating temperature, shortens requirements to thermal
insulation system. Further improvement of CdTe crystals growth may be expected in the future and
potentially more thick CdTe detectors could be available.
System3
Coded-mask imager has shown excellent performance on point sources and non-complex extended
source patterns. 5 mm thickness of room temperature CZT detector array having sensitive volume of 6
cm3 is well suited for U and Pu imaging. For distributed source when it “fills” practically the entire
field of view, application of mask/anti-mask imaging method could be considered. HURA mask is
used with hexagonal pattern, it may be replaced with mask having rectangular pattern in order to fit
detector geometry. As soon as 3D position sensitive CZT detectors are used application of Compton
imaging method could be considered as well. Some engineering work is required in order to replace
relatively heavy enclosure with more ergonomic and lighter one. In terms of spectrometric
capabilities, number of channels of multichannel analyzer needs to be increased.
System7
Coded-aperture imager has been demonstrated. Imager performed well against all tests and scenarios.
Mask/anti-mask acquisition strategy was especially useful for imaging of extended source patterns.
Variable focal length which allows make gamma-ray image in wide field of view first and then zoom
specific areas of interest is an important feature. Availability of spectra of each imaging pixel allows
operator to get complete information about radiological composition of localized gamma-ray sources.
Applied 3 mm thick Tantalum mask is rather transparent for high-energy photons (Cs-137 and Co-60),
so application of Compton imaging method in addition to coded aperture could be essential. Some
engineering work is required in order to make automated mask positioning and rotating system more
compact.
System1
Compton imaging by means of single 3D position sensitive CZT detector has been successfully
demonstrated. Good values of imaged to full-energy peak events have been demonstrated at high
energies (Cs-137 and Co-60). Large volume (6 cm3) single crystal room temperature CZT detector is
utilized in the imager and excellent values of energy resolution have been obtained (1% at 662 keV).

Report
2016 Technology Demonstration Workshop (TDW) on Gamma Imaging-External
Version Date: 2017-03-02
Version No.: 1
Department of Safeguards Page: 119 of 123
Coded-aperture imaging is under research. Development of Compton imager based on array of 4 CZT
detectors (24 cm3 total sensitive volume) with coded aperture imaging package has been highlighted
and it should be suitable for nuclear safeguards applications.
System8
This system could be classified as a gamma-ray scanner. In order to obtain a gamma-ray image
multiple measurements needs to be performed. The system is fully automated and could be especially
useful for the search and localization of hot spots in high-background radiation environment, as well
as on the creation of radioactivity map of the scanned area. As soon as localization of source is made
using variations of radiation signals between individual scan elements and in order to obtain good
values of angular resolution LaBr3 detector is well collimated what makes system heavy. In order to
overcome this difficulty implementation of active collimator operating in anti-coincidence mode with
main detector could be considered.
7.1 Conclusion to measurement campaign
The goal of the workshop was to evaluate technologies utilized in gamma-ray imaging systems and
make a review and definite conclusion about current status and perspectives of the development of this
emerging field with application for nuclear safeguards. In order to achieve this goal, different types of
static measurements with radioactive sources and nuclear materials were conducted.
Measurements were submerged into sets of the following eight Experiments:
Experiment 1 – Measurements of sensitivity in wide energy range of imager operation
Experiment 2 – Overnight localization and identification of weak source in the presence of
masking source
Experiment 3 – Measurements of sensitivity to nuclear materials, time to detect, identify and
localize nuclear materials
Experiment 4/5 – Angular resolution measurements
Experiment 6 – Localization performance for extended sources
Experiment 7 (a) – False alarm rate
Experiment 7 (b) – High-background masking scenario
Experiment 8 (a) – Angular resolution for extended sources
Experiment 8 (b) – Glove box scenarios
In addition dynamic measurements have been made to reveal performance characteristics of 3D
volumetric Compton imager.
Tests under experiments 1 and 3 were focused on the estimation of total sensitivity and sensitivity in
full-energy peaks. Experiments were conducted with Am 241, Cs-137 and Co-60 to cover wide energy
range of imager operation and with HBPu, LBPu, HEU and LEU to evaluate sensitivity to nuclear
materials. Sensitivity measurements allowed to evaluate and compare suitability of gamma-ray
imagers for both imaging modes.
Test under Experiment 2 and 7 (b) have revealed the importance of having spectrometric information
for coded-aperture imaging in order to enhance imaging capabilities, which is achieved by imaging the

Report
2016 Technology Demonstration Workshop (TDW) on Gamma Imaging-External
Version Date: 2017-03-02
Version No.: 1
Department of Safeguards Page: 120 of 123
events from selected region of interest in the spectrum. In Compton imaging full-energy peak events
are imaged, therefore Compton imager shall be spectrometric.
As soon as nuclear materials such as HEU and LBPu are characterized by relatively low energies of
emitted photons coded-aperture imaging could be considered as a necessary mode of imager operation
for the tasks associated with activities of nuclear safeguards.
Angular resolution and field of view of coded aperture imaging is a function of mask pattern, distance
between mask and detector and spatial resolution of the detector. Therefore, basic tests under
experiments 4/5 and 8b were aimed to reveal performance of coded-aperture imagers and in particular
to evaluate level of segmentation of semiconductor radiation detectors.
Tests under Experiment 6 have demonstrated, an advantage of using mask/anti-mask imaging method
for imaging of a pattern of widely distributed source.
Tests under Experiment 7 (b) and Experiment 8 (b) have demonstrated, an advantage of having
combined coded-aperture/Compton imager.
Tests under Experiment 2 and 8 (a) have demonstrated an independence of gamma-ray imagers in
their ability to detect and localize radioactive source from necessity in having background
measurements.
Some Pu experiments with coded-aperture imagers were affected by low-energy Am-241 emissions as
imagers were able to localize unshielded Pu sources very fast, however availability of spectrometric
information allowed mitigate this difficulty performing further analysis based on the regions of
interests characteristic for LBPu and HBPu and excluding low-energy photon emissions.
Methodology of measurements of such basic imaging parameters as field of view and angular
resolution as well as such derived parameters as time to alarm, time to identify and time to localize
needs to be developed.
Field of view and its uniformity is estimated measuring sensitivity of gamma-ray imager to the point
source positioned at different angles with reference to the detector.
Angular resolution is estimated accumulating gamma-ray image of point source; when a necessary
number of imaged events is obtained with full-widths of half maximum of imaged peak is measured.
Time to alarm algorithm utilized in one system and based on N*sigma comparisons of a radiation
signal amplitude in individual pixels with mean value of signal obtained in all imaged pixels, allows to
control false alarm rate and avoid background measurements, in the meantime this algorithm is more
suitable for point rather than distributed sources. Time to alarm could be estimated based on
accumulation of a gamma-ray image of two point sources separated across the field of view.
Time to localize algorithm could be based on N*sigma comparison of mean radiation signal amplitude
obtained in the cluster of imaged pixels with mean value of signal obtained in all imaged pixels. Time
to localize may be estimated accumulating gamma-ray image of two point sources separated across the
field of view and could be linked to the angular resolution measurements.

Report
2016 Technology Demonstration Workshop (TDW) on Gamma Imaging-External
Version Date: 2017-03-02
Version No.: 1
Department of Safeguards Page: 121 of 123
Time to identify may be linked to spectrometric performance. As soon as full-energy peak is identified
in the spectrum detection flag (independent from background measurements) may be raised what
could alert an operator about presence of the source within imager field of view.
At the workshop a majority of tests were made with unshielded nuclear materials, which clearly
indicated advantages of using coded-aperture imaging method. Tests with shielded nuclear materials
may reveal advantages of Compton imaging method as with increase of energies of incident photons
improvement of imaging efficiency and angular resolution could be expected.
In the result of the analysis of experimental results it can be concluded that new generation of gamma-
ray imagers having the following essential features already demonstrated by participants at this
workshop:
Application of semiconductor radiation detectors
High-level of segmentation of CdTe, CZT and HPGe detectors
Application of 3D position sensitive semiconductor detectors
Combination of coded-mask/Compton imaging methods
Performing dynamic gamma-ray imaging – 3D volumetric Compton imager has been
successfully demonstrated.
Gamma-ray imagers demonstrated at workshop can be suitable for nuclear safeguards and are capable
to address majority of the contextual user scenarios defined by the IAEA.

Report
2016 Technology Demonstration Workshop (TDW) on Gamma Imaging-External
Version Date: 2017-03-02
Version No.: 1
Department of Safeguards Page: 122 of 123
8 References
[1] A. N. Sudarkin et al. HERV - High Energy Radiation Visualizer, A New System for Imaging in
X-Ray and Gamma Regions. IEEE Transactions on Nuclear Science, Volume 43, Issue 4, pg.
2427 – 2433, 1996
[2] O. Gal et al. CARTOGAM – a portable gamma camera for remote localisation of radioactive
sources in nuclear facilities. Nuclear Instruments and Methods in Physics Research A 460
(2001) 138–145
[3] O. P. Ivanov et al. New Portable Gamma-Camera for Nuclear Environment and Its
Application at Rehabilitation Works. IEEE 2004.
[4] O. Gal et al. Development of a portable gamma camera with coded aperture Nuclear
Instruments and Methods in Physics Research A 563 (2006) 233–237
[5] K.A. Hughes et al. RadScan 600 - A Portable Instrument for the Remote Imaging of Gamma
Contamination: Its Design and use in Aiding Decommissioning Strategy. IEEE 1997
[6] Klaus-Peter Ziock. Gamma-ray Imaging Spectrometry. Science and Technology Review.
October 1995.
[7] Peter E. Vanier. Analogies between neutron and gamma-ray imaging. Brookhaven National
Laboratory. 2006
[8] L. J. Schultz et al. Hybrid coded aperture and Compton imaging using an active mask.
Nuclear Instruments and Methods in Physics Research A 608 (2009) 267–274
[9] John A. Mason et al. DEVELOPMENT AND TESTING OF A NOVEL GAMMA RAY
CAMERA FOR RADIATION SURVEYING, CONTAMINATION MEASUREMENT AND
RADIATION DETECTION. 12-A-409-INMM
[10] John A. Mason et al. Testing and Performance Validation of a Sensitive Gamma Ray
Camera Designed for Radiation Detection and Decommissioning Measurements in Nuclear
Facilities. WM2013 Conference, February 24 – 28, 2013, Phoenix, Arizona, USA
[11] L. Mihailescu et al. SPEIR: A Ge Compton camera. Nuclear Instruments and Methods in
Physics Research A 570 (2007) 89–100
[12] P. N. Luke et al. Amorphous Ge Bipolar Blocking Contacts on Ge Detectors. IEEE
TRANSACTIONS ON NUCLEAR SCIENCE. VOL. 39, NO. 4.1992
[13] Free-piston Stirling-cycle cryocoolers. http://sunpowerinc.com/
[14] Pulse tube Stirling-cycle cryocoolers. http://www.thales-cryogenics.com/
[15] RATZLAFF, CHELSEA ROBYN. Detector Response Function for a Germanium Strip
Type Detector/Imager. Master of Science Thesis, 2014.
[16] Bruks et al. A 4-π Field of View Compton Imager Based on a Single Planar Germanium
Detector. IEEE
[17] Ethan Hull. Germanium Gamma-Ray Imager. Presentation, IAEA October 2015.
[18] GeGI - Graphical User Interface. http://phdsco.com/news/view/14/gegi-performs-at-iaea-
workshop-
[19] Klaus Ziock. Coded-aperture Gamma-Ray Imaging. Presentation. IAEA October 2015
[20] Klaus Ziock. ORNL Gamma-Ray Imager Results from the IAEA TDW on Gamma-Ray
Imaging. ORNL/LTR-2015/679. November 2015
[21] Christopher G. Wahl et al. The Polaris-H imaging spectrometer. Nuclear Instruments and
Methods in Physics Research A 784 (2015) 377 – 381
[22] F. Zhang et al. Events Reconstruction in 3-D Position Sensitive CdZnTe Gamma-ray
Spectrometers (Ph. D. Thesis). University of Michigan, 2005.
[23] W. Kaye. Energy and Position Reconstruction in Pixelated CdZnTe Detectors (Ph. D.
Thesis). University of Michigan, 2012.

Report
2016 Technology Demonstration Workshop (TDW) on Gamma Imaging-External
Version Date: 2017-03-02
Version No.: 1
Department of Safeguards Page: 123 of 123
[24] Sonal Joshi. Coded Aperture Imaging Applied to Pixelated CdZnTe Detectors (Ph. D.
Thesis), University of Michigan, 2014.
[25] Willy Kaye. Polaris and Orion 3D CdZnTe Gamma-Neutron Imaging Spectrometers.
Presentation at IAEA, October 2015.
[26] G. Montemont. CEA Portable Gamma-Ray Imagers. Presentation, IAEA October 2015.
[27] H. Lemaire et al. Implementation of an imaging spectrometer for localization and
identification of radioactive sources. Nuclear Instruments and Methods in Physics Research A
763 (2014) 97-103.
[28] M. Gmar et al. GAMPIX: A new generation of gamma camera. Nuclear Instruments and
Methods in Physics Research A 652 (2011) 638-640.
[29] Mark Amman et al. Detector Module Development for the High Efficiency Multimode
Imager. IEEE Nuclear Science Symposium Conference Record, 2009.
[30] R. Barnowski, A. Haefner, K. Vetter. LBNL’s High Efficiency Multimodal Imager
(HEMI) and Demonstration of Hand-Held Volumetric Imaging. December 2015.
[31] Michelle Lee Galloway. Characterization and Applications of a CdZnTe-Based Gamma-
Ray Imager, (Ph. D. Thesis). University of California, Berkeley, 2014.
[32] S. Dubos et al. ORIGAMIX, a CdTe-based spectro-imager development for nuclear
applications. Nuclear Instruments and Methods in Physics Research A 787 (2015) 302-307.
9 Technical Contacts
Dimitri Finker — [email protected]
Andrey Sokolov — [email protected]
10 Document Revision History
Revision History
Version No. Release Date Description of changes
1 New Document.