Embed Size (px)
Citation preview
8/2/2019 Sfm Project
http://slidepdf.com/reader/full/sfm-project 1/15
1 | P a g e
A
PROJECT REPORT
ON
INDUSTRIAL SICKNESS OF TAMILNADU TELECOM LIMITED
SUBMITTED TO: RAJSHEE JOSHI
SUBMITTED BY:DRASHTI DHOLAKIA(G1007)
VANDANA KASHYAP(G1011)
ANKITA MANKANI(G1018)
DRASHTI MEHTA(G1020)
CHANDNI THAKER(G1052)
8/2/2019 Sfm Project
http://slidepdf.com/reader/full/sfm-project 2/15
2 | P a g e
Industrial Sickness
Introduction
Definition of a sick unit is given by Sick Industrial companies act, 1985. According to the act “
The sick industrial company is a company which has at the end of any financial year
accumulated losses equal to or excluding its entire net worth and has also suffered cash losses in
that financial year and in the financial year immediately preceding it.”
Extent of sickness
Industrial sickness is growing at an annual rate of about 28% and 13% respectively in terms of
number of units and out standing number of bank credit. It is reckoned that as of today there are
more than 2 lakhs sick units with an outstanding bank credit of over Rs7000crore nearly 29000
units are added to sick list every year.
Industrial sickness especially in small-scale Industry has been always a demerit for the Indian
economy, because more and more industries like – cotton, Jute, Sugar, Textile small steel and
engineering industries are being affected by this sickness problem.
8/2/2019 Sfm Project
http://slidepdf.com/reader/full/sfm-project 3/15
3 | P a g e
TAMILNADU TELECOM
Tamilnadu Telecommunications Limited (TTL) was set up in 1988. It is a three way jointventure between Telecommunications Consultants India Ltd (TCIL), a central government PSU
that renders consultancy services and undertakes turnkey projects in telecom in India and abroad,
Tamilnadu Industrial Development Corp Ltd (TIDCO), a state PSU, and Fujikura Ltd of Japan, a
leading manufacturer of optical fibre products in the world. The company’s sole business
segment is telephone cables. Its optical fibre cable plant is located at Maraimalai Nagar in Tamil
Nadu.
KEY HIGHLIGHTS
Declared sick by BIFR, SBI named operating agency
In accordance with the requirement of Section 15 of the Sick Industrial Companies (Special
Provisions) Act, 1985, the company made a reference in October 2004 to the Board for Industrial
and Financial Reconstruction (BIFR) of the fact that the accumulated losses of the company at
the end of financial year 2003‐04 exceeded the entire net worth of the company. BIFR declared
the company as industrially sick and appointed State Bank of India as operating agency.
Technical and strategic support from foreign companies
TTL receives technical and strategic support from its foreign affiliates through joint ventures. In
1998, it diversified into manufacture of optical fibre cables in technical collaboration with M/s
Fujikura Ltd of Japan. Its optical fibre cables plant, located at Maraimalai Nagar in Chennai, has
been set up with machinery imported from M/s Nextrom Technologies of Finland. The company
has also developed tight buffered fibre, drop cable, raiser cable etc, with LSZH compound, as per
the EU standard.
8/2/2019 Sfm Project
http://slidepdf.com/reader/full/sfm-project 4/15
4 | P a g e
Established client base across telecommunication industry
TTL is engaged in the manufacture of telecommunication cables and fibre optic cables. Its client
list includes BSNL, MTNL, Tata Teleservices, Indian Railways, Reliance Infocom and TCIL,
among others. The company also exports optic fibre cables to clients in Nepal, Kuwait, Algeria,
Zimbabwe, Maldives etc.
During FY10, the company exported optical fibre cables on favourable terms through its
promoters, i.e., TCIL, for its projects abroad.
BACKGROUND
TTL is engaged in the manufacturing of telecommunication cables and fibre optic cables. Its
products include telecommunication grade optical fibre cables, ribbon cable, composite cables,
self supporting aerial optical fibre cable, armoured optical fibre cable and metal free optical fibre
cable. As of March 31, 2010, the company had an installed capacity of 20,220 running km and
485,280 fibre km of optical fibre cables.
During FY10, the company produced 6,714 running km and 330,887 fibre km of optical fibre
cables. The company's clients include BSNL, MTNL, Tata Teleservices, Indian Railways,
Reliance Infocom, Aircel, Hathway and Power Grid Corp of India Ltd, among others. The
company exports its optic fibre cables to Kuwait, Algeria, Zimbabwe, Maldives etc. During the
year, the company developed tight buffered fibre, drop cable and raiser cable.
Operations turn profitable, but company remains in the red in FY10
TTL's revenue grew ~81% to Rs 360 mn in FY10, led by increase in volumes of optical fibre
cables and addition of new optical fibres to the product range during the year. Domestic
operations grew ~71% year‐on‐year in FY10, while exports increased to Rs 12.8 mn from Rs
0.5 mn in FY09.
During the year, the company managed to survive a price war in the market by implementing
various cost‐cutting and value engineering measures in its manufacturing operations. This
helped it report operating profit of Rs 35 mn in FY10, compared with an operating loss of Rs
10 mn in FY09.
8/2/2019 Sfm Project
http://slidepdf.com/reader/full/sfm-project 5/15
5 | P a g e
Despite reporting operating profit during the year, the company reported a net loss of Rs 21 mn
in FY10, primarily due to higher depreciation and interest costs. In FY09, it has
reported a net loss of ~Rs 75 mn.
8/2/2019 Sfm Project
http://slidepdf.com/reader/full/sfm-project 6/15
6 | P a g e
CAUSES OF SICKNESS
Most of the Indian authors and researchers have classified the different types of industrial
sickness under two important categories. They are :
1) Internal Cause for sickness
We can say pertaining to the factors which are within the control of management. This sickness
arises due to internal disorder in the areas justified as following:
a) Lack of Finance: This including weak equity base, poor utilization of assets, inefficient
working capital management, absence of costing & pricing, absence of planning and budgeting
and inappropriate utilization or diversion of funds.
b) Bad Production Policies : The another very important reason for sickness is wrong selection
of site which is related to production, inappropriate plant & machinery, bad maintenance of Plant
& Machinery, lack of quality control, lack of standard research & development and so on.
c) Marketing and Sickness : This is another part which always affects the health of any sector as
well as SSI. This including wrong demand forecasting, selection of inappropriate product mix,
absence of product planning, wrong market research methods, and bad sales promotions.
d) Inappropriate Personnel Management : The another internal reason for the sickness of SSIs is
inappropriate personnel management policies which includes bad wages and salary
administration, bad labour relations, lack of behavioural approach causes dissatisfaction among
the employees and workers.
e) Ineffective Corporate Management : Another reason for the sickness of SSIs is ineffective orbad corporate management which includes improper corporate planning, lack of integrity in top
management, lack of coordination and control etc.
8/2/2019 Sfm Project
http://slidepdf.com/reader/full/sfm-project 7/15
7 | P a g e
2) External causes for sickness:
a) Personnel Constraint : The first for most important reason for the sickness of small scale
industries are non availability of skilled labour or manpower wages disparity in similar industry
and general labour invested in the area.
b) Marketing Constraints: The second cause for the sickness is related to marketing. The
sickness arrives due to liberal licensing policies, restrain of purchase by bulk purchasers, changes
in global marketing scenario, excessive tax policies by govt. and market recession.
c) Production Constraints: This is another reason for the sickness which comes under external
cause of sickness. This arises due to shortage of raw material, shortage of power, fuel and highprices, import-export restrictions.
d) Finance Constraints: The another external cause for the sickness of SSIs is lack of finance.
This arises due to credit restrains policy, delay in disbursement of loan by govt., unfavorable
investments, fear of nationalization.
8/2/2019 Sfm Project
http://slidepdf.com/reader/full/sfm-project 8/15
8/2/2019 Sfm Project
http://slidepdf.com/reader/full/sfm-project 9/15
9 | P a g e
TTL's role
For instance, TCIL has been shortlisted for an “intrusion proof cable network” project for laying
OFC cables for Defence Services. TCIL is to handle two packages totalling about 45,000 km of
cable network out of a total of about 70,000 km. TTL will supply a portion of the cables for this
project once it has received the formal approvals. Similarly, TCIL has bagged a $30-million
order in Sierra Leone, for which TTL will supply cables.
TCIL has also charted out a Rs 75-crore investment plan in TTL. This includes Rs 50 crore for a
fibre drawing plant and Rs 25 crore in an OPGW (Optical Ground Wire) Plant. OPGW is optical
fibre embedded in ground wire cables used on high power transmission lines enabling use of
power infrastructure for data transfer.
Fujikura, the technology and equity partner in TTL, has evinced interest in participating in these
investments, according to Mr M. Sengupta, Managing Director, TTL.
Addressing the AGM, Mr Batra said that under the rehabilitation package, TCIL loan of Rs
15.43 crore along with the bank consortium loan of Rs 7.58 crore will be converted to equity. A
portion of bank loan of Rs 9.83 crore will be settled under a one-time settlement and Rs 9.79
crore waived. TCIL will also provide a Rs-12.5 crore bridge loan for capital expenditure and
working capital. The accumulated losses of Rs 27 crore will be wiped out as a part of the
business plan.
8/2/2019 Sfm Project
http://slidepdf.com/reader/full/sfm-project 10/15
10 | P a g e
BY INDIAN GOVERNMENT
Tamilnadu Telecommunications Ltd, TTL as it is known to the people working in fiber optic
field in India and abroad have not been in good financial conditions for quite a long time. It is
one of the two fiber optic cable manufacturing company left in the southern part of India. The
another one in the southern India is Sudarshan telecom, which is located in Mysore, Karnataka,
neighboring state of Tamilnadu.
India's federal government is considering to support TTL and there is a proposal from the Board
of Industrial and Financial Reconstruction for reviving Tamilnadu Telecommunications Ltd.
Tamilnadu is a industry friendly state in India with considerable number of human potential.
Tamilnadu telecommunications Ltd, TTL is a fiber optic cable manufacturer who is supplying
cables to BSNL, Tata teleservices, Reliance, TCIL etc. TTL cables have made their entry to
foreign countries like Ethiopia, Kuwait, Oman, Bangladesh, Nepal, Jordan etc.
Tamilnadu Telecommunications has been declared a sick company and the Jelly filled telephone
cables unit, which was at Arakonam is not functioning. Telecommunications Minister A. Raja
has taken some initiatives with lawmakers in the upper house of Parliament to save Tamilnadu
telecommunications Ltd.Fiber optic cable manufacturing unit of Tamilnadu Telecommunications
Ltd is at Maraimalai nagar, not so far away from Chennai is on the way to Chengalpettu, which
is in the district of Kancheepuram. Though the unit at Arakkonam is closed its operation, some
of the employees were being absorbed in the fiber optic cable manufacturing unit at Maraimalai
nagar.
It is strategically important to have manufacturing unit for optical fiber cables in the southern
state of Tamilnadu, as most of India’s fiber optic cable companies are concentrated in the
western regions like Goa, Maharashtra, Sylvassa etc. Some of the fiber optic cable companies
and optical fiber manufacturing units in another southern state, Andhrapradesh were closed due
to severe competition from big companies or poor management.Generally, Sterlite dominates the
8/2/2019 Sfm Project
http://slidepdf.com/reader/full/sfm-project 11/15
11 | P a g e
Indian Fiber optic market and it has the major share in India’s fiber optic cable production and
supply. Birla Ericsson and Vindhya telelinks together comes second in India, followed by
Finolex in the third position.
The Indian government, through Telecommunications Consultants India Ltd., TCIL, holds
30.67% of Tamilnadu Telecommunications. Tamil Nadu Industrial Development Corp., a unit of
the state government in Tamil Nadu, has a 29.49% stake in the company, stock exchange data
showed.
8/2/2019 Sfm Project
http://slidepdf.com/reader/full/sfm-project 12/15
12 | P a g e
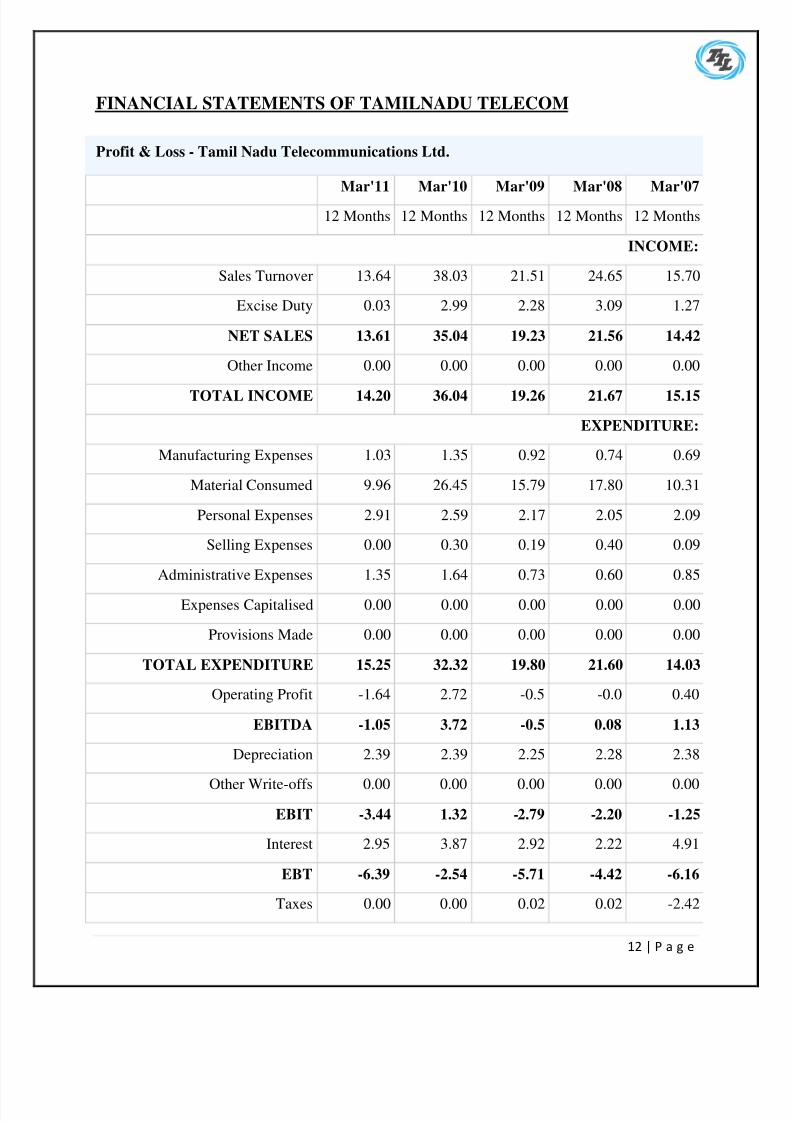
FINANCIAL STATEMENTS OF TAMILNADU TELECOM
Profit & Loss - Tamil Nadu Telecommunications Ltd.
Mar'11 Mar'10 Mar'09 Mar'08 Mar'07
12 Months 12 Months 12 Months 12 Months 12 Months
INCOME:
Sales Turnover 13.64 38.03 21.51 24.65 15.70
Excise Duty 0.03 2.99 2.28 3.09 1.27
NET SALES 13.61 35.04 19.23 21.56 14.42
Other Income 0.00 0.00 0.00 0.00 0.00
TOTAL INCOME 14.20 36.04 19.26 21.67 15.15
EXPENDITURE:
Manufacturing Expenses 1.03 1.35 0.92 0.74 0.69
Material Consumed 9.96 26.45 15.79 17.80 10.31
Personal Expenses 2.91 2.59 2.17 2.05 2.09
Selling Expenses 0.00 0.30 0.19 0.40 0.09
Administrative Expenses 1.35 1.64 0.73 0.60 0.85
Expenses Capitalised 0.00 0.00 0.00 0.00 0.00
Provisions Made 0.00 0.00 0.00 0.00 0.00
TOTAL EXPENDITURE 15.25 32.32 19.80 21.60 14.03
Operating Profit -1.64 2.72 -0.5 -0.0 0.40
EBITDA -1.05 3.72 -0.5 0.08 1.13
Depreciation 2.39 2.39 2.25 2.28 2.38
Other Write-offs 0.00 0.00 0.00 0.00 0.00
EBIT -3.44 1.32 -2.79 -2.20 -1.25
Interest 2.95 3.87 2.92 2.22 4.91
EBT -6.39 -2.54 -5.71 -4.42 -6.16
Taxes 0.00 0.00 0.02 0.02 -2.42
8/2/2019 Sfm Project
http://slidepdf.com/reader/full/sfm-project 13/15
13 | P a g e
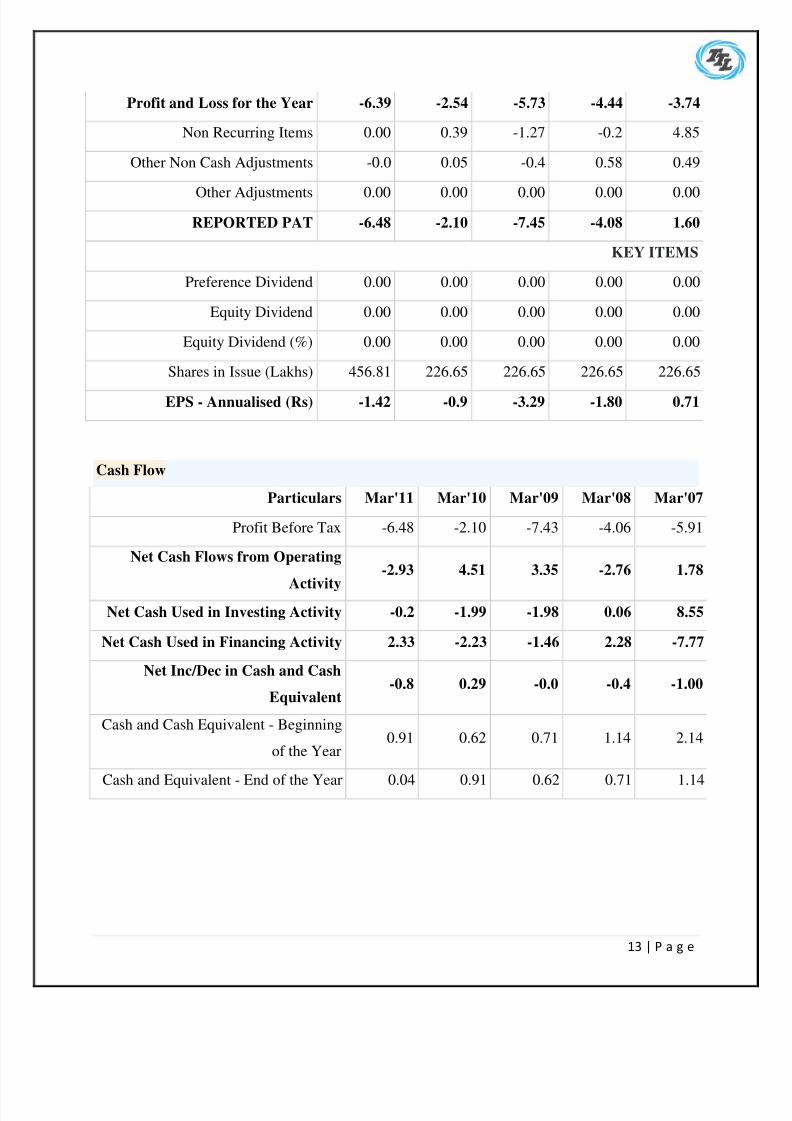
Profit and Loss for the Year -6.39 -2.54 -5.73 -4.44 -3.74
Non Recurring Items 0.00 0.39 -1.27 -0.2 4.85
Other Non Cash Adjustments -0.0 0.05 -0.4 0.58 0.49
Other Adjustments 0.00 0.00 0.00 0.00 0.00
REPORTED PAT -6.48 -2.10 -7.45 -4.08 1.60
KEY ITEMS
Preference Dividend 0.00 0.00 0.00 0.00 0.00
Equity Dividend 0.00 0.00 0.00 0.00 0.00
Equity Dividend (%) 0.00 0.00 0.00 0.00 0.00
Shares in Issue (Lakhs) 456.81 226.65 226.65 226.65 226.65
EPS - Annualised (Rs) -1.42 -0.9 -3.29 -1.80 0.71
Cash Flow
Particulars Mar'11 Mar'10 Mar'09 Mar'08 Mar'07
Profit Before Tax -6.48 -2.10 -7.43 -4.06 -5.91
Net Cash Flows from Operating
Activity
-2.93 4.51 3.35 -2.76 1.78
Net Cash Used in Investing Activity -0.2 -1.99 -1.98 0.06 8.55
Net Cash Used in Financing Activity 2.33 -2.23 -1.46 2.28 -7.77
Net Inc/Dec in Cash and Cash
Equivalent-0.8 0.29 -0.0 -0.4 -1.00
Cash and Cash Equivalent - Beginning
of the Year0.91 0.62 0.71 1.14 2.14
Cash and Equivalent - End of the Year 0.04 0.91 0.62 0.71 1.14
8/2/2019 Sfm Project
http://slidepdf.com/reader/full/sfm-project 14/15
14 | P a g e
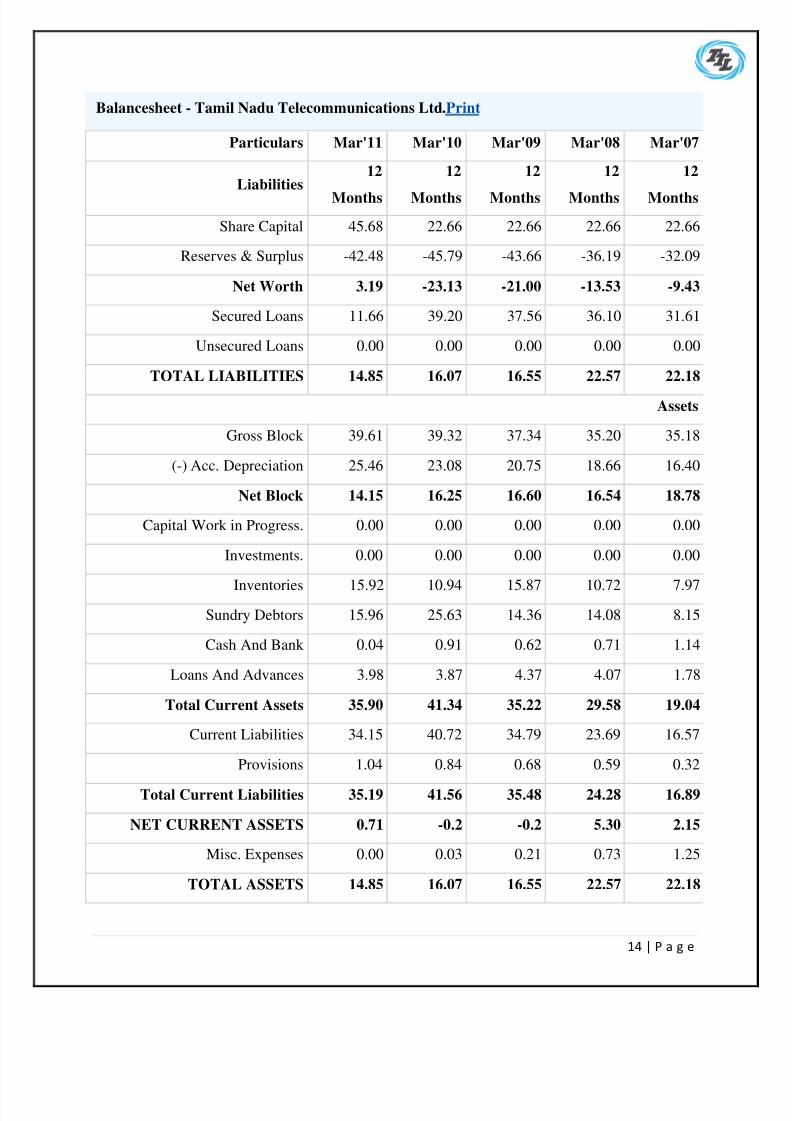
Balancesheet - Tamil Nadu Telecommunications Ltd.Print
Particulars Mar'11 Mar'10 Mar'09 Mar'08 Mar'07
Liabilities12
Months
12
Months
12
Months
12
Months
12
Months
Share Capital 45.68 22.66 22.66 22.66 22.66
Reserves & Surplus -42.48 -45.79 -43.66 -36.19 -32.09
Net Worth 3.19 -23.13 -21.00 -13.53 -9.43
Secured Loans 11.66 39.20 37.56 36.10 31.61
Unsecured Loans 0.00 0.00 0.00 0.00 0.00
TOTAL LIABILITIES 14.85 16.07 16.55 22.57 22.18
Assets
Gross Block 39.61 39.32 37.34 35.20 35.18
(-) Acc. Depreciation 25.46 23.08 20.75 18.66 16.40
Net Block 14.15 16.25 16.60 16.54 18.78
Capital Work in Progress. 0.00 0.00 0.00 0.00 0.00
Investments. 0.00 0.00 0.00 0.00 0.00
Inventories 15.92 10.94 15.87 10.72 7.97
Sundry Debtors 15.96 25.63 14.36 14.08 8.15
Cash And Bank 0.04 0.91 0.62 0.71 1.14
Loans And Advances 3.98 3.87 4.37 4.07 1.78
Total Current Assets 35.90 41.34 35.22 29.58 19.04
Current Liabilities 34.15 40.72 34.79 23.69 16.57
Provisions 1.04 0.84 0.68 0.59 0.32
Total Current Liabilities 35.19 41.56 35.48 24.28 16.89
NET CURRENT ASSETS 0.71 -0.2 -0.2 5.30 2.15
Misc. Expenses 0.00 0.03 0.21 0.73 1.25
TOTAL ASSETS 14.85 16.07 16.55 22.57 22.18
8/2/2019 Sfm Project
http://slidepdf.com/reader/full/sfm-project 15/15
15 | P a g e
ANALYSIS
Since 5 years profit after tax of TTL is declining which shows that
company’s spending is more than its earnings.
Since 5 years company is not declaring dividend.
EPS is also negative.
Liquidity condition is not good as decrease in cash and cash equivalents are
observed in statements.
Assets are less as compared to liabilities.
Due to severe sickness and cash crunch payment of interest on bank loan
including cash credit has not been provided.
The accounts have become irregular during the year due to industry reasons
and company’s continued struggle for revival.