Embed Size (px)
Citation preview

CIRSA- University of bologna
Sewage Sludge to Energy and materials: advanced urban-mining H2020 Project To-Syn-Fuel Liceo Galvani, Bologna 26 April 2018 Diego Marazza [email protected], Andrea Contin
University of Bologna, University of Bologna
Ravenna Campus, Italy
MATERIA
LE A
USO ESCLU
SIVO
DEGLI STU
DENTI

Sommario dei contenuti
1. il progetto To-Syn-Fuel (2SF): principi di funzionamento della tecnologia e applicazioni
2. la misura della sostenibilità del progetto 3. le sfide accettate da questo progetto 4. chi lo sta facendo e cosa possiamo fare
insieme
2

3
1 il progetto

The general concept
4
67 food intake
THIS IS WHAT WE ARE : Mass body: 21 Kg of Carbon
Kg CO2 Carbon/year
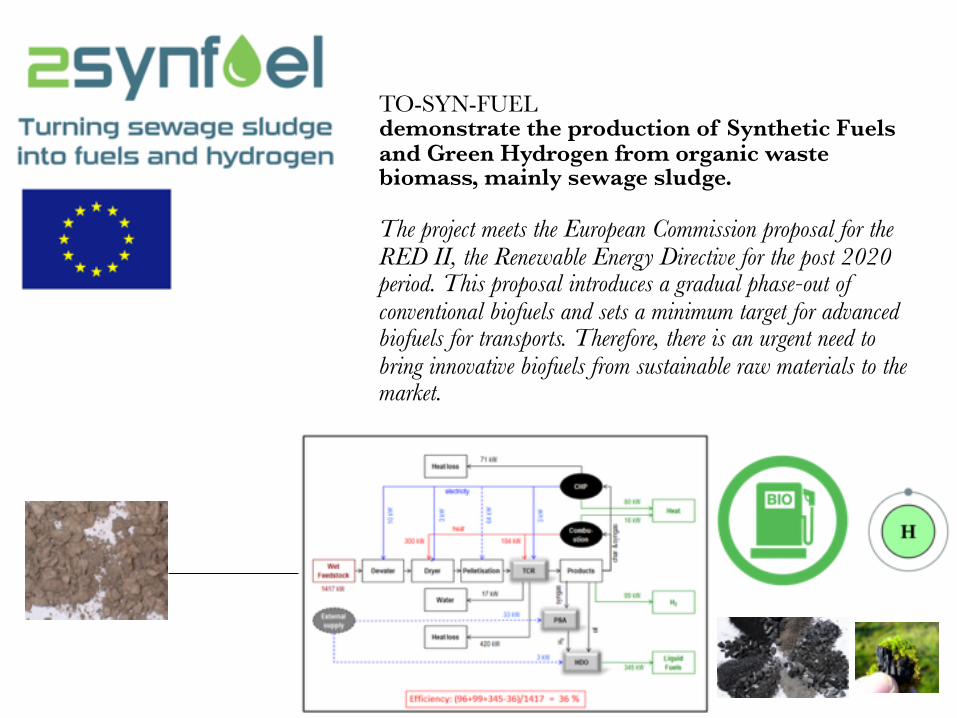
7 feces and urine: polysaccharides (e.g. starch, cellulose, or glycogen) lipids, proteins and polipeptides, pectins,
59 respiration
1 flatus, sweat,
and aromatic compounds
Aerobic Degradation: CO2
Anaerobic Digestion (artificial+spontaneous): CH4
Thermochemical (artificial as in 2SF): Syngas (hydrogen, carbon monoxide), fuel, bio-charcoal (biochar)
TO-SYN-FUEL demonstrate the production of Synthetic Fuels and Green Hydrogen from organic waste biomass, mainly sewage sludge.
The project meets the European Commission proposal for the RED II, the Renewable Energy Directive for the post 2020 period. This proposal introduces a gradual phase-out of conventional biofuels and sets a minimum target for advanced biofuels for transports. Therefore, there is an urgent need to bring innovative biofuels from sustainable raw materials to the market.
6
pectines
Feedstock carbon excreta (funny mix)

7

8
PROVISIO
NAL

The petrochemical way
9

Organic solid waste treatments
10
Examples: • Burning (after selection and purification) • HydroThermal Conditioning (high temperature/high
pressure water) • … • Thermo-Chemical Reactor (TCR) • Pyrolysis coupled to anaerobic digestion
based on pyrolysis
Thermochemical Pathway

Pyrolysis
11
Thermochemical decomposition of organic material at elevated temperatures (200–300 °C to >1000 °C) in the absence of oxygen
Products: char + high temp. vapors Vapors: condensate in liquid + gas
The feedstock can be inserted in the heated chamber by, e.g., an auger screw
Needs feedstock with low water content (excess water takes out heat from the process)
Feedstock form: depends on the system (e.g. for auger screw: pellets 5-10 cm)

Standard pyrolysis products
12
Char Liquid: oil+water (Syn)Gas
Tar in the oil
decreases with temperature decreases with temperature increases with temperature
increases with heating rate
Energy densities for intermediate pyrolysis:
feedstock: 15-20 MJ/kg
Char: 20-30 MJ/kg Oil: 15-25 MJ/kg Water: 1-5 MJ/kg Gas: 5-15 MJ/kg
Problems:
• the liquid is a mix of water (~40%) and oil (~60%) which does not separate by gravity
• the oil contains a large quantity of oxygen and polymerize
• the tar in the oil makes it viscous and acid • the hydrogen content in the syngas is low
(~20%)
TCR: Pyrolysis + reforming
13
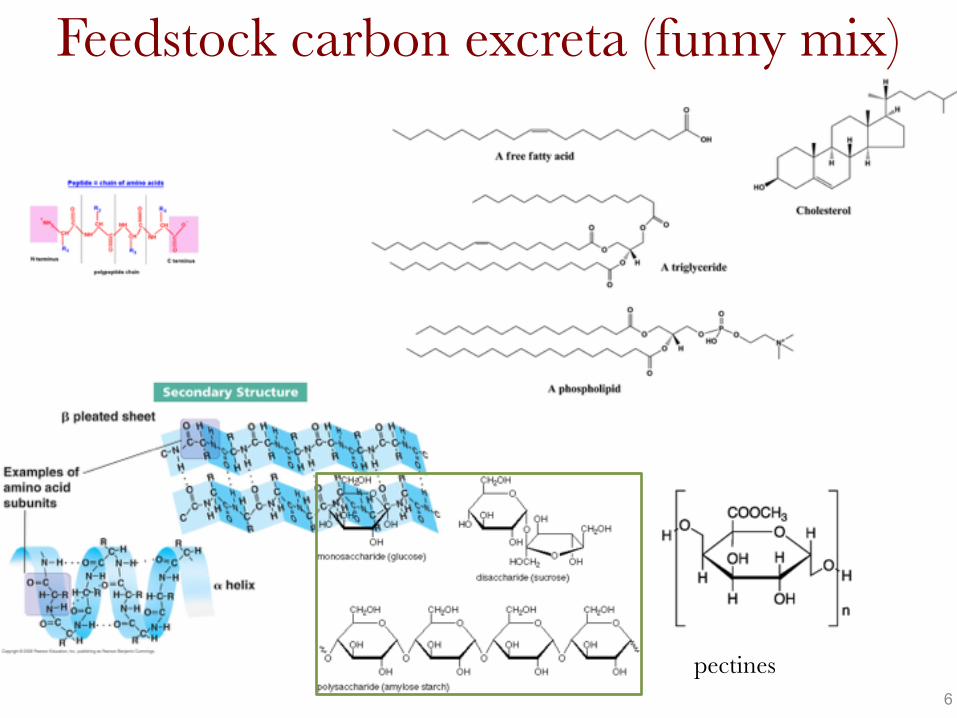
TCR: Thermo Catalytic Reforming
Very recent development (last 3 years)
Intermediate temperature pyrolysis (550-700 °C, heating time: minutes) so as to have sizable fractions of oil and char and low tar in the oil)
Hot char is used for vapor reforming at 700 °C
• The reforming produces smaller molecules in the oil and increases • significantly the quantity of hydrogen in the syngas • The water phase is easily separated from the oil by gravity • The solid fraction is "activated" char
Tested on municipal wastes, anaerobic digestate, sewage sludge

Reforming
14
Reforming is a process in which hydrocarbon molecules are rearranged into other molecules, usually with the loss of a small molecule such as hydrogen.

TCR: Pyrolysis + reforming
15
UnitAverage TCR Oil
Fossil Diesel
BiodieselFast Pyrolysis Oil
C wt% 81.05 84.7 77.2 54.2H wt% 7.8 13.2 13.2 6.9N wt% 2.4 <0.1 0.1 0.1S wt% 0.44 <0.1 <0.1 0.1O* wt% 6.9 1.4 9.4 38.9Water wt% 1.4 0.06 0.4 35.6Ash wt% <0.1 <0.01 <0.01 0.4TAN mgKOH/g 3.2 0.02 0.5 >90HHV MJ/Kg 37.3 44.7 39.3 24LHV MJ/Kg 35.7 41.9 36.2 20Viscosity cSt 10.9 3.01 8.2 >100
TCR oil directly blended with fossil Diesel at 50-50 volume ratio showing one phase

TCR: Pyrolysis + reforming
16
Syngas: energy production in IC engines
Oil: engine applications in fuel blends
Char: energy production, agronomic applications (soil conditioner)
Energy balance using residues from anaerobic digestion as feedstock

TCR: products upgrading to biofuels
17
Pre-treatment: - drying - pelletisation
TCR
Oil
Syngas
Char
Gasification/combustionProcess Heat
Methanol synthesis Methanol
Blending
Gasoline (EN228 standard)HDO/HDN/HDS
treatmentsDiesel (EN590
standard)
Residual heat
Gasoline (Bio)Diesel
Blended Fuel
Ash as fertiliser
H2 from syngas
Hydrodeoxigenated TCR-oil from digestate
Small scale tests

TCR: nutrients recovery
18
N, P, K recovery through biochar
Wet Feedstock
Anaerobic Digestion Digestate Drying
Dried digestate
Water
TCR
Biochar
Filter
N,K-enriched biochar
Crystalliza-tion
MAP (magnesium-ammonium- phosphate)
WaterN,K-enriched compost
Magnesium
To be developed

TCR: energy storage
19
Biobattery application Flexible energy supply
e.g. Co-combustion,
soil conditioner
e.g. Co-fermentation
1.8 Part power(for the Process)
8.2 Parts Biomass2.4 Part losses
0.3 watery Phase
3.6 Parts Biochar
3.7 Parts Gas/Oil1.8 Parts
Power1.9 Parts
heath
To be developed

TCR: Pyrolysis + reforming
20
TCR®: Thermo Catalytic Reforming
Very recent development (last 3 years)
Intermediate temperature pyrolysis (550-700 °C, heating time: minutes)
Products: char + high temp. vaporsHot char is used for vapor reforming at 700 °C
Vapors condensate in liquid + gas
• The reforming produces smaller molecules in the oil and increases the quantity of hydrogen in the syngas up to 40%
• The water phase is easily separated from the oil by gravity• Oil can be blended with diesel or biodiesel
Tested on municipal wastes, anaerobic digestate, sewage sludge
The process has been developed and patented by Fraunhofer Gesellschaft (UMSICHT Institute, Sulzbach-Rosenberg Branch)

TCR prototypes
21
30 kg/h pilot plant at Fraunhofer UMSICHT
2 kg/h lab-scale reactor

A TCR capable of treating 30 kg/h is now installed and operating at Fraunhofer UMSICHT
22

TCR industrial plant
23
300 kg/h Schwandorf - Germany 2018

Biorefinery
24
il concetto di bioraffineria
recupero di nutrienti: fosforoPROVIS
IONAL
H2020 Project TO-SYN-FUEL
25
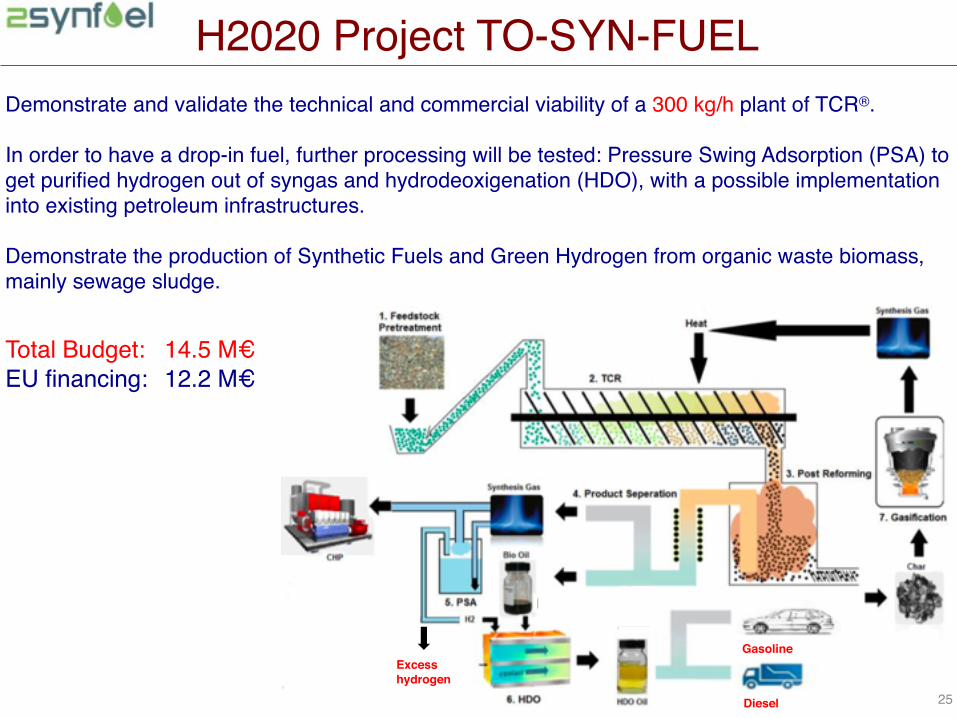
Demonstrate and validate the technical and commercial viability of a 300 kg/h plant of TCR®.
In order to have a drop-in fuel, further processing will be tested: Pressure Swing Adsorption (PSA) to get purified hydrogen out of syngas and hydrodeoxigenation (HDO), with a possible implementation into existing petroleum infrastructures.
Demonstrate the production of Synthetic Fuels and Green Hydrogen from organic waste biomass, mainly sewage sludge.
Total Budget: 14.5 M€EU financing: 12.2 M€
Excess hydrogen
Gasoline
Diesel

Bio-oil + HDO
26Source: Johannes Neumann et al., Upgraded biofuel from residue biomass by Thermo-Catalytic Reforming and hydrodeoxygenation, Biomass and Bioenergy 89 (2016) 91-97
Before HDO After HDO
Hydrodeoxygenation:R2O + 2 H2 → H2O + 2 RH
Catalysts: sulfided nickel-molybdenum or cobalt-molybdenum
Part of standard hydrotreating in oil refineries (HDS, HDN, HDO)
Drop-in fuel: directly usable in cars

A. Contin, Erice 2017
Process
27
Wet feedstock
Dewaterto 55% water
Dryerto 10% water Pelletizer TCR
90% water
9 kW
300 kW 185 kW
Water
Char
Syngas
Oil
PSA
H2
Tail gas
Gasifier
CHP BurnerHDO
H2
(45 kW)
23 kW
3 kW
Liquid fuel(340kW)
80 kW 500 kW
65 kW
Needs Production
Heat (kW)
Power (kW)
Heat (kW)
Power (kW)
Pre-treatment 485 15 (80)
Processing 26 500 80
Total 485 41 (106) 500 80
In addition to fuel and hydrogen, the system essentially produces its own
energy
1400 kW
3 kW 3 kW

Energy Balance
28
heat
feed
stoc
k
TCR
Oil 20%
Syngas 24%
Loss 5%
HDO-oil 22%
H2 3%
Tail gas 14%
Bio-char 29%
Loss 27%
Water 1%
341 kW
45 kW
PSA+HDO
Usefulproducts
Used to produce heat and power for the plant itself

R&D needs
29
TCR • go from lab-scale prototypes (2-30 kg/h) to industrial pilot scale
(300 kg/h) • test the uniformity of heating of feedstock • scan the feedstock-pyrolysis temperature-reforming
temperature-product quality parameter space • apply to large scale feedstock treatment (uniformity checks)
Coupled pyrolysis/anaerobic digestion • go from lab-scale prototypes (5 kg/h) to industrial pilot scale
(50 kg/h) • apply the method to different feedstocks
PROVISIO
NAL
H2020 Project TO-SYN-FUEL
30
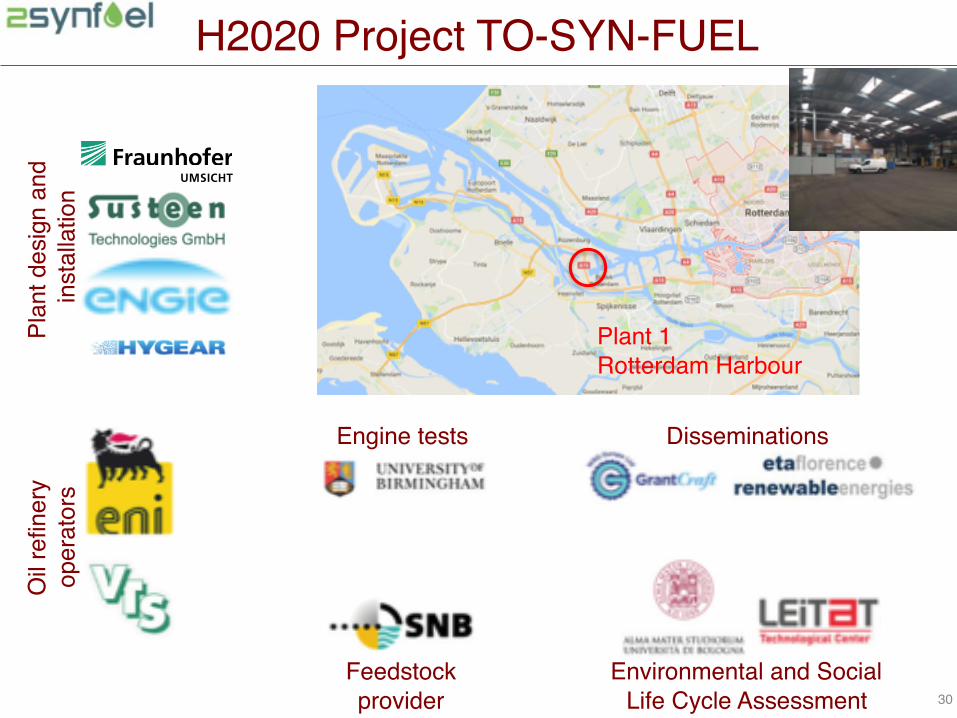
Plant 1Rotterdam Harbour
Plan
t des
ign
and
inst
alla
tion
Oil
refin
ery
oper
ator
s
Feedstock provider
Engine tests
Environmental and SocialLife Cycle Assessment
Disseminations

Cost for a 3 tons/h Plant
31
Capital costsEquipment purchase cost (PCE) 7,200,000 €Construction costs 3,600,000 €Physical Plant Cost (PPC) 10,800,000 €Engineering, Contractors, Contingency 2,700,000 €Full Cost (FC) 13,500,000 €Working capital (3% of FC) 400,000 €Total Capital Cost (TCC) 13,900,000 €
Operating costsTotal Operating costs 980,000 €
Present cost of gasoline at the refinery gate 0.58 €/kg [EIA, 2016]
Present cost of H2 2.55 €/kg [DOE, 2012]
ResultOperation hours/year 7,000 h/yTotal products income 1,434,000 €/yAvoided gate fees (10 €/ton) 1,890,000 €/yTotal income 3,324,000 €/yGross profit 2,344,000 €/yNet profit 1,641,000 €/yPayback time 8.5 y
Note: 3 tons/h is the maximum foreseable size of a TCR/PSA/HDO plant

Delocalization
32
Production of sewage sludge: approx. 30 kg/inhabitant/y (dry matter)3 t/h 21000 t/y 700,000 inhabitants
Delocalization is an advantage
Milano-Nosedo Wastewater Treatment Plant (1,200,000 inhabitants)

How many plants?
33
Feedstock Europe (million tons/year d.m.)
World (million tons/year d.m.)
Sewage sludge 12 75
Anaerobic digestion digestate 100 (est.) 200 (est.)
Farming residues 120 500 (est.)
Municipal Organic Waste 450 2,200
Agro-food industry residues 2,000 (est.) 5,000 (est.)
TOTAL ~2,700 ~ 8,000
Production upper limit HDO-oil ~ 250(~ 10,000 PJ)
~ 700(~ 30,000 PJ)
No. of plants (3 tons/h) 130,000 380,000
90 b€/y in 20 years
Note: crude oil imports in EU: 140 b€/yhttp://ec.europa.eu/energy/en/data-analysis/eu-crude-oil-imports
To be tested in follow-up projects

34
2 sostenibilità

HOW did they get this?

HOW TO EVALUATE CHANGES? BETTER A COTTON MADE T-SHIRT OR SYNTHETIC ONE?
P1 P2 P3INPUT = Extraction factors (x) and impact on resource availability
OUTPUT = Pressure factors (x) and impact on health & environment
reference
Extraction Pressure
Midpoint Endpoint (Protection area)
Impa
ct (C
)
Characterisation factors CF for amount m of input or output can be get from inventories
Typical response with midpoint indicators
Models describe and quantify impacts
Intervention
LCA
actual
Functional Unit (FU) e.g. t-shirt dresnable 2000 times
Softwares provide to us CFs and allow modelling
Stepwise and standardised procedure (ISO 14040 + ILCD)
GoalScopeInventoryImpactInterpretation
Key words
PROVISIO
NAL
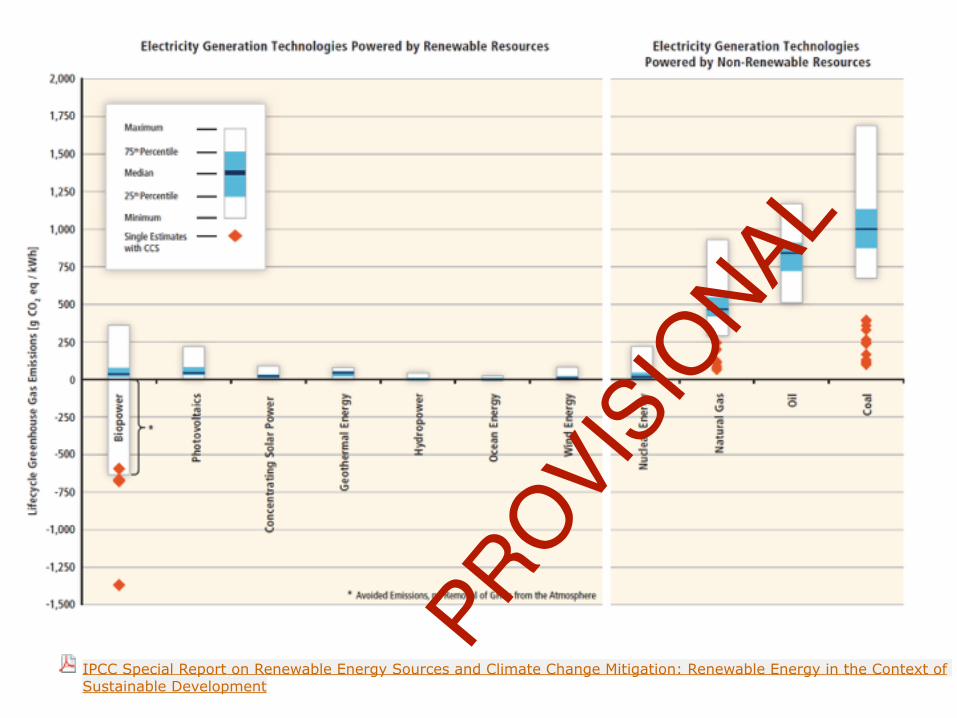
IPCC Special Report on Renewable Energy Sources and Climate Change Mitigation: Renewable Energy in the Context of Sustainable Development
PROVISIO
NAL

supply chain: from sewage sludge to advanced biofuel and green hydrogen;
when considering LCA and the business as usual scenario (counterfactuals) we shall consider sewage sludge treatments, including anaerobic digestion.
SEWAGE SLUDGE PRODUCT
FU = 1 TON OF TREATED SLUDGE
REFERENCE
SEWAGE SLUDGE PRODUCT
TO SYN FUEL
g COeq/kg
TO-SYN- FUEL - CARBON FOOTPRINT
Biochar
Bioenergy
Spent sewage sludge
Focus is on the measure of biogenic emissions and storage (biochar) accountability
PROCESSING LINE
PROVISIO
NAL

TYPICAL BIOGENIC EMISSIONS BROUGHT ON BY ANTHROPOGENIC ACTIVITIES
combustion livestock enteric emissions & cropland oxidation
fugitive emissions of biogas/biomethane for transportation and other fermentation process along the supply chain

TOPIC ISSUES
1. metrics (GWP, GTP) 2. carbon sequestration 3. baseline choice
(counterfactuals scenarios)PROVIS
IONAL
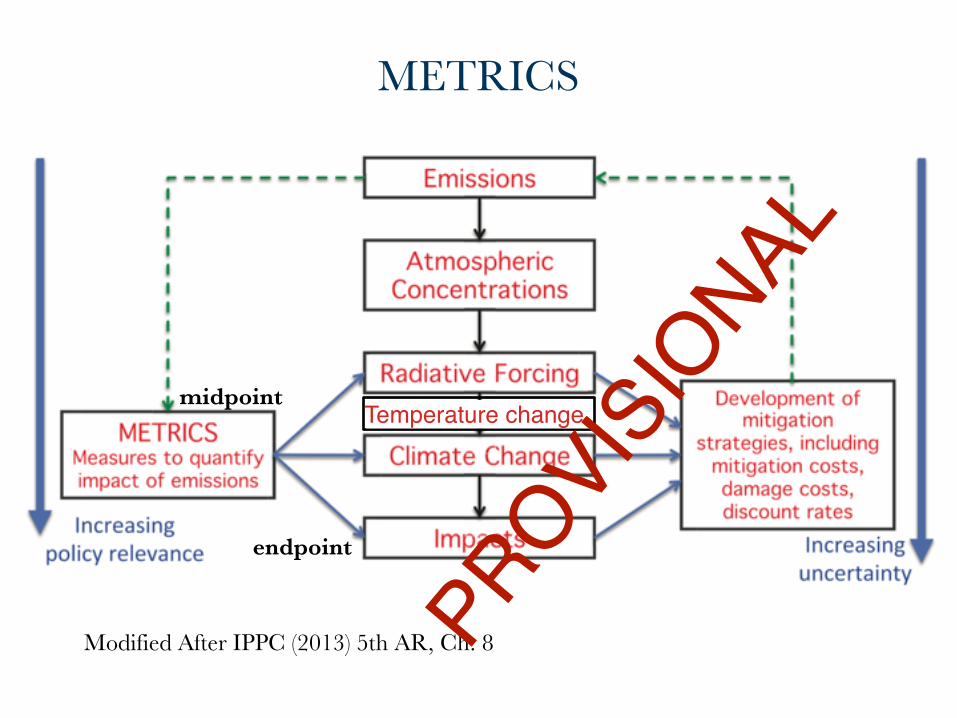
endpoint
midpoint
METRICS
Modified After IPPC (2013) 5th AR, Ch. 8
Temperature change
PROVISIO
NAL

Global warming potential (GWP) “relative cumulative forcing index” (IPCC 2013)
• [kgCO2 -eq kg−1 ] Index of total energy added to the atmosphere over a given time horizon
• Based on radiative forcing of greenhouse gases (GHG) in the atmosphere
• GWP measures the relative effect of the i GHG vs CO2
CO2 (cumulative function is enhanced)
IPPC (2013) 5th AR, Ch. 8Relative cumulative forcing index’ would be more appropriateIRF = Impulse Response Function
PROVISIO
NAL

Global Temperature change potential (GTP)(IPCC 2013)
• [kgCO2-eqkg−1] the change in global mean surface temperature at a chosen point in time in response to an emission pulse relative to that of CO2
• GWT measures the relative effect of the i GHG vs CO2 : likewise GWP, can be used for weighting the emissions to obtain ‘CO2 equivalents’ ; time horizon has a strong effect on the metric values
• similar to GWP, yet may be more relevant for determining environmental consequences of emissions; relevant as for black carbon (BC)
IPPC (2013) 5th AR, Ch. 8
GTP(t)i = AGTP(t)i / AGTP(t)CO2 = ∆T((t)i /∆T(t)CO2
A. Levasseur et al. / Ecological Indicators 71 (2016) 163–174
CO2 compared
GWP CH4
PROVISIO
NAL

NEP(t) is the net ecosystem productivity normalized to the biomass yield that is extracted and utilized as a product (i.e. normalized to the unit emission profile e(t)).
GWPbio indicator based on Impulse Response Function(IRF) aka Cherubini method (2011): convolution between atmospheric CO2 decay and carbon sequestration in biomass (Accepted by IPPC 5th AR)
e(t) is the unit distributed emission profile of the
carbon that oxidizes to the atmosphere
decay IRF
G. Guest et al. / Environmental Impact Assessment Review 43 (2013) 21–30
If this unit of net additional CO2 is sequestered at
RBP = biomass resource pool
HBP = harvested biomass pool
PROVISIO
NAL
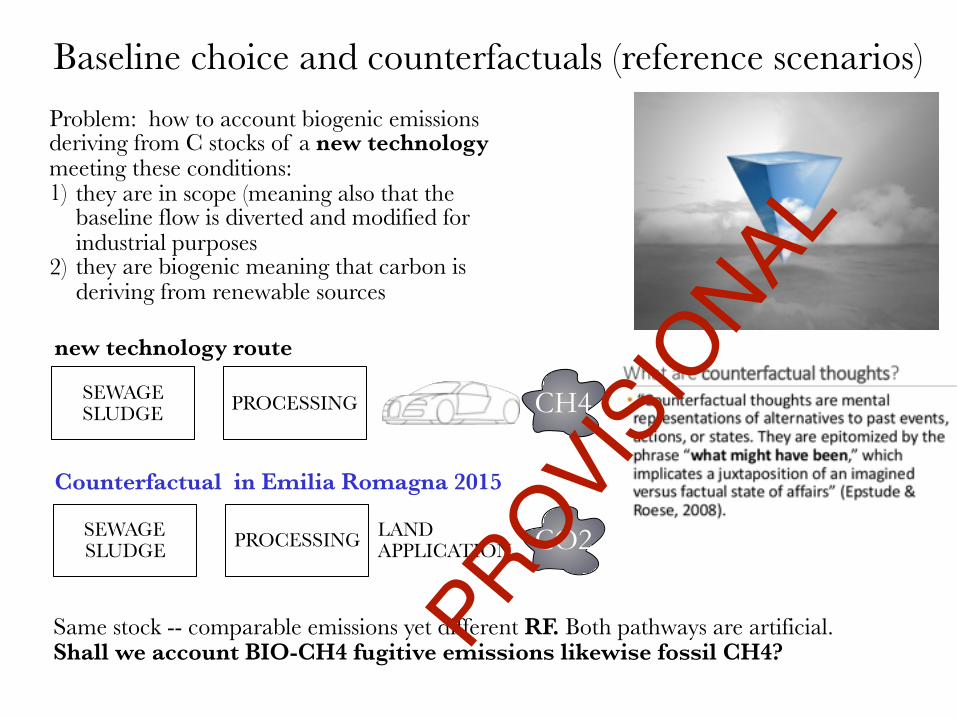
Baseline choice and counterfactuals (reference scenarios)
CH4SEWAGE SLUDGE
Problem: how to account biogenic emissions deriving from C stocks of a new technology meeting these conditions: 1) they are in scope (meaning also that the
baseline flow is diverted and modified for industrial purposes
2) they are biogenic meaning that carbon is deriving from renewable sources
PROCESSING
SEWAGE SLUDGE PROCESSING CO2
Counterfactual in Emilia Romagna 2015
LAND APPLICATION
Same stock -- comparable emissions yet different RF. Both pathways are artificial. Shall we account BIO-CH4 fugitive emissions likewise fossil CH4?
new technology route
PROVISIO
NAL
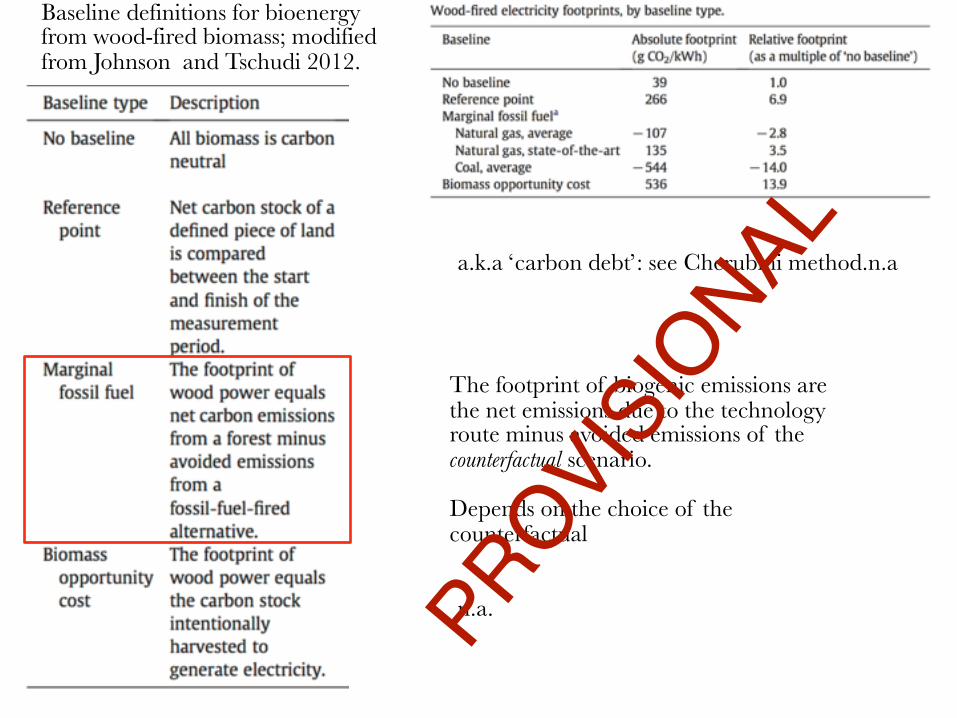
Baseline definitions for bioenergy from wood-fired biomass; modified from Johnson and Tschudi 2012.
The footprint of biogenic emissions are the net emissions due to the technology route minus avoided emissions of the counterfactual scenario.
Depends on the choice of the counterfactual
n.a.
a.k.a ‘carbon debt’: see Cherubini method.n.a
PROVISIO
NAL

RED II Renewable Energy
Directive
PROVISIO
NAL
48
3 LE SFIDE
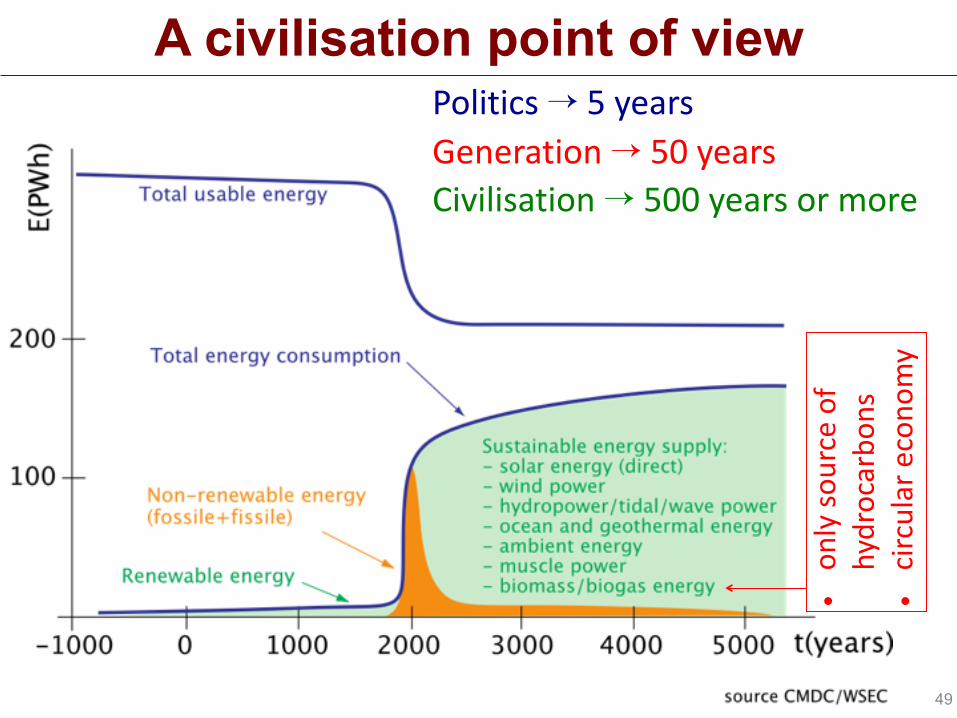
A civilisation point of view
49
Politics → 5 years Generation → 50 years Civilisation → 500 years or more
•on
ly so
urce
of
hydr
ocar
bons
•ci
rcul
ar e
cono
my

The problemWorld solid waste production by urban population: 1.3 billion tons/year ➯ 440 kg/capita/year, out of which nearly half is organic.
Source: The World Bank, WHAT A WASTE - A Global Review of Solid Waste Management (2012)
Very large stock of secondary material to be managed in the best possible way
50
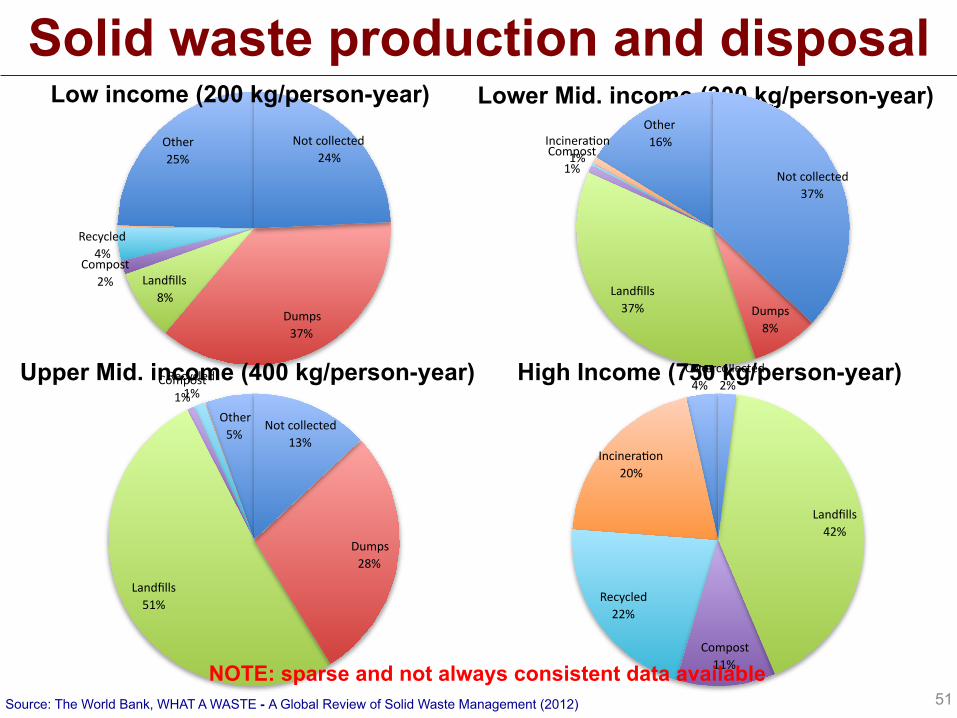
Solid waste production and disposal
Source: The World Bank, WHAT A WASTE - A Global Review of Solid Waste Management (2012)
Other 25%
Recycled 4%
Compost 2% Landfills
8%Dumps
37%
Not collected 24%
Other 5%
Recycled 1%
Compost 1%
Landfills 51%
Dumps 28%
Not collected 13%
Other 4%
Incinerakon 20%
Recycled 22%
Compost 11%
Landfills 42%
Not collected 2%
Low income (200 kg/person-year) Lower Mid. income (300 kg/person-year)
Upper Mid. income (400 kg/person-year) High Income (750 kg/person-year)
NOTE: sparse and not always consistent data available51
Other 16%Incinerakon
1%Compost 1%
Landfills 37% Dumps
8%
Not collected 37%
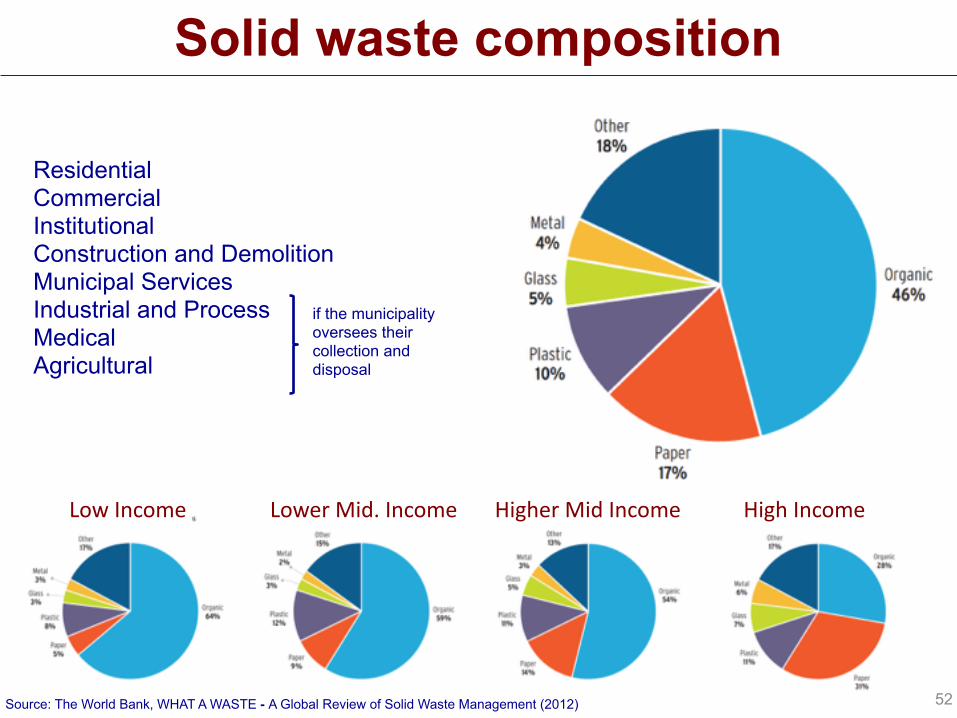
Solid waste composition
Source: The World Bank, WHAT A WASTE - A Global Review of Solid Waste Management (2012)
Residential Commercial Institutional Construction and Demolition Municipal Services Industrial and Process Medical Agricultural
if the municipality oversees their collection and disposal
52
Low Income Lower Mid. Income Higher Mid Income High Income

Projection to 2025
Source: The World Bank, WHAT A WASTE - A Global Review of Solid Waste Management (2012)
Urban population 2.9 4.3 billion
Solid waste production
434 1.3
511 kg/capita/year 2.2 billion tons/year
2010 2025
total organic 1 billion tons/year energetic content 3000 kcal/kg total energy content 1.3x10¹⁹ J/year
303 Mtoe/year2.2x109 barrels/year
total oil production 3x10¹⁰ barrels/year
Percent of oil production = 7.5%
53
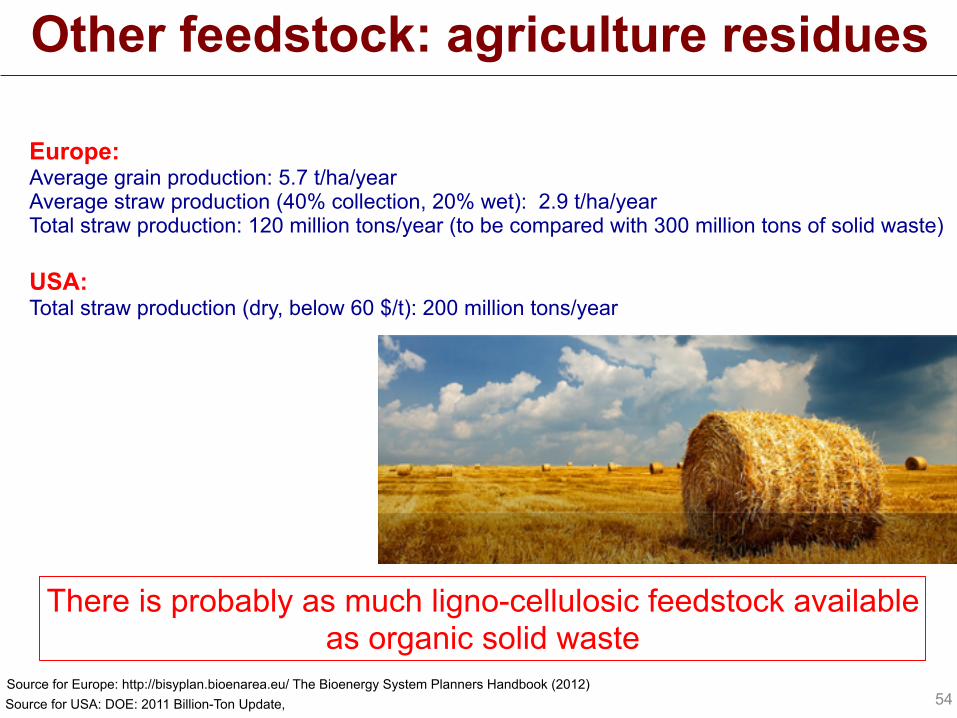
Other feedstock: agriculture residues
Europe: Average grain production: 5.7 t/ha/year Average straw production (40% collection, 20% wet): 2.9 t/ha/year Total straw production: 120 million tons/year (to be compared with 300 million tons of solid waste)
Source for Europe: http://bisyplan.bioenarea.eu/ The Bioenergy System Planners Handbook (2012)Source for USA: DOE: 2011 Billion-Ton Update,
USA: Total straw production (dry, below 60 $/t): 200 million tons/year
There is probably as much ligno-cellulosic feedstock available as organic solid waste
54

The Project
55
Large scale pilot pyrolyser with reforming
• capacity: 300 kg/h (2,100 t/year, dried biomass) • dealing with organic solid wastes, agricultural residues, forestry management products,
residues from wood manufacture industries
Small scale pilot pyrolyser without reforming coupled to an anaerobic digestor
• capacity: 50 kg/h (400 t/year) • fitting in a 20" standard container, dealing with all kinds of food production wastes from
farms and industrial manufacturers (canning, juice and wine production, etc.)
Present financing from European Regional Funds (test TCR 2kg/h): Thermo-chemical treatment for zero waste (product upgrading – small scale) – budget 1 M€ total
Larger co-financing looked at through three EU H2020 Proposals (deadlines September 8th, 13thand 16th): • Products and Chemicals from low value agricultural residues – (ProChem) – budget 11 M€ • Advanced biofuel pathways (TO-SYN-FUEL) – budget 12.5 M€ • Sustainability Transition Assessment and Research of Bio-based Products (STAR-ProBio) –
budget 5 M€

Conclusions
56
• Pyrolysis is a way to treat all kind of organic residues
• Avoidance of gate fees makes the system economically viable
• De-localization is an important advantage
A. Contin, Erice 2017
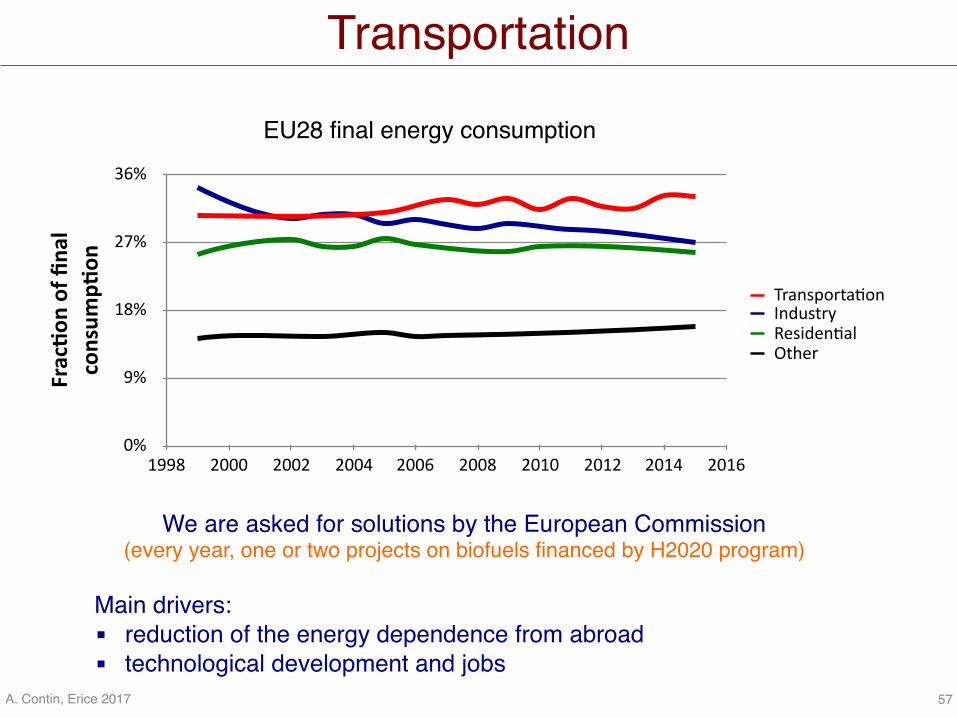
Transportation
57
Frac
Xon
of fi
nal
cons
umpX
on
0%
9%
18%
27%
36%
1998 2000 2002 2004 2006 2008 2010 2012 2014 2016
TransportakonIndustryResidenkalOther
We are asked for solutions by the European Commission(every year, one or two projects on biofuels financed by H2020 program)
Main drivers:▪ reduction of the energy dependence from abroad▪ technological development and jobs
EU28 final energy consumption
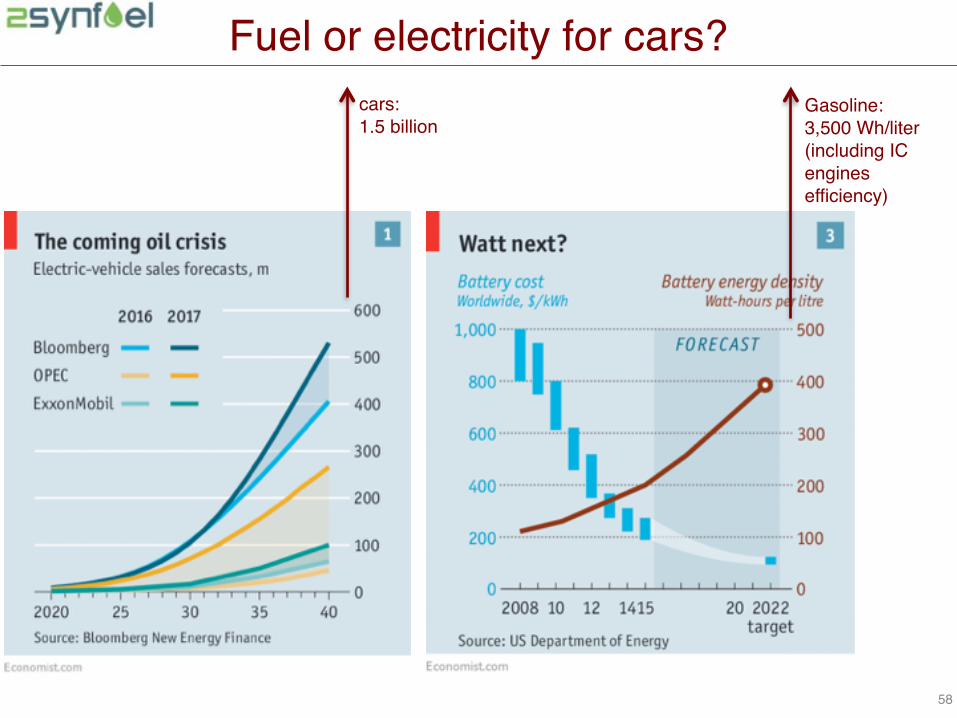
Fuel or electricity for cars?
58
Gasoline:3,500 Wh/liter(including IC engines efficiency)
cars:1.5 billion

Aviation
59
Jet Fuel accounts for 12% of consumption in
USA

A. Contin, Erice 2017
Which biomass? And which kind of technology for biomass?
60
Cultivated crops, agricultural waste and forest residues ➟ Combustion
Oil seed crops (esterification) ➟ Bio-diesel (esterified oil)
Starch or glucose-producing plants (fermentation) ➟ Bio-ethanol
Wet biomass (anaerobic digestion) ➟ Bio-methane
Any residual biomass (pyrolysis) ➟ Bio-oils for fuel or as substitute for oil in the chemical industry
Combustion ➟ low efficiency for electricity (25-30%), particulate emissions – essentially dedicated to heat production
Bio-diesel ➟ Needs dedicated crops (with low productivity), marginal production from used cooking oil and animal grease
Bio-ethanol ➟ Needs dedicated crops, no commercial plant yet for enzyme destruction of lignin to treat ligno-cellulosic material
Bio-methane ➟ Relatively low production (about 60% of organic input material is transformed), digestate may be used as fertilizer
Pyrolysis ➟ Treat all kind of biomass, need of pretreatment (drying and maybe pellettisation)

A. Contin, Erice 2017
1st generation biomass: dedicated crops
61
G. Fischer, S. Prieler, H.van Velthuizen, G. Berndes, A. Faaij, M. Londo, M. de Wit, Biofuel production potentials in Europe: Sustainable use of cultivated land and pastures. Part II: Land use scenarios, Biomass and Bioenergy, 34 (2010 ) 173-187 (REFUEL FP7 project)
Energy yield with 1st generation biofuels
IEA - International Energy Outlook 2016Europe consumption
gasoline+diesel 13,500 PJjet fuel 2,200 PJtotal 15,700 PJ
Strong competition with foodTotal yield: 2,000 ÷ 4,000 PJ
A. Contin, Erice 2017
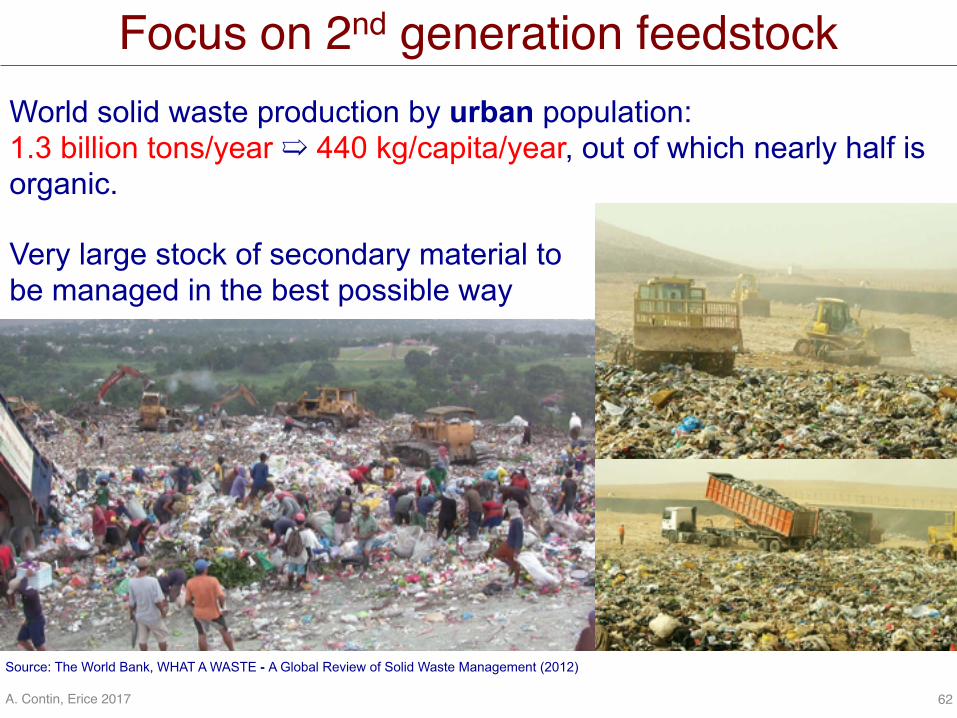
Focus on 2nd generation feedstockWorld solid waste production by urban population: 1.3 billion tons/year ➯ 440 kg/capita/year, out of which nearly half is organic.
Source: The World Bank, WHAT A WASTE - A Global Review of Solid Waste Management (2012)
Very large stock of secondary material to be managed in the best possible way
62
A. Contin, Erice 2017
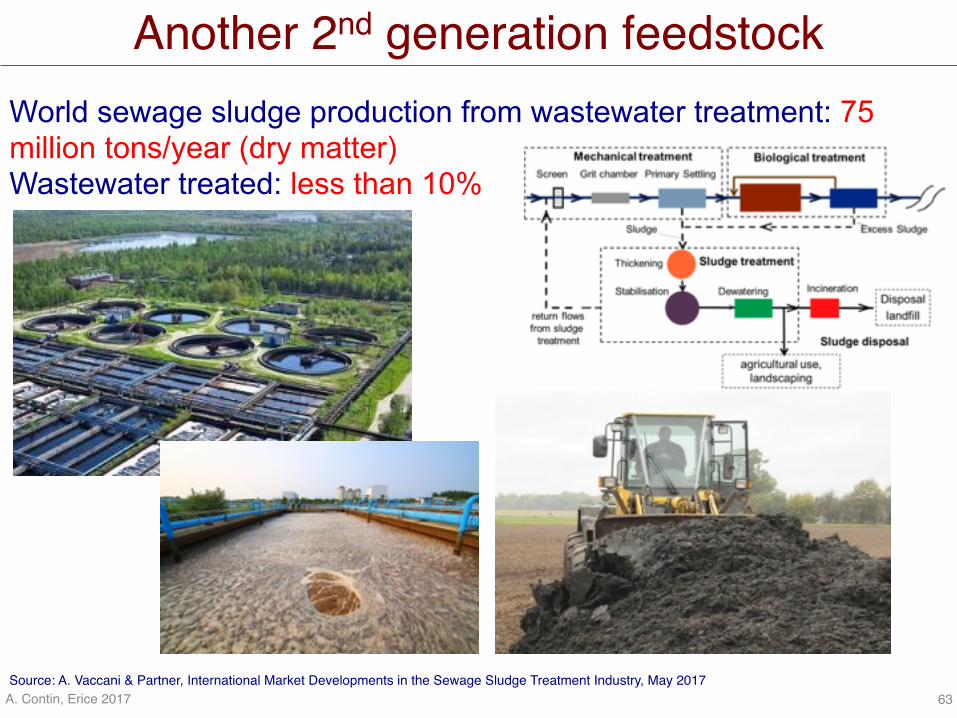
Another 2nd generation feedstockWorld sewage sludge production from wastewater treatment: 75 million tons/year (dry matter) Wastewater treated: less than 10%
Source: A. Vaccani & Partner, International Market Developments in the Sewage Sludge Treatment Industry, May 2017 63
© antiksu - Fotolia.com

Yet another 2nd generation feedstockEurope: Average grain production: 5.7 t/ha/year Average straw production (40% collection, 20% wet): 2.9 t/ha/year Total straw production: 120 million tons/year (to be compared with 300 million tons of solid waste)
Source for Europe: http://bisyplan.bioenarea.eu/ The Bioenergy System Planners Handbook (2012)Source for USA: DOE: 2011 Billion-Ton Update,
USA: Total straw production (dry, below 60 $/t): 200 million tons/year
There is probably as much ligno-cellulosic feedstock available as organic solid waste
64

A. Contin, Erice 2017
Technology readiness level
65
Energy Technology Perspectives 2010

WHY TO GO FOR BIOBASED PRODUCTS
StyrenePhenolTolueneEthyleneAmmoniaAmmineFertilisers
The unique selling point of materials from renewable biomass is chemical functionality. The same functionality can be achieved by processing virgin naphtha (fossil oil) at price of higher energy expenditure.
7.13 GJ/ton58 GJ/ton
POTENTIAL ADVANTAGES- diminished GWP,
acidification potential, eutrophication and persistent pollutants
- some biobased products are biodegradable
Optimal array of 1 t of intermediate biobased product from petrochemical route and from biomass (grass) and related cumulative energy demand (CED)
Brehmer et al. doi:10.1016/j.cherd.2009.07.010


75
4 NOI

76
slide di presentazione del gruppo:
chi sono io e cosa faccio nella vita
cosa fa il nostro gruppo
dove siamo collocati
77
Cosa possiamo fare insieme:
impianto da 2 kg/h da noi da settembre:
visite
newsletter del progetto
1 progetto alternanza scuola lavoro?

78
Prof. Andrea ContinDirector Research Center for Environmental SciencesUniversity of BolognaRavenna Campus, Italy
[email protected]://www.cirsa.unibo.it/en/research/environmental-management-research-group-emrg
Thanks for your attention