Embed Size (px)
Citation preview
SEWAGE PUMPING STATIONS
SEWAGE PUMPING STATIONS
Purpose:These are required to ELEVATE and TRANSPORT wastewater when
– Continuation of gravity flow is no longer feasible and there is a need to raise the HGL of sewer.
– Any obstacle lies in the path of sewer (e.g. river, canal etc)
– Receiving stream is higher than the sewer.
Pumps
Pumps for Sewage:Centrifugal, single suction, non-clogging type pumps are normally used. They have impellers having two or three vanes. PUMPS SUCTION PIPE is usually larger than the DISCHARGE pipe by about 25%.
SMALLEST discharge pipe =75mm (3”)SMALLEST suction pipe =100mm (4”)
[WASA]
4
Type of PumpsType of Pumps
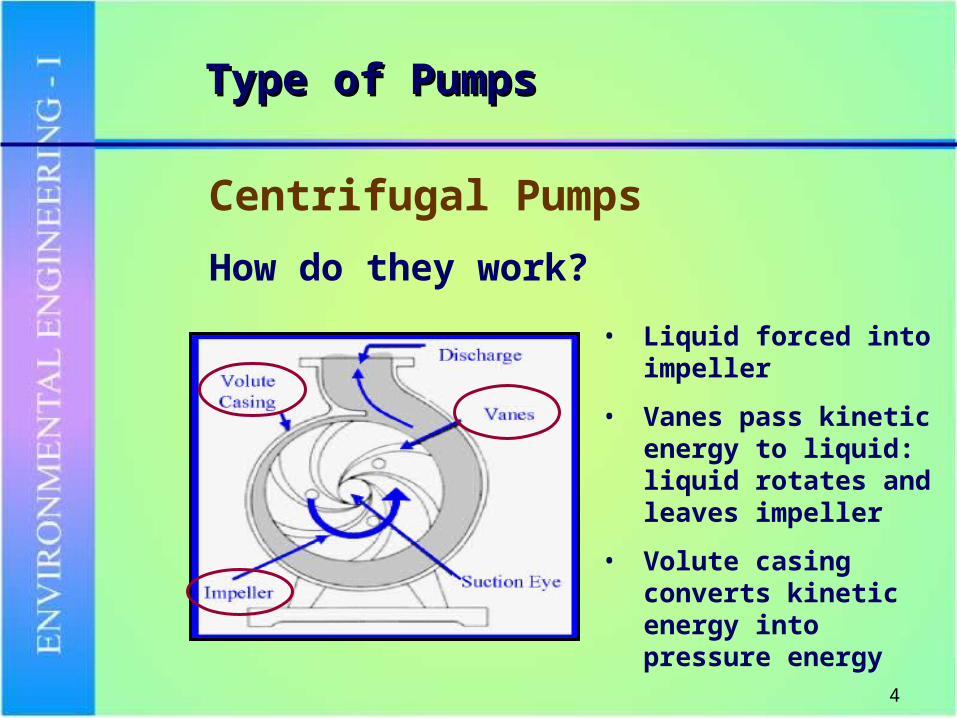
Centrifugal Pumps
How do they work?
• Liquid forced into impeller
• Vanes pass kinetic energy to liquid: liquid rotates and leaves impeller
• Volute casing converts kinetic energy into pressure energy
5
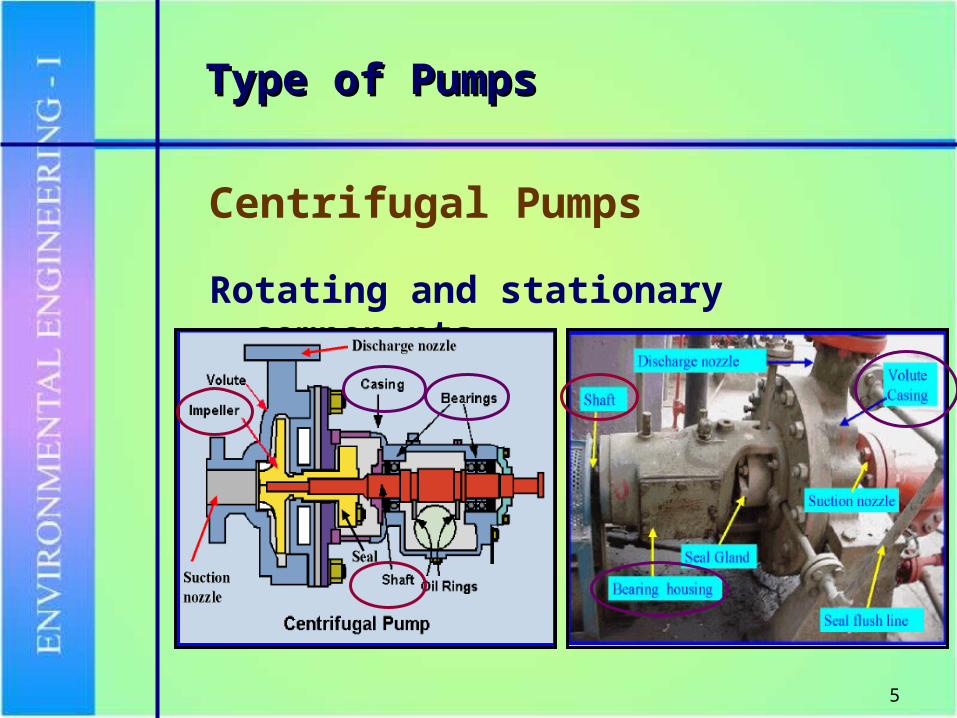
Type of PumpsType of Pumps
Centrifugal Pumps
Rotating and stationary components
6
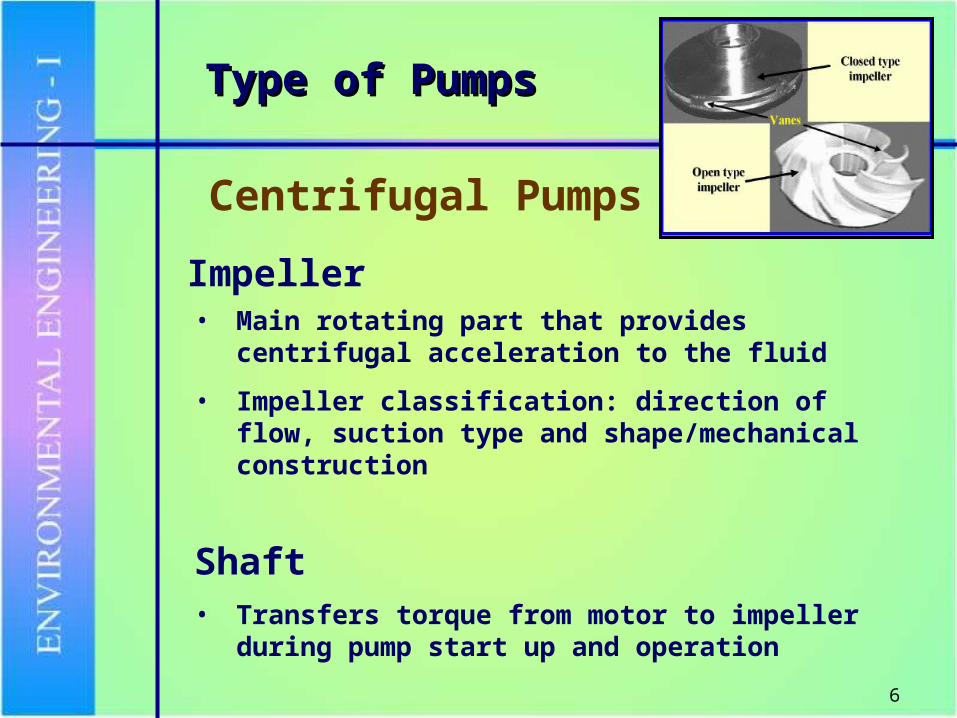
Type of PumpsType of Pumps
Centrifugal Pumps
Impeller• Main rotating part that provides centrifugal
acceleration to the fluid
• Impeller classification: direction of flow, suction type and shape/mechanical construction
Shaft• Transfers torque from motor to impeller during pump
start up and operation
7
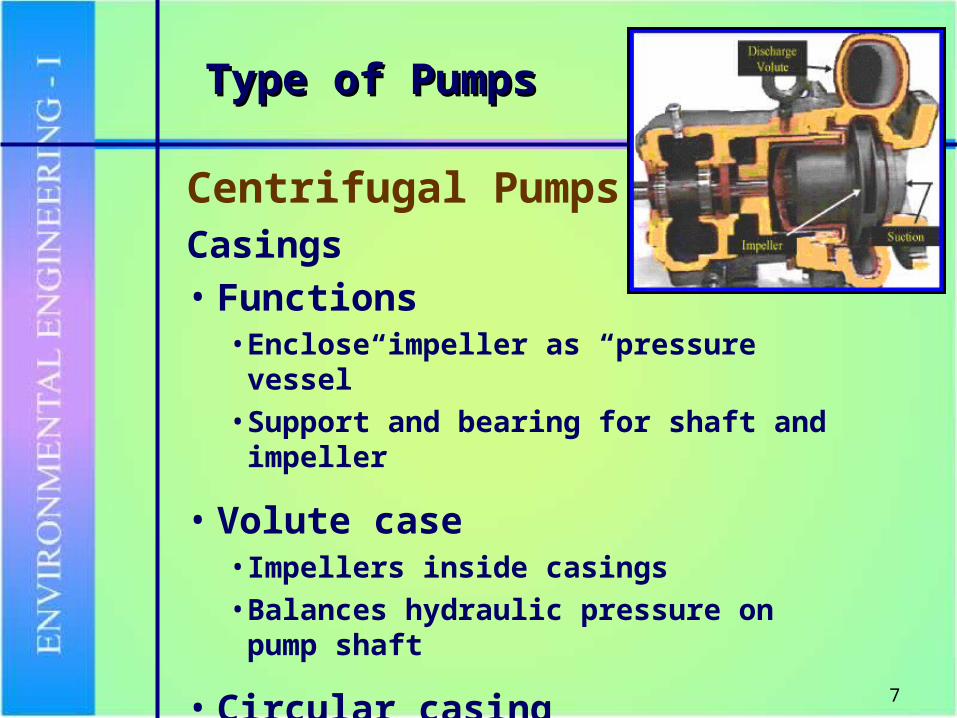
Type of PumpsType of Pumps
Centrifugal PumpsCasings• Functions
• Enclose impeller as “pressure vessel”
• Support and bearing for shaft and impeller
• Volute case• Impellers inside casings
• Balances hydraulic pressure on pump shaft
• Circular casing• Vanes surrounds impeller
• Used for multi-stage pumps
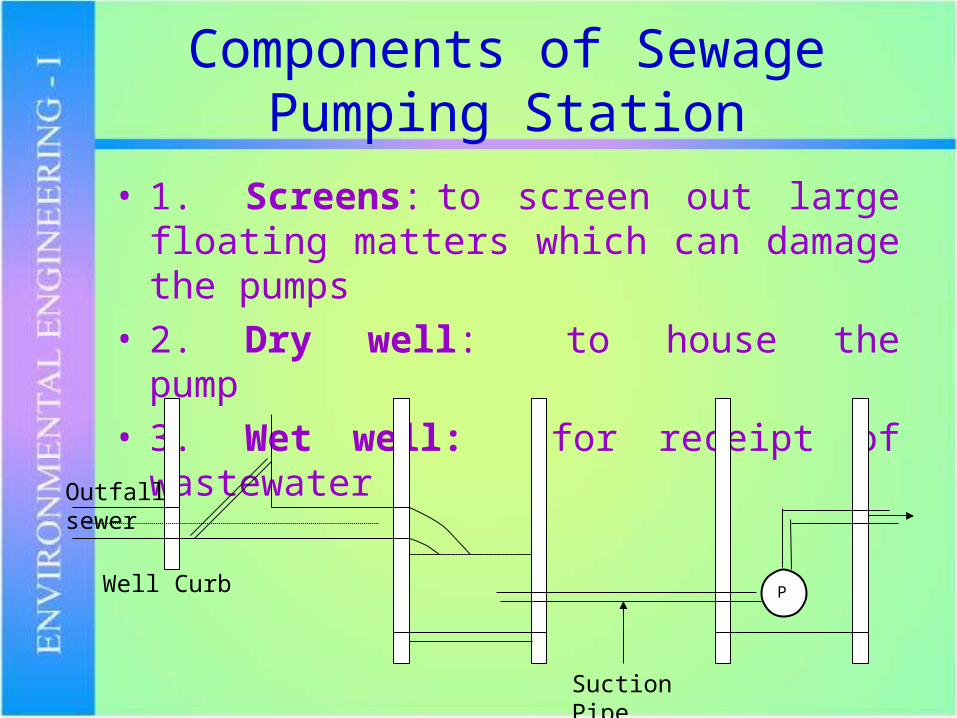
Components of Sewage Pumping Station
• 1. Screens: to screen out large floating matters which can damage the pumps
• 2. Dry well: to house the pump• 3. Wet well: for receipt of
wastewater
P
Suction Pipe
Well Curb
Outfall sewer
GENERAL DESIGN CONSIDERATIONS
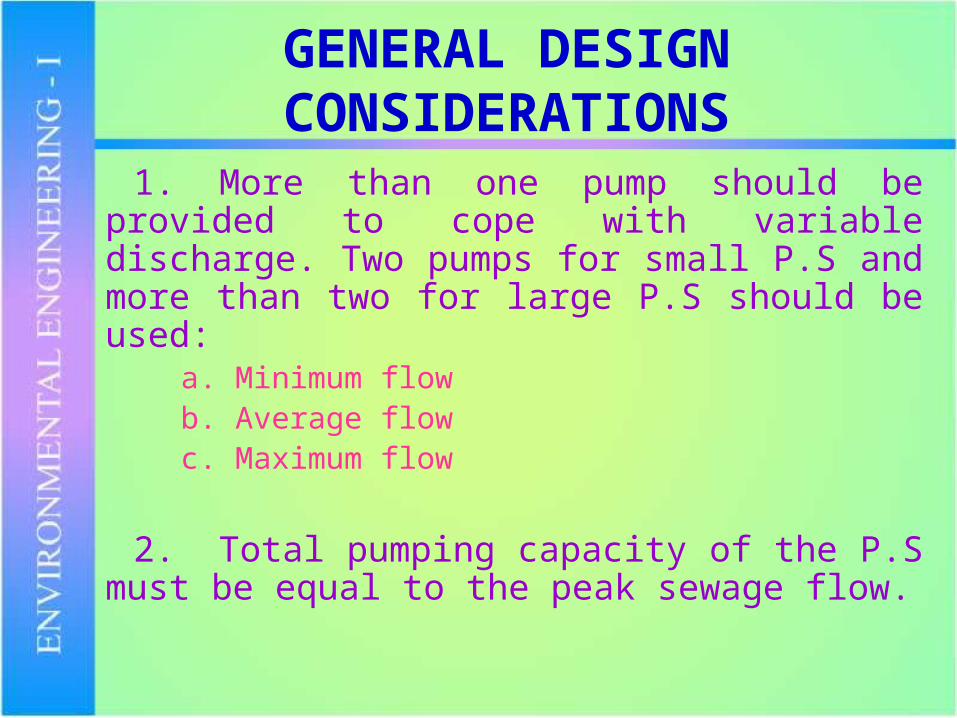
1. More than one pump should be provided to cope with variable discharge. Two pumps for small P.S and more than two for large P.S should be used:
a. Minimum flowb. Average flowc. Maximum flow
2. Total pumping capacity of the P.S must be equal to the peak sewage flow.
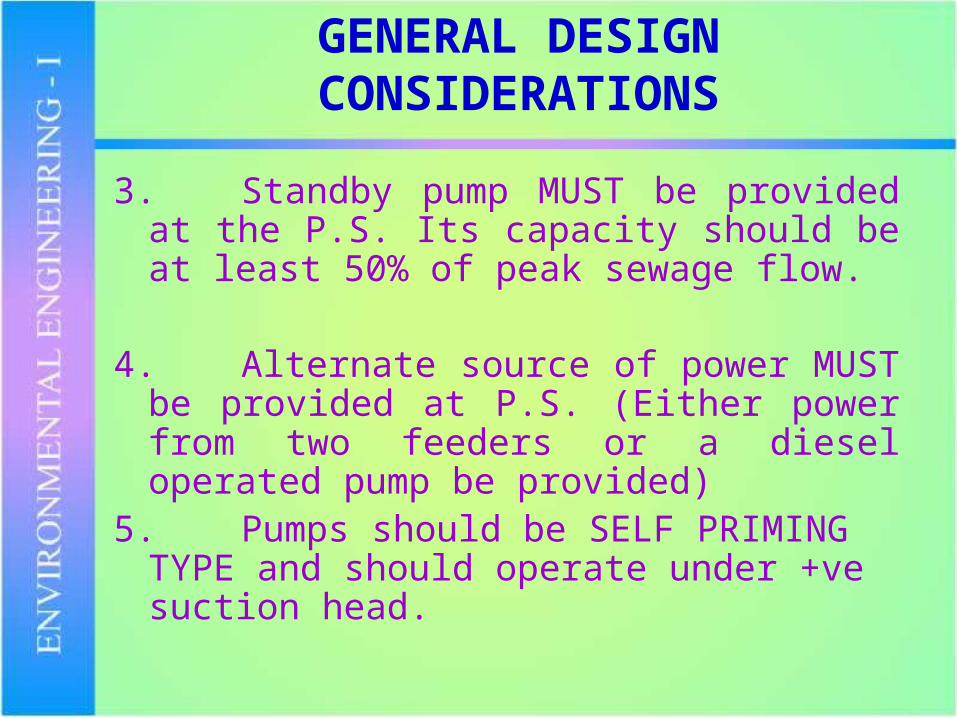
3. Standby pump MUST be provided at the P.S. Its capacity should be at least 50% of peak sewage flow.
4.Alternate source of power MUST be provided at P.S. (Either power from two feeders or a diesel operated pump be provided)
5.Pumps should be SELF PRIMING TYPE and should operate under +ve suction head.
GENERAL DESIGN CONSIDERATIONS
GENERAL DESIGN CONSIDERATIONS
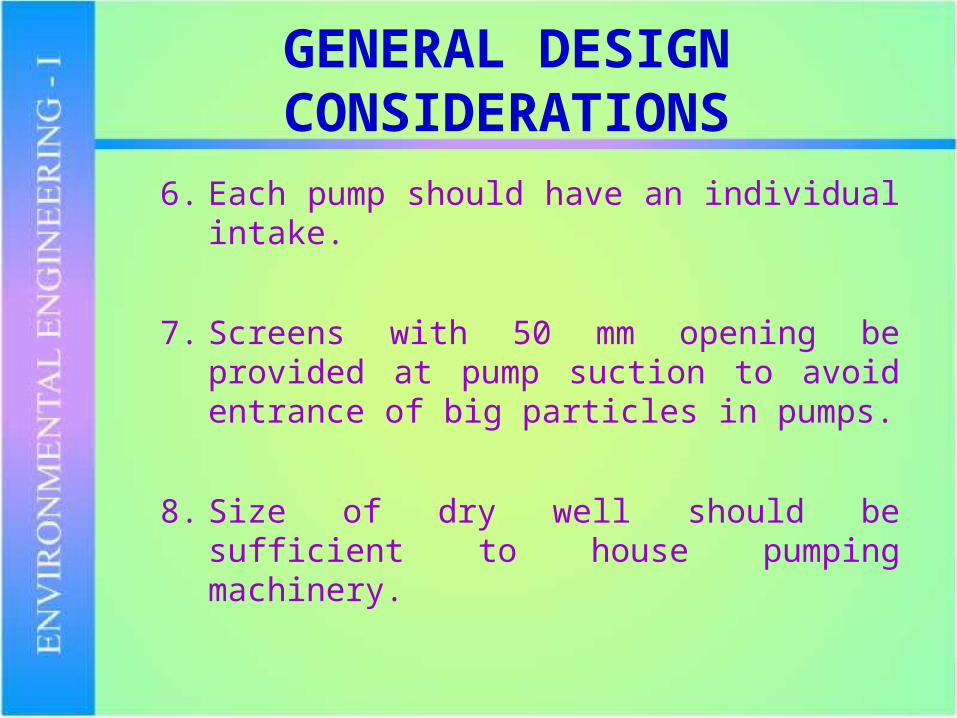
6. Each pump should have an individual intake.
7. Screens with 50 mm opening be provided at pump suction to avoid entrance of big particles in pumps.
8. Size of dry well should be sufficient to house pumping machinery.
GENERAL DESIGN CONSIDERATIONS
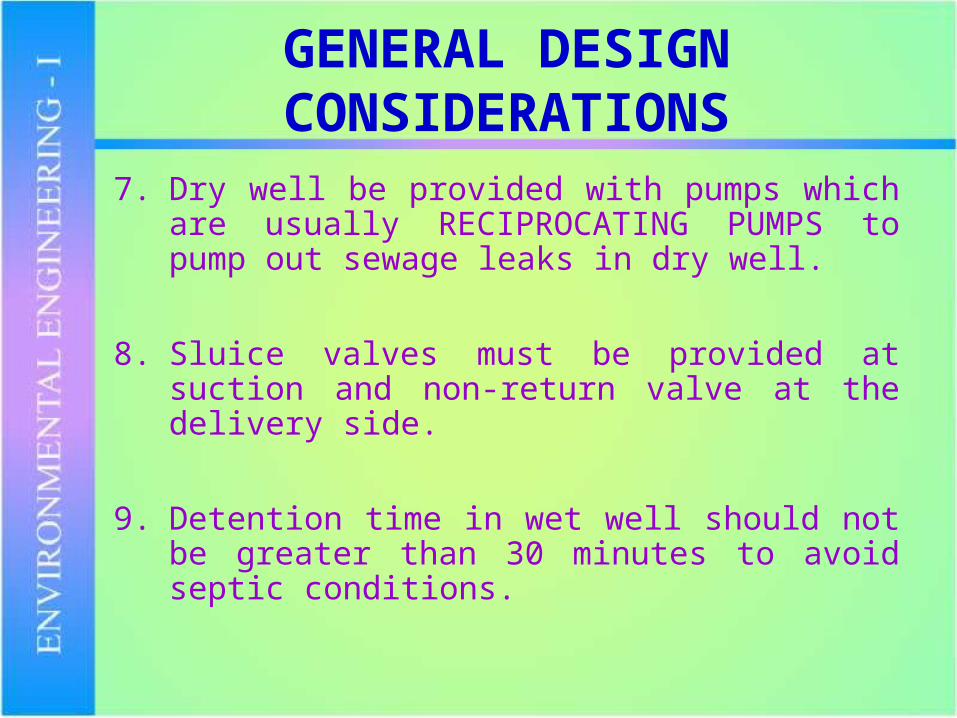
7. Dry well be provided with pumps which are usually RECIPROCATING PUMPS to pump out sewage leaks in dry well.
8. Sluice valves must be provided at suction and non-return valve at the delivery side.
9. Detention time in wet well should not be greater than 30 minutes to avoid septic conditions.
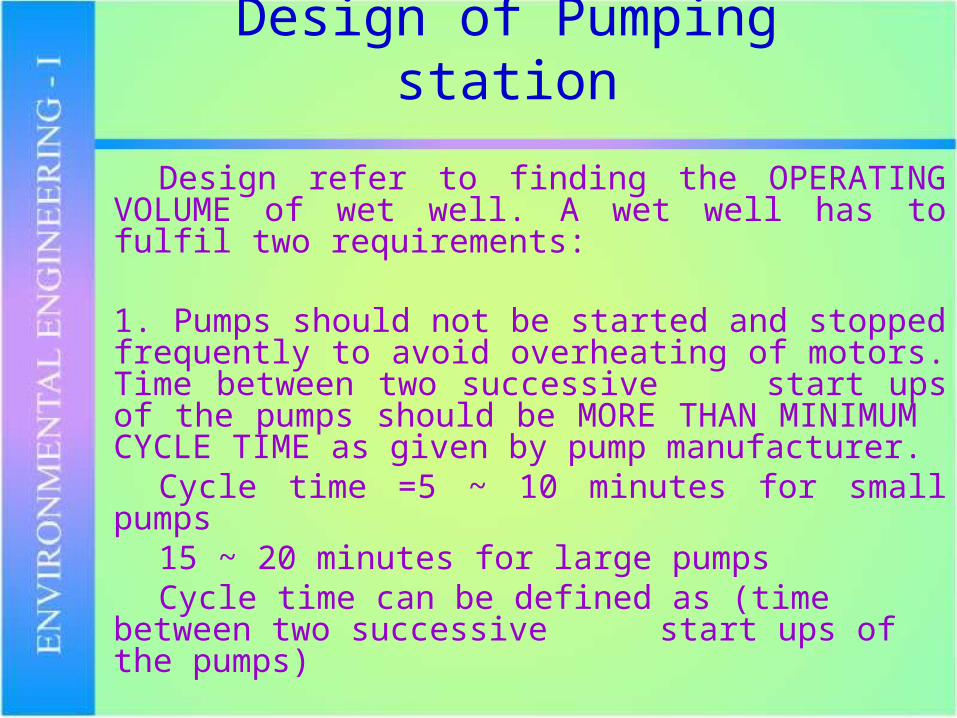
Design of Pumping station
Design refer to finding the OPERATING VOLUME of wet well. A wet well has to fulfil two requirements:
1. Pumps should not be started and stopped frequently to avoid overheating of motors. Time between two successive start ups of the pumps should be MORE THAN MINIMUM
CYCLE TIME as given by pump manufacturer.Cycle time =5 ~ 10 minutes for small
pumps15 ~ 20 minutes for large
pumpsCycle time can be defined as (time between
two successive start ups of the pumps)
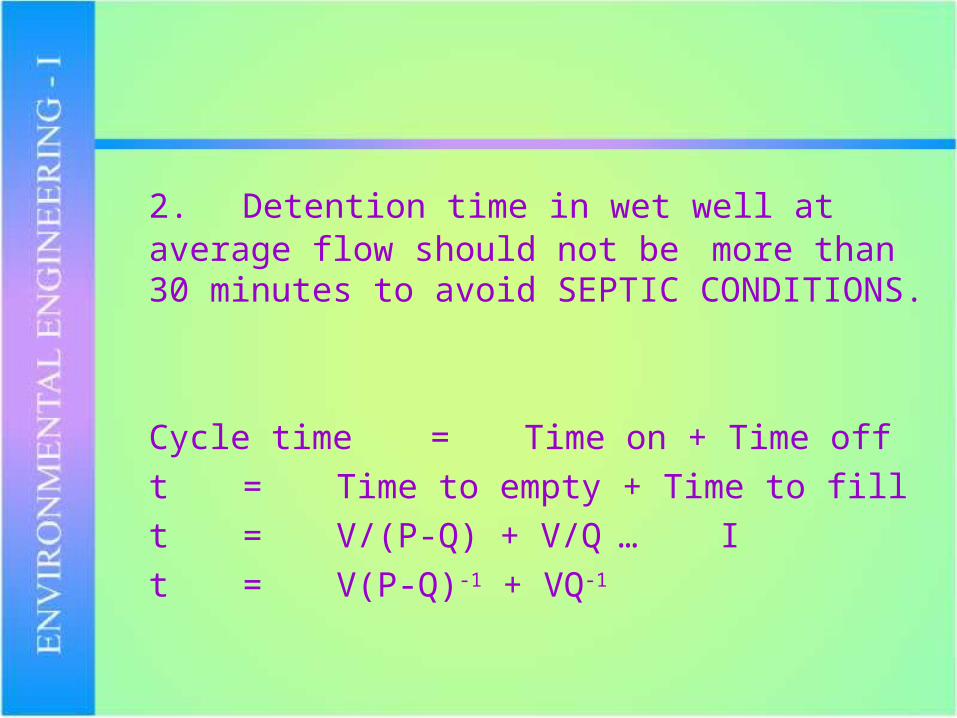
2. Detention time in wet well at average flow should not be more than 30 minutes to avoid SEPTIC CONDITIONS.
Cycle time = Time on + Time offt = Time to empty + Time
to fillt = V/(P-Q) + V/Q … It = V(P-Q)-1 + VQ-1
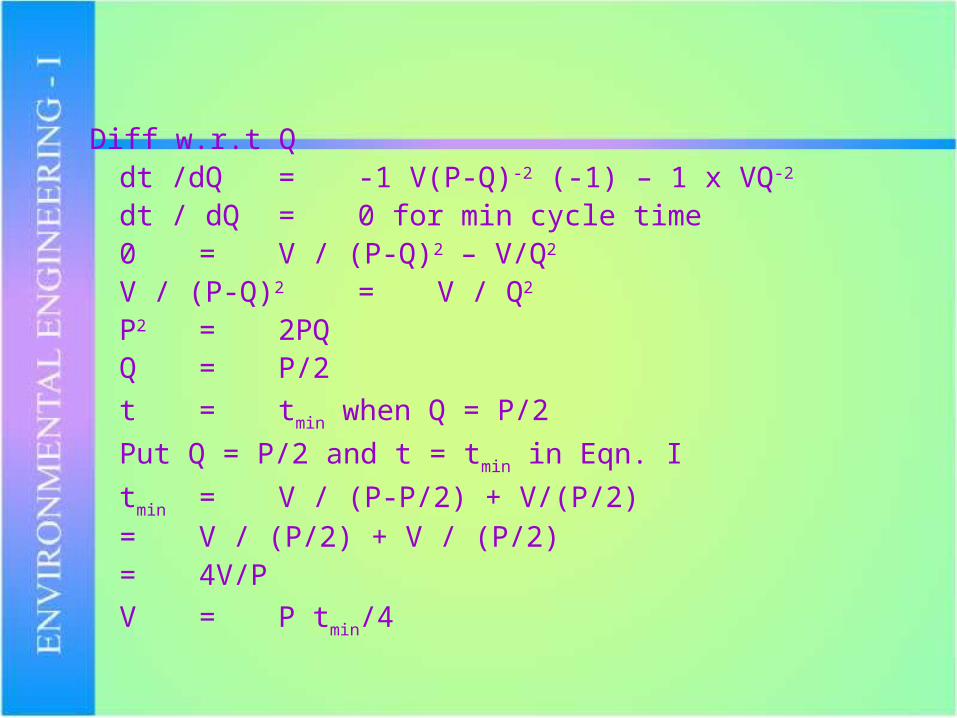
Diff w.r.t Qdt /dQ = -1 V(P-Q)-2 (-1) – 1 x VQ-2
dt / dQ = 0 for min cycle time0 = V / (P-Q)2 – V/Q2
V / (P-Q)2 = V / Q2
P2 = 2PQQ = P/2
t = tmin when Q = P/2
Put Q = P/2 and t = tmin in Eqn. I
tmin = V / (P-P/2) + V/(P/2)= V / (P/2) + V / (P/2)= 4V/P
V = P tmin/4
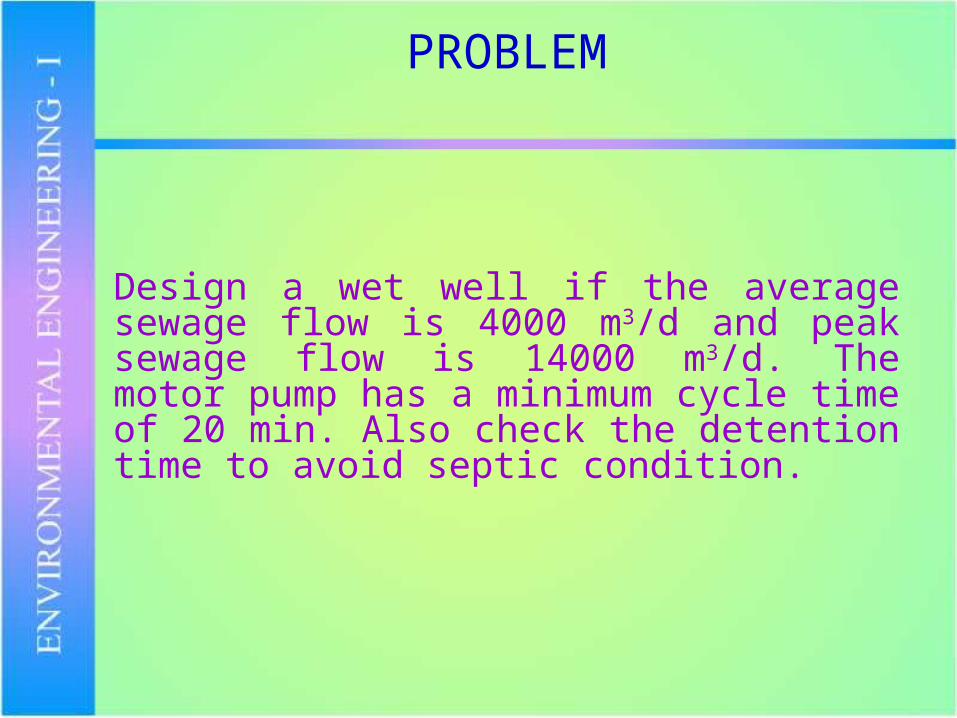
PROBLEM
Design a wet well if the average sewage flow is 4000 m3/d and peak sewage flow is 14000 m3/d. The motor pump has a minimum cycle time of 20 min. Also check the detention time to avoid septic condition.
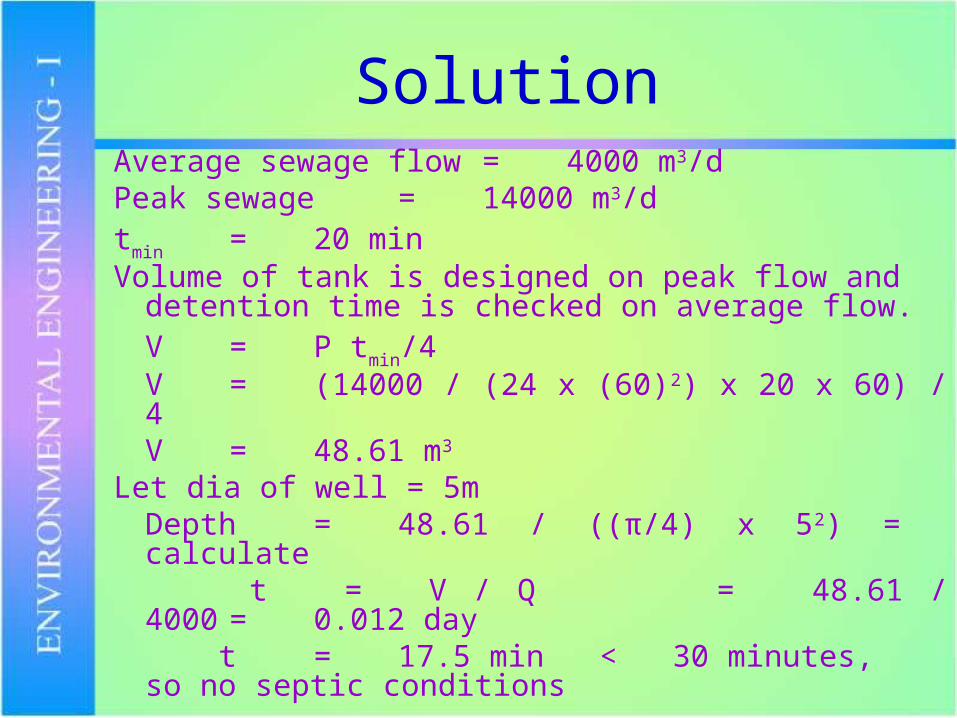
SolutionAverage sewage flow = 4000 m3/dPeak sewage = 14000 m3/dtmin = 20 minVolume of tank is designed on peak flow and
detention time is checked on average flow. V = P tmin/4V = (14000 / (24 x (60)2) x 20 x 60) / 4V = 48.61 m3
Let dia of well = 5mDepth = 48.61 / ((π/4) x 52) = calculate t = V / Q = 48.61 / 4000 =0.012 day t = 17.5 min < 30 minutes, so no septic conditions
Lake Ecosystems
Definitions
Limnology – the study of the ecology of inland waters. Derived from the Greek root limne meaning pool or marsh. Focused on freshwater biotic communities and the relationships of the biota to the physical, chemical and biological characteristics of the aquatic system which they are a part of.
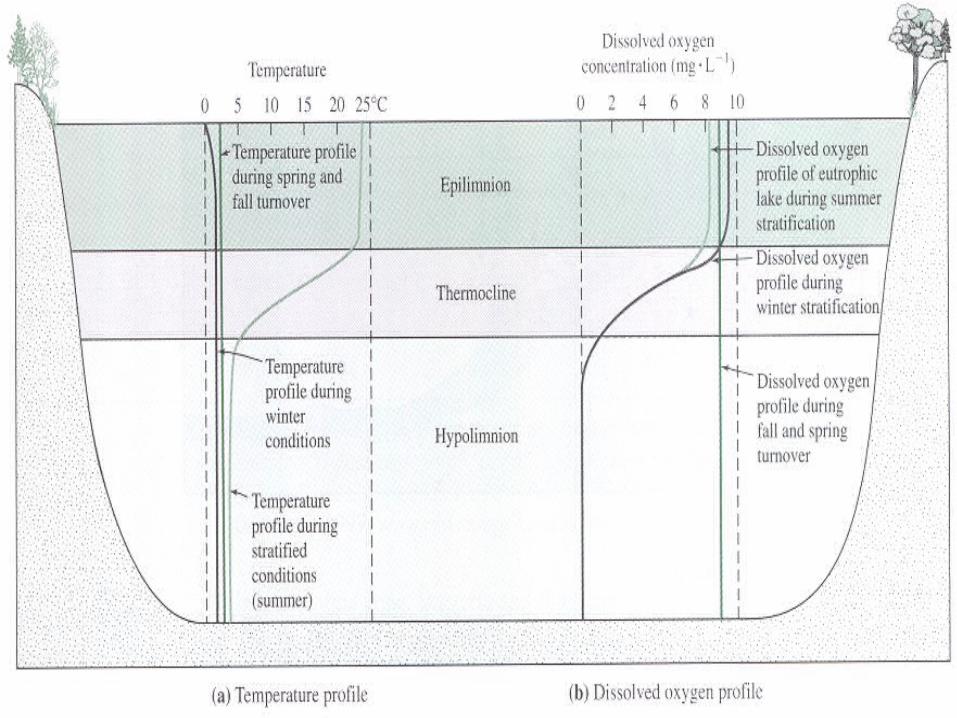
Temperature and Oxygen
Dissolved Oxygen
• Dissolved oxygen analysis measures the amount of gaseous oxygen dissolved in an aqueous solution. It gets from surroundings like air, aeration and waste product of photosynthesis.
• Total dissolved gas concentration in water should not exceed the allowable limit. Above this can cause harm to the users.
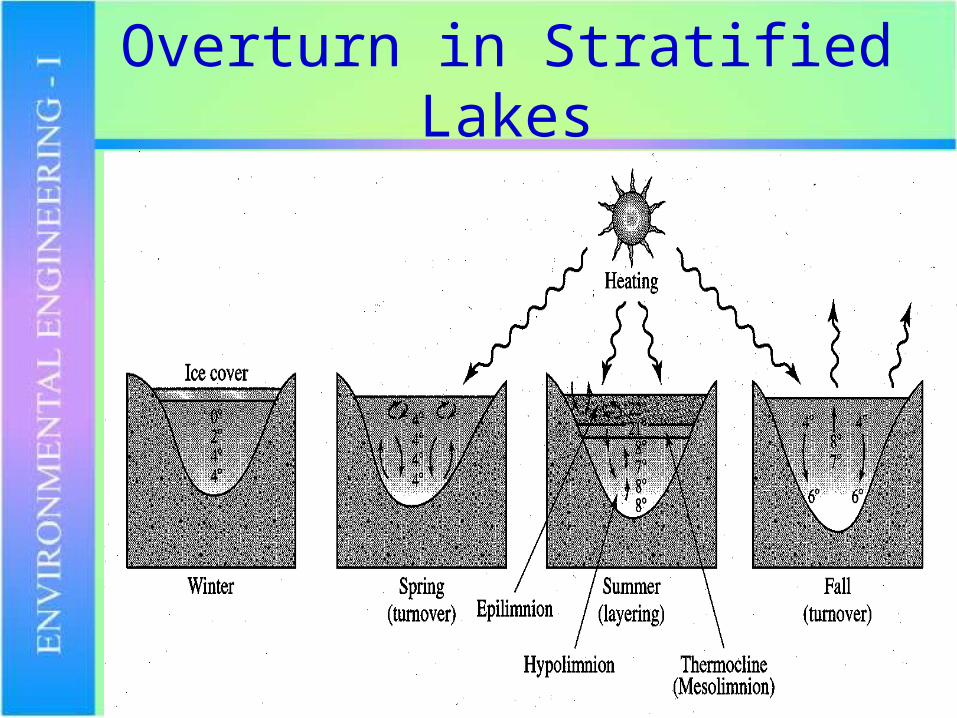
Overturn in Stratified Lakes
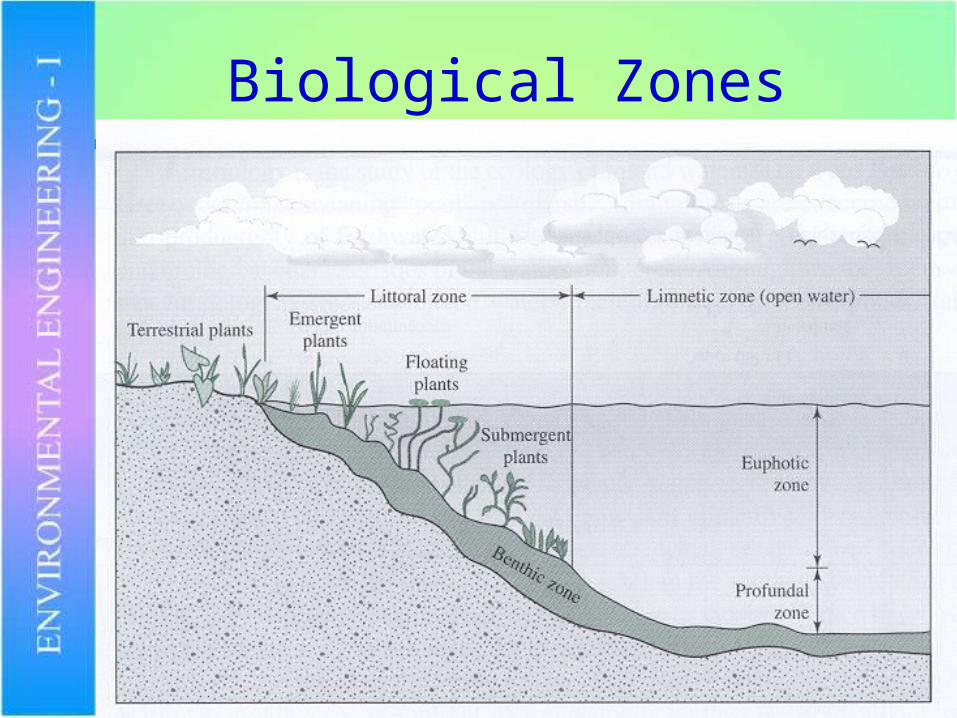
Biological Zones
Productivity
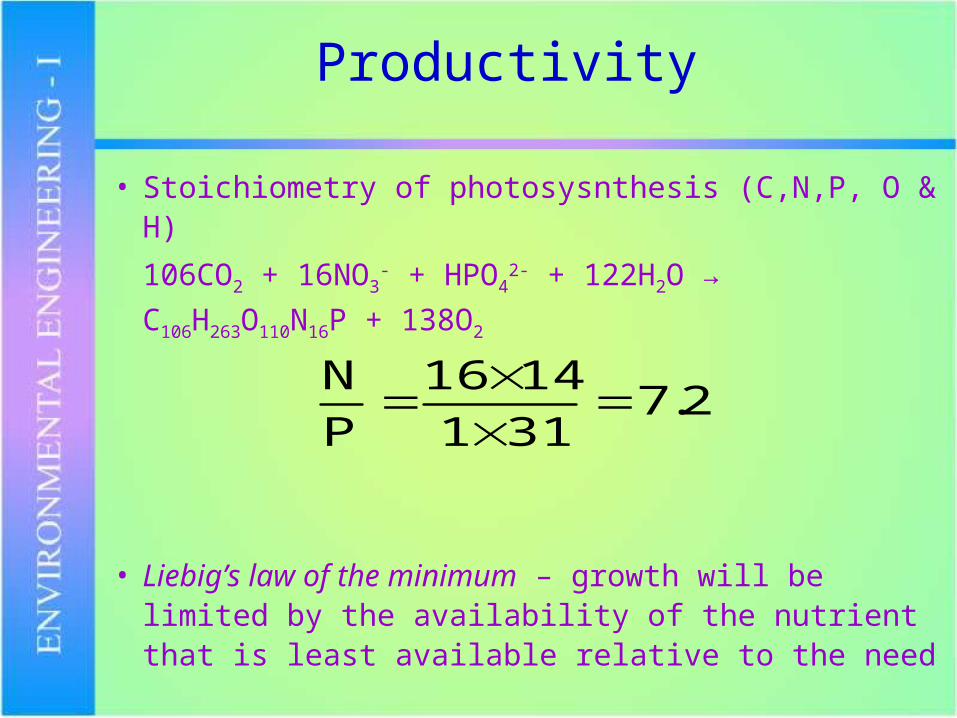
• Stoichiometry of photosysnthesis (C,N,P, O & H)
106CO2 + 16NO3- + HPO4
2- + 122H2O →
C106H263O110N16P + 138O2
• Liebig’s law of the minimum – growth will be limited by the availability of the nutrient that is least available relative to the need
2.7311
1416
P
N
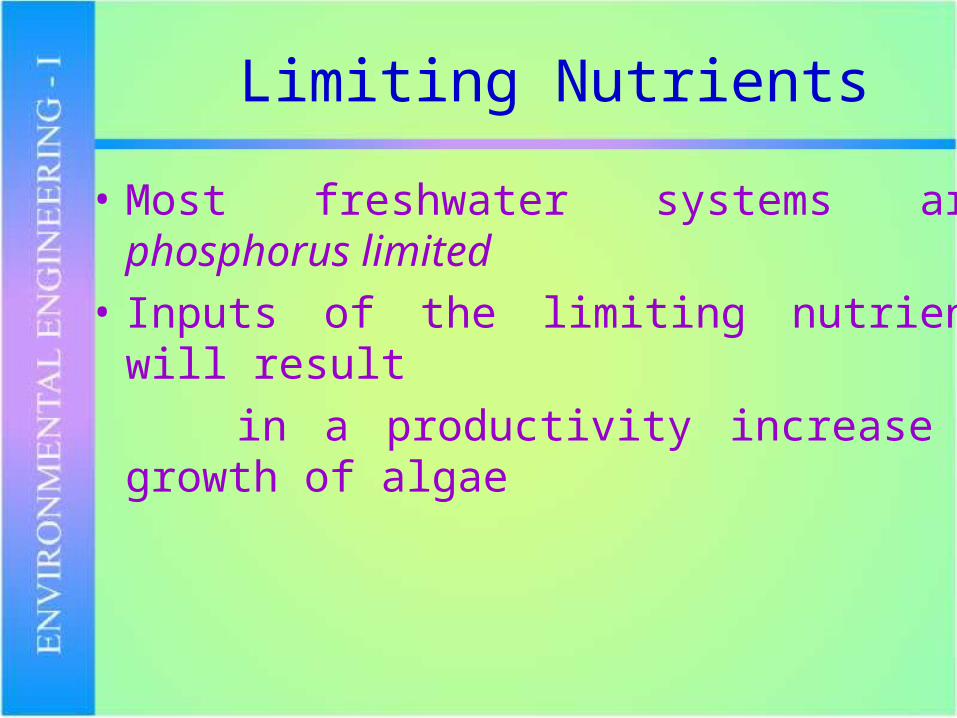
Limiting Nutrients
• Most freshwater systems are phosphorus limited
• Inputs of the limiting nutrient will result
in a productivity increase – growth of algae
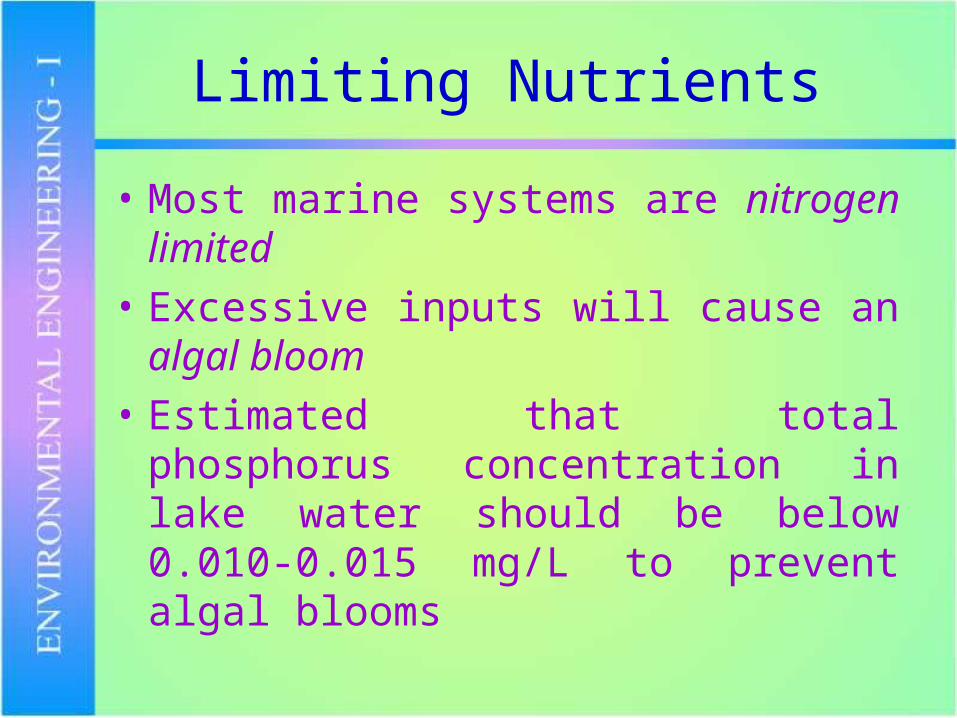
Limiting Nutrients
• Most marine systems are nitrogen limited
• Excessive inputs will cause an algal bloom
• Estimated that total phosphorus concentration in lake water should be below 0.010-0.015 mg/L to prevent algal blooms
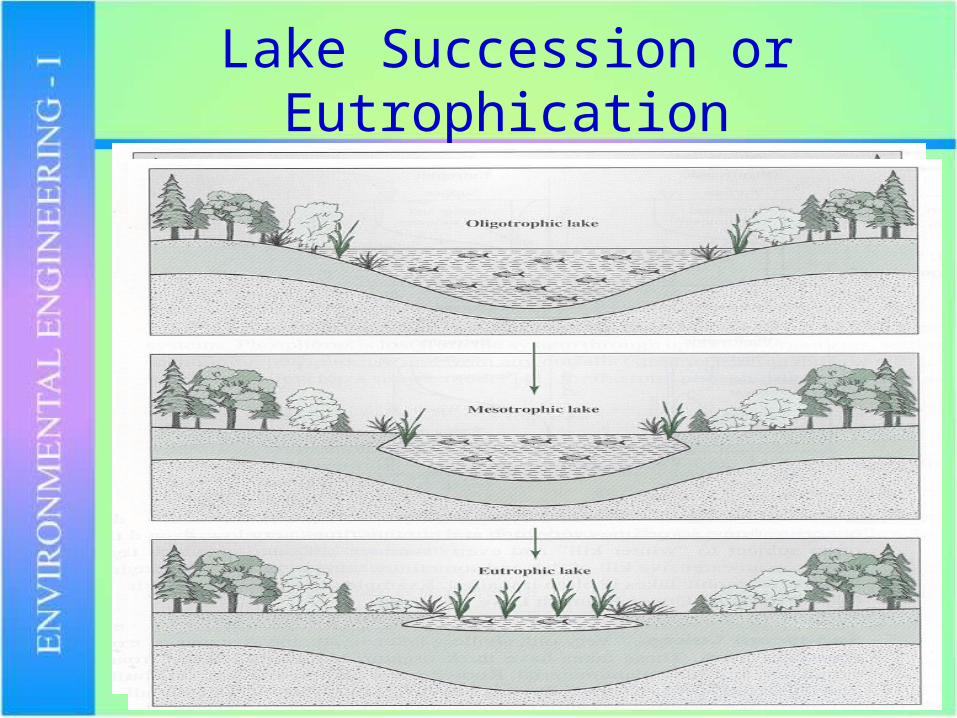
Lake Succession or Eutrophication

Perspective on Eutrophication
• Eutrophication is a natural process
• Some lakes have been eutrophic long before human activities could have had any effect
• Aging process is thought to occur over thousands of years
• Cultural eutrophication is accelerated aging due to human influences
• May occur over tens of years

Lake Classification
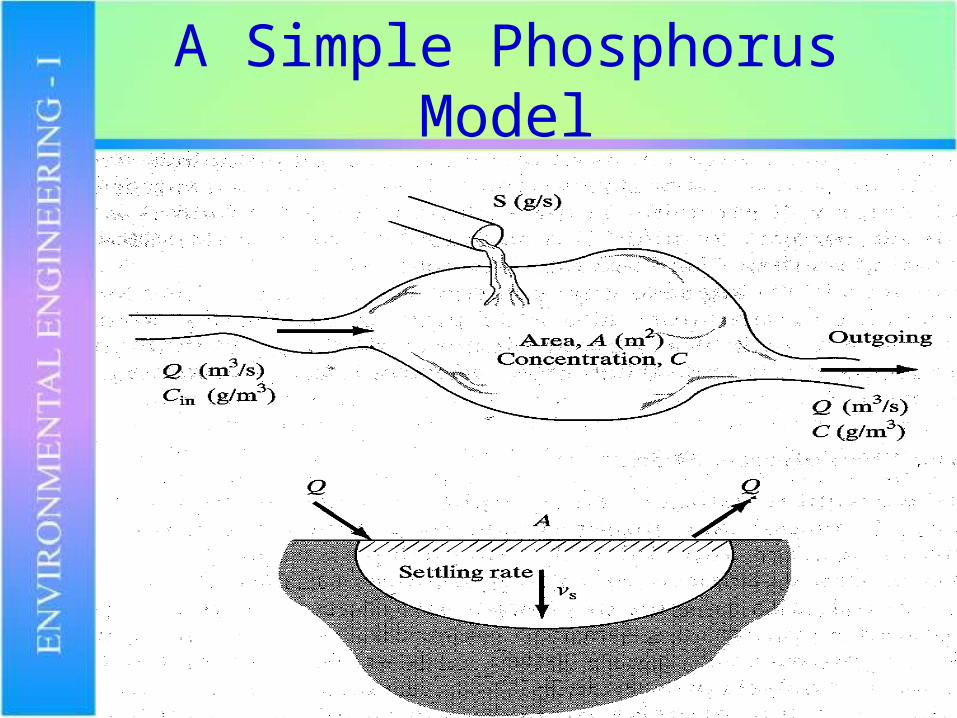
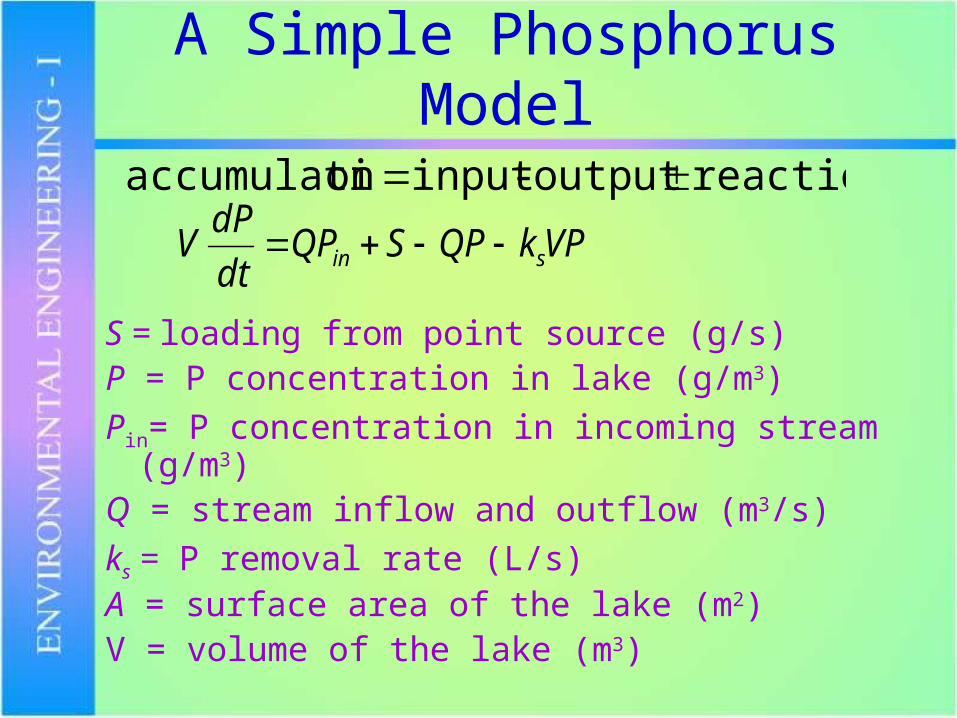
A Simple Phosphorus Model
A Simple Phosphorus Model
S = loading from point source (g/s)P = P concentration in lake (g/m3)
Pin= P concentration in incoming stream (g/m3)Q = stream inflow and outflow (m3/s)
ks = P removal rate (L/s)A = surface area of the lake (m2)V = volume of the lake (m3)
reaction output - input onaccumulati
VPkQPSQPdt
dPV sin
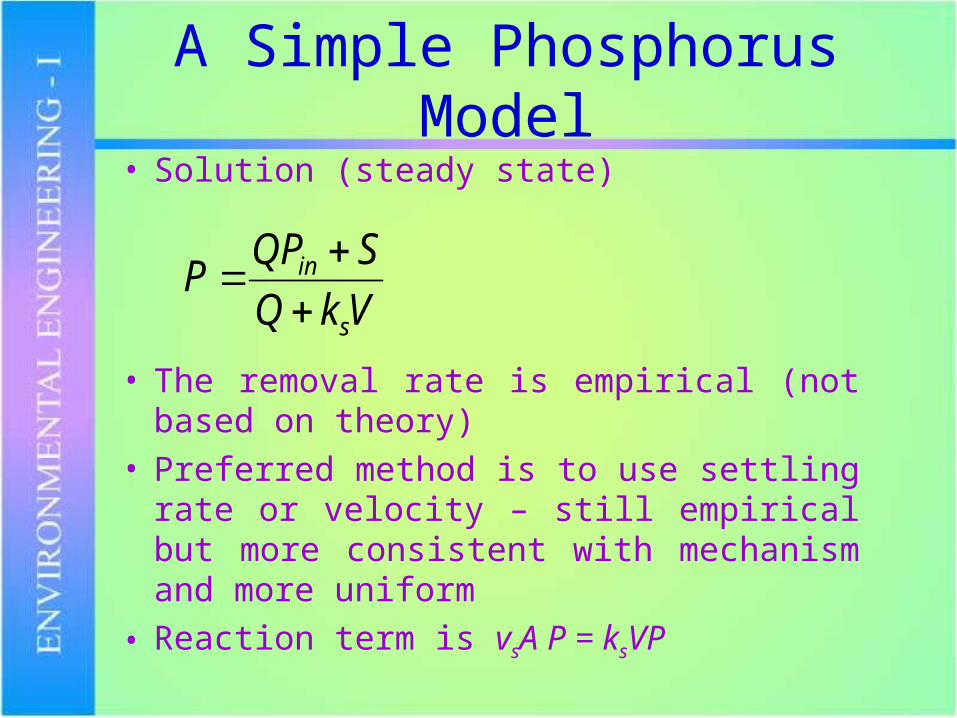
A Simple Phosphorus Model
• Solution (steady state)
• The removal rate is empirical (not based on theory)
• Preferred method is to use settling rate or velocity – still empirical but more consistent with mechanism and more uniform
• Reaction term is vsA P = ksVP
VkQ
SQPP
s
in
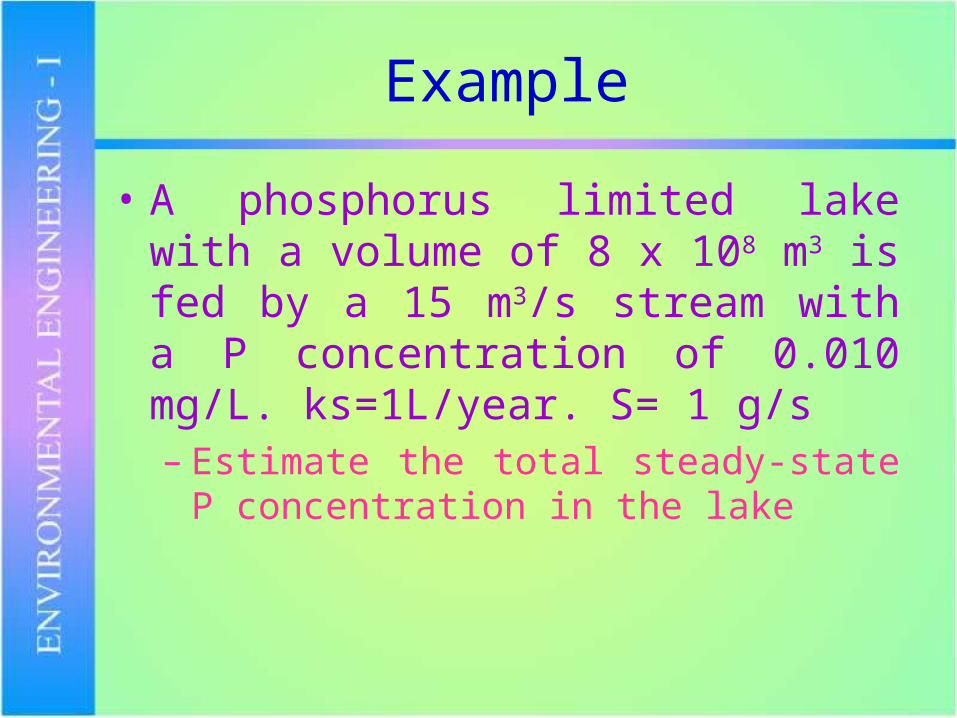
Example
• A phosphorus limited lake with a volume of 8 x 10⁸ m3 is fed by a 15 m3/s stream with a P concentration of 0.010 mg/L. ks=1L/year. S= 1 g/s– Estimate the total steady-state P
concentration in the lake
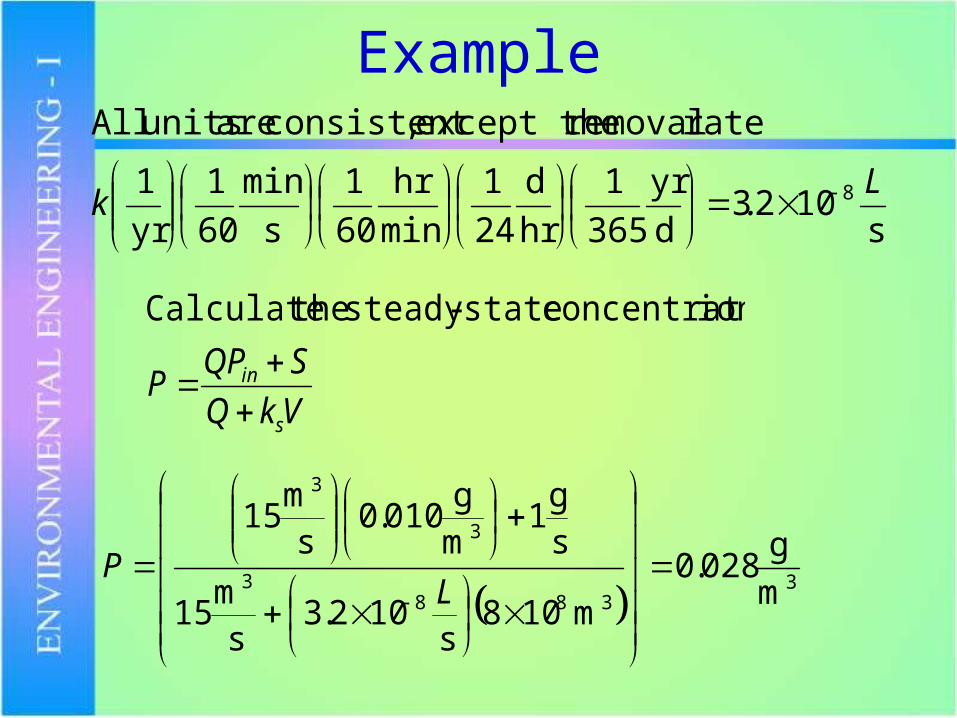
Example
s1023
d
yr
365
1
hr
d
24
1
min
hr
60
1
s
min
60
1
yr
1
rate removal except the,consistent are units All
8 L.k
VkQ
SQPP
s
in
ionconcentrat state-steady the Calculate
3
3883
3
3
m
g028.0
m108s
102.3s
m15
sg
1mg
010.0s
m15
L
P
Acidification of Lakes
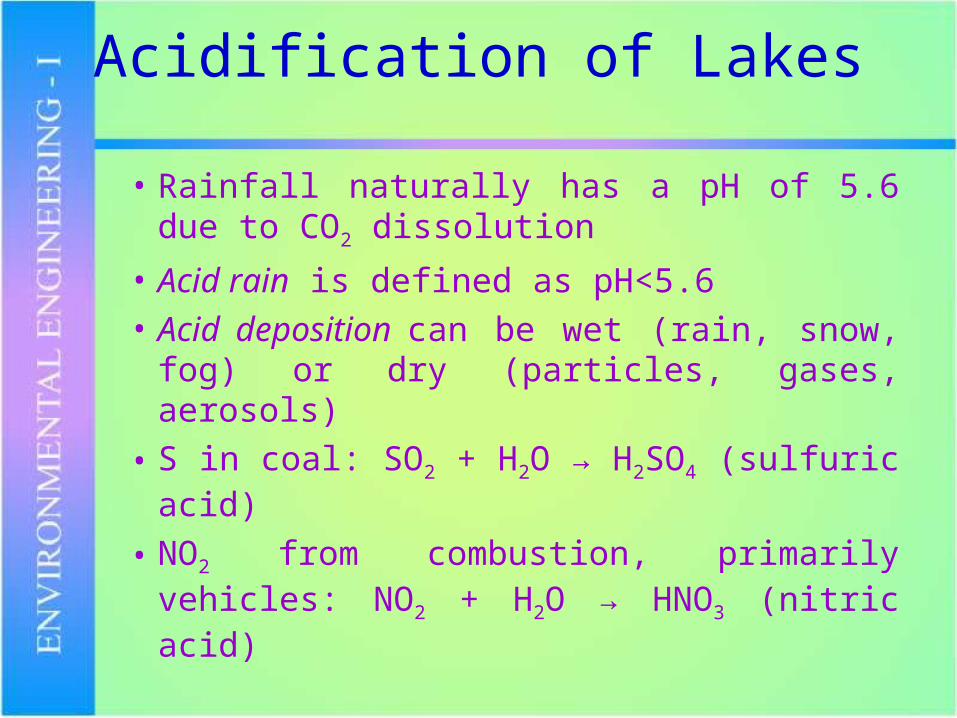
• Rainfall naturally has a pH of 5.6 due to CO2 dissolution
• Acid rain is defined as pH<5.6
• Acid deposition can be wet (rain, snow, fog) or dry (particles, gases, aerosols)
• S in coal: SO2 + H2O → H2SO4 (sulfuric acid)
• NO2 from combustion, primarily vehicles: NO2 + H2O → HNO3 (nitric acid)
Effects of Acid Rain
• Degrades building materials especially limestone, marble, metals, paints
• pH reduction in surface waters – many species can not tolerate pH < 5
• solubilizes metals leading to increased toxicity
Bicarbonate Buffering
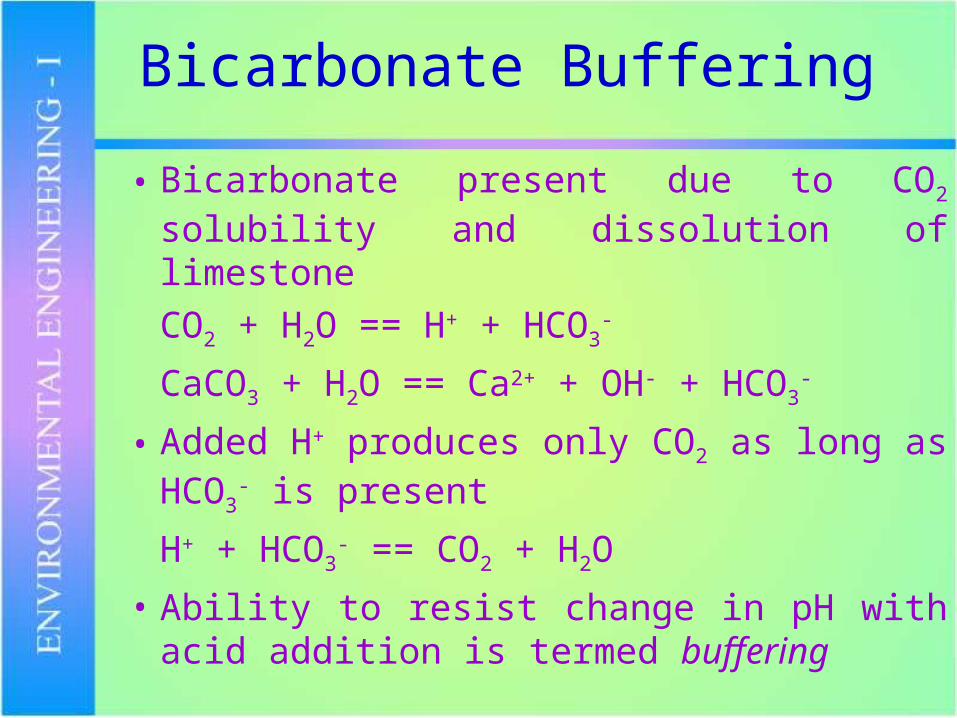
• Bicarbonate present due to CO2 solubility and dissolution of limestone
CO2 + H2O == H+ + HCO3-
CaCO3 + H2O == Ca2+ + OH- + HCO3-
• Added H+ produces only CO2 as long as HCO3-
is present
H+ + HCO3- == CO2 + H2O
• Ability to resist change in pH with acid addition is termed buffering
Implications
• Critical Issue is the amount of calcite in the watershed
• Particular problem in New England – large amount of sulfur are released in
midwest– bedrock is largely granite– soils are shallow
• Many lakes are unproductive due to low pH
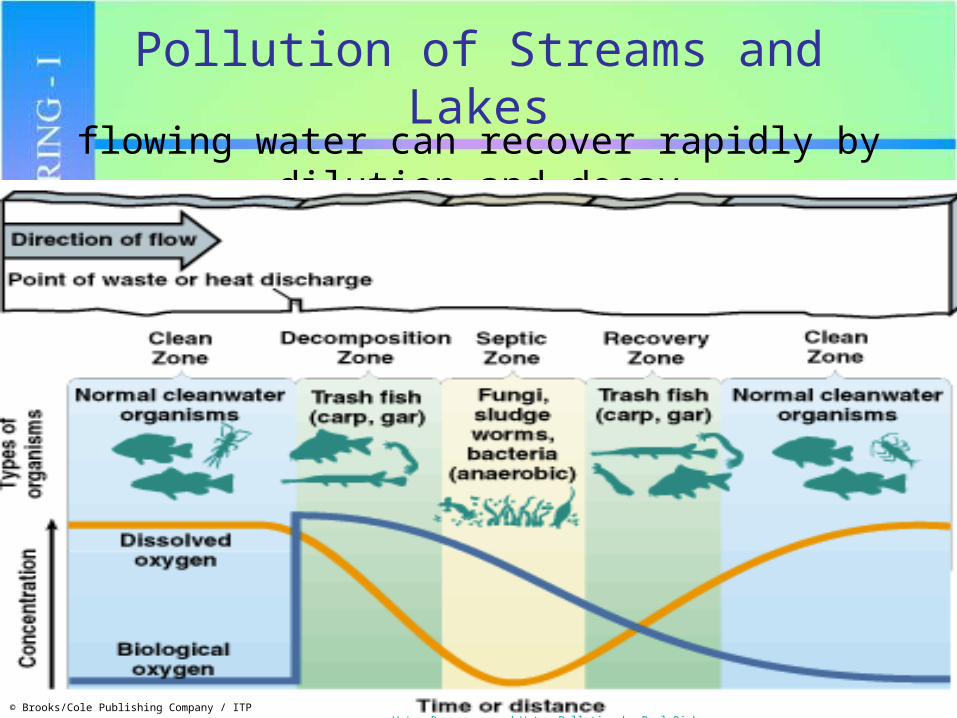
flowing water can recover rapidly by dilution and decay
Pollution of Streams and Lakes
© Brooks/Cole Publishing Company / ITP Water Resources and Water Pollution by Paul Rich
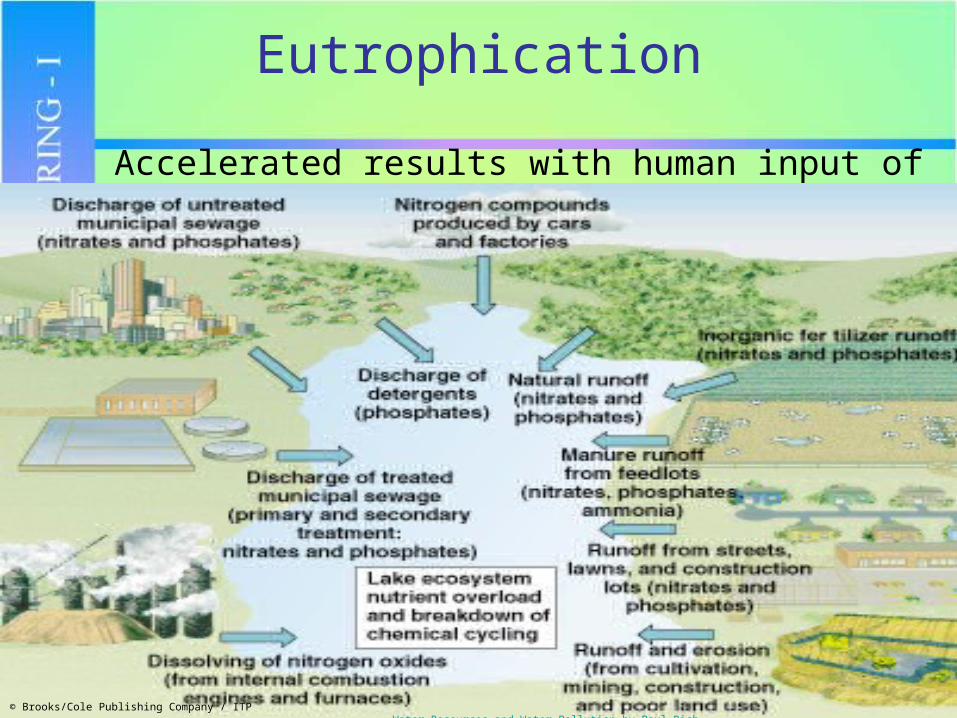
Accelerated results with human input of nutrients to a lake
Eutrophication
© Brooks/Cole Publishing Company / ITP Water Resources and Water Pollution by Paul Rich