Embed Size (px)
Citation preview
Seven Myths of Randomisation in Clinical Trials
Stephen Senn
(c)Stephen Senn 2011 1 (c)Stephen Senn 2011 1 (c)Stephen Senn 2011 1
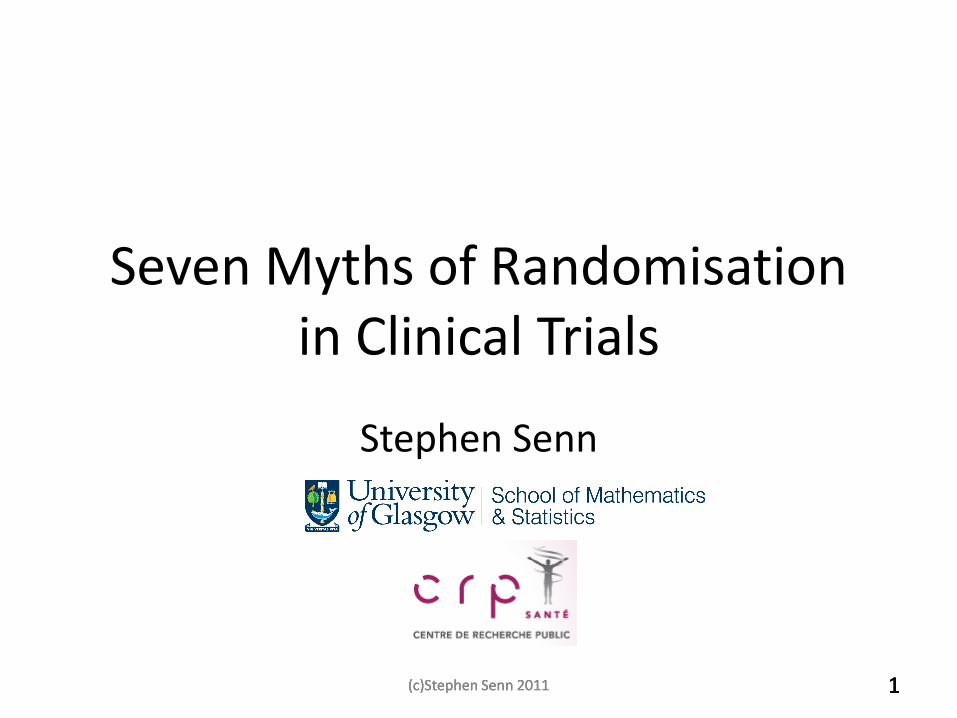
Why this talk
• I had begun to notice that there were a number of published criticisms of randomisation in the methodology of science literature of randomisation
• These seemed to be accepted as valid by others
• I felt a refutation was called for
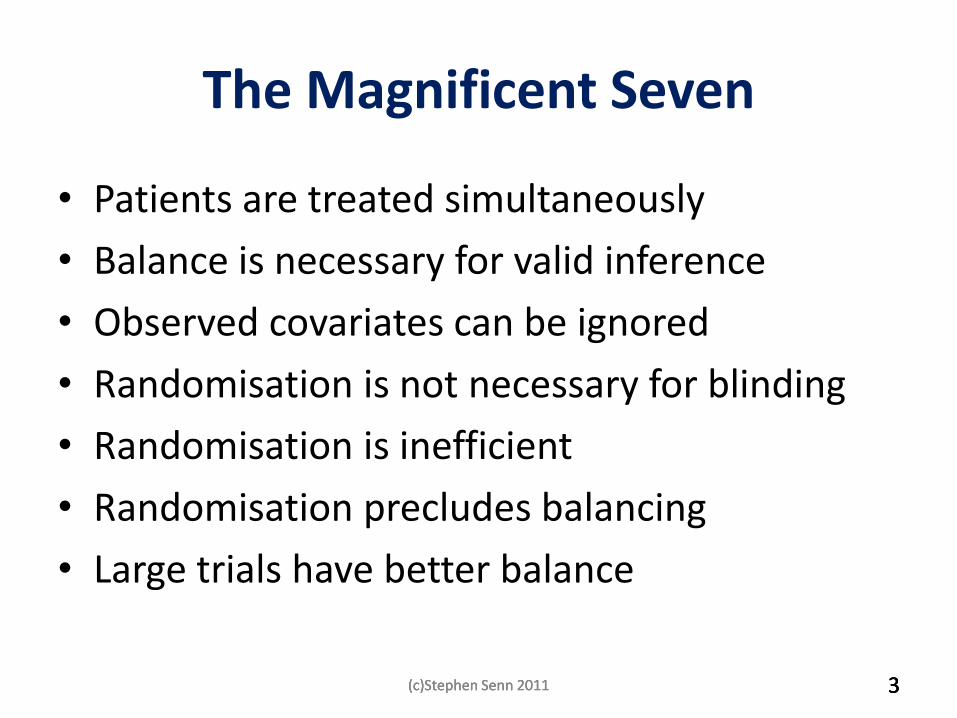
The Magnificent Seven
• Patients are treated simultaneously
• Balance is necessary for valid inference
• Observed covariates can be ignored
• Randomisation is not necessary for blinding
• Randomisation is inefficient
• Randomisation precludes balancing
• Large trials have better balance
(c)Stephen Senn 2011 3 (c)Stephen Senn 2011 3 (c)Stephen Senn 2011 3
Outline
• A game of chance
• The seven myths
• My philosophy of randomisation and analysis
(c)Stephen Senn 2011 4 (c)Stephen Senn 2011 4 (c)Stephen Senn 2011 4
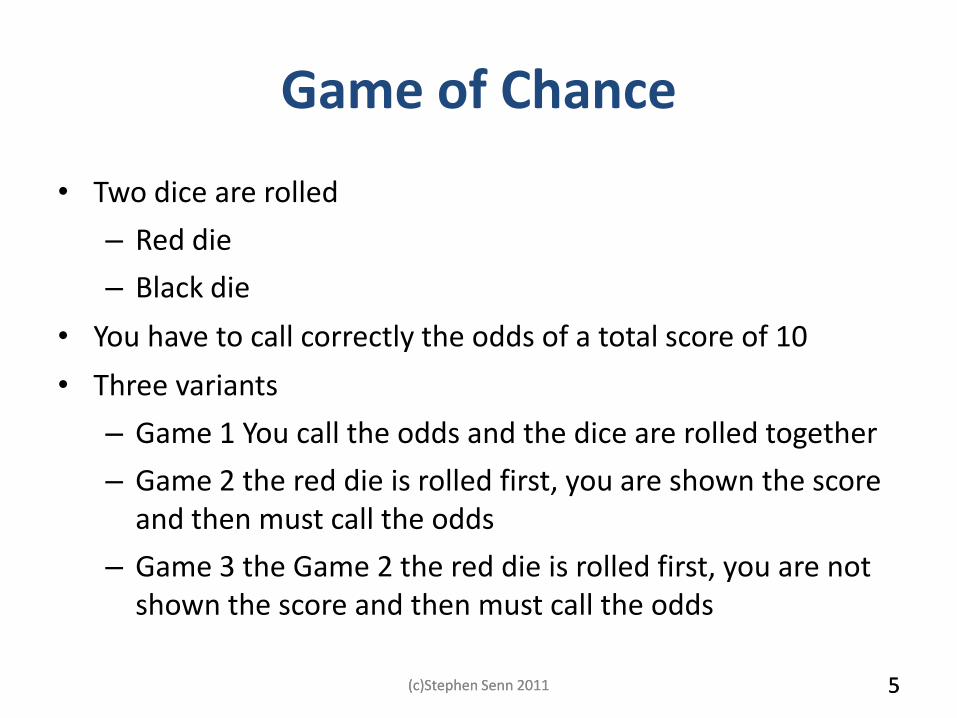
Game of Chance
• Two dice are rolled
– Red die
– Black die
• You have to call correctly the odds of a total score of 10
• Three variants
– Game 1 You call the odds and the dice are rolled together
– Game 2 the red die is rolled first, you are shown the score and then must call the odds
– Game 3 the Game 2 the red die is rolled first, you are not shown the score and then must call the odds
(c)Stephen Senn 2011 5 (c)Stephen Senn 2011 5
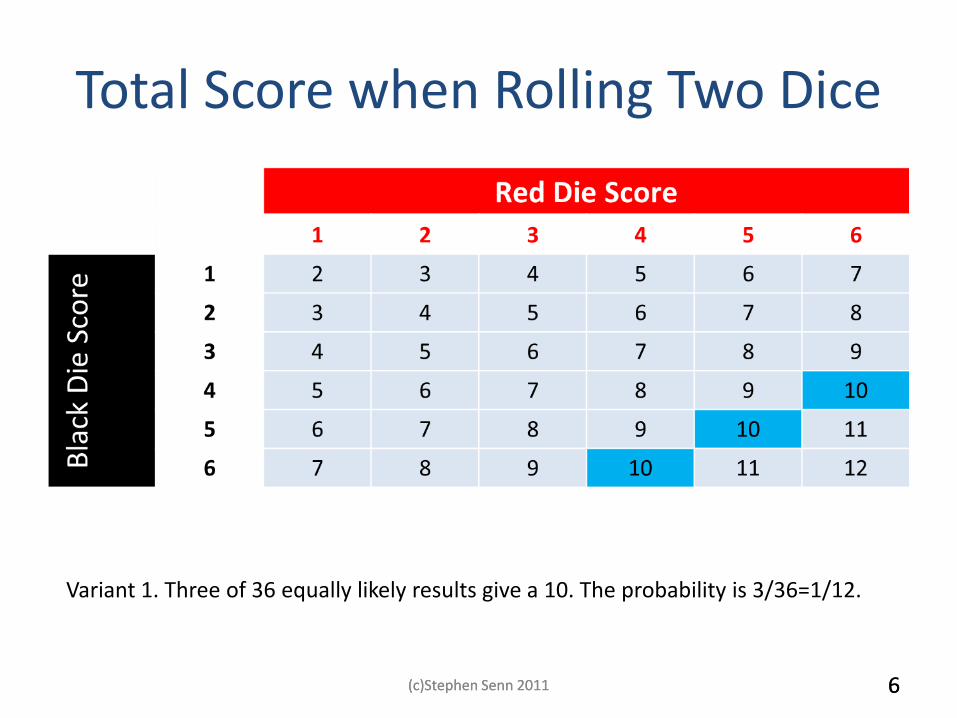
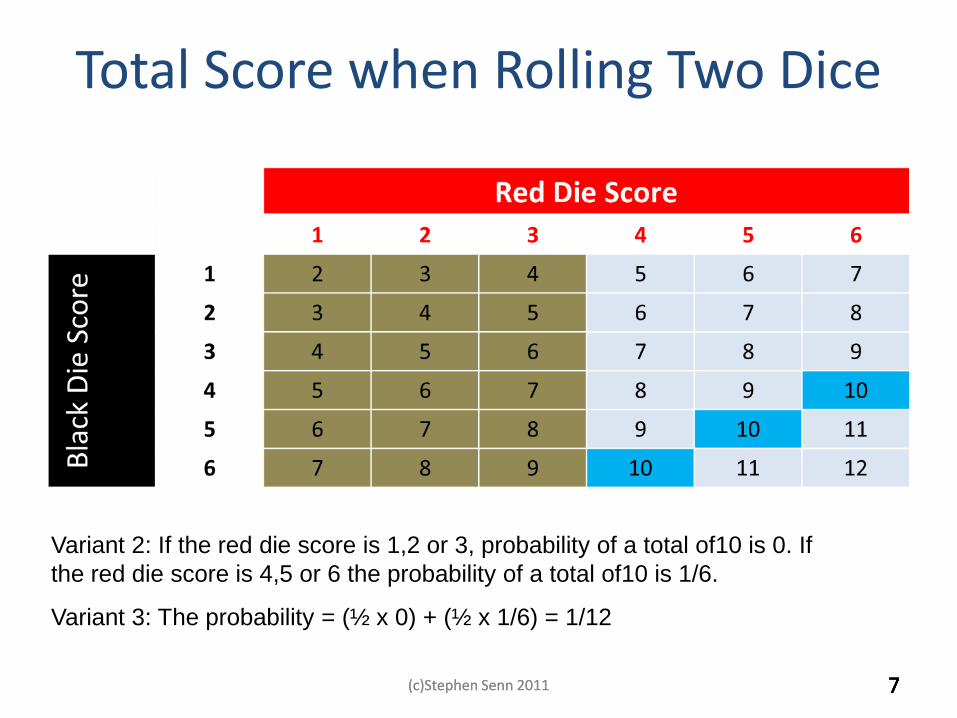
Total Score when Rolling Two Dice
Variant 1. Three of 36 equally likely results give a 10. The probability is 3/36=1/12.
(c)Stephen Senn 2011 6 (c)Stephen Senn 2011 6
7
Variant 2: If the red die score is 1,2 or 3, probability of a total of10 is 0. If
the red die score is 4,5 or 6 the probability of a total of10 is 1/6.
Variant 3: The probability = (½ x 0) + (½ x 1/6) = 1/12
7
Total Score when Rolling Two Dice
(c)Stephen Senn 2011 7 (c)Stephen Senn 2011 7
8
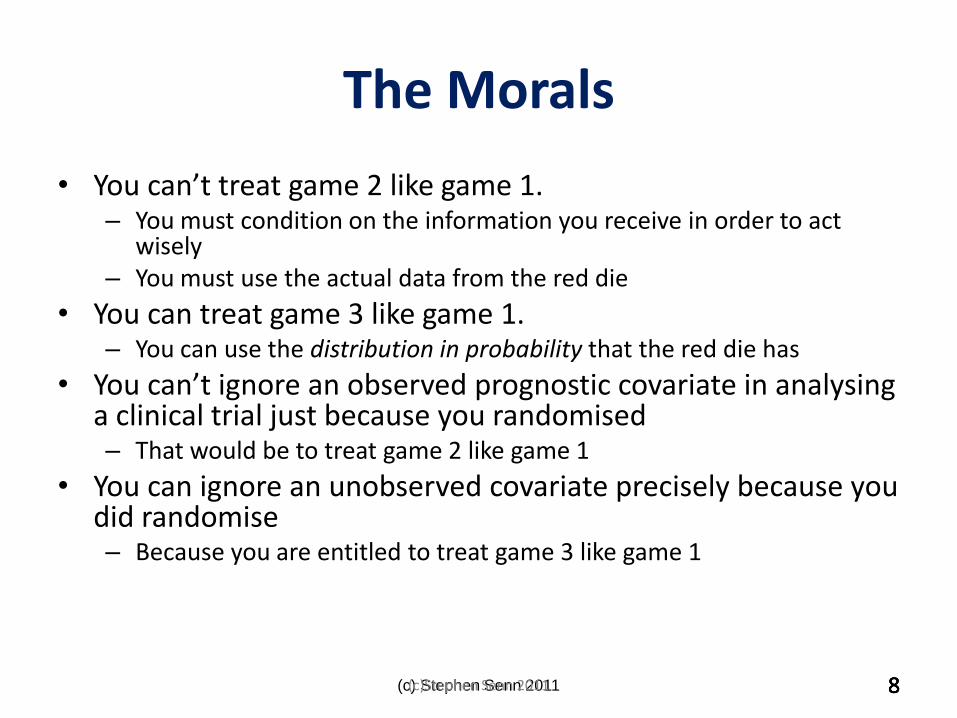
The Morals
• You can’t treat game 2 like game 1. – You must condition on the information you receive in order to act
wisely – You must use the actual data from the red die
• You can treat game 3 like game 1. – You can use the distribution in probability that the red die has
• You can’t ignore an observed prognostic covariate in analysing a clinical trial just because you randomised – That would be to treat game 2 like game 1
• You can ignore an unobserved covariate precisely because you did randomise – Because you are entitled to treat game 3 like game 1
(c) Stephen Senn 2011 8 8 (c)Stephen Senn 2011 8
9
Trialists continue to use their randomization as an excuse for ignoring prognostic information (myth 3), and they continue to worry about the effect of factors they have not measured (myth 2). Neither practice is logical.
The Reality
(c) Stephen Senn 2011 9 9 (c)Stephen Senn 2011 9
Myth 1: Patients are treated simultaneously
If, having created groups matched with respect to those ‘known’ factors, one then goes on to decide which will be the experimental and which the control group by some random process—in the simplest case by tossing a fair coin—then one can do no epistemic harm, though one also does no further epistemic good. Worrall 2007, p463.
For example, one could arrange for the matching to be performed by a panel of doctors representing a spectrum of opinion on the likely value of the drugs and whose criteria of selection have been made explicit. Urbach, 1985, p272
(c)Stephen Senn 2011 (c)Stephen Senn 2011 10 (c)Stephen Senn 2011 10
All this is pretty obvious
• The point is that it is obvious to us
• It is not obvious to them
– Critics of randomisation writing on clinical trials
• You need to tell them to abandon the deep-freeze microwave theory of clinical trials
• You can’t thaw patients out just when it suits you
(c)Stephen Senn 2011 (c)Stephen Senn 2011 11 (c)Stephen Senn 2011 11
Myth 2: Balance is necessary for validity
• It is generally held as being self evident that a trial which is not balanced is not valid.
• Trials are examined at baseline to establish their validity.
• In fact the matter is not so simple...........
(c)Stephen Senn 2011 (c)Stephen Senn 2011 12 (c)Stephen Senn 2011 12
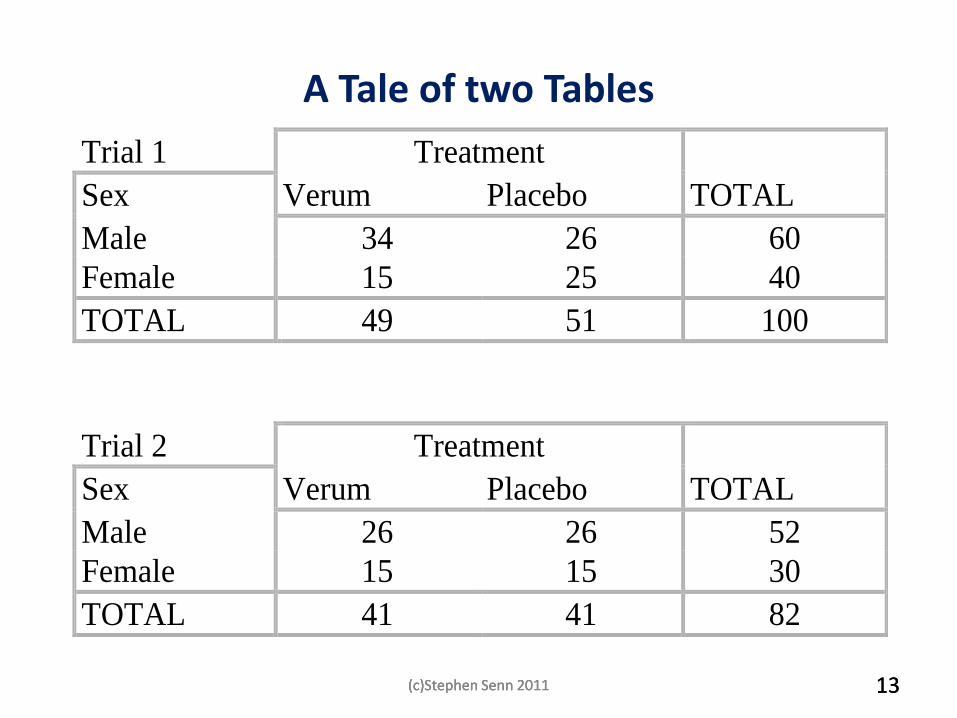
A Tale of two Tables
Trial 1 Treatment
Sex Verum Placebo TOTAL TOTAL
Male 34 26 60
Female 15 25 40
TOTAL 49 51 100
Trial 2 Treatment TOTAL
Sex Verum Placebo TOTAL
Male 26 26 52
Female 15 15 30
TOTAL 41 41 82
(c)Stephen Senn 2011 (c)Stephen Senn 2011 13 (c)Stephen Senn 2011 13
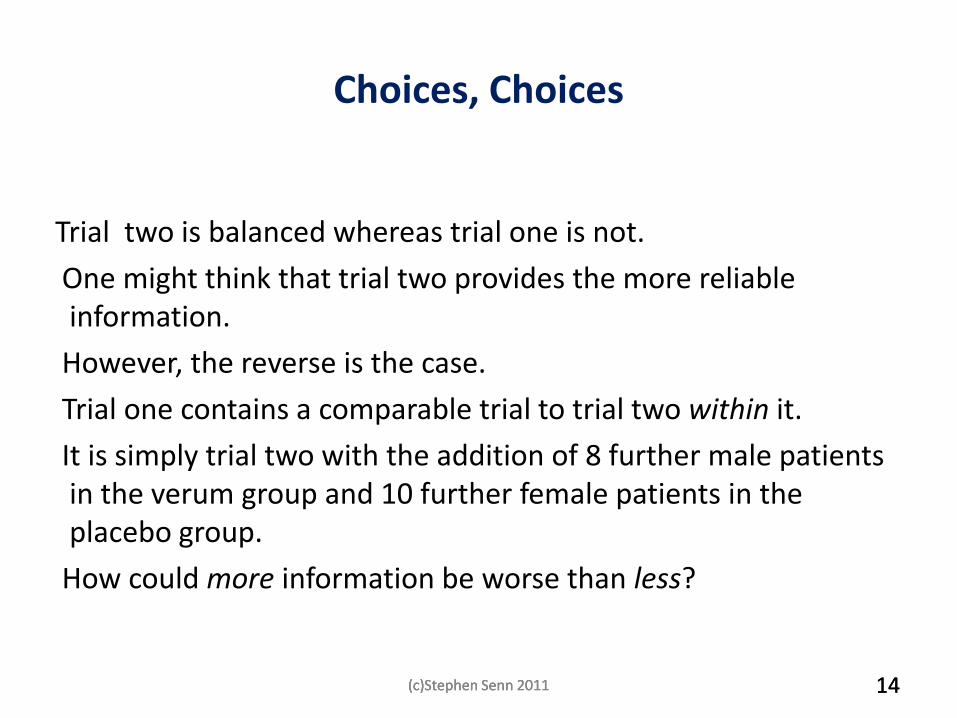
Choices, Choices
Trial two is balanced whereas trial one is not.
One might think that trial two provides the more reliable information.
However, the reverse is the case.
Trial one contains a comparable trial to trial two within it.
It is simply trial two with the addition of 8 further male patients in the verum group and 10 further female patients in the placebo group.
How could more information be worse than less?
(c)Stephen Senn 2011 (c)Stephen Senn 2011 14 (c)Stephen Senn 2011 14
Stratification
All we need to do is compare like with like.
If we compare males with males and females with females we shall obtain two unbiased estimators of the treatment effects. These can then be combined in some appropriate way. This technique is called stratification.
A similar approach called analysis of covariance is available to deal with continuous covariates such as height, age or a baseline measurement.
(c)Stephen Senn 2011 (c)Stephen Senn 2011 15 (c)Stephen Senn 2011 15
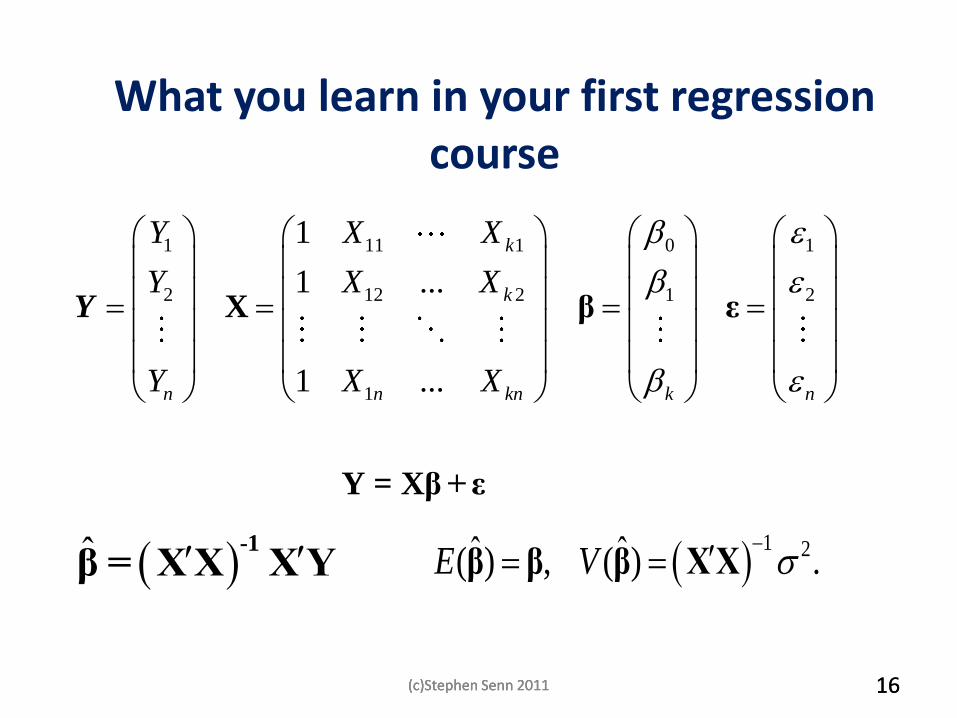
What you learn in your first regression course
1 11 1 0 1
2 12 2 1 2
1
1
1 ...
1 ...
k
k
n n kn k n
Y X X
Y X X
Y X X
X β ε
Y = Xβ +ε
Y
ˆ -1
β = XX XY 1 2ˆ ˆ( ) , ( ) .E V
β β β XX
(c)Stephen Senn 2011 (c)Stephen Senn 2011 16 (c)Stephen Senn 2011 16
1 2
11 12 1
12 22 2
1
22
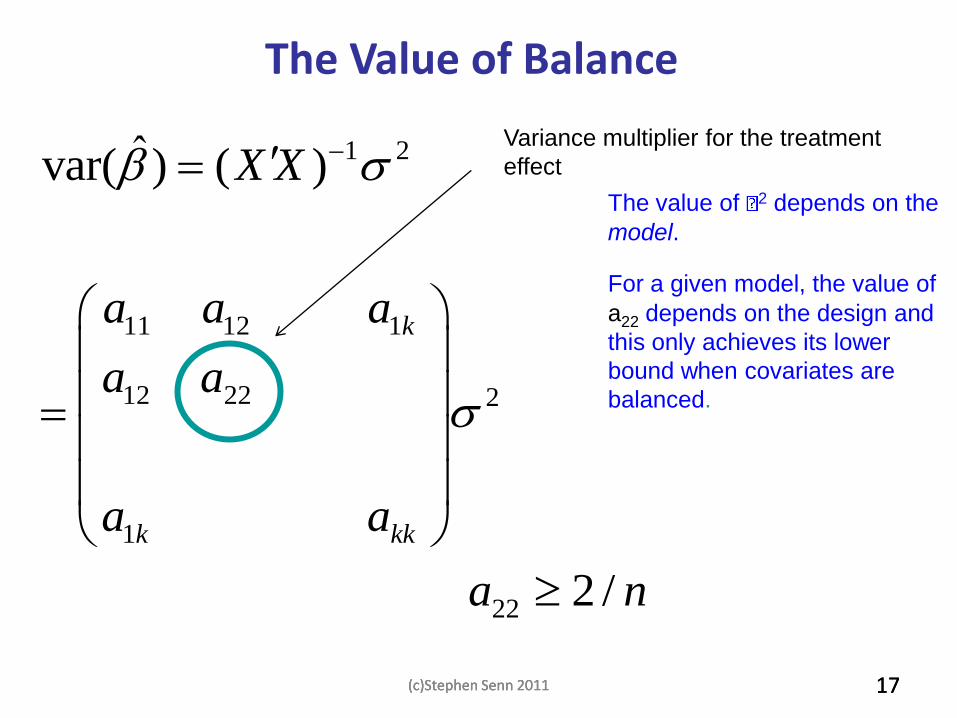
ˆvar( ) ( )
2 /
k
k kk
X X
a a a
a a
a a
a n
The value of 2 depends on the
model.
For a given model, the value of
a22 depends on the design and
this only achieves its lower
bound when covariates are
balanced.
The Value of Balance
Variance multiplier for the treatment
effect
(c)Stephen Senn 2011 (c)Stephen Senn 2011 17 (c)Stephen Senn 2011 17
Myth 3 The fact that covariates are balanced means that they can be ignored
• You may think that this is an obvious fallacy
• Nobody would analyse a matched pairs design like a completely randomised design
• However two classes of statisticians are implicitly signing up to this
– Those who minimise
– Those who use the propensity score
(c)Stephen Senn 2011 (c)Stephen Senn 2011 18 (c)Stephen Senn 2011 18
The Problem with Minimisation
• Many public sector trials are minimised but not strictly randomised
– That is to say a dynamic form of balancing is employed
• Often the covariates used for balancing are not fitted in the model
(c)Stephen Senn 2011 (c)Stephen Senn 2011 19 (c)Stephen Senn 2011 19
Typical MRC Stuff
„The central telephone randomisation system used a minimisation algorithm to
balance the treatment groups with respect to eligibility criteria and other major
prognostic factors.‟ (p24)
„All comparisons involved logrank analyses of the first occurrence of particular
events during the scheduled treatment period after randomisation among all those
allocated the vitamins versus all those allocated matching placebo capsules (ie,
they were “intention-to treat” analyses).‟ (p24)
1. (2002) MRC/BHF Heart Protection Study of cholesterol lowering
with simvastatin in 20,536 high-risk individuals: a randomised placebo-
controlled trial. Lancet 360:7-22
(c)Stephen Senn 2011 (c)Stephen Senn 2011 20 (c)Stephen Senn 2011 20
An Example of Why You Should Condition
• Contrary to what many critics of randomisation believe matched pairs clinical trial are incredibly rare
– The philosophers believe they are possible because they think patients are treated simultaneously in clinical trials (myth 1)
– The fact that they are not makes matching impossible
• So I will have to consider a cross-over trial as a surrogate example
(c)Stephen Senn 2011 (c)Stephen Senn 2011 21 (c)Stephen Senn 2011 21
22
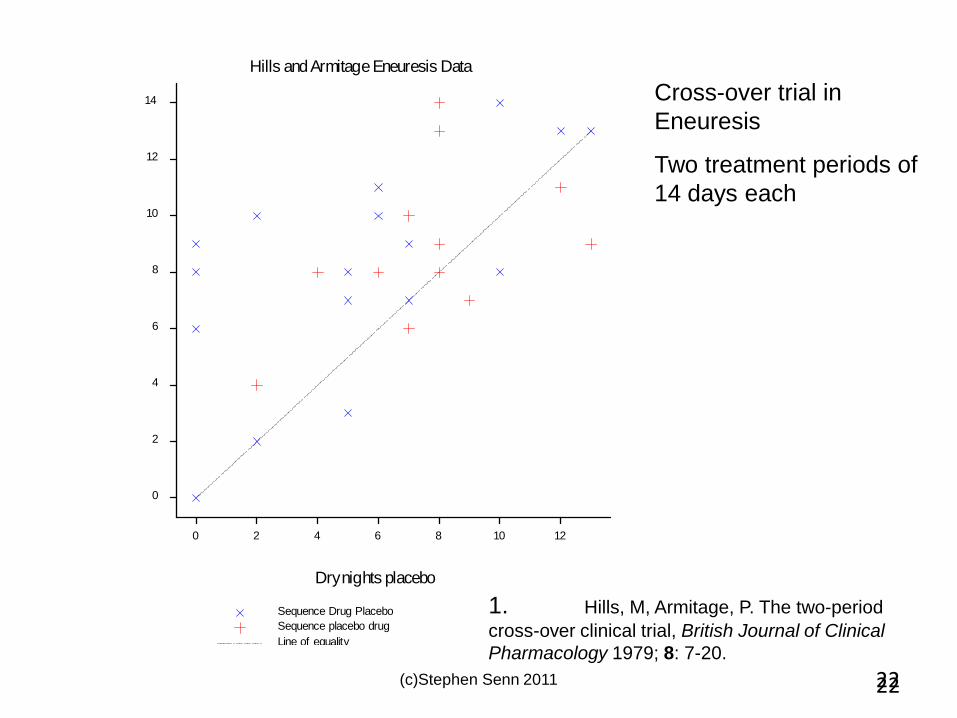
Hills and Armitage Eneuresis Data
10
8
14
2
12
6 1210
6
4
2
0
40 8
Dry nights placebo
Dry
nig
hts
dru
g
Line of equality
Sequence Drug Placebo
Sequence placebo drug
Cross-over trial in
Eneuresis
Two treatment periods of
14 days each
1. Hills, M, Armitage, P. The two-period
cross-over clinical trial, British Journal of Clinical
Pharmacology 1979; 8: 7-20.
(c)Stephen Senn 2011 22
23
0.7
4
0.5
2
0.3
0
0.1
-2-4
0.6
0.2
0.4
0.0
Den
sity
Permutated treatment effect
(c)Stephen Senn 2011
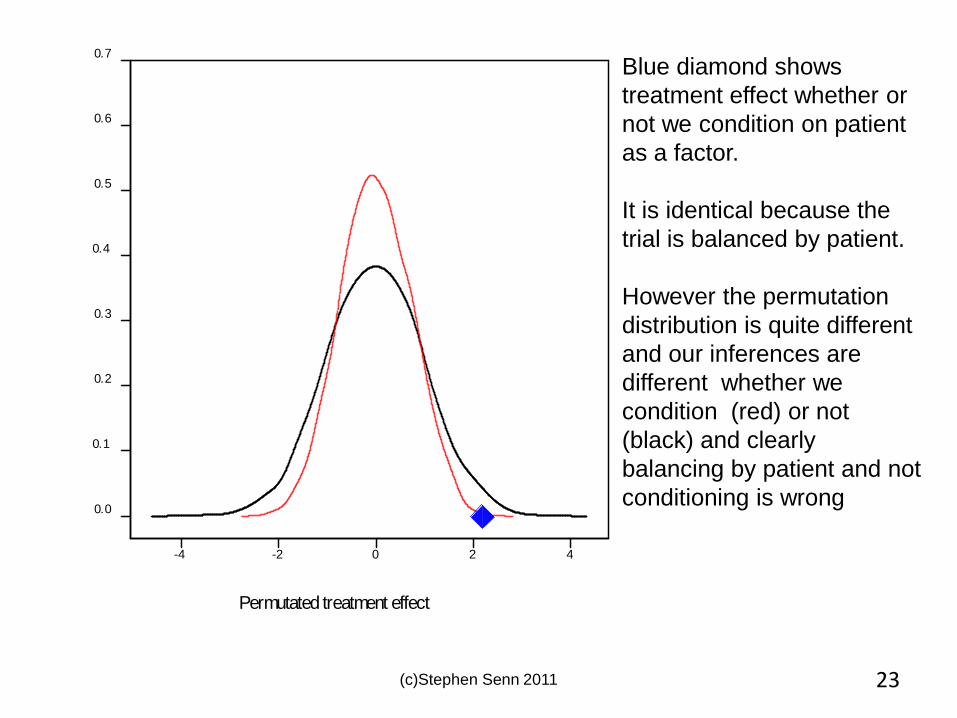
Blue diamond shows
treatment effect whether or
not we condition on patient
as a factor.
It is identical because the
trial is balanced by patient.
However the permutation
distribution is quite different
and our inferences are
different whether we
condition (red) or not
(black) and clearly
balancing by patient and not
conditioning is wrong
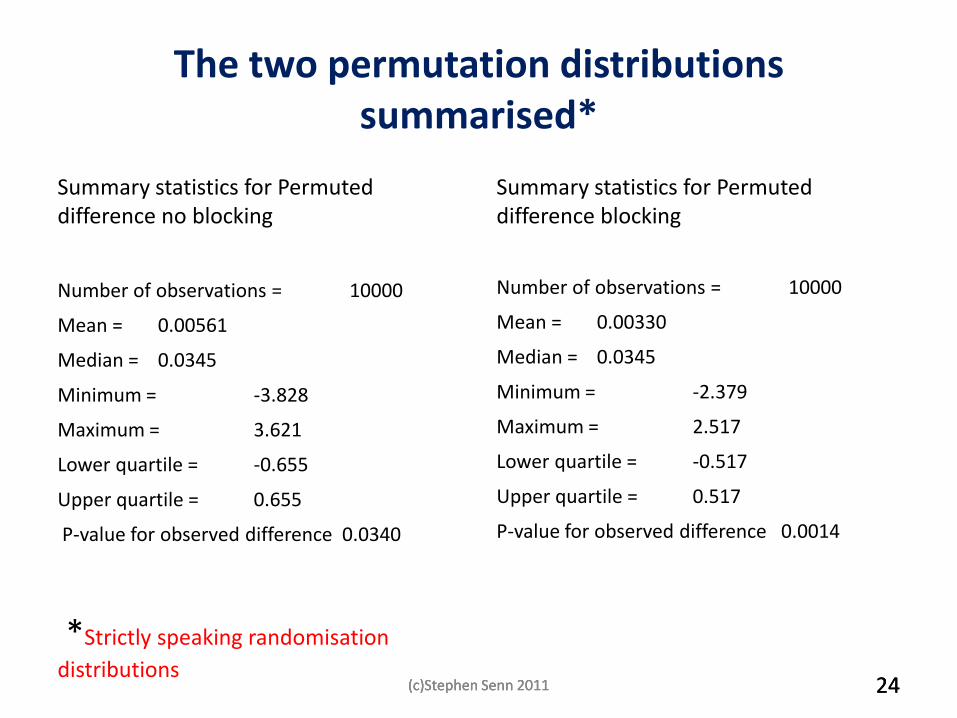
The two permutation distributions summarised*
Summary statistics for Permuted difference no blocking
Number of observations = 10000
Mean = 0.00561
Median = 0.0345
Minimum = -3.828
Maximum = 3.621
Lower quartile = -0.655
Upper quartile = 0.655
P-value for observed difference 0.0340
*Strictly speaking randomisation
distributions
Summary statistics for Permuted difference blocking
Number of observations = 10000
Mean = 0.00330
Median = 0.0345
Minimum = -2.379
Maximum = 2.517
Lower quartile = -0.517
Upper quartile = 0.517
P-value for observed difference 0.0014
(c)Stephen Senn 2011 (c)Stephen Senn 2011 24 (c)Stephen Senn 2011 24
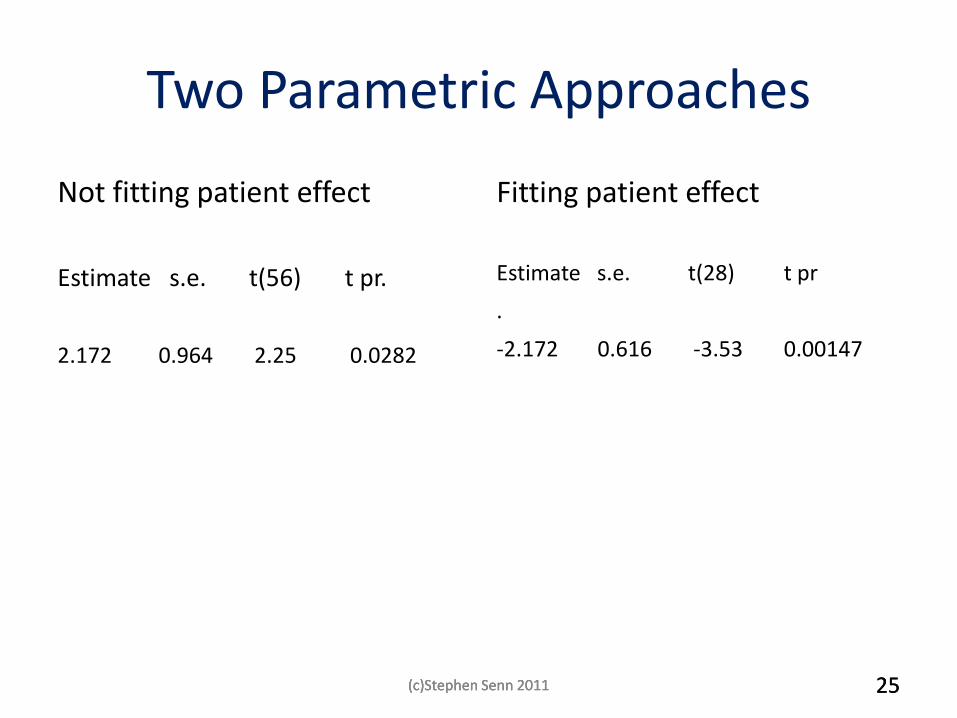
Two Parametric Approaches
Not fitting patient effect
Estimate s.e. t(56) t pr.
2.172 0.964 2.25 0.0282
Fitting patient effect
Estimate s.e. t(28) t pr
.
-2.172 0.616 -3.53 0.00147
(c)Stephen Senn 2011 (c)Stephen Senn 2011 25 (c)Stephen Senn 2011 25
Myth 4 Randomisation is Not Necessary for Blinding
Fisher, in a letter to Jeffreys, explained the dangers of using a haphazard method thus … if I want to test the capacity of the human race for telepathically perceiving a playing card, I might choose the Queen of Diamonds, and get thousands of radio listeners to send in guesses. I should then find that considerably more than one in 52 guessed the card right... Experimentally this sort of thing arises because we are in the habit of making tacit hypotheses, e.g. ‘Good guesses are at random except for a possible telepathic influence.’ But in reality it appears that red cards are always guessed more frequently than black(Bennett, 1990).(pp268-269) …if the trial was, and remained, double-blind then randomization could play no further role in this respect. (Worrall, 2007)(P454)
(c)Stephen Senn 2011 26 (c)Stephen Senn 2011 26
Avoiding Double Guessing
• If you don’t randomise you have to assume that your strategy has not been guessed by the investigator
• You are using ‘the argument from the stupidity of others’
• Not publishing the block size in your protocol is a classic example
(c)Stephen Senn 2011 27 (c)Stephen Senn 2011 27
Myth 5 Randomisation is Inefficient
• There is a sense in which this is no myth
• Randomisation is not fully efficient
• Theory shows that there is a loss of about one patient per factor fitted compared to a completely balanced design
– Such completely balanced designs are not usually possible, however
• In any case, the loss is small
(c)Stephen Senn 2011 28
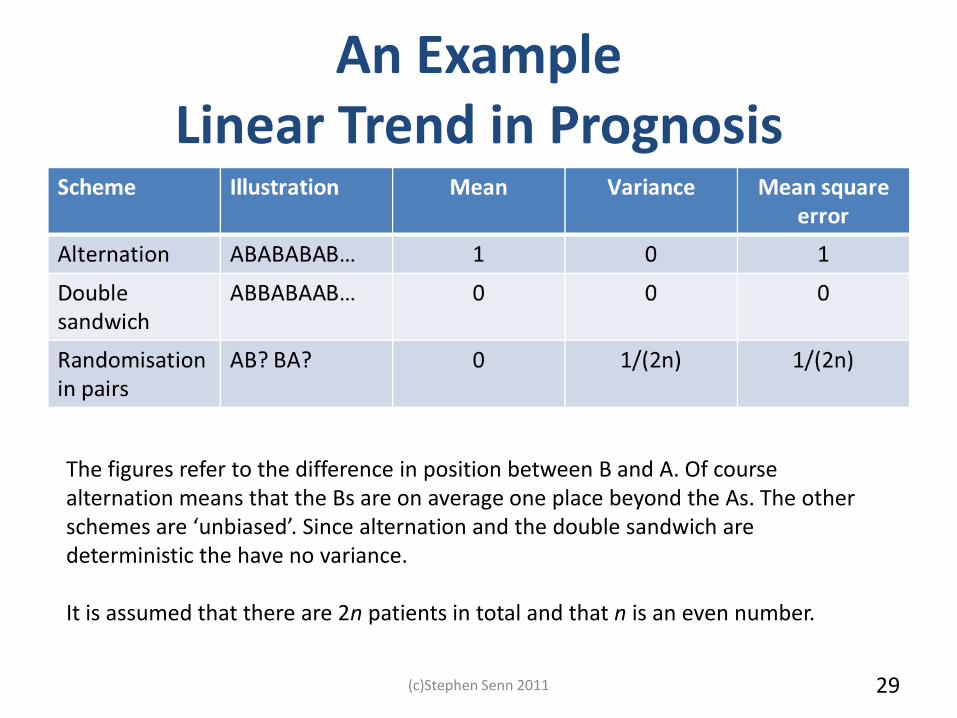
An Example Linear Trend in Prognosis
(c)Stephen Senn 2011 29
The figures refer to the difference in position between B and A. Of course alternation means that the Bs are on average one place beyond the As. The other schemes are ‘unbiased’. Since alternation and the double sandwich are deterministic the have no variance. It is assumed that there are 2n patients in total and that n is an even number.
Myth 6 Randomisation precludes balancing
• Of course we know this is not true
• We can build strata and randomise within them
• ‘Balance what you can and randomise what you can’t’ was Fisher’s recipe
(c)Stephen Senn 2011 30
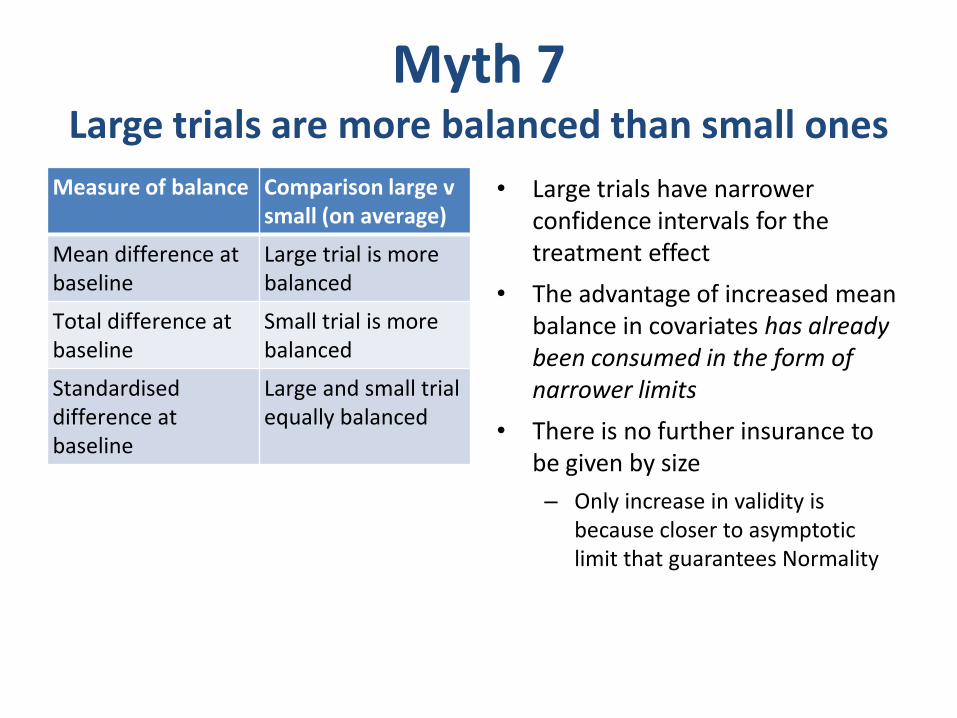
Myth 7 Large trials are more balanced than small ones
Measure of balance Comparison large v small (on average)
Mean difference at baseline
Large trial is more balanced
Total difference at baseline
Small trial is more balanced
Standardised difference at baseline
Large and small trial equally balanced
• Large trials have narrower confidence intervals for the treatment effect
• The advantage of increased mean balance in covariates has already been consumed in the form of narrower limits
• There is no further insurance to be given by size
– Only increase in validity is because closer to asymptotic limit that guarantees Normality
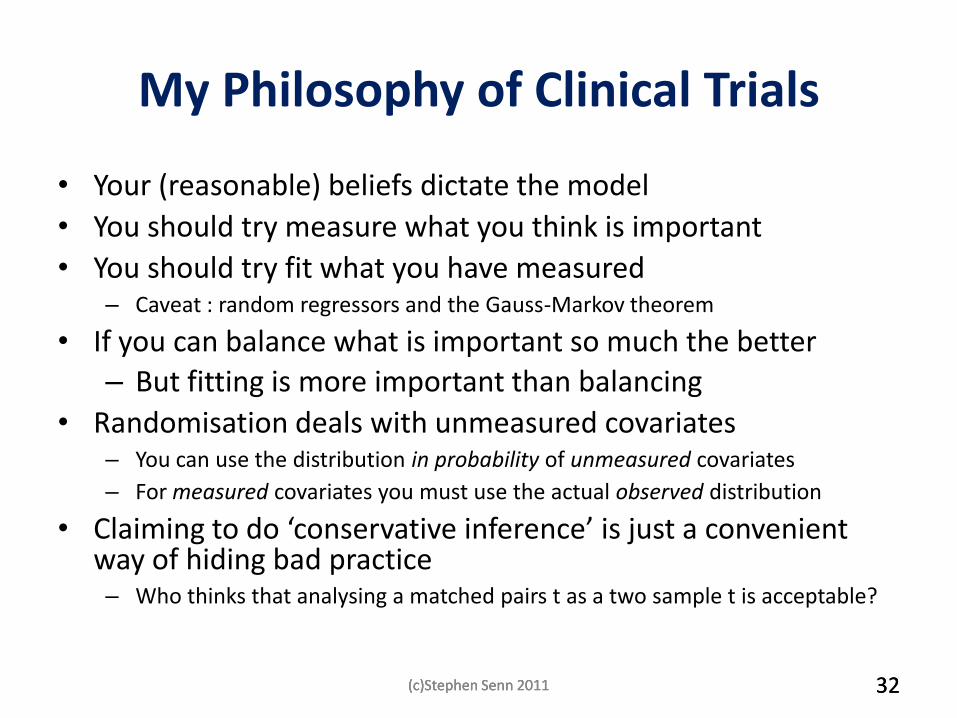
My Philosophy of Clinical Trials
• Your (reasonable) beliefs dictate the model
• You should try measure what you think is important
• You should try fit what you have measured – Caveat : random regressors and the Gauss-Markov theorem
• If you can balance what is important so much the better
– But fitting is more important than balancing
• Randomisation deals with unmeasured covariates – You can use the distribution in probability of unmeasured covariates
– For measured covariates you must use the actual observed distribution
• Claiming to do ‘conservative inference’ is just a convenient way of hiding bad practice – Who thinks that analysing a matched pairs t as a two sample t is acceptable?
(c)Stephen Senn 2011 (c)Stephen Senn 2011 32 (c)Stephen Senn 2011 32
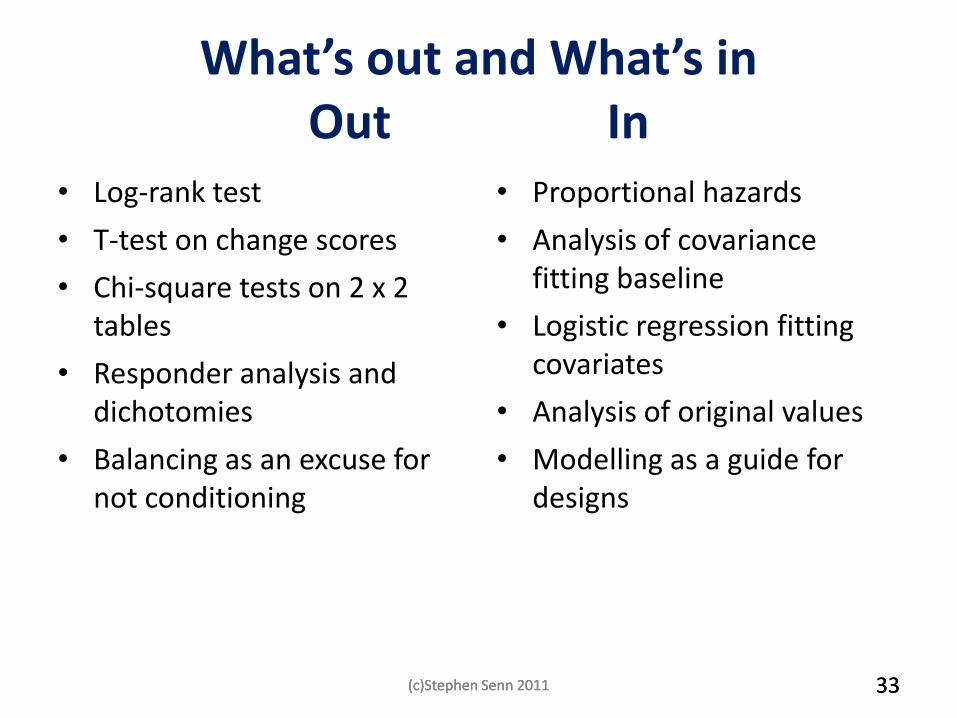
What’s out and What’s in Out In
• Log-rank test
• T-test on change scores
• Chi-square tests on 2 x 2 tables
• Responder analysis and dichotomies
• Balancing as an excuse for not conditioning
• Proportional hazards
• Analysis of covariance fitting baseline
• Logistic regression fitting covariates
• Analysis of original values
• Modelling as a guide for designs
(c)Stephen Senn 2011 (c)Stephen Senn 2011 33 (c)Stephen Senn 2011 33
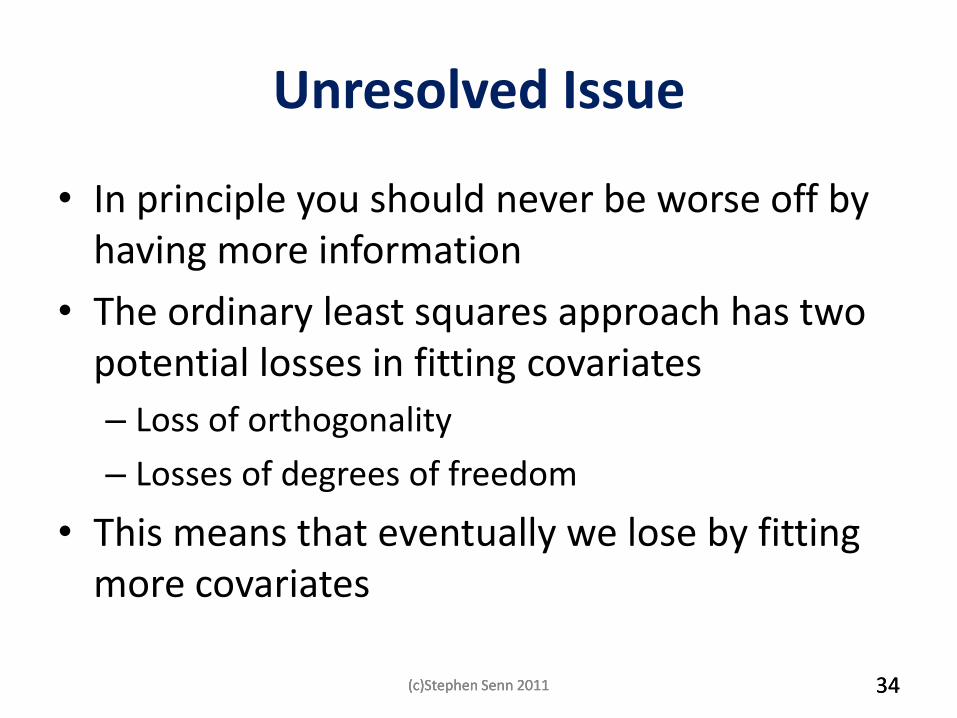
Unresolved Issue
• In principle you should never be worse off by having more information
• The ordinary least squares approach has two potential losses in fitting covariates
– Loss of orthogonality
– Losses of degrees of freedom
• This means that eventually we lose by fitting more covariates
(c)Stephen Senn 2011 (c)Stephen Senn 2011 34 (c)Stephen Senn 2011 34
Resolution?
• The Gauss-Markov theorem does not apply to stochastic regressors
• In theory we can do better by having random effect models
• However there are severe practical difficulties
• Possible Bayesian resolution in theory
• A pragmatic compromise of a limited number of prognostic factors may be reasonable
(c)Stephen Senn 2011 (c)Stephen Senn 2011 35 (c)Stephen Senn 2011 35
To sum up
• There are a lot of people out there who fail to understand what randomisation can and cannot do for you
• We need to tell them firmly and clearly what they need to understand
(c)Stephen Senn 2011 36 (c)Stephen Senn 2011 36
Finally
I leave you with this thought
Statisticians are always tossing coins but do not own many
Acknowledgements and Disclaimer
• Thanks to
– MRC Network of Hubs
– My previous employer Glasgow University
• GIFTED Glasgow Initiative for Trial Evaluation and Design and
• School of Mathematics and Statistics
– My current employer CRP-Santé, Luxembourg
• These are my personal views and should not be ascribed to the above


![Strategic planning senn,j [autosaved]](https://img.pdfslide.us/doc/110x75/5592c0c71a28abe9408b479c/strategic-planning-sennj-autosaved.jpg)