Embed Size (px)
Citation preview

Seven Aspects of Loan Size
Mark Schreiner
October 4, 2001
Center for Social Development, Washington University in St. LouisCampus Box 1196, One Brookings Drive, St. Louis, MO 63130-4899, U.S.A.
and
Microfinance Risk Management6070 Chippewa St. #1W, St. Louis, MO 63109-3060, U.S.A.
Telephone: (314) 481-9788, Web: http://www.microfinance.com
AbstractAttempts to measure the depth of outreach in microfinance usually start—and oftenend—with loan size. But just what is loan size? This paper discusses seven aspects ofloan size, each of which affects not only depth of outreach but also profitability. Theseven aspects are: term to maturity, dollars disbursed, average balance, dollars perinstallment, time between installments, number of installments, and “dollar-years ofborrowed resources”. This paper defines the seven aspects, explains why each onematters, and gives examples of their measurement with data from three Latin Americanmicrofinance organizations.
Author’s noteMark Schreiner is a Senior Scholar in the Center for Social Development at WashingtonUniversity in St. Louis. He is also a consultant with Microfinance Risk Management,http://www.microfinance.com. He gratefully acknowledges extremely help from theeditor and from an anonymous referee, data from three Latin American microfinanceorganizations, and financial support from the Division of Asset Building andCommunity Development of the Ford Foundation. This is an earlier version of a paperpublished in Journal of Microfinance, Vol. 3, No. 2, pp. 27-47.

1
Seven Aspects of Loan Size
1. Introduction
Ten years ago, self-sustainability was measured with the Subsidy Dependence
Index (Yaron, 1992). Now, grades and shades of self-sustainability are recognized, and
the SDI is complemented by such measures as Adjusted Return on Assets, Financial
Self-sufficiency, and Net Present Cost (Christen, 1997; Schreiner, 1997).
In the same way, depth of outreach has been measured mostly as loan size,
usually as dollars disbursed or average balance. But both borrowers and lenders also
care about many other aspects of loan size. In addition to dollars disbursed and average
balance, this paper defines the following aspects and discusses how they affect outreach
and profitability: term to maturity, dollars per installment, time between installments,
number of installments, and “dollar-years of borrowed resources”.
Each of the seven measures highlights one or more dimensions of loans but
ignores other dimensions. Thus, loans may be “large” in some senses but “small” in
others. Compared with knowledge of one aspect of loan size, knowledge of all aspects
can lead to markedly different choices.
The aspect most often ignored is probably term to maturity. For example,
donors often take the amount disbursed as a marker of depth of outreach. Gonzalez-
Vega et al. (1997) find, however, that while growth in the amount disbursed had slowed
2
for a group of large, mature microfinance organizations in Bolivia, growth in the term
to maturity continued. The microlenders increased loan size not by disbursing more per
loan but by lengthening terms to maturity. Looking only at amount disbursed, donors
would mistakenly have viewed depth of outreach as unchanged rather than decreased.
Likewise, microfinance loans (for example, for the purchase of a fixed asset such
as a sewing machine) may differ in term to maturity. Compared with a 2-year loan, a
1-year loan is typically equivalent in amount disbursed, in average balance, and in time
between installments; larger in dollars per installment; and smaller in term to maturity,
in number of installments, and in “dollar-years of borrowed resources”.
Whether a given loan is seen as “large” or “small” depends on which aspects
matter most from a given point of view. Borrowers concerned mostly about low
monthly payments will see a 2-year loan as smaller than a 1-year loan; borrowers
concerned mostly with getting enough cash to make a purchase will see both loans as
equivalent; and borrowers concerned mostly with interest costs will see the 30-year
loans as larger than the 15-year loan.
The best measures of loan size encompass multiple dimensions. In particular, the
measure of “dollar-years of borrowed resources” encompasses all six other aspects.
Although virtually unknown and unused to date, “dollar-years of borrowed resources”
probably should be the preferred summary measure of loan size. In simple terms,

3
“dollar-years of borrowed resources” is the average balance that would obtain if the
loan had a term to maturity of one year.
The rest of this paper defines and explains each of the seven aspects of loan size.
It explains the importance of each aspect in terms of depth of outreach and
profitability, and it defines formulae for their measurement. Examples of all of the
measures are drawn from three large Latin American microfinance organizations. The
examples not only show how to compute the measures but they also show that,
compared with looking at a single aspect such as amount disbursed, looking at all seven
aspects can lead to different conclusions. Finance is the exchange of resources through
time; measures of loan size should account explicitly for the passage of time.

4
2. The seven aspects
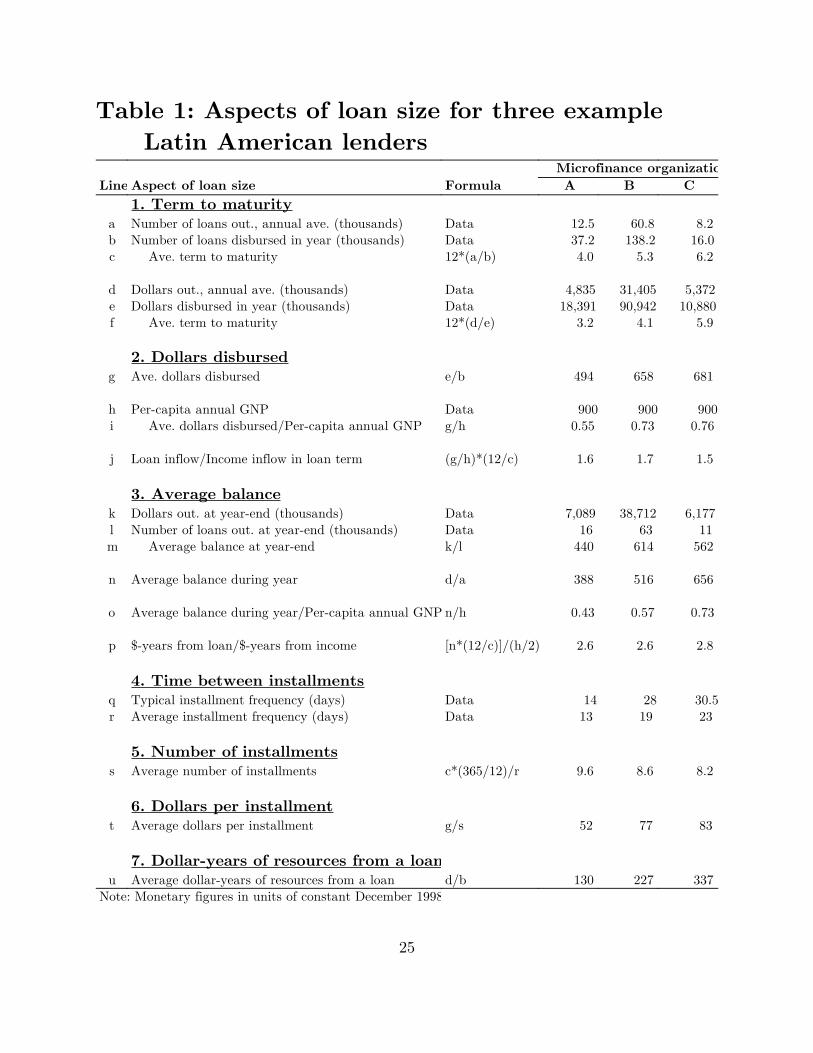
To illustrate the measurement of loan size given data generally available to
external analysts, Table 1 computes measures of the seven aspects of loan size for three
large, broadly targeted microfinance organizations in Latin America.
Figure 1 depicts the seven aspects of loan size for a loan repaid in equal
installments. The vertical axis marks cash flows, with positive flows going from the
lender to the borrower and negative flows going from the borrower to the lender. The
horizontal axis marks time. For simplicity, interest is ignored. Figure 2 depicts typical
loans in 1995 from two of the example microfinance lenders from Latin America.
2.1 Term to maturity
In Figure 1, term is measured along the horizontal axis. All else constant, longer
loans are larger than shorter ones. For lenders, longer loans generate more interest
revenue from a single evaluation and disbursement. On the other hand, longer loans
have more chances to fall into arrears and may lead to greater delinquency costs.
For borrowers, longer loans signal shallower outreach because the most
creditworthy—and hence the least-poor—usually get the longest loans (Conning, 1998).
Term also matters because lenders usually allow borrowers only one loan at a time.
Thus, if borrowers use loans to pay for periodic purchases—for example, monthly
additions to inventory—shorter terms would be more valuable than longer terms. On

5
Term to maturity � 12 � Annual average number of loans outstandingNumber of loans disbursed in year
. (1)
Term to maturity � 12 � Annual average value outstandingValue disbursed in year
. (2)
the other hand, if loans purchase fixed assets whose returns take longer to realize,
longer terms would be more valuable both because such fixed-asset purchases are
infrequent and because longer terms better match the size and timing of installments
with the size and timing of returns from the fixed asset.
In general, longer loans signal greater profitability but less depth of outreach.
2.1.1 Formulae
The most accurate way to compute average term to maturity uses data on each
loan outstanding at a point in time or on each loan disbursed in a year. External
analysts, however, usually do not have access to such data. A proxy measure for
average term to maturity (in months) that uses commonly-available data is:
This estimate is based on numbers of loans outstanding and numbers of loans
disbursed. An alternative estimate is based on value outstanding and value disbursed:
Both equations 1 and 2 understate the true average term in a growing portfolio,
but the bias is small. To measure term to maturity in years rather than months,
remove the multiplicative factor of 12 from the formulae.

6
2.1.2 Examples
For the three Latin American lenders, the average term based on the number of
loans is 4.0 months for lender A, 5.3 months for lender B, and 6.2 months for lender C
(Table 1, line c). In contrast, the estimates based on dollars loaned is 3.2 months, 4.1
months, and 5.9 months (line f). (Comparisons could also focus on changes through
time for a single given lender rather than differences across lenders.)
With term to maturity measured from loan values, Lender C makes loans that
are (5.9 � 4.1) ÷ 4.1 = 44 percent larger than lender B and 84 percent larger than
lender A. In contrast, when loan size is measured as amount disbursed, the differences
are only 3 percent and 38 percent (Table 1, line g). For these three microlenders,
differences in depth of outreach and profitability due to loan size are much larger when
seen as term to maturity than when seen as amount disbursed. Accounting explicitly for
time—via term to maturity—matters for the measurement of loan size.
2.2 Dollars disbursed
Dollars disbursed is the most common measure of loan size. In Figure 1, dollars
disbursed is measured along the vertical axis. This measure ignores time.
For borrowers, dollars disbursed matters because it represents the largest single
purchase possible from loan proceeds. For example, a farmer who wants to buy a cow
that sells for $100 has little use for a disbursement of only $60 unless she can make up
7
Amount disbursed �
Dollars disbursed in yearNumber of loans disbursed in year
. (3)
the $40 difference from other sources. Dollars disbursed also represents the addition to
overall household liquidity provided by the loan.
For lenders, dollars disbursed affects operational costs and profits in two ways.
First, the disbursement is the maximum possible loss due to default. Second, although
most of the costs of evaluation and disbursement are fixed, larger loans do have higher
per-dollar variable costs because lenders take extra care due to greater risk exposure.
From the standpoint of depth of outreach, smaller disbursements imply greater
average depth if poorer borrowers are riskier and so qualify only for smaller loans.
Furthermore, poorer borrowers have fewer complementary assets to combine in
production with the large, lumpy assets that might be purchased with a large
disbursement. For example, a farmer with two hectares of land is unlikely to use a
disbursement to buy a tractor. Thus, poorer borrowers are more likely to want smaller
loans than less-poor borrowers.
In general, larger disbursements mean more profits but less depth of outreach.
2.2.1 Formulae
Given the aggregate annual data usually available to external analysts, the
formula the amount disbursed is:

8
Average dollars disbursedPer�capita annual GNP
. (4)
2.2.2 Examples
Average disbursements in 1995 by the Latin American lenders were $494 for
lender A, $658 for lender B, and $681 for lender C (Table 1, line g). As noted above,
Lender C disbursed 3 percent more than lender B and 38 percent more than lender A.
2.2.3 International comparisons
Cross-country comparisons of loan size often attempt to account for different
levels of income by dividing average dollars disbursed by per-capita annual GNP:
In 1995, annual per-capital GNP in the country of the three Latin American
lenders was about $900. As a share of average dollars disbursed, per-capita GNP was
0.55 for lender A, 0.73 for lender B, and 0.76 for lender C (Table 1, line i). Because the
lenders are in the same country, normalizing by per-capita annual GNP does not
change their relationships. In general, however, normalization changes the rankings.
As a benchmark for depth of outreach, this ratio has two weaknesses. First, per-
capita GNP typically exceeds both median GNP and the poverty-line income because a
few very rich people pull the average up. Thus, although the ratios are useful for
relative comparisons across countries with similar income distributions, they are not
useful if the income distribution differs. Furthermore, the ratios are not good
benchmarks of absolute depth of outreach, whether across countries or within a

9
Average dollars disbursedPer�capita annual GNP
�
12Average term to maturity
. (5)
country. An alternative might compare dollars disbursed with poverty-line income,
perhaps adjusted for purchasing-power parity. The standards used to set the poverty
line differ across countries, however, so median income might be a better benchmark.
Unfortunately, data on median income are difficult to come by.
A second weakness of the ratio of dollars disbursed to per-capita GNP is its lack
of a useful interpretation: the numerator is the flow disbursed as a loan, while the
denominator is the flow from average income in a year. The two flows pertain to
different time frames.
An alternative ratio compares cash inflows in a common time frame, cash inflows
from loans in a year with cash inflows from income in a year:
Of course, cash from income, unlike cash from loans, does not need to be repaid.
Still, this ratio is sensible because it compares annual flows with annual flows. In short,
it accounts for time.
For the three example microlenders, this ratio was 1.6 for lender A, 1.7 for lender
B, and 1.5 for lender C (Table 1, line j). Although lender C had the largest average
dollars disbursed, the longest average term, and—as shown below—the second-largest
average balance, its loans provided smaller cash inflows to repeat borrowers through
10
time. This point of view is particularly relevant because the typical microfinance
borrower takes several consecutive loans through time.
This new ratio also has another interpretation. It suggests that, compared with
self-finance from savings, access to these example lenders allows borrowers to make
investments that otherwise would have required saving 1.5 to 1.7 years of the typical
per-capita income. Even assuming savings of 25 percent of income, access to loans
allowed investments, all else constant, 6 to 7 years sooner than under self-finance.
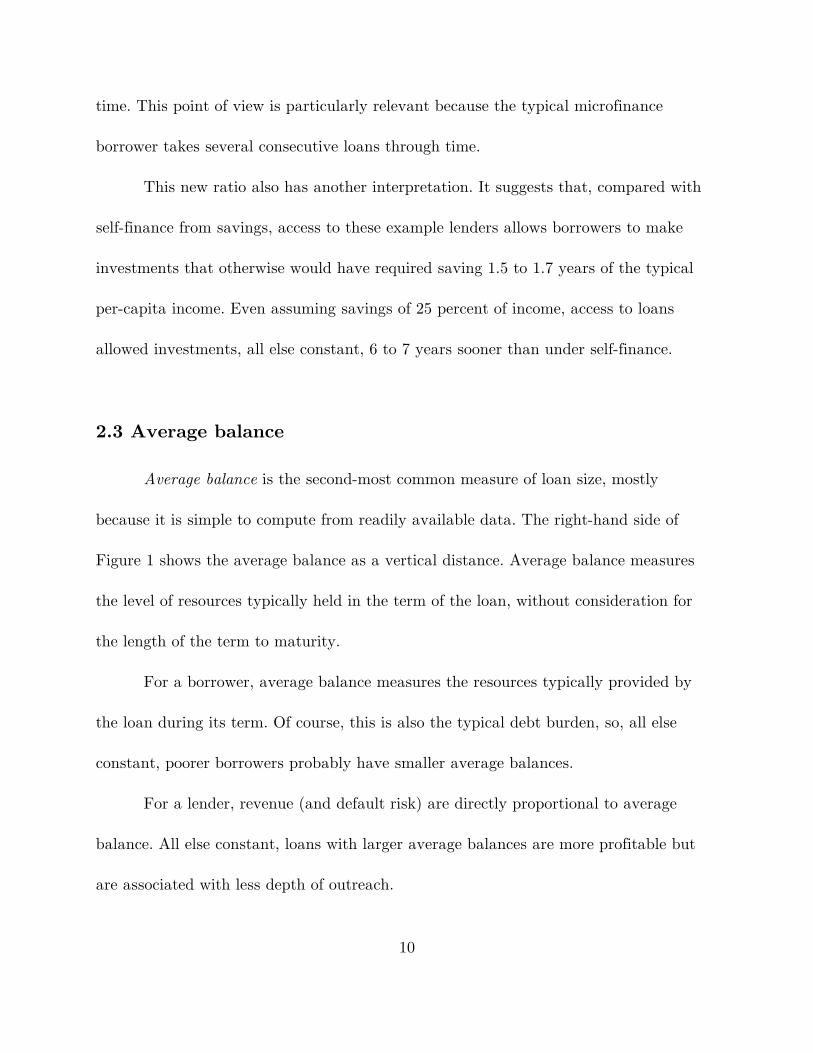
2.3 Average balance
Average balance is the second-most common measure of loan size, mostly
because it is simple to compute from readily available data. The right-hand side of
Figure 1 shows the average balance as a vertical distance. Average balance measures
the level of resources typically held in the term of the loan, without consideration for
the length of the term to maturity.
For a borrower, average balance measures the resources typically provided by
the loan during its term. Of course, this is also the typical debt burden, so, all else
constant, poorer borrowers probably have smaller average balances.
For a lender, revenue (and default risk) are directly proportional to average
balance. All else constant, loans with larger average balances are more profitable but
are associated with less depth of outreach.

11
Average balance �
Dollars outstanding at year�endNumber of loans outstanding at year�end
. (6)
Average balance �
Annual average value outstandingAnnual average number of loans outstanding
. (7)
But not all else is constant. In particular, the average balance depends on the
term to maturity and on the size, timing, and number of installments. For example, the
average balance of a balloon loan with one repayment equals the amount disbursed, but
the average balance of a loan repaid in equal installments is slightly more than half the
amount disbursed (Rosenberg, 1999). Furthermore, a loan repaid in four weekly
installments has about the same average balance as a loan repaid in four monthly
installments. Average balance ignores term to maturity (and other aspects of loan size),
so it is an imperfect measure.
2.3.1 Formulae
The average balance may be computed from publicly available data as the ratio
of stocks at a point in time (usually year-end):
This stock measure is susceptible to seasonality, and if a portfolio has grown
rapidly, then it also can overstate the average balance of the average loan during the
year. A ratio of annual averages avoids these issues:
Which formula is most appropriate depends on data availability (year-end stocks
are easier to obtain than annual averages) and on the question the measurement

12
Average balancePer�capita annual GNP
. (8)
intends to inform. For a snapshot of the portfolio at a point in time, stocks are best; for
a summary picture through a year, annual averages are best.
2.3.2 Examples
All three Latin American lenders grew rapidly in 1995, so year-end stocks (Table
1, lines k and l) exceed annual averages (lines a and d) from monthly data. The choice
of formula (equation 6 versus 7) matters for comparisons among lenders; average
balances computed from annual averages are smaller, compared with average balances
computed from year-end stocks, for lender A ($388 to $440, lines m and n) and for
lender B ($516 to $614), but larger for lender C ($656 to $562), probably because a
sharp seasonal spike in small loans to traders at Christmas distorts the stock measure.
Average balance can provide a different picture of loan size than amount
disbursed. Although lender C had larger amounts disbursed than B and A, if average
balance is measured with annual averages, then lender B ($614) had larger loans than
lender C ($562). The relationships differ even if average balance is measured with
stocks: in this case, C is 27 percent larger than B (rather than 3 percent for amount
disbursed) and 69 percent larger than A (rather than 38 percent).
2.3.3 International comparisons
For cross-country comparisons, common practice is to divide average balance by
per-capita annual GNP:

13
Average balance � 12Average term to maturity
Per�capita annual GNP ÷ 2. (9)
For lenders A, B, and C, this ratio was 0.43, 0.57, and 0.73 (Table 1, line o). But
what exactly do these shares mean? Besides the weaknesses of per-capita GNP as a
benchmark for depth of outreach that have already been discussed, the interpretation of
the ratio is unclear because the numerator has units of resources borrowed per loan but
the denominator has units of income per year.
An alternative ratio would compare dollar-years of resources provided by a loan
to dollar-years of resources provided by income, if all income were saved. This ratio
uses the concept of dollar-years of resources. A dollar-year of resources is a dollar’s
worth of resource held for 12 months, or, equivalently, 12 dollar’s worth of resources
held for one month, or 6 dollar’s worth of resources held for 2 months, etc.
If income flows into a household in a constant stream and if all income is saved
in a year, then the resulting dollar-years are half the total annual flow of income (that
is, per-capita annual GNP ÷ 2). The dollar-years provided by loans in a
year—assuming repaid loans are renewed with identical loans—is the average balance
multiplied by the number of loans in a year. Thus, the proposed alternative ratio
compares dollar-years of resources from loans with dollar-years of resources from
annual income, if it were all saved:

14
As seen by this summary ratio, loan size was about the same for lenders A and
B (2.6, Table 1, line p) and about 8 percent larger for lender C (2.8). This near-
sameness contrasts with the much larger differences found through the lens of amount
disbursed, term to maturity, and average balance. Again, the difference results from a
more complete consideration of the passage of time.
2.4 Time between installments
Loan size increases with time between installments, the horizontal distance
between steps in Figure 1. Obviously, this measure directly accounts for time.
For borrowers, more-frequent installments increase costs because, with less time
to accumulate cash for repayment, the likelihood increases that net cash flows will be
unusually low. For example, a street vender has more bad days than bad weeks, so
daily installments are more likely to be late than weekly installments or monthly
installments. Also, more-frequent installments imply greater transaction costs to
actually make payments. Poorer borrowers are less able to absorb these costs.
For lenders, frequent installments affect costs (and thus profits) in three ways.
First, costs increase because borrowers fall into arrears more often and thus must be
dunned more. Second, costs increase because of the need to process frequent payments.
Third, costs decrease because—all else constant—unusually risky borrowers are more

15
Frequency of installments �
Average term to maturityAverage number of installments
. (10)
likely to fall into arrears and draw attention to themselves before they have severe
repayment problems.
In general, more time between installments implies less depth of outreach and
both positive and negative effects on profits.
2.4.1 Measurement
The ideal way to measure the frequency of installments is with data on each loan
outstanding at a point in time or on each loan disbursed in a year. If the average
number of installments is known, then one alternative is:
Such data, however, are usually not available. A cruder (but more feasible)
alternative is to ask the lender to estimate the typical (most common) frequency. The
typical frequency, however, may differ from the average frequency. For example, if 30
percent of loans have weekly installments and 70 percent have monthly installments,
then the typical frequency is monthly, but the average frequency is 0.3�7 + 0.7�(365/12)
� 23 days. The typical frequency is appropriate when most loans have the same
frequency, while the average frequency is appropriate when no one frequency
dominates.

16
2.4.2 Examples
For the example Latin American microlenders, the typical installment frequency
(Table 1, line q) was 14 days for lender A, 28 days (4 weeks) for lender B, and 30.5
days (one month) for lender C. Like other measures of loan size already discussed, the
typical frequency suggests that A makes smaller loans than B or C. Unlike most other
measures, the typical frequency also suggests that loans from B and C are about the
same size.
The average installment frequency (line r), computed from a sample of loans,
was 13 days for lender A, 19 days for lender B, and 23 days for lender C. Again A is
smaller than B or C, and now B, as by most other measures, is a bit smaller than C.
2.5 Number of installments
All else constant, loan size increases with the number of installments. This is
pictured as the number of steps in Figure 1. This aspect does not consider time.
For borrowers, more installments mean more transaction costs to make
payments. More installments also mean more chances to fall into arrears, and this
increases the psychological costs of being in arrears and of dealing with enforcement
visits from the lender. Thus, poorer borrowers generally have fewer installments.
For lenders, more installments increase costs (and decrease profits) because
tellers and administrators spend more time on cash transactions. More installments also

17
Number of installments �
Average term to maturityAverage frequency of installments
. (11)
increase lender costs because loans have more chances to fall into arrears and to require
enforcement visits. All else constant, more installments decreases profit.
More installments implies larger loans, less profit, and less depth of outreach.
2.5.1 Measurement
The best way to measure the average number of installments is with data on all
loans outstanding at a point in time or on all loans disbursed in a year. This data is
usually unavailable. A second-best proxy for the average number of installments is:
2.5.2 Examples
Lender A had the most installments per loan (9.6, Table 1, line s). Lender B
came next (8.6), and lender C had the fewest (8.2). Unlike all measures of loan size
discussed so far, the number of installments suggests that A has the largest loans, B
the next-largest, and C the smallest. This shows again how loan size varies by aspect.
2.6 Dollars per installment
In Figure 1, the vertical distance between steps is dollars per installment. Higher
steps mean larger loan sizes. This measure ignores time.
For borrowers, dollars per installment matters for depth of outreach because, all
else constant, poorer borrowers are less likely to be able to pay large installments. For

18
Dollars per installment �
Average dollars disbursedAverage number of installments
. (12)
lenders, this aspect matters for lender profitability because larger installments help to
dilute the fixed costs of the cash transaction. Thus, larger loans in terms of dollars per
installment imply more profits and less depth of outreach.
2.6.1 Measurement
The ideal way to measure dollars per installment is with data on each
installment due in a year, but external analysts rarely can get such data. A crude
alternative that uses commonly available data is:
Equation 12 ignores the interest portion of installments. This omission matters
most for absolute measures of loan size and for loans with large disbursements or long
terms to maturity, but it is not a major issue for most comparisons among lenders.
2.6.2 Examples
Among the example lenders, A had the fewest dollars per installment ($52, Table
1, line t), B was intermediate ($77), and C was the largest ($83). The relationships are
close to those for amount disbursed (8 percent difference between B and C, 60 percent
difference between C and A).

19
2.7 Dollar-years of borrowed resources
The best summary measure of loan size is probably dollar-years of borrowed
resources. In Figure 1, this is the shaded area southwest of the cash-flow steps. “Dollar-
years of borrowed resources” accounts for time and incorporates all the other six
aspects of loan size: term to maturity, dollars disbursed, average balance, time between
installments, number of installments, and dollars per installment. Loan size increases
with dollar-years of resources from a loan.
“Dollar-years of borrowed resources” measures the purchasing power provided by
the loan and the time through which the borrower controls this purchasing power. For
example, a $100 loan with one balloon installment after one year provides the use of a
dollar for a year, or 1 dollar-year. A $100 loan repaid in 12 monthly installments
provides 50 dollar-years; the purchasing power provided through time is the same as
that of a $50 with one balloon installment after one year. Finally, a $100 loan repaid in
6 monthly installments provides 25 dollar-years; average balance in the 6 months is
$50, and the $50 in half a year is equivalent to $25 in a full year.
For lenders, dollar-years per loan indicate the resources that earn revenue and
that are at-risk of loss from default. This measure is better than average balance
because, unlike average balance, it accounts for the term to maturity. On the whole,
more dollar-years per loan imply greater profitability.

20
Dollar�years �
Average annual dollars outstandingNumber of loans disbursed in a year
. (13)
For borrowers, dollar-years per loan measures the typical debt burden as well as
the amount of resources provided. Again, this is better than average balance because it
accounts for the term to maturity. More dollar-years implies less depth of outreach.
2.7.1 Measurement
Given data typically available to an external analyst, an estimate of average
dollar-years of resources from a loan is:
In contrast to the average balance, which has units of dollars per loan, this
measure has units of dollar-years per loan. If a portfolio has grown in the year, then
this formula will slightly overestimate the true figure.
2.7.2 Examples
More than any other aspect of loan size, “dollar-years of borrowed resources”
highlights the large differences among the three example lenders. While lender A
provides 130 dollar-years per loan, lender B provides about 227 dollar-years, and lender
C provides 337 dollar-years (Table 1, line u). In short, loans from lender C are 50
percent larger than loans from B and 160 percent larger than loans from A.

21
3. Discussion
3.1 Better measurement of loan size
This paper has discussed how seven aspects of loan size affect depth of outreach
and profitability. The most common summary measures—dollars disbursed and average
balance—ignore term to maturity. “Dollar-years of borrowed resources” is a better
measure because it encompasses the other six aspects of loan size and accounts for
time.
Furthermore, common ratios that compare average dollars disbursed or average
balance to per-capita GNP lack useful interpretations. Better alternatives compare cash
inflows from a loan to cash inflows from income or compare dollar-years from a loan to
dollar-years from income, if all income were saved.
3.2 Depth of outreach and profitability
Greater loan size usually means more profitability for the lender but less depth
of outreach for the borrower. Of course, improvements in efficiency (or other
innovations) can increase both depth of outreach and profitability. Because poorer
borrowers cannot demonstrate and guarantee their creditworthiness as well as less-poor
borrowers, however, efficient lenders must trade off depth of outreach against

22
profitability. Innovations can remove the trade-off temporarily, but the trade-off will
reappear once lenders reach the efficiency frontier (Gonzalez-Vega, 1998; Rhyne, 1998).
3.3 Latin American examples
This paper used publicly available data to measure aspects of loan size for three
large, microfinance organizations from Latin America. The main insight is that relative
loan size varies widely by aspect. Small differences between lenders A and C in amount
disbursed ($494 versus $681, or 38 percent) and in term to maturity (4 months versus
6.2 months, or 55 percent) exist side-by-side with large differences in the summary
measure of “dollar-years of borrowed resources” (130 versus 337, or 160 percent).
3.4 Caveats
Measurements of loan size mean little in a vacuum. Good analyses will look for
the why behind the measure of different aspects. For example, lender A might have
small loans not because it lends to poor borrowers (and has greater depth of outreach)
but because it is excessively conservative. Likewise, if lender A is more efficient than
lender C, it might make smaller loans and yet also make larger profits.
Loan size for a lender should be analyzed through time. For example, an analysis
of mission drift might look at loan size over a stretch of three or more years.

23
Other aspects of loans, aspects not discussed in detail here, also matter for both
depth of outreach and profitability. Examples include interest rates, fees, guarantee
requirements, and whether the loan is disbursed to an individual or through a group.
The fixation on loan size does not imply that bigger is better. What matters for
social welfare is not that loans are large but rather that the aspects of loan size be
tailored to the demand of the borrower, subject to the profitability and technological
constraints of supply by a lender (Rutherford, 2000; Schreiner, 1999).
Finally, the measures in this paper are necessarily crude because they use only
aggregate portfolio data, the data generally available to external analysts. A more
complete analysis would use data on individual loans. This would allow, for example,
analysis of medians instead of averages.
24
References
Christen, Robert Peck. (1997) Banking Services for the Poor, Boston: AcciónInternational, www.accion.org/pubs/main.asp.
Conning, Jonathan. (1998) “Outreach, Sustainability, and Leverage in Monitored andPeer-Monitored Lending”, Journal of Development Economics, Vol. 60, pp. 51-77.
Gonzalez-Vega, Claudio. (1998) “Microfinance: Broader Achievements and NewChallenges”, Economics and Sociology Occasional Paper No. 2518, The OhioState University, www-agecon.ag.ohio-state.edu/RuralFinance.
Gonzalez-Vega, Claudio; Schreiner, Mark; Meyer, Richard L.; Rodriguez-Meza, Jorge;and Sergio Navajas. (1997) An Ohio State Primer on Microfinance in Bolivia,manuscript, The Ohio State University, [email protected].
Rosenberg, Richard. (1999) “Measuring Microcredit Delinquency: Ratios Can BeHarmful to Your Health”, CGAP Occasional Paper No. 3, Washington, D.C.:World Bank, www.cgap.org/html/p_occasional_papers03.html.
Schreiner, Mark. (1999) “Aspects of Outreach: A Framework for the Discussion of theSocial Benefits of Microfinance”, Center for Social Development Working PaperNo. 99-3, Washington University in St. Louis, www.microfinance.com.
_____. (1997) A Framework for the Analysis of the Performance and Sustainability ofSubsidized Microfinance Organizations with Application to BancoSol of Boliviaand to the Grameen Bank of Bangladesh, unpublished Ph.D. dissertation, TheOhio State University, www.microfinance.com.
Rhyne, Elisabeth. (1998) “The Yin and Yang of Microfinance: Reaching the Poor andSustainability”, Microbanking Bulletin, Issue 2, pp. 6-8,www.colorado.edu/EconomicsInstitute/bfmft/mbbdown.htm.
Rutherford, Stuart. (2000) The Poor and Their Money, Delhi: Oxford University Press,ISBN 0-195-65255-X.
Yaron, Jacob. (1992) “Successful Rural Finance Institutions”, Discussion Paper No. 150,Washington, D.C.: World Bank, ISBN 0-8213-2018-1.
25
Table 1: Aspects of loan size for three exampleLatin American lenders
Microfinance organizatioCBAFormulaAspect of loan sizeLine
1. Term to maturity8.260.812.5DataNumber of loans out., annual ave. (thousands)a
16.0138.237.2DataNumber of loans disbursed in year (thousands)b6.25.34.012*(a/b) Ave. term to maturityc
5,37231,4054,835DataDollars out., annual ave. (thousands)d10,88090,94218,391DataDollars disbursed in year (thousands)e
5.94.13.212*(d/e) Ave. term to maturityf
2. Dollars disbursed681658494e/bAve. dollars disbursedg
900900900DataPer-capita annual GNPh0.760.730.55g/h Ave. dollars disbursed/Per-capita annual GNPi
1.51.71.6(g/h)*(12/c)Loan inflow/Income inflow in loan termj
3. Average balance6,17738,7127,089DataDollars out. at year-end (thousands)k
116316DataNumber of loans out. at year-end (thousands)l562614440k/l Average balance at year-endm
656516388d/aAverage balance during yearn
0.730.570.43n/hAverage balance during year/Per-capita annual GNPo
2.82.62.6[n*(12/c)]/(h/2)$-years from loan/$-years from incomep
4. Time between installments30.52814DataTypical installment frequency (days)q231913DataAverage installment frequency (days)r
5. Number of installments8.28.69.6c*(365/12)/rAverage number of installmentss
6. Dollars per installment837752g/sAverage dollars per installmentt
7. Dollar-years of resources from a loan337227130d/bAverage dollar-years of resources from a loanu
Note: Monetary figures in units of constant December 1998

26
Figure 1: Seven aspects of loan size
$
Time
Dollar-months of resources from a loan
Term to maturity
Time between installments
Dollars per installment
Dollars disbursed Ave. balance
Number of installments

27
0
100
200
300
400
500
600
700
0 30 60 90 120 150 180 210 240
Lender A
Lender C
Time
$
Figure 2: Loan size for lenders A and C