Embed Size (px)
Citation preview
For more information on this profile please contact: [email protected]
www.reachresourcecentre.info 1
Due to its proximity to three major humanitarian emergencies in South Sudan, Burundi, and the Democratic Republic of Congo (DRC), its progressive refugee hosting and settlement policies, and the ease of border crossings, Uganda has received a large number of refugees over the past 3 years.
With over 1 million refugees in Uganda1, humanitarian needs across the country are significant with little capacity for actors to clearly map the landscape of needs across refugee and host communities alike. UNHCR, with support from REACH, conducted a Multi-Sector Needs Assessment with the aim to address this information gap by providing evidence-based analysis to inform the Refugee Response Plan (RRP) for 2019-2020.
A total of 4,313 refugee household (HH) level surveys were conducted across all 30 refugee settlements. Households were randomly sampled with a confidence level of 95% and 10% margin of error and findings are generalisable at the settlement level.
109 HHs were interviewed in Kyaka II Settlement between 5 June and 19 June 2018.
Background & Methodology
Multi-Sector Needs Assessment: Kyaka II SettlementSettlement Factsheet, Kyegegwa District, Uganda, August 2018
Demographics% of assessed HHs by area of origin:
96% DRC 3% Rwanda 1% Burundi
% of HHs that have lived in the settlement for:
% of individuals by age group: Girls (0-17) 31% Boys (0-17) 32% Adult females (18-59) 17% Adult males (18-59) 16% Elderly females (60+) 3% Elderly males (60+) 1%
Average HH size:2 4.9 members
Gender distribution of the head of the HHs:
48% Female 52% Male
Top 3 sectors with most reported HH needs:3
Food Health and nutrition Livelihoods
96+3+1+A31+32+17+16+3+1
83+39+3848+52+A10049 3 6
49% 6%
3% 42%
<6 months 7 - 11 months
1 - 2 years > 2 years
96% of HHs reported being registered in the settlement.4
% of HHs with at least one vulnerable member: 18% Unaccompanied or separated children 23% Individuals with chronic illnesses 22% Individuals with disabilities 41% Pregnant and/or lactating women
% of HHs reporting at least one member with psychological distress:
21% Yes 79% No
83% of the HHs with at least one member with psychological distress were unable to receive psychological care.
% of HHs with at least one unaccompanied or separate child that reported still needing targeted protection services:
90% Yes 10% No
% of HHs that reported being reached by protection awareness campaigns on:
SGBV 23% Child protection 15% Psycho-social 13%
66% of HHs with at least one woman or girl of reproductive age reported at least one female member could not access sanitary pads.
21+79+A
90+10+A
Protection
23+15+1383%39%38%
C
C Assessed settlement
Assessed district
District boundary
1) OPM RIMS statistics, June 2018, Uganda Comprehensive Refugee Response Portal. 2) The MSNA found the average size of refugee and host community HHs to be larger than previous assessments conducted in Uganda. HH was defined as a group of members who regularly share resources, such as water, food, and living space.3) Respondents could select multiple options.4) Refugees are registered in settlements by Uganda’s Office of the Prime Minister (OPM).Note: For questions asked only to a subset of households, a lower confidence level and a wider margin of error may apply.
2 2
For more information on this profile please contact: [email protected]
www.reachresourcecentre.info 2
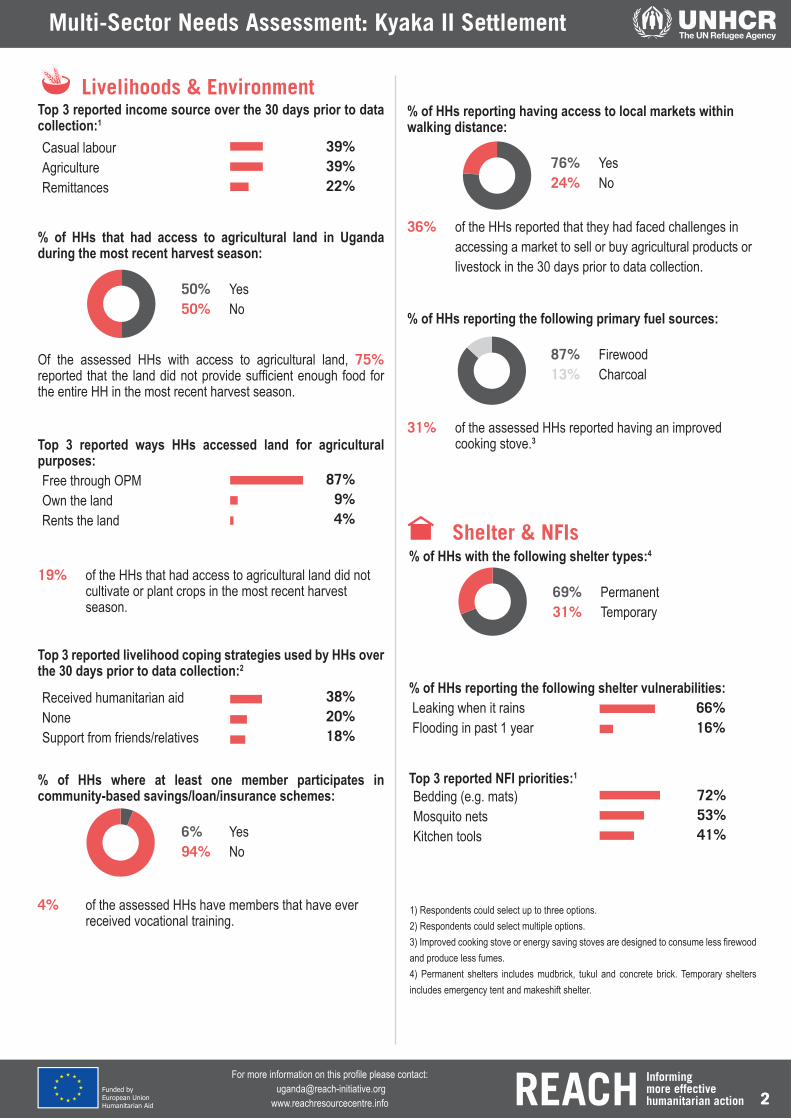
% of HHs reporting having access to local markets within walking distance: 76% Yes 24% No
36% of the HHs reported that they had faced challenges in accessing a market to sell or buy agricultural products or livestock in the 30 days prior to data collection.
% of HHs reporting the following primary fuel sources:
87% Firewood 13% Charcoal
31% of the assessed HHs reported having an improved cooking stove.3
Multi-Sector Needs Assessment: Kyaka II Settlement
Top 3 reported income source over the 30 days prior to data collection:1
% of HHs that had access to agricultural land in Uganda during the most recent harvest season: 50% Yes 50% No
Of the assessed HHs with access to agricultural land, 75% reported that the land did not provide sufficient enough food for the entire HH in the most recent harvest season.
Top 3 reported ways HHs accessed land for agricultural purposes:
19% of the HHs that had access to agricultural land did not cultivate or plant crops in the most recent harvest season.
Top 3 reported livelihood coping strategies used by HHs over the 30 days prior to data collection:2
% of HHs where at least one member participates in community-based savings/loan/insurance schemes:
6% Yes 94% No
4% of the assessed HHs have members that have ever received vocational training.
39+39+2287+9+4
38+20+18
Livelihoods & Environment
50+50+A87+13+A
6+94+A
76+24+A
% of HHs with the following shelter types:4
69% Permanent 31% Temporary
% of HHs reporting the following shelter vulnerabilities: Leaking when it rains 66% Flooding in past 1 year 16%
Top 3 reported NFI priorities:1 72+53+4166+16
Shelter & NFIs
69+31+A
1) Respondents could select up to three options.2) Respondents could select multiple options.3) Improved cooking stove or energy saving stoves are designed to consume less firewood and produce less fumes.4) Permanent shelters includes mudbrick, tukul and concrete brick. Temporary shelters includes emergency tent and makeshift shelter.
39%39%22%
87%9%4%
38%20%18%
72%53%41%
Casual labourAgricultureRemittances
Free through OPMOwn the landRents the land
Received humanitarian aidNoneSupport from friends/relatives
Bedding (e.g. mats)Mosquito netsKitchen tools

2
For more information on this profile please contact: [email protected]
www.reachresourcecentre.info2 3
Top 3 reported sources of drinking water:
% of HHs, by litres of water/person/day:
34% > 15 litres 35% 10 -15 litres 31% < 10 litres
Average litre of water/person/day: 14 litres
% of HHs reporting not having enough water to cover the basic HH needs during the 7 days prior to data collection:4
83% Enough 17% Not enough
Top 3 reported strategies for coping with insufficient quantity of water during the 7 days prior to data collection:5
% of HHs reporting challenges to collecting water: Distance Queuing Queuing and distance None
44% of the HHs do not have a access to a functioning HH latrine. 42% of the HHs did not have soap in the HH during data collection.
Top 3 reported reasons for HHs not to have soap in the HH:6
Multi-Sector Needs Assessment: Kyaka II Settlement
47+32+1126+17+17+39
61+17+11Top 3 reported health issues among HH members during the 2 weeks prior to data collection:1
Of the HHs that reported having a member with health issues in the past year, 53% reported facing challenges when they sought treatment.
Top 3 reported challenges in accessing health care:
Of the HHs with children:2
78% reported they had been vaccinated against polio. 43% reported that they had been vaccinated against measles.
% of HHs reporting owning mosquito nets: 28% Yes 72% No
Average number of HH members sleeping under nets: 0.9
% of HHs with pregnant and/or lactating women that had received the following services: Counselling on infant and young child feeding 56% Iron and folic acid supplements or micro- nutrient supplements 62% At least 2 doses of fansidar3 62%
Health & Nutrition46+19+1928+28+24
28+72+A83+17+A
34+35+31+A
Water, Sanitation & Hygiene59+15+10
1) Respondents could select multiple options.2) Polio vaccination is given to children between 0-5 years old. Measles vaccination is given to children aged 15 or younger .3) Fansidar is a prescription medication used to prevent and treat malaria. It can be used for pregnant women as the risks to the mother and fetus is small in relation to the benefits of the drug.4) Basic HH needs include having enough water for drinking, cooking, bathing, etc.5) The question was asked to HHs that reported to have inadequate water over the seven days prior to data collection.6) The question was only asked for HHs that reported not having access to soap.
46%19%19%
28%28%24%
59%15%10%
47%32%11%
26%17%17%39%
61%17%11%
No medicine availableUnqualified staffLack of transport
MalariaDiarrhoeaDiarrhoea
BoreholeProtected rainwater tankPublic tap
Fetch from further pointUse less water for bathingUse less water for drinking
Soap is too expensiveWaiting for next distributionSoap isn’t necessary
Multi-Sector Needs Assessment: Kyaka II Settlement

4
For more information on this profile please contact: [email protected]
www.reachresourcecentre.info 4
Multi-Sector Needs Assessment: Kyaka II Settlement
Top 3 reported primary source of food during the 7 days prior to data collection:1
HHs that had been living in the settlement for less than one year relied more on humanitarian aid (71%) than HHs that had lived there from one year or more (4%).
% of HHs with the following Food Consumption Scores (FCS):2
68% Acceptable 23% Borderline 9% Poor
HH average Food Consumption Score: 39
% of HHs FCS by time spent in the settlement:
<6 months 7 - 11 months 1 - 2 years >2 years
Acceptable 60% 67% 71% 76%Borderline 32% 0% 29% 13%Poor 8% 33% 0% 11%
% of HHs who reported having access to sufficient food for all members over the 7 days prior to data collection: 28% Yes 72% No
% of HHs reported using food coping strategies during the 7 days prior to the data collection: Reduce number of meals / day Limit meal size Buy cheaper food Debt/Borrowing Skip days of eating Only children eat Exchanged food for different food None
39+37+1527+43+35+6+11+7+4+7
Food Assistance
68+23+9+A
28+72+A
1) Respondents could select multiple options.2) The FCS is used as proxy for HH food security and is a composite score based on 1) Dietary diversity 2) Food frequency and 3) Relative nutritional importance of the various food groups consumed by HHs. The FCS is recorded from a 7-day recall and is based on 9 weighted food groups. The FCS is used to classify households into three groups: poor, borderline or acceptable food consumption. In the Ugandan context the thresholds used are as follows: ≥ 31 – Acceptable; 28 - 30 – Borderline; ≤ 27 - Poor.3) Other types of education include acelerated learning program, non-formal skills training, and vocational training.
39%37%15%
27%43%35%6%
11%7%4%7%
Food distributionBought with cashOwn production
60% of households with school-aged children have at least one child not enrolled in school
% of HHs with at least one child not enrolled in school, by age and gender:
Boys Age Girls
62% 3 - 5 57%28% 6 - 12 41%48% 13 - 18 50%
% of HHs with at least one school aged children enrolled in school, by school type: Boys Girls ECD 8% 10% Primary 45% 40% Secondary 4% 2% Other3 1% 1% Not enrolled 41% 45%
Of the households with school aged children not attending school, 15% reported their children had been enrolled before displacement but had dropped out at the time of the assessment.
Top 3 reported barriers to education for HHs with at least one school-aged child not enrolled in school:1
Of those HHs that reported cost as a barrier to education, the following were reported as the most common costs:
57+41+5062+28+48Education
8+45+4+1+14110+40+2+1+45
51+16+16+ 51%16%16%
123
High costsDistanceJust arrived in this area
TuitionBooksUniform