Embed Size (px)
Citation preview

7Setting Monetary Policy in East Asia: Goals, Developments and Institutions
Setting Monetary Policy in East Asia: Goals,Developments and Institutions
Robert N McCauley1
1. IntroductionThe Asian crisis represented a watershed in monetary policy-making in east Asia.
Suddenly gone, in many cases, was the guiding principle of stability of the currencyagainst the US dollar. Suddenly gone, in some cases, was the senior management ofthe central bank itself. New goals, and new means to achieve them, were needed. Ina number of Asian central banks, new leaders faced the challenge of setting newgoals.
Four years after the onset of the crisis it is possible to characterise the objectivesthat have been embraced and the institutions that have developed to elaborate andattain these objectives. What follows, therefore, reviews the broad menu of objectivesconsidered, and poses the question of whether a predominant emphasis on pricestability can be reconciled with attention to asset prices or exchange rates. Thenfollows a sketch of the various choices made by the monetary authorities and howthese are related to structural differences across economies. The institutions ofmonetary policy-making have evolved, but not always in smooth parallel. Section 2discusses five appropriate objectives of monetary policy. Section 3 sketches thechange in objectives since the crisis. Section 4 focuses on institutional developments.Section 5 briefly summarises the key points.
2. The Appropriate Objectives of Monetary PolicyMonetary authorities bear the responsibility for achieving certain objectives.
Macroeconomic goals can include long-term growth or employment. Increasinglyin recent years, central bank goals have, either in practice or law, focused on ‘pricestability’, in some cases even going as far as setting numerical inflation targets to beattained over specific time horizons. Other objectives also assumed by central banksin east Asia are assuring financial stability, exchange-rate stability, somehowdefined, and attempting to maintain positive real interest rates for depositors. Acentral bank may also embrace the principle of freedom for international capitalflows, although this principle may constrain the bank in achieving its otherobjectives. I now focus on each of these in turn and look at, in increasing depth inthe next two sections, how they have fared in east Asia.
1. The author has benefited from discussions with Palle Andersen, Claudio Borio, Ben Fung, StefanGerlach, David Gruen, George Pickering, Amando Tetangco and Shinichi Yoshikuni and from theassistance of Angelika Donaubauer and Les Skoczylas but responsibility for any errors or badjudgement remains his own. The views expressed are those of the author and not necessarily thoseof the Bank for International Settlements.
8 Robert N McCauley
2.1 Goals
2.1.1 Price stability
Price stability, defined qualitatively or operationalised as a range for the inflationrate, has gained wide acceptance as an appropriate goal of monetary policy. Explicitinflation targeting, which can be defined as including a publicy announced, specificrange of acceptable inflation rates, a horizon for achieving this target range andregular reporting, has been characterised as constrained discretion. It has the greatadvantage, in my view, of framing the public discussion of monetary policy in termsof an outcome that the public demonstrably cares about and can understand. Itpermits the use of an intermediate target, if a sensible one is available, but frames adiscussion of ignoring it (or even abandoning it), if necessary.
Guy Debelle’s following contribution to this conference makes ‘The Case forInflation Targeting in East Asia’ (this volume). Amato, Gerlach and Hawkins (2001)have recently surveyed institutional arrangements and challenges faced by emergingmarket and transition economies, including Korea and Thailand.
Relieved of the need for balance, let me echo below some reservations that mycolleagues at the Bank for International Settlements have lodged regarding anexclusive focus on inflation and neglect of asset prices. Bill White, present at thecreation of inflation targeting at the Bank of Canada, has joined the questioning, sono innate hostility to inflation targeting is involved.
2.1.2 Financial stability
Financial stability is an objective of monetary policy as well. Indeed, this was thefirst rationale for, and goal of, the Federal Reserve. Its leaders even denied that itshould be held responsible for price fluctuations well into the 1920s. While this viewnow seems quaint, some proponents of inflation targeting focus as single-mindedlyon price stability and, implicitly or explicitly, hold that it is a necessary and sufficientcondition for financial stability.
Price stability, however, does not appear to be a sufficient condition for financialstability. In particular, asset price inflation and associated excessive credit growthcan occur against the backdrop of stable prices. The risk of asset price inflation andexcessive credit growth, indeed, might even be heightened by falling or lowinflation. Conversely, the effect of asset inflation and excessive credit growth maybe to reduce inflation, including via exchange rate appreciation associated withcapital inflows.
To some observers, the solution is that the central bank must have the discretionto depart from the inflation-targeting framework itself, responding to threats tofinancial stability in a manner that cannot be readily explained in terms of meetingthe inflation target.2 Others argue that an apparent departure from actions required
2. Kindleberger (1995).
9Setting Monetary Policy in East Asia: Goals, Developments and Institutions
by inflation stabilisation – in particular, a tightening in the face of asset price inflation– can be justified in terms of avoiding the deflationary consequences of a latercollapse.3 Others suggest using the full scope of a tolerable inflation range, by, forexample, aiming at price increases in the lower end of the target corridor in the faceof asset price inflation and associated rapid credit growth.4 Others adopt a Tinbergianposition, and argue for policies other than interest rate movements to address theproblem of credit cycles: disclosure of credit exposures to inflated asset prices;higher capital requirements for particular assets or across the board during asset priceinflation; variable loan-to-value ratios; and other policies.5
2.1.3 Exchange-rate stability
Usually portrayed as an alternative to inflation targeting is stabilisation of theexchange rate (real or nominal). This can be argued for on the grounds of an optimalcurrency area, the criteria for which, by construction, ensure that the importedinterest rate policy is appropriate for the economy adopting the fixed exchange rate.The policy of fixing the exchange rate can alternatively be thought of as adopting amonetary standard that has long-term predictability even if the associated interestrates are often cyclically inappropriate. One appeal is that this policy is simple toexecute and does not require a deep understanding of the linkages between interestrates, inflation and growth.
In practice, the contrast usually drawn between assigning the monetary authorityto achieving price stability and managing the exchange rate is harder to sustain as theeconomy under consideration is more open. The more open an economy, the greaterwill be the effect of the exchange rate relative to the interest rate in setting monetaryconditions. At the extreme of hyper-openness, the monetary authority may wellchoose to devote monetary policy first and foremost to some rate or path for theexchange rate, as a means of achieving price stability.
2.1.4 Capital account openness
Capital account openness is a policy choice that may be adopted for various otherreasons but that then puts a constraint on monetary policy. In particular, accordingto the so-called ‘impossible trinity’ view, an economy can only have two of thefollowing: independent monetary policy, a fixed exchange rate and capital accountopenness.
Yi Gang and Tang Xian (2001) have argued a variant of this view. They hold thatthe impossible trinity is better viewed as a constrained sum in which fractions arepossible. That is, an independent monetary policy (1) might be combined withsemi-fixity of the exchange rate (1/2) and a halfway open capital account (1/2).
3. Kent and Lowe (1997).
4. Crockett (2001, p 17).
5. BIS (2001, pp 123–141); Borio, Furfine and Lowe (2001); McCauley, Ruud and Iacono (1999,pp 289–326).
10 Robert N McCauley
Whether one agrees with this characterisation or not, one must agree that capitalaccount openness should not be viewed as an all-or-nothing proposition. TheMundell-Flemming model, after all, conceived of capital flows as largelymoney-market flows, or at most money-market and bond-market flows.
An important development in the world economy in the late 1990s was the shiftof international capital flows from the fixed income market, both money and bondflows, to the equity market, including both portfolio equity flows and directinvestment. Equity-dominated capital flows can overturn standard Mundell-Flemmingresults. That is, a decline in policy interest rates can raise expected corporateearnings, possibly in conjunction with a decline in the longer-term interest ratespresumably used as the basis for discounting those earnings. This can lead equityprices to rise and attract foreign investors with extrapolative expectations to buymore equities. These equity inflows, under the hypothesis of equity domination ofcapital flows, can overwhelm the money-market effects of lower interest rates on thecurrency and lead to a rise in the currency. Attempts to explain the US dollar’sstrength in the first half of 2001 along these lines run up against the shift from equityto bond inflows into the US during this period. The yen’s strength after theMarch 2001 change in policy, and episodes of the US dollar/won exchange rate,however, can be more plausibly read in this manner.
The increased importance of equity flows has increased the effective scope of acapital account policy of semi-openness. In particular, in this era a capital accountcan be open to equity flows, both portfolio and direct investment, but closed tomoney and bond flows, or only some kind of money flows. Such a policy allows theinternational redistribution of risk through trade in the most risky assets, whilelimiting international influence on the money market.
2.1.5 Positive real interest rate on deposits?
In parts of east Asia, it appears that monetary policy is constrained by a perceivedneed to maintain positive real interest rates on household deposits. During boomyears, of course, this constraint did not bind. Since the crisis, however, as economieshave flown into the ‘headwinds’ of corporate and bank balance sheet restructuring,this consideration may have kept interest rates higher than they might have beenotherwise. The view that real deposit yields must at all times over the business cyclebe positive may derive from the arguments against financial repression of ageneration ago. But these arguments targeted the chronic, not episodic, maintenanceof negative real interest rates.
The application of a secular argument to each point in a cycle may be questioned.Elsewhere, in the face of fairly mild headwinds, at least by the recent standards ofeast Asia, the Federal Reserve pushed interbank rates down to zero in real terms. Thisimplied significantly negative real deposit rates for all but the largest deposits.Structural differences, however, may allow the Federal Reserve to more easily adoptsuch a policy than its counterparts in east Asia. For one, bank deposits are a muchsmaller share of household deposits in the United States, and the institutions of
11Setting Monetary Policy in East Asia: Goals, Developments and Institutions
collective investment in stocks and bonds are much more developed. For another, theUnited States is a net debtor to the rest of the world in short-term dollar instruments,so the net income effect of lower short-term interest rates is positive.
2.2 Goals and instrumentsTinbergen’s genius was to win a Nobel Prize for the insight that you can’t hit two
birds with one stone. The question arises whether to seek only price stability orexchange-rate stability, however defined, or whether to try to seek to achieve somemeasure of another goal, given the primary emphasis. There are two approaches tothis question.
One approach is to attempt to use the range of targeted outcomes to accommodateother goals. This was mentioned above in the context of attention to asset priceinflation in an inflation-targeting regime. A similar, within the margins, attention tothe exchange rate might be paid in the same regime. (Similarly, there might be roomwithin an exchange-rate targeting regime for interest-rate stabilisation or even somelimited interest rate policy.)
Another approach is to look for another instrument. Again, this was mentionedabove in the context of assigning prudential measures a role in limiting the potentialdamage of asset price inflation. Another instrument, or following Dooley, a quarterof an instrument,6 is the currency composition of the government’s (or the centralbank’s) balance sheet. If monetary policy is assigned to stabilising prices, changesin the balance of domestic and foreign currency assets or liabilities on the officialbalance sheet can be used to affect the exchange rate in some fashion. Changes in thecomposition could include not only sterilised intervention but also changes in debtmanagement.
Another instrument available in some economies is variation in employercontributions to a mandatory provident fund. A cut in the employer’s contributionlowers the cost of labour in domestic and foreign currency. The Singaporeanauthorities used this incomes-policy instrument in the mid 1980s and during theAsian crisis (MAS 2001a) to lower the real exchange rate as measured by relativeunit labour costs without requiring a depreciation of the nominal exchange rate. Thisthen allows the nominal exchange rate to be assigned to price stability (see below).Mandatory provident funds in Malaysia and, more recently, in Hong Kong might besimilarly used (although the recent proposal in Malaysia to cut the employeecontribution is more akin to fiscal policy).
3. Recent Choice of Objectives in East AsiaThis section analyses the choices of objectives for monetary policy in east Asia
since the crisis. Broadly, the goal of monetary policy in the region has movedtowards price stability. The exception, of course, is Malaysia, which has, for the timebeing, joined Hong Kong SAR (Special Administrative Region) in embracing a
6. In his presentation in Seoul (Dooley, Dornbusch and Park 2001).
12 Robert N McCauley
fixed exchange rate against the US dollar. The Chinese authorities took a smaller stepin the same direction by reducing the already very limited volatility of the renminbiagainst the US dollar in the course of the crisis, a policy that has since been reversedonly partially.
3.1 Price stabilityAt writing there are six or seven central banks in east Asia that have set for
themselves the objective of price stability. In addition, two central banks seek to usethe control over interest rates afforded by capital controls to stabilise prices in thecontext of a fixed exchange rate. The following paragraphs consider central banksgenerally oriented toward price stability; explicit inflation targeters, or central banksmoving in that direction; and fixed exchange rate countries with a large measure offreedom in setting interest rates.7
Among the central banks with a general orientation to price stability one canargue, and indeed the Monetary Authority of Singapore (MAS 2001a, p 15;Khor 2000, p 110) has argued, that it has long aimed at price stability, albeit without,until recently, publicly articulating their strategy. In March 2001, theBank of Japan adopted the goal of an end to deflation and promised to maintain largeexcess reserves in the banking system until such time as deflation ended. Themonetary authority of Taiwan, China8 sets an M2 target ‘to allow the economy tomake full use of its production capacity without jeopardising price stability’(CBC 2000, p 35), where the latter apparently means a core inflation rate of1 per cent.9
Explicit inflation targeting is relatively new in east Asia. The Bank of Koreaintroduced explicit inflation targeting in the context of the reforms adopted with thesupport of the IMF in 1998. The Bank of Thailand published its first quarterlyInflation Report in July 2000. Indonesia set its second annual inflation target inJanuary of 2001. The Philippines is in the process of adopting inflation targeting.
Capital controls allow for independent setting of interest rates in China andMalaysia. The authorities in China expressed their concern at the deflation thatresulted from maintaining China’s exchange rate during the Asian crisis as theylowered 1-year deposit rates to 2.25 per cent in 1999. In Malaysia, ‘the basic thrustof monetary policy was…to support economic recovery and facilitate structuralreforms, while preserving price stability’ (Bank Negara Malaysia 2000, p 85) andinterest rates were brought down to 3 per cent. In 2000, ‘interest rates remained lowbut were judiciously managed to balance the need to suppoert economic growth,
7. Schaechter, Stone and Zelmer (2000), published in December 2000, does not focus on any inflationtargeters in east Asia.
8. Henceforward ‘the CBC’ of ‘Taiwan’.
9. Core inflation is defined as consumer prices excluding fresh fruits and vegetables, fish and shellfishand energy (CBC 2000, p 21).
13Setting Monetary Policy in East Asia: Goals, Developments and Institutions
preserve price stability and sustain the nation's level of savings’ (Bank NegaraMalaysia 2001, p 85).
3.1.1 Singapore: price stability and the exchange rate
Above, Singapore was included among central banks aiming at price stability, butconventional classification would leave Singapore out of this group and insteadplace it among the economies pursuing a stable exchange rate. On this view, the basicstrategy of monetary policy in east Asia would line up rather neatly along the linesof economic openness. The relatively closed economies, with export to GDP ratiosranging from 10 per cent in Japan up to 50–60 per cent in the Philippines or Thailandfocus on price stability, while the very open economies of Malaysia, Hong Kong andSingapore focus on the exchange rate. On this view the outlier is China, which byregional standards is not so open. There, however, discussion of more flexibleinterest rates and exchange rates in the lead-up to WTO admission may suggest amonetary policy regime in transition. Of course, China and Malaysia employ capitalcontrols to allow a combination of fixed exchange rate and domestic interest ratesetting.
At the level of strategy, however, Singapore belongs among those central banksaiming for price stability. One can model a Taylor rule for Singapore in which thenominal effective exchange rate moves in response to deviations of inflation awayfrom its target and of output from its trend. Box A reports two empirical efforts alongthese lines. That foreign exchange market economists in Singapore (rather than, say,a policy economist in Hong Kong) have estimated these Taylor rules means that theSingaporean authorities have succeeded in communicating their strategy to marketparticipants. Thus, the exchange rate is a policy variable analogous to the short-terminterest rate elsewhere. If one insists that the monetary strategy in Singapore isexchange-rate stabilisation, then one has to argue that the monetary strategy of theUnited States is interest-rate stabilisation. Singapore poses a challenge to theconcept of ‘an international system of hard pegs and relatively free floats’, in whichthe central banks with freely floating currencies target inflation; it has not joined ‘theobserved movement away from intermediate arrangements’ (Eichengreen 2001,p 17).

14 Robert N McCauley
Box A: A Taylor Rule for Singapore with the NominalEffective Exchange Rate as Operating Target
At least two sets of market analysts conceive of the Monetary Authority ofSingapore following a Taylor Rule, but of a form quite different from the originalformulation. The standard Taylor rule relates the policy interest rate, the overnighttarget for the federal funds rate, to deviations of expected inflation from targetinflation and deviation of output from trend output. In this variant on the Taylorrule, however, the MAS operating target is the change in the nominal effectiveexchange rate (NEER)1, not the short-term policy interest rate.
In particular, Simon Flint of Bank of America’s Currency Strategy Groupargued in 1999 that ‘Singapore uses its FX rate as the US Federal Reserve usesthe Fed Funds Rate’.2 Similarly, Bhanu Baweja and Paul Schymyck at IDEAglobalEconomic Research in Singapore find the MAS ‘set the NEER in period t as afunction of the expected deviation of inflation and the output gap from their targetlevels’.3
Flint estimates the following equation on quarterly data:
NEER NEER a b I c Y Yt t t t t− = + [ ] + −( )[ ]− − −1 1 1* (1)
where NEER is the nominal effective exchange rate, It is core inflation, Yt is realquarterly GDP and Y* is potential output, estimated as growing at 7.8 per centpre-crisis and 5–5.5 per cent post-crisis.
Baweja and Schymyck estimate the following equation on quarterly data:
NEER NEER a b I I c Y Yt t t t t− = + −( )[ ] + −( )[ ]− − + +1 1 1 1* * (2)
Where It is taken to be the core rate of inflation on the MAS definition, I* istaken at the long-term average rate of inflation of 1.5 per cent and Yt+1 is realisedGDP in the following period and Y*t+1 is computed using the Hodrick-Prescottfilter.
Parameter estimates and regression statistics are shown in Table A1.
1. Note that in order for Singapore to have a lower inflation rate than its trading partners, the NEERhas shown a trend appreciation. This requires the left hand side variable to be expressed as somesort of change variable. With the NEER indexed at 100 at some point, longer estimation periodswould probably benefit from the variable being defined as a percentage change in the index ratherthan an absolute change.
2. Flint (1999, p 1).
3. Baweja and Schymyck (2001).

15Setting Monetary Policy in East Asia: Goals, Developments and Institutions
Table A1: Two Estimates of a Taylor Rule for Singapore’sNominal Effective Exchange Rate
Constant Inflation Output Adjusted Standard F-statistic Durbin- Numbergap R2 error Watson of
statistic observations
Flint 0.0041 0.79 0.11 0.32 0.012 8.6 36
(1.5) (3.5) (2.0)
Baweja and 0.65 0.44 0.24 0.31 1.2 9.6 2.2 45Schymyck (3.3) (3.3) (2.4)
Notes: Flint estimates refer to the period 1990–99; Baweja and Schymyck refer to 1985–96.Figures in parentheses are t-statistics.
Sources: Baweja and Schymyck (2001); Flint (1999); author’s personal communication withsame
The two analyses agree qualitatively that point estimates of the parameter oninflation are larger than those for the output gap but the authors’ interpretationsof this finding vary in an interesting manner. Baweja and Schymyck follow thestandard approach by suggesting that ‘The estimates…indicate a stronger policyresponse to inflation deviations as compared with output gap deviations’. Inparticular, the authors note, if inflation is 1 per cent over target, a 0.44 per centappreciation in the NEER is engineered. For the output gap, a 1 per cent excessof output over potential would lead to an appreciation of the NEER by0.24 per cent. By contrast, Flint holds that ‘It would be wrong to conclude fromthe coefficients above that I was far more influential than Y. It is chiefly that Y hasbeen far more volatile than I (with a standard deviation of 3.6% versus 0.9%)’. Inother words, it may be more interesting to ask whether the central bank moves itspolicy variable more or less for a one standard deviation overshoot of inflation orgrowth, rather than a 1 per cent overshoot. In industrial countries, inflation andgrowth vary more similarly over the cycle, so this issue does not arise with thesame force.
16 Robert N McCauley
3.1.2 The choice between a general orientation to price stabilityand explicit inflation targeting
Why have some economies chosen explicitly to target inflation while others havenot? Gerlach (1999) examined data on 22 OECD countries and found that a previouslack of independence of the central bank, heavy dependence on commodity exportsand a relatively closed economy all favoured the adoption of explicit inflationtargeting. For central banks that previously did not enjoy independence, explicitinflation targeting was interpreted as a sort of substitute: a government gives a clearmandate and allows the central bank to choose the means of achieving it. Ineconomies dependent on commodity exports, wide swings in the terms of traderender an exchange-rate goal hard to attain and thereby make a regime of inflationtargeting more attractive. In highly open economies, central banks are less temptedto ease to give a temporary boost to the economy because any consequent exchangerate depreciation would strongly affect domestic prices. Thus, with openness itselfdisciplining monetary policy, there is less advantage to targeting inflation.10
In the light of these findings for most of the OECD, any historical lack of centralbank independence in east Asia would seem to argue for the broad advantage ofexplicit inflation targeting (see below). With regard to export composition, however,only Indonesia remains heavily dependent on commodity exports in east Asia today.The openness of a number of east Asian economies would make their adoption ofexplicit inflation targeting unusual in light of the experience in most of the OECD.Sweden, with a ratio of exports to GDP of 32 per cent, was the most open economyamong explicit inflation targeters in Gerlach’s sample, although Iceland and Norwayat 35 per cent and 39 per cent, respectively, have since adopted this policy.11 Theadoption of explicit inflation targeting by the relatively closed economies, at least ona regional comparison, of Korea and Thailand accords with the choices of most ofthe OECD, although Thailand is more open than any industrial country that hasadopted explicit inflation targeting.
One can ask the converse of Gerlach’s question: why do some central banks thatembrace price stability as a goal abstain from explicit inflation targeting?Baltensperger, Fischer and Jordan (2001) argue that central banks that enjoyconsiderable latitude to set or to define their goal (said to enjoy ‘goal independence’)are likely to eschew inflation targeting. Such central banks, the argument goes, arelikely to view inflation targeting as a restriction on their ability to act flexibly topromote preferred economic outcomes and so not only the Swiss National Bank but
10. Note that Gerlach’s paper, owing to data limitations, confined itself to the choice of explicit inflationtargeting versus all other choices. Thus, dependence on commodity exports and a relatively closedeconomy may argue for a domestic price stability goal in general, rather than explicit inflationtargeting per se.
11. Gerlach’s analysis had to exclude these two countries to obtain sensible results. Given theirdependence on commodity exports, Gerlach suggested that perhaps they would do better to adoptexplicit inflation targeting, which they subsequently did.
17Setting Monetary Policy in East Asia: Goals, Developments and Institutions
Table 1: High-tech Exports of Asian Economies
PercentageShare of economy’s total exports change in
to OECD countries US imports
Per cent during year to:
CN HK ID KR MY PH SG TH TW Jun Feb2000 2001
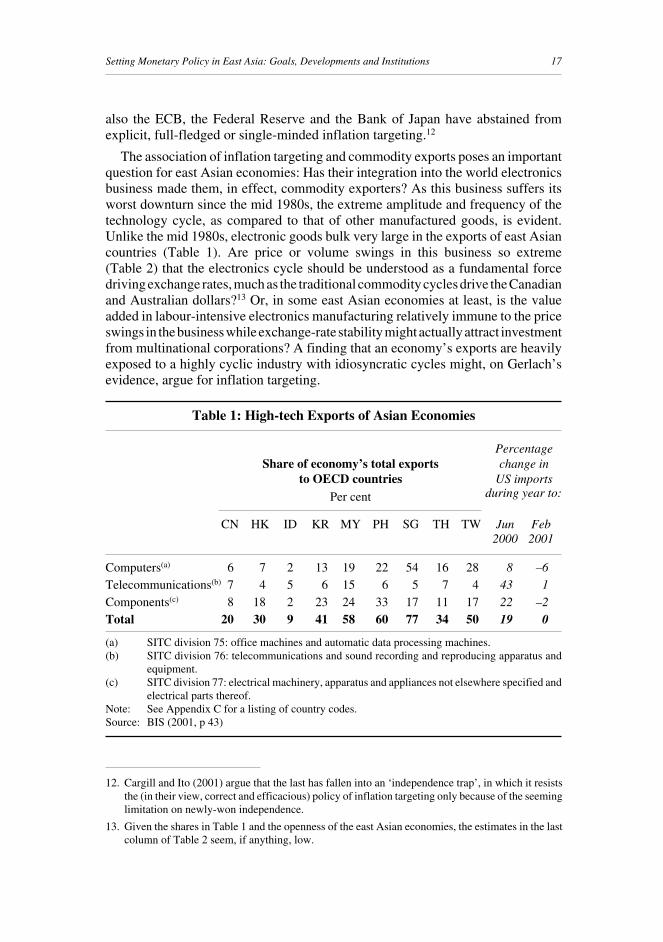
Computers(a) 6 7 2 13 19 22 54 16 28 8 –6Telecommunications(b) 7 4 5 6 15 6 5 7 4 43 1Components(c) 8 18 2 23 24 33 17 11 17 22 –2Total 20 30 9 41 58 60 77 34 50 19 0
(a) SITC division 75: office machines and automatic data processing machines.(b) SITC division 76: telecommunications and sound recording and reproducing apparatus and
equipment.(c) SITC division 77: electrical machinery, apparatus and appliances not elsewhere specified and
electrical parts thereof.Note: See Appendix C for a listing of country codes.Source: BIS (2001, p 43)
also the ECB, the Federal Reserve and the Bank of Japan have abstained fromexplicit, full-fledged or single-minded inflation targeting.12
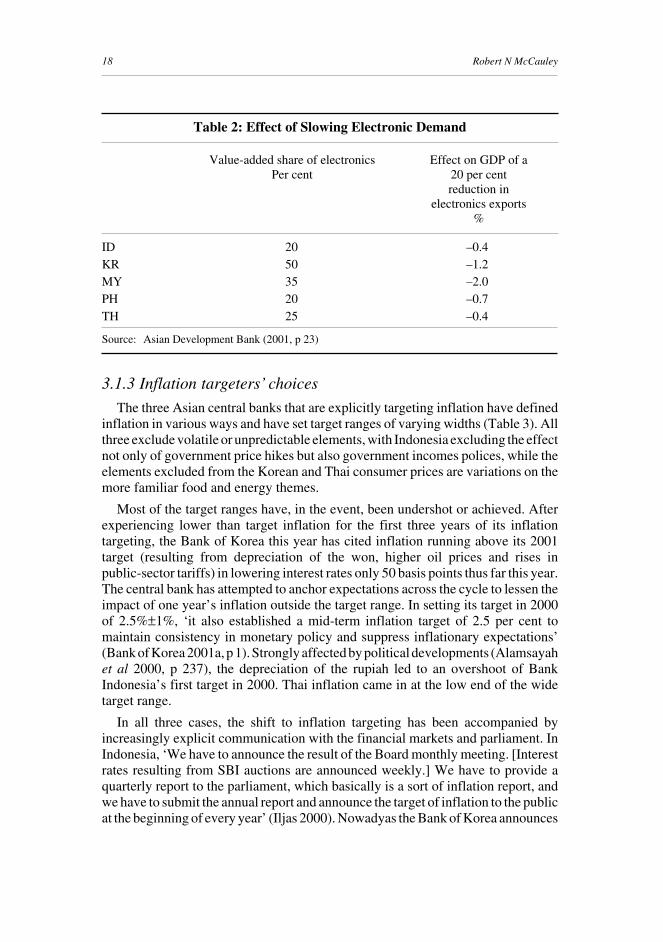
The association of inflation targeting and commodity exports poses an importantquestion for east Asian economies: Has their integration into the world electronicsbusiness made them, in effect, commodity exporters? As this business suffers itsworst downturn since the mid 1980s, the extreme amplitude and frequency of thetechnology cycle, as compared to that of other manufactured goods, is evident.Unlike the mid 1980s, electronic goods bulk very large in the exports of east Asiancountries (Table 1). Are price or volume swings in this business so extreme(Table 2) that the electronics cycle should be understood as a fundamental forcedriving exchange rates, much as the traditional commodity cycles drive the Canadianand Australian dollars?13 Or, in some east Asian economies at least, is the valueadded in labour-intensive electronics manufacturing relatively immune to the priceswings in the business while exchange-rate stability might actually attract investmentfrom multinational corporations? A finding that an economy’s exports are heavilyexposed to a highly cyclic industry with idiosyncratic cycles might, on Gerlach’sevidence, argue for inflation targeting.
12. Cargill and Ito (2001) argue that the last has fallen into an ‘independence trap’, in which it resiststhe (in their view, correct and efficacious) policy of inflation targeting only because of the seeminglimitation on newly-won independence.
13. Given the shares in Table 1 and the openness of the east Asian economies, the estimates in the lastcolumn of Table 2 seem, if anything, low.
18 Robert N McCauley
3.1.3 Inflation targeters’ choices
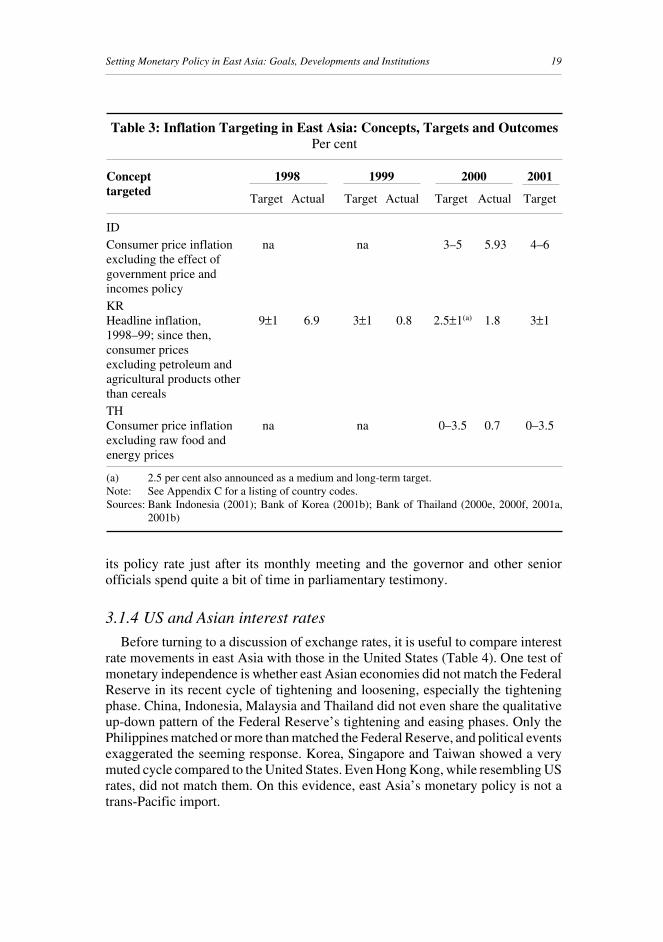
The three Asian central banks that are explicitly targeting inflation have definedinflation in various ways and have set target ranges of varying widths (Table 3). Allthree exclude volatile or unpredictable elements, with Indonesia excluding the effectnot only of government price hikes but also government incomes polices, while theelements excluded from the Korean and Thai consumer prices are variations on themore familiar food and energy themes.
Most of the target ranges have, in the event, been undershot or achieved. Afterexperiencing lower than target inflation for the first three years of its inflationtargeting, the Bank of Korea this year has cited inflation running above its 2001target (resulting from depreciation of the won, higher oil prices and rises inpublic-sector tariffs) in lowering interest rates only 50 basis points thus far this year.The central bank has attempted to anchor expectations across the cycle to lessen theimpact of one year’s inflation outside the target range. In setting its target in 2000of 2.5%±1%, ‘it also established a mid-term inflation target of 2.5 per cent tomaintain consistency in monetary policy and suppress inflationary expectations’(Bank of Korea 2001a, p 1). Strongly affected by political developments (Alamsayahet al 2000, p 237), the depreciation of the rupiah led to an overshoot of BankIndonesia’s first target in 2000. Thai inflation came in at the low end of the widetarget range.
In all three cases, the shift to inflation targeting has been accompanied byincreasingly explicit communication with the financial markets and parliament. InIndonesia, ‘We have to announce the result of the Board monthly meeting. [Interestrates resulting from SBI auctions are announced weekly.] We have to provide aquarterly report to the parliament, which basically is a sort of inflation report, andwe have to submit the annual report and announce the target of inflation to the publicat the beginning of every year’ (Iljas 2000). Nowadyas the Bank of Korea announces
Table 2: Effect of Slowing Electronic Demand
Value-added share of electronics Effect on GDP of aPer cent 20 per cent
reduction inelectronics exports
%
ID 20 –0.4KR 50 –1.2MY 35 –2.0PH 20 –0.7TH 25 –0.4
Source: Asian Development Bank (2001, p 23)
19Setting Monetary Policy in East Asia: Goals, Developments and Institutions
its policy rate just after its monthly meeting and the governor and other seniorofficials spend quite a bit of time in parliamentary testimony.
3.1.4 US and Asian interest rates
Before turning to a discussion of exchange rates, it is useful to compare interestrate movements in east Asia with those in the United States (Table 4). One test ofmonetary independence is whether east Asian economies did not match the FederalReserve in its recent cycle of tightening and loosening, especially the tighteningphase. China, Indonesia, Malaysia and Thailand did not even share the qualitativeup-down pattern of the Federal Reserve’s tightening and easing phases. Only thePhilippines matched or more than matched the Federal Reserve, and political eventsexaggerated the seeming response. Korea, Singapore and Taiwan showed a verymuted cycle compared to the United States. Even Hong Kong, while resembling USrates, did not match them. On this evidence, east Asia’s monetary policy is not atrans-Pacific import.
Table 3: Inflation Targeting in East Asia: Concepts, Targets and OutcomesPer cent
Concept 1998 1999 2000 2001targeted
Target Actual Target Actual Target Actual Target
IDConsumer price inflation na na 3–5 5.93 4–6excluding the effect ofgovernment price andincomes policyKRHeadline inflation, 9±1 6.9 3±1 0.8 2.5±1(a) 1.8 3±11998–99; since then,consumer pricesexcluding petroleum andagricultural products otherthan cerealsTHConsumer price inflation na na 0–3.5 0.7 0–3.5excluding raw food andenergy prices
(a) 2.5 per cent also announced as a medium and long-term target.Note: See Appendix C for a listing of country codes.Sources: Bank Indonesia (2001); Bank of Korea (2001b); Bank of Thailand (2000e, 2000f, 2001a,
2001b)

20 Robert N McCauley
Tab
le 4
: C
hang
es in
Pol
icy
Rat
es in
the
US
and
Asi
aPe
rcen
tage
poi
nts
US
CN
HK
(a)
IDK
RJP
MY
PHSG
(a)
TW
TH
Tig
hten
ing
phas
eU
pD
own
Up
Dow
nU
pU
pD
own
Up
Up
Up
Dow
nM
ay 9
9–N
ov 0
0(b)
1.75
1.53
0.52
12.0
00.
500.
250.
205.
001.
000.
250.
25
Eas
ing
phas
eD
own
Non
eD
own
Up
Dow
nD
own
Non
eD
own
Dow
nD
own
Up
Dec
00–
Jul 0
1(c)
2.75
–2.
242.
230.
500.
25–
4.50
0.61
1.23
1.00
Mem
o: n
omin
al e
ffec
tive
exc
hang
e ra
teM
ay 9
9–N
ov 0
06.
913.
575.
07–1
3.90
1.26
17.3
03.
72–2
1.20
1.11
2.67
–12.
70D
ec 0
0–Ju
l 01(c
)4.
574.
204.
56–9
.90
–1.5
6–9
.78
6.04
–2.1
10.
550.
352.
25
(a)
Thr
ee-m
onth
HIB
OR
/DIB
OR
, not
a p
olic
y ra
te.
(b)
The
US
Fede
ral R
eser
ve fi
rst r
aise
d th
e Fe
dera
l Fun
ds ta
rget
rate
in J
une
1999
and
tigh
tene
d in
five
furt
her s
teps
thro
ugh
to M
ay 2
000.
The
per
iod
used
her
eis
long
er, r
efle
ctin
g th
e Fe
dera
l Res
erve
’s ‘
tight
enin
g bi
as’
into
Nov
embe
r.(c
)D
ata
as o
f 9
July
.N
ote:
See
App
endi
x C
for
a li
stin
g of
cou
ntry
cod
es.
Sour
ces:
BIS
cal
cula
tions
; nat
iona
l sou
rces
21Setting Monetary Policy in East Asia: Goals, Developments and Institutions
3.2 Exchange ratesDiscussion of post-crisis exchange rate policy in east Asia has given rise to
controversy and misapprehension. The exceptions are China, Hong Kong andMalaysia, which have adopted widely acknowledged fixed-rate or quasi-fixed-rateregimes. Elsewhere, it has been claimed that the behaviour of exchange rates in eastAsia has reverted to pre-crisis norms. The data do not support such claims (seeAppendix A). A harder question is how to characterise the foreign exchange marketintervention of east Asian economies, that is, going beyond the one-size-fits-alldesignation of a managed or dirty float.
3.2.1 China, Hong Kong and Malaysia
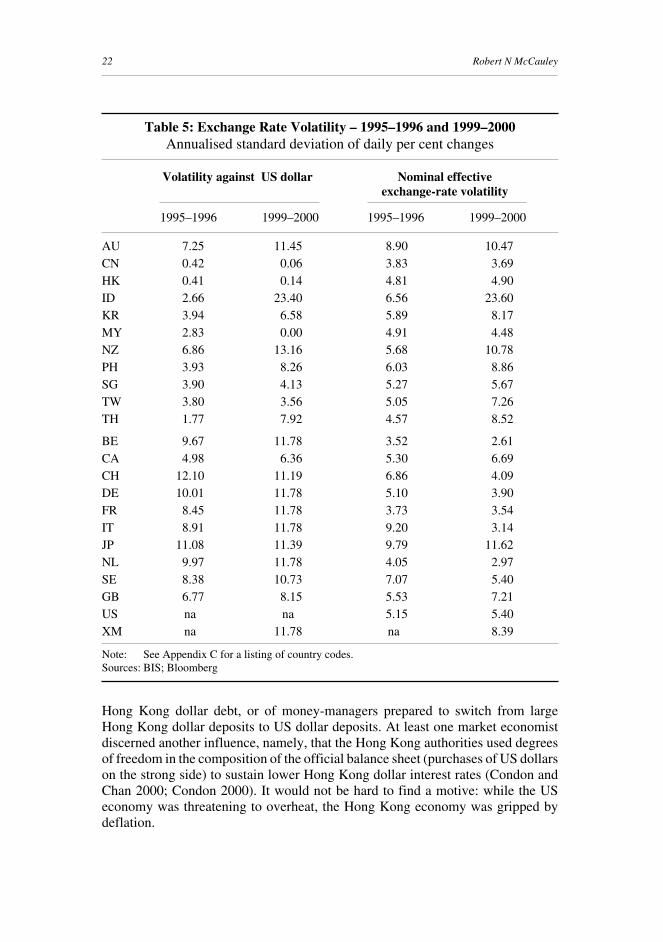
These three economies aligned their exchange rates more closely to the US dollarin 1999–2000 than they did in 1995–1996. Starting from very similar spot ratevolatility against the dollar in the earlier period, the Chinese renminbi andHong Kong dollar both became more stable (Table 5). Ironically, even though thepolicy commitment to dollar exchange rate stability was stronger in Hong Kong, therenminbi showed less movement against the dollar in the latter period. The volatilityof the Malaysian ringgit against the US dollar, for its part, fell from a notinconsiderable level around 3 per cent to 0.
Against the background of widening of interest rate differentials in favour of theUS dollar in the course of the Federal Reserve’s last tightening cycle, the isolationof the Chinese and Malaysian money markets came under stress. The Chineseauthorities allowed domestic banks to offer higher rates on US dollar and otherforeign-currency accounts (McCauley and Mo 2000), and for a time China’sofficial reserves grew very slowly notwithstanding reported surpluses on thecurrent and direct investment accounts. Malaysia’s reserves declined for much of2000, albeit they remained at comfortable levels, again notwithstanding a widecurrent account surplus.
The conventional wisdom with regard to currency board systems is that, at best,interest rates can fall to match those obtaining in the base currency. In general,owing to lower creditworthiness or residual concern about the possibility of abreakdown in the peg, interest rates in the pegged economy offer a premium overthose in the base currency. Developments in Hong Kong in 2000, however, didsome puzzling damage to this view as money market rates there fell substantiallybelow US dollar LIBOR. The 1-month HIBOR fell below LIBOR by over 100 basispoints at times, and 1-year HIBOR (a very liquid node in the Hong Kong money andforeign exchange market) by as much as 40 basis points. Most commentary ascribesthese relatively low interest rates to weak loan demand and/or the strength of capitalinflows.14 Implicitly, these interpretations require a shortage of speculators (ornimble hedgers), that is, of corporations willing to switch US dollar debt into
14. Capital inflows were cited by the Hong Kong Monetary Authority (2001, p 42), in particular fundsflowed strongly into China-related share offerings.
22 Robert N McCauley
Hong Kong dollar debt, or of money-managers prepared to switch from largeHong Kong dollar deposits to US dollar deposits. At least one market economistdiscerned another influence, namely, that the Hong Kong authorities used degreesof freedom in the composition of the official balance sheet (purchases of US dollarson the strong side) to sustain lower Hong Kong dollar interest rates (Condon andChan 2000; Condon 2000). It would not be hard to find a motive: while the USeconomy was threatening to overheat, the Hong Kong economy was gripped bydeflation.
Table 5: Exchange Rate Volatility – 1995–1996 and 1999–2000Annualised standard deviation of daily per cent changes
Volatility against US dollar Nominal effectiveexchange-rate volatility
1995–1996 1999–2000 1995–1996 1999–2000
AU 7.25 11.45 8.90 10.47CN 0.42 0.06 3.83 3.69HK 0.41 0.14 4.81 4.90ID 2.66 23.40 6.56 23.60KR 3.94 6.58 5.89 8.17MY 2.83 0.00 4.91 4.48NZ 6.86 13.16 5.68 10.78PH 3.93 8.26 6.03 8.86SG 3.90 4.13 5.27 5.67TW 3.80 3.56 5.05 7.26TH 1.77 7.92 4.57 8.52
BE 9.67 11.78 3.52 2.61CA 4.98 6.36 5.30 6.69CH 12.10 11.19 6.86 4.09DE 10.01 11.78 5.10 3.90FR 8.45 11.78 3.73 3.54IT 8.91 11.78 9.20 3.14JP 11.08 11.39 9.79 11.62NL 9.97 11.78 4.05 2.97SE 8.38 10.73 7.07 5.40GB 6.77 8.15 5.53 7.21US na na 5.15 5.40XM na 11.78 na 8.39
Note: See Appendix C for a listing of country codes.Sources: BIS; Bloomberg
23Setting Monetary Policy in East Asia: Goals, Developments and Institutions
3.2.2 The Singapore dollar
As noted above, the authorities have guided the Singapore dollar’s effectiveexchange rate as a means of keeping prices stable. Singapore’s policy continuity isunderscored by the observation that neither its bilateral nor its effective exchangerate volatility has changed substantially since the crisis. Recently, however, theMAS has outlined its approach to the public in a way that marks a break with the past.On 27 July 2000, a senior official at a media briefing on the release of the MASAnnual Report reported that the MAS had taken a ‘neutral stance’ toward thetrade-weighted Singapore dollar in the previous year. In view of labour markettightening and higher world commodity prices the ‘MAS is, therefore, prepared toallow a gradual and modest appreciation of the Sing dollar on a trade-weighted basisin the coming year’. This stance was re-affirmed in the Monetary Policy Statementin February 2001 (MAS 2001b). Market participants were left to infer the currenttarget nominal effective exchange rate (the ‘centre’) and the margin of tolerancearound it (the ‘width of the band’) from the behaviour of the exchange rate andperceived interventions, but they learned its slope, in qualitative terms at least, andthat the market rate was in the upper half of the band. Under the circumstances,market participants might interpret gradual to mean something like 1–2 per centper annum.15 In July 2001, market participants were surprised that the MAS openlyswitched to a neutral stance (i.e., a stable nominal effective exchange rate goingforward), citing labour market softening, weaker global price pressures and theimplications of collapsing non-oil domestic exports. The MAS also published itsnominal effective exchange rate and characterised the market exchange ratevis-à-vis its target band (MAS Economics Department 2001, p ii), allowing marketparticipants to make more progress on inferring the official basket weights and targetband (Patterson, Chong and Eschweiler 2001).
3.2.3 The NT dollar
Falling between the economies experiencing lower or higher exchange-ratevolatility is Taiwan. The New Taiwan dollar’s bilateral US dollar volatility remainedthe same but its effective-exchange-rate volatility increased. This was in part aconsequence of the greater US dollar volatility of its neighbours’ currencies. Thereis evidence, however, of a change in policy in 2001 (see below).
3.2.4 The rupiah, won, peso and baht
Calvo and Reinhart (2000, p 27) claim: ‘Indeed, once financial markets settledand capital flowed back into Asia, their currencies are fluctuating much the way theydid prior to the crisis—that is to say, they are not fluctuating at all’. Similarly,McKinnon (2000) concludes that the east Asian dollar standard enjoyed a resurrectionafter the crisis and Ogawa (2001, p 32) looks at the baht, won and Singapore dollar
15. Baweja and Schymyck (2001) find 2.5 per cent as the trend (their estimated constant times 4).
24 Robert N McCauley
and concludes that ‘some of the East Asian currencies have returned to de factopegging of the home currencies to the U.S. dollar since late 1998’. By contrast, theMAS Economics Department (2000) measures exchange rate volatility against thedollar and concludes that ‘the declaration that there [is] greater flexibility in the threecurrencies [(namely, rupiah, won and baht) is] not “merely words but also deeds”’(p 14). The data through end 2000 weigh in favour of the central bank economistsin Southeast Asia, showing distinctly higher volatility for the currencies of Indonesia,Korea, the Philippines and Thailand. The higher volatility of these currencies holdswhether the exchange rate is measured against the US dollar or in effective terms.Note, however, that the increase in effective-exchange-rate volatility is smaller thanthe increase in US dollar exchange-rate volatility. (See Appendix A for a moreextensive treatment of the relationship between McKinnon’s conclusion andevidence.)
It is not safe, however, to conclude from this observation that policy is moreaccepting of exchange rate volatility. Neither Australia nor New Zealand haschanged its exchange rate policy, and yet both of their exchange rates were morevolatile in the latter period. Moreover, it could be, for instance in Indonesia, that theeconomy as a whole was more volatile in the latter period and thus any rise in foreignexchange volatility might simply reflect the underlying economy rather than policy.An approach that considers both exchange rate and interest rate volatility is required.
3.2.5 The balance of interest rate and exchange rate volatility
A more telling measure juxtaposes exchange-rate volatility and interest-ratevolatility.16 Looking, then, at the ratio of exchange-rate to interest-rate volatility,17
the impression gained by a simple comparison of exchange-rate volatilities is largelyconfirmed (Figure 1 shows effective-exchange-rate volatility and Figure 2 shows
16. The present analysis does not follow some studies of the balance between interest- and exchange-ratevolatility that include the volatility of foreign exchange reserves. The concept, that pressure on thecurrency can find expression in some combination of exchange rate intervention and interest ratemovements, is sound enough. To measure intervention-related reserve changes, however, requires morethan differencing a series in the International Financial Statistics. For one thing, variations in theUS dollar/euro and US dollar/yen exchange rate introduce changes in reserve levels that are unrelated tointervention. Worse, not just interest receipts, but also draw-downs and repayments of loans, as well asgovernment transactions, can move reserve levels in the absence of intervention. Of course, swaptransactions can serve to maintain reserve levels in the presence of intervention.
17. In measuring interest-rate volatility, one faces a choice between two measures, each of which haslimitations. One can look at basis point volatility or yield volatility. The former is constructed as thestandard deviation of actual interest rate movements over some period (appropriately annualised); thelatter as the standard deviation of percentage movements in interest rates over some period. The problemwith basis point volatility is that it treats as the same a 25 basis point interest rate move when interest ratesare 20 per cent or 1 per cent, yet interest rates tend, like inflation, to be more variable at higher levels. Theproblem with looking at interest rate movements in percentage terms, however, is that at very low rates,the same 25 basis points can be a large fraction. Thus, Japan’s short-term interest rates have shown outsizedyield volatility in recent years. As in Borio and McCauley (1996), yield volatility serves as the focus herewhile the oddity of the measure for Japan must be borne in mind; figures based on basis point volatilitycan be found in Appendix B. One appealing feature in the present context is that exchange-rate volatilityis measured in the same units of percentage changes as yield volatility.
25Setting Monetary Policy in East Asia: Goals, Developments and Institutions
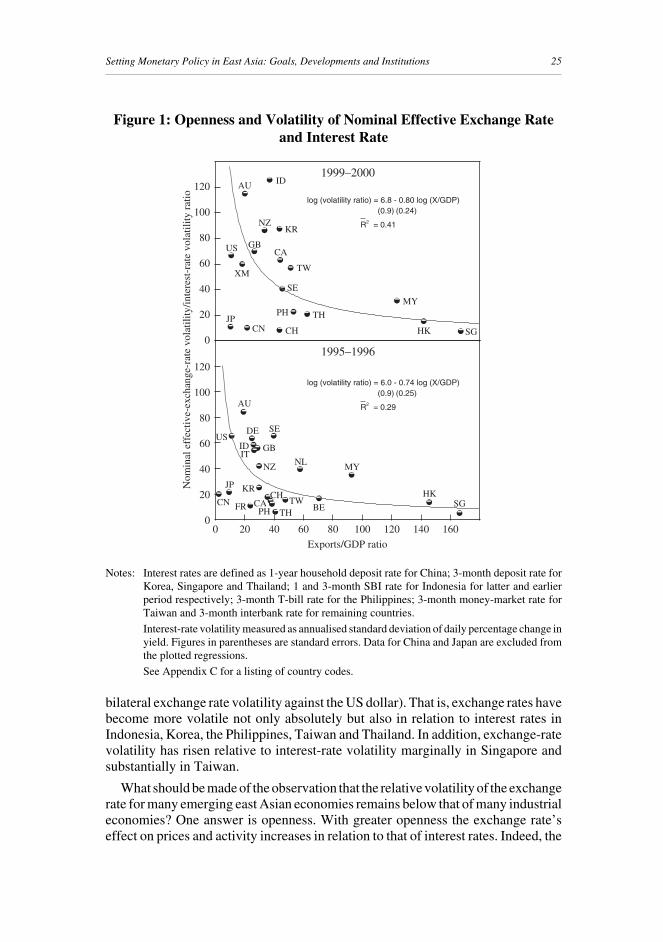
Figure 1: Openness and Volatility of Nominal Effective Exchange Rateand Interest Rate
Notes: Interest rates are defined as 1-year household deposit rate for China; 3-month deposit rate forKorea, Singapore and Thailand; 1 and 3-month SBI rate for Indonesia for latter and earlierperiod respectively; 3-month T-bill rate for the Philippines; 3-month money-market rate forTaiwan and 3-month interbank rate for remaining countries.
Interest-rate volatility measured as annualised standard deviation of daily percentage change inyield. Figures in parentheses are standard errors. Data for China and Japan are excluded fromthe plotted regressions.
See Appendix C for a listing of country codes.
1999–2000
Exports/GDP ratio
●
●
●●
●
●
●
●●
●
●
●●●
●
●
●
●
●
●
●
●
0
20
40
60
80
100
120
0 20 40 60 80 100 120 140 160
●
●
●●
●
●
●
●
●
●
●
●
●●
●
●●
●
0
20
40
60
80
100
120
AU
IDUS
DE
GBIT
SE
HKSG
MY
BE
NLNZ
KRJP
CN TWTH
FR CACH
PH
Nom
inal
eff
ectiv
e-ex
chan
ge-r
ate
vola
tility
/inte
rest
-rat
e vo
latil
ity r
atio
1995–1996
AU ID
NZKR
CA
TW
SE
US
XM
GB
JPCN CH
PH TH
MY
HK SG
log (volatility ratio) = 6.8 - 0.80 log (X/GDP)(0.9) (0.24)
R2 = 0.41
log (volatility ratio) = 6.0 - 0.74 log (X/GDP)(0.9) (0.25)
R2 = 0.29
bilateral exchange rate volatility against the US dollar). That is, exchange rates havebecome more volatile not only absolutely but also in relation to interest rates inIndonesia, Korea, the Philippines, Taiwan and Thailand. In addition, exchange-ratevolatility has risen relative to interest-rate volatility marginally in Singapore andsubstantially in Taiwan.
What should be made of the observation that the relative volatility of the exchangerate for many emerging east Asian economies remains below that of many industrialeconomies? One answer is openness. With greater openness the exchange rate’seffect on prices and activity increases in relation to that of interest rates. Indeed, the
26 Robert N McCauley
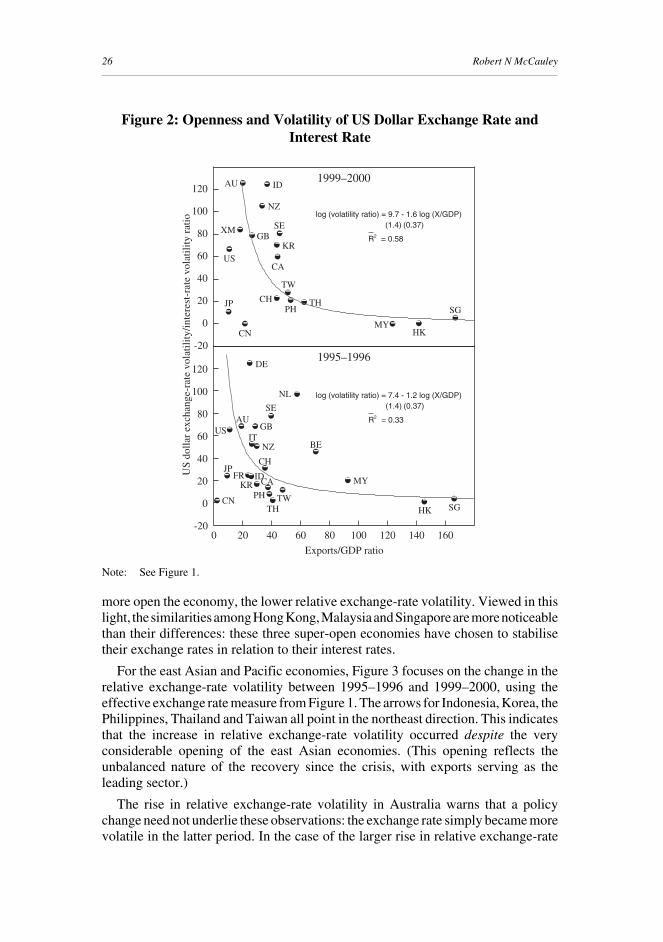
Figure 2: Openness and Volatility of US Dollar Exchange Rate andInterest Rate
Note: See Figure 1.
more open the economy, the lower relative exchange-rate volatility. Viewed in thislight, the similarities among Hong Kong, Malaysia and Singapore are more noticeablethan their differences: these three super-open economies have chosen to stabilisetheir exchange rates in relation to their interest rates.
For the east Asian and Pacific economies, Figure 3 focuses on the change in therelative exchange-rate volatility between 1995–1996 and 1999–2000, using theeffective exchange rate measure from Figure 1. The arrows for Indonesia, Korea, thePhilippines, Thailand and Taiwan all point in the northeast direction. This indicatesthat the increase in relative exchange-rate volatility occurred despite the veryconsiderable opening of the east Asian economies. (This opening reflects theunbalanced nature of the recovery since the crisis, with exports serving as theleading sector.)
The rise in relative exchange-rate volatility in Australia warns that a policychange need not underlie these observations: the exchange rate simply became morevolatile in the latter period. In the case of the larger rise in relative exchange-rate
●
●
●●
●● ●
●●
●
●
●
●
●
●
●
●
●
●
●
●●
-20
0
20
40
60
80
100
120
0 20 40 60 80 100 120 140 160
●
●
●●
●
●
●
●
●
●
●
●
●
●
●●
●
●
-20
0
20
40
60
80
100
120 AU ID
US
DE
GB
IT
SE
HKMY
BE
NL
NZ
KR
JP
CN
TW
TH
FR
CA
CHPH
XM
SG
HK SG
MY
TWTH
PH
CAKR
JP
CN
CH
ID
AUUS
NZ
GB
SE
1999–2000
Exports/GDP ratio
US
dol
lar
exch
ange
-rat
e vo
lati
lity
/int
eres
t-ra
te v
olat
ilit
y ra
tio
1995–1996
log (volatility ratio) = 9.7 - 1.6 log (X/GDP)(1.4) (0.37)
R2 = 0.58
log (volatility ratio) = 7.4 - 1.2 log (X/GDP)(1.4) (0.37)
R2 = 0.33
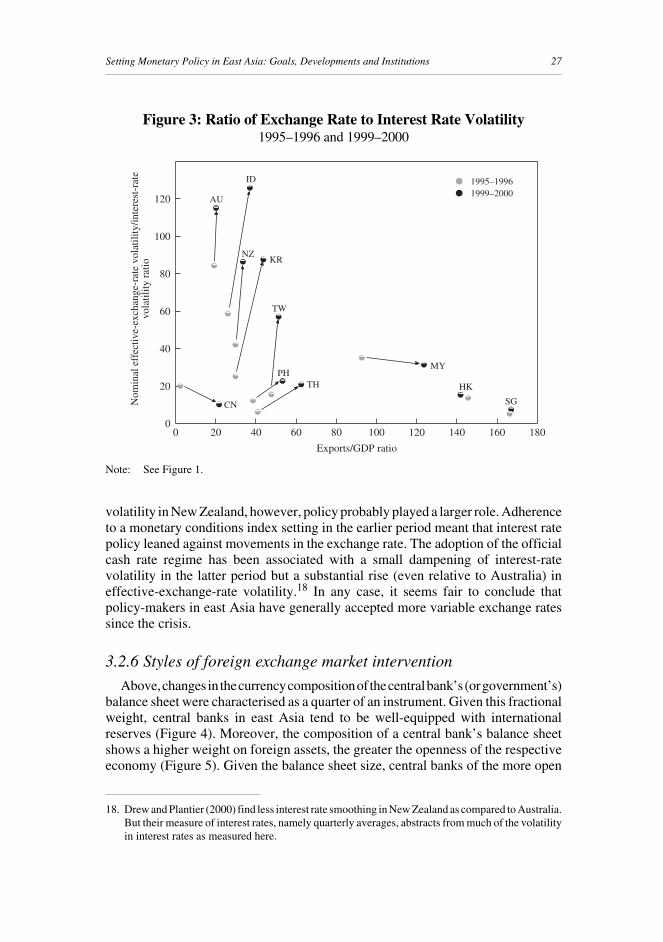
27Setting Monetary Policy in East Asia: Goals, Developments and Institutions
Figure 3: Ratio of Exchange Rate to Interest Rate Volatility1995–1996 and 1999–2000
volatility in New Zealand, however, policy probably played a larger role. Adherenceto a monetary conditions index setting in the earlier period meant that interest ratepolicy leaned against movements in the exchange rate. The adoption of the officialcash rate regime has been associated with a small dampening of interest-ratevolatility in the latter period but a substantial rise (even relative to Australia) ineffective-exchange-rate volatility.18 In any case, it seems fair to conclude thatpolicy-makers in east Asia have generally accepted more variable exchange ratessince the crisis.
3.2.6 Styles of foreign exchange market intervention
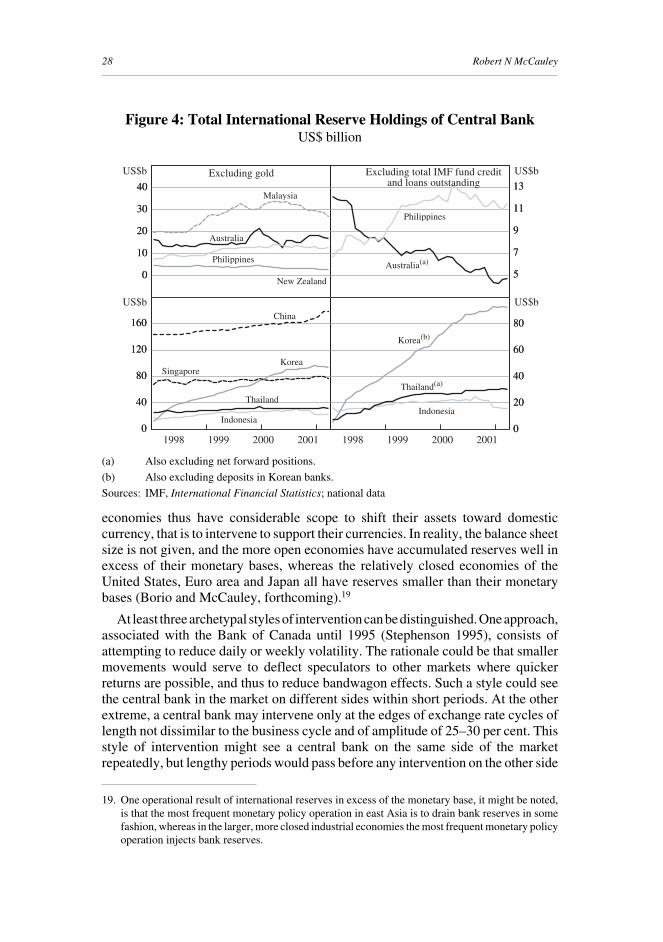
Above, changes in the currency composition of the central bank’s (or government’s)balance sheet were characterised as a quarter of an instrument. Given this fractionalweight, central banks in east Asia tend to be well-equipped with internationalreserves (Figure 4). Moreover, the composition of a central bank’s balance sheetshows a higher weight on foreign assets, the greater the openness of the respectiveeconomy (Figure 5). Given the balance sheet size, central banks of the more open
18. Drew and Plantier (2000) find less interest rate smoothing in New Zealand as compared to Australia.But their measure of interest rates, namely quarterly averages, abstracts from much of the volatilityin interest rates as measured here.
Note: See Figure 1.
●
●
●
●
●
●
●
●
●
●
●
●
●
●
●
●
●
●
●
●
●
●
0
20
40
60
80
100
120
0 20 40 60 80 100 120 140 160 180
Exports/GDP ratio
AU
ID
NZKR
TW
CN
PHTH
MY
HK
SGNom
inal
eff
ectiv
e-ex
chan
ge-r
ate
vola
tility
/inte
rest
-rat
evo
latil
ity r
atio
● 1995–1996● 1999–2000
28 Robert N McCauley
economies thus have considerable scope to shift their assets toward domesticcurrency, that is to intervene to support their currencies. In reality, the balance sheetsize is not given, and the more open economies have accumulated reserves well inexcess of their monetary bases, whereas the relatively closed economies of theUnited States, Euro area and Japan all have reserves smaller than their monetarybases (Borio and McCauley, forthcoming).19
At least three archetypal styles of intervention can be distinguished. One approach,associated with the Bank of Canada until 1995 (Stephenson 1995), consists ofattempting to reduce daily or weekly volatility. The rationale could be that smallermovements would serve to deflect speculators to other markets where quickerreturns are possible, and thus to reduce bandwagon effects. Such a style could seethe central bank in the market on different sides within short periods. At the otherextreme, a central bank may intervene only at the edges of exchange rate cycles oflength not dissimilar to the business cycle and of amplitude of 25–30 per cent. Thisstyle of intervention might see a central bank on the same side of the marketrepeatedly, but lengthy periods would pass before any intervention on the other side
19. One operational result of international reserves in excess of the monetary base, it might be noted,is that the most frequent monetary policy operation in east Asia is to drain bank reserves in somefashion, whereas in the larger, more closed industrial economies the most frequent monetary policyoperation injects bank reserves.
Figure 4: Total International Reserve Holdings of Central BankUS$ billion
(a) Also excluding net forward positions.
(b) Also excluding deposits in Korean banks.
Sources: IMF, International Financial Statistics; national data
Australia
20010
20
40
60
80
0
20
40
60
80
0
40
80
120
160
0
40
80
120
160
0
10
20
30
40
0
10
20
30
40
5
7
9
11
13
5
7
9
11
13Excluding gold Excluding total IMF fund credit
and loans outstanding
2000199919982001200019991998
Malaysia
Philippines
New Zealand
Australia(a)
Philippines
China
SingaporeKorea
Indonesia
Thailand
Korea(b)
Thailand(a)
Indonesia
US$b US$b
US$b US$b

29Setting Monetary Policy in East Asia: Goals, Developments and Institutions
of the market. This has been the pattern in US dollar/mark–euro markets. In betweenthese two styles is intervention at the edges of a band defined, say, as single-digitpercentages away from a centre.
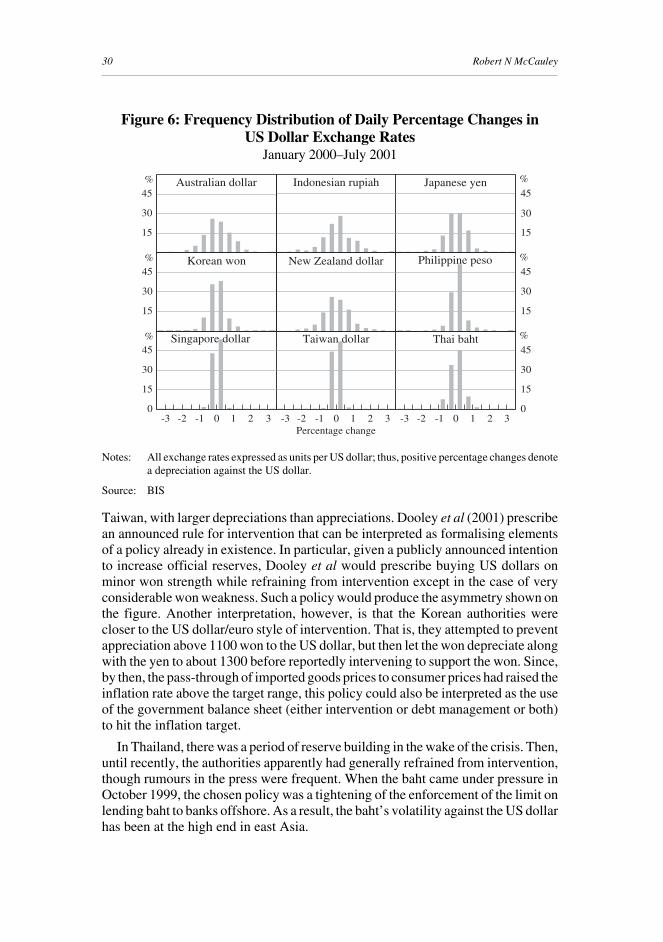
In east Asia and the Pacific, it is easy to identify some economies with thesearchetypes. Taiwan practices Canadian-style intervention, at times reportedlyintervening on both sides of the exchange rate on the same day. As a result, theNT dollar shows few changes of absolute value over 1/2 per cent (Figure 6). In thepast three months, however, several single-day moves of about one NT dollar –roughly 3 per cent – may signal a change in approach. Changes in the Philippine pesoexchange rate also fall in a narrow percentage range, although the approach may beless to limit volatility per se as to resist sharp downward moves in the peso, on theone side, and to rebuild expensive, borrowed reserves, on the other. Australia has inrecent years at least intervened at the perceived extremes of broad swings in theexchange rate.
Korea presents greater difficulty of interpretation. Foreign exchange dealersactually staged a job action some while back to protest what they took to beunwholesome official censoring of daily volatility, suggesting a style akin to that ofTaiwan. Korea’s panel, however, shows an asymmetry not so evident in the case of
Figure 5: Economic Openness and Foreign Asset Holdings ofCentral Banks
Notes: Data for the individual Euro area countries are for 1998; for all other countries are the latestavailable.
See Appendix C for a listing of country codes.
Sources: IMF, International Financial Statistics; national data
●
●
●
●●
●
●
●
●
●
●
●
●
●
●
●
●
●
●
●
●
●
●
●
0
20
40
60
80
100
0 20 40 60 80 100 120 140 160 180
Exports/GDP ratio
Fore
ign
asse
ts/to
tal a
sset
s ra
tio
ITCN
US
JP
IN
SG
HKMY
DE
XM
ID
GB
AT
FRNZ
CA
KRSE
CHPH NL
TH
TWBE
30 Robert N McCauley
Taiwan, with larger depreciations than appreciations. Dooley et al (2001) prescribean announced rule for intervention that can be interpreted as formalising elementsof a policy already in existence. In particular, given a publicly announced intentionto increase official reserves, Dooley et al would prescribe buying US dollars onminor won strength while refraining from intervention except in the case of veryconsiderable won weakness. Such a policy would produce the asymmetry shown onthe figure. Another interpretation, however, is that the Korean authorities werecloser to the US dollar/euro style of intervention. That is, they attempted to preventappreciation above 1100 won to the US dollar, but then let the won depreciate alongwith the yen to about 1300 before reportedly intervening to support the won. Since,by then, the pass-through of imported goods prices to consumer prices had raised theinflation rate above the target range, this policy could also be interpreted as the useof the government balance sheet (either intervention or debt management or both)to hit the inflation target.
In Thailand, there was a period of reserve building in the wake of the crisis. Then,until recently, the authorities apparently had generally refrained from intervention,though rumours in the press were frequent. When the baht came under pressure inOctober 1999, the chosen policy was a tightening of the enforcement of the limit onlending baht to banks offshore. As a result, the baht’s volatility against the US dollarhas been at the high end in east Asia.
%
321-1-2-3 0321-1-2-3 0321-1-2-3 0
%
%
%
%
%
Australian dollar Indonesian rupiah Japanese yen
Korean won New Zealand dollar Philippine peso
Singapore dollar Taiwan dollar Thai baht
Percentage change
15
30
45
15
30
45
15
30
45
15
30
45
0
15
30
45
0
15
30
45
Figure 6: Frequency Distribution of Daily Percentage Changes inUS Dollar Exchange Rates
January 2000–July 2001
Notes: All exchange rates expressed as units per US dollar; thus, positive percentage changes denotea depreciation against the US dollar.
Source: BIS
31Setting Monetary Policy in East Asia: Goals, Developments and Institutions
3.2.7 Limitations on international capital flows
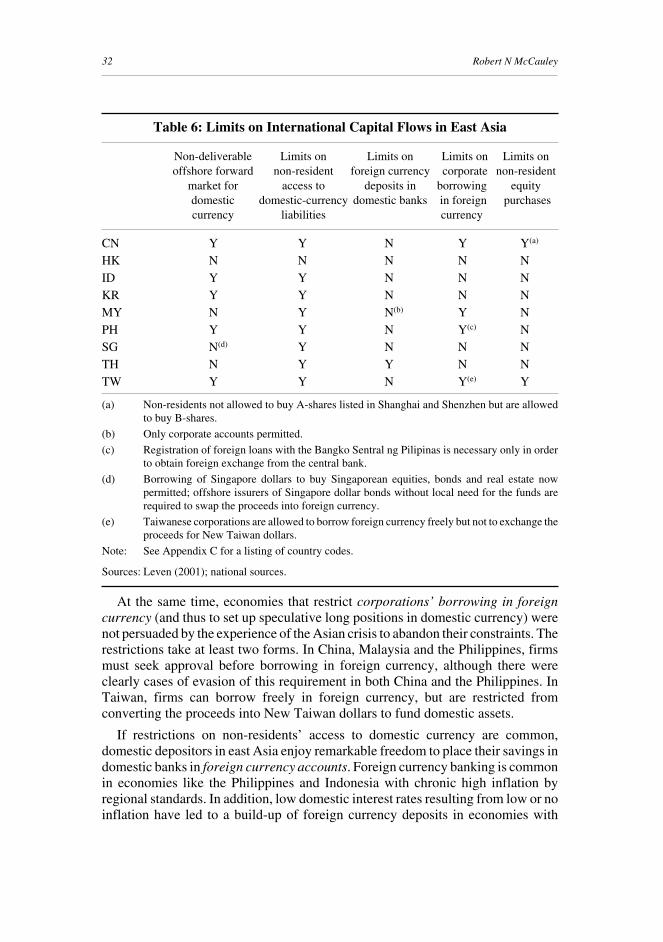
The experience of Latin America heavily influences the international discussionof monetary policy choices in emerging market economies. As a result, the use ofrestrictions on international capital flows to square the circle of independence inmonetary policy and some control over the exchange rate is generally assumed away.Yet in east Asia, not only has the use of such restrictions not passed from the scenein major economies, but also it could be argued that on balance their use has increasedsince the Asian crisis.
East Asian authorities put limits on international capital flows in a variety ofdifferent ways. These include limitations on non-residents access to domesticcurrency assets and liabilities, restrictions on resident holdings of foreign-currencybank accounts held with the domestic banking system, required approval for foreigncurrency borrowing by the corporate sector, and constraints on portfolio flows intoequity markets.20 Table 6 profiles east Asian economies on these dimensions and inaddition reports whether there is a non-deliverable forward market for the respectivecurrency. In such a market, forward transactions are settled not by an exchange ofUS dollars against local currency but rather a net dollar payment is made dependingon the difference between the agreed rate and the actual, prevailing exchange rate.The existence of such a market indicates the force of the restrictions on non-residentaccess to the domestic currency through the banking system, although the closenessof the arbitrage between offshore and onshore exchange rates (and thus interest rates)varies.
Particularly noteworthy are the limits on non-resident access to domestic currency.Since the crisis, such limits have been adopted not only in Malaysia, but also inThailand, and more recently in Indonesia. ‘The Bank of Thailand imposed a newmeasure on 29 January 1998 that baht-denominated credit facilities provided by eachfinancial institution to non-residents where there is no underlying trade or investmentactivities in Thailand, are subject to a maximum of B50 million [about US$1 million]per counterparty. On 4 October 1999, the Bank of Thailand clarified that the term“per counterparty” refers to all transactions taken by the head office, branches,representative offices and all affiliated companies of a particular non-resident to becounted as one’ (Bank of Thailand 2000b). ‘Until this year, the IDR [Indonesianrupiah] was one of the freer currencies in the region but…earlier this year, the centralbank made offshore to offshore transactions illegal which effectively shut down theoffshore deliverable market’ (Leven 2001).21 Such restrictions have been tightenedin China, the Philippines and Taiwan, and loosened only in Singapore and Korea.These restrictions suggest that the argument that non-resident short-sellers, includingspeculative accounts, have a role to play in the international financial system haslittle resonance in the region.
20. Restrictions on foreign direct investment are not discussed.
21. ‘However, there are still no restrictions on spot transactions…Transactions to hedge onshoreinvestments (including portfolio) and trade flows are exempt from this limit providing thatsupporting documentation is filed with the central bank’ (Leven 2001, p 3).
32 Robert N McCauley
At the same time, economies that restrict corporations’ borrowing in foreigncurrency (and thus to set up speculative long positions in domestic currency) werenot persuaded by the experience of the Asian crisis to abandon their constraints. Therestrictions take at least two forms. In China, Malaysia and the Philippines, firmsmust seek approval before borrowing in foreign currency, although there wereclearly cases of evasion of this requirement in both China and the Philippines. InTaiwan, firms can borrow freely in foreign currency, but are restricted fromconverting the proceeds into New Taiwan dollars to fund domestic assets.
If restrictions on non-residents’ access to domestic currency are common,domestic depositors in east Asia enjoy remarkable freedom to place their savings indomestic banks in foreign currency accounts. Foreign currency banking is commonin economies like the Philippines and Indonesia with chronic high inflation byregional standards. In addition, low domestic interest rates resulting from low or noinflation have led to a build-up of foreign currency deposits in economies with
Table 6: Limits on International Capital Flows in East Asia
Non-deliverable Limits on Limits on Limits on Limits onoffshore forward non-resident foreign currency corporate non-resident
market for access to deposits in borrowing equitydomestic domestic-currency domestic banks in foreign purchasescurrency liabilities currency
CN Y Y N Y Y(a)
HK N N N N NID Y Y N N NKR Y Y N N NMY N Y N(b) Y NPH Y Y N Y(c) NSG N(d) Y N N NTH N Y Y N NTW Y Y N Y(e) Y
(a) Non-residents not allowed to buy A-shares listed in Shanghai and Shenzhen but are allowedto buy B-shares.
(b) Only corporate accounts permitted.
(c) Registration of foreign loans with the Bangko Sentral ng Pilipinas is necessary only in orderto obtain foreign exchange from the central bank.
(d) Borrowing of Singapore dollars to buy Singaporean equities, bonds and real estate nowpermitted; offshore issurers of Singapore dollar bonds without local need for the funds arerequired to swap the proceeds into foreign currency.
(e) Taiwanese corporations are allowed to borrow foreign currency freely but not to exchange theproceeds for New Taiwan dollars.
Note: See Appendix C for a listing of country codes.
Sources: Leven (2001); national sources.
33Setting Monetary Policy in East Asia: Goals, Developments and Institutions
restrictions on the scope of foreign investment, namely China and Taiwan.22
Taiwan’s limits on remittances by residents, $5 million a year for individuals and$20 million a year for firms, have allowed, at times, rapid shifts from NT dollars todomestic foreign currency accounts. In Thailand, by contrast, individuals or firmscannot open foreign currency accounts without underlying overseas cash flows.
Foreign investors also enjoy considerable freedom across east Asia to buy and sellequities. Malaysia abandoned the last of its holding-period based capital gains taxesin the last budget. Taiwan restricts investment from abroad to the larger global ‘realmoney’ investors but has enlarged the ambit of qualifying foreign investors in a bidto attract more funds into its NASDAQ-related market. While China prohibitsforeign investment in its A-share markets in Shanghai and Shenzhen, valuations areso high that the pressure is from the other side, that is, domestic investors buying intolower-rated B-shares (permitted earlier this year) and into offshore issues of Chineseand China-related firms (not permitted). Foreign portfolio investors’ desire at timesto hold onto shares but to hedge currency risk results in some of the largest flows inthe non-deliverable forward market for the Korean won and New Taiwan dollar.
Three strands of evidence shed light on the effectiveness of limits on non-residentaccess to local currencies and on domestic corporations borrowing in foreigncurrency. The general view is that controls on capital outflows ‘tend to lose theireffectiveness and efficiency over time’ and that ‘capital inflow controls may for atime be useful in enabling a country to run an independent monetary policy…buttheir long-term effectiveness to those ends is doubtful’ (Fischer 2001). The presentevidence cannot test these assertions but rather can indicate whether, at a point intime, the limits seemed to have the intended effect.
Regarding capital outflows by residents, the considerable gap that opened upduring the Federal Reserve’s tightening cycle and domestic interest rates in Chinaand Malaysia in the 2–3 per cent range strongly argues for the effectiveness ofrestrictions on capital flows. This conclusion holds even after acknowledging thesubstantial capital outflows from both economies, which seems to have abated withthe lowering of US dollar money rates this year (Aziz 2001).
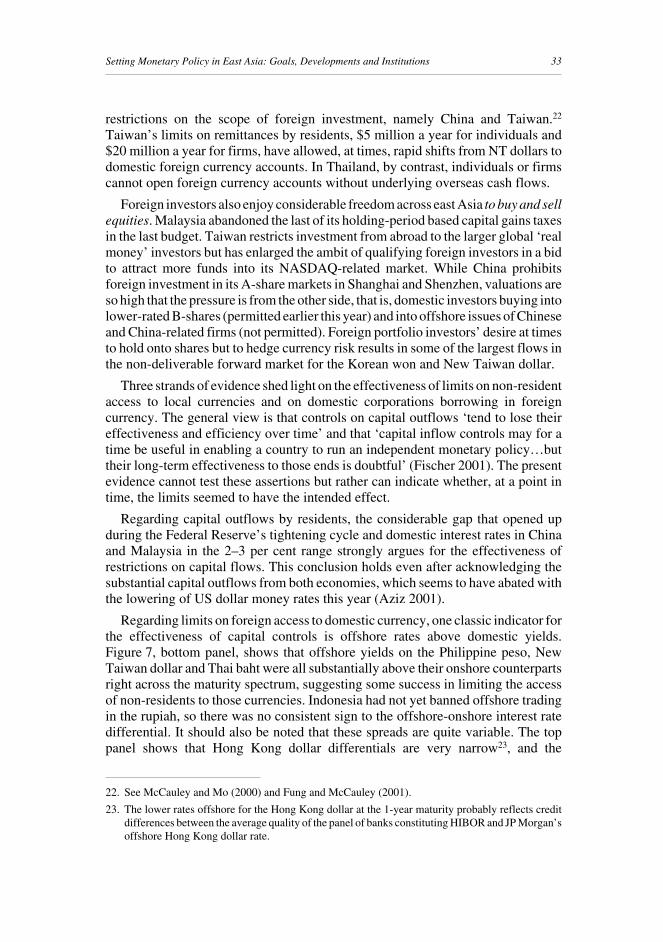
Regarding limits on foreign access to domestic currency, one classic indicator forthe effectiveness of capital controls is offshore rates above domestic yields.Figure 7, bottom panel, shows that offshore yields on the Philippine peso, NewTaiwan dollar and Thai baht were all substantially above their onshore counterpartsright across the maturity spectrum, suggesting some success in limiting the accessof non-residents to those currencies. Indonesia had not yet banned offshore tradingin the rupiah, so there was no consistent sign to the offshore-onshore interest ratedifferential. It should also be noted that these spreads are quite variable. The toppanel shows that Hong Kong dollar differentials are very narrow23, and the
22. See McCauley and Mo (2000) and Fung and McCauley (2001).
23. The lower rates offshore for the Hong Kong dollar at the 1-year maturity probably reflects creditdifferences between the average quality of the panel of banks constituting HIBOR and JP Morgan’soffshore Hong Kong dollar rate.
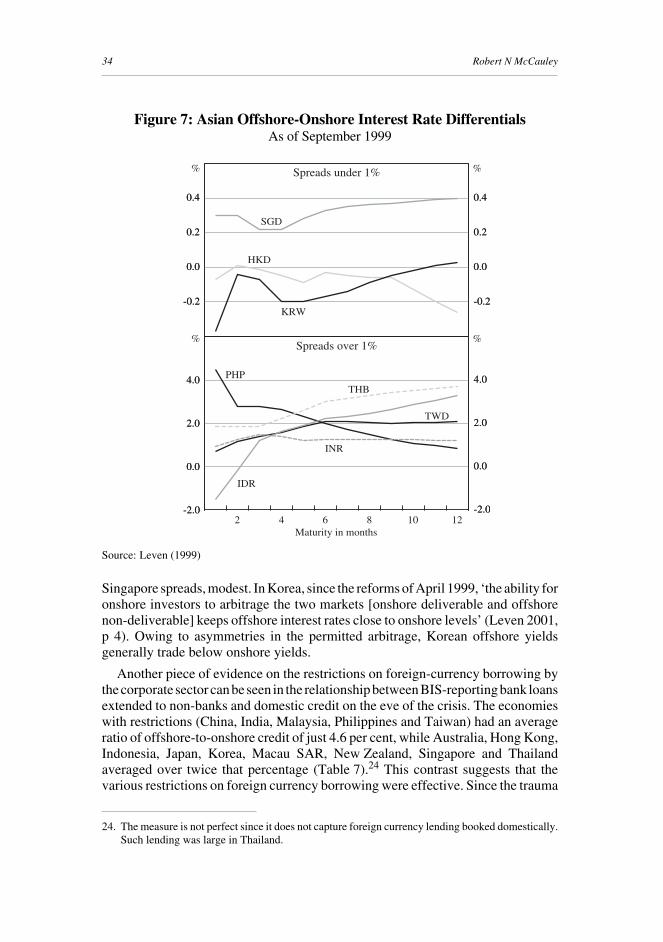
34 Robert N McCauley
Singapore spreads, modest. In Korea, since the reforms of April 1999, ‘the ability foronshore investors to arbitrage the two markets [onshore deliverable and offshorenon-deliverable] keeps offshore interest rates close to onshore levels’ (Leven 2001,p 4). Owing to asymmetries in the permitted arbitrage, Korean offshore yieldsgenerally trade below onshore yields.
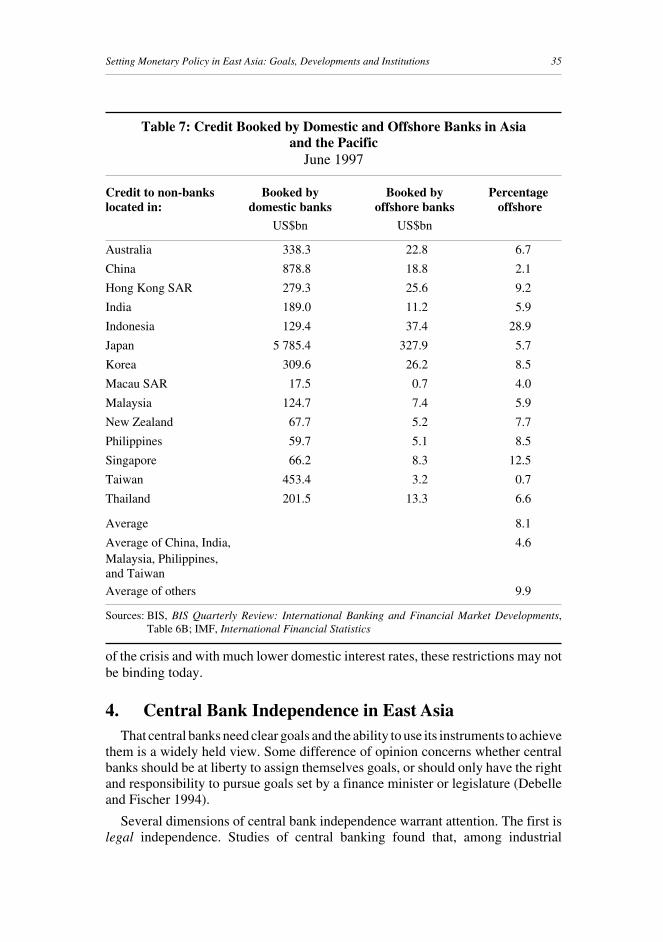
Another piece of evidence on the restrictions on foreign-currency borrowing bythe corporate sector can be seen in the relationship between BIS-reporting bank loansextended to non-banks and domestic credit on the eve of the crisis. The economieswith restrictions (China, India, Malaysia, Philippines and Taiwan) had an averageratio of offshore-to-onshore credit of just 4.6 per cent, while Australia, Hong Kong,Indonesia, Japan, Korea, Macau SAR, New Zealand, Singapore and Thailandaveraged over twice that percentage (Table 7).24 This contrast suggests that thevarious restrictions on foreign currency borrowing were effective. Since the trauma
THB
% %
PHP
INR
TWD
12108642
IDR
Spreads under 1%
-0.2
0.0
0.2
0.4
-0.2
0.0
0.2
0.4
-0.2
0.0
0.2
0.4
-0.2
0.0
0.2
0.4
-2.0
0.0
2.0
4.0
-2.0
0.0
2.0
4.0
-2.0
0.0
2.0
4.0
-2.0
0.0
2.0
4.0
% %
SGD
HKD
KRW
Spreads over 1%
Maturity in months
Figure 7: Asian Offshore-Onshore Interest Rate DifferentialsAs of September 1999
Source: Leven (1999)
24. The measure is not perfect since it does not capture foreign currency lending booked domestically.Such lending was large in Thailand.
35Setting Monetary Policy in East Asia: Goals, Developments and Institutions
Table 7: Credit Booked by Domestic and Offshore Banks in Asiaand the Pacific
June 1997
Credit to non-banks Booked by Booked by Percentagelocated in: domestic banks offshore banks offshore
US$bn US$bn
Australia 338.3 22.8 6.7
China 878.8 18.8 2.1
Hong Kong SAR 279.3 25.6 9.2
India 189.0 11.2 5.9
Indonesia 129.4 37.4 28.9
Japan 5 785.4 327.9 5.7
Korea 309.6 26.2 8.5
Macau SAR 17.5 0.7 4.0
Malaysia 124.7 7.4 5.9
New Zealand 67.7 5.2 7.7
Philippines 59.7 5.1 8.5
Singapore 66.2 8.3 12.5
Taiwan 453.4 3.2 0.7
Thailand 201.5 13.3 6.6
Average 8.1
Average of China, India, 4.6Malaysia, Philippines,and Taiwan
Average of others 9.9
Sources: BIS, BIS Quarterly Review: International Banking and Financial Market Developments,Table 6B; IMF, International Financial Statistics
of the crisis and with much lower domestic interest rates, these restrictions may notbe binding today.
4. Central Bank Independence in East AsiaThat central banks need clear goals and the ability to use its instruments to achieve
them is a widely held view. Some difference of opinion concerns whether centralbanks should be at liberty to assign themselves goals, or should only have the rightand responsibility to pursue goals set by a finance minister or legislature (Debelleand Fischer 1994).
Several dimensions of central bank independence warrant attention. The first islegal independence. Studies of central banking found that, among industrial
36 Robert N McCauley
economies, legal independence was associated with lower inflation. The lack ofassociation between measures of legal independence and inflation elsewhere,however, led to a focus on behavioural proxies for independence. Finally, someattention should be paid to balance sheet (or possibly income) independence.
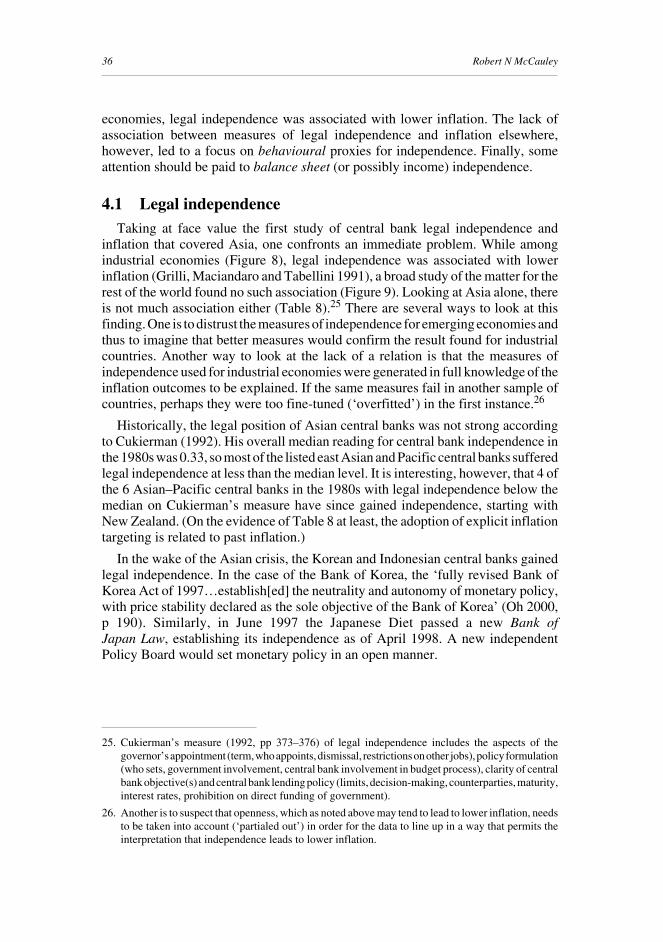
4.1 Legal independenceTaking at face value the first study of central bank legal independence and
inflation that covered Asia, one confronts an immediate problem. While amongindustrial economies (Figure 8), legal independence was associated with lowerinflation (Grilli, Maciandaro and Tabellini 1991), a broad study of the matter for therest of the world found no such association (Figure 9). Looking at Asia alone, thereis not much association either (Table 8).25 There are several ways to look at thisfinding. One is to distrust the measures of independence for emerging economies andthus to imagine that better measures would confirm the result found for industrialcountries. Another way to look at the lack of a relation is that the measures ofindependence used for industrial economies were generated in full knowledge of theinflation outcomes to be explained. If the same measures fail in another sample ofcountries, perhaps they were too fine-tuned (‘overfitted’) in the first instance.26
Historically, the legal position of Asian central banks was not strong accordingto Cukierman (1992). His overall median reading for central bank independence inthe 1980s was 0.33, so most of the listed east Asian and Pacific central banks sufferedlegal independence at less than the median level. It is interesting, however, that 4 ofthe 6 Asian–Pacific central banks in the 1980s with legal independence below themedian on Cukierman’s measure have since gained independence, starting withNew Zealand. (On the evidence of Table 8 at least, the adoption of explicit inflationtargeting is related to past inflation.)
In the wake of the Asian crisis, the Korean and Indonesian central banks gainedlegal independence. In the case of the Bank of Korea, the ‘fully revised Bank ofKorea Act of 1997…establish[ed] the neutrality and autonomy of monetary policy,with price stability declared as the sole objective of the Bank of Korea’ (Oh 2000,p 190). Similarly, in June 1997 the Japanese Diet passed a new Bank ofJapan Law, establishing its independence as of April 1998. A new independentPolicy Board would set monetary policy in an open manner.
25. Cukierman’s measure (1992, pp 373–376) of legal independence includes the aspects of thegovernor’s appointment (term, who appoints, dismissal, restrictions on other jobs), policy formulation(who sets, government involvement, central bank involvement in budget process), clarity of centralbank objective(s) and central bank lending policy (limits, decision-making, counterparties, maturity,interest rates, prohibition on direct funding of government).
26. Another is to suspect that openness, which as noted above may tend to lead to lower inflation, needsto be taken into account (‘partialed out’) in order for the data to line up in a way that permits theinterpretation that independence leads to lower inflation.
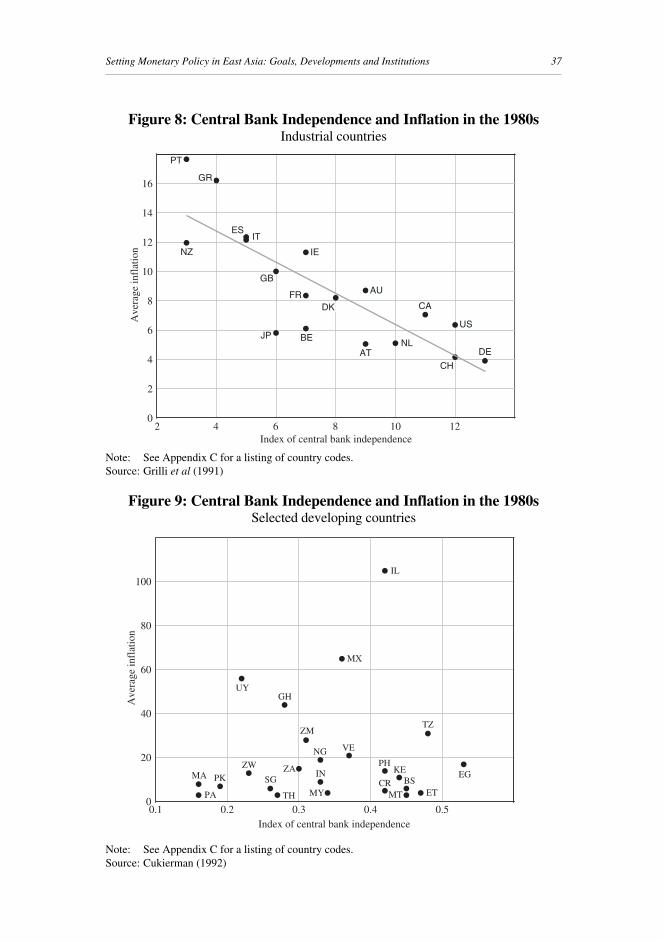
37Setting Monetary Policy in East Asia: Goals, Developments and Institutions
Figure 8: Central Bank Independence and Inflation in the 1980sIndustrial countries
Note: See Appendix C for a listing of country codes.Source: Grilli et al (1991)
Figure 9: Central Bank Independence and Inflation in the 1980sSelected developing countries
Note: See Appendix C for a listing of country codes.Source: Cukierman (1992)
●
●
●
●
●●
●
●
●
●
●
●
●●
●
●
●
●
0
2
4
6
8
10
12
14
16
2 4 6 8 10 12
AU
AT
BE
CADKFR
DE
GR
IE
IT
JPNL
NZ
ES
CH
GB
US
PT
Index of central bank independence
Ave
rage
infl
atio
n
●
●
●●●
●
●
●
●
●
●
●
●
●
●
●
●
●●
●
●
●●
●0
20
40
60
80
100
0.1 0.2 0.3 0.4 0.5
EG
TZ
ETBS
MT
KE
IL
CR
PH
VE
MX
MY
NG
IN
ZM
ZA
GH
SG
TH
ZW
UY
PKMA
PA
Index of central bank independence
Ave
rage
infl
atio
n
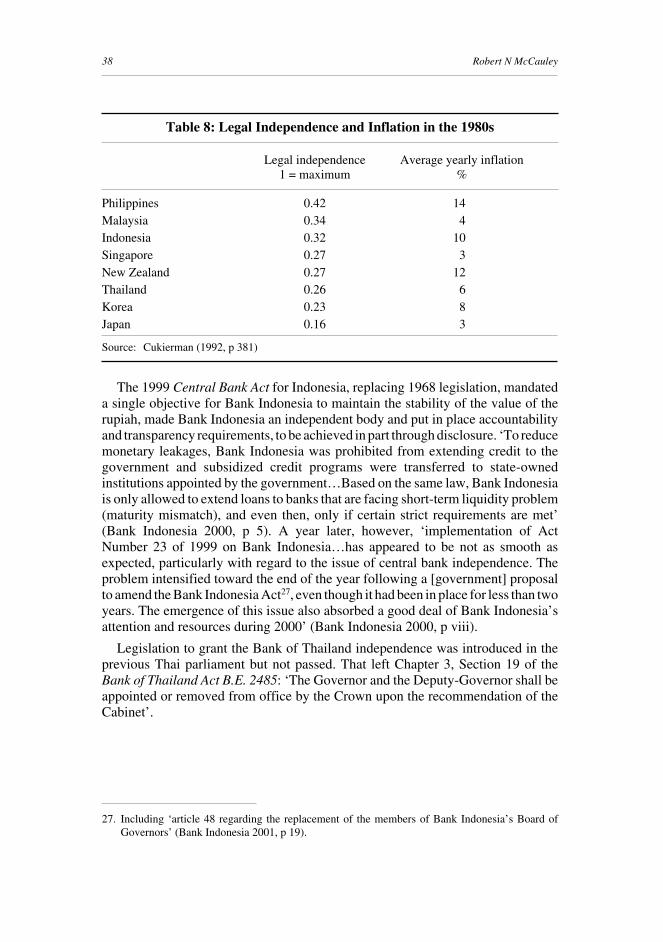
38 Robert N McCauley
Table 8: Legal Independence and Inflation in the 1980s
Legal independence Average yearly inflation1 = maximum %
Philippines 0.42 14Malaysia 0.34 4Indonesia 0.32 10Singapore 0.27 3New Zealand 0.27 12Thailand 0.26 6Korea 0.23 8Japan 0.16 3
Source: Cukierman (1992, p 381)
The 1999 Central Bank Act for Indonesia, replacing 1968 legislation, mandateda single objective for Bank Indonesia to maintain the stability of the value of therupiah, made Bank Indonesia an independent body and put in place accountabilityand transparency requirements, to be achieved in part through disclosure. ‘To reducemonetary leakages, Bank Indonesia was prohibited from extending credit to thegovernment and subsidized credit programs were transferred to state-ownedinstitutions appointed by the government…Based on the same law, Bank Indonesiais only allowed to extend loans to banks that are facing short-term liquidity problem(maturity mismatch), and even then, only if certain strict requirements are met’(Bank Indonesia 2000, p 5). A year later, however, ‘implementation of ActNumber 23 of 1999 on Bank Indonesia…has appeared to be not as smooth asexpected, particularly with regard to the issue of central bank independence. Theproblem intensified toward the end of the year following a [government] proposalto amend the Bank Indonesia Act27, even though it had been in place for less than twoyears. The emergence of this issue also absorbed a good deal of Bank Indonesia’sattention and resources during 2000’ (Bank Indonesia 2000, p viii).
Legislation to grant the Bank of Thailand independence was introduced in theprevious Thai parliament but not passed. That left Chapter 3, Section 19 of theBank of Thailand Act B.E. 2485: ‘The Governor and the Deputy-Governor shall beappointed or removed from office by the Crown upon the recommendation of theCabinet’.
27. Including ‘article 48 regarding the replacement of the members of Bank Indonesia’s Board ofGovernors’ (Bank Indonesia 2001, p 19).
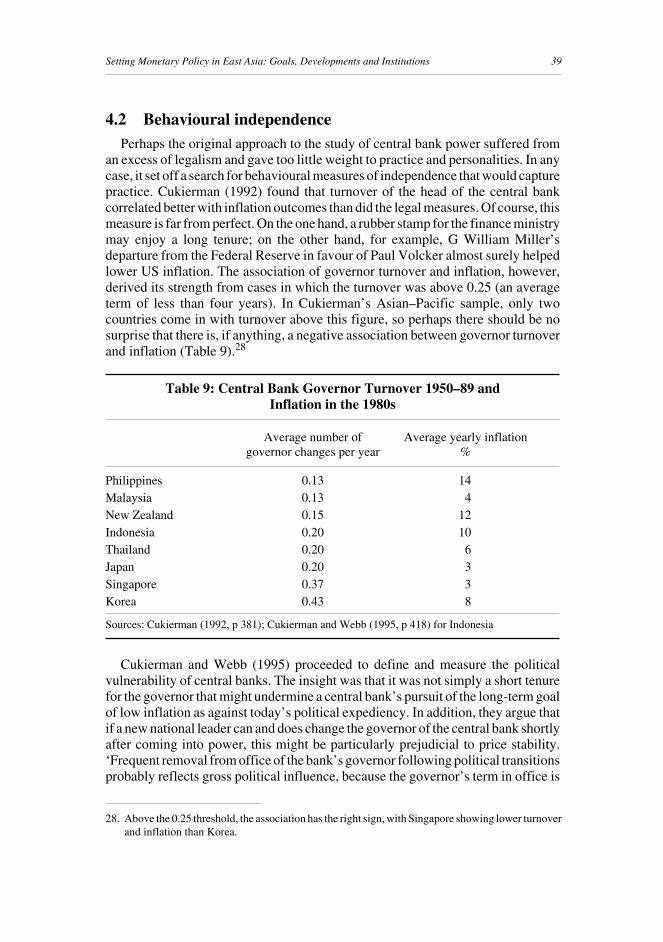
39Setting Monetary Policy in East Asia: Goals, Developments and Institutions
28. Above the 0.25 threshold, the association has the right sign, with Singapore showing lower turnoverand inflation than Korea.
4.2 Behavioural independencePerhaps the original approach to the study of central bank power suffered from
an excess of legalism and gave too little weight to practice and personalities. In anycase, it set off a search for behavioural measures of independence that would capturepractice. Cukierman (1992) found that turnover of the head of the central bankcorrelated better with inflation outcomes than did the legal measures. Of course, thismeasure is far from perfect. On the one hand, a rubber stamp for the finance ministrymay enjoy a long tenure; on the other hand, for example, G William Miller’sdeparture from the Federal Reserve in favour of Paul Volcker almost surely helpedlower US inflation. The association of governor turnover and inflation, however,derived its strength from cases in which the turnover was above 0.25 (an averageterm of less than four years). In Cukierman’s Asian–Pacific sample, only twocountries come in with turnover above this figure, so perhaps there should be nosurprise that there is, if anything, a negative association between governor turnoverand inflation (Table 9).28
Table 9: Central Bank Governor Turnover 1950–89 andInflation in the 1980s
Average number of Average yearly inflationgovernor changes per year %
Philippines 0.13 14Malaysia 0.13 4New Zealand 0.15 12Indonesia 0.20 10Thailand 0.20 6Japan 0.20 3Singapore 0.37 3Korea 0.43 8
Sources: Cukierman (1992, p 381); Cukierman and Webb (1995, p 418) for Indonesia
Cukierman and Webb (1995) proceeded to define and measure the politicalvulnerability of central banks. The insight was that it was not simply a short tenurefor the governor that might undermine a central bank’s pursuit of the long-term goalof low inflation as against today’s political expediency. In addition, they argue thatif a new national leader can and does change the governor of the central bank shortlyafter coming into power, this might be particularly prejudicial to price stability.‘Frequent removal from office of the bank’s governor following political transitionsprobably reflects gross political influence, because the governor’s term in office is
40 Robert N McCauley
not shielded by law or custom from political changes’ (Cukierman and Webb 1995,p 400). They find that the higher the political vulnerability, the higher the inflation.29
Again, the empirical relevance of this work for Asia and the Pacific does notappear all that strong (Table 10). Perhaps, however, the argument should not bedismissed, given the global, if not the regional experience. The record summarisedon Table 10 helps puts some recent events in east Asia into perspective. The effortof the Indonesian head of state and the decision by the new Thai government tochange governors both had precedents in the respective post-war histories throughthe 1980s. In the case of the Philippines, the mooted replacement of the governor bya new president would have been quite at variance with the Philippines’ post-warrecord. Cukierman and Webb would suggest at the margin that the tenure of the twogovernors bode well for lower inflation. Whether the argument can be extended tothe recent replacement of the Thai governor is difficult to say. The turnover at thecentral bank was followed by a raising of interest rates – an action quite at variancewith the theoretical presumptions regarding a new government’s interest in turnoverat the central bank.
29. A window of six months after a political transition was selected to maximise the explanatory powerof this variable in regression analysis of inflation across countries.
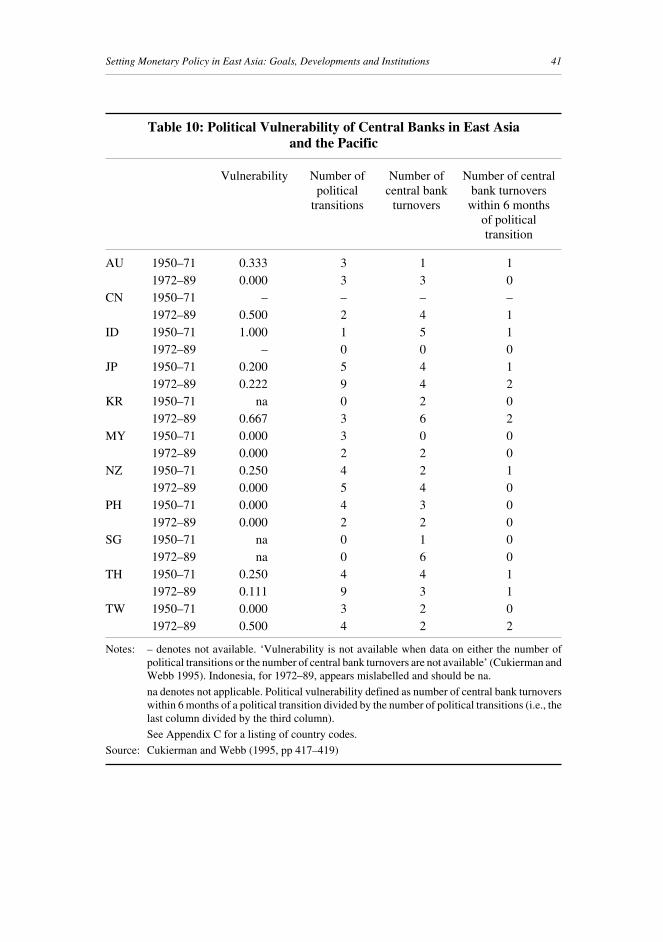
41Setting Monetary Policy in East Asia: Goals, Developments and Institutions
Table 10: Political Vulnerability of Central Banks in East Asiaand the Pacific
Vulnerability Number of Number of Number of centralpolitical central bank bank turnovers
transitions turnovers within 6 monthsof politicaltransition
AU 1950–71 0.333 3 1 11972–89 0.000 3 3 0
CN 1950–71 – – – –1972–89 0.500 2 4 1
ID 1950–71 1.000 1 5 11972–89 – 0 0 0
JP 1950–71 0.200 5 4 11972–89 0.222 9 4 2
KR 1950–71 na 0 2 01972–89 0.667 3 6 2
MY 1950–71 0.000 3 0 01972–89 0.000 2 2 0
NZ 1950–71 0.250 4 2 11972–89 0.000 5 4 0
PH 1950–71 0.000 4 3 01972–89 0.000 2 2 0
SG 1950–71 na 0 1 01972–89 na 0 6 0
TH 1950–71 0.250 4 4 11972–89 0.111 9 3 1
TW 1950–71 0.000 3 2 01972–89 0.500 4 2 2
Notes: – denotes not available. ‘Vulnerability is not available when data on either the number ofpolitical transitions or the number of central bank turnovers are not available’ (Cukierman andWebb 1995). Indonesia, for 1972–89, appears mislabelled and should be na.
na denotes not applicable. Political vulnerability defined as number of central bank turnoverswithin 6 months of a political transition divided by the number of political transitions (i.e., thelast column divided by the third column).
See Appendix C for a listing of country codes.
Source: Cukierman and Webb (1995, pp 417–419)
42 Robert N McCauley
4.3 Balance sheet independenceEvents during the Asian crisis left a mark on the balance sheets of the central banks
of Indonesia, Korea, Malaysia and Thailand. An extreme parallel is offered by thePhilippines, where the debt crisis of the 1980s left the central bank insolvent(Cuisia 1992; Zialcita 1993). The 1993 New Central Bank Act attempts to preventa recurrence.
The balance-sheet aftermath of crisis can, at the limit, impair the capital andweaken the income of the central bank, and thereby hurt its credibility in the marketplace and make it dependent on appropriations. The principle is important even whennone of these results follow. For instance, in the case of the run on, and subsequenteffective takeover of, Continental Illinois by the Federal Deposit InsuranceCorporation in 1984, the Federal Reserve’s discount window advance to the bankremained outstanding for years. In the view of some observers, in allowing thediscount window advance to remain outstanding for so long, the Federal Reservewas inappropriately lending to the solvency-support agency, the FDIC. Even if theFed’s monetary operations were in no way impaired by this arrangement, theprinciple of no Federal Reserve funding of the government was arguably frayed.
It is by no means surprising that, in system-wide financial crises, central bankbalance sheets in Indonesia, Korea, Malaysia and in effect Thailand took some hits.The hope must be that these hits prove temporary, and generally there are groundsfor hope. Last year the Indonesian government took responsibility for losses relatedto Bank Indonesia loans to insolvent banks during the crisis. In Korea, the centralbank has received substantial repayments over the past two years on variouscrisis-related credits. In Malaysia, a bank recapitalisation fund owned by the centralbank has recovered the bulk of the funds advanced to banks.
In the case of Bank Indonesia, three years after the onset of the crisis, the centralbank and government were still arguing about the distribution of losses, mostly fromfunds advanced to Suharto-related banks.30 Bank Indonesia had made discountwindow advances to insolvent banks in the amount of Rp144.5 trillion (aboutUS$13 billion at the current exchange rate) in late 1997 and early 1998. Theseadvances had been transferred from Bank Indonesia to the government in return forgovernment bonds, but the government had threatened to withdraw these bonds inview of questions about the circumstances under which these advances had beenmade and the uses to which the funds had been put. A Parliamentary committeeaccepted Bank Indonesia’s view that the advances had been government policy andthat in any case the government was responsible for Bank Indonesia’s solvency. Latelast year, Bank Indonesia and the government agreed to share this burdenapproximately 1/6– 5/6. Bank Indonesia transferred notes to the government in theamount of Rp24.5 trillion, the terms of which matched the government bonds.Notwithstanding recording this amount as an extraordinary loss, Bank Indonesia
30. This account relies on Bank Indonesia (2001, pp 16-17). There is also a much smaller issue regardingBank Indonesia’s divestment of its equity stakes in banks and non-bank financial institutions (BankIndonesia 2001, p 18)

43Setting Monetary Policy in East Asia: Goals, Developments and Institutions
reported a profit in 2000. This resolution did not signal an improvement in relationsbetween the central bank and the government: three days after the agreement wasreached, the government proposed amendments to the central bank law to theparliament, as discussed above.
The Bank of Korea has worked half its way out of the balance sheet implicationsof the crisis. In 1999, 6.2 trillion won was repaid by the Financial Market StabilisationFund (Bank of Korea 2001b, p 37). In 2000, Korea First Bank, which had been takenover by the government in the crisis but was successfully divested to a foreignpartnership, repaid a 1 trillion won loan. These repayments left 7.4 trillion wonaggregate ceiling credits, which, ‘following the currency crisis of 1997, …had cometo be used as a means of easing the corporate credit crunch, making it difficult forthe central bank’s lending system to perform its original inherent function’ (Bank ofKorea 2001b, p 28).31
Acting in pre-emptive fashion, Bank Negara Malaysia in August 1998 set up anagency known as Danamodal to fortify the capital positions of Malaysian bankinginstitutions adversely affected by a weakening economy and falling asset prices. Inthe event, Danamodal injected 7.6 billion ringgit (US$2 billion) of cash into 10 banksin exchange for subordinated capital instruments convertible into preferred shares,subordinated debt and ordinary shares. The impact on Bank Negara’s balance sheetwas minimised by its making a modest equity investment of 3 billion ringgit (lessthan US$1 billion) and Danamodal’s issuing 11 billion ringgit (US$3 billion)zero-coupon bonds (Danamodal 2001b). By the end of January 2001, the bulk of theinvestments actually made had been redeemed by seven of the beneficiary banks,with a number of redemptions related to the consolidation of the Malaysian bankingsystem (Danamodal 2001a). Whether or not Bank Negara’s equity investment hasat this stage been reduced, the fact that most of Danamodal’s investments into bankshave been repaid implies that the central bank is more than half-way to undoing theeffect of the crisis on its own balance sheet and contingent liabilities.
The Bank of Thailand’s monetary policy-making does not necessarily benefitfrom its management and partial funding of a bank bail out agency, albeit a legallyseparate one. The Financial Institutions Development Fund (FIDF) was founded inthe mid 1980s to permit the Bank of Thailand ‘to relax BOT limitation[s] inimplementing financial-support measures for rehabilitation and development of the
31. This crisis-related expanded use of the aggregate ceiling credits undid some of the progress madesince March 1994,when the Bank of Korea revised its lending facilities. Kim and Kim (1999, p 130)note that ‘since the currency crisis in late 1997, the aggregate credit ceiling has been raised twice [andat least once more] owing to the extreme difficulties faced by SMEs in accessing loans from financialinstitutions because of the severe credit crunch associated with financial sector restructuring. Morespecifically, the ceiling was raised from 3.6 trillion won to 4.6 trillion won with effect frommid-December 1997 and to 5.6 trillion won with effect from March 1998. Furthermore, nosignificant progress has been made so far in the area of flexible adjustment of the discount rate inaccordance with the movement of market interest rates. Since a considerable share of loans throughthe discount window are still directed at SMEs, the discount rate has remained at 5 %’ [3 per centin 2000]. ‘The Bank of Korea increased the Aggregate Credit Ceiling by 2 trillion won (7.6 trillionwon to 9.6 trillion won) as of January 2001 to alleviate the funding difficulties of small and mediumsized enterprises (SMEs) in the course of restructuring’ (Bank of Korea 2001a, pp 4–5).
44 Robert N McCauley
financial institutions to maintain stability in the system…[In particular, the] FIDFcan purchase and lend to illiquid financial institution[s] against many kind[s] ofcollateral other than required by BOT’ and ‘can own a stake in a troubled financialinstitution and take control over the management’ (Bank of Thailand 2000a, 2000c,2000d). It became ‘majority creditor to the closed-down financial institutions suchas the Bangkok Bank of Commerce…[and] the 56 financial institutions [financecompanies] under the supervision of the FRA’ (Bank of Thailand 2000g). The fundshowed negative equity of 202 billion baht (about US$4 billion) at end 2000, eventhough it enjoys a guarantee of the Ministry of Finance on its borrowing. Guarantees,of course, tend to be better budgetary politics than public policy, given the addedexpense of the market’s treatment of guarantees as opposed to ‘full faith and credit’debt and the damage to the bond market of splitting government debt (McCauley andRemolona 2000).
Running and funding the FIDF affects the development of the Bank of Thailand’soperations as well. The FIDF gets the bulk of its funds through the repurchasemarket, where the Bank of Thailand does most of it operations. At present, the Bankof Thailand is a counterparty on all transactions in the repo market. The developmentof a broader market in which private parties transact directly with each other wouldhelp widen the effect of Bank of Thailand operations. But the doubtful capacity ofthe FIDF to fund itself without the Bank of Thailand fronting for it has not promotedthis development. So the central bank’s involvement with a bank bail-out fundaffects the clarity of the country’s fiscal accounts and the central bank’s mission, andalso the development of bond and money markets.
5. ConclusionsMost central banks in east Asia focus on price stability. Given the openness of
some east Asian economies, however, this focus entails quite a bit of attention to theexchange rate. In the case of extremely open Singapore, the effective exchange rateserves as an operating target of a monetary policy geared to price stability, in muchthe same way as the nominal interest rate is managed elsewhere to achieve pricestability. The economies hardest hit by the crisis, and not the most open ones byregional standards, have adopted explicit inflation targeting and the Philippines is onthe road to joining them. Two of the three economies with fixed exchange rates,China and Malaysia, have effective enough capital controls to permit them anindependent interest rate policy. Only Hong Kong can be said to have chosenexchange rate stability and open capital markets over price stability.
Contrary to some readings of the evidence, east Asian economies have notgenerally fallen back into managing their currencies tightly against the dollar.Comparing the ratio of exchange rate to interest rate volatility before and after thecrisis, Indonesia, Korea, the Philippines, Taiwan and Thailand all show much moreexchange rate flexibility. This development came against the background of thesubstantial increase in the openness of economies in the region, which tends to workagainst exchange rate volatility. There remains in the region a capacity, in terms ofreserve levels, and a willingness to use foreign exchange intervention to affect the
45Setting Monetary Policy in East Asia: Goals, Developments and Institutions
exchange rate and several styles of intervention can be discerned. There is also awillingness to use restrictions on financial transactions with non-residents as ameans to limit exchange rate volatility. These restrictions seem able to drive a wedgebetween onshore and offshore interest rates, at least for a time.
Do central banks in east Asia enjoy sufficient independence to be held responsiblefor achieving their goals? Milestones in central bank independence in the regioninclude 1993 in the Philippines, 1997–1998 in Korea and Japan, and 1999 inIndonesia. Any answer must acknowledge that the east Asian evidence has contributedvery little support for several propositions linking central bank independence andinflation: more legal independence results in lower inflation; less turnover at thegovernor level leads to lower inflation; and more job security for governors duringpolitical transitions leads to lower inflation. More attention should be paid to thebalance-sheet independence of central banks. Here there is clear progress inIndonesia, Korea and Malaysia since the crisis in extinguishing central bank creditextended to banks.
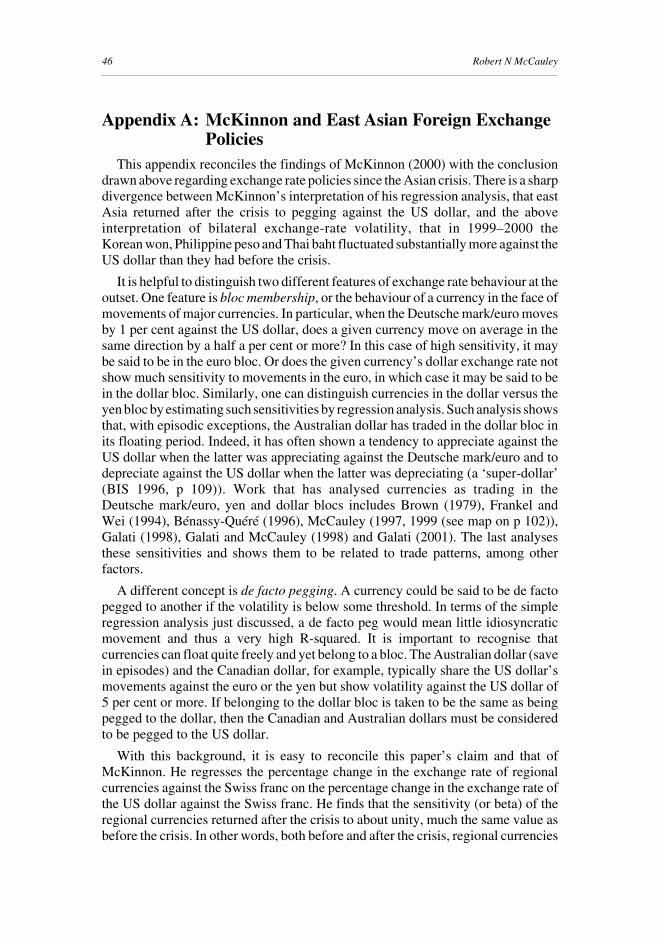
46 Robert N McCauley
Appendix A: McKinnon and East Asian Foreign ExchangePolicies
This appendix reconciles the findings of McKinnon (2000) with the conclusiondrawn above regarding exchange rate policies since the Asian crisis. There is a sharpdivergence between McKinnon’s interpretation of his regression analysis, that eastAsia returned after the crisis to pegging against the US dollar, and the aboveinterpretation of bilateral exchange-rate volatility, that in 1999–2000 theKorean won, Philippine peso and Thai baht fluctuated substantially more against theUS dollar than they had before the crisis.
It is helpful to distinguish two different features of exchange rate behaviour at theoutset. One feature is bloc membership, or the behaviour of a currency in the face ofmovements of major currencies. In particular, when the Deutsche mark/euro movesby 1 per cent against the US dollar, does a given currency move on average in thesame direction by a half a per cent or more? In this case of high sensitivity, it maybe said to be in the euro bloc. Or does the given currency’s dollar exchange rate notshow much sensitivity to movements in the euro, in which case it may be said to bein the dollar bloc. Similarly, one can distinguish currencies in the dollar versus theyen bloc by estimating such sensitivities by regression analysis. Such analysis showsthat, with episodic exceptions, the Australian dollar has traded in the dollar bloc inits floating period. Indeed, it has often shown a tendency to appreciate against theUS dollar when the latter was appreciating against the Deutsche mark/euro and todepreciate against the US dollar when the latter was depreciating (a ‘super-dollar’(BIS 1996, p 109)). Work that has analysed currencies as trading in theDeutsche mark/euro, yen and dollar blocs includes Brown (1979), Frankel andWei (1994), Bénassy-Quéré (1996), McCauley (1997, 1999 (see map on p 102)),Galati (1998), Galati and McCauley (1998) and Galati (2001). The last analysesthese sensitivities and shows them to be related to trade patterns, among otherfactors.
A different concept is de facto pegging. A currency could be said to be de factopegged to another if the volatility is below some threshold. In terms of the simpleregression analysis just discussed, a de facto peg would mean little idiosyncraticmovement and thus a very high R-squared. It is important to recognise thatcurrencies can float quite freely and yet belong to a bloc. The Australian dollar (savein episodes) and the Canadian dollar, for example, typically share the US dollar’smovements against the euro or the yen but show volatility against the US dollar of5 per cent or more. If belonging to the dollar bloc is taken to be the same as beingpegged to the dollar, then the Canadian and Australian dollars must be consideredto be pegged to the US dollar.
With this background, it is easy to reconcile this paper’s claim and that ofMcKinnon. He regresses the percentage change in the exchange rate of regionalcurrencies against the Swiss franc on the percentage change in the exchange rate ofthe US dollar against the Swiss franc. He finds that the sensitivity (or beta) of theregional currencies returned after the crisis to about unity, much the same value asbefore the crisis. In other words, both before and after the crisis, regional currencies
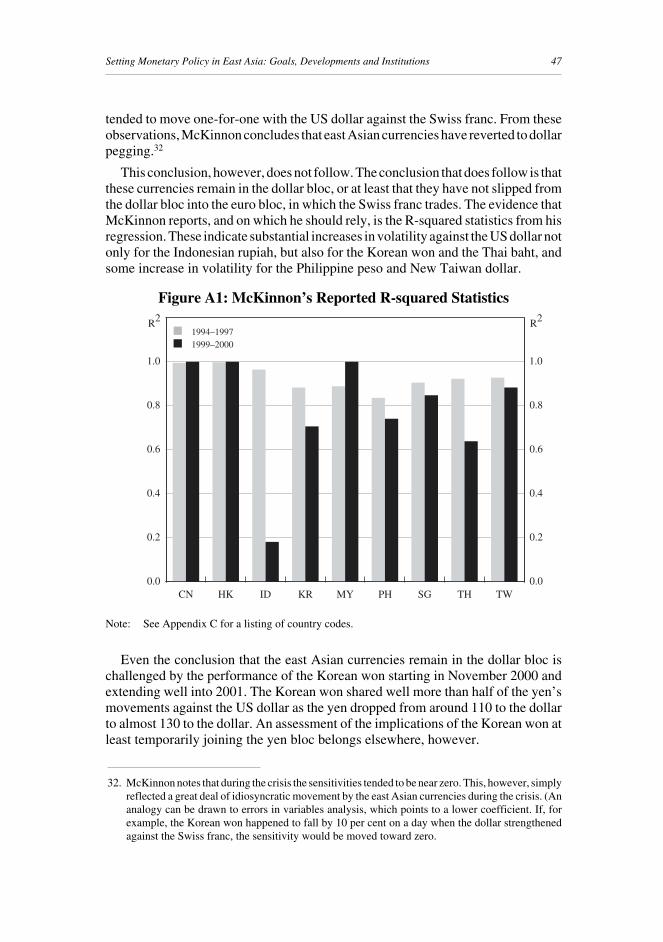
47Setting Monetary Policy in East Asia: Goals, Developments and Institutions
tended to move one-for-one with the US dollar against the Swiss franc. From theseobservations, McKinnon concludes that east Asian currencies have reverted to dollarpegging.32
This conclusion, however, does not follow. The conclusion that does follow is thatthese currencies remain in the dollar bloc, or at least that they have not slipped fromthe dollar bloc into the euro bloc, in which the Swiss franc trades. The evidence thatMcKinnon reports, and on which he should rely, is the R-squared statistics from hisregression. These indicate substantial increases in volatility against the US dollar notonly for the Indonesian rupiah, but also for the Korean won and the Thai baht, andsome increase in volatility for the Philippine peso and New Taiwan dollar.
Figure A1: McKinnon’s Reported R-squared Statistics
Note: See Appendix C for a listing of country codes.
Even the conclusion that the east Asian currencies remain in the dollar bloc ischallenged by the performance of the Korean won starting in November 2000 andextending well into 2001. The Korean won shared well more than half of the yen’smovements against the US dollar as the yen dropped from around 110 to the dollarto almost 130 to the dollar. An assessment of the implications of the Korean won atleast temporarily joining the yen bloc belongs elsewhere, however.
32. McKinnon notes that during the crisis the sensitivities tended to be near zero. This, however, simplyreflected a great deal of idiosyncratic movement by the east Asian currencies during the crisis. (Ananalogy can be drawn to errors in variables analysis, which points to a lower coefficient. If, forexample, the Korean won happened to fall by 10 per cent on a day when the dollar strengthenedagainst the Swiss franc, the sensitivity would be moved toward zero.
0.0
0.2
0.4
0.6
0.8
1.0
0.0
0.2
0.4
0.6
0.8
1.0
CN HK ID MYKR PH SG TH TW
■ 1994–1997■ 1999–2000
R2 R2
48 Robert N McCauley
Appendix B: The Balance of Interest-rate andExchange-rate Volatility Based on Basis PointVolatility
Figure B1: Openness and Volatility of Nominal Effective ExchangeRate and Interest Rate
Notes: Interest rates are defined as 1-year household deposit rate for China; 3-month deposit ratefor Korea, Singapore and Thailand; 1 and 3-month SBI rate for Indonesia for latter andearlier period respectively; 3-month T-bill rate for the Philippines; 3-month money-marketrate for Taiwan and 3-month interbank rate for remaining countries.Interest-rate volatility measured as annualised standard deviation of actual interest ratemovements.
See Appendix C for a listing of country codes.
1999–2000
Exports/GDP ratio
●
●
●●●
●
●
●●●
●●●
●
●
●
●
●
●●●
●
-10
0
10
20
30
0 20 40 60 80 100 120 140 160
● ●
●● ●●
●● ●
●●
●●
●
●●●●
-20
0
20
40
60
80
100
120
Nom
inal
eff
ectiv
e-ex
chan
ge-r
ate
vola
tility
/inte
rest
-rat
e vo
latil
ity r
atio
1995–1996
AU
IDUS
DE
GB
IT
SE
HK SG
MY
BE
NL
NZ
JP
CN
TWTH
FR
PH
XM
MY
HK SG
AU
ID NZ
KR
CA
TW
SEUS GB
JP
CN
CH
PH
TH
CA
CH
KR
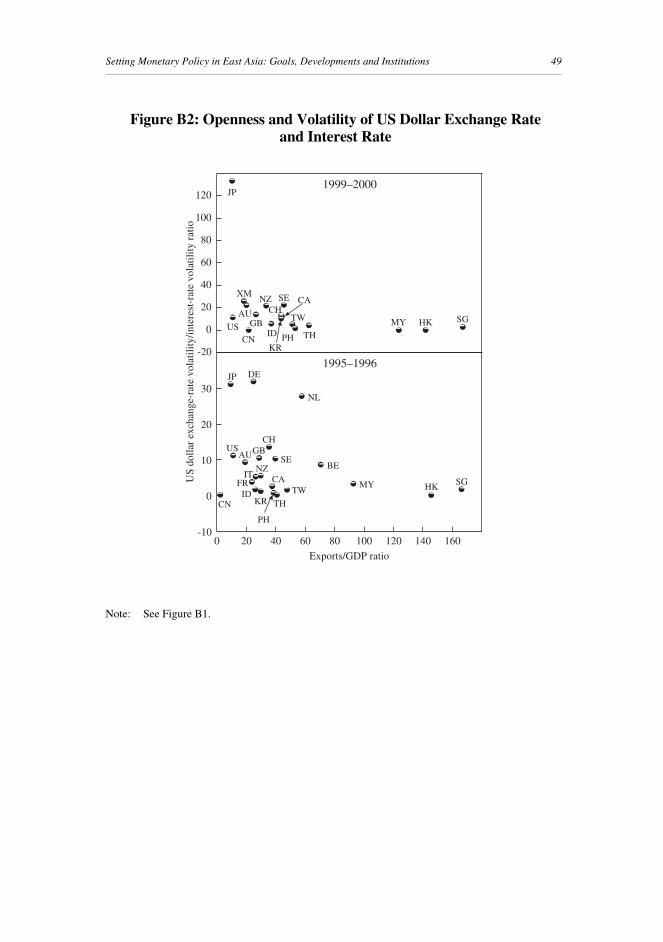
49Setting Monetary Policy in East Asia: Goals, Developments and Institutions
Figure B2: Openness and Volatility of US Dollar Exchange Rate and Interest Rate
Note: See Figure B1.
1999–2000
Exports/GDP ratio
●
●
●●●●
●● ●●●
●
●
●
●
●●
●
●
●●●
-10
0
10
20
30
0 20 40 60 80 100 120 140 160
● ●
●●●
●
●● ●● ●●●
●
●
●●
●
-20
0
20
40
60
80
100
120U
S do
llar
exch
ange
-rat
e vo
latil
ity/in
tere
st-r
ate
vola
tility
rat
io
1995–1996
AU
IDUS
DE
GB
IT
SE
HK SG
MY
BE
NL
NZ
JP
CN
TW
TH
FR
PH
XM
MY
HK SG
AU
ID
NZ
KR
CATW
SEUS GB
JP
CN
CH
PH
TH
CACH
KR
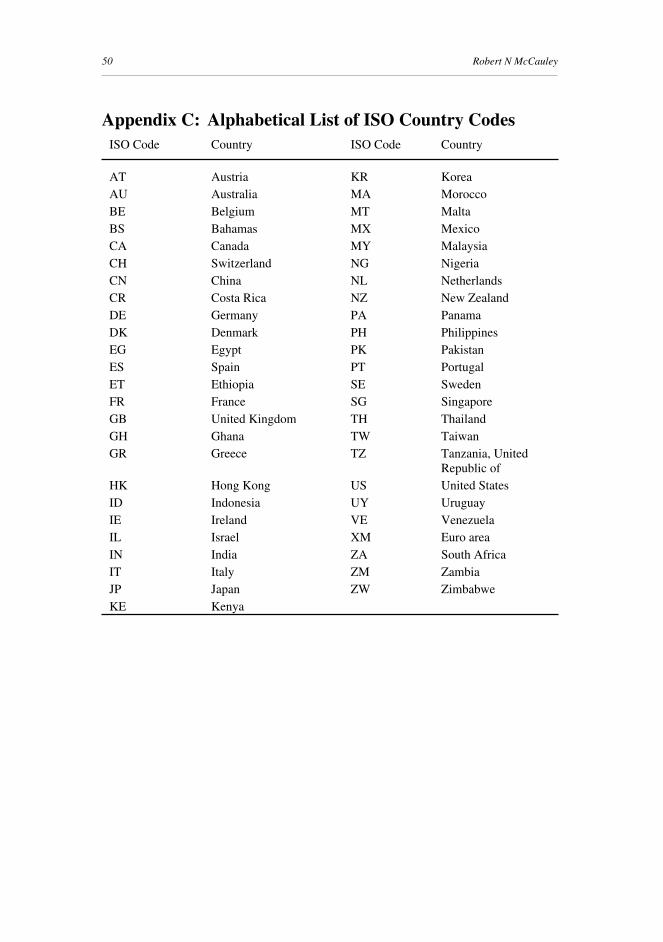
50 Robert N McCauley
Appendix C: Alphabetical List of ISO Country CodesISO Code Country ISO Code Country
AT Austria KR KoreaAU Australia MA MoroccoBE Belgium MT MaltaBS Bahamas MX MexicoCA Canada MY MalaysiaCH Switzerland NG NigeriaCN China NL NetherlandsCR Costa Rica NZ New ZealandDE Germany PA PanamaDK Denmark PH PhilippinesEG Egypt PK PakistanES Spain PT PortugalET Ethiopia SE SwedenFR France SG SingaporeGB United Kingdom TH ThailandGH Ghana TW TaiwanGR Greece TZ Tanzania, United
Republic ofHK Hong Kong US United StatesID Indonesia UY UruguayIE Ireland VE VenezuelaIL Israel XM Euro areaIN India ZA South AfricaIT Italy ZM ZambiaJP Japan ZW ZimbabweKE Kenya
51Setting Monetary Policy in East Asia: Goals, Developments and Institutions
ReferencesAlamsyah H, C Joseph, J Agung and D Zulverdy (2000), ‘Framework for Implementing
Inflation Targeting in Indonesia’, in C Joseph and AH Gunawan (eds), Monetary Policyand Inflation Targeting in Emerging Countries, Proceedings of an InternationalConference, Bank Indonesia and International Monetary Fund, Jakarta, pp 222–255.
Amato JD, S Gerlach and J Hawkins (2001), ‘Inflation Targeting in Emerging Market andTransition Economies: A Survey and Issues’, Bank for International Settlements,mimeo.
Asian Development Bank (2001), Asian Recovery Report 2001, March.
Aziz ZA (2001), ‘BNM Governor Dato’ Dr. Zeti Akhtar Aziz responds to questions postedby THE EDGE on Central Bank’s foreign reserves on 10 March, 2001’, available at<http://www.bnm.gov.my/spch/2001/0312.htm>.
Baltensperger E, AM Fischer and TJ Jordan (2001), ‘Abstaining from Inflation Targets:Understanding SNB Rhetoric in the Inflation Targeting Debate’, mimeo.
Bank for International Settlements (BIS) (1996), 66th Annual Report, Basel, BIS.
BIS (2001), 71st Annual Report, Basel, BIS.
Bank Indonesia (2000), Annual Report 1999, Jakarta, Bank Indonesia.
Bank Indonesia (2001), Annual Report 2000, Jakarta, Bank Indonesia.
Bank of Korea (2001a), Monetary Policy Report, January 2000 – February 2001.
Bank of Korea (2001b), 2000 Annual Report, Seoul, Bank of Korea.
Bank Negara Malaysia (2000), Annual Report 1999, Kuala Lumpur, Bank Negara Malaysia.
Bank Negara Malaysia (2001), Annual Report 2000, Kuala Lumpur, Bank Negara Malaysia.
Bank of Thailand (2000a), Announcement of FIDF’s History and Financial Position, May,available at <http://www.bot.or.th/bothomepage/Special/FIDF/Publications/public_index_E2.htm>.
Bank of Thailand (2000b), Exchange Rate Policy, available at <http://www.bot.or.th/bothomepage/BankAtWork/Monetary&FXPolicies/EXPolicy/8-23-2000-Eng-i/exchange_e.htm>.
Bank of Thailand (2000c), Financial Institutions Development Fund, available at<http://www.bot.or.th/bothomepage/Special/FIDF/Publications/public_index_e.htm>.
Bank of Thailand (2000d), History, Role and Responsibilities of FIDF, available at<http://www.bot.or.th/bothomepage/Special/FIDF/Objectives/History_E.htm>.
Bank of Thailand (2000e), Inflation Report, July.
Bank of Thailand (2000f), Inflation Report, October.
Bank of Thailand (2000g), Operation of Financial Institutions Development Fund, availablea t <h t tp : / /www.bo t .o r . t h /bo thomepage /Spec i a l /F IDF/Pub l i ca t i onsoperation_FIDF.htm>.
Bank of Thailand (2001a), Inflation Report, January.
Bank of Thailand (2001b), Inflation Report, April.
52 Robert N McCauley
Baweja B and P Schymyck (2001), ‘Policy Update: How Loose Can They Get?’, IDEAglobalEconomic Research, 18 May.
Bénassy-Quéré, A (1996), “Exchange Rate Regimes and Policies in Asia”, Centre d’ÉtudesProspectives et d’Informations Internationales (CEPII), Working Paper No 96-07.
Borio CEV, C Furfine and P Lowe (2001), ‘Procyclicality of the financial system andfinancial stability: issues and policy options’, in BIS Papers No 1, Marrying the macro-and microprudential dimensions of financial stability, pp 1–57.
Borio CEV and RN McCauley (1996), The Economics of Recent Bond Yield Volatility, BISEconomic Paper No 45.
Borio CEV and RN McCauley (forthcoming), ‘Comparing Monetary Policy OperatingProcedures in Indonesia, Korea, Malaysia and Thailand’, in GJ de Brouwer (ed),Financial Markets and Policies in East Asia, Routledge, London,pp 253–285.
Brown B (1979), The Dollar–Mark Axis: On Currency Power, Macmillan, London.
Calvo GA and CM Reinhart (2000), ‘Fear of Floating’, NBER Working Paper 7993.
Cargill T and T Ito (2001), ‘The Independence Trap’, in T Cargill, M Hutchson and T Ito (eds),Financial Policy and Central Banking in Japan, MIT Press, Cambridge.
Central Bank of China (CBC) (2000), Annual Report 1999, Taipei, The Central Bank ofChina.
Condon T (2000), ‘HKMA Institutionalises Discretion’, ING Barings, Economics Research,Economic and Policy Watch, 5 October.
Condon T and C Chan (2000), ‘HKMA’s Interest Rate Targeting Policy’, ING Barings,Economics Research, Economic and Policy Watch, 3 July.
Crockett A (2001), ‘Monetary Policy and Financial Stability’, Hong Kong MonetaryAuthority Distinguished Lecture No 4.
Cuisia JL (1992) ‘Opening Statement on CB Net Income Position’, to joint hearing of theCommittees on Economic Affairs, Banks and Ways and Means held at the SenatorsLounge, Manila Hotel, Manila, 2 September.
Cukierman A (1992) Central Bank Strategy, Credibility and Independence: Theory andEvidence, MIT Press, Cambridge.
Cukierman A and SB Webb (1995), ‘Political Influence on the Central Bank: InternationalEvidence’, World Bank Economic Review, 9(3), pp 397–423.
Danamodal Nasional Berhad (Danamodal) (2001a), ‘Chairman’s Statement’, Annual Report,available at <http://www.bnm.gov.my/danamodal/ff_press.htm>.
Danamodal Nasional Berhad (2001b), ‘Financial Statements for the ended 31st December2000’, available at <http://www.bnm.gov.my/danamodal/ff_press.htm>.
Debelle G and S Fischer (1994), ‘How Independent Should a Central Bank Be?’ inJC Fuhrer (ed), Goals, Guidelines, and Constraints Facing Monetary Policymakers,Federal Reserve Bank of Boston Conference Series No 38, pp 195–221.
Dooley MP, R Dornbusch and YC Park (2001), ‘A Framework for Exchange Rate Policy inKorea’, paper presented at KIEP/IMF Conference, ‘Korean Crisis and Recovery’,Seoul, 17–19 May.
53Setting Monetary Policy in East Asia: Goals, Developments and Institutions
Drew A and LC Plantier (2000), ‘Interest Rate Smoothing in New Zealand and Other DollarBloc Countries’, Reserve Bank of New Zealand Economics Department DiscussionPaper No DP2000/10.
Eichengreen B (2001), ‘Strengthening the International Financial Architecture: Open Issues,Asian Concerns’, paper presented at KIEP/IMF Conference, ‘Korean Crisis andRecovery’, Seoul, 17–19 May.
Fischer S (2001), ‘Exchange Rate Regimes: Is the Bipolar View Correct?’ Journal ofEconomic Perspectives, 15(2), pp 3–24.
Flint S (1999), ‘SGD Appreciation: Taylor-Made in 2000’, Bank of America Global MarketsGroup Country Alert, 22 November.
Frankel JA and S-J Wei (1994), ‘Yen Bloc or Dollar Bloc? Exchange Rate Policies of the EastAsian Economies’, in T Ito and AO Krueger (eds) Macroeconomic Linkage: SavingsExchange Rates and Capital Flows, University of Chicago Press, Chicago,pp 295–329.
Fung B, and RN McCauley (2001), ‘Analysing the Growth of Taiwanese Deposits in ForeignCurrency’, BIS Quarterly Review: International Banking and Financial MarketDevelopments, September, pp 49–56.
Galati G (1998), ‘The Role of Major Currencies in Emerging Foreign Exchange Markets’,Bank for International Settlements: International Banking and Financial MarketDevelopments, February, pp 34–37.
Galati G (2001), ‘The dollar–mark axis’, Weltwirtschaftliches Archiv, 137 (1), pp 36–57.
Galati G and RN McCauley (1998), ‘The yen/dollar exchange rate and fluctuations in Asian-Pacific currencies’, BIS Quarterly Review: International Banking and FinancialMarket Developments, November, pp 13–15.
Gang Y and T Xian (2001), ‘On the Choice of the Exchange Rate Regime: An Explanationof the “Corner Solutions” Hypothesis’, China Center for Economic Research, workingpaper, May.
Gerlach S (1999), ‘Who Targets Inflation Explicitly?’ European Economic Review, 43(7),pp 1257–1277.
Grilli VU, D Masciandaro and G Tabellini (1991), ‘Political and Monetary Institutions andPublic Financial Policies in the Industrial Countries’, Economic Policy: A EuropeanForum, No 13, pp 342–392.
Hong Kong Monetary Authority (2001), Annual Report 2000, Hong Kong, HKMA.
Iljas A (2000), ‘Conclusion’, in C Joseph and AH Gunawan (eds), Monetary Policy andInflation Targeting in Emerging Countries, Proceedings of an International Conference,Bank Indonesia and International Monetary Fund, Jakarta, p 283.
Kent C and P Lowe (1997), ‘Asset-price Bubbles and Monetary Policy’, Reserve Bank ofAustralia Research Discussion Paper No 9709.
Khor HE (2000), ‘Discussion’, in C Joseph and AH Gunawan (eds), Monetary Policy andInflation Targeting in Emerging Countries, Proceedings of an International Conference,Bank Indonesia and International Monetary Fund, Jakarta, pp 108–111.
54 Robert N McCauley
Kim S and WT Kim (1999), ‘Recent developments in monetary policy operating procedures:the Korean case’, in Monetary Policy Operating Procedures in Emerging MarketEconomies, BIS Policy Paper No 5, pp 118–168.
Kindleberger CP (1995), ‘Asset Inflation and Monetary Policy’, Banco Nazionale del LavoroQuarterly Review, (98)192, pp 17–37.
Leven R (1999), ‘Hedging Asian Currencies’, presentation to AIMR Global Credit OutlookRoadshow, October, JP Morgan.
Leven R (2001), ‘Asian FX Trading Environment’, Lehman Brothers, June.
McCauley RN (1997), The Euro and the Dollar. Princeton University Essays in InternationalFinance, No 205.
McCauley RN (1999), ‘The Euro and the Dollar, 1998’, Open Economies Review, 10(1),pp 91–133.
McCauley RN and YK Mo (2000), ‘Foreign currency deposits of firms and individuals withbanks in China’, BIS Quarterly Review: International Banking and Financial MarketDevelopments, August, pp 35–39.
McCauley RN and E Remolona (2000), ‘Size and liquidity of government bond markets’, BISQuarterly Review: International Banking and Financial Market Developments,November, pp 52–58.
McCauley RN, JS Ruud and F Iacono (1999), Dodging Bullets: Changing US CorporateCapital Structure in the 1980s and 1990s, MIT Press, Cambridge.
McKinnon RI (2000), ‘After the Crisis, the East Asia Dollar Standard Resurrected: AnInterpretation of High-Frequency Exchange Rate Pegging’, Stanford University,mimeo.
Monetary Authority of Singapore (MAS) (2001a), ‘Singapore’s Exchange Rate Policy’,available at <http://www.mas.gov.sg>.
MAS(2001b), ‘MAS Monetary Policy Statement’, 22 February, available at<http://www.mas.gov.sg>.
MAS Economics Department (2000), ‘Kicking the habit and turning over a new leaf:monetary policy in east Asia after the currency crisis’, Occasional Paper No 21.
MAS Economics Department (2001), ‘Monetary Policy Statement’, Quarterly Bulletin, 3(2),pp ii–v.
Ogawa E (2001), ‘The Japanese Yen as an International Currency’, in YH Kim andY Wang (eds), Regional Financial Arrangements in East Asia: Issues and Prospects,Korea Institute for International Economic Policy, Seoul, pp 25–52.
Oh JG (2000), ‘Discussion of Suitability of Inflation Targeting for Emerging Economies’, inC Joseph and AH Gunawan (eds), Monetary Policy and Inflation Targeting inEmerging Countries, Proceedings of an International Conference, Bank Indonesia andInternational Monetary Fund, Jakarta, pp 190–191.
Patterson R, HC Chong and B Eschweiler (2001), ‘The Singapore Dollar Basket Unpacked’,in JP Morgan Asian Markets Outlook and Strategy, 2 August.
Schaechter A, MR Stone and M Zelmer (2000), ‘Adopting Inflation Targeting: PracticalIssues for Emerging Market Countries’, International Monetary Fund OccasionalPaper No 202.
55Setting Monetary Policy in East Asia: Goals, Developments and Institutions
Stephenson D (1995), ‘Letter to Foreign Exchange Market Participants’, 5 April.
Zialcita EP (1993), ‘Statement on the Central Bank Financial Position’, delivered at theUniversity of the Philippines School of Business Administration, Manila, 13 May.