Embed Size (px)
Citation preview
2006
1234L
AT
VIJA
SB
AN
KA
MONETĀRAIS APSKATS MONETARY REVIEW
MO
NE
TÂ
RA
ISA
PS
KA
TS
MO
NE
TA
RY
RE
VIE
W�
42
00
6�
MONETÂRAIS APSKATS • MONETARY REVIEW 4• 2006
ISSN 1407–2815
© Latvijas Banka, 2007
Pârpublicçjot obligâta avota norâde.The source is to be indicated when reproduced.
Latvijas BankaK. Valdemâra ielâ 2A, Rîgâ, LV-1050Tâlrunis: 6702 2300 Fakss: 6702 2420http://[email protected]ìistrâcijas apliecîba Nr. 1450Iespiests "Premo"
Latvijas Banka (Bank of Latvia)K. Valdemâra ielâ 2A, Riga, LV-1050, LatviaTel.: +371 6702 2300 Fax: +371 6702 2420http://[email protected] of Registration No. 1450Printed by Premo
SATURS
Saîsinâjumi 4Ievads 5Ârçjâ ekonomiskâ vide 6Ârçjâ sektora attîstîba 8
Ârçjâ tirdzniecîba un konkurçtspçja 8Maksâjumu bilance 10
Iekðzemes ekonomiskâ aktivitâte 11Kopçjais pieprasîjums 11Kopçjais piedâvâjums 12Nodarbinâtîba un darba samaksa 13
Cenu dinamika 14Fiskâlais sektors 15Monetârâ un finanðu attîstîba 17
Banku likviditâte un Latvijas Bankas operâcijas 17Naudas râdîtâju dinamika 18
Procentu likmes 22Valûtas un vçrtspapîru tirgus attîstîba 24MFI darbîba 27Naudas râdîtâju sezonâlâ izlîdzinâðana 27Latvijas Bankas starpbanku maksâjumu sistçmu statistika 30Kredîtiestâþu maksâjumu statistika 31
Maksâðanas lîdzekïi 31Konti 33Kredîtiestâþu konti MFI 34Norçíinu kartes 34Bankomâti un norçíinu karðu pieòemðanas vietas 35
Latvijas Bankas pamatuzdevumu izpildes normatîvâs aktualitâtes 36Statistiskâ informâcija 69Papildinformâcija 135
CONTENTS
Abbreviations 4Introduction 36External Economic Environment 37External Sector Developments 39
Foreign Trade and Competitiveness 39Balance of Payments 41
Domestic Economic Activity 42Aggregate Demand 42Aggregate Supply 43Employment, Wages and Salaries 44
Price Dynamics 45Fiscal Sector 46Monetary and Financial Developments 48
Bank Liquidity and the Bank of Latvia's Operations 48Dynamics of Monetary Aggregates 50
Interest Rates 54Foreign Exchange and Securities Market Developments 56MFI Developments 58Seasonal Adjustment of Monetary Aggregates 59Statistics Relating to the Bank of Latvia Interbank Payment Systems 62Credit Institution Payment Statistics 63
Payment Instruments 63Accounts 65Credit Institution Accounts with MFIs 66Payment Cards 66Automated Teller Machines and Points of Sale 66
Highlights of Resolutions and Regulations Adopted in Pursuitof the Bank of Latvia's Main Tasks 67Statistics 69Additional Information 138
3
4
MONETÂRAIS APSKATS · MONETARY REVIEW
SAÎSINÂJUMI
AS – akciju sabiedrîbaASV – Amerikas Savienotâs ValstisBALTIX – vienotais Baltijas valstu birþu kapitalizâcijas indekssCSP – Latvijas Republikas Centrâlâ statistikas pârvaldeECB – Eiropas Centrâlâ bankaEKS – Latvijas Bankas elektroniskâ klîringa sistçmaEMS – Ekonomikas un monetârâ savienîbaES – Eiropas SavienîbaES8 valstis – Èehija, Igaunija, Latvija, Lietuva, Polija, Slovâkija,Slovçnija, UngârijaES10 valstis – valstis, kuras pievienojâs ES 2004. gada 1. maijâES15 valstis – valstis, kuras ietilpa ES pirms 2004. gada 1. maijaFRS – Federâlo rezervju sistçmaIKP – iekðzemes kopproduktsLCD – Latvijas Centrâlais depozitârijsMFI – monetârâ finanðu iestâdeNVS – Neatkarîgo Valstu SavienîbaPVN – pievienotâs vçrtîbas nodoklisRFB – Rîgas Fondu birþaRIGIBOR – Riga Interbank Offered Rate; Latvijas starpbankukredîtu procentu likmju indekssRIGSE (ar 2005. gada 3. oktobri – OMX Riga) – kapitalizâcijasindekss, kas tiek attiecinâts pret iepriekðçjo vçrtîbu un raksturokopçjo ieguldîjuma atdevi un kurâ ietvertas visas RFB Oficiâlâun Otrâ saraksta uzòçmumu akcijasROA – aktîvu atdeveROE – kapitâla atdeveSAMS – Latvijas Bankas starpbanku automatizçtâ maksâjumusistçmaSIA – sabiedrîba ar ierobeþotu atbildîbuSPCI – saskaòotais patçriòa cenu indekssVAS – valsts akciju sabiedrîbaVKM II – Valûtas kursa mehânisms II
ABBREVIATIONS
BALTIX – Pan-Baltic capitalisation-weighted chain-linked totalreturn indexCIS – Commonwealth of Independent StatesCPI – Consumer Price IndexCSB – Central Statistical Bureau of LatviaECB – European Central BankEKS – Bank of Latvia's Electronic Clearing SystemEMU – Economic and Monetary UnionERM II – Exchange Rate Mechanism IIEU – European UnionEU8 – Czech Republic, Estonia, Hungary, Latvia, Lithuania,Poland, Slovakia, SloveniaEU10 – countries which joined the EU on May 1, 2004EU15 – EU countries before May 1, 2004FRS – Federal Reserve SystemGDP – gross domestic productHICP – Harmonised Index of Consumer PricesJSC – joint stock companyLCD – Latvian Central DepositoryMFI – monetary financial institutionRIGIBOR – Riga Interbank Offered RateRIGSE (as of October 3, 2005 – OMX Riga) – capitalisation-based total return index including all company shares quoted onthe RSE Official List and the RSE Second ListROA – return on assetsROE – return on equityRSE – Riga Stock ExchangeSAMS – Bank of Latvia's Interbank Automated Payment SystemSJSC – state joint stock companyUK – United KingdomUS – United States of America
5
4 · 2006
IEVADS
Strauja, bet nesabalansçta Latvijas tautsaimniecîbas izaugsme turpinâjâs arî2006. gada 4. ceturksnî. Tâs virzîtâji joprojâm bija iekðzemes pieprasîjuma kompo-nenti – rekordlielais privâtais patçriòð un stabili augstais investîciju pieaugums.Ârçjais pieprasîjums bija samçrâ augsts, bet ar lejupvçrstu pârmaiòu tendenci.Eksporta pieauguma temps samazinâjâs, un spçcîgâ iekðzemes pieprasîjumanoteiktais importa kâpums palielinâja tekoðâ konta deficîtu. Pieprasîjuma spiedienaietekmç paaugstinâjâs inflâcijas (galvenokârt – pamatinflâcijas) lîmenis. Lai ganturpinâja palielinâties noguldîjumu atlikums bankâs, kreditçðanas pieaugumugalvenokârt nodroðinâja ârvalstu MFI finansçjums, tâdçjâdi palielinot Latvijasârçjo parâdu. Gandrîz nemainîjâs naudas piedâvâjuma kâpums: decembrî plaðâsnaudas M3 un iekðzemes noguldîjumu atlikuma gada pieauguma temps sasniedzaattiecîgi 40.3% un 41.0%. Saglabâjoties lielam pieprasîjumam pçc mâjokïiem,kredîtu atlikuma, îpaði mâjsaimniecîbâm mâjokïa iegâdei izsniegto kredîtuatlikuma, pieauguma temps bija straujð, lai gan augstâs bâzes ietekmç nedaudzsamazinâjâs (no 59.5% septembrî lîdz 58.4% decembrî). Kredîtu procentu likmjupieaugumam pagaidâm nozîmîgas ietekmes nebija, un stabili palielinâjâs arî finanðuiestâdçm un nefinanðu sabiedrîbâm izsniegto kredîtu atlikums. 2006. gadâ valstskonsolidçtâ kopbudþeta finansiâlais deficîts bija 0.9% no IKP, 2006. gada divospçdçjos mçneðos budþeta izdevumiem ievçrojami pârsniedzot ieòçmumus unpalielinot jau tâ augsto iekðzemes pieprasîjumu. Ðâda budþeta izdevumu eskalâcijanav adekvâta situâcijâ, kad tautsaimniecîbai raksturîga strauja izaugsme.
2006. gada 4. ceturksnî IKP gada pieaugums sasniedza 11.7% (2006. gadâ kopumâ –11.9%). Arî 4. ceturksnî saglabâjâs lîdzðinçjâs tendences – ïoti liels privâtâ patçriòaun importa pieaugums, lçnâks eksporta pieauguma temps un straujâka to nozaruattîstîba, kas piedâvâ preces un pakalpojumus iekðzemes tirgum, nevis eksportam.Mazumtirdzniecîbas apgrozîjuma tâlâku strauju izaugsmi noteica ilglietojuma pre-èu dinamiskais pieprasîjums. Pasliktinâjâs dzelzceïa un ostu darbîbas râdîtâji, betpalielinâjâs automobiïu kravu pârvadâjumu apjoms un pa cauruïvadu transportçtonaftas produktu apjoms, uzlabojâs arî Rîgas lidostas darbîbas un sakaru nozaresrâdîtâji. Saglabâjâs mçrens apstrâdes rûpniecîbas pieauguma temps. Vienlaikusturpinâja palçninâties eksporta kâpuma temps. Latvijas Bankas prognozes liecina,ka 2007. gadâ nedaudz samazinâsies kopçjâs pievienotâs vçrtîbas kâpums. Tas sais-tîts ar iekðzemes pieprasîjuma pieauguma palçninâðanos tâ augstâs bâzes dçï, kâarî reâlo kredîtu procentu likmju kâpuma, darbaspçka trûkuma un augstâs inflâcijasietekmç. Gaidâma arî mçrenâka ârçjâ pieprasîjuma palielinâðanâs.
Darbaspçka tirgû turpinâjâs iepriekðçjos mçneðos vçrojamâs tendences – nodar-binâtîbas pieaugums, augoðs darbaspçka trûkums un darba algu kâpums. Bezdarbalîmenis decembrî saruka lîdz 6.5%.
Arvien lielâks kïûst importa pârsvars pâr eksportu, lîdz ïoti augstam lîmenim pa-lielinot maksâjumu bilances tekoðâ konta deficîtu, kas 2006. gadâ sasniedza 21.1%no IKP (2005. gadâ – 12.6%), bet 4. ceturksnî – 26.3% no IKP. Deficîta kâpumuvisvairâk ietekmçja preèu bilances negatîvâ saldo pieaugums, jo importa kâpumsgada laikâ (29.3%) bija vairâk nekâ divreiz straujâks par eksporta pieaugumu(11.6%). Nepiecieðamo finansçjumu nodroðinâja ârvalstu tieðâs investîcijas (35.1%no tekoðâ konta deficîta) un aizòçmumi (galvenokârt banku ilgtermiòa aizòçmumino mâtesbankâm). Tekoðâ konta deficîtu sedza ilgtermiòa kapitâls. Neto ârvalstutieðo investîciju apjoms pieauga 2.5 reizes.
Latvijas Banka turpinâja îstenot ierobeþojoðu monetâro politiku, jo noturîgais inflâ-cijas lîmenis, tekoðâ konta negatîvais saldo un kreditçðanas veicinâtâ tautsaimnie-cîbas izaugsme pârsniedza ilgtermiòâ uzturamu lîmeni. Òemot vçrâ makroekono-miskâs attîstîbas tendences Latvijâ un procentu likmju kâpumu eiro zonâ, Latvijas
6
MONETÂRAIS APSKATS · MONETARY REVIEW
Banka ar 2006. gada 17. novembri par 0.5 procentu punktiem (lîdz 5.0%) paaug-stinâja refinansçðanas likmi. Par 0.5 procentu punktiem (attiecîgi lîdz 6.0%, 7.0%un 8.0%) tika paaugstinâtas arî lombarda kredîtu procentu likmes aizdevumiemar izmantoðanas termiòu pçdçjo 30 dienu laikâ lîdz 10 dienâm, no 11 lîdz 20 dienâmun 21 dienu un ilgâk.
Centrâlâs bankas naudas piedâvâjuma apjomu oktobrî bûtiski ietekmçja ârvalstuvalûtas pirkðana no bankâm, un 4. ceturksnî Latvijas Bankas tîrie ârçjie aktîvipalielinâjâs par 196.1 milj. latu, gadâ pieaugot par 73.7%. Emitçtâs nacionâlâsvalûtas segums ar Latvijas Bankas tîrajiem ârçjiem aktîviem decembra beigâs bija107.4%.
ÂRÇJÂ EKONOMISKÂ VIDE
Pasaules tautsaimniecîba kopumâ 4. ceturksnî turpinâja veiksmîgi attîstîties. Eirozonas un Âzijas reìiona valstîs bija vçrojams tautsaimniecîbas izaugsmes tempapaâtrinâjums. Strauja ekonomiskâ attîstîba turpinâjâs arî ES8 valstîs. Pasaules eko-nomisko attîstîbu 4. ceturksnî nozîmîgi ietekmçja naftas cenu kritums salîdzinâ-jumâ ar vasaras vidu, vienlaikus mazinot inflâcijas draudus nâkotnç. Naftas cenasoktobrî sasniedza 2006. gada minimumu – 55 ASV dolârus par barelu (gada beigâs –59 ASV dolâri par barelu).
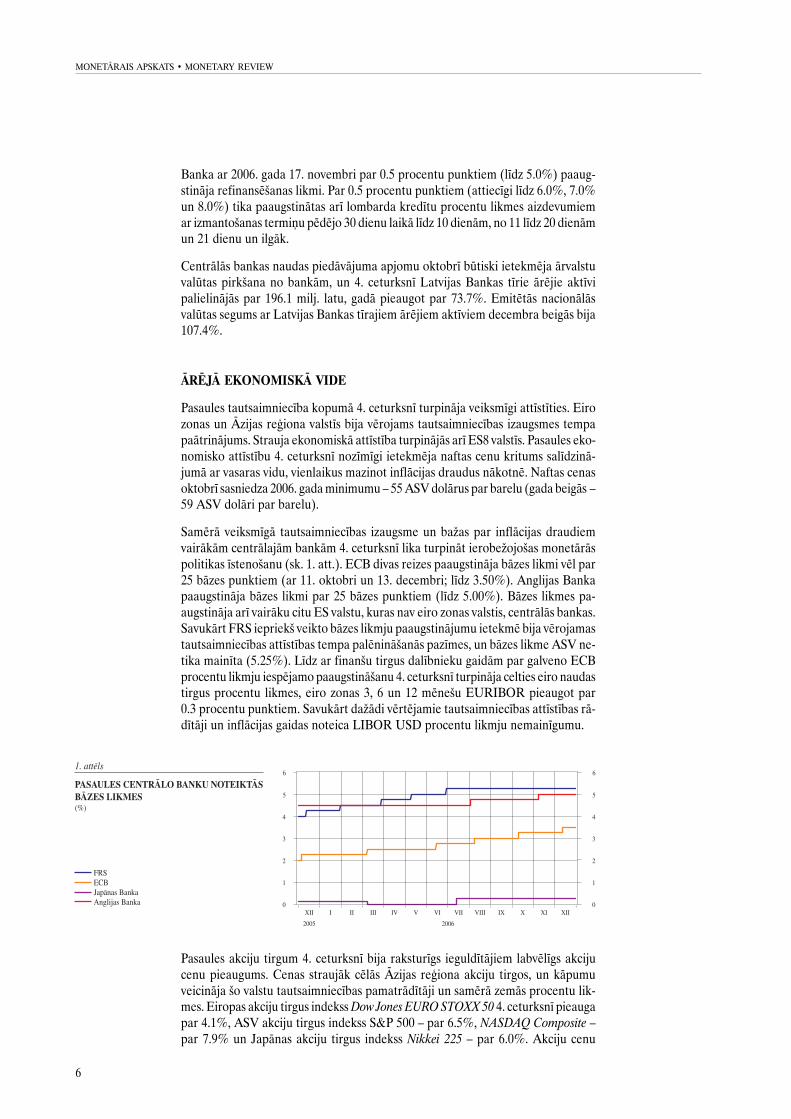
Samçrâ veiksmîgâ tautsaimniecîbas izaugsme un baþas par inflâcijas draudiemvairâkâm centrâlajâm bankâm 4. ceturksnî lika turpinât ierobeþojoðas monetârâspolitikas îstenoðanu (sk. 1. att.). ECB divas reizes paaugstinâja bâzes likmi vçl par25 bâzes punktiem (ar 11. oktobri un 13. decembri; lîdz 3.50%). Anglijas Bankapaaugstinâja bâzes likmi par 25 bâzes punktiem (lîdz 5.00%). Bâzes likmes pa-augstinâja arî vairâku citu ES valstu, kuras nav eiro zonas valstis, centrâlâs bankas.Savukârt FRS iepriekð veikto bâzes likmju paaugstinâjumu ietekmç bija vçrojamastautsaimniecîbas attîstîbas tempa palçninâðanâs pazîmes, un bâzes likme ASV ne-tika mainîta (5.25%). Lîdz ar finanðu tirgus dalîbnieku gaidâm par galveno ECBprocentu likmju iespçjamo paaugstinâðanu 4. ceturksnî turpinâja celties eiro naudastirgus procentu likmes, eiro zonas 3, 6 un 12 mçneðu EURIBOR pieaugot par0.3 procentu punktiem. Savukârt daþâdi vçrtçjamie tautsaimniecîbas attîstîbas râ-dîtâji un inflâcijas gaidas noteica LIBOR USD procentu likmju nemainîgumu.
Pasaules akciju tirgum 4. ceturksnî bija raksturîgs ieguldîtâjiem labvçlîgs akcijucenu pieaugums. Cenas straujâk cçlâs Âzijas reìiona akciju tirgos, un kâpumuveicinâja ðo valstu tautsaimniecîbas pamatrâdîtâji un samçrâ zemâs procentu lik-mes. Eiropas akciju tirgus indekss Dow Jones EURO STOXX 50 4. ceturksnî pieaugapar 4.1%, ASV akciju tirgus indekss S&P 500 – par 6.5%, NASDAQ Composite –par 7.9% un Japânas akciju tirgus indekss Nikkei 225 – par 6.0%. Akciju cenu
7
4 · 2006
kâpums turpinâjâs arî ES8 valstîs – Dow Jones STOXX EU Enlarged 15 4. ceturksnîpieauga par 19.6%. Krievijas akciju tirgus indekss RTS palielinâjâs par 23.4% unÍînas akciju tirgus indekss SSE A Share – pat par 50.1%. ECB lçmumi par galvenoprocentu likmju celðanu, tirgus dalîbniekiem gaidot arî tâlâku procentu likmjukâpumu, mazinâja ienesîguma lîknes slîpumu, Vâcijas valdîbas 10 gadu obligâcijupeïòas likmei palielinoties par 0.25 procentu punktiem. Ienesîguma lîknes slîpumsASV, valdîbas 10 gadu obligâciju peïòas likmei pieaugot par 0.07 procentu pun-ktiem, 4. ceturksnî saglabâjâs negatîvs.
ASV IKP 4. ceturksnî palielinâjâs straujâk nekâ iepriekðçjos divos ceturkðòos –par 2.2%. Tas varçtu liecinât par gada vidû mâjokïu tirgus stagnâcijas izraisîtoASV tautsaimniecîbas lejupslîdes pârvarçðanu. Strauji pieauga privâtais un valdîbaspatçriòð, kâ arî eksports, bet mâjokïu iegâdei un uzòçmçjdarbîbâ ieguldîto in-vestîciju apjoms saruka. Rûpnieciskâs raþoðanas apjoms pçc trîs mçneðus ilguðâkrituma decembrî atkal pieauga (salîdzinâjumâ ar iepriekðçjo mçnesi – par 0.5%).Inflâcija ASV 4. ceturksnî nedaudz pazeminâjâs.
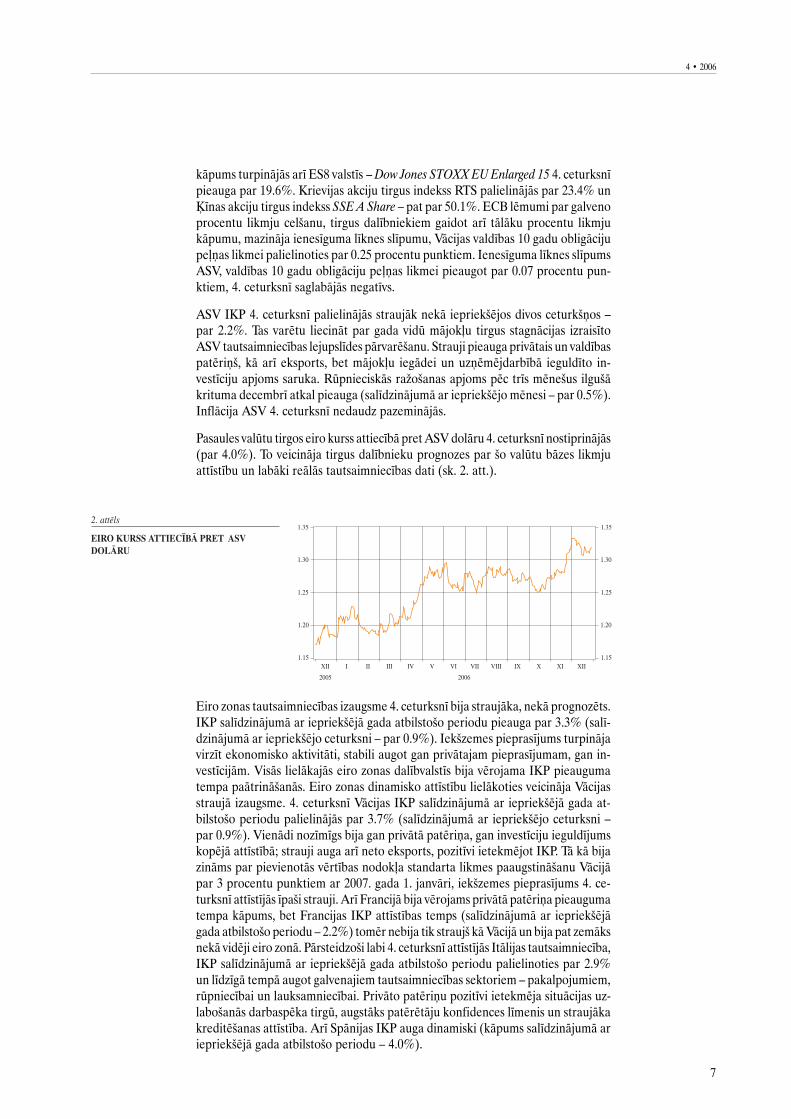
Pasaules valûtu tirgos eiro kurss attiecîbâ pret ASV dolâru 4. ceturksnî nostiprinâjâs(par 4.0%). To veicinâja tirgus dalîbnieku prognozes par ðo valûtu bâzes likmjuattîstîbu un labâki reâlâs tautsaimniecîbas dati (sk. 2. att.).
Eiro zonas tautsaimniecîbas izaugsme 4. ceturksnî bija straujâka, nekâ prognozçts.IKP salîdzinâjumâ ar iepriekðçjâ gada atbilstoðo periodu pieauga par 3.3% (salî-dzinâjumâ ar iepriekðçjo ceturksni – par 0.9%). Iekðzemes pieprasîjums turpinâjavirzît ekonomisko aktivitâti, stabili augot gan privâtajam pieprasîjumam, gan in-vestîcijâm. Visâs lielâkajâs eiro zonas dalîbvalstîs bija vçrojama IKP pieaugumatempa paâtrinâðanâs. Eiro zonas dinamisko attîstîbu lielâkoties veicinâja Vâcijasstraujâ izaugsme. 4. ceturksnî Vâcijas IKP salîdzinâjumâ ar iepriekðçjâ gada at-bilstoðo periodu palielinâjâs par 3.7% (salîdzinâjumâ ar iepriekðçjo ceturksni –par 0.9%). Vienâdi nozîmîgs bija gan privâtâ patçriòa, gan investîciju ieguldîjumskopçjâ attîstîbâ; strauji auga arî neto eksports, pozitîvi ietekmçjot IKP. Tâ kâ bijazinâms par pievienotâs vçrtîbas nodokïa standarta likmes paaugstinâðanu Vâcijâpar 3 procentu punktiem ar 2007. gada 1. janvâri, iekðzemes pieprasîjums 4. ce-turksnî attîstîjâs îpaði strauji. Arî Francijâ bija vçrojams privâtâ patçriòa pieaugumatempa kâpums, bet Francijas IKP attîstîbas temps (salîdzinâjumâ ar iepriekðçjâgada atbilstoðo periodu – 2.2%) tomçr nebija tik straujð kâ Vâcijâ un bija pat zemâksnekâ vidçji eiro zonâ. Pârsteidzoði labi 4. ceturksnî attîstîjâs Itâlijas tautsaimniecîba,IKP salîdzinâjumâ ar iepriekðçjâ gada atbilstoðo periodu palielinoties par 2.9%un lîdzîgâ tempâ augot galvenajiem tautsaimniecîbas sektoriem – pakalpojumiem,rûpniecîbai un lauksamniecîbai. Privâto patçriòu pozitîvi ietekmçja situâcijas uz-laboðanâs darbaspçka tirgû, augstâks patçrçtâju konfidences lîmenis un straujâkakreditçðanas attîstîba. Arî Spânijas IKP auga dinamiski (kâpums salîdzinâjumâ ariepriekðçjâ gada atbilstoðo periodu – 4.0%).
8
MONETÂRAIS APSKATS · MONETARY REVIEW
Lielbritânijas IKP 4. ceturksnî salîdzinâjumâ ar iepriekðçjo ceturksni pieauga par0.8%. Izaugsmes virzîtâjspçks bija pakalpojumu sektora attîstîba, îpaði viesnîcuun restorânu nozare, bet rûpnieciskâ raþoðana stagnçja ârçjâ pieprasîjuma svârstî-guma un Lielbritânijas sterliòu mârciòas kursa kâpuma dçï. Tomçr inflâcija Liel-britânijâ bija virs mçría inflâcijas lîmeòa, tâpçc, lai gan tautsaimniecîbas attîstîbasperspektîvas bija labas, Anglijas Banka novembrî paaugstinâja bâzes likmi.
Zviedrijâ 4. ceturksnî IKP salîdzinâjumâ ar iepriekðçjo ceturksni pieauga par 1.2%.Tautsaimniecîbai attîstoties, palielinâjâs kreditçðanas apjoms un nekustamâ îpa-ðuma cenas, lai gan inflâcija saglabâjâs samçrâ zema. Tas skaidrojams ar augstoproduktivitâtes lîmeni: firmas spçja saraþot vairâk produkcijas, nepiesaistot papildudarbaspçku, tâpçc nebija ievçrojama darba algu spiediena uz inflâciju. Tomçr,òemot vçrâ nâkotnes prognozes un cenu stabilitâtes riskus, Sveriges Riksbank arî4. ceturksnî turpinâja palielinât bâzes likmi.
4. ceturksnî saglabâjâs samçrâ dinamisks ES8 valstu tautsaimniecîbas izaugsmestemps. Igaunijas IKP salîdzinâjumâ ar iepriekðçjâ gada atbilstoðo periodu pieaugapar 11.2%, un kâpumu noteica rûpniecîbas un tirdzniecîbas izaugsme un transportapakalpojumu un finanðu nozares attîstîba. Ïoti strauji auga arî Slovâkijas IKP –4. ceturksnî tas salîdzinâjumâ ar iepriekðçjâ gada atbilstoðo periodu pieauga par9.5%. Izlietojumâ bija nozîmîga gan ârçjâ, gan iekðçjâ pieprasîjuma loma; izaugsminoteica rûpniecîbas, vairumtirdzniecîbas un finanðu pakalpojumu attîstîba. LietuvasIKP palielinâjâs lçnâk (par 7.0%), izaugsmi veicinot galvenokârt bûvniecîbas unfinanðu pakalpojumu attîstîbai. Polijas IKP pieaugums sasniedza 6.6%, jo iekðzemespieprasîjuma ietekmç auga investîcijas pamatkapitâlâ un privâtais patçriòð. Un-gârijas IKP pieauga lçnâk – par 3.4%. Inflâcija daudzâs ES8 valstîs arî 4. ceturksnîsaglabâjâs samçrâ augsta. Decembrî augstâkâ inflâcija bija Latvijâ (6.8%), Ungârijâ(6.6%) un Igaunijâ (5.1%), bet Polijâ un Èehijâ tâ bija zemâka nekâ vidçji ES(attiecîgi 1.4% un 1.6%).
Krievijas tautsaimniecîba 2006. gada pirmajos deviòos mçneðos attîstîjâs veiksmîgi,un arî 4. ceturksnî turpinâjâs strauja izaugsme. Decembrî ievçrojami palielinâjâsmazumtirdzniecîbas apgrozîjuma apjoms (salîdzinâjumâ ar iepriekðçjâ gada at-bilstoðo periodu – par 14.8%), jo iedzîvotâju ienâkumi pieauga. Vienlaikus rûp-nieciskâs raþoðanas kâpuma temps pçc straujâ pieauguma oktobrî un novembrîdecembrî bija lçnâks. Lai gan 2006. gada pçdçjos mçneðos bija vçrojams nozîmîgsimporta kâpums, Krievijas ârçjâs tirdzniecîbas bilance tomçr saglabâjâs pozitîva,jo dinamiski attîstîjâs eksports.
ÂRÇJÂ SEKTORA ATTÎSTÎBA
Ârçjâ tirdzniecîba un konkurçtspçja
Latvijas ârçjâs tirdzniecîbas izaugsme 4. ceturksnî salîdzinâjumâ ar iepriekðçjâgada atbilstoðo periodu kïuva mçrenâka. Tirdzniecîbas apgrozîjums sasniedza2.7 mljrd. latu, eksportam palielinoties par 9.1%, bet importam – par 24.5%. Jo-projâm augoðâ iekðzemes pieprasîjuma ietekmç importa apjoms divas reizes pâr-sniedza eksporta apjomu. Eksporta pieauguma palçninâðanos noteica augstais iekð-zemes pieprasîjums un konkurçtspçjas samazinâðanâs.
Latvijas preèu eksportâ 4. ceturksnî salîdzinâjumâ ar iepriekðçjâ gada atbilstoðoperiodu vislielâkais bija koka un koka izstrâdâjumu, parasto metâlu un parastometâlu izstrâdâjumu un satiksmes lîdzekïu eksporta pieaugums, savukârt bûtiskikritâs minerâlproduktu izvedums. Preèu eksportâ joprojâm dominçja koks un kokaizstrâdâjumi, lauksaimniecîbas un pârtikas preces, parastie metâli un parasto metâ-
9
4 · 2006
lu izstrâdâjumi, mehânismi un mehâniskas ierîces, elektroiekârtas un tekstilmate-riâli un tekstilizstrâdâjumi. Eksporta pieaugumu kopumâ noteica cenu kâpums,jo eksporta fiziskais apjoms samazinâjâs. Preèu grupu dalîjumâ vienîgi lauksaim-niecîbas un pârtikas preèu izveduma pieaugumu ietekmçja fiziskâ apjoma palieli-nâðanâs. Gan fiziskâ apjoma, gan cenu kâpums noteica íîmiskâs rûpniecîbas untâs saskarnozaru raþojumu, satiksmes lîdzekïu, tekstilmateriâlu un tekstilizstrâ-dâjumu un mehânismu un mehânisku ierîèu, elektroiekârtu eksporta pieaugumu.Kritâs minerâlproduktu, koka un koka izstrâdâjumu, parasto metâlu un parastometâlu izstrâdâjumu un daþâdu izstrâdâjumu (mçbeïu) fiziskais apjoms. To izve-duma pieaugumu noteica vienîgi cenu kâpums.
Preèu eksporta vienîbas vçrtîba auga katru ceturksni, un 4. ceturksnî kâpums salî-dzinâjumâ ar iepriekðçjâ gada atbilstoðo periodu sasniedza 14.2%. Vislielâkaisbija parasto metâlu un parasto metâlu izstrâdâjumu (28.7%), koka un koka izstrâ-dâjumu (19.6%), satiksmes lîdzekïu (13.2%), daþâdu izstrâdâjumu (mçbeïu; 11.3%)un íîmiskâs rûpniecîbas un tâs saskarnozaru raþojumu (8.7%) cenu pieaugums.Lîdz ar straujâku eksporta cenu kâpumu gada beigâs uzlabojâs tirdzniecîbas no-sacîjumi.
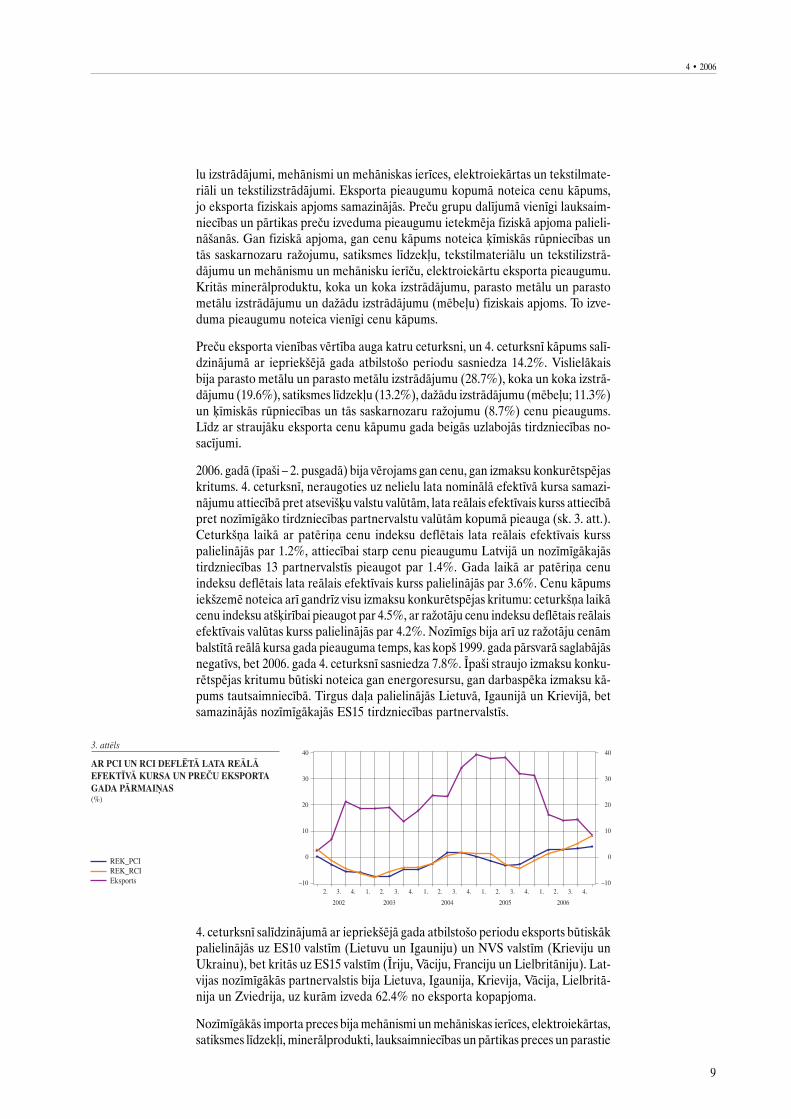
2006. gadâ (îpaði – 2. pusgadâ) bija vçrojams gan cenu, gan izmaksu konkurçtspçjaskritums. 4. ceturksnî, neraugoties uz nelielu lata nominâlâ efektîvâ kursa samazi-nâjumu attiecîbâ pret atseviðíu valstu valûtâm, lata reâlais efektîvais kurss attiecîbâpret nozîmîgâko tirdzniecîbas partnervalstu valûtâm kopumâ pieauga (sk. 3. att.).Ceturkðòa laikâ ar patçriòa cenu indeksu deflçtais lata reâlais efektîvais kursspalielinâjâs par 1.2%, attiecîbai starp cenu pieaugumu Latvijâ un nozîmîgâkajâstirdzniecîbas 13 partnervalstîs pieaugot par 1.4%. Gada laikâ ar patçriòa cenuindeksu deflçtais lata reâlais efektîvais kurss palielinâjâs par 3.6%. Cenu kâpumsiekðzemç noteica arî gandrîz visu izmaksu konkurçtspçjas kritumu: ceturkðòa laikâcenu indeksu atðíirîbai pieaugot par 4.5%, ar raþotâju cenu indeksu deflçtais reâlaisefektîvais valûtas kurss palielinâjâs par 4.2%. Nozîmîgs bija arî uz raþotâju cenâmbalstîtâ reâlâ kursa gada pieauguma temps, kas kopð 1999. gada pârsvarâ saglabâjâsnegatîvs, bet 2006. gada 4. ceturksnî sasniedza 7.8%. Îpaði straujo izmaksu konku-rçtspçjas kritumu bûtiski noteica gan energoresursu, gan darbaspçka izmaksu kâ-pums tautsaimniecîbâ. Tirgus daïa palielinâjâs Lietuvâ, Igaunijâ un Krievijâ, betsamazinâjâs nozîmîgâkajâs ES15 tirdzniecîbas partnervalstîs.
4. ceturksnî salîdzinâjumâ ar iepriekðçjâ gada atbilstoðo periodu eksports bûtiskâkpalielinâjâs uz ES10 valstîm (Lietuvu un Igauniju) un NVS valstîm (Krieviju unUkrainu), bet kritâs uz ES15 valstîm (Îriju, Vâciju, Franciju un Lielbritâniju). Lat-vijas nozîmîgâkâs partnervalstis bija Lietuva, Igaunija, Krievija, Vâcija, Lielbritâ-nija un Zviedrija, uz kurâm izveda 62.4% no eksporta kopapjoma.
Nozîmîgâkâs importa preces bija mehânismi un mehâniskas ierîces, elektroiekârtas,satiksmes lîdzekïi, minerâlprodukti, lauksaimniecîbas un pârtikas preces un parastie
10
MONETÂRAIS APSKATS · MONETARY REVIEW
metâli un parasto metâlu izstrâdâjumi. Preèu ieveduma pieaugumâ 4. ceturksnîsalîdzinâjumâ ar iepriekðçjâ gada atbilstoðo periodu dominçja satiksmes lîdzekïi,mehânismi un mehâniskas ierîces, elektroiekârtas, lauksaimniecîbas un pârtikaspreces un parastie metâli un parasto metâlu izstrâdâjumi. Importa pieaugumunoteica fiziskâ apjoma palielinâðanâs, mazâk – cenu kâpums. Fiziskâ apjoma palie-linâðanâs dominçja pârtikas rûpniecîbas raþojumu un satiksmes lîdzekïu importapieaugumâ. Mehânismu un mehânisku ierîèu, elektroiekârtu un parasto metâluun parasto metâlu izstrâdâjumu ieveduma kâpumu ietekmçja gan fiziskâ apjoma,gan cenu celðanâs. No importâ dominçjoðâm precçm cenas visvairâk auga paras-tajiem metâliem un parasto metâlu izstrâdâjumiem (par 16.7%), mehânismiemun mehâniskâm ierîcçm, elektroiekârtâm (par 7.9%), satiksmes lîdzekïiem (par7.1%) un zemâs bâzes ietekmç – tekstilmateriâliem un tekstilizstrâdâjumiem (par13.4%). Kopumâ preèu importa vienîbas vçrtîba 4. ceturksnî salîdzinâjumâ ar ie-priekðçjâ gada atbilstoðo periodu palielinâjâs par 8.1%, joprojâm sarûkot cenukâpumam.
Importa preèu ievedums palielinâjâs no visâm valstu grupâm (visvairâk – no ESvalstîm). Pusi no importa kopapjoma 4. ceturksnî ieveda no piecâm nozîmîgâkajâmpartnervalstîm – Vâcijas, Lietuvas, Krievijas, Igaunijas un Polijas. Salîdzinâjumâar iepriekðçjâ gada atbilstoðo periodu bûtiski palielinâjâs imports no Vâcijas, Igau-nijas, Polijas, Zviedrijas, Krievijas un Somijas.
Maksâjumu bilance
Latvijas maksâjumu bilances tekoðâ konta negatîvais saldo 4. ceturksnî bija864.1 milj. latu jeb 26.3% no IKP (iepriekðçjâ gada atbilstoðajâ periodâ – 15.2%).Salîdzinâjumâ ar iepriekðçjâ gada atbilstoðo periodu preèu un ienâkumu negatîvâsaldo attiecîba pret IKP bûtiski palielinâjâs, bet pakalpojumu un kârtçjo pârvedumupozitîvâ saldo attiecîba pret IKP samazinâjâs.
Pakalpojumu pozitîvais saldo 4. ceturksnî salîdzinâjumâ ar iepriekðçjâ gadaatbilstoðo periodu samazinâjâs par 31.3 milj. latu, jo saòemto pakalpojumu apjomakâpums bija lielâks nekâ sniegto pakalpojumu apjoma pieaugums visâs pakalpo-jumu grupâs. Pakalpojumu eksportâ joprojâm dominçja pârvadâjumu pakalpojumi(50.8% no pakalpojumu eksporta kopapjoma), tomçr palielinâjâs braucienu pa-kalpojumu îpatsvars (17.6%). Saòemto pakalpojumu apjomâ nedaudz saruka pâr-vadâjumu pakalpojumu (lîdz 29.3% no pakalpojumu importa kopapjoma) un brau-cienu pakalpojumu (35.2%) îpatsvars.
Pârvadâjumu pakalpojumu pozitîvais saldo 4. ceturksnî saruka, galvenokârt sa-mazinoties sniegto un palielinoties saòemto citu ar pârvadâjumiem saistîto pakal-pojumu apjomam jûras transportâ. Braucienu pakalpojumu negatîvais saldo pie-auga nedaudz. Lai gan saskaòâ ar CSP datiem 4. ceturksnî salîdzinâjumâ ar ie-priekðçjâ gada atbilstoðo periodu Latviju apmeklçjuðo ârvalstu ceïotâju skaits palie-linâjâs par 13.5%, bet uz ârvalstîm devuðos Latvijas ceïotâju skaits bûtiski nemai-nîjâs, tomçr Latvijas ceïotâju tçriòi ârvalstîs joprojâm bija lielâki nekâ ârvalstuceïotâju tçriòi Latvijâ. Vidçjais Latvijas ceïotâju uzturçðanâs laiks ârvalstîs turpinâjaaugt, bet ârvalstu ceïotâju uzturçðanâs laiks Latvijâ – samazinâties. Citu pakalpo-jumu pozitîvâ saldo bûtisku sarukumu noteica saòemto citu saimnieciskâs darbîbaspakalpojumu, apdroðinâðanas un bûvniecîbas pakalpojumu apjoma kâpums. Vien-laikus palielinâjâs sniegto finanðu pakalpojumu apjoms.
Ienâkumu negatîvais saldo salîdzinâjumâ ar iepriekðçjâ gada atbilstoðo periodupieauga par 86.2 milj. latu, jo nerezidentu Latvijâ gûto ienâkumu apjoma kâpumslîdz ar nozîmîgo tieðo investîciju apjoma palielinâðanos Latvijâ èetras reizes pâr-sniedza rezidentu ieguldîjumu ienâkumu pieaugumu. Visvairâk palielinâjâs nere-
11
4 · 2006
zidentu tieðo investîciju (galvenokârt reinvestçtâs peïòas veidâ) un citu ieguldîjumuienâkumu apjoms.
Kârtçjo pârvedumu pozitîvais saldo 4. ceturksnî salîdzinâjumâ ar iepriekðçjâ gadaatbilstoðo periodu samazinâjâs par 51.4 milj. latu, un to noteica bûtiska debetadarîjumu apjoma palielinâðanâs citos sektoros. Saòemto kârtçjo pârvedumu apjomapieaugums bija daudz mazâks.
Kapitâla un finanðu konta pozitîvais saldo bija 872.2 milj. latu, un lielâko daïu notâ veidoja ilgtermiòa finansçjums.
Tieðâs investîcijas Latvijâ (293.4 milj. latu; 8.9% no IKP) bija 4.1 reizi lielâkasnekâ iepriekðçjâ gada atbilstoðajâ periodâ un sedza 34.0% no tekoðâ konta negatîvâsaldo. Ârvalstu tieðâs investîcijas Latvijâ ieplûda galvenokârt reinvestçtâs peïòas(45.0% no ârvalstu tieðajâm investîcijâm Latvijâ) un paðu kapitâla (18.2%) veidâ.Investîcijas Latvijâ visvairâk pieauga no Kipras, Maltas un Zviedrijas (finanðu starp-niecîbâ, operâcijâs ar nekustamo îpaðumu, nomâ un citâ komercdarbîbâ un vairum-tirdzniecîbâ un mazumtirdzniecîbâ).
Portfeïieguldîjumu saldo 4. ceturksnî bija pozitîvs (84.1 milj. latu), jo bankas ievç-rojami samazinâja aktîvus, pârdodot parâda vçrtspapîrus.
Citu ieguldîjumu pozitîvais saldo bija 700.1 milj. latu (21.3% no IKP). Pasîvu kâ-pums jau otro ceturksni pçc kârtas pârsniedza miljarda latu robeþu, 4. ceturksnîpalielinoties par 1 058.0 milj. latu. 91.2% no pasîvu pieauguma veidoja bankusektora aizòçmumi (galvenokârt no mâtesbankâm). Ilgtermiòa saistîbu kâpumsveidoja lielâko daïu (83.7%) no citu ieguldîjumu pozitîvâ saldo.
Uzòçmumu sektora citu ieguldîjumu saldo 4. ceturksnî bija negatîvs (1.5% noIKP). Turpinâjâs uzòçmumu no nerezidentiem saòemto ilgtermiòa aizòçmumupieauguma tendence, taèu bûtiski tika samazinâtas îstermiòa ârçjâs saistîbas (tirdz-niecîbas kredîti) un palielinâts noguldîjumu apjoms.
Rezerves aktîvi 4. ceturksnî pieauga par 237.3 milj. latu, bankâm konvertçjot âr-valstu valûtu latu pieprasîjuma apmierinâðanai.
IEKÐZEMES EKONOMISKÂ AKTIVITÂTE
Kopçjais pieprasîjums
2006. gada 3. ceturksnî tautsaimniecîbas izaugsmi noteica privâtais patçriòð, sagla-bâjoties augstam kopçjâs pamatkapitâla veidoðanas pieauguma tempam. Ârçjâpieprasîjuma pieauguma temps bûtiski samazinâjâs, palielinot negatîvo neto eks-porta devumu IKP pieaugumâ. Privâtais patçriòð palielinâjâs par 16.8%, nosakotpusi no iekðzemes pieprasîjuma kâpuma. Mâjsaimniecîbu tçriòu pieaugumu vei-cinâja joprojâm dinamiskâ kreditçðanas attîstîba un rîcîbâ esoðo ienâkumu nozîmîgspalielinâjums, ko noteica nodarbinâtîbas, reâlâs vidçjâs darba algas, kâ arî sociâlopabalstu un pensiju apjoma pieaugums. Papildus ðiem tieðas ietekmes faktoriempatçriòa kâpumu veicinâja cenu pieauguma gaidas, kâ arî iedzîvotâju aktîvu vçrtîbaspalielinâjuma un straujâs tautsaimniecîbas izaugsmes radîtais optimistiskaisnoskaòojums.
Kopçjâ pamatkapitâla veidoðana 3. ceturksnî pieauga par 10.0%, ko veicinâja labiuzòçmumu iepriekðçjo periodu finanðu rezultâti (reinvestçtâ peïòa), dinamiskakreditçðanas attîstîba un straujas tautsaimniecîbas izaugsmes gaidas, kuras galve-nokârt veicinâjuðas ieguldîjumus visstraujâk augoðajâs nozarçs – tirdzniecîbâ unoperâcijâs ar nekustamo îpaðumu.
12
MONETÂRAIS APSKATS · MONETARY REVIEW
Preèu un pakalpojumu eksporta reâlais kâpums 3. ceturksnî bija 7.5%, savukârtimports palielinâjâs trîs reizes straujâk (par 24.0%), un to noteica iekðzemes pie-prasîjuma ekspansija, t.sk. liela apjoma atseviðíu investîciju projektu îstenoðana.Eksporta pieauguma tempa samazinâjums bija saistîts ar atseviðíu produktu grupueksporta apjomu samazinâjumu vai pieauguma tempa kritumu (minerâlprodukti,papîra un kartona izstrâdâjumi, koks un koka izstrâdâjumi u.c.). Izmaksu un cenupalielinâjums samazinâja konkurçtspçju ârçjos tirgos, kas papildus mudinâjauzòçmçjus par prioritâti izvçlçties iekðzemes pieprasîjuma apmierinâðanu.
Vienlaikus arvien spçcîgâk iezîmçjâs tautsaimniecîbas turpmâko attîstîbu ierobe-þojoði faktori – augoða spriedze darba tirgû, cenu kâpums, nesamçrîga iekðzemespieprasîjuma izaugsme, kas noteica negatîvu neto eksporta devumu, bûtisks mâj-saimniecîbu parâda palielinâjums, strauji augoðas investîcijas mâjokïos, automo-biïos un nozarçs ar samçrâ zemu pievienoto vçrtîbu.
Kopçjais piedâvâjums
4. ceturksnî turpinâjâs strauja Latvijas tautsaimniecîbas attîstîba. IKP salîdzinâ-majâs cenâs salîdzinâjumâ ar iepriekðçjâ gada atbilstoðo periodu palielinâjâs par11.7%, 2006. gadâ faktiskajâs cenâs sasniedzot 11 264.7 milj. latu. Kopçjo tautsaim-niecîbas izaugsmi visvairâk ietekmçja straujais pievienotâs vçrtîbas kâpums tirdz-niecîbâ (15.3%).
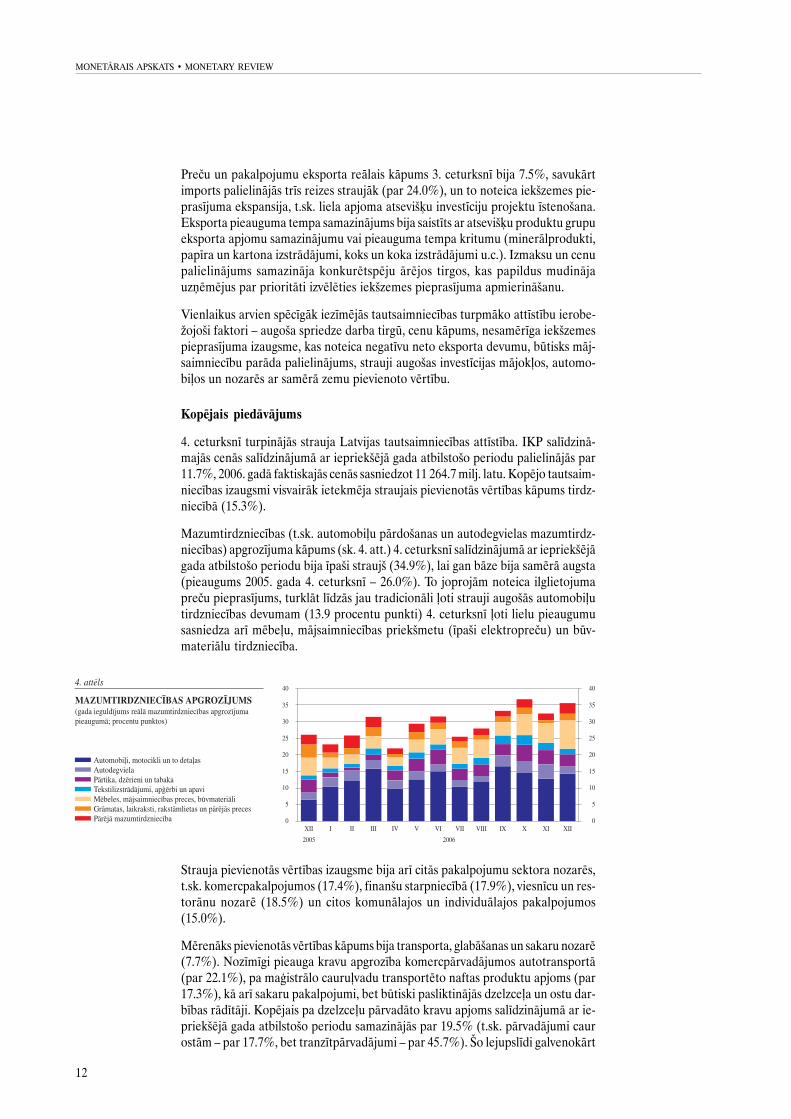
Mazumtirdzniecîbas (t.sk. automobiïu pârdoðanas un autodegvielas mazumtirdz-niecîbas) apgrozîjuma kâpums (sk. 4. att.) 4. ceturksnî salîdzinâjumâ ar iepriekðçjâgada atbilstoðo periodu bija îpaði straujð (34.9%), lai gan bâze bija samçrâ augsta(pieaugums 2005. gada 4. ceturksnî – 26.0%). To joprojâm noteica ilglietojumapreèu pieprasîjums, turklât lîdzâs jau tradicionâli ïoti strauji augoðâs automobiïutirdzniecîbas devumam (13.9 procentu punkti) 4. ceturksnî ïoti lielu pieaugumusasniedza arî mçbeïu, mâjsaimniecîbas priekðmetu (îpaði elektropreèu) un bûv-materiâlu tirdzniecîba.
Strauja pievienotâs vçrtîbas izaugsme bija arî citâs pakalpojumu sektora nozarçs,t.sk. komercpakalpojumos (17.4%), finanðu starpniecîbâ (17.9%), viesnîcu un res-torânu nozarç (18.5%) un citos komunâlajos un individuâlajos pakalpojumos(15.0%).
Mçrenâks pievienotâs vçrtîbas kâpums bija transporta, glabâðanas un sakaru nozarç(7.7%). Nozîmîgi pieauga kravu apgrozîba komercpârvadâjumos autotransportâ(par 22.1%), pa maìistrâlo cauruïvadu transportçto naftas produktu apjoms (par17.3%), kâ arî sakaru pakalpojumi, bet bûtiski pasliktinâjâs dzelzceïa un ostu dar-bîbas râdîtâji. Kopçjais pa dzelzceïu pârvadâto kravu apjoms salîdzinâjumâ ar ie-priekðçjâ gada atbilstoðo periodu samazinâjâs par 19.5% (t.sk. pârvadâjumi caurostâm – par 17.7%, bet tranzîtpârvadâjumi – par 45.7%). Ðo lejupslîdi galvenokârt
13
4 · 2006
noteica naftas produktu un akmeòogïu pârvadâjumu kritums. Latvijas ostâs ko-pçjais saòemto un nosûtîto kravu apjoms samazinâjâs par 6.6%, sarûkot visâs ostâs,t.sk. Ventspils ostâ (par 6.5%) un Rîgas ostâ (par 4.6%).
Preèu sektorâ joprojâm spçcîga bija bûvniecîbas izaugsme (10.3%), bet samçrâneliels bija pievienotâs vçrtîbas kâpums apstrâdes rûpniecîbâ. 4. ceturksnî salîdzi-nâmajâs cenâs samazinâjâs koksnes, koka un koría izstrâdâjumu (izòemot mçbeles)un metâlu raþoðanas produkcijas eksports, kas noteica raþoðanas apjoma reâlo kri-tumu salîdzinâjumâ ar iepriekðçjâ gada atbilstoðo periodu. Tas bija galvenais fak-tors, kas kavçja apstrâdes rûpniecîbas izaugsmes tempu. Vienlaikus augoðs pie-prasîjums iekðçjâ tirgû un eksporta pieaugums veicinâja izaugsmi vairâkâs citâsnozarçs, no kurâm vislielâko ieguldîjumu deva tekstilizstrâdâjumu raþoðana, íî-misko vielu, to izstrâdâjumu un íîmisko ðíiedru raþoðana, gatavo metâlizstrâdâ-jumu (izòemot maðînas un iekârtas) raþoðana un citu transportlîdzekïu raþoðana.Tâdçjâdi sezonâli izlîdzinâtais fiziskais apstrâdes rûpniecîbas produkcijas apjomaindekss salîdzinâjumâ ar iepriekðçjâ gada atbilstoðo periodu palielinâjâs par 3.9%un pievienotâ vçrtîba – par 4.5%.
Nefinanðu investîcijas tautsaimniecîbâ 4. ceturksnî sasniedza 719.8 milj. latu (par25.7% vairâk nekâ iepriekðçjâ gada atbilstoðajâ periodâ). Lielâkie ieguldîjumi veiktiapstrâdes rûpniecîbâ (128.7 milj. latu), valsts pârvaldç un aizsardzîbâ un obligâtajâsociâlajâ apdroðinâðanâ (107.4 milj. latu), transportâ, glabâðanâ un sakaros(84.5 milj. latu), enerìçtikâ (84.3 milj. latu), tirdzniecîbâ (83.8 milj. latu), kâ arîoperâcijâs ar nekustamo îpaðumu, nomâ un citâ komercdarbîbâ (76.5 milj. latu),kur bija vçrojams visstraujâkais investçto lîdzekïu gada pieaugums. Apstrâdes rûp-niecîbâ lielâkâs investîcijas veiktas pârtikas produktu un dzçrienu raþoðanâ(39.0 milj. latu), koksnes, koka un koría izstrâdâjumu raþoðanâ (izòemot mçbeles;24.4 milj. latu), kâ arî nemetâlisko minerâlu izstrâdâjumu raþoðanâ (21.0 milj.latu).
Nodarbinâtîba un darba samaksa
Reìistrçtâ bezdarba lîmenis 4. ceturksnî turpinâja samazinâties gan salîdzinâjumâar iepriekðçjo ceturksni (par 0.3 procentu punktiem), gan salîdzinâjumâ ar iepriek-ðçjâ gada atbilstoðo periodu (par 0.9 procentu punktiem) un gada beigâs bija 6.5%no ekonomiski aktîvo iedzîvotâju skaita.
Sarûkot bezdarbnieku skaitam un augot reìistrçto vakanèu skaitam (par 91.2%vairâk nekâ 2005. gada 4. ceturksnî), darba tirgus noslodzes koeficients samazinâjâslîdz 3.8. Salîdzinâjumâ ar iepriekðçjâ gada atbilstoðo periodu bezdarbnieku skaitsuz vienu reìistrçto brîvo darba vietu bija vairâk nekâ divas reizes mazâks.
Darba meklçtâju îpatsvars 4. ceturksnî saglabâjâs nemainîgs (6.2% no ekonomiskiaktîvo iedzîvotâju skaita). Darba meklçtâju skaits joprojâm bija ievçrojami mazâksnekâ iepriekðçjâ gada atbilstoðajâ periodâ, taèu ceturkðòa laikâ tas îpaði nemainîjâs.
Tautsaimniecîbâ nodarbinâto skaita palielinâðanos (salîdzinâjumâ ar iepriekðçjâgada atbilstoðo periodu – par 5.0%) noteica straujâ ekonomiskâ izaugsme, kasizraisîja darbaspçka pieprasîjuma kâpumu un jaunu darba vietu izveidi. Preèu sek-torâ nodarbinâto skaits palielinâjâs par 9.4%, visstraujâk augot bûvniecîbâ, betapstrâdes rûpniecîbâ nodarbinâto skaits salîdzinâjumâ ar iepriekðçjâ gada atbilstoðoperiodu pieauga nedaudz. Savukârt pakalpojumu sektora nodarbinâto skaita mç-renajâ pieaugumâ (2.9%) lielâkais devums, kâ arî straujâkâ izaugsme bija operâcijâsar nekustamo îpaðumu, nomâ un citâ komercdarbîbâ. Ievçrojami pieauga arî tirdz-niecîbâ nodarbinâto skaits, savukârt lielâkais nodarbinâto skaita samazinâjumsbija sabiedriskajos, sociâlajos un individuâlajos pakalpojumos, veselîbas un sociâlâsaprûpes un izglîtîbas nozarç.
14
MONETÂRAIS APSKATS · MONETARY REVIEW
Tradicionâlie faktori – augoðais darbaspçka pieprasîjums, produktivitâtes un pa-tçriòa cenu kâpums, darbaspçka migrâcija un çnu ekonomikas mazinâðanâs noteicastrauju darba samaksas pieaugumu arî 4. ceturksnî. Tautsaimniecîbâ strâdâjoðomçneða vidçjâ bruto darba samaksa 4. ceturksnî bija Ls 343.75 (par 27.9% vairâknekâ iepriekðçjâ gada atbilstoðajâ periodâ). Straujâk (par 29.9%) auga sabiedriskajâsektorâ strâdâjoðo darba samaksa. To ietekmçja izglîtîbas darbinieku darba samak-sas pieaugums par 43.3%. Privâtajâ sektorâ darba samaksa palielinâjâs par 27.4%.Straujâkais darba samaksas pieaugums bija bûvniecîbâ (37.0%), finanðustarpniecîbâ (30.7%) un tirdzniecîbâ (29.8%). Reâlâ bruto darba samaksa tautsaim-niecîbâ palielinâjâs par 20.4%.
CENU DINAMIKA
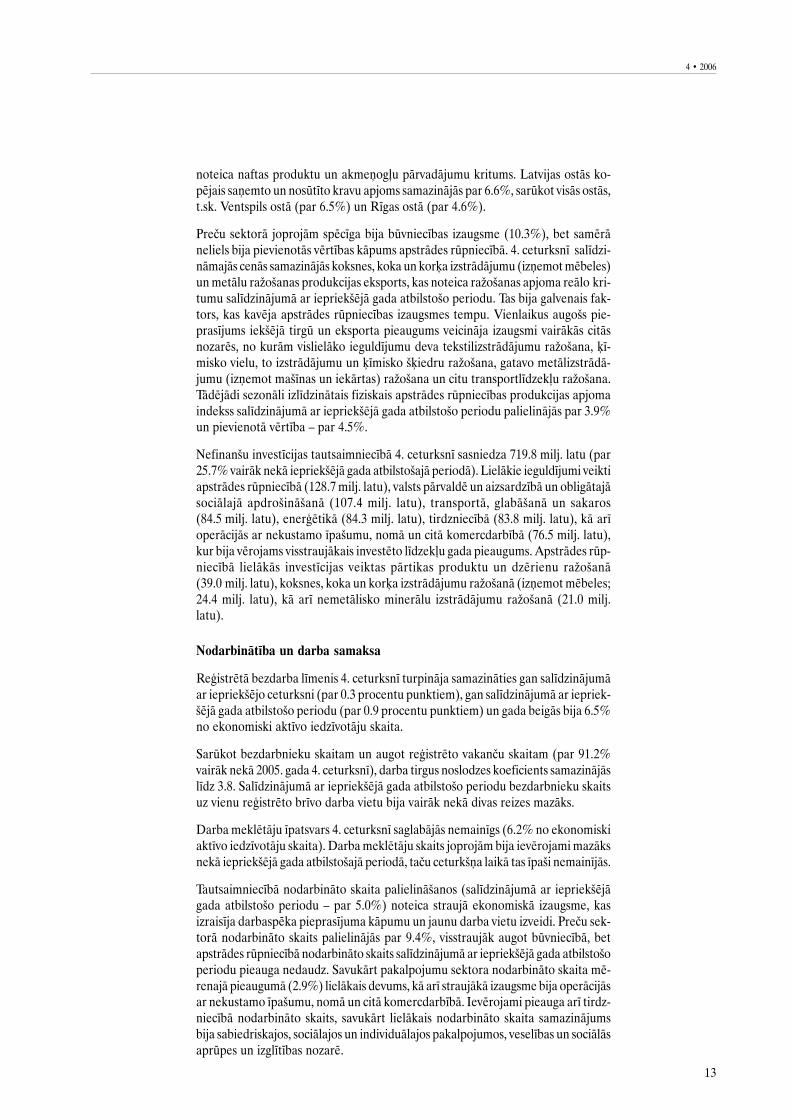
Lai gan 2006. gada 4. ceturksnî vidçjais patçriòa cenu gada pieauguma temps(6.3%) bija nedaudz mazâks nekâ 3. ceturksnî, ceturkðòa laikâ inflâcijai bija ten-dence pieaugt (sk. 5. att.). Salîdzinâjumâ ar iepriekðçjo ceturksni patçriòa cenaspieauga par 1.7% (3. ceturksnî – par 1.2%).
4. ceturksnî turpinâja palielinâties administratîvi regulçjamâs cenas (t.sk. visvairâk –maksa par siltumenerìiju), kâ arî pârtikas un atseviðíu administratîvi neregulçjamopakalpojumu cenas. Kopumâ nozîmîgi pieauga pamatinflâcijas komponentu ie-tekme uz kopçjo inflâciju: pamatinflâciju veidojoðo cenu gada pieaugums palieli-nâjâs lîdz 5.3% (3. ceturksnî – 4.8%).
Kopð septembra saglabâjâs negatîvs degvielas cenu gada pieaugums, kas saistâmsar naftas tirgus cenu svârstîbâm un, iespçjams, arî konkurences ietekmi iekðzemesdegvielas tirgû. Bûtiski nemainîjâs vai pat mazliet samazinâjâs daudzu nepârtikasrûpniecîbas preèu cenas (galvenokârt elektropreèu, apìçrba un apavu cenas) ne-daudz lielâka importa komponenta un pietiekamas konkurences ietekmç. Pakal-pojumu grupâ neliels cenu samazinâjums vçrojams vienîgi telefonu pakalpojumiem,turklât sezonâli mazinoties tûrisma aktivitâtei, 4. ceturksnî saruka viesnîcupakalpojumu cenas.
Lîdz ar nerezidentu patçriòa mazâku ietekmi izlîdzinâjâs arî starpîba starp na-cionâlo un saskaòoto patçriòa cenu indeksu, tâdçjâdi gadâ kopumâ SPCI tikaipar 0.1 procentu punktu pârsniedza nacionâlo patçriòa cenu indeksu.
4. ceturksnî turpinâjâs visu gadu vçrotais bûtiskais raþotâju cenu kâpums rûp-niecîbâ, atspoguïojot gan nozîmîgu izmaksu pieaugumu, gan augoðo pieprasîjumu.Salîdzinâjumâ ar iepriekðçjo ceturksni raþotâju cenu indekss rûpniecîbâ palielinâjâspar 3.9%, t.sk. eksportçtajai produkcijai – nedaudz straujâk nekâ iekðzemes tirgûpârdotajai (attiecîgi par 4.7% un 3.4%). Iekðzemes tirgû visvairâk (par 7.0%)sadârdzinâjâs starppatçriòa preces. Îslaicîga lietojuma un ilglietojuma patçriòa
15
4 · 2006
preèu un enerìijas cenas pieauga daudz mazâk: attiecîgi par 1.9%, 1.7% un 1.6%.Salîdzinâjumâ ar iepriekðçjâ gada atbilstoðo periodu raþotâju cenas rûpniecîbâpalielinâjâs par 12.8%, t.sk. eksportçtajai produkcijai – par 14.0%, bet iekðzemestirgû pârdotajai – par 12.0%. Gada laikâ iekðzemes tirgû pârdotajai produkcijaivislielâkais raþotâju cenu indeksa rûpniecîbâ kâpums bija starppatçriòa precçm(17.3%), enerìijai (16.6%) un raþoðanas lîdzekïiem (11.4%). Lçnâks cenu kâpumsbija îslaicîga lietojuma patçriòa precçm (5.6%) un nenozîmîgs – ilglietojumapatçriòa precçm (0.6%).
Kopçjâs bûvniecîbas izmaksas 4. ceturksnî sadârdzinâjâs par 4.1%, visvairâk (par7.6%) augot maðînu un mehânismu uzturçðanas izmaksâm. Savukârt strâdniekudarba samaksa pieauga par 4.1% un bûvmateriâlu izmaksas – par 3.3%. Salîdzinâ-jumâ ar iepriekðçjâ gada atbilstoðo periodu bûvniecîbas izmaksas palielinâjâs par25.0% (t.sk. darba samaksa – par 41.1%, maðînu un mehânismu uzturçðanas iz-maksas – par 30.3% un bûvmateriâlu izmaksas – par 15.2%).
FISKÂLAIS SEKTORS
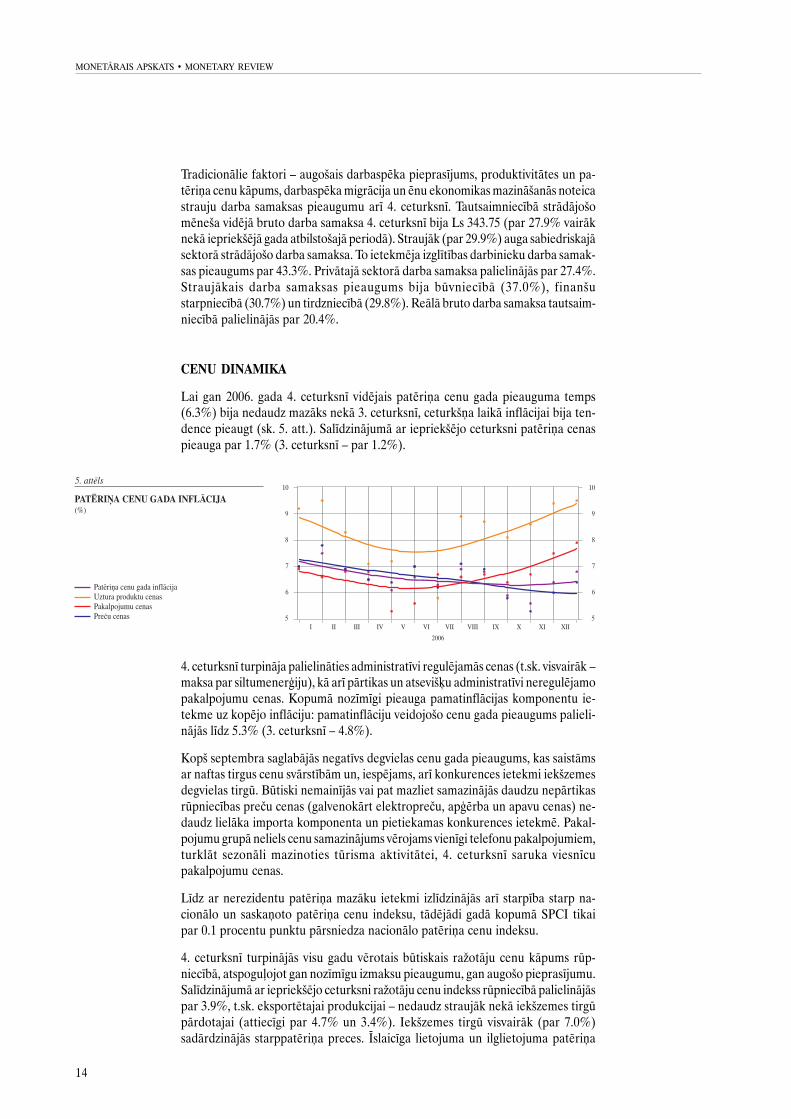
Valsts konsolidçtâ kopbudþeta finansiâlais deficîts 2006. gada beigâs bija 98.6 milj.latu jeb 0.9% no IKP, lai gan 2006. gada pirmajos trijos ceturkðòos valsts konsoli-dçtajâ kopbudþetâ bija uzkrâjies rekordliels finansiâlais pârpalikums. Budþeta iz-devumi 4. ceturksnî tradicionâli bija ïoti lieli, turklât izdevumus palielinâja arîoktobrî veiktie grozîjumi likumâ "Par valsts budþetu 2006. gadam". Tâdçjâdi valstskonsolidçtâ kopbudþeta finansiâlais deficîts 4. ceturksnî sasniedza 403.1 milj. latu(sk. 6. att.).
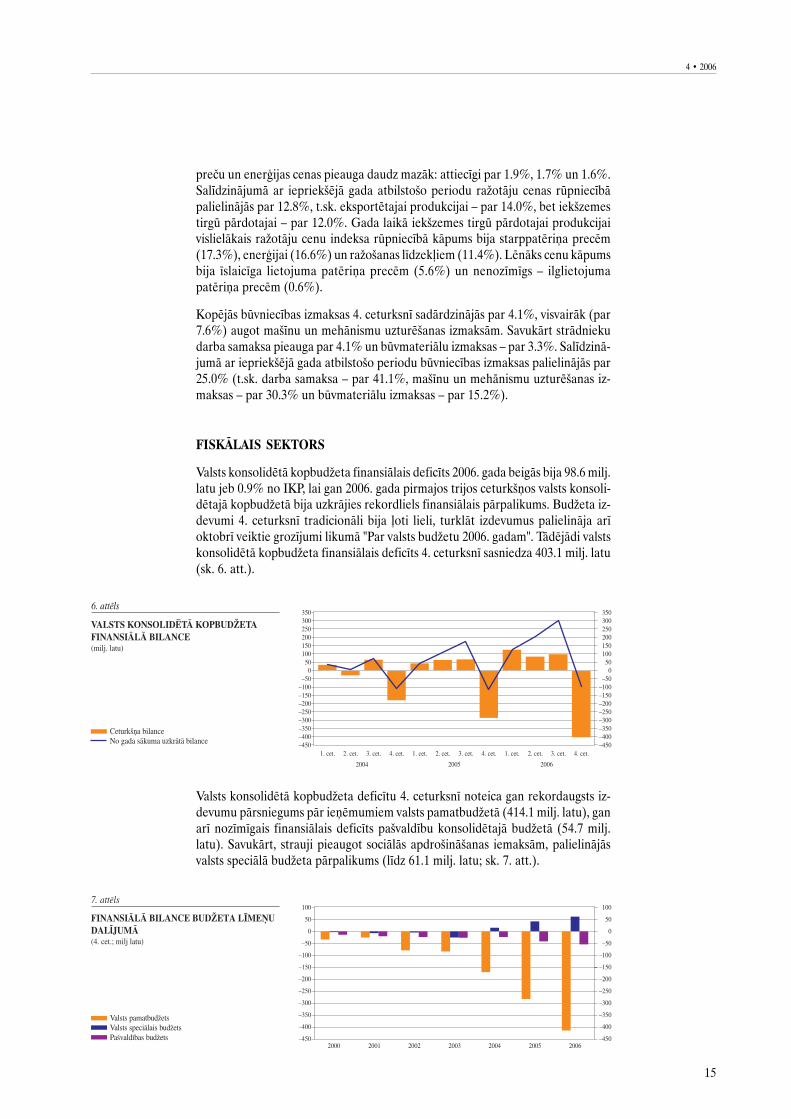
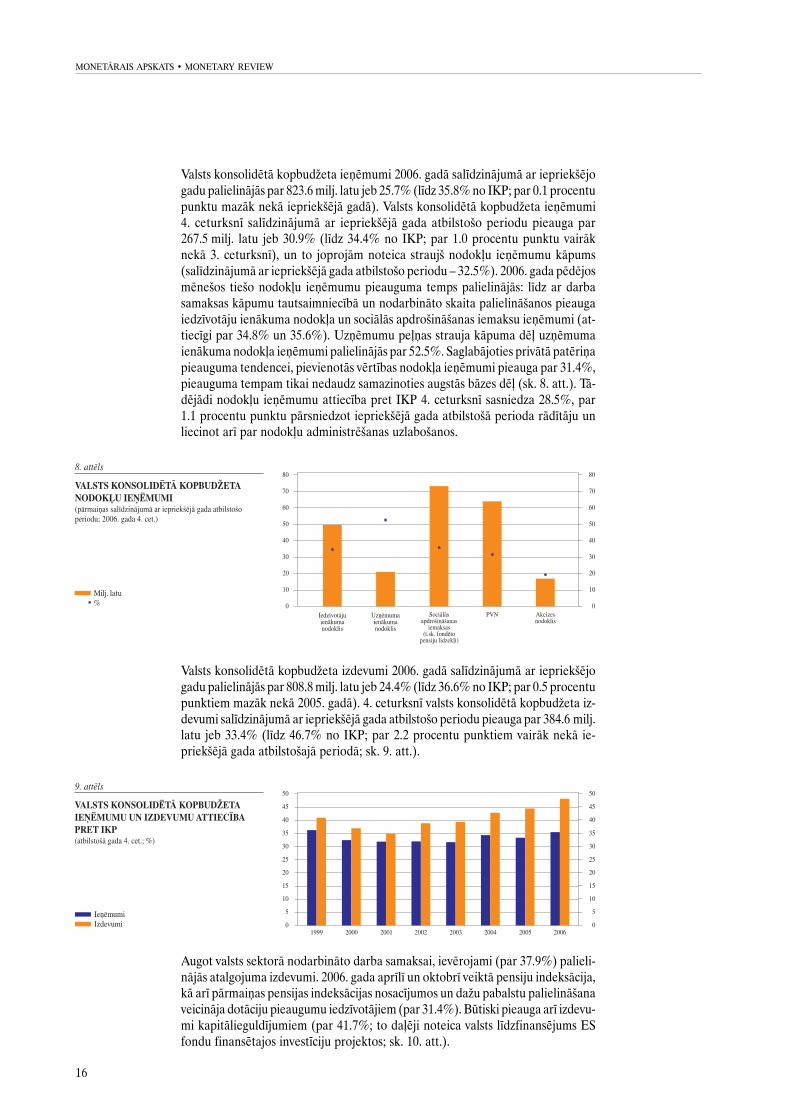
Valsts konsolidçtâ kopbudþeta deficîtu 4. ceturksnî noteica gan rekordaugsts iz-devumu pârsniegums pâr ieòçmumiem valsts pamatbudþetâ (414.1 milj. latu), ganarî nozîmîgais finansiâlais deficîts paðvaldîbu konsolidçtajâ budþetâ (54.7 milj.latu). Savukârt, strauji pieaugot sociâlâs apdroðinâðanas iemaksâm, palielinâjâsvalsts speciâlâ budþeta pârpalikums (lîdz 61.1 milj. latu; sk. 7. att.).
16
MONETÂRAIS APSKATS · MONETARY REVIEW
Valsts konsolidçtâ kopbudþeta ieòçmumi 2006. gadâ salîdzinâjumâ ar iepriekðçjogadu palielinâjâs par 823.6 milj. latu jeb 25.7% (lîdz 35.8% no IKP; par 0.1 procentupunktu mazâk nekâ iepriekðçjâ gadâ). Valsts konsolidçtâ kopbudþeta ieòçmumi4. ceturksnî salîdzinâjumâ ar iepriekðçjâ gada atbilstoðo periodu pieauga par267.5 milj. latu jeb 30.9% (lîdz 34.4% no IKP; par 1.0 procentu punktu vairâknekâ 3. ceturksnî), un to joprojâm noteica straujð nodokïu ieòçmumu kâpums(salîdzinâjumâ ar iepriekðçjâ gada atbilstoðo periodu – 32.5%). 2006. gada pçdçjosmçneðos tieðo nodokïu ieòçmumu pieauguma temps palielinâjâs: lîdz ar darbasamaksas kâpumu tautsaimniecîbâ un nodarbinâto skaita palielinâðanos pieaugaiedzîvotâju ienâkuma nodokïa un sociâlâs apdroðinâðanas iemaksu ieòçmumi (at-tiecîgi par 34.8% un 35.6%). Uzòçmumu peïòas strauja kâpuma dçï uzòçmumaienâkuma nodokïa ieòçmumi palielinâjâs par 52.5%. Saglabâjoties privâtâ patçriòapieauguma tendencei, pievienotâs vçrtîbas nodokïa ieòçmumi pieauga par 31.4%,pieauguma tempam tikai nedaudz samazinoties augstâs bâzes dçï (sk. 8. att.). Tâ-dçjâdi nodokïu ieòçmumu attiecîba pret IKP 4. ceturksnî sasniedza 28.5%, par1.1 procentu punktu pârsniedzot iepriekðçjâ gada atbilstoðâ perioda râdîtâju unliecinot arî par nodokïu administrçðanas uzlaboðanos.
Valsts konsolidçtâ kopbudþeta izdevumi 2006. gadâ salîdzinâjumâ ar iepriekðçjogadu palielinâjâs par 808.8 milj. latu jeb 24.4% (lîdz 36.6% no IKP; par 0.5 procentupunktiem mazâk nekâ 2005. gadâ). 4. ceturksnî valsts konsolidçtâ kopbudþeta iz-devumi salîdzinâjumâ ar iepriekðçjâ gada atbilstoðo periodu pieauga par 384.6 milj.latu jeb 33.4% (lîdz 46.7% no IKP; par 2.2 procentu punktiem vairâk nekâ ie-priekðçjâ gada atbilstoðajâ periodâ; sk. 9. att.).
Augot valsts sektorâ nodarbinâto darba samaksai, ievçrojami (par 37.9%) palieli-nâjâs atalgojuma izdevumi. 2006. gada aprîlî un oktobrî veiktâ pensiju indeksâcija,kâ arî pârmaiòas pensijas indeksâcijas nosacîjumos un daþu pabalstu palielinâðanaveicinâja dotâciju pieaugumu iedzîvotâjiem (par 31.4%). Bûtiski pieauga arî izdevu-mi kapitâlieguldîjumiem (par 41.7%; to daïçji noteica valsts lîdzfinansçjums ESfondu finansçtajos investîciju projektos; sk. 10. att.).
17
4 · 2006
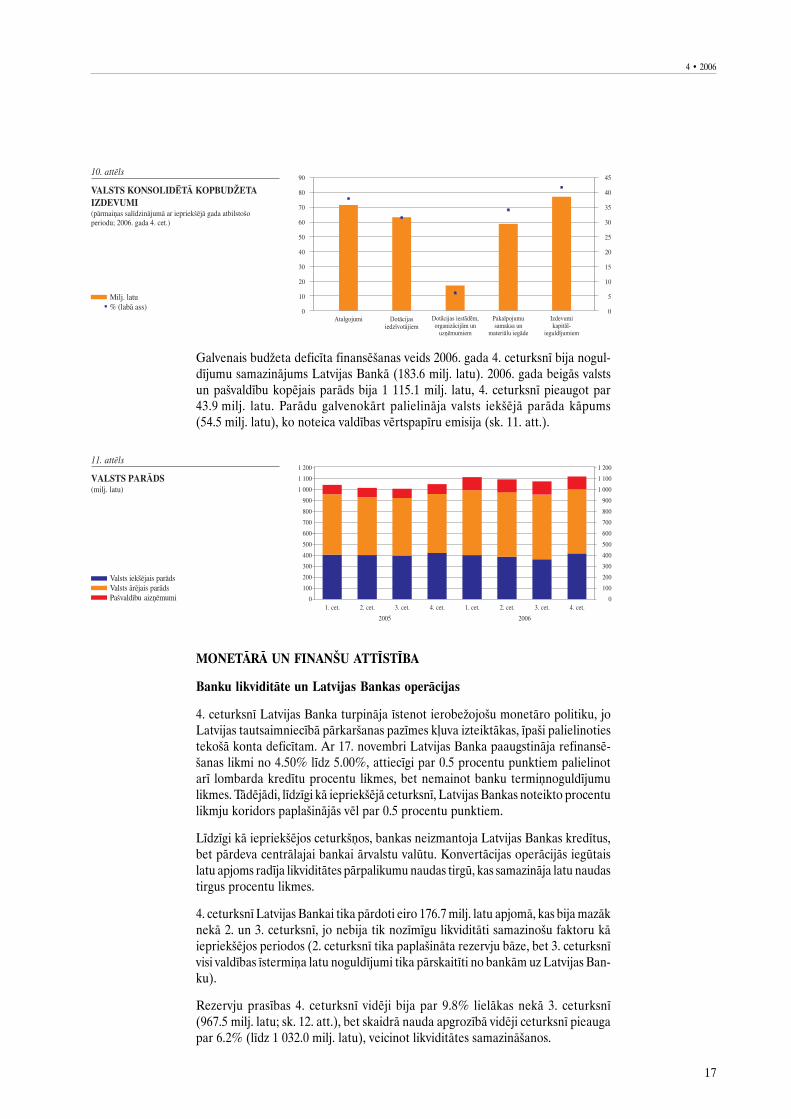
Galvenais budþeta deficîta finansçðanas veids 2006. gada 4. ceturksnî bija nogul-dîjumu samazinâjums Latvijas Bankâ (183.6 milj. latu). 2006. gada beigâs valstsun paðvaldîbu kopçjais parâds bija 1 115.1 milj. latu, 4. ceturksnî pieaugot par43.9 milj. latu. Parâdu galvenokârt palielinâja valsts iekðçjâ parâda kâpums(54.5 milj. latu), ko noteica valdîbas vçrtspapîru emisija (sk. 11. att.).
MONETÂRÂ UN FINANÐU ATTÎSTÎBA
Banku likviditâte un Latvijas Bankas operâcijas
4. ceturksnî Latvijas Banka turpinâja îstenot ierobeþojoðu monetâro politiku, joLatvijas tautsaimniecîbâ pârkarðanas pazîmes kïuva izteiktâkas, îpaði palielinotiestekoðâ konta deficîtam. Ar 17. novembri Latvijas Banka paaugstinâja refinansç-ðanas likmi no 4.50% lîdz 5.00%, attiecîgi par 0.5 procentu punktiem palielinotarî lombarda kredîtu procentu likmes, bet nemainot banku termiònoguldîjumulikmes. Tâdçjâdi, lîdzîgi kâ iepriekðçjâ ceturksnî, Latvijas Bankas noteikto procentulikmju koridors paplaðinâjâs vçl par 0.5 procentu punktiem.
Lîdzîgi kâ iepriekðçjos ceturkðòos, bankas neizmantoja Latvijas Bankas kredîtus,bet pârdeva centrâlajai bankai ârvalstu valûtu. Konvertâcijas operâcijâs iegûtaislatu apjoms radîja likviditâtes pârpalikumu naudas tirgû, kas samazinâja latu naudastirgus procentu likmes.
4. ceturksnî Latvijas Bankai tika pârdoti eiro 176.7 milj. latu apjomâ, kas bija mazâknekâ 2. un 3. ceturksnî, jo nebija tik nozîmîgu likviditâti samazinoðu faktoru kâiepriekðçjos periodos (2. ceturksnî tika paplaðinâta rezervju bâze, bet 3. ceturksnîvisi valdîbas îstermiòa latu noguldîjumi tika pârskaitîti no bankâm uz Latvijas Ban-ku).
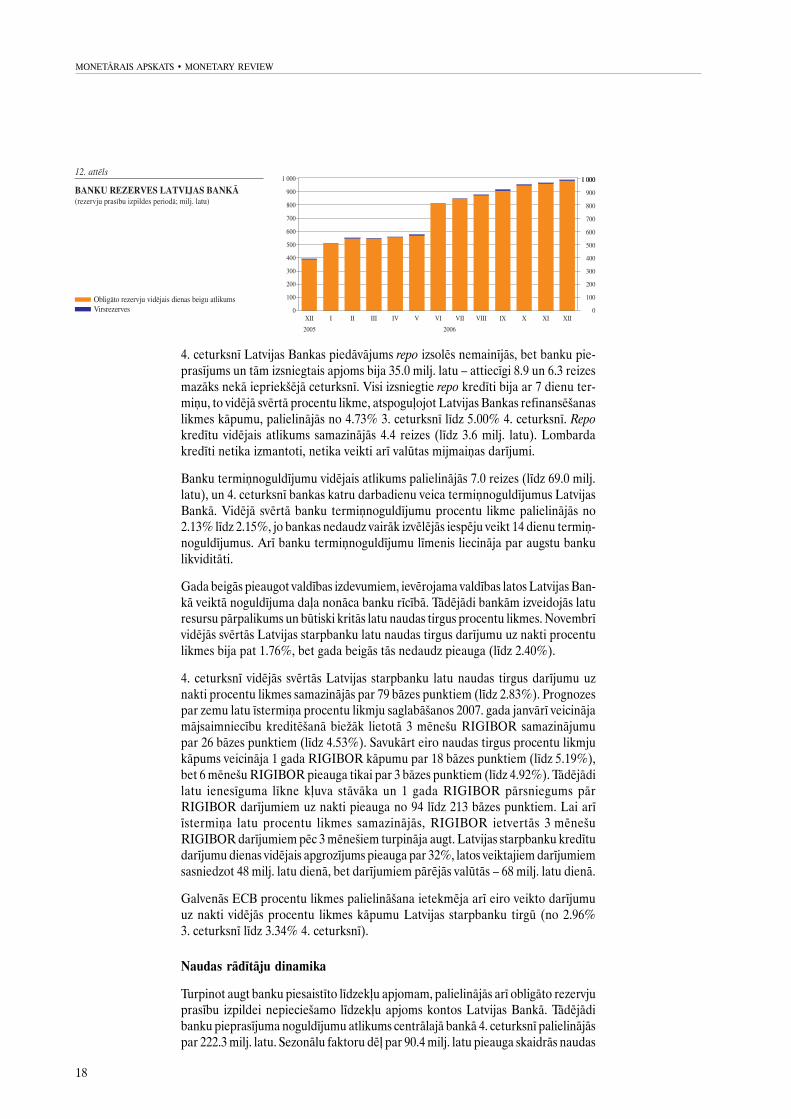
Rezervju prasîbas 4. ceturksnî vidçji bija par 9.8% lielâkas nekâ 3. ceturksnî(967.5 milj. latu; sk. 12. att.), bet skaidrâ nauda apgrozîbâ vidçji ceturksnî pieaugapar 6.2% (lîdz 1 032.0 milj. latu), veicinot likviditâtes samazinâðanos.
18
MONETÂRAIS APSKATS · MONETARY REVIEW
4. ceturksnî Latvijas Bankas piedâvâjums repo izsolçs nemainîjâs, bet banku pie-prasîjums un tâm izsniegtais apjoms bija 35.0 milj. latu – attiecîgi 8.9 un 6.3 reizesmazâks nekâ iepriekðçjâ ceturksnî. Visi izsniegtie repo kredîti bija ar 7 dienu ter-miòu, to vidçjâ svçrtâ procentu likme, atspoguïojot Latvijas Bankas refinansçðanaslikmes kâpumu, palielinâjâs no 4.73% 3. ceturksnî lîdz 5.00% 4. ceturksnî. Repo
kredîtu vidçjais atlikums samazinâjâs 4.4 reizes (lîdz 3.6 milj. latu). Lombardakredîti netika izmantoti, netika veikti arî valûtas mijmaiòas darîjumi.
Banku termiònoguldîjumu vidçjais atlikums palielinâjâs 7.0 reizes (lîdz 69.0 milj.latu), un 4. ceturksnî bankas katru darbadienu veica termiònoguldîjumus LatvijasBankâ. Vidçjâ svçrtâ banku termiònoguldîjumu procentu likme palielinâjâs no2.13% lîdz 2.15%, jo bankas nedaudz vairâk izvçlçjâs iespçju veikt 14 dienu termiò-noguldîjumus. Arî banku termiònoguldîjumu lîmenis liecinâja par augstu bankulikviditâti.
Gada beigâs pieaugot valdîbas izdevumiem, ievçrojama valdîbas latos Latvijas Ban-kâ veiktâ noguldîjuma daïa nonâca banku rîcîbâ. Tâdçjâdi bankâm izveidojâs laturesursu pârpalikums un bûtiski kritâs latu naudas tirgus procentu likmes. Novembrîvidçjâs svçrtâs Latvijas starpbanku latu naudas tirgus darîjumu uz nakti procentulikmes bija pat 1.76%, bet gada beigâs tâs nedaudz pieauga (lîdz 2.40%).
4. ceturksnî vidçjâs svçrtâs Latvijas starpbanku latu naudas tirgus darîjumu uznakti procentu likmes samazinâjâs par 79 bâzes punktiem (lîdz 2.83%). Prognozespar zemu latu îstermiòa procentu likmju saglabâðanos 2007. gada janvârî veicinâjamâjsaimniecîbu kreditçðanâ bieþâk lietotâ 3 mçneðu RIGIBOR samazinâjumupar 26 bâzes punktiem (lîdz 4.53%). Savukârt eiro naudas tirgus procentu likmjukâpums veicinâja 1 gada RIGIBOR kâpumu par 18 bâzes punktiem (lîdz 5.19%),bet 6 mçneðu RIGIBOR pieauga tikai par 3 bâzes punktiem (lîdz 4.92%). Tâdçjâdilatu ienesîguma lîkne kïuva stâvâka un 1 gada RIGIBOR pârsniegums pârRIGIBOR darîjumiem uz nakti pieauga no 94 lîdz 213 bâzes punktiem. Lai arîîstermiòa latu procentu likmes samazinâjâs, RIGIBOR ietvertâs 3 mçneðuRIGIBOR darîjumiem pçc 3 mçneðiem turpinâja augt. Latvijas starpbanku kredîtudarîjumu dienas vidçjais apgrozîjums pieauga par 32%, latos veiktajiem darîjumiemsasniedzot 48 milj. latu dienâ, bet darîjumiem pârçjâs valûtâs – 68 milj. latu dienâ.
Galvenâs ECB procentu likmes palielinâðana ietekmçja arî eiro veikto darîjumuuz nakti vidçjâs procentu likmes kâpumu Latvijas starpbanku tirgû (no 2.96%3. ceturksnî lîdz 3.34% 4. ceturksnî).
Naudas râdîtâju dinamika
Turpinot augt banku piesaistîto lîdzekïu apjomam, palielinâjâs arî obligâto rezervjuprasîbu izpildei nepiecieðamo lîdzekïu apjoms kontos Latvijas Bankâ. Tâdçjâdibanku pieprasîjuma noguldîjumu atlikums centrâlajâ bankâ 4. ceturksnî palielinâjâspar 222.3 milj. latu. Sezonâlu faktoru dçï par 90.4 milj. latu pieauga skaidrâs naudas
19
4 · 2006
pieprasîjums, tomçr skaidrâs naudas apgrozîbâ gada kâpuma temps nedaudzsamazinâjâs (no 22.8% septembrî lîdz 22.4% decembrî). Naudas bâze M0 decembrabeigâs sasniedza augstu lîmeni – 2.2 mljrd. latu, lîdz 66.5% palielinoties arî tâsgada kâpuma tempam (septembrî – 61.0%).
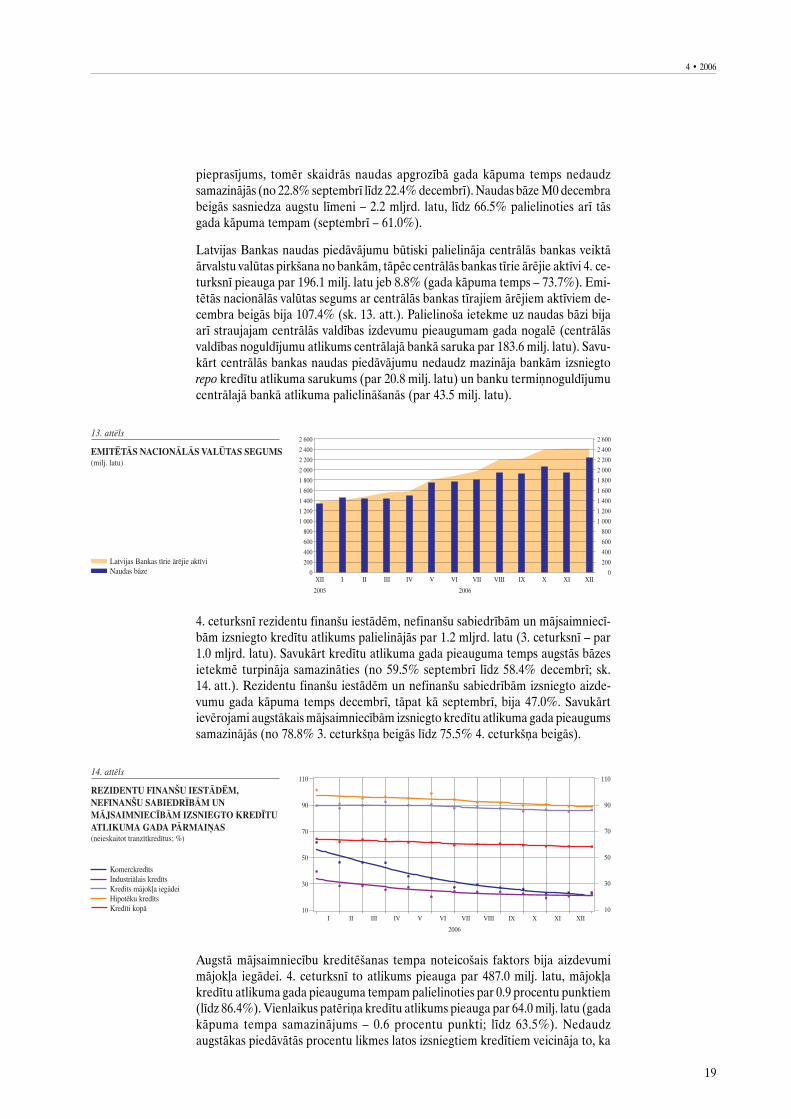
Latvijas Bankas naudas piedâvâjumu bûtiski palielinâja centrâlâs bankas veiktâârvalstu valûtas pirkðana no bankâm, tâpçc centrâlâs bankas tîrie ârçjie aktîvi 4. ce-turksnî pieauga par 196.1 milj. latu jeb 8.8% (gada kâpuma temps – 73.7%). Emi-tçtâs nacionâlâs valûtas segums ar centrâlâs bankas tîrajiem ârçjiem aktîviem de-cembra beigâs bija 107.4% (sk. 13. att.). Palielinoða ietekme uz naudas bâzi bijaarî straujajam centrâlâs valdîbas izdevumu pieaugumam gada nogalç (centrâlâsvaldîbas noguldîjumu atlikums centrâlajâ bankâ saruka par 183.6 milj. latu). Savu-kârt centrâlâs bankas naudas piedâvâjumu nedaudz mazinâja bankâm izsniegtorepo kredîtu atlikuma sarukums (par 20.8 milj. latu) un banku termiònoguldîjumucentrâlajâ bankâ atlikuma palielinâðanâs (par 43.5 milj. latu).
4. ceturksnî rezidentu finanðu iestâdçm, nefinanðu sabiedrîbâm un mâjsaimniecî-bâm izsniegto kredîtu atlikums palielinâjâs par 1.2 mljrd. latu (3. ceturksnî – par1.0 mljrd. latu). Savukârt kredîtu atlikuma gada pieauguma temps augstâs bâzesietekmç turpinâja samazinâties (no 59.5% septembrî lîdz 58.4% decembrî; sk.14. att.). Rezidentu finanðu iestâdçm un nefinanðu sabiedrîbâm izsniegto aizde-vumu gada kâpuma temps decembrî, tâpat kâ septembrî, bija 47.0%. Savukârtievçrojami augstâkais mâjsaimniecîbâm izsniegto kredîtu atlikuma gada pieaugumssamazinâjâs (no 78.8% 3. ceturkðòa beigâs lîdz 75.5% 4. ceturkðòa beigâs).
Augstâ mâjsaimniecîbu kreditçðanas tempa noteicoðais faktors bija aizdevumimâjokïa iegâdei. 4. ceturksnî to atlikums pieauga par 487.0 milj. latu, mâjokïakredîtu atlikuma gada pieauguma tempam palielinoties par 0.9 procentu punktiem(lîdz 86.4%). Vienlaikus patçriòa kredîtu atlikums pieauga par 64.0 milj. latu (gadakâpuma tempa samazinâjums – 0.6 procentu punkti; lîdz 63.5%). Nedaudzaugstâkas piedâvâtâs procentu likmes latos izsniegtiem kredîtiem veicinâja to, ka
20
MONETÂRAIS APSKATS · MONETARY REVIEW
mâjsaimniecîbas pieprasîja aizdevumus gandrîz tikai eiro. Ðâdu kredîtu atlikums4. ceturksnî pieauga par 520.4 milj. latu (latos izsniegto – tikai par 38.3 milj. latu),un to atlikuma gada kâpuma temps bija 123.5% (latos izsniegtajiem kredîtiem –32.9%). Latos izsniegto kredîtu mâjokïa iegâdei atlikuma îpatsvars 4. ceturkðòabeigâs samazinâjâs lîdz 18.8% (3. ceturkðòa beigâs – 21.5%), bet eiro izsniegtokredîtu mâjokïa iegâdei – pieauga lîdz 78.0% (3. ceturkðòa beigâs – 74.5%). Savu-kârt patçriòa kredîtu valûtu struktûrâ latos izsniegto kredîtu îpatsvars samazinâjâslîdz 53.7% (3. ceturkðòa beigâs – 55.2%), bet eiro izsniegto kredîtu îpatsvars pa-lielinâjâs lîdz 43.1% (3. ceturkðòa beigâs – 41.6%).
Eiro izsniegto kredîtu dominçðana bija vçrojama arî uzòçmçjdarbîbai izsniegtajoskredîtos – to atlikums pieauga par 625.3 milj. latu (latos izsniegto – par 29.4 milj.latu; gada pieauguma temps decembrî – attiecîgi 80.6% un 13.9%). Tâdçjâdi eiroizsniegto kredîtu atlikuma îpatsvars visos izsniegtajos kredîtos 4. ceturkðòa beigâssasniedza 72.9%, bet latos izsniegto – samazinâjâs lîdz 23.2%.
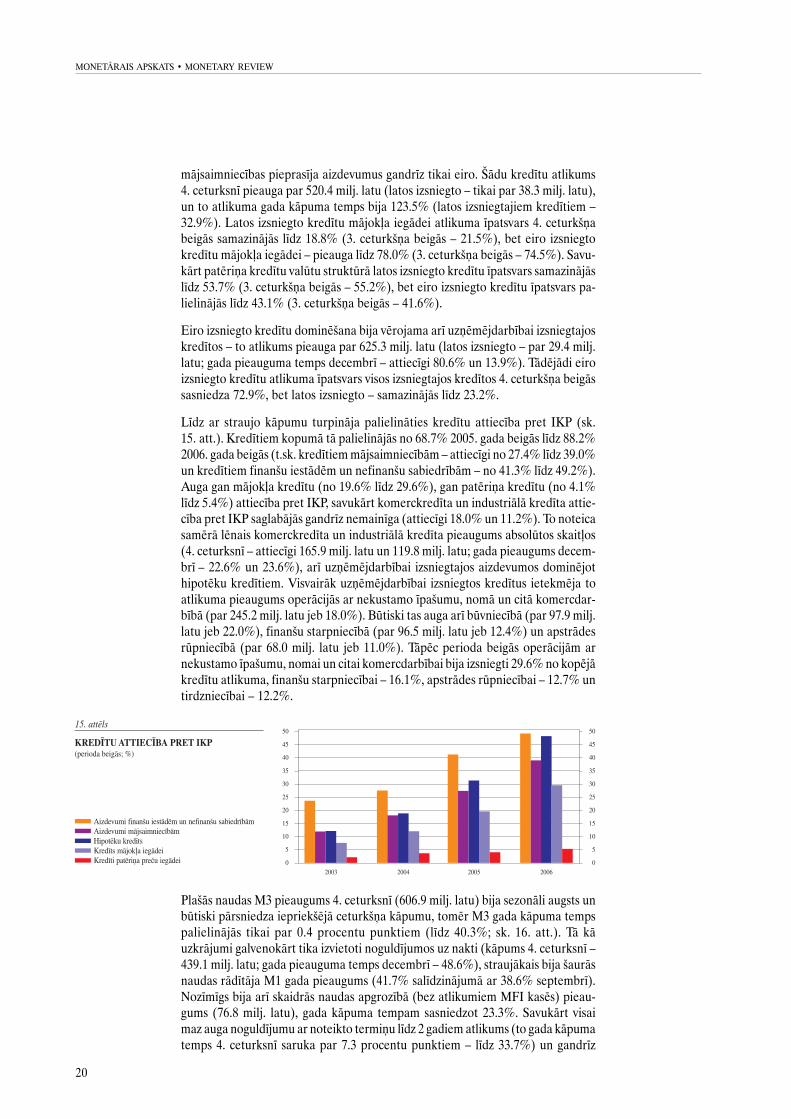
Lîdz ar straujo kâpumu turpinâja palielinâties kredîtu attiecîba pret IKP (sk.15. att.). Kredîtiem kopumâ tâ palielinâjâs no 68.7% 2005. gada beigâs lîdz 88.2%2006. gada beigâs (t.sk. kredîtiem mâjsaimniecîbâm – attiecîgi no 27.4% lîdz 39.0%un kredîtiem finanðu iestâdçm un nefinanðu sabiedrîbâm – no 41.3% lîdz 49.2%).Auga gan mâjokïa kredîtu (no 19.6% lîdz 29.6%), gan patçriòa kredîtu (no 4.1%lîdz 5.4%) attiecîba pret IKP, savukârt komerckredîta un industriâlâ kredîta attie-cîba pret IKP saglabâjâs gandrîz nemainîga (attiecîgi 18.0% un 11.2%). To noteicasamçrâ lçnais komerckredîta un industriâlâ kredîta pieaugums absolûtos skaitïos(4. ceturksnî – attiecîgi 165.9 milj. latu un 119.8 milj. latu; gada pieaugums decem-brî – 22.6% un 23.6%), arî uzòçmçjdarbîbai izsniegtajos aizdevumos dominçjothipotçku kredîtiem. Visvairâk uzòçmçjdarbîbai izsniegtos kredîtus ietekmçja toatlikuma pieaugums operâcijâs ar nekustamo îpaðumu, nomâ un citâ komercdar-bîbâ (par 245.2 milj. latu jeb 18.0%). Bûtiski tas auga arî bûvniecîbâ (par 97.9 milj.latu jeb 22.0%), finanðu starpniecîbâ (par 96.5 milj. latu jeb 12.4%) un apstrâdesrûpniecîbâ (par 68.0 milj. latu jeb 11.0%). Tâpçc perioda beigâs operâcijâm arnekustamo îpaðumu, nomai un citai komercdarbîbai bija izsniegti 29.6% no kopçjâkredîtu atlikuma, finanðu starpniecîbai – 16.1%, apstrâdes rûpniecîbai – 12.7% untirdzniecîbai – 12.2%.
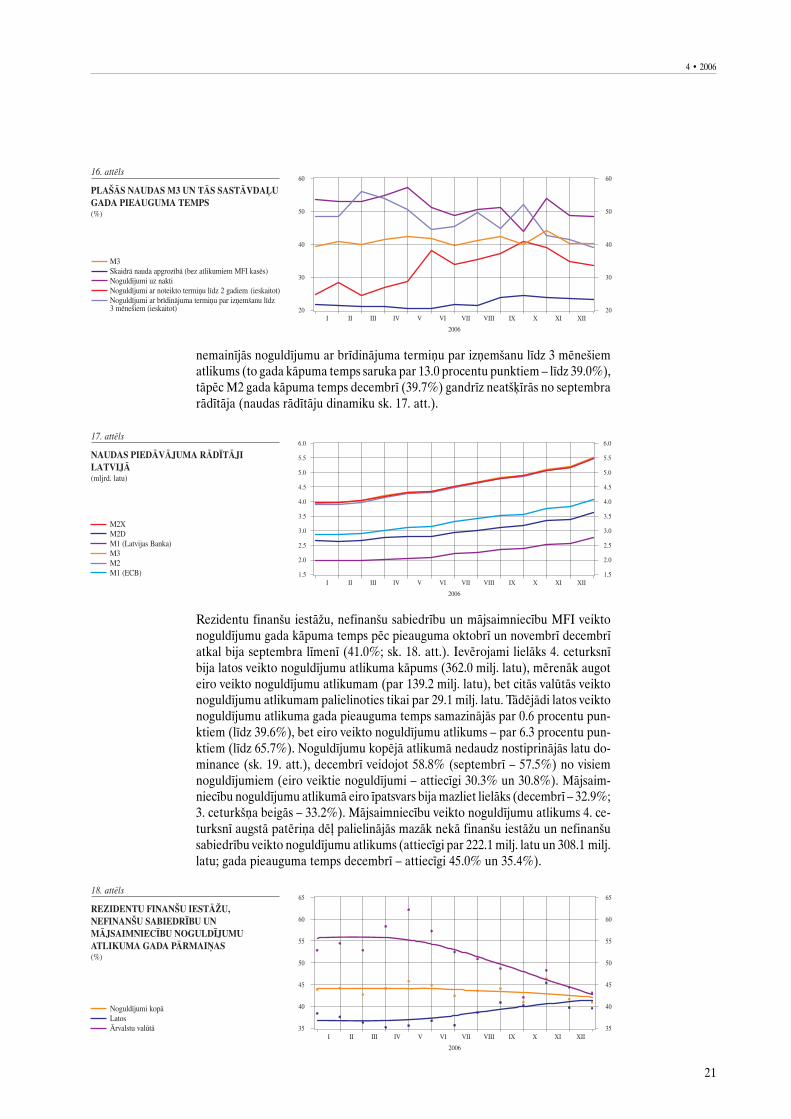
Plaðâs naudas M3 pieaugums 4. ceturksnî (606.9 milj. latu) bija sezonâli augsts unbûtiski pârsniedza iepriekðçjâ ceturkðòa kâpumu, tomçr M3 gada kâpuma tempspalielinâjâs tikai par 0.4 procentu punktiem (lîdz 40.3%; sk. 16. att.). Tâ kâuzkrâjumi galvenokârt tika izvietoti noguldîjumos uz nakti (kâpums 4. ceturksnî –439.1 milj. latu; gada pieauguma temps decembrî – 48.6%), straujâkais bija ðaurâsnaudas râdîtâja M1 gada pieaugums (41.7% salîdzinâjumâ ar 38.6% septembrî).Nozîmîgs bija arî skaidrâs naudas apgrozîbâ (bez atlikumiem MFI kasçs) pieau-gums (76.8 milj. latu), gada kâpuma tempam sasniedzot 23.3%. Savukârt visaimaz auga noguldîjumu ar noteikto termiòu lîdz 2 gadiem atlikums (to gada kâpumatemps 4. ceturksnî saruka par 7.3 procentu punktiem – lîdz 33.7%) un gandrîz
21
4 · 2006
nemainîjâs noguldîjumu ar brîdinâjuma termiòu par izòemðanu lîdz 3 mçneðiematlikums (to gada kâpuma temps saruka par 13.0 procentu punktiem – lîdz 39.0%),tâpçc M2 gada kâpuma temps decembrî (39.7%) gandrîz neatðíîrâs no septembrarâdîtâja (naudas râdîtâju dinamiku sk. 17. att.).
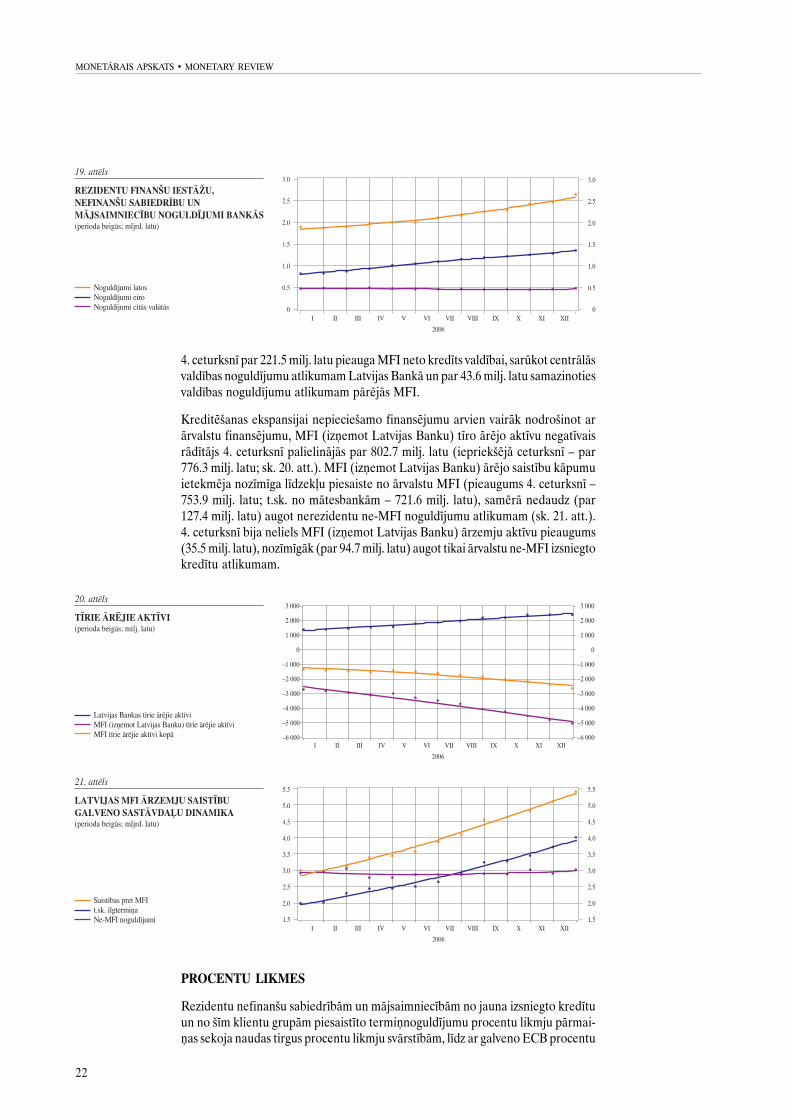
Rezidentu finanðu iestâþu, nefinanðu sabiedrîbu un mâjsaimniecîbu MFI veiktonoguldîjumu gada kâpuma temps pçc pieauguma oktobrî un novembrî decembrîatkal bija septembra lîmenî (41.0%; sk. 18. att.). Ievçrojami lielâks 4. ceturksnîbija latos veikto noguldîjumu atlikuma kâpums (362.0 milj. latu), mçrenâk augoteiro veikto noguldîjumu atlikumam (par 139.2 milj. latu), bet citâs valûtâs veiktonoguldîjumu atlikumam palielinoties tikai par 29.1 milj. latu. Tâdçjâdi latos veiktonoguldîjumu atlikuma gada pieauguma temps samazinâjâs par 0.6 procentu pun-ktiem (lîdz 39.6%), bet eiro veikto noguldîjumu atlikums – par 6.3 procentu pun-ktiem (lîdz 65.7%). Noguldîjumu kopçjâ atlikumâ nedaudz nostiprinâjâs latu do-minance (sk. 19. att.), decembrî veidojot 58.8% (septembrî – 57.5%) no visiemnoguldîjumiem (eiro veiktie noguldîjumi – attiecîgi 30.3% un 30.8%). Mâjsaim-niecîbu noguldîjumu atlikumâ eiro îpatsvars bija mazliet lielâks (decembrî – 32.9%;3. ceturkðòa beigâs – 33.2%). Mâjsaimniecîbu veikto noguldîjumu atlikums 4. ce-turksnî augstâ patçriòa dçï palielinâjâs mazâk nekâ finanðu iestâþu un nefinanðusabiedrîbu veikto noguldîjumu atlikums (attiecîgi par 222.1 milj. latu un 308.1 milj.latu; gada pieauguma temps decembrî – attiecîgi 45.0% un 35.4%).
22
MONETÂRAIS APSKATS · MONETARY REVIEW
4. ceturksnî par 221.5 milj. latu pieauga MFI neto kredîts valdîbai, sarûkot centrâlâsvaldîbas noguldîjumu atlikumam Latvijas Bankâ un par 43.6 milj. latu samazinotiesvaldîbas noguldîjumu atlikumam pârçjâs MFI.
Kreditçðanas ekspansijai nepiecieðamo finansçjumu arvien vairâk nodroðinot arârvalstu finansçjumu, MFI (izòemot Latvijas Banku) tîro ârçjo aktîvu negatîvaisrâdîtâjs 4. ceturksnî palielinâjâs par 802.7 milj. latu (iepriekðçjâ ceturksnî – par776.3 milj. latu; sk. 20. att.). MFI (izòemot Latvijas Banku) ârçjo saistîbu kâpumuietekmçja nozîmîga lîdzekïu piesaiste no ârvalstu MFI (pieaugums 4. ceturksnî –753.9 milj. latu; t.sk. no mâtesbankâm – 721.6 milj. latu), samçrâ nedaudz (par127.4 milj. latu) augot nerezidentu ne-MFI noguldîjumu atlikumam (sk. 21. att.).4. ceturksnî bija neliels MFI (izòemot Latvijas Banku) ârzemju aktîvu pieaugums(35.5 milj. latu), nozîmîgâk (par 94.7 milj. latu) augot tikai ârvalstu ne-MFI izsniegtokredîtu atlikumam.
PROCENTU LIKMES
Rezidentu nefinanðu sabiedrîbâm un mâjsaimniecîbâm no jauna izsniegto kredîtuun no ðîm klientu grupâm piesaistîto termiònoguldîjumu procentu likmju pârmai-òas sekoja naudas tirgus procentu likmju svârstîbâm, lîdz ar galveno ECB procentu
23
4 · 2006
likmju paaugstinâðanu pieaugot eiro izsniegto kredîtu un piesaistîto noguldîjumuprocentu likmçm.
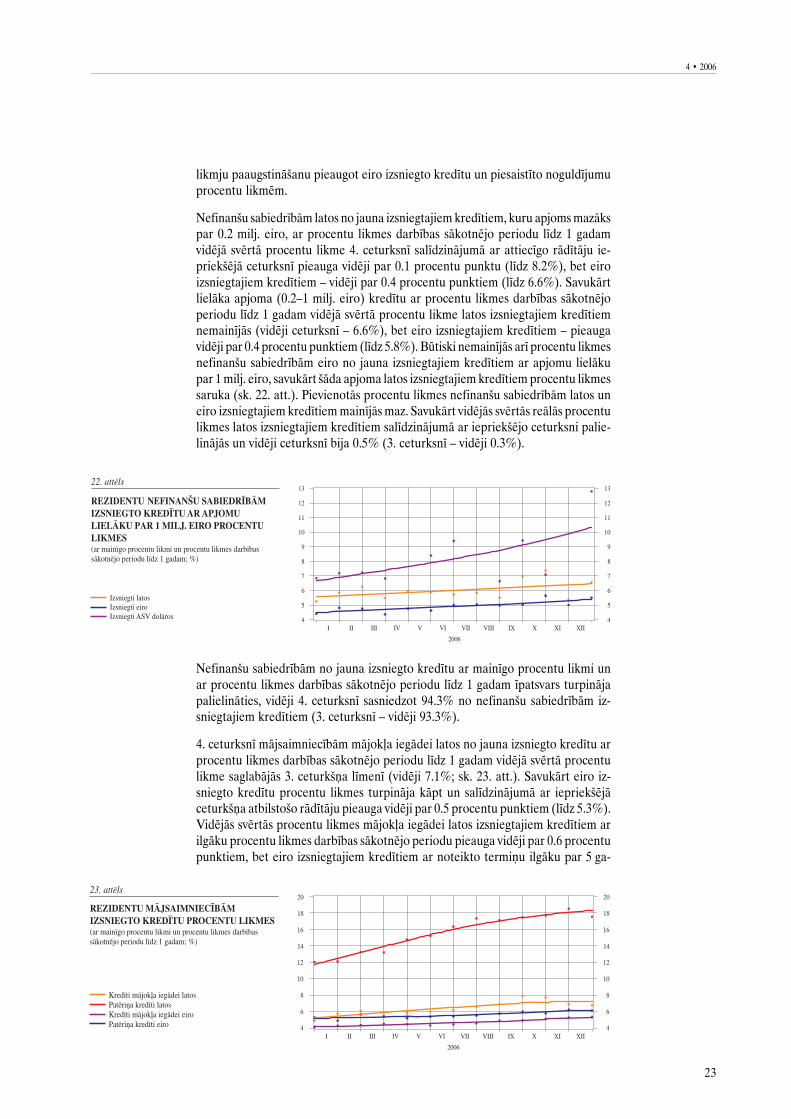
Nefinanðu sabiedrîbâm latos no jauna izsniegtajiem kredîtiem, kuru apjoms mazâkspar 0.2 milj. eiro, ar procentu likmes darbîbas sâkotnçjo periodu lîdz 1 gadamvidçjâ svçrtâ procentu likme 4. ceturksnî salîdzinâjumâ ar attiecîgo râdîtâju ie-priekðçjâ ceturksnî pieauga vidçji par 0.1 procentu punktu (lîdz 8.2%), bet eiroizsniegtajiem kredîtiem – vidçji par 0.4 procentu punktiem (lîdz 6.6%). Savukârtlielâka apjoma (0.2–1 milj. eiro) kredîtu ar procentu likmes darbîbas sâkotnçjoperiodu lîdz 1 gadam vidçjâ svçrtâ procentu likme latos izsniegtajiem kredîtiemnemainîjâs (vidçji ceturksnî – 6.6%), bet eiro izsniegtajiem kredîtiem – pieaugavidçji par 0.4 procentu punktiem (lîdz 5.8%). Bûtiski nemainîjâs arî procentu likmesnefinanðu sabiedrîbâm eiro no jauna izsniegtajiem kredîtiem ar apjomu lielâkupar 1 milj. eiro, savukârt ðâda apjoma latos izsniegtajiem kredîtiem procentu likmessaruka (sk. 22. att.). Pievienotâs procentu likmes nefinanðu sabiedrîbâm latos uneiro izsniegtajiem kredîtiem mainîjâs maz. Savukârt vidçjâs svçrtâs reâlâs procentulikmes latos izsniegtajiem kredîtiem salîdzinâjumâ ar iepriekðçjo ceturksni palie-linâjâs un vidçji ceturksnî bija 0.5% (3. ceturksnî – vidçji 0.3%).
Nefinanðu sabiedrîbâm no jauna izsniegto kredîtu ar mainîgo procentu likmi unar procentu likmes darbîbas sâkotnçjo periodu lîdz 1 gadam îpatsvars turpinâjapalielinâties, vidçji 4. ceturksnî sasniedzot 94.3% no nefinanðu sabiedrîbâm iz-sniegtajiem kredîtiem (3. ceturksnî – vidçji 93.3%).
4. ceturksnî mâjsaimniecîbâm mâjokïa iegâdei latos no jauna izsniegto kredîtu arprocentu likmes darbîbas sâkotnçjo periodu lîdz 1 gadam vidçjâ svçrtâ procentulikme saglabâjâs 3. ceturkðòa lîmenî (vidçji 7.1%; sk. 23. att.). Savukârt eiro iz-sniegto kredîtu procentu likmes turpinâja kâpt un salîdzinâjumâ ar iepriekðçjâceturkðòa atbilstoðo râdîtâju pieauga vidçji par 0.5 procentu punktiem (lîdz 5.3%).Vidçjâs svçrtâs procentu likmes mâjokïa iegâdei latos izsniegtajiem kredîtiem arilgâku procentu likmes darbîbas sâkotnçjo periodu pieauga vidçji par 0.6 procentupunktiem, bet eiro izsniegtajiem kredîtiem ar noteikto termiòu ilgâku par 5 ga-
24
MONETÂRAIS APSKATS · MONETARY REVIEW
diem – samazinâjâs vidçji par 0.3 procentu punktiem. Pievienotâs procentu likmesmâjokïa iegâdei izsniegtajiem kredîtiem bûtiski nemainîjâs, uzcenojumam pieaugotmâjokïa iegâdei latos no jauna izsniegtajiem kredîtiem ar procentu likmes dar-bîbas sâkotnçjo periodu ilgâku par 1 gadu, bet samazinoties mâjokïa iegâdei eirono jauna izsniegtajiem kredîtiem ar procentu likmes darbîbas sâkotnçjo perioduilgâku par 1 gadu.
Mâjsaimniecîbâm latos no jauna izsniegto patçriòa kredîtu (galvenokârt norçíinukarðu kredîti un patçriòa kredîti bez nodroðinâjuma) procentu likmes 4. ceturksnîturpinâja palielinâties – patçriòa kredîtiem ar procentu likmes darbîbas sâkotnçjoperiodu lîdz 1 gadam vidçjâ svçrtâ procentu likme 4. ceturksnî salîdzinâjumâ arattiecîgo râdîtâju iepriekðçjâ ceturksnî pieauga vidçji par 0.6 procentu punktiem(lîdz 17.9%). Dominçjoðo eiro izsniegto patçriòa kredîtu (galvenokârt patçriòakredîti ar nodroðinâjumu) ar procentu likmes darbîbas sâkotnçjo periodu lîdz 1 ga-dam vidçjâ svçrtâ procentu likme pieauga vidçji par 0.3 procentu punktiem (lîdz6.1%).
Nedaudz samazinoties inflâcijai un augot procentu likmçm, mâjsaimniecîbâm mâ-jokïa iegâdei latos izsniegto kredîtu reâlâs procentu likmes 4. ceturksnî palielinâjâs,vidçji ceturksnî veidojot 0.8% (3. ceturksnî – 0.3%). Latos izsniegto patçriòa kredîtureâlâs procentu likmes vidçji ceturksnî sasniedza 11.0% (3. ceturksnî – 10.2%).
4. ceturksnî turpina samazinâties mâjsaimniecîbâm no jauna izsniegto kredîtu arprocentu likmes darbîbas sâkotnçjo periodu lîdz 1 gadam îpatsvars (lîdz 79.0%;vidçji 3. ceturksnî – 81.3).
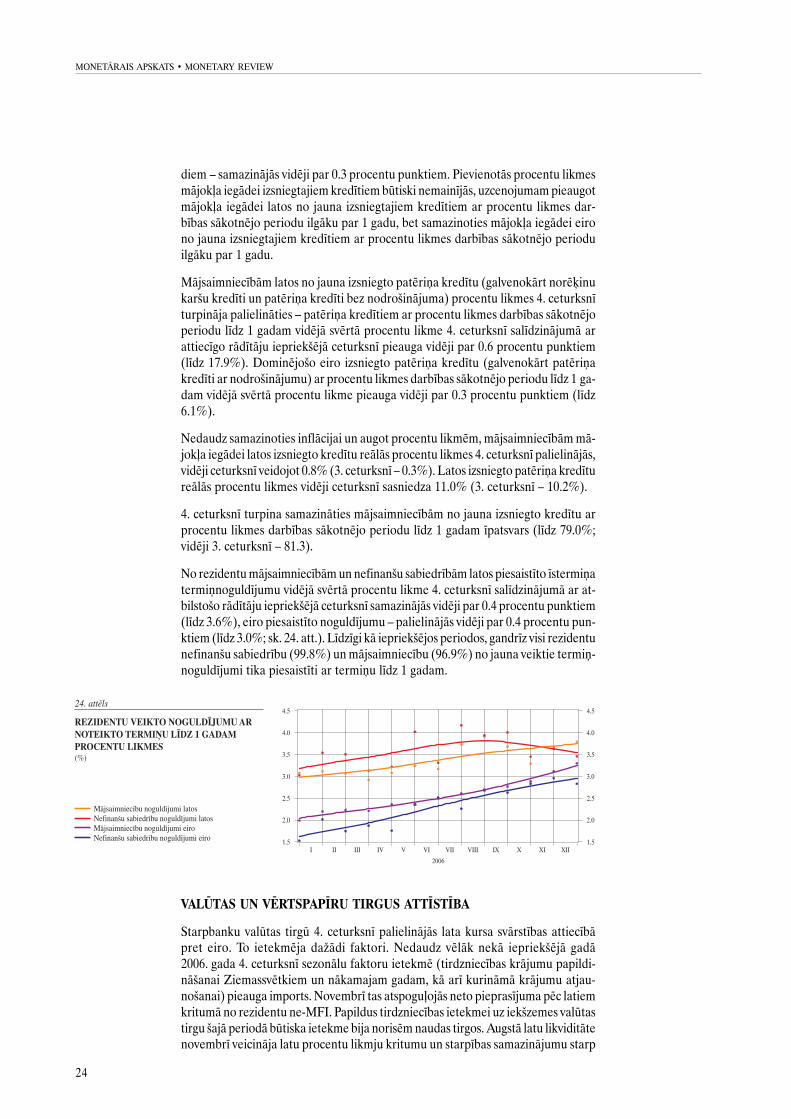
No rezidentu mâjsaimniecîbâm un nefinanðu sabiedrîbâm latos piesaistîto îstermiòatermiònoguldîjumu vidçjâ svçrtâ procentu likme 4. ceturksnî salîdzinâjumâ ar at-bilstoðo râdîtâju iepriekðçjâ ceturksnî samazinâjâs vidçji par 0.4 procentu punktiem(lîdz 3.6%), eiro piesaistîto noguldîjumu – palielinâjâs vidçji par 0.4 procentu pun-ktiem (lîdz 3.0%; sk. 24. att.). Lîdzîgi kâ iepriekðçjos periodos, gandrîz visi rezidentunefinanðu sabiedrîbu (99.8%) un mâjsaimniecîbu (96.9%) no jauna veiktie termiò-noguldîjumi tika piesaistîti ar termiòu lîdz 1 gadam.
VALÛTAS UN VÇRTSPAPÎRU TIRGUS ATTÎSTÎBA
Starpbanku valûtas tirgû 4. ceturksnî palielinâjâs lata kursa svârstîbas attiecîbâpret eiro. To ietekmçja daþâdi faktori. Nedaudz vçlâk nekâ iepriekðçjâ gadâ2006. gada 4. ceturksnî sezonâlu faktoru ietekmç (tirdzniecîbas krâjumu papildi-nâðanai Ziemassvçtkiem un nâkamajam gadam, kâ arî kurinâmâ krâjumu atjau-noðanai) pieauga imports. Novembrî tas atspoguïojâs neto pieprasîjuma pçc latiemkritumâ no rezidentu ne-MFI. Papildus tirdzniecîbas ietekmei uz iekðzemes valûtastirgu ðajâ periodâ bûtiska ietekme bija norisçm naudas tirgos. Augstâ latu likviditâtenovembrî veicinâja latu procentu likmju kritumu un starpîbas samazinâjumu starp
25
4 · 2006
eiro un latu procentu likmçm. Novembra beigâs lata kurss attiecîbâ pret eiro sa-mazinâjâs, un atseviðíos periodos banku individuâlâs kursa kotâcijas starpbankuvalûtas tirgû attâlinâjâs no Latvijas Bankas noteiktâ eiro pirkðanas kursa (1 EUR =Ls 0.6958) pat par 35 punktiem. Pakâpeniski lata kurss attiecîbâ pret eiro palieli-nâjâs, taèu decembra beigâs tas nebija sasniedzis septembra beigu lîmeni.
4. ceturksnî valûtas darîjumu apgrozîjums pârsniedza 420 mljrd. latu. Nozîmîgâkiedarîjuma partneri valûtu pirkðanâ un pârdoðanâ bija nerezidentu MFI (noslçgtidarîjumi par 212.1 mljrd. latu) un ne-MFI (izòemot mâjsaimniecîbas; 134.2 mljrd.latu). Darîjumu apjoma pieaugums ar nerezidentu MFI nedaudz samazinâjâs, betdarîjumos ar nerezidentu ne-MFI (izòemot mâjsaimniecîbas) tas salîdzinâjumâar iepriekðçjâ gada atbilstoðo periodu uzrâdîja stabilu kâpumu. Bûtiski un straujipieauga valûtas darîjumu apgrozîjums iekðzemes starpbanku tirgû (4. ceturksnî –58.8 mljrd. latu; 2.0 reizes vairâk nekâ iepriekðçjâ gada atbilstoðajâ periodâ). Valûtasdarîjumu apjoms ar rezidentu nefinanðu sabiedrîbâm turpinâja palielinâties, taèuto îpatsvars kopçjâ valûtas darîjumu apjomâ, tâpat kâ 2006. gadâ kopumâ, joprojâmbija mazâks par 5%.
Vçl straujâk nekâ starpbanku tirgû pieauga valûtas pirkðanas un pârdoðanas apjomsar mâjsaimniecîbâm veiktajos darîjumos. 2006. gadâ ðo darîjumu gada pieaugumspârsniedza divas reizes, un 4. ceturksnî to apjoms bija 5.5 mljrd. latu. Lai arî armâjsaimniecîbâm veikto valûtas maiòas darîjumu apjoms jau ilgstoði palielinâjâs(ðî tendence ir kopð 2004. gada), 2006. gadâ notika ïoti straujð ar mâjsaimniecîbâmveikto valûtas darîjumu apjoma pieaugums, kuru noteica joprojâm straujais ârvalstuvalûtâs izsniegto kredîtu atlikuma kâpums. Ar mâjsaimniecîbâm veiktajos valûtasmaiòas darîjumos nozîmîgs bija arî tûrisma nozares attîstîbas un daudzo Rîgânotikuðo starptautisko pasâkumu ieguldîjums, kâ arî Latvijas iedzîvotâju ârvalstîsgûto darba ienâkumu konvertâcija.
Valûtas darîjumu veidu dalîjumâ bûtiski pieauga valûtas mijmaiòas darîjumu ap-grozîjums (4. ceturksnî – 266.8 mljrd. latu). To ietekmçja tieði rezidentu MFI sav-starpçjo darîjumu apjoma straujais pieaugums. Lai gan mijmaiòas darîjumu kop-apjomâ darîjumi ar rezidentu MFI veido ne vairâk par 25%, to apjoms 4. ceturksnî,tâpat kâ 2006. gadâ kopumâ, katru mçnesi salîdzinâjumâ ar iepriekðçjâ gada at-bilstoðo periodu palielinâjâs vidçji 2.2 reizes. 4. ceturksnî veikto tagadnes darîjumukopapjoms (150.0 mljrd. latu) salîdzinâjumâ ar 2005. gada 4. ceturksni samazinâjâspar 5.9%.
Kopð 2005. gada jûlija valûtas maiòas darîjumos pret latiem dominç eiro. Tomçrpretstatâ 2006. gada 1. pusgadam, kad eiro îpatsvars valûtu darîjumos ar latiemkonsekventi pieauga, bet ASV dolâra îpatsvars – tikpat konsekventi samazinâjâs,2006. gada 2. pusgadâ (t.sk. 4. ceturksnî) abu valûtu relatîvâ nozîme valûtas maiòasdarîjumos pret latiem stabilizçjâs. 4. ceturksnî eiro îpatsvars visos valûtas maiòasdarîjumos pret latiem svârstîjâs ap 60%, savukârt ASV dolâra îpatsvars bija aptu-veni 37%.
Sâkotnçjâ tirgû 4. ceturksnî notika valsts iekðçjâ aizòçmuma 6 un 12 mçneðu pa-râdzîmju un 5 gadu obligâciju izsole. Tâ kâ Valsts kasei bija lieli lîdzekïu uzkrâjumi,tâ no decembrî plânotajâm divâm valsts iekðçjâ aizòçmuma vçrtspapîru (tâlâk tek-stâ – valdîbas vçrtspapîri) izsolçm rîkoja tikai vienu. Valdîbas vçrtspapîru kopçjaispiedâvâjums bija 103.0 milj. latu (2.9 reizes lielâks nekâ iepriekðçjâ ceturksnî).Piedâvâjuma pieaugumu noteica nepiecieðamîba finansçt valdîbas izdevumu kâ-pumu. Savukârt pieprasîjums bija 110.6 milj. latu, bet pârdotais apjoms – 61.6 milj.latu (attiecîgi 9.8 un 26.3 reizes vairâk nekâ iepriekðçjâ ceturksnî). Arî vçrtspapîrupârdotâ apjoma attiecîba pret piedâvâjumu 4. ceturksnî bija augstâka, jo izsolçspalielinâjâs procentu likmes. Salîdzinâjumâ ar iepriekðçjâm izsolçm 6 mçneðu pa-
26
MONETÂRAIS APSKATS · MONETARY REVIEW
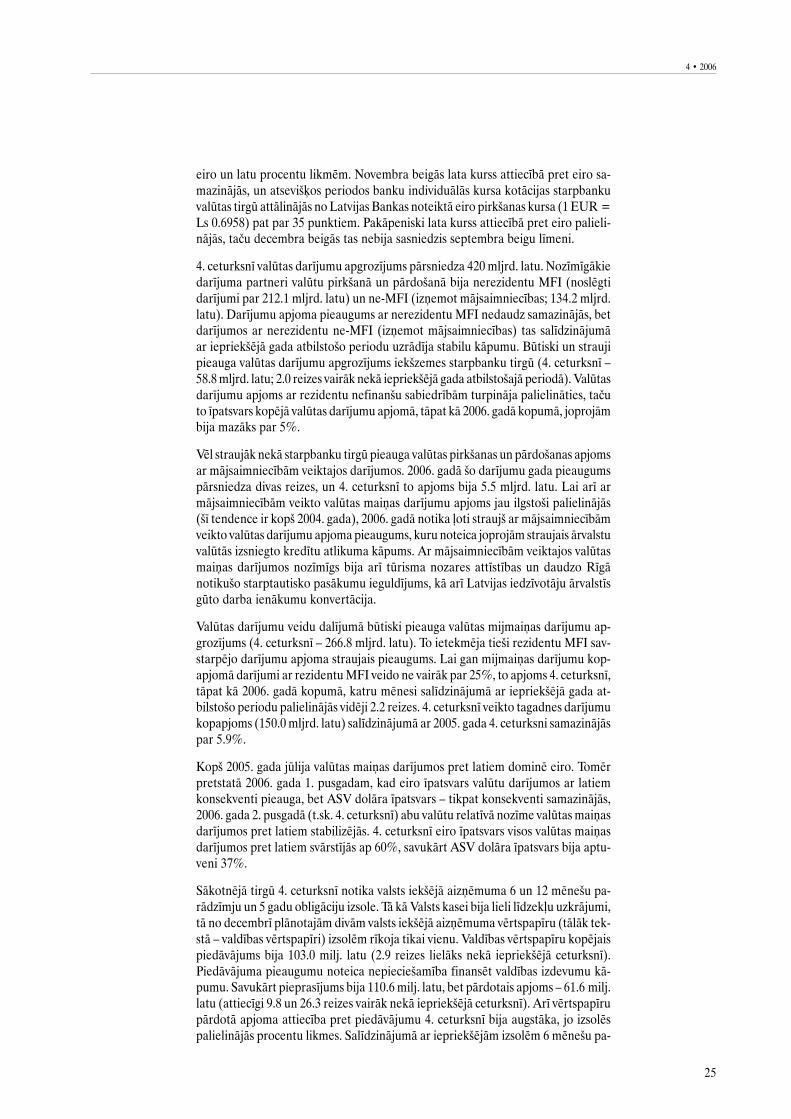
râdzîmju vidçjâ peïòas likme pieauga no 3.59% lîdz 4.84%, 12 mçneðu parâdzî-mçm – no 4.00% lîdz 4.83%. Savukârt 5 gadu obligâciju vidçjâ svçrtâ peïòas likmebija 5.13% salîdzinâjumâ ar 3.30% 2005. gada martâ notikuðajâ 5 gadu obligâcijuizsolç (sk. 25. att.).
Latvijas valdîbas vçrtspapîru atlikums apgrozîbâ pçc samazinâjuma 3. ceturksnîsâkotnçjâ tirgus darîjumu ietekmç atkal pieauga (par 15.2%; lîdz 418.7 milj. latu).
Valdîbas emitçto vçrtspapîru turçtâji 4. ceturkðòa beigâs bija Latvijas bankas(57.1%), pârçjie rezidenti (36.0%) un nerezidenti (6.9%). Salîdzinâjumâ ar ie-priekðçjo ceturksni strukturâlâs pârmaiòas saistîtas ar Latvijas Banku, kurai 3. ce-turksnî piederçja 5.8% no valdîbas vçrtspapîriem.
RFB 10 gadu (sâkotnçjais termiòð) valsts obligâciju (ar dzçðanas termiòu 2015. ga-dâ) pirkðanas likme otrreizçjâ tirgû 4. ceturksnî palielinâjâs no 4.83% lîdz 5.00%un 12 mçneðu parâdzîmju pirkðanas likme – no 4.12% lîdz 4.50%. Kopð gada sâ-kuma vçrojamais procentu likmju kâpums turpinâjâs; to noteica augstâ inflâcijaun valsts budþeta deficîta izveidoðanâs, kâ arî Latvijas Bankas intervences vçrts-papîru otrreizçjâ tirgû iepriekðçjos divos ceturkðòos. Latvijas eiroobligâciju (ardzçðanas termiòu 2014. gadâ) pirkðanas likme palielinâjâs no 3.83% lîdz 4.15%.Palielinâjuma iemesls bija obligâciju procentu likmju kâpums Eiropâ, bet procentulikmju starpîba ar Vâcijas attiecîgâ termiòa eiroobligâcijâm palielinâjâs tikai par1 bâzes punktu (lîdz 20 bâzes punktiem). VAS "Latvijas Hipotçku un zemes banka"latu obligâciju (ar dzçðanas termiòu 2013. gadâ) pirkðanas likme RFB 4. ceturksnîmainîjâs minimâli (5.18%).
LCD reìistrçto latos denominçto korporatîvo parâda vçrtspapîru atlikums 4. ce-turksnî samazinâjâs no 77.4 milj. latu lîdz 49.8 milj. latu. Tika dzçstas 5 emisijas,no tâm lielâkâs bija divas Norddeutsche Landesbank Girozentrale ilgtermiòa obli-gâciju emisijas (kopâ – 13 milj. latu), bet viena emisija (West LB AG ilgtermiòaobligâciju emisija 13 milj. latu apjomâ) tika dzçsta pirms termiòa. Bija tikai vienajauna emisija – AS "SEB Latvijas Unibanka" emitçja îstermiòa noguldîjumu serti-fikâtus 2.1 milj. latu apjomâ.
4. ceturksnî parâda vçrtspapîru apgrozîjums RFB bija 4.4 reizes lielâks nekâ 3. ce-turksnî (611 tûkst. latu). VAS "Latvijas Hipotçku un zemes banka" hipotekâroíîlu zîmju apgrozîjums veidoja 64.3% no parâda vçrtspapîru apgrozîjuma (iepriek-ðçjâ ceturksnî hipotekâro íîlu zîmju apgrozîjums – 85.6% no kopçjâ apgrozîjuma),bet pârçjais bija valdîbas vçrtspapîru apgrozîjums.
OMX Riga 4. ceturksnî palielinâjâs par 7.9%, bet BALTIX pieauga par 19.1%. Laigan paziòotie 9 mçneðu rezultâti izmaksu sadârdzinâjuma dçï izrâdîjâs nedaudzsliktâki nekâ iepriekðçjâ gadâ, tomçr kopumâ saglabâjâs pozitîvas nâkotnes per-spektîvas un akciju indekss turpinâja augt. Latvijas akciju tirgus kapitalizâcija pie-
27
4 · 2006
auga par 13.9% (lîdz 1 430 milj. latu). RFB apgrozîjums 4. ceturksnî bija 16.2 milj.latu (par 62.0% vairâk nekâ 3. ceturksnî). Vislielâkais apgrozîjums bija ar AS "Grin-deks" akcijâm (6.0 milj. latu). AS "Grindeks" izteica akciju atpirkðanas piedâvâjumuAS "Tallinas Farmaceitiskâ rûpnîca" mazajiem akcionâriem, kâ arî palielinâja inves-tîcijas raþoðanas attîstîbai. Bija vçrojama ârvalstu investoru interese par AS "Grin-deks" akcijâm.
5. oktobrî tika pârdotas valstij piederoðâs AS "Ventspils nafta" akcijas, piedâvâjot38.6% no kopapjoma jeb 40.3 milj. akciju un minimâlo cenu nosakot Ls 1.81 parakciju. Izolç pieprasîjums bija mazliet lielâks nekâ piedâvâjums un akcijas tikanopirktas, maksâjot Ls 1.84 par akciju. Nîderlandes naftas kompânija Vitol Group
nopirka 34% no AS "Ventspils nafta" akcijâm, apòemoties palielinât AS "Ventspilsnafta" naftas terminâïu apgrozîjumu.
MFI DARBÎBA
4. ceturkðòa beigâs Latvijas Republikâ bija reìistrçtas 64 MFI (izòemot LatvijasBanku), t.sk. 21 banka, trîs ârvalstu banku filiâles, 35 krâjaizdevu sabiedrîbas, trîselektroniskâs naudas institûcijas un divi naudas tirgus fondi.
Kopçjais apmaksâtais MFI pamatkapitâls 4. ceturkðòa beigâs bija 590.1 milj. latu(par 1.4% vairâk nekâ 3. ceturkðòa beigâs). Ârvalstu kapitâla îpatsvars apmaksâtajâpamatkapitâlâ nedaudz palielinâjâs (lîdz 68.6%).
Visi nozîmîgâkie MFI darbîbas râdîtâji salîdzinâjumâ ar 3. ceturkðòa beigâm tur-pinâja augt, t.sk. aktîvi (neieskaitot aktîvus pârvaldîðanâ) – par 11.0% (lîdz15.9 mljrd. latu), izsniegto kredîtu atlikums (ieskaitot tranzîtkredîtus) – par 13.3%(lîdz 10.8 mljrd. latu) un noguldîjumu atlikums – par 8.7% (lîdz 7.7 mljrd. latu).MFI neauditçtâ 2006. gada peïòa bija 266.9 milj. latu (1.4 reizes vairâk nekâ ie-priekðçjâ gadâ). Kapitâls un rezerves palielinâjâs par 97.6 milj. latu un 4. ceturkðòabeigâs sasniedza 1.2 mljrd. latu.
Banku pelnîtspçjas râdîtâji nedaudz pieauga. Kapitâla atdeve (ROE) 4. ceturkðòabeigâs bija 26.3% un aktîvu atdeve (ROA) – 2.1%. Kapitâla pietiekamîbas râdîtâjssamazinâjâs (lîdz 10.2%).
Galvenie banku ienâkumu avoti 4. ceturksnî joprojâm bija procentu ienâkumi none-MFI izsniegtajiem kredîtiem (50.9% no kopçjiem banku ienâkumiem) un ko-misijas naudas ienâkumi (17.8%), kâ arî procentu ienâkumi par prasîbâm pretMFI (8.8%).
Lai gan kreditçðana joprojâm strauji pieauga, kredîtu kvalitâte arî 4. ceturksnîbija augsta. Ienâkumus nenesoðo kredîtu atlikums 4. ceturkðòa beigâs, tâpat kâ3. ceturksnî, bija 0.4% no ne-MFI izsniegto kredîtu atlikuma.
Speciâlo uzkrâjumu ne-MFI izsniegtajiem kredîtiem attiecîba pret ne-MFI iz-sniegto kredîtu atlikumu salîdzinâjumâ ar iepriekðçjo ceturksni nemainîjâs (0.5%).Speciâlie uzkrâjumi ne-MFI izsniegtajiem kredîtiem 4. ceturkðòa beigâs sedza116.6% ienâkumus nenesoðo kredîtu atlikuma.
NAUDAS RÂDÎTÂJU SEZONÂLÂ IZLÎDZINÂÐANA
Latvijas Banka ar 2005. gada 1. ceturksni publicç atbilstoði ECB metodoloìijaiaprçíinâto monetâro râdîtâju M1, M2 un M3 sezonâli izlîdzinâtâs laikrindas.
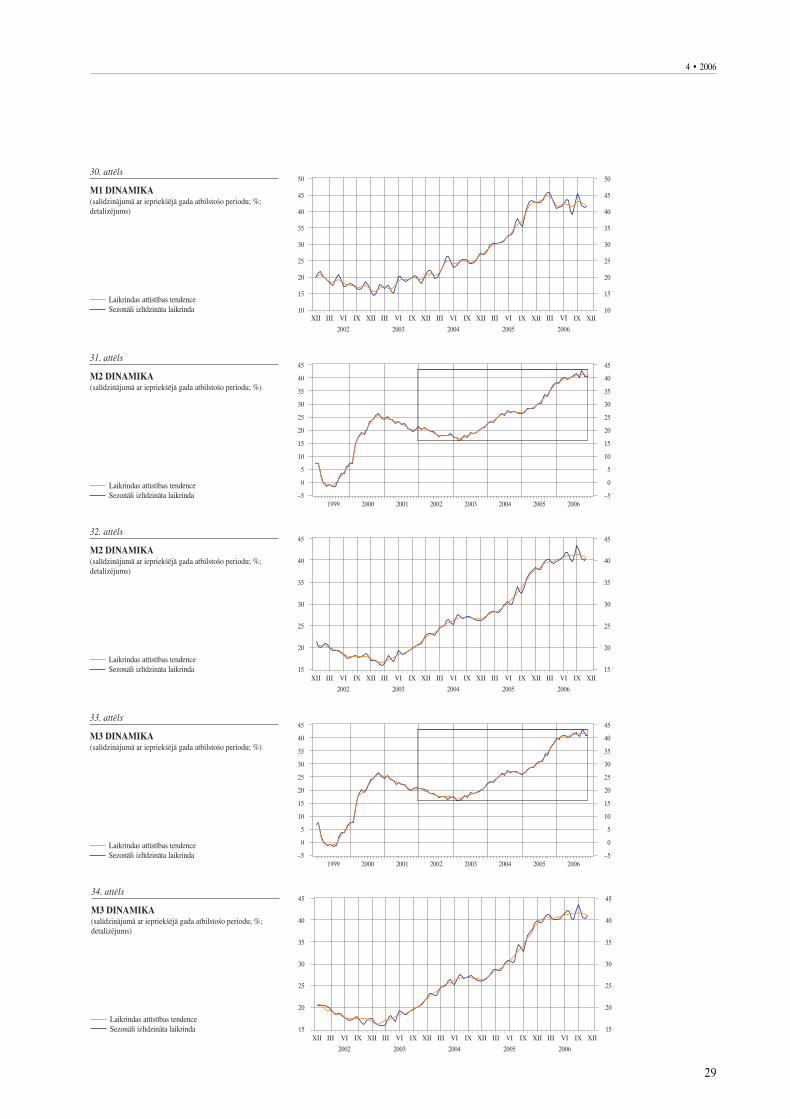
Monetâro râdîtâju M1, M2 un M3 dinamikas analîze, kas veikta ar programmpro-
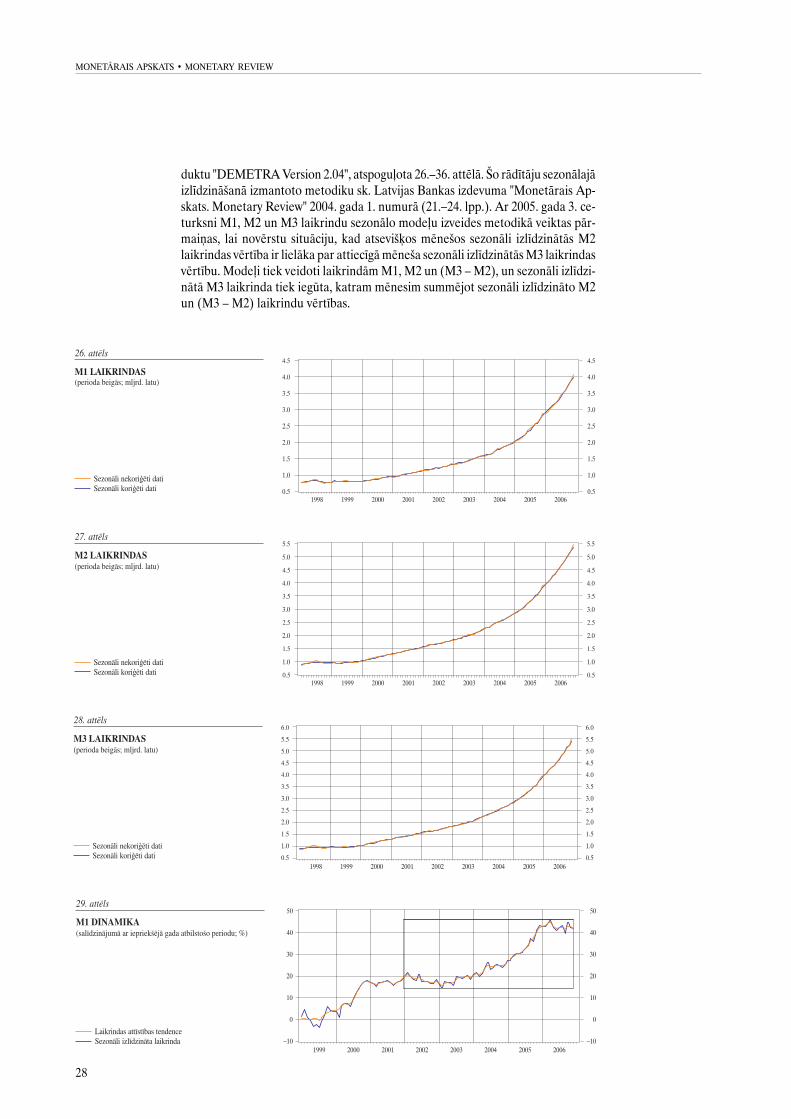
28
MONETÂRAIS APSKATS · MONETARY REVIEW
duktu "DEMETRA Version 2.04", atspoguïota 26.–36. attçlâ. Ðo râdîtâju sezonâlajâizlîdzinâðanâ izmantoto metodiku sk. Latvijas Bankas izdevuma "Monetârais Ap-skats. Monetary Review" 2004. gada 1. numurâ (21.–24. lpp.). Ar 2005. gada 3. ce-turksni M1, M2 un M3 laikrindu sezonâlo modeïu izveides metodikâ veiktas pâr-maiòas, lai novçrstu situâciju, kad atseviðíos mçneðos sezonâli izlîdzinâtâs M2laikrindas vçrtîba ir lielâka par attiecîgâ mçneða sezonâli izlîdzinâtâs M3 laikrindasvçrtîbu. Modeïi tiek veidoti laikrindâm M1, M2 un (M3 – M2), un sezonâli izlîdzi-nâtâ M3 laikrinda tiek iegûta, katram mçnesim summçjot sezonâli izlîdzinâto M2un (M3 – M2) laikrindu vçrtîbas.
29
4 · 2006
30
MONETÂRAIS APSKATS · MONETARY REVIEW
LATVIJAS BANKAS STARPBANKU MAKSÂJUMU SISTÇMUSTATISTIKA
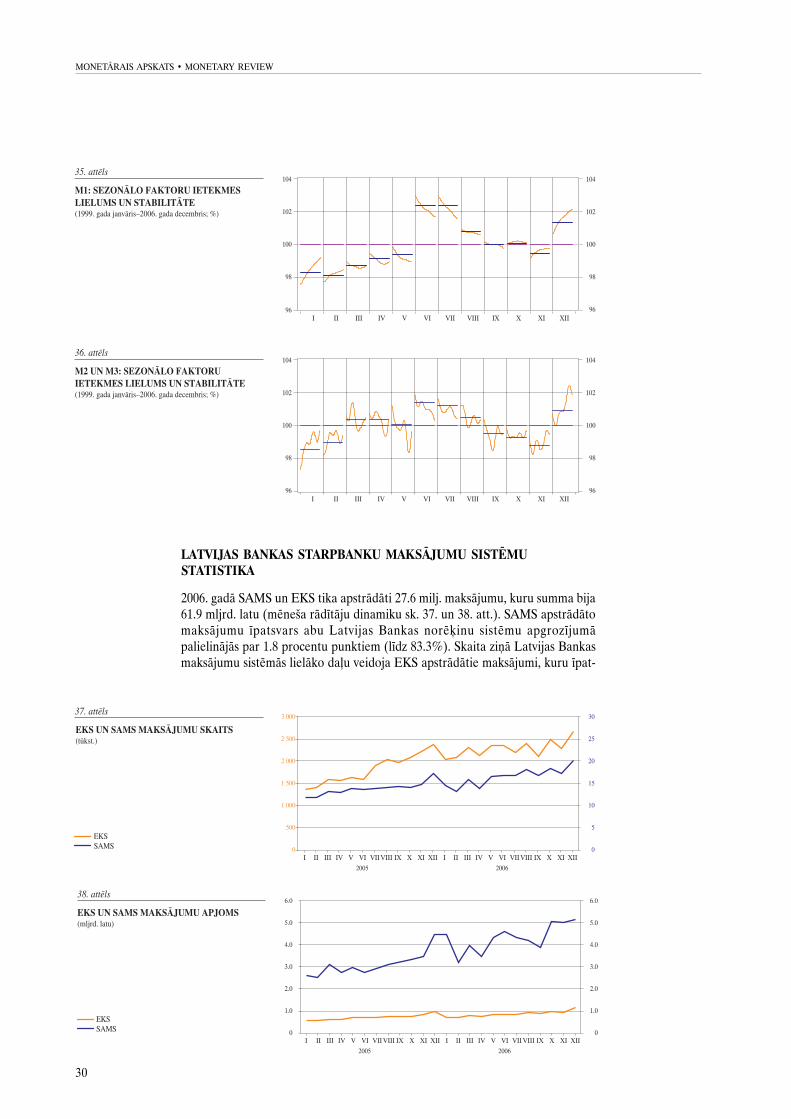
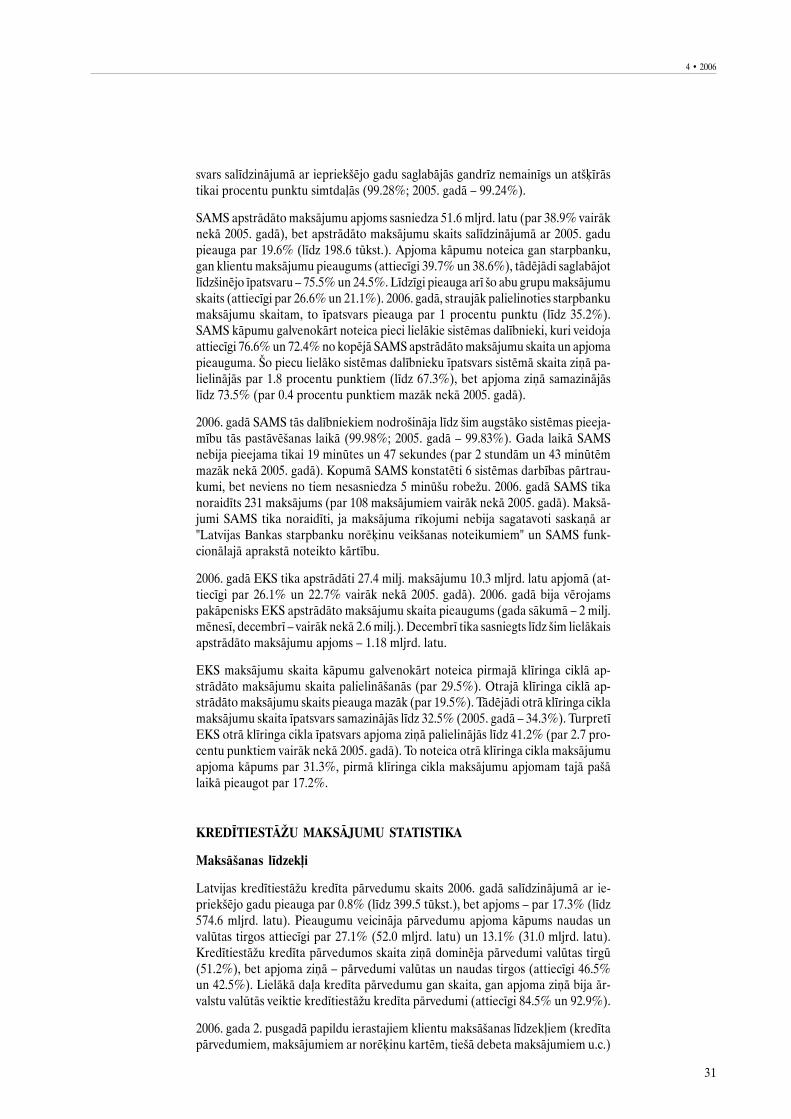
2006. gadâ SAMS un EKS tika apstrâdâti 27.6 milj. maksâjumu, kuru summa bija61.9 mljrd. latu (mçneða râdîtâju dinamiku sk. 37. un 38. att.). SAMS apstrâdâtomaksâjumu îpatsvars abu Latvijas Bankas norçíinu sistçmu apgrozîjumâpalielinâjâs par 1.8 procentu punktiem (lîdz 83.3%). Skaita ziòâ Latvijas Bankasmaksâjumu sistçmâs lielâko daïu veidoja EKS apstrâdâtie maksâjumi, kuru îpat-
31
4 · 2006
svars salîdzinâjumâ ar iepriekðçjo gadu saglabâjâs gandrîz nemainîgs un atðíîrâstikai procentu punktu simtdaïâs (99.28%; 2005. gadâ – 99.24%).
SAMS apstrâdâto maksâjumu apjoms sasniedza 51.6 mljrd. latu (par 38.9% vairâknekâ 2005. gadâ), bet apstrâdâto maksâjumu skaits salîdzinâjumâ ar 2005. gadupieauga par 19.6% (lîdz 198.6 tûkst.). Apjoma kâpumu noteica gan starpbanku,gan klientu maksâjumu pieaugums (attiecîgi 39.7% un 38.6%), tâdçjâdi saglabâjotlîdzðinçjo îpatsvaru – 75.5% un 24.5%. Lîdzîgi pieauga arî ðo abu grupu maksâjumuskaits (attiecîgi par 26.6% un 21.1%). 2006. gadâ, straujâk palielinoties starpbankumaksâjumu skaitam, to îpatsvars pieauga par 1 procentu punktu (lîdz 35.2%).SAMS kâpumu galvenokârt noteica pieci lielâkie sistçmas dalîbnieki, kuri veidojaattiecîgi 76.6% un 72.4% no kopçjâ SAMS apstrâdâto maksâjumu skaita un apjomapieauguma. Ðo piecu lielâko sistçmas dalîbnieku îpatsvars sistçmâ skaita ziòâ pa-lielinâjâs par 1.8 procentu punktiem (lîdz 67.3%), bet apjoma ziòâ samazinâjâslîdz 73.5% (par 0.4 procentu punktiem mazâk nekâ 2005. gadâ).
2006. gadâ SAMS tâs dalîbniekiem nodroðinâja lîdz ðim augstâko sistçmas pieeja-mîbu tâs pastâvçðanas laikâ (99.98%; 2005. gadâ – 99.83%). Gada laikâ SAMSnebija pieejama tikai 19 minûtes un 47 sekundes (par 2 stundâm un 43 minûtçmmazâk nekâ 2005. gadâ). Kopumâ SAMS konstatçti 6 sistçmas darbîbas pârtrau-kumi, bet neviens no tiem nesasniedza 5 minûðu robeþu. 2006. gadâ SAMS tikanoraidîts 231 maksâjums (par 108 maksâjumiem vairâk nekâ 2005. gadâ). Maksâ-jumi SAMS tika noraidîti, ja maksâjuma rîkojumi nebija sagatavoti saskaòâ ar"Latvijas Bankas starpbanku norçíinu veikðanas noteikumiem" un SAMS funk-cionâlajâ aprakstâ noteikto kârtîbu.
2006. gadâ EKS tika apstrâdâti 27.4 milj. maksâjumu 10.3 mljrd. latu apjomâ (at-tiecîgi par 26.1% un 22.7% vairâk nekâ 2005. gadâ). 2006. gadâ bija vçrojamspakâpenisks EKS apstrâdâto maksâjumu skaita pieaugums (gada sâkumâ – 2 milj.mçnesî, decembrî – vairâk nekâ 2.6 milj.). Decembrî tika sasniegts lîdz ðim lielâkaisapstrâdâto maksâjumu apjoms – 1.18 mljrd. latu.
EKS maksâjumu skaita kâpumu galvenokârt noteica pirmajâ klîringa ciklâ ap-strâdâto maksâjumu skaita palielinâðanâs (par 29.5%). Otrajâ klîringa ciklâ ap-strâdâto maksâjumu skaits pieauga mazâk (par 19.5%). Tâdçjâdi otrâ klîringa ciklamaksâjumu skaita îpatsvars samazinâjâs lîdz 32.5% (2005. gadâ – 34.3%). TurpretîEKS otrâ klîringa cikla îpatsvars apjoma ziòâ palielinâjâs lîdz 41.2% (par 2.7 pro-centu punktiem vairâk nekâ 2005. gadâ). To noteica otrâ klîringa cikla maksâjumuapjoma kâpums par 31.3%, pirmâ klîringa cikla maksâjumu apjomam tajâ paðâlaikâ pieaugot par 17.2%.
KREDÎTIESTÂÞU MAKSÂJUMU STATISTIKA
Maksâðanas lîdzekïi
Latvijas kredîtiestâþu kredîta pârvedumu skaits 2006. gadâ salîdzinâjumâ ar ie-priekðçjo gadu pieauga par 0.8% (lîdz 399.5 tûkst.), bet apjoms – par 17.3% (lîdz574.6 mljrd. latu). Pieaugumu veicinâja pârvedumu apjoma kâpums naudas unvalûtas tirgos attiecîgi par 27.1% (52.0 mljrd. latu) un 13.1% (31.0 mljrd. latu).Kredîtiestâþu kredîta pârvedumos skaita ziòâ dominçja pârvedumi valûtas tirgû(51.2%), bet apjoma ziòâ – pârvedumi valûtas un naudas tirgos (attiecîgi 46.5%un 42.5%). Lielâkâ daïa kredîta pârvedumu gan skaita, gan apjoma ziòâ bija âr-valstu valûtâs veiktie kredîtiestâþu kredîta pârvedumi (attiecîgi 84.5% un 92.9%).
2006. gada 2. pusgadâ papildu ierastajiem klientu maksâðanas lîdzekïiem (kredîtapârvedumiem, maksâjumiem ar norçíinu kartçm, tieðâ debeta maksâjumiem u.c.)
32
MONETÂRAIS APSKATS · MONETARY REVIEW
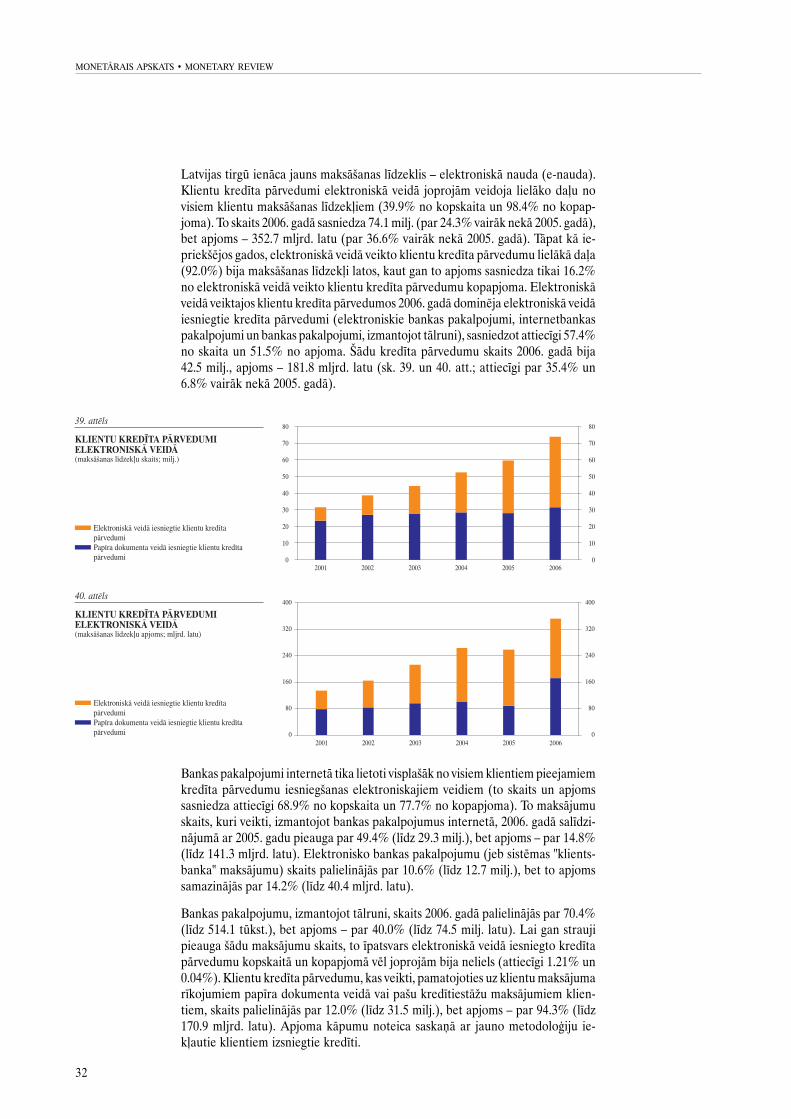
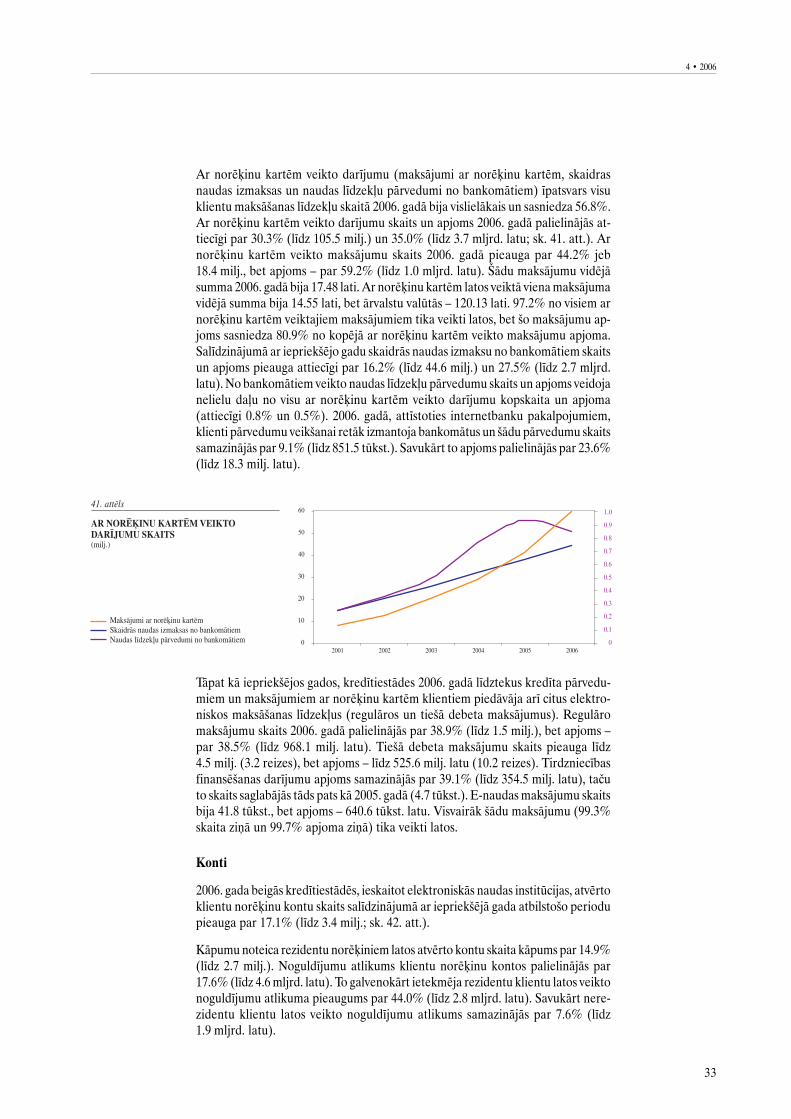
Latvijas tirgû ienâca jauns maksâðanas lîdzeklis – elektroniskâ nauda (e-nauda).Klientu kredîta pârvedumi elektroniskâ veidâ joprojâm veidoja lielâko daïu novisiem klientu maksâðanas lîdzekïiem (39.9% no kopskaita un 98.4% no kopap-joma). To skaits 2006. gadâ sasniedza 74.1 milj. (par 24.3% vairâk nekâ 2005. gadâ),bet apjoms – 352.7 mljrd. latu (par 36.6% vairâk nekâ 2005. gadâ). Tâpat kâ ie-priekðçjos gados, elektroniskâ veidâ veikto klientu kredîta pârvedumu lielâkâ daïa(92.0%) bija maksâðanas lîdzekïi latos, kaut gan to apjoms sasniedza tikai 16.2%no elektroniskâ veidâ veikto klientu kredîta pârvedumu kopapjoma. Elektroniskâveidâ veiktajos klientu kredîta pârvedumos 2006. gadâ dominçja elektroniskâ veidâiesniegtie kredîta pârvedumi (elektroniskie bankas pakalpojumi, internetbankaspakalpojumi un bankas pakalpojumi, izmantojot tâlruni), sasniedzot attiecîgi 57.4%no skaita un 51.5% no apjoma. Ðâdu kredîta pârvedumu skaits 2006. gadâ bija42.5 milj., apjoms – 181.8 mljrd. latu (sk. 39. un 40. att.; attiecîgi par 35.4% un6.8% vairâk nekâ 2005. gadâ).
Bankas pakalpojumi internetâ tika lietoti visplaðâk no visiem klientiem pieejamiemkredîta pârvedumu iesniegðanas elektroniskajiem veidiem (to skaits un apjomssasniedza attiecîgi 68.9% no kopskaita un 77.7% no kopapjoma). To maksâjumuskaits, kuri veikti, izmantojot bankas pakalpojumus internetâ, 2006. gadâ salîdzi-nâjumâ ar 2005. gadu pieauga par 49.4% (lîdz 29.3 milj.), bet apjoms – par 14.8%(lîdz 141.3 mljrd. latu). Elektronisko bankas pakalpojumu (jeb sistçmas "klients-banka" maksâjumu) skaits palielinâjâs par 10.6% (lîdz 12.7 milj.), bet to apjomssamazinâjâs par 14.2% (lîdz 40.4 mljrd. latu).
Bankas pakalpojumu, izmantojot tâlruni, skaits 2006. gadâ palielinâjâs par 70.4%(lîdz 514.1 tûkst.), bet apjoms – par 40.0% (lîdz 74.5 milj. latu). Lai gan straujipieauga ðâdu maksâjumu skaits, to îpatsvars elektroniskâ veidâ iesniegto kredîtapârvedumu kopskaitâ un kopapjomâ vçl joprojâm bija neliels (attiecîgi 1.21% un0.04%). Klientu kredîta pârvedumu, kas veikti, pamatojoties uz klientu maksâjumarîkojumiem papîra dokumenta veidâ vai paðu kredîtiestâþu maksâjumiem klien-tiem, skaits palielinâjâs par 12.0% (lîdz 31.5 milj.), bet apjoms – par 94.3% (lîdz170.9 mljrd. latu). Apjoma kâpumu noteica saskaòâ ar jauno metodoloìiju ie-kïautie klientiem izsniegtie kredîti.
33
4 · 2006
Ar norçíinu kartçm veikto darîjumu (maksâjumi ar norçíinu kartçm, skaidrasnaudas izmaksas un naudas lîdzekïu pârvedumi no bankomâtiem) îpatsvars visuklientu maksâðanas lîdzekïu skaitâ 2006. gadâ bija vislielâkais un sasniedza 56.8%.Ar norçíinu kartçm veikto darîjumu skaits un apjoms 2006. gadâ palielinâjâs at-tiecîgi par 30.3% (lîdz 105.5 milj.) un 35.0% (lîdz 3.7 mljrd. latu; sk. 41. att.). Arnorçíinu kartçm veikto maksâjumu skaits 2006. gadâ pieauga par 44.2% jeb18.4 milj., bet apjoms – par 59.2% (lîdz 1.0 mljrd. latu). Ðâdu maksâjumu vidçjâsumma 2006. gadâ bija 17.48 lati. Ar norçíinu kartçm latos veiktâ viena maksâjumavidçjâ summa bija 14.55 lati, bet ârvalstu valûtâs – 120.13 lati. 97.2% no visiem arnorçíinu kartçm veiktajiem maksâjumiem tika veikti latos, bet ðo maksâjumu ap-joms sasniedza 80.9% no kopçjâ ar norçíinu kartçm veikto maksâjumu apjoma.Salîdzinâjumâ ar iepriekðçjo gadu skaidrâs naudas izmaksu no bankomâtiem skaitsun apjoms pieauga attiecîgi par 16.2% (lîdz 44.6 milj.) un 27.5% (lîdz 2.7 mljrd.latu). No bankomâtiem veikto naudas lîdzekïu pârvedumu skaits un apjoms veidojanelielu daïu no visu ar norçíinu kartçm veikto darîjumu kopskaita un apjoma(attiecîgi 0.8% un 0.5%). 2006. gadâ, attîstoties internetbanku pakalpojumiem,klienti pârvedumu veikðanai retâk izmantoja bankomâtus un ðâdu pârvedumu skaitssamazinâjâs par 9.1% (lîdz 851.5 tûkst.). Savukârt to apjoms palielinâjâs par 23.6%(lîdz 18.3 milj. latu).
Tâpat kâ iepriekðçjos gados, kredîtiestâdes 2006. gadâ lîdztekus kredîta pârvedu-miem un maksâjumiem ar norçíinu kartçm klientiem piedâvâja arî citus elektro-niskos maksâðanas lîdzekïus (regulâros un tieðâ debeta maksâjumus). Regulâromaksâjumu skaits 2006. gadâ palielinâjâs par 38.9% (lîdz 1.5 milj.), bet apjoms –par 38.5% (lîdz 968.1 milj. latu). Tieðâ debeta maksâjumu skaits pieauga lîdz4.5 milj. (3.2 reizes), bet apjoms – lîdz 525.6 milj. latu (10.2 reizes). Tirdzniecîbasfinansçðanas darîjumu apjoms samazinâjâs par 39.1% (lîdz 354.5 milj. latu), taèuto skaits saglabâjâs tâds pats kâ 2005. gadâ (4.7 tûkst.). E-naudas maksâjumu skaitsbija 41.8 tûkst., bet apjoms – 640.6 tûkst. latu. Visvairâk ðâdu maksâjumu (99.3%skaita ziòâ un 99.7% apjoma ziòâ) tika veikti latos.
Konti
2006. gada beigâs kredîtiestâdçs, ieskaitot elektroniskâs naudas institûcijas, atvçrtoklientu norçíinu kontu skaits salîdzinâjumâ ar iepriekðçjâ gada atbilstoðo periodupieauga par 17.1% (lîdz 3.4 milj.; sk. 42. att.).
Kâpumu noteica rezidentu norçíiniem latos atvçrto kontu skaita kâpums par 14.9%(lîdz 2.7 milj.). Noguldîjumu atlikums klientu norçíinu kontos palielinâjâs par17.6% (lîdz 4.6 mljrd. latu). To galvenokârt ietekmçja rezidentu klientu latos veiktonoguldîjumu atlikuma pieaugums par 44.0% (lîdz 2.8 mljrd. latu). Savukârt nere-zidentu klientu latos veikto noguldîjumu atlikums samazinâjâs par 7.6% (lîdz1.9 mljrd. latu).
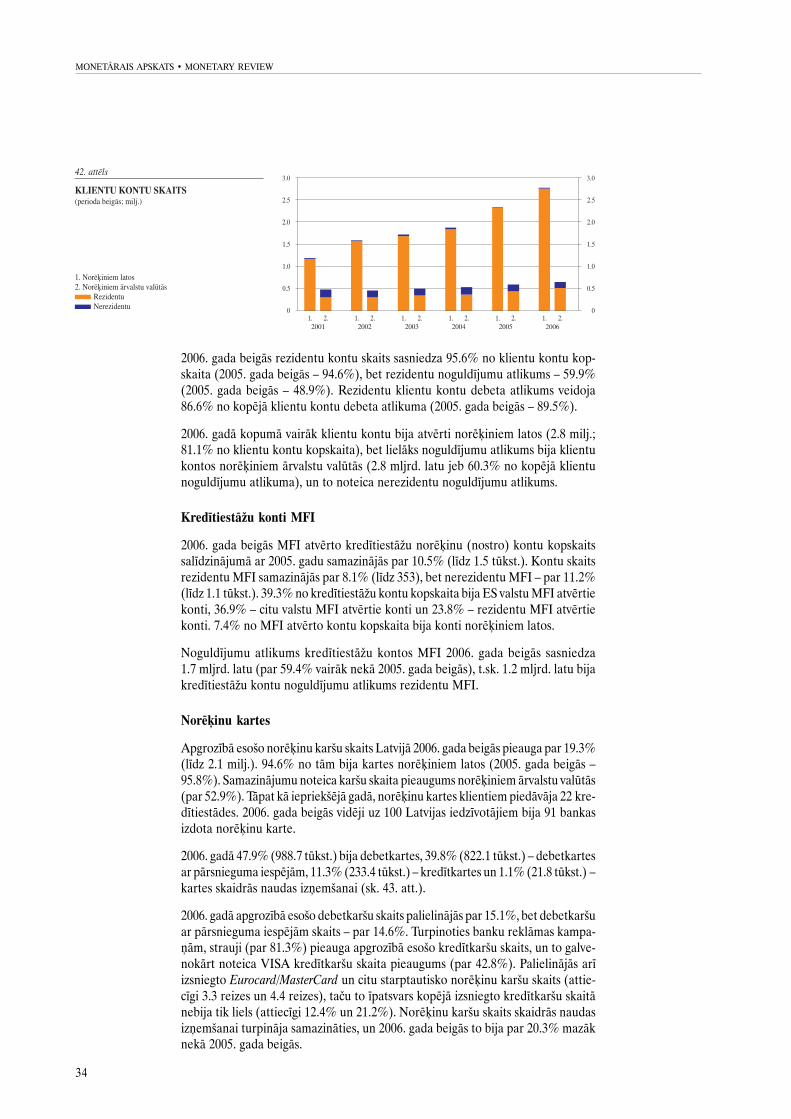
34
MONETÂRAIS APSKATS · MONETARY REVIEW
2006. gada beigâs rezidentu kontu skaits sasniedza 95.6% no klientu kontu kop-skaita (2005. gada beigâs – 94.6%), bet rezidentu noguldîjumu atlikums – 59.9%(2005. gada beigâs – 48.9%). Rezidentu klientu kontu debeta atlikums veidoja86.6% no kopçjâ klientu kontu debeta atlikuma (2005. gada beigâs – 89.5%).
2006. gadâ kopumâ vairâk klientu kontu bija atvçrti norçíiniem latos (2.8 milj.;81.1% no klientu kontu kopskaita), bet lielâks noguldîjumu atlikums bija klientukontos norçíiniem ârvalstu valûtâs (2.8 mljrd. latu jeb 60.3% no kopçjâ klientunoguldîjumu atlikuma), un to noteica nerezidentu noguldîjumu atlikums.
Kredîtiestâþu konti MFI
2006. gada beigâs MFI atvçrto kredîtiestâþu norçíinu (nostro) kontu kopskaitssalîdzinâjumâ ar 2005. gadu samazinâjâs par 10.5% (lîdz 1.5 tûkst.). Kontu skaitsrezidentu MFI samazinâjâs par 8.1% (lîdz 353), bet nerezidentu MFI – par 11.2%(lîdz 1.1 tûkst.). 39.3% no kredîtiestâþu kontu kopskaita bija ES valstu MFI atvçrtiekonti, 36.9% – citu valstu MFI atvçrtie konti un 23.8% – rezidentu MFI atvçrtiekonti. 7.4% no MFI atvçrto kontu kopskaita bija konti norçíiniem latos.
Noguldîjumu atlikums kredîtiestâþu kontos MFI 2006. gada beigâs sasniedza1.7 mljrd. latu (par 59.4% vairâk nekâ 2005. gada beigâs), t.sk. 1.2 mljrd. latu bijakredîtiestâþu kontu noguldîjumu atlikums rezidentu MFI.
Norçíinu kartes
Apgrozîbâ esoðo norçíinu karðu skaits Latvijâ 2006. gada beigâs pieauga par 19.3%(lîdz 2.1 milj.). 94.6% no tâm bija kartes norçíiniem latos (2005. gada beigâs –95.8%). Samazinâjumu noteica karðu skaita pieaugums norçíiniem ârvalstu valûtâs(par 52.9%). Tâpat kâ iepriekðçjâ gadâ, norçíinu kartes klientiem piedâvâja 22 kre-dîtiestâdes. 2006. gada beigâs vidçji uz 100 Latvijas iedzîvotâjiem bija 91 bankasizdota norçíinu karte.
2006. gadâ 47.9% (988.7 tûkst.) bija debetkartes, 39.8% (822.1 tûkst.) – debetkartesar pârsnieguma iespçjâm, 11.3% (233.4 tûkst.) – kredîtkartes un 1.1% (21.8 tûkst.) –kartes skaidrâs naudas izòemðanai (sk. 43. att.).
2006. gadâ apgrozîbâ esoðo debetkarðu skaits palielinâjâs par 15.1%, bet debetkarðuar pârsnieguma iespçjâm skaits – par 14.6%. Turpinoties banku reklâmas kampa-òâm, strauji (par 81.3%) pieauga apgrozîbâ esoðo kredîtkarðu skaits, un to galve-nokârt noteica VISA kredîtkarðu skaita pieaugums (par 42.8%). Palielinâjâs arîizsniegto Eurocard/MasterCard un citu starptautisko norçíinu karðu skaits (attie-cîgi 3.3 reizes un 4.4 reizes), taèu to îpatsvars kopçjâ izsniegto kredîtkarðu skaitânebija tik liels (attiecîgi 12.4% un 21.2%). Norçíinu karðu skaits skaidrâs naudasizòemðanai turpinâja samazinâties, un 2006. gada beigâs to bija par 20.3% mazâknekâ 2005. gada beigâs.
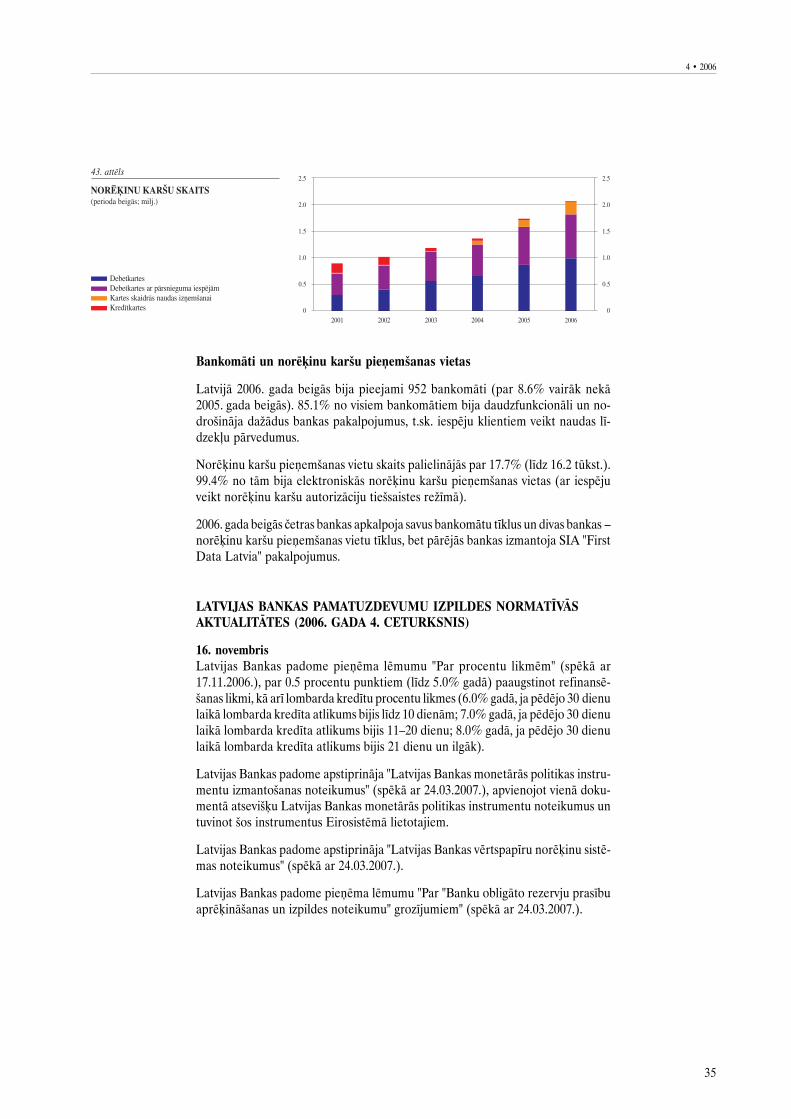
35
4 · 2006
Bankomâti un norçíinu karðu pieòemðanas vietas
Latvijâ 2006. gada beigâs bija pieejami 952 bankomâti (par 8.6% vairâk nekâ2005. gada beigâs). 85.1% no visiem bankomâtiem bija daudzfunkcionâli un no-droðinâja daþâdus bankas pakalpojumus, t.sk. iespçju klientiem veikt naudas lî-dzekïu pârvedumus.
Norçíinu karðu pieòemðanas vietu skaits palielinâjâs par 17.7% (lîdz 16.2 tûkst.).99.4% no tâm bija elektroniskâs norçíinu karðu pieòemðanas vietas (ar iespçjuveikt norçíinu karðu autorizâciju tieðsaistes reþîmâ).
2006. gada beigâs èetras bankas apkalpoja savus bankomâtu tîklus un divas bankas –norçíinu karðu pieòemðanas vietu tîklus, bet pârçjâs bankas izmantoja SIA "FirstData Latvia" pakalpojumus.
LATVIJAS BANKAS PAMATUZDEVUMU IZPILDES NORMATÎVÂSAKTUALITÂTES (2006. GADA 4. CETURKSNIS)
16. novembris
Latvijas Bankas padome pieòçma lçmumu "Par procentu likmçm" (spçkâ ar17.11.2006.), par 0.5 procentu punktiem (lîdz 5.0% gadâ) paaugstinot refinansç-ðanas likmi, kâ arî lombarda kredîtu procentu likmes (6.0% gadâ, ja pçdçjo 30 dienulaikâ lombarda kredîta atlikums bijis lîdz 10 dienâm; 7.0% gadâ, ja pçdçjo 30 dienulaikâ lombarda kredîta atlikums bijis 11–20 dienu; 8.0% gadâ, ja pçdçjo 30 dienulaikâ lombarda kredîta atlikums bijis 21 dienu un ilgâk).
Latvijas Bankas padome apstiprinâja "Latvijas Bankas monetârâs politikas instru-mentu izmantoðanas noteikumus" (spçkâ ar 24.03.2007.), apvienojot vienâ doku-mentâ atseviðíu Latvijas Bankas monetârâs politikas instrumentu noteikumus untuvinot ðos instrumentus Eirosistçmâ lietotajiem.
Latvijas Bankas padome apstiprinâja "Latvijas Bankas vçrtspapîru norçíinu sistç-mas noteikumus" (spçkâ ar 24.03.2007.).
Latvijas Bankas padome pieòçma lçmumu "Par "Banku obligâto rezervju prasîbuaprçíinâðanas un izpildes noteikumu" grozîjumiem" (spçkâ ar 24.03.2007.).
36
MONETÂRAIS APSKATS · MONETARY REVIEW
INTRODUCTION
The Latvian economy continued its boisterous yet unbalanced growth also in thefourth quarter of 2006. The components of domestic demand: the all-time-highprivate consumption and the sustained high growth of investment continued asthe driving forces. External demand was relatively high, however, with a down-ward pointing trend. Export growth rate slowed down, and the increase of im-ports, dictated by the robust domestic demand, added to the current account defi-cit. As a result of the pressure from the demand side, the inflation rate (mainlycore inflation) went up. Though the deposits with banks continued to grow, theincrease in lending was mainly funded by non-resident MFIs, increasing Latvia'sexternal debt. The increase in money supply remained almost unchanged: in De-cember the annual growth rate of broad money M3 and of domestic deposits was40.3% and 41.0% respectively. With the demand for housing remaining high, theloans, especially housing loans to households, increased rapidly, albeit at a slightlylower rate due to the high base (from 59.5% in September to 58.4% in Decem-ber). For the time being, the increase in lending rates did not have a notableeffect; also, the loans to financial institutions and to non-financial corporationsposted a robust growth. In 2006 the general government consolidated budget fi-nancial deficit was 0.9% of GDP, in the last two months of 2006 the budget expen-diture considerably outweighing the revenue and swelling the already high do-mestic demand. Such escalation in the budget expenditure is inadequate in a situ-ation when the national economy is booming.
In the fourth quarter of 2006, GDP increased by 11.7% year-on-year (11.9% inentire 2006). The ongoing acceleration in private consumption and imports, aslowdown in export growth, and a more pronounced development in the sectorsproviding goods and services to domestic rather than export market continued topersist also in the fourth quarter. The dynamic demand for durable goods deter-mined a further swift increase of retail trade turnover. The performance of rail-way and ports deteriorated, while freight volumes transported by road and oilproduct volumes transported by pipeline increased; the performance of the RigaAirport and of communication sector also improved. Manufacturing sustained amoderate growth rate. Simultaneously, export growth was slowing down. Accord-ing to the Bank of Latvia's forecasts, in 2007 the rise of the total value added isexpected to diminish somewhat. This is related to the decreasing growth of do-mestic demand due to its high base, as well as to the increase in real interest rateson loans, to shortage of labour force and to the high inflation rate. A more mod-erate growth of external demand can be expected as well.
The trends observed during the previous months continued to persist in the labourmarket: increase of employment, aggravating shortages of labour force and risingwages and salaries. The unemployment rate in December shrunk to 6.5%.
With imports increasingly outweighing exports, in 2006 current account deficit ofthe balance of payments skyrocketed to 21.1% of GDP (12.6% in 2005); in thefourth quarter it was 26.3% of GDP. The rise in the goods deficit accounted formost of the increase in overall deficit, because the annual growth of imports(29.3%) was more than twice as fast as that of exports (11.6%). Foreign directinvestment (35.1% of the current account deficit) and borrowings (mainly banklong-term borrowings from parent banks) made up for the necessary funding. Thecurrent account deficit was covered by long-term capital. Net direct foreign in-vestment increased 2.5 times.
The Bank of Latvia continued to pursue a tight monetary policy warranted by thepersistently high inflation, large current account deficit and the fact that the cur-
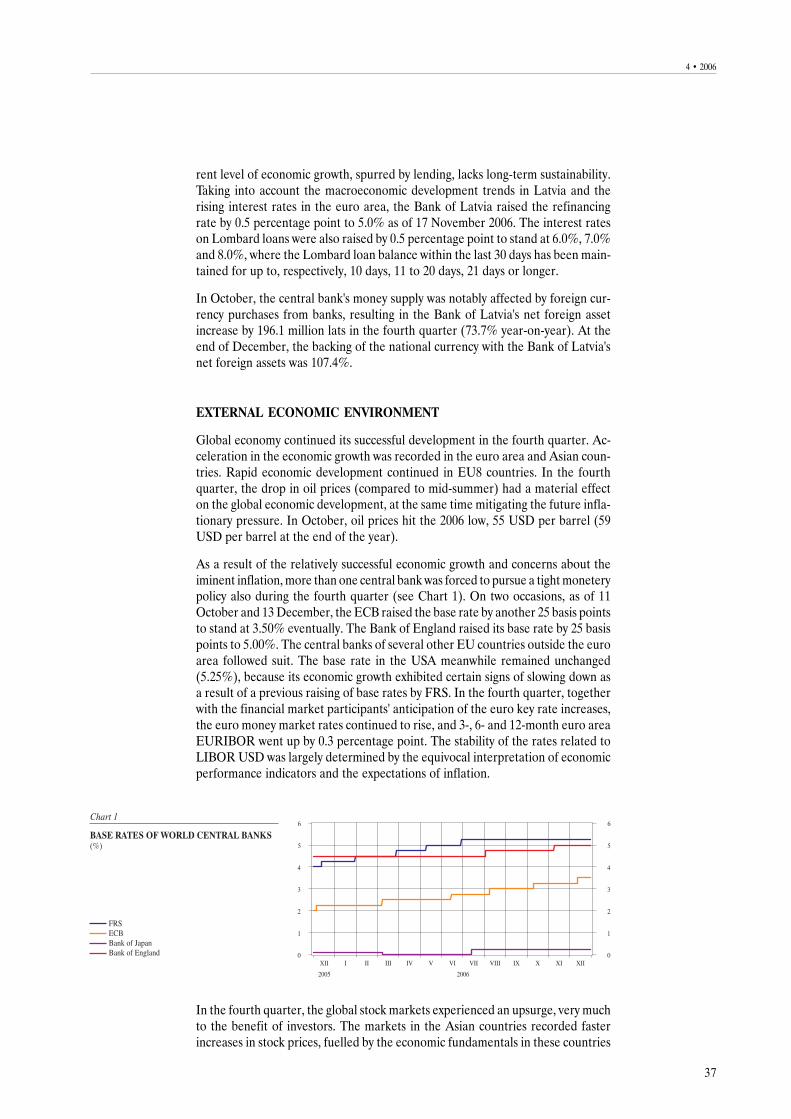
37
4 · 2006
rent level of economic growth, spurred by lending, lacks long-term sustainability.Taking into account the macroeconomic development trends in Latvia and therising interest rates in the euro area, the Bank of Latvia raised the refinancingrate by 0.5 percentage point to 5.0% as of 17 November 2006. The interest rateson Lombard loans were also raised by 0.5 percentage point to stand at 6.0%, 7.0%and 8.0%, where the Lombard loan balance within the last 30 days has been main-tained for up to, respectively, 10 days, 11 to 20 days, 21 days or longer.
In October, the central bank's money supply was notably affected by foreign cur-rency purchases from banks, resulting in the Bank of Latvia's net foreign assetincrease by 196.1 million lats in the fourth quarter (73.7% year-on-year). At theend of December, the backing of the national currency with the Bank of Latvia'snet foreign assets was 107.4%.
EXTERNAL ECONOMIC ENVIRONMENT
Global economy continued its successful development in the fourth quarter. Ac-celeration in the economic growth was recorded in the euro area and Asian coun-tries. Rapid economic development continued in EU8 countries. In the fourthquarter, the drop in oil prices (compared to mid-summer) had a material effecton the global economic development, at the same time mitigating the future infla-tionary pressure. In October, oil prices hit the 2006 low, 55 USD per barrel (59USD per barrel at the end of the year).
As a result of the relatively successful economic growth and concerns about theiminent inflation, more than one central bank was forced to pursue a tight moneterypolicy also during the fourth quarter (see Chart 1). On two occasions, as of 11October and 13 December, the ECB raised the base rate by another 25 basis pointsto stand at 3.50% eventually. The Bank of England raised its base rate by 25 basispoints to 5.00%. The central banks of several other EU countries outside the euroarea followed suit. The base rate in the USA meanwhile remained unchanged(5.25%), because its economic growth exhibited certain signs of slowing down asa result of a previous raising of base rates by FRS. In the fourth quarter, togetherwith the financial market participants' anticipation of the euro key rate increases,the euro money market rates continued to rise, and 3-, 6- and 12-month euro areaEURIBOR went up by 0.3 percentage point. The stability of the rates related toLIBOR USD was largely determined by the equivocal interpretation of economicperformance indicators and the expectations of inflation.
In the fourth quarter, the global stock markets experienced an upsurge, very muchto the benefit of investors. The markets in the Asian countries recorded fasterincreases in stock prices, fuelled by the economic fundamentals in these countries
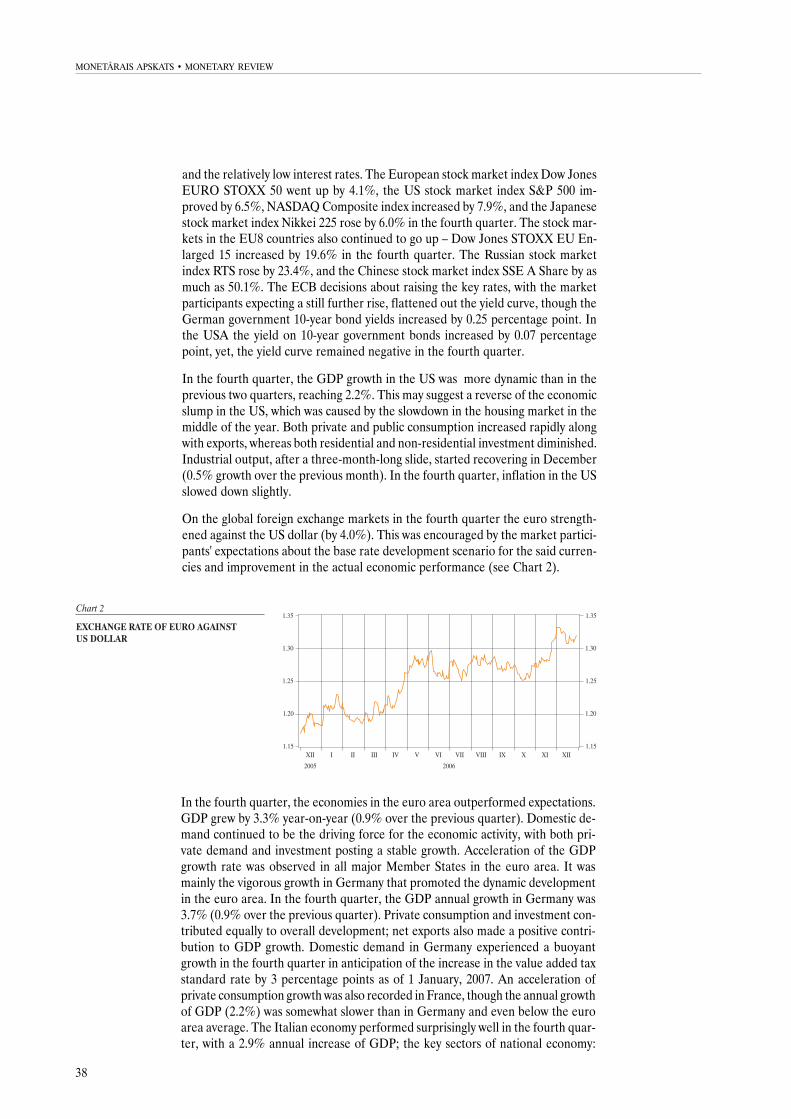
38
MONETÂRAIS APSKATS · MONETARY REVIEW
and the relatively low interest rates. The European stock market index Dow JonesEURO STOXX 50 went up by 4.1%, the US stock market index S&P 500 im-proved by 6.5%, NASDAQ Composite index increased by 7.9%, and the Japanesestock market index Nikkei 225 rose by 6.0% in the fourth quarter. The stock mar-kets in the EU8 countries also continued to go up – Dow Jones STOXX EU En-larged 15 increased by 19.6% in the fourth quarter. The Russian stock marketindex RTS rose by 23.4%, and the Chinese stock market index SSE A Share by asmuch as 50.1%. The ECB decisions about raising the key rates, with the marketparticipants expecting a still further rise, flattened out the yield curve, though theGerman government 10-year bond yields increased by 0.25 percentage point. Inthe USA the yield on 10-year government bonds increased by 0.07 percentagepoint, yet, the yield curve remained negative in the fourth quarter.
In the fourth quarter, the GDP growth in the US was more dynamic than in theprevious two quarters, reaching 2.2%. This may suggest a reverse of the economicslump in the US, which was caused by the slowdown in the housing market in themiddle of the year. Both private and public consumption increased rapidly alongwith exports, whereas both residential and non-residential investment diminished.Industrial output, after a three-month-long slide, started recovering in December(0.5% growth over the previous month). In the fourth quarter, inflation in the USslowed down slightly.
On the global foreign exchange markets in the fourth quarter the euro strength-ened against the US dollar (by 4.0%). This was encouraged by the market partici-pants' expectations about the base rate development scenario for the said curren-cies and improvement in the actual economic performance (see Chart 2).
In the fourth quarter, the economies in the euro area outperformed expectations.GDP grew by 3.3% year-on-year (0.9% over the previous quarter). Domestic de-mand continued to be the driving force for the economic activity, with both pri-vate demand and investment posting a stable growth. Acceleration of the GDPgrowth rate was observed in all major Member States in the euro area. It wasmainly the vigorous growth in Germany that promoted the dynamic developmentin the euro area. In the fourth quarter, the GDP annual growth in Germany was3.7% (0.9% over the previous quarter). Private consumption and investment con-tributed equally to overall development; net exports also made a positive contri-bution to GDP growth. Domestic demand in Germany experienced a buoyantgrowth in the fourth quarter in anticipation of the increase in the value added taxstandard rate by 3 percentage points as of 1 January, 2007. An acceleration ofprivate consumption growth was also recorded in France, though the annual growthof GDP (2.2%) was somewhat slower than in Germany and even below the euroarea average. The Italian economy performed surprisingly well in the fourth quar-ter, with a 2.9% annual increase of GDP; the key sectors of national economy:
39
4 · 2006
services, manufacturing and agriculture grew at a similar rate. Private consump-tion was encouraged by improvement in the labour market, a higher consumerconfidence and a more advanced development of lending. In Spain, too, GDPposted a dynamic annual growth of 4.0%.
In the fourth quarter, GDP in the United Kingdom increased by 0.8% quarter-on-quarter. The development of the service sector, especially in the hotel andrestaurant business, was the main driving force behind the growth, whereas indus-trial production stagnated due to the unstable external demand and the apprecia-tion of the pound sterling. Inflation in the United Kingdom was however abovethe target rate, therefore the Bank of England increased the base rate in Novem-ber despite the positive economic outlook.
In the fourth quarter, GDP in Sweden increased by 1.2% quarter-on-quarter. Thelending volumes and the prices of real estate went up in tandem with the growthof economy, though inflation remained rather low. The explanation lies in thehigh productivity: the corporations managed to boost their output without hiringextra labour; hence, there was no material pressure on inflation on the account ofwage and salary increases. However, considering the forecasts and the price sta-bility risks, Sveriges Riksbank raised the base rate again in the fourth quarter.
In the fourth quarter, growth in the EU8 countries continued to be rather dyna-mic. The Estonian GDP posted an 11.2% annual growth, resulting from the ex-pansion in manufacturing, trade and transportation services and the developmentof financial sector. GDP in Slovakia also grew rapidly, 9.5% year-on-year in thefourth quarter. Both external as well as domestic demand largely determined theexpenditure; the growth was fuelled by the development of industrial sector, whole-sale and financial services. GDP in Lithuania grew slower (by 7.0%), with con-struction and financial services as major contributors. GDP increase in Polandwas 6.6%, because of the growth of investment in share capital and of privateconsumption driven by domestic demand. Hungary's GDP increased slower, by3.4%. In a number of EU8 countries inflation remained relatively high in thefourth quarter. In December, Latvia (6.8%), Hungary (6.6%) and Estonia (5.1%)were the economies with the highest inflation, whereas Poland (1.4%) and theCzech Republic (1.6%) stayed below the EU average.
Russia experienced a favourable economic development in the first nine monthsof 2006; the buoyant growth continued in the fourth quarter as well. Owing to thegrowth of personal income, retail trade turnover increased considerably in De-cember (14.8% year-on-year). At the same time, in December the industrial pro-duction growth rate fell down following the rapid increase during October andNovember. Though there was a notable expansion of imports in the last monthsof 2006, Russia's foreign trade balance still remained positive thanks to the dy-namic growth of exports.
EXTERNAL SECTOR DEVELOPMENTS
Foreign Trade and Competitiveness
In the fourth quarter, Latvia's foreign trade growth moderated in comparison withthe respective period a year ago. Trade turnover totalled to 2.7 billion lats, withexports growing by 9.1% and imports by 24.5%. As a result of ever increasingdomestic demand, import volume was double that of exports in terms of volume.The slowdown of export growth resulted from the high domestic demand andreduced competitiveness.
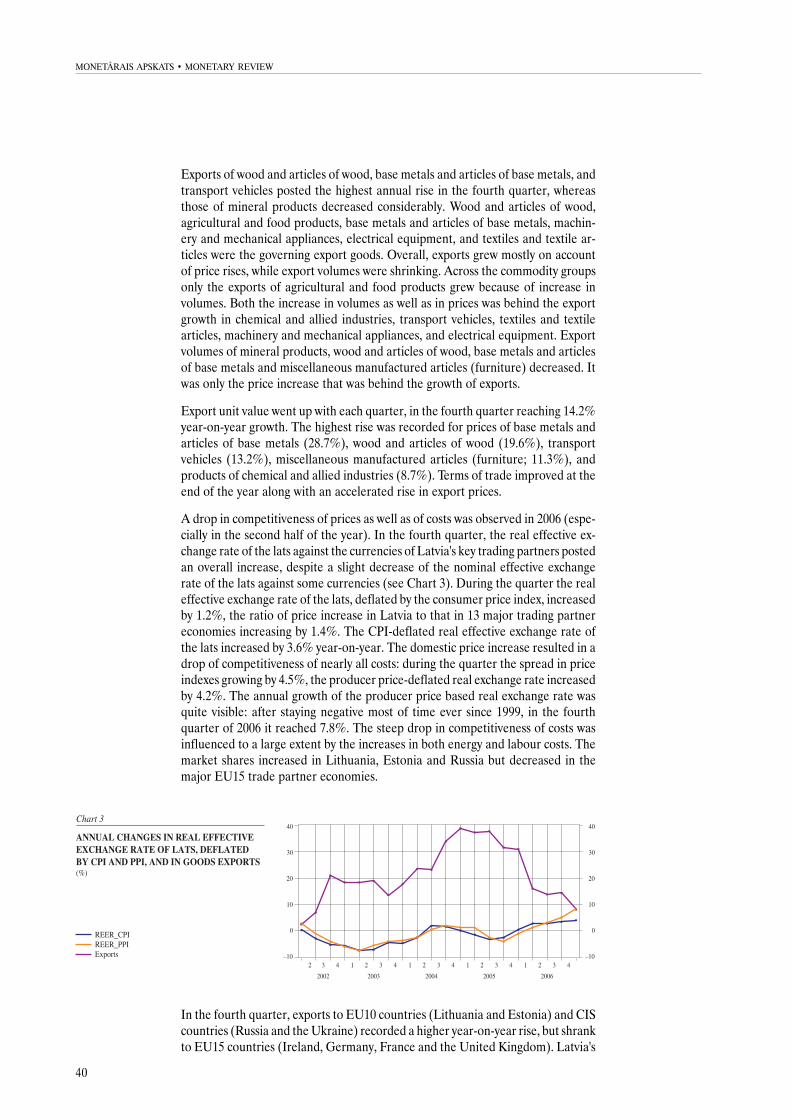
40
MONETÂRAIS APSKATS · MONETARY REVIEW
Exports of wood and articles of wood, base metals and articles of base metals, andtransport vehicles posted the highest annual rise in the fourth quarter, whereasthose of mineral products decreased considerably. Wood and articles of wood,agricultural and food products, base metals and articles of base metals, machin-ery and mechanical appliances, electrical equipment, and textiles and textile ar-ticles were the governing export goods. Overall, exports grew mostly on accountof price rises, while export volumes were shrinking. Across the commodity groupsonly the exports of agricultural and food products grew because of increase involumes. Both the increase in volumes as well as in prices was behind the exportgrowth in chemical and allied industries, transport vehicles, textiles and textilearticles, machinery and mechanical appliances, and electrical equipment. Exportvolumes of mineral products, wood and articles of wood, base metals and articlesof base metals and miscellaneous manufactured articles (furniture) decreased. Itwas only the price increase that was behind the growth of exports.
Export unit value went up with each quarter, in the fourth quarter reaching 14.2%year-on-year growth. The highest rise was recorded for prices of base metals andarticles of base metals (28.7%), wood and articles of wood (19.6%), transportvehicles (13.2%), miscellaneous manufactured articles (furniture; 11.3%), andproducts of chemical and allied industries (8.7%). Terms of trade improved at theend of the year along with an accelerated rise in export prices.
A drop in competitiveness of prices as well as of costs was observed in 2006 (espe-cially in the second half of the year). In the fourth quarter, the real effective ex-change rate of the lats against the currencies of Latvia's key trading partners postedan overall increase, despite a slight decrease of the nominal effective exchangerate of the lats against some currencies (see Chart 3). During the quarter the realeffective exchange rate of the lats, deflated by the consumer price index, increasedby 1.2%, the ratio of price increase in Latvia to that in 13 major trading partnereconomies increasing by 1.4%. The CPI-deflated real effective exchange rate ofthe lats increased by 3.6% year-on-year. The domestic price increase resulted in adrop of competitiveness of nearly all costs: during the quarter the spread in priceindexes growing by 4.5%, the producer price-deflated real exchange rate increasedby 4.2%. The annual growth of the producer price based real exchange rate wasquite visible: after staying negative most of time ever since 1999, in the fourthquarter of 2006 it reached 7.8%. The steep drop in competitiveness of costs wasinfluenced to a large extent by the increases in both energy and labour costs. Themarket shares increased in Lithuania, Estonia and Russia but decreased in themajor EU15 trade partner economies.
In the fourth quarter, exports to EU10 countries (Lithuania and Estonia) and CIScountries (Russia and the Ukraine) recorded a higher year-on-year rise, but shrankto EU15 countries (Ireland, Germany, France and the United Kingdom). Latvia's
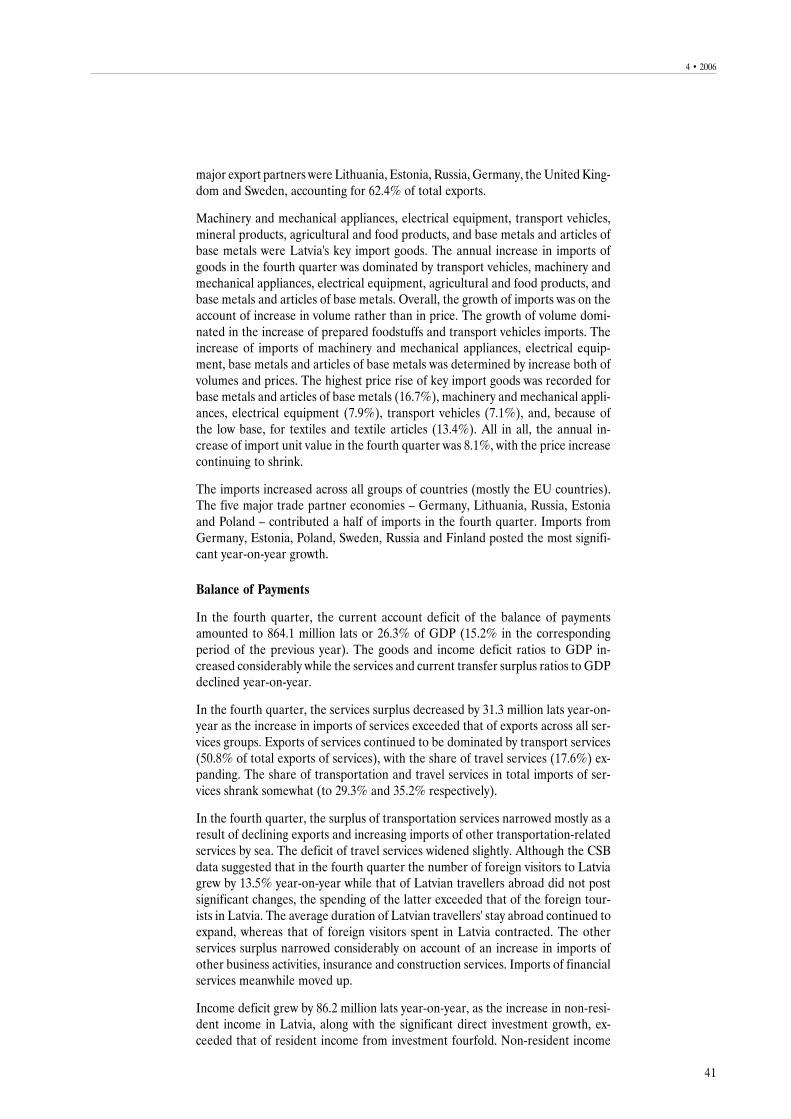
41
4 · 2006
major export partners were Lithuania, Estonia, Russia, Germany, the United King-dom and Sweden, accounting for 62.4% of total exports.
Machinery and mechanical appliances, electrical equipment, transport vehicles,mineral products, agricultural and food products, and base metals and articles ofbase metals were Latvia's key import goods. The annual increase in imports ofgoods in the fourth quarter was dominated by transport vehicles, machinery andmechanical appliances, electrical equipment, agricultural and food products, andbase metals and articles of base metals. Overall, the growth of imports was on theaccount of increase in volume rather than in price. The growth of volume domi-nated in the increase of prepared foodstuffs and transport vehicles imports. Theincrease of imports of machinery and mechanical appliances, electrical equip-ment, base metals and articles of base metals was determined by increase both ofvolumes and prices. The highest price rise of key import goods was recorded forbase metals and articles of base metals (16.7%), machinery and mechanical appli-ances, electrical equipment (7.9%), transport vehicles (7.1%), and, because ofthe low base, for textiles and textile articles (13.4%). All in all, the annual in-crease of import unit value in the fourth quarter was 8.1%, with the price increasecontinuing to shrink.
The imports increased across all groups of countries (mostly the EU countries).The five major trade partner economies – Germany, Lithuania, Russia, Estoniaand Poland – contributed a half of imports in the fourth quarter. Imports fromGermany, Estonia, Poland, Sweden, Russia and Finland posted the most signifi-cant year-on-year growth.
Balance of Payments
In the fourth quarter, the current account deficit of the balance of paymentsamounted to 864.1 million lats or 26.3% of GDP (15.2% in the correspondingperiod of the previous year). The goods and income deficit ratios to GDP in-creased considerably while the services and current transfer surplus ratios to GDPdeclined year-on-year.
In the fourth quarter, the services surplus decreased by 31.3 million lats year-on-year as the increase in imports of services exceeded that of exports across all ser-vices groups. Exports of services continued to be dominated by transport services(50.8% of total exports of services), with the share of travel services (17.6%) ex-panding. The share of transportation and travel services in total imports of ser-vices shrank somewhat (to 29.3% and 35.2% respectively).
In the fourth quarter, the surplus of transportation services narrowed mostly as aresult of declining exports and increasing imports of other transportation-relatedservices by sea. The deficit of travel services widened slightly. Although the CSBdata suggested that in the fourth quarter the number of foreign visitors to Latviagrew by 13.5% year-on-year while that of Latvian travellers abroad did not postsignificant changes, the spending of the latter exceeded that of the foreign tour-ists in Latvia. The average duration of Latvian travellers' stay abroad continued toexpand, whereas that of foreign visitors spent in Latvia contracted. The otherservices surplus narrowed considerably on account of an increase in imports ofother business activities, insurance and construction services. Imports of financialservices meanwhile moved up.
Income deficit grew by 86.2 million lats year-on-year, as the increase in non-resi-dent income in Latvia, along with the significant direct investment growth, ex-ceeded that of resident income from investment fourfold. Non-resident income
42
MONETÂRAIS APSKATS · MONETARY REVIEW
from direct investment (mostly as reinvested earnings) and other investment postedthe highest rise.
In the fourth quarter, the current transfer surplus shrank by 51.4 million lats year-on-year as a result of a notably expanding amount of debit transactions in othersectors. The current transfers received recorded a more moderate growth.
Net inflow of the capital and financial account was 872.2 million lats, mostly in theform of long-term funding.
Direct investment in Latvia (293.4 million lats or 8.9% of GDP) was 4.1 timeslarger year-on-year, covering 34.0% of the current account deficit. Foreign directinvestment in Latvia was made primarily in the form of reinvested earnings (45.0%of foreign direct investment in Latvia) and equity capital (18.2%). In Latvia, thehighest growth was recorded in investment from Cyprus, Malta and Sweden (infinancial intermediation, real estate, renting and business activities, wholesale andretail trade).
In the fourth quarter, portfolio investment posted a net inflow of 84.1 million latsas banks reduced their assets considerably by selling debt securities.
Other investment recorded a net inflow of 700.1 million lats (21.3% of GDP). Forthe second subsequent quarter, the growth in liabilities surpassed the milestoneof one billion lats, expanding by 1 058.0 million lats in the fourth quarter. Of theincrease in liabilities, banking sector loans (mostly from parent banks) accountedfor 91.2%. Long-term liabilities' growth was the major contribution (83.7%) tothe other investment surplus.
In the fourth quarter, other investment of the corporate sector recorded a deficit(1.5% of GDP). The tendency of companies to increase their long-term borrow-ing from non-residents continued; at the same time companies reduced their short-term foreign liabilities (trade credit) considerably and increased deposits.
In the fourth quarter, with banks converting foreign currencies to meet the de-mand for lats, reserve assets increased by 237.3 million lats.
DOMESTIC ECONOMIC ACTIVITY
Aggregate Demand
Private consumption was the driver of the growth of national economy in the thirdquarter of 2006, with gross fixed capital formation rate sustained high. The exter-nal demand slowed down notably, increasing the negative contribution of net ex-ports to GDP growth. Private consumption boosted by 16.8%, accounting for ahalf of the increase of the domestic demand. The growing household expenditurewas promoted by the continuous dynamic development of lending and a consider-able rise of disposable income, resulting from increase in employment, real aver-age wages and salaries, and the amount of social benefits and pensions. In addi-tion to the said direct factors, the rise of consumption was induced by the antici-pated price increase, as well as by the growing household wealth and the opti-mism inspired by the buoyant economic growth.
Gross fixed capital formation in the third quarter increased by 10.0%, as a resultof the sound corporate financial performance in the previous periods (reinvestedearnings), brisk development of lending, and expectations for further rapid eco-nomic growth, the latter largely conducive to investment in trade and real estate,the most dynamically growing sectors.
43
4 · 2006
In real terms, the growth of goods and services exports in the third quarter was7.5%, while the growth of imports, at 24.0%, was thrice as fast. It was determinedby the expansion of domestic demand, including implementation of individuallarge-scale investment projects. A decrease of export growth rate was linked withshrinking export volumes in some product groups, or else, a slowdown of the growthrates (mineral products, paper and cardboard products, wood and articles of wood,etc.). The increase of costs and prices reduced the competitive power in exportmarkets, which was an additional motivation for the businesses to give a priorityto meeting the domestic demand.
Simultaneously, the elements limiting the further development of national economybecame more and more conspicuous: growing tension in the labour market; priceincrease; exorbitant growth of domestic demand, resulting in a negative contribu-tion to net exports; spiralling household debt; sizeable investment in housing, motorvehicles and sectors with a relatively low value added.
Aggregate Supply
In the fourth quarter, Latvia's economy continued to develop buoyantly. At con-stant prices, GDP increased by 11.7% year-on-year, at current prices totalling11 264.7 million lats in 2006. The overall growth was primarily driven by the strongincrease of value added in trade (15.3%).
The expansion of retail trade turnover (see Chart 4), including sales of motorvehicles and automotive fuel, was especially buoyant in the fourth quarter (34.9%year-on-year), despite the comparatively high base (26.0% increase in the fourthquarter of 2005). The demand for durable goods continued to be the determiningfactor; moreover, alongside with the contribution of the traditional speedy growthof motor vehicle sales (13.9 percentage points), the trade turnover of furniture,household goods (especially electrical appliances) and building materials alsoposted a very high growth in the fourth quarter.
Value added grew steadily also in other branches of the services sector, includingbusiness activities (by 17.4%), financial intermediation (by 17.9%), hotels andrestaurants (by 18.5%), as well as other community and personal services (by15.0%).
Transport, storage and communication demonstrated a more moderate growth ofvalue added (7.7%). Commercial freight turnover by road and volumes of oil prod-ucts transported by pipeline increased significantly (by 22.1% and 17.3% respec-tively) along with communication services, whereas the performance indicators ofrailways and ports deteriorated noticeably. Year-on-year, cargo traffic by rail de-creased by 19.5% (including via ports by 17.7% and transit by 45.7%). The
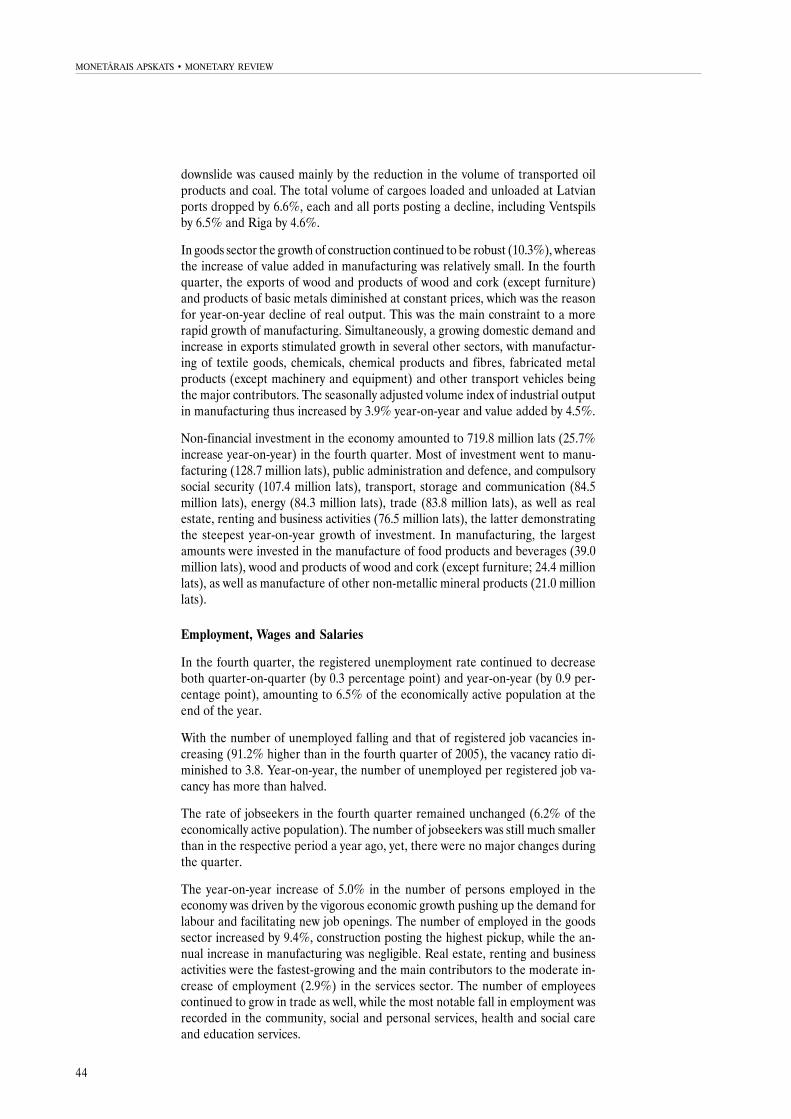
44
MONETÂRAIS APSKATS · MONETARY REVIEW
downslide was caused mainly by the reduction in the volume of transported oilproducts and coal. The total volume of cargoes loaded and unloaded at Latvianports dropped by 6.6%, each and all ports posting a decline, including Ventspilsby 6.5% and Riga by 4.6%.
In goods sector the growth of construction continued to be robust (10.3%), whereasthe increase of value added in manufacturing was relatively small. In the fourthquarter, the exports of wood and products of wood and cork (except furniture)and products of basic metals diminished at constant prices, which was the reasonfor year-on-year decline of real output. This was the main constraint to a morerapid growth of manufacturing. Simultaneously, a growing domestic demand andincrease in exports stimulated growth in several other sectors, with manufactur-ing of textile goods, chemicals, chemical products and fibres, fabricated metalproducts (except machinery and equipment) and other transport vehicles beingthe major contributors. The seasonally adjusted volume index of industrial outputin manufacturing thus increased by 3.9% year-on-year and value added by 4.5%.
Non-financial investment in the economy amounted to 719.8 million lats (25.7%increase year-on-year) in the fourth quarter. Most of investment went to manu-facturing (128.7 million lats), public administration and defence, and compulsorysocial security (107.4 million lats), transport, storage and communication (84.5million lats), energy (84.3 million lats), trade (83.8 million lats), as well as realestate, renting and business activities (76.5 million lats), the latter demonstratingthe steepest year-on-year growth of investment. In manufacturing, the largestamounts were invested in the manufacture of food products and beverages (39.0million lats), wood and products of wood and cork (except furniture; 24.4 millionlats), as well as manufacture of other non-metallic mineral products (21.0 millionlats).
Employment, Wages and Salaries
In the fourth quarter, the registered unemployment rate continued to decreaseboth quarter-on-quarter (by 0.3 percentage point) and year-on-year (by 0.9 per-centage point), amounting to 6.5% of the economically active population at theend of the year.
With the number of unemployed falling and that of registered job vacancies in-creasing (91.2% higher than in the fourth quarter of 2005), the vacancy ratio di-minished to 3.8. Year-on-year, the number of unemployed per registered job va-cancy has more than halved.
The rate of jobseekers in the fourth quarter remained unchanged (6.2% of theeconomically active population). The number of jobseekers was still much smallerthan in the respective period a year ago, yet, there were no major changes duringthe quarter.
The year-on-year increase of 5.0% in the number of persons employed in theeconomy was driven by the vigorous economic growth pushing up the demand forlabour and facilitating new job openings. The number of employed in the goodssector increased by 9.4%, construction posting the highest pickup, while the an-nual increase in manufacturing was negligible. Real estate, renting and businessactivities were the fastest-growing and the main contributors to the moderate in-crease of employment (2.9%) in the services sector. The number of employeescontinued to grow in trade as well, while the most notable fall in employment wasrecorded in the community, social and personal services, health and social careand education services.
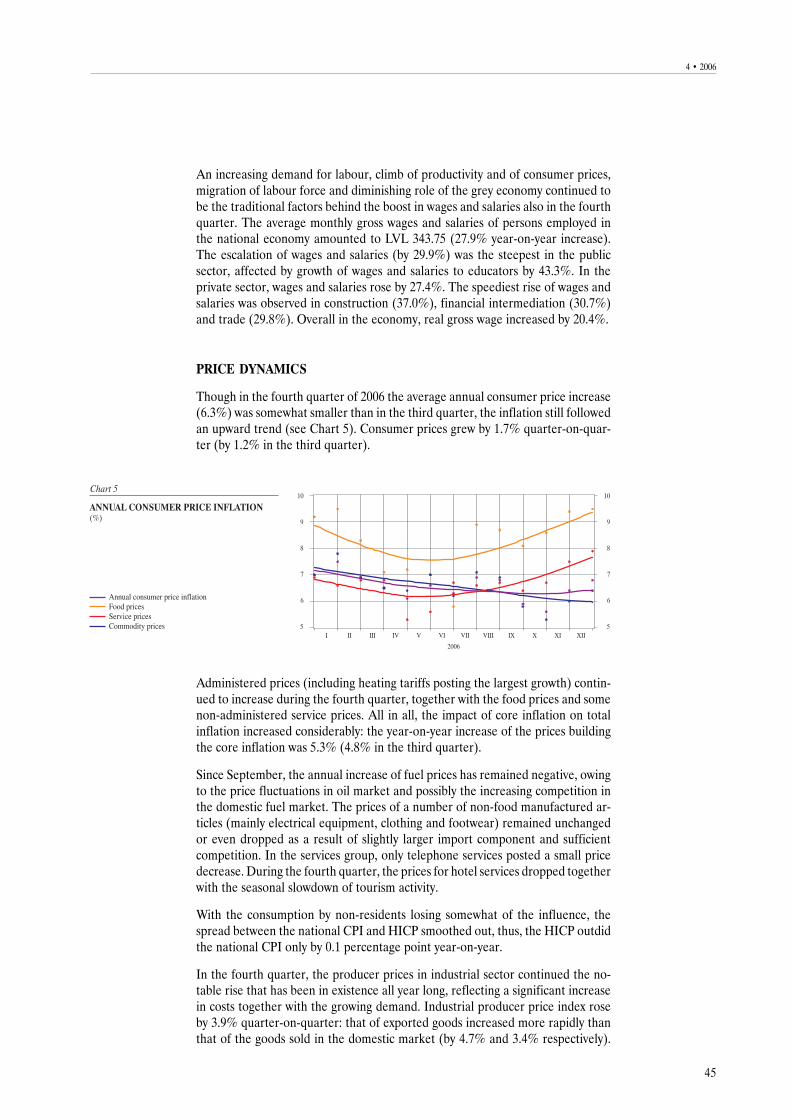
45
4 · 2006
An increasing demand for labour, climb of productivity and of consumer prices,migration of labour force and diminishing role of the grey economy continued tobe the traditional factors behind the boost in wages and salaries also in the fourthquarter. The average monthly gross wages and salaries of persons employed inthe national economy amounted to LVL 343.75 (27.9% year-on-year increase).The escalation of wages and salaries (by 29.9%) was the steepest in the publicsector, affected by growth of wages and salaries to educators by 43.3%. In theprivate sector, wages and salaries rose by 27.4%. The speediest rise of wages andsalaries was observed in construction (37.0%), financial intermediation (30.7%)and trade (29.8%). Overall in the economy, real gross wage increased by 20.4%.
PRICE DYNAMICS
Though in the fourth quarter of 2006 the average annual consumer price increase(6.3%) was somewhat smaller than in the third quarter, the inflation still followedan upward trend (see Chart 5). Consumer prices grew by 1.7% quarter-on-quar-ter (by 1.2% in the third quarter).
Administered prices (including heating tariffs posting the largest growth) contin-ued to increase during the fourth quarter, together with the food prices and somenon-administered service prices. All in all, the impact of core inflation on totalinflation increased considerably: the year-on-year increase of the prices buildingthe core inflation was 5.3% (4.8% in the third quarter).
Since September, the annual increase of fuel prices has remained negative, owingto the price fluctuations in oil market and possibly the increasing competition inthe domestic fuel market. The prices of a number of non-food manufactured ar-ticles (mainly electrical equipment, clothing and footwear) remained unchangedor even dropped as a result of slightly larger import component and sufficientcompetition. In the services group, only telephone services posted a small pricedecrease. During the fourth quarter, the prices for hotel services dropped togetherwith the seasonal slowdown of tourism activity.
With the consumption by non-residents losing somewhat of the influence, thespread between the national CPI and HICP smoothed out, thus, the HICP outdidthe national CPI only by 0.1 percentage point year-on-year.
In the fourth quarter, the producer prices in industrial sector continued the no-table rise that has been in existence all year long, reflecting a significant increasein costs together with the growing demand. Industrial producer price index roseby 3.9% quarter-on-quarter: that of exported goods increased more rapidly thanthat of the goods sold in the domestic market (by 4.7% and 3.4% respectively).
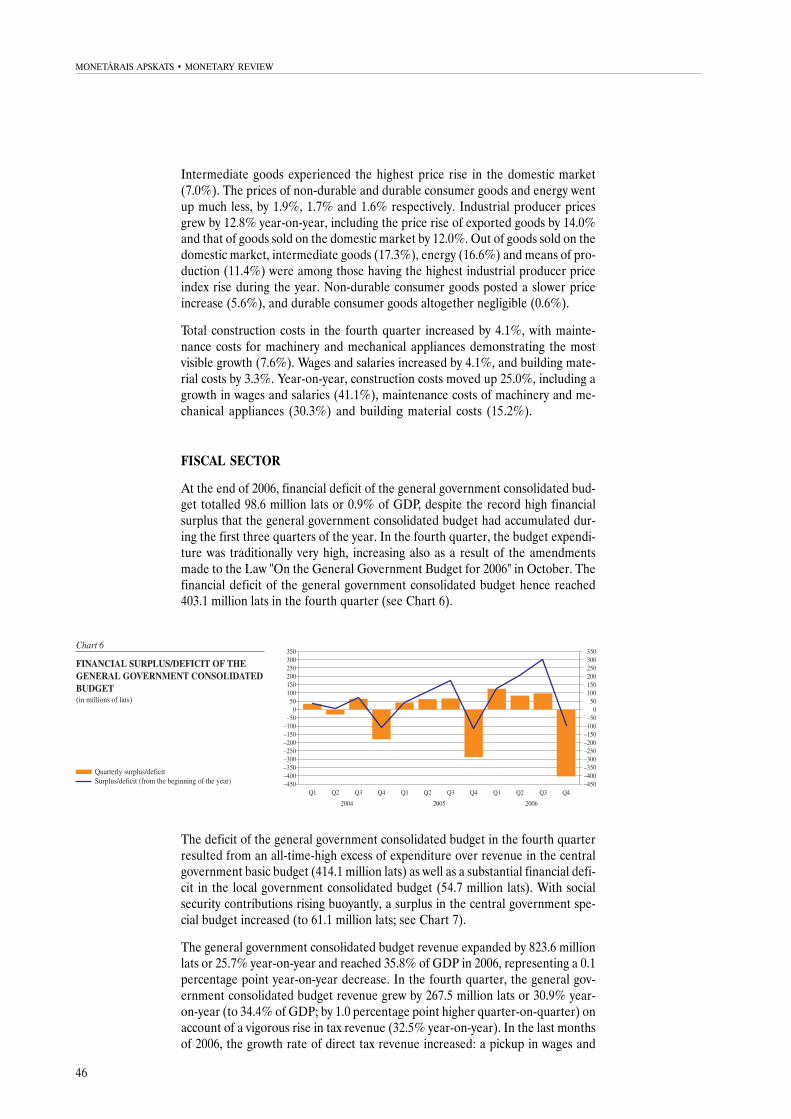
46
MONETÂRAIS APSKATS · MONETARY REVIEW
Intermediate goods experienced the highest price rise in the domestic market(7.0%). The prices of non-durable and durable consumer goods and energy wentup much less, by 1.9%, 1.7% and 1.6% respectively. Industrial producer pricesgrew by 12.8% year-on-year, including the price rise of exported goods by 14.0%and that of goods sold on the domestic market by 12.0%. Out of goods sold on thedomestic market, intermediate goods (17.3%), energy (16.6%) and means of pro-duction (11.4%) were among those having the highest industrial producer priceindex rise during the year. Non-durable consumer goods posted a slower priceincrease (5.6%), and durable consumer goods altogether negligible (0.6%).
Total construction costs in the fourth quarter increased by 4.1%, with mainte-nance costs for machinery and mechanical appliances demonstrating the mostvisible growth (7.6%). Wages and salaries increased by 4.1%, and building mate-rial costs by 3.3%. Year-on-year, construction costs moved up 25.0%, including agrowth in wages and salaries (41.1%), maintenance costs of machinery and me-chanical appliances (30.3%) and building material costs (15.2%).
FISCAL SECTOR
At the end of 2006, financial deficit of the general government consolidated bud-get totalled 98.6 million lats or 0.9% of GDP, despite the record high financialsurplus that the general government consolidated budget had accumulated dur-ing the first three quarters of the year. In the fourth quarter, the budget expendi-ture was traditionally very high, increasing also as a result of the amendmentsmade to the Law "On the General Government Budget for 2006" in October. Thefinancial deficit of the general government consolidated budget hence reached403.1 million lats in the fourth quarter (see Chart 6).
The deficit of the general government consolidated budget in the fourth quarterresulted from an all-time-high excess of expenditure over revenue in the centralgovernment basic budget (414.1 million lats) as well as a substantial financial defi-cit in the local government consolidated budget (54.7 million lats). With socialsecurity contributions rising buoyantly, a surplus in the central government spe-cial budget increased (to 61.1 million lats; see Chart 7).
The general government consolidated budget revenue expanded by 823.6 millionlats or 25.7% year-on-year and reached 35.8% of GDP in 2006, representing a 0.1percentage point year-on-year decrease. In the fourth quarter, the general gov-ernment consolidated budget revenue grew by 267.5 million lats or 30.9% year-on-year (to 34.4% of GDP; by 1.0 percentage point higher quarter-on-quarter) onaccount of a vigorous rise in tax revenue (32.5% year-on-year). In the last monthsof 2006, the growth rate of direct tax revenue increased: a pickup in wages and
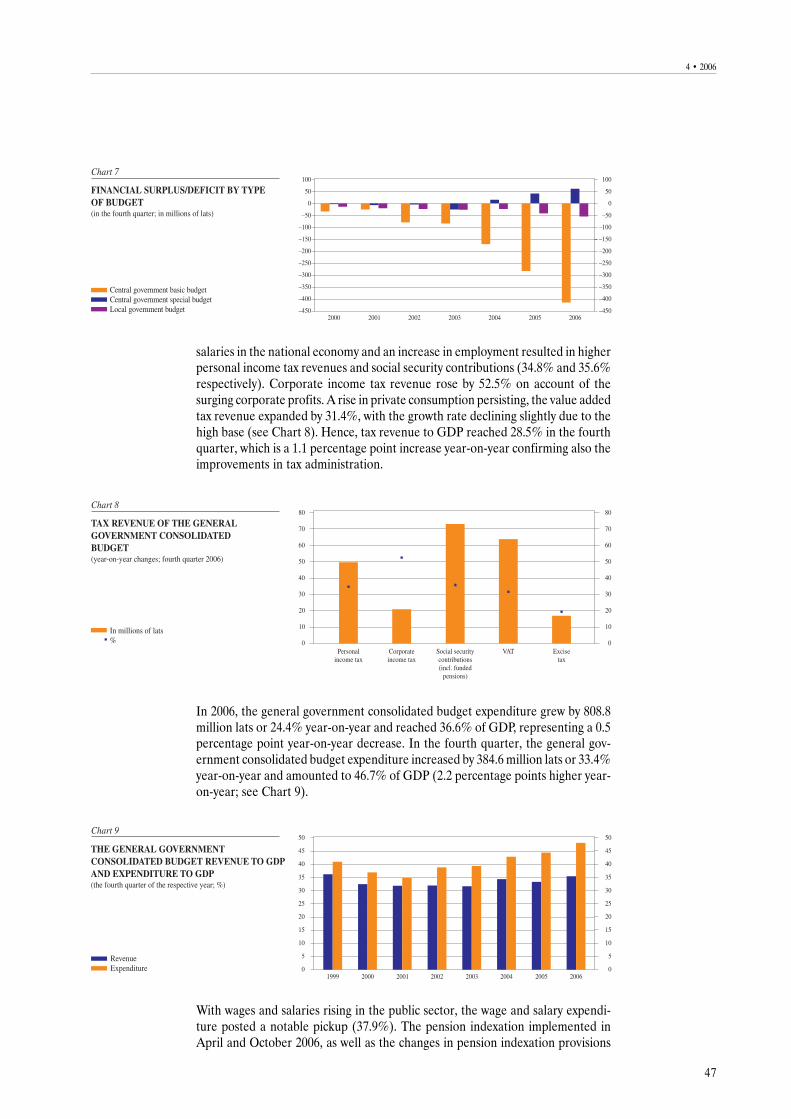
47
4 · 2006
salaries in the national economy and an increase in employment resulted in higherpersonal income tax revenues and social security contributions (34.8% and 35.6%respectively). Corporate income tax revenue rose by 52.5% on account of thesurging corporate profits. A rise in private consumption persisting, the value addedtax revenue expanded by 31.4%, with the growth rate declining slightly due to thehigh base (see Chart 8). Hence, tax revenue to GDP reached 28.5% in the fourthquarter, which is a 1.1 percentage point increase year-on-year confirming also theimprovements in tax administration.
In 2006, the general government consolidated budget expenditure grew by 808.8million lats or 24.4% year-on-year and reached 36.6% of GDP, representing a 0.5percentage point year-on-year decrease. In the fourth quarter, the general gov-ernment consolidated budget expenditure increased by 384.6 million lats or 33.4%year-on-year and amounted to 46.7% of GDP (2.2 percentage points higher year-on-year; see Chart 9).
With wages and salaries rising in the public sector, the wage and salary expendi-ture posted a notable pickup (37.9%). The pension indexation implemented inApril and October 2006, as well as the changes in pension indexation provisions
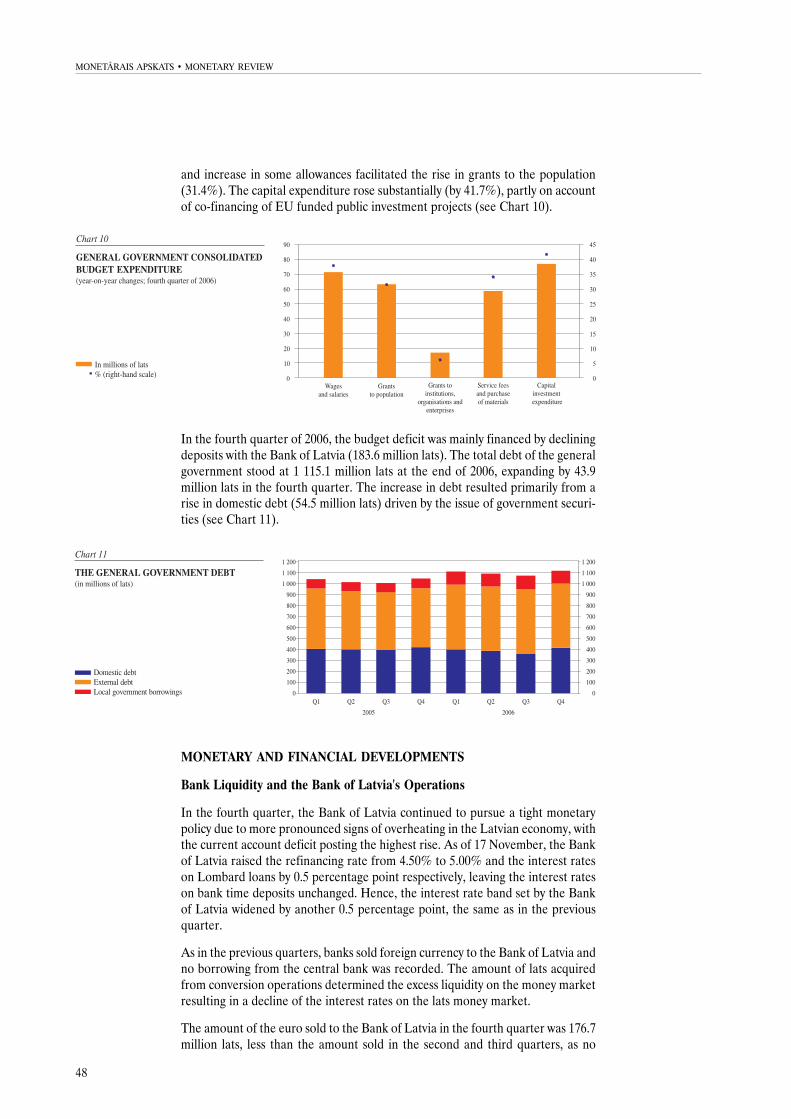
48
MONETÂRAIS APSKATS · MONETARY REVIEW
and increase in some allowances facilitated the rise in grants to the population(31.4%). The capital expenditure rose substantially (by 41.7%), partly on accountof co-financing of EU funded public investment projects (see Chart 10).
In the fourth quarter of 2006, the budget deficit was mainly financed by decliningdeposits with the Bank of Latvia (183.6 million lats). The total debt of the generalgovernment stood at 1 115.1 million lats at the end of 2006, expanding by 43.9million lats in the fourth quarter. The increase in debt resulted primarily from arise in domestic debt (54.5 million lats) driven by the issue of government securi-ties (see Chart 11).
MONETARY AND FINANCIAL DEVELOPMENTS
Bank Liquidity and the Bank of Latvia's Operations
In the fourth quarter, the Bank of Latvia continued to pursue a tight monetarypolicy due to more pronounced signs of overheating in the Latvian economy, withthe current account deficit posting the highest rise. As of 17 November, the Bankof Latvia raised the refinancing rate from 4.50% to 5.00% and the interest rateson Lombard loans by 0.5 percentage point respectively, leaving the interest rateson bank time deposits unchanged. Hence, the interest rate band set by the Bankof Latvia widened by another 0.5 percentage point, the same as in the previousquarter.
As in the previous quarters, banks sold foreign currency to the Bank of Latvia andno borrowing from the central bank was recorded. The amount of lats acquiredfrom conversion operations determined the excess liquidity on the money marketresulting in a decline of the interest rates on the lats money market.
The amount of the euro sold to the Bank of Latvia in the fourth quarter was 176.7million lats, less than the amount sold in the second and third quarters, as no
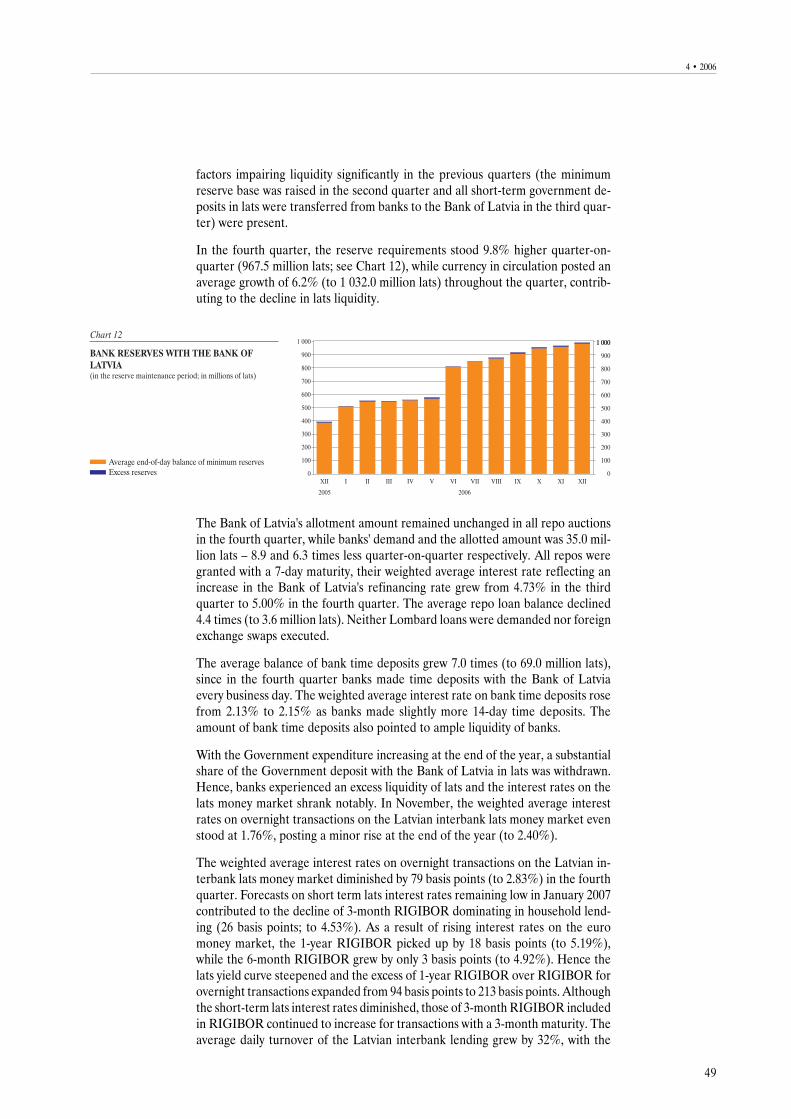
49
4 · 2006
The Bank of Latvia's allotment amount remained unchanged in all repo auctionsin the fourth quarter, while banks' demand and the allotted amount was 35.0 mil-lion lats – 8.9 and 6.3 times less quarter-on-quarter respectively. All repos weregranted with a 7-day maturity, their weighted average interest rate reflecting anincrease in the Bank of Latvia's refinancing rate grew from 4.73% in the thirdquarter to 5.00% in the fourth quarter. The average repo loan balance declined4.4 times (to 3.6 million lats). Neither Lombard loans were demanded nor foreignexchange swaps executed.
The average balance of bank time deposits grew 7.0 times (to 69.0 million lats),since in the fourth quarter banks made time deposits with the Bank of Latviaevery business day. The weighted average interest rate on bank time deposits rosefrom 2.13% to 2.15% as banks made slightly more 14-day time deposits. Theamount of bank time deposits also pointed to ample liquidity of banks.
With the Government expenditure increasing at the end of the year, a substantialshare of the Government deposit with the Bank of Latvia in lats was withdrawn.Hence, banks experienced an excess liquidity of lats and the interest rates on thelats money market shrank notably. In November, the weighted average interestrates on overnight transactions on the Latvian interbank lats money market evenstood at 1.76%, posting a minor rise at the end of the year (to 2.40%).
The weighted average interest rates on overnight transactions on the Latvian in-terbank lats money market diminished by 79 basis points (to 2.83%) in the fourthquarter. Forecasts on short term lats interest rates remaining low in January 2007contributed to the decline of 3-month RIGIBOR dominating in household lend-ing (26 basis points; to 4.53%). As a result of rising interest rates on the euromoney market, the 1-year RIGIBOR picked up by 18 basis points (to 5.19%),while the 6-month RIGIBOR grew by only 3 basis points (to 4.92%). Hence thelats yield curve steepened and the excess of 1-year RIGIBOR over RIGIBOR forovernight transactions expanded from 94 basis points to 213 basis points. Althoughthe short-term lats interest rates diminished, those of 3-month RIGIBOR includedin RIGIBOR continued to increase for transactions with a 3-month maturity. Theaverage daily turnover of the Latvian interbank lending grew by 32%, with the
factors impairing liquidity significantly in the previous quarters (the minimumreserve base was raised in the second quarter and all short-term government de-posits in lats were transferred from banks to the Bank of Latvia in the third quar-ter) were present.
In the fourth quarter, the reserve requirements stood 9.8% higher quarter-on-quarter (967.5 million lats; see Chart 12), while currency in circulation posted anaverage growth of 6.2% (to 1 032.0 million lats) throughout the quarter, contrib-uting to the decline in lats liquidity.
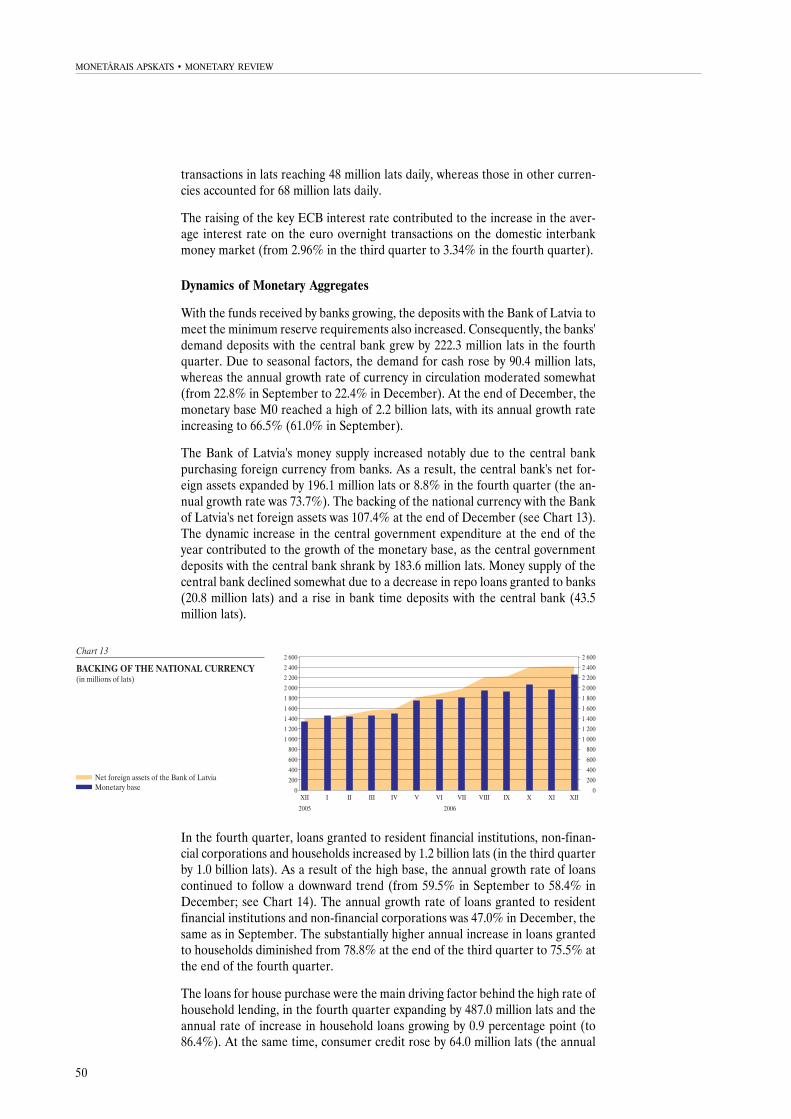
50
MONETÂRAIS APSKATS · MONETARY REVIEW
transactions in lats reaching 48 million lats daily, whereas those in other curren-cies accounted for 68 million lats daily.
The raising of the key ECB interest rate contributed to the increase in the aver-age interest rate on the euro overnight transactions on the domestic interbankmoney market (from 2.96% in the third quarter to 3.34% in the fourth quarter).
Dynamics of Monetary Aggregates
With the funds received by banks growing, the deposits with the Bank of Latvia tomeet the minimum reserve requirements also increased. Consequently, the banks'demand deposits with the central bank grew by 222.3 million lats in the fourthquarter. Due to seasonal factors, the demand for cash rose by 90.4 million lats,whereas the annual growth rate of currency in circulation moderated somewhat(from 22.8% in September to 22.4% in December). At the end of December, themonetary base M0 reached a high of 2.2 billion lats, with its annual growth rateincreasing to 66.5% (61.0% in September).
The Bank of Latvia's money supply increased notably due to the central bankpurchasing foreign currency from banks. As a result, the central bank's net for-eign assets expanded by 196.1 million lats or 8.8% in the fourth quarter (the an-nual growth rate was 73.7%). The backing of the national currency with the Bankof Latvia's net foreign assets was 107.4% at the end of December (see Chart 13).The dynamic increase in the central government expenditure at the end of theyear contributed to the growth of the monetary base, as the central governmentdeposits with the central bank shrank by 183.6 million lats. Money supply of thecentral bank declined somewhat due to a decrease in repo loans granted to banks(20.8 million lats) and a rise in bank time deposits with the central bank (43.5million lats).
In the fourth quarter, loans granted to resident financial institutions, non-finan-cial corporations and households increased by 1.2 billion lats (in the third quarterby 1.0 billion lats). As a result of the high base, the annual growth rate of loanscontinued to follow a downward trend (from 59.5% in September to 58.4% inDecember; see Chart 14). The annual growth rate of loans granted to residentfinancial institutions and non-financial corporations was 47.0% in December, thesame as in September. The substantially higher annual increase in loans grantedto households diminished from 78.8% at the end of the third quarter to 75.5% atthe end of the fourth quarter.
The loans for house purchase were the main driving factor behind the high rate ofhousehold lending, in the fourth quarter expanding by 487.0 million lats and theannual rate of increase in household loans growing by 0.9 percentage point (to86.4%). At the same time, consumer credit rose by 64.0 million lats (the annual
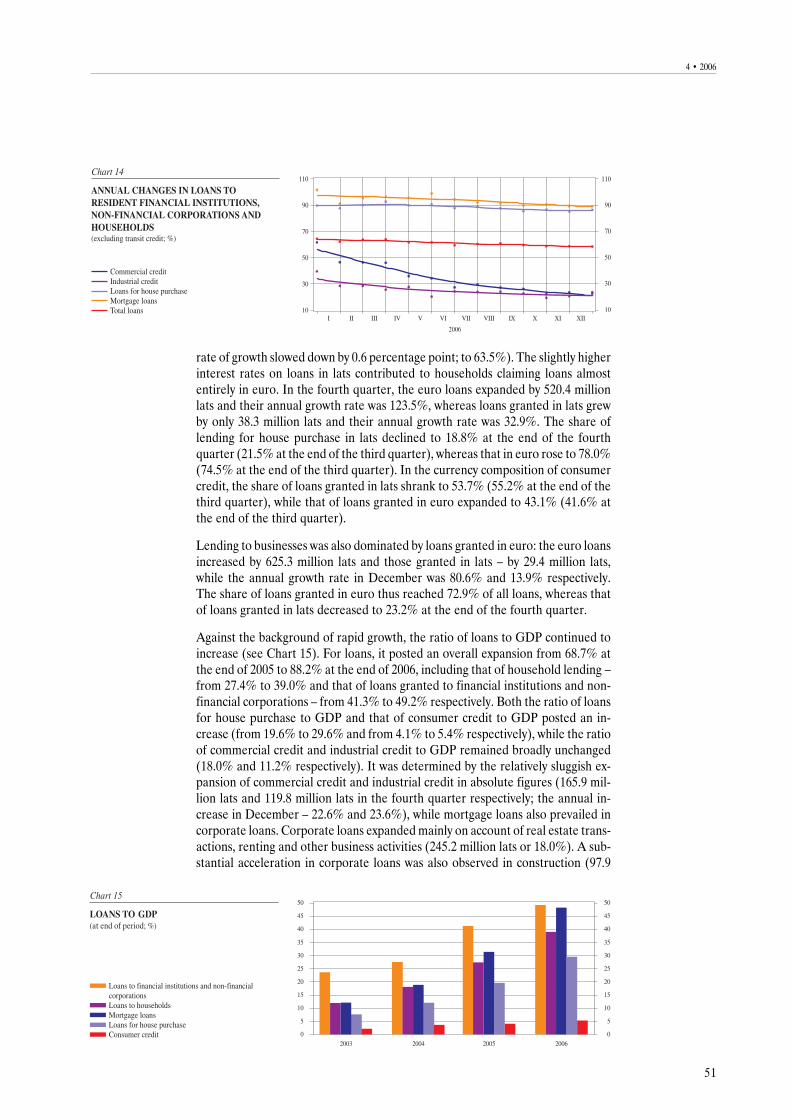
51
4 · 2006
rate of growth slowed down by 0.6 percentage point; to 63.5%). The slightly higherinterest rates on loans in lats contributed to households claiming loans almostentirely in euro. In the fourth quarter, the euro loans expanded by 520.4 millionlats and their annual growth rate was 123.5%, whereas loans granted in lats grewby only 38.3 million lats and their annual growth rate was 32.9%. The share oflending for house purchase in lats declined to 18.8% at the end of the fourthquarter (21.5% at the end of the third quarter), whereas that in euro rose to 78.0%(74.5% at the end of the third quarter). In the currency composition of consumercredit, the share of loans granted in lats shrank to 53.7% (55.2% at the end of thethird quarter), while that of loans granted in euro expanded to 43.1% (41.6% atthe end of the third quarter).
Lending to businesses was also dominated by loans granted in euro: the euro loansincreased by 625.3 million lats and those granted in lats – by 29.4 million lats,while the annual growth rate in December was 80.6% and 13.9% respectively.The share of loans granted in euro thus reached 72.9% of all loans, whereas thatof loans granted in lats decreased to 23.2% at the end of the fourth quarter.
Against the background of rapid growth, the ratio of loans to GDP continued toincrease (see Chart 15). For loans, it posted an overall expansion from 68.7% atthe end of 2005 to 88.2% at the end of 2006, including that of household lending –from 27.4% to 39.0% and that of loans granted to financial institutions and non-financial corporations – from 41.3% to 49.2% respectively. Both the ratio of loansfor house purchase to GDP and that of consumer credit to GDP posted an in-crease (from 19.6% to 29.6% and from 4.1% to 5.4% respectively), while the ratioof commercial credit and industrial credit to GDP remained broadly unchanged(18.0% and 11.2% respectively). It was determined by the relatively sluggish ex-pansion of commercial credit and industrial credit in absolute figures (165.9 mil-lion lats and 119.8 million lats in the fourth quarter respectively; the annual in-crease in December – 22.6% and 23.6%), while mortgage loans also prevailed incorporate loans. Corporate loans expanded mainly on account of real estate trans-actions, renting and other business activities (245.2 million lats or 18.0%). A sub-stantial acceleration in corporate loans was also observed in construction (97.9
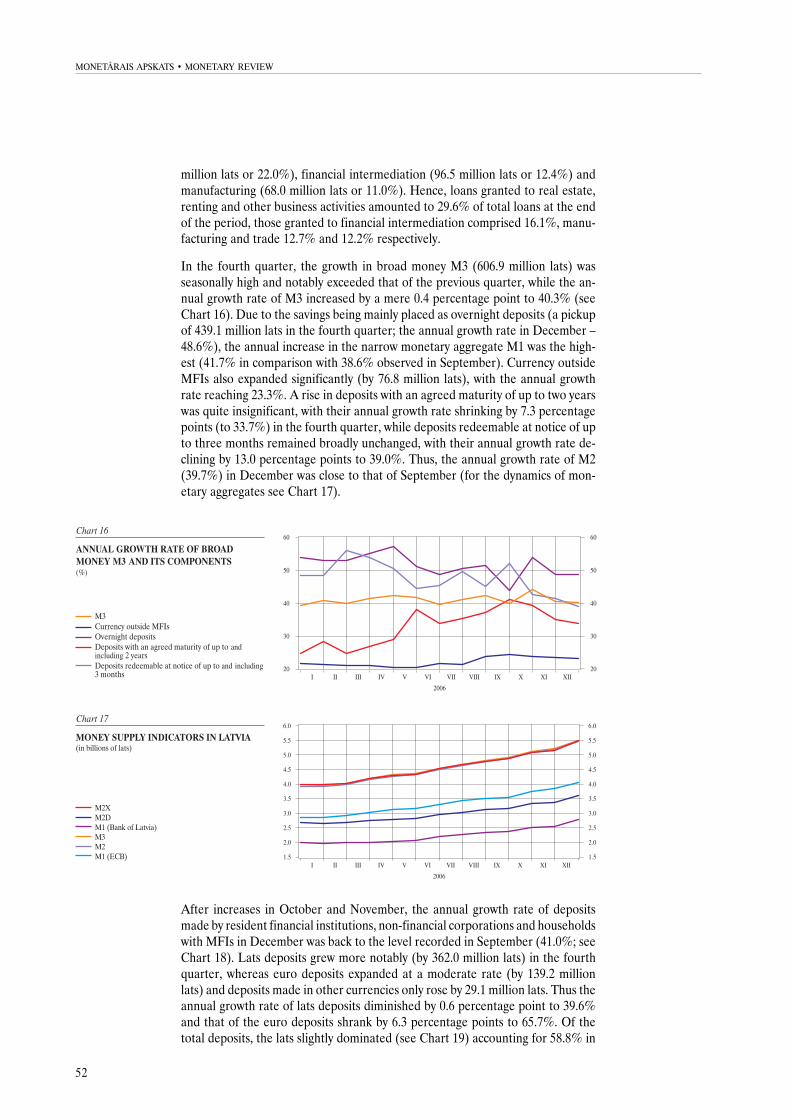
52
MONETÂRAIS APSKATS · MONETARY REVIEW
After increases in October and November, the annual growth rate of depositsmade by resident financial institutions, non-financial corporations and householdswith MFIs in December was back to the level recorded in September (41.0%; seeChart 18). Lats deposits grew more notably (by 362.0 million lats) in the fourthquarter, whereas euro deposits expanded at a moderate rate (by 139.2 millionlats) and deposits made in other currencies only rose by 29.1 million lats. Thus theannual growth rate of lats deposits diminished by 0.6 percentage point to 39.6%and that of the euro deposits shrank by 6.3 percentage points to 65.7%. Of thetotal deposits, the lats slightly dominated (see Chart 19) accounting for 58.8% in
million lats or 22.0%), financial intermediation (96.5 million lats or 12.4%) andmanufacturing (68.0 million lats or 11.0%). Hence, loans granted to real estate,renting and other business activities amounted to 29.6% of total loans at the endof the period, those granted to financial intermediation comprised 16.1%, manu-facturing and trade 12.7% and 12.2% respectively.
In the fourth quarter, the growth in broad money M3 (606.9 million lats) wasseasonally high and notably exceeded that of the previous quarter, while the an-nual growth rate of M3 increased by a mere 0.4 percentage point to 40.3% (seeChart 16). Due to the savings being mainly placed as overnight deposits (a pickupof 439.1 million lats in the fourth quarter; the annual growth rate in December –48.6%), the annual increase in the narrow monetary aggregate M1 was the high-est (41.7% in comparison with 38.6% observed in September). Currency outsideMFIs also expanded significantly (by 76.8 million lats), with the annual growthrate reaching 23.3%. A rise in deposits with an agreed maturity of up to two yearswas quite insignificant, with their annual growth rate shrinking by 7.3 percentagepoints (to 33.7%) in the fourth quarter, while deposits redeemable at notice of upto three months remained broadly unchanged, with their annual growth rate de-clining by 13.0 percentage points to 39.0%. Thus, the annual growth rate of M2(39.7%) in December was close to that of September (for the dynamics of mon-etary aggregates see Chart 17).
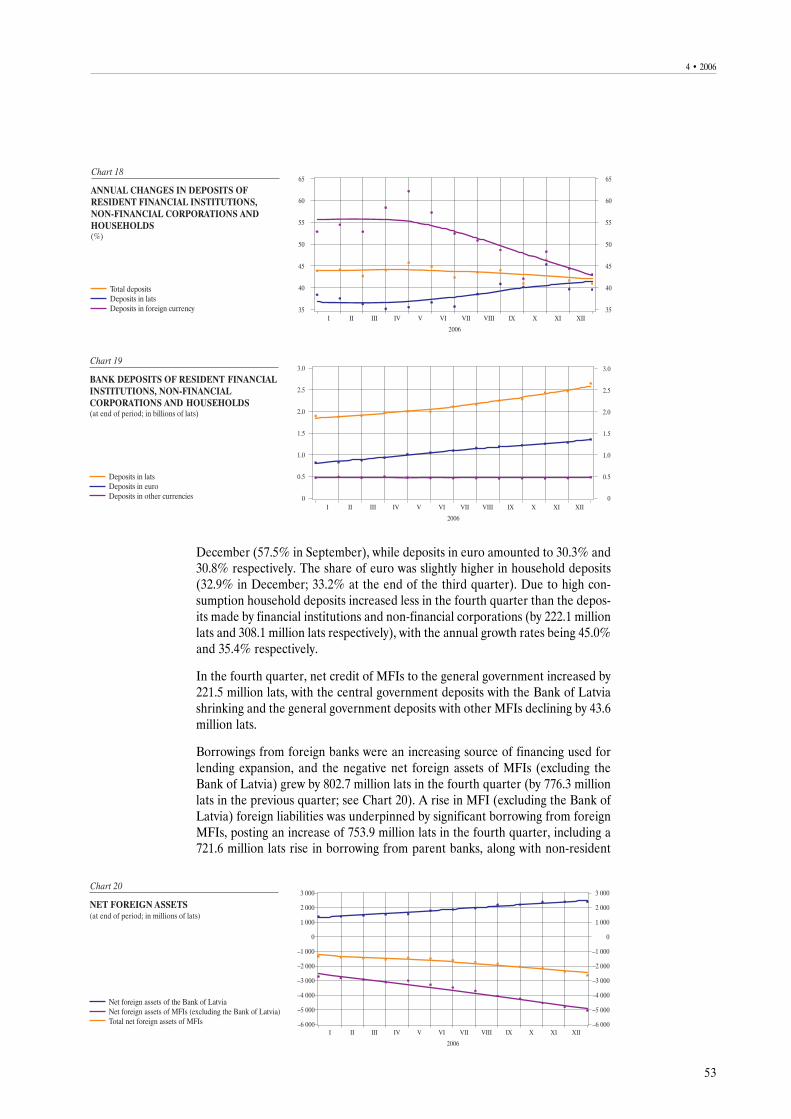
53
4 · 2006
December (57.5% in September), while deposits in euro amounted to 30.3% and30.8% respectively. The share of euro was slightly higher in household deposits(32.9% in December; 33.2% at the end of the third quarter). Due to high con-sumption household deposits increased less in the fourth quarter than the depos-its made by financial institutions and non-financial corporations (by 222.1 millionlats and 308.1 million lats respectively), with the annual growth rates being 45.0%and 35.4% respectively.
In the fourth quarter, net credit of MFIs to the general government increased by221.5 million lats, with the central government deposits with the Bank of Latviashrinking and the general government deposits with other MFIs declining by 43.6million lats.
Borrowings from foreign banks were an increasing source of financing used forlending expansion, and the negative net foreign assets of MFIs (excluding theBank of Latvia) grew by 802.7 million lats in the fourth quarter (by 776.3 millionlats in the previous quarter; see Chart 20). A rise in MFI (excluding the Bank ofLatvia) foreign liabilities was underpinned by significant borrowing from foreignMFIs, posting an increase of 753.9 million lats in the fourth quarter, including a721.6 million lats rise in borrowing from parent banks, along with non-resident
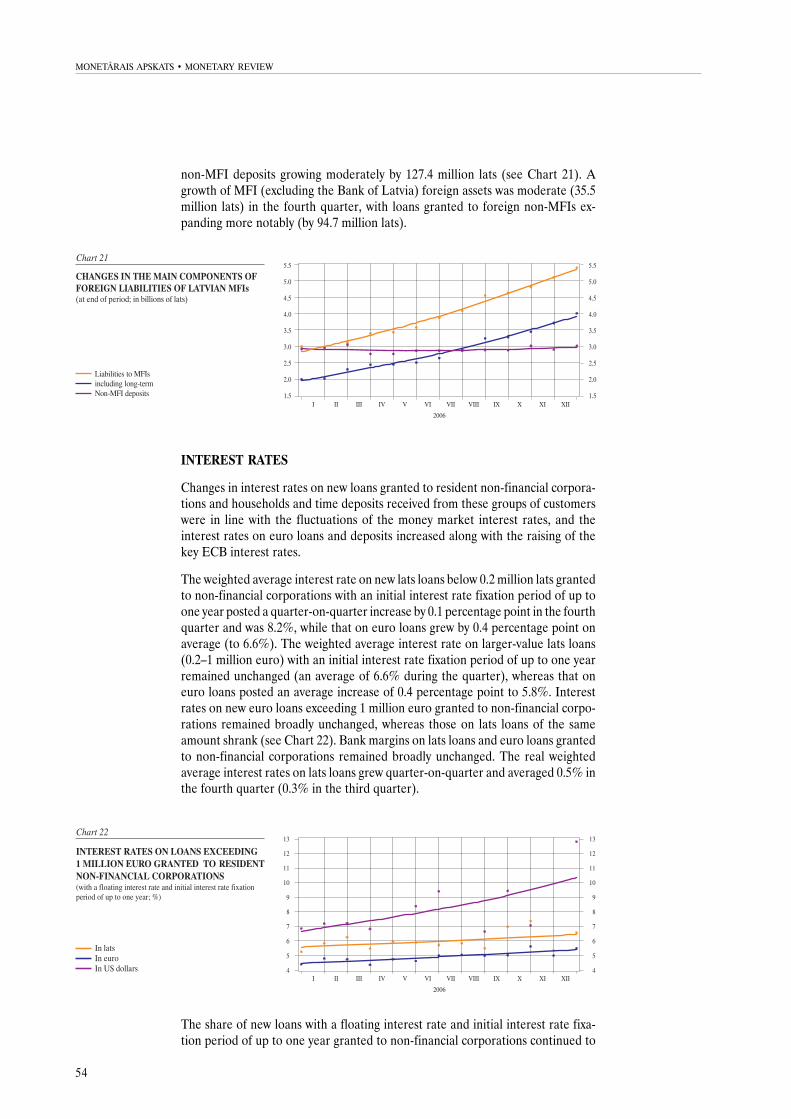
54
MONETÂRAIS APSKATS · MONETARY REVIEW
non-MFI deposits growing moderately by 127.4 million lats (see Chart 21). Agrowth of MFI (excluding the Bank of Latvia) foreign assets was moderate (35.5million lats) in the fourth quarter, with loans granted to foreign non-MFIs ex-panding more notably (by 94.7 million lats).
INTEREST RATES
Changes in interest rates on new loans granted to resident non-financial corpora-tions and households and time deposits received from these groups of customerswere in line with the fluctuations of the money market interest rates, and theinterest rates on euro loans and deposits increased along with the raising of thekey ECB interest rates.
The weighted average interest rate on new lats loans below 0.2 million lats grantedto non-financial corporations with an initial interest rate fixation period of up toone year posted a quarter-on-quarter increase by 0.1 percentage point in the fourthquarter and was 8.2%, while that on euro loans grew by 0.4 percentage point onaverage (to 6.6%). The weighted average interest rate on larger-value lats loans(0.2–1 million euro) with an initial interest rate fixation period of up to one yearremained unchanged (an average of 6.6% during the quarter), whereas that oneuro loans posted an average increase of 0.4 percentage point to 5.8%. Interestrates on new euro loans exceeding 1 million euro granted to non-financial corpo-rations remained broadly unchanged, whereas those on lats loans of the sameamount shrank (see Chart 22). Bank margins on lats loans and euro loans grantedto non-financial corporations remained broadly unchanged. The real weightedaverage interest rates on lats loans grew quarter-on-quarter and averaged 0.5% inthe fourth quarter (0.3% in the third quarter).
The share of new loans with a floating interest rate and initial interest rate fixa-tion period of up to one year granted to non-financial corporations continued to
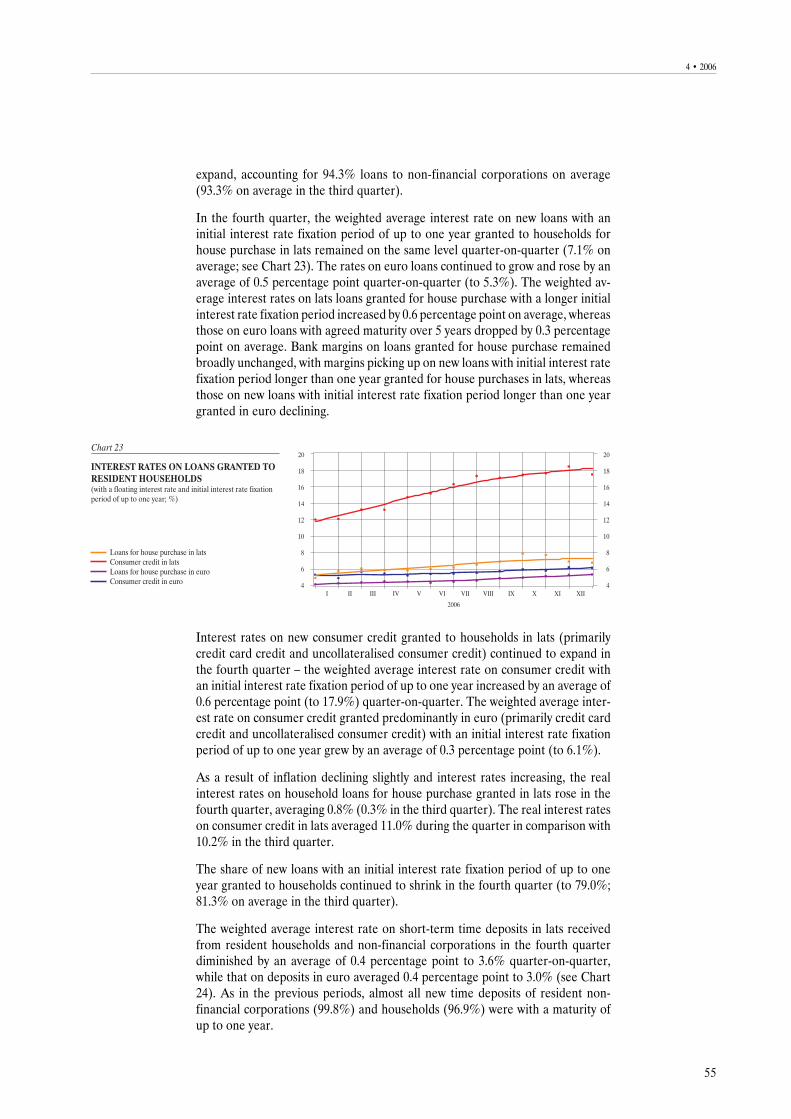
55
4 · 2006
expand, accounting for 94.3% loans to non-financial corporations on average(93.3% on average in the third quarter).
In the fourth quarter, the weighted average interest rate on new loans with aninitial interest rate fixation period of up to one year granted to households forhouse purchase in lats remained on the same level quarter-on-quarter (7.1% onaverage; see Chart 23). The rates on euro loans continued to grow and rose by anaverage of 0.5 percentage point quarter-on-quarter (to 5.3%). The weighted av-erage interest rates on lats loans granted for house purchase with a longer initialinterest rate fixation period increased by 0.6 percentage point on average, whereasthose on euro loans with agreed maturity over 5 years dropped by 0.3 percentagepoint on average. Bank margins on loans granted for house purchase remainedbroadly unchanged, with margins picking up on new loans with initial interest ratefixation period longer than one year granted for house purchases in lats, whereasthose on new loans with initial interest rate fixation period longer than one yeargranted in euro declining.
Interest rates on new consumer credit granted to households in lats (primarilycredit card credit and uncollateralised consumer credit) continued to expand inthe fourth quarter – the weighted average interest rate on consumer credit withan initial interest rate fixation period of up to one year increased by an average of0.6 percentage point (to 17.9%) quarter-on-quarter. The weighted average inter-est rate on consumer credit granted predominantly in euro (primarily credit cardcredit and uncollateralised consumer credit) with an initial interest rate fixationperiod of up to one year grew by an average of 0.3 percentage point (to 6.1%).
As a result of inflation declining slightly and interest rates increasing, the realinterest rates on household loans for house purchase granted in lats rose in thefourth quarter, averaging 0.8% (0.3% in the third quarter). The real interest rateson consumer credit in lats averaged 11.0% during the quarter in comparison with10.2% in the third quarter.
The share of new loans with an initial interest rate fixation period of up to oneyear granted to households continued to shrink in the fourth quarter (to 79.0%;81.3% on average in the third quarter).
The weighted average interest rate on short-term time deposits in lats receivedfrom resident households and non-financial corporations in the fourth quarterdiminished by an average of 0.4 percentage point to 3.6% quarter-on-quarter,while that on deposits in euro averaged 0.4 percentage point to 3.0% (see Chart24). As in the previous periods, almost all new time deposits of resident non-financial corporations (99.8%) and households (96.9%) were with a maturity ofup to one year.
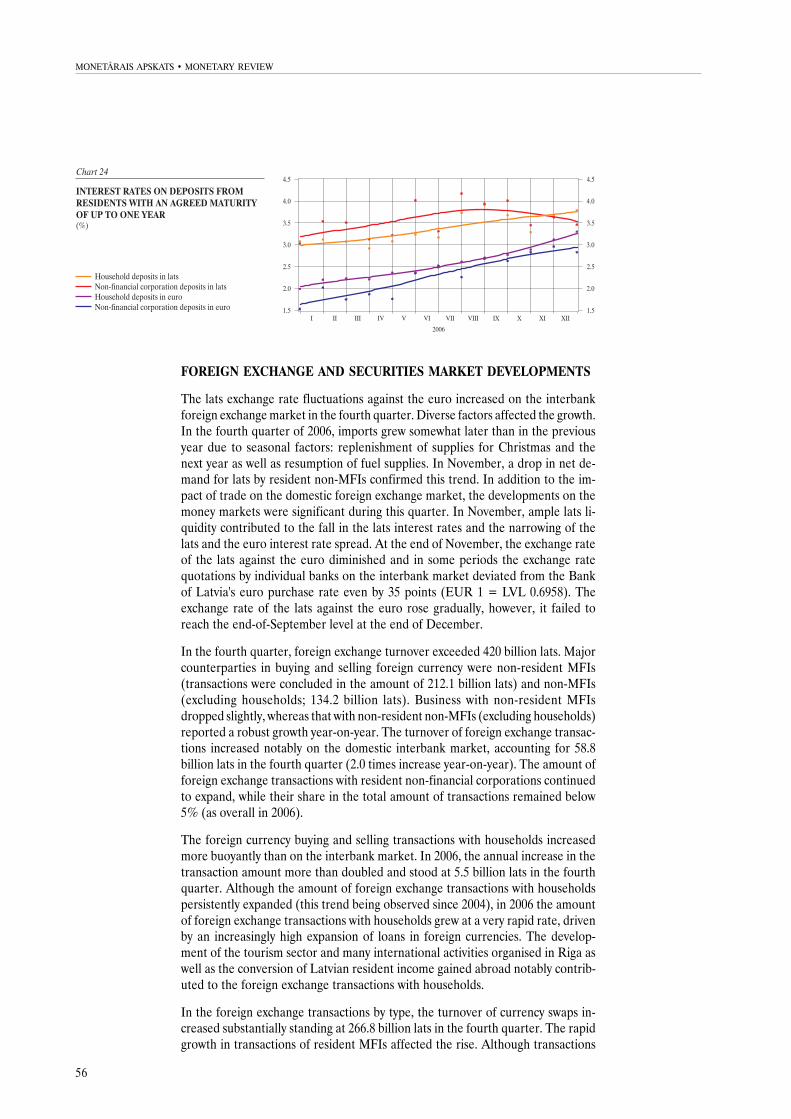
56
MONETÂRAIS APSKATS · MONETARY REVIEW
FOREIGN EXCHANGE AND SECURITIES MARKET DEVELOPMENTS
The lats exchange rate fluctuations against the euro increased on the interbankforeign exchange market in the fourth quarter. Diverse factors affected the growth.In the fourth quarter of 2006, imports grew somewhat later than in the previousyear due to seasonal factors: replenishment of supplies for Christmas and thenext year as well as resumption of fuel supplies. In November, a drop in net de-mand for lats by resident non-MFIs confirmed this trend. In addition to the im-pact of trade on the domestic foreign exchange market, the developments on themoney markets were significant during this quarter. In November, ample lats li-quidity contributed to the fall in the lats interest rates and the narrowing of thelats and the euro interest rate spread. At the end of November, the exchange rateof the lats against the euro diminished and in some periods the exchange ratequotations by individual banks on the interbank market deviated from the Bankof Latvia's euro purchase rate even by 35 points (EUR 1 = LVL 0.6958). Theexchange rate of the lats against the euro rose gradually, however, it failed toreach the end-of-September level at the end of December.
In the fourth quarter, foreign exchange turnover exceeded 420 billion lats. Majorcounterparties in buying and selling foreign currency were non-resident MFIs(transactions were concluded in the amount of 212.1 billion lats) and non-MFIs(excluding households; 134.2 billion lats). Business with non-resident MFIsdropped slightly, whereas that with non-resident non-MFIs (excluding households)reported a robust growth year-on-year. The turnover of foreign exchange transac-tions increased notably on the domestic interbank market, accounting for 58.8billion lats in the fourth quarter (2.0 times increase year-on-year). The amount offoreign exchange transactions with resident non-financial corporations continuedto expand, while their share in the total amount of transactions remained below5% (as overall in 2006).
The foreign currency buying and selling transactions with households increasedmore buoyantly than on the interbank market. In 2006, the annual increase in thetransaction amount more than doubled and stood at 5.5 billion lats in the fourthquarter. Although the amount of foreign exchange transactions with householdspersistently expanded (this trend being observed since 2004), in 2006 the amountof foreign exchange transactions with households grew at a very rapid rate, drivenby an increasingly high expansion of loans in foreign currencies. The develop-ment of the tourism sector and many international activities organised in Riga aswell as the conversion of Latvian resident income gained abroad notably contrib-uted to the foreign exchange transactions with households.
In the foreign exchange transactions by type, the turnover of currency swaps in-creased substantially standing at 266.8 billion lats in the fourth quarter. The rapidgrowth in transactions of resident MFIs affected the rise. Although transactions
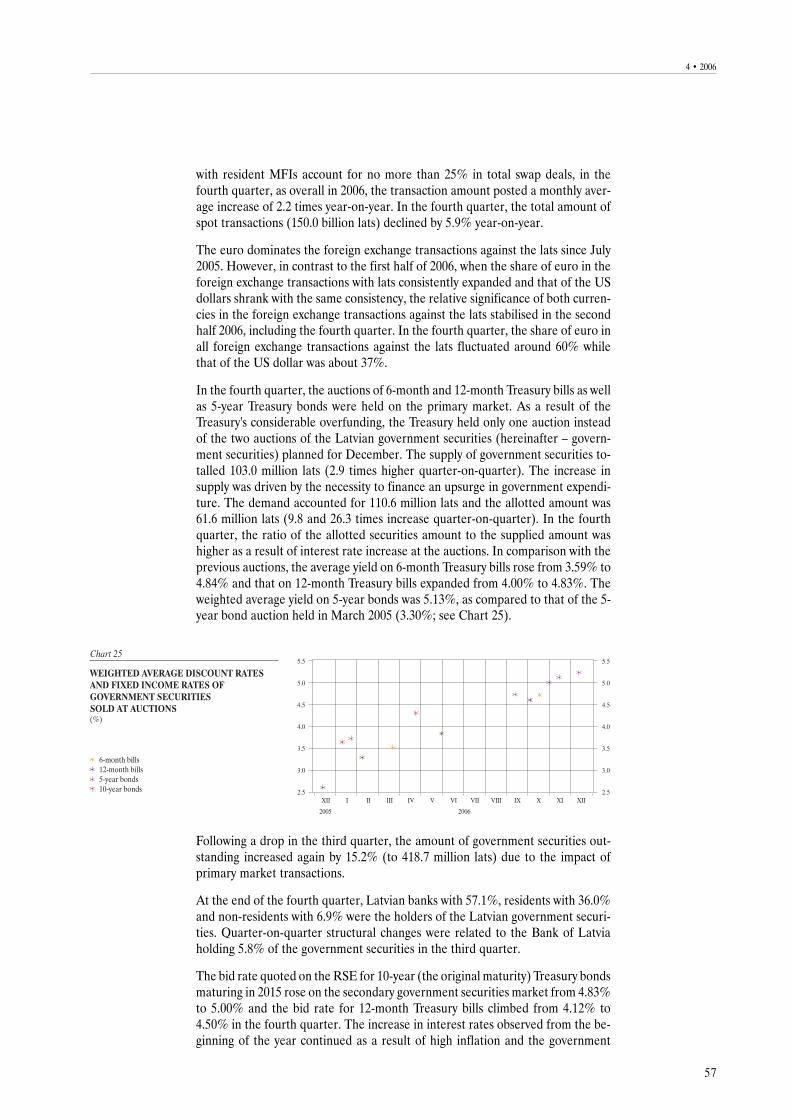
57
4 · 2006
with resident MFIs account for no more than 25% in total swap deals, in thefourth quarter, as overall in 2006, the transaction amount posted a monthly aver-age increase of 2.2 times year-on-year. In the fourth quarter, the total amount ofspot transactions (150.0 billion lats) declined by 5.9% year-on-year.
The euro dominates the foreign exchange transactions against the lats since July2005. However, in contrast to the first half of 2006, when the share of euro in theforeign exchange transactions with lats consistently expanded and that of the USdollars shrank with the same consistency, the relative significance of both curren-cies in the foreign exchange transactions against the lats stabilised in the secondhalf 2006, including the fourth quarter. In the fourth quarter, the share of euro inall foreign exchange transactions against the lats fluctuated around 60% whilethat of the US dollar was about 37%.
In the fourth quarter, the auctions of 6-month and 12-month Treasury bills as wellas 5-year Treasury bonds were held on the primary market. As a result of theTreasury's considerable overfunding, the Treasury held only one auction insteadof the two auctions of the Latvian government securities (hereinafter – govern-ment securities) planned for December. The supply of government securities to-talled 103.0 million lats (2.9 times higher quarter-on-quarter). The increase insupply was driven by the necessity to finance an upsurge in government expendi-ture. The demand accounted for 110.6 million lats and the allotted amount was61.6 million lats (9.8 and 26.3 times increase quarter-on-quarter). In the fourthquarter, the ratio of the allotted securities amount to the supplied amount washigher as a result of interest rate increase at the auctions. In comparison with theprevious auctions, the average yield on 6-month Treasury bills rose from 3.59% to4.84% and that on 12-month Treasury bills expanded from 4.00% to 4.83%. Theweighted average yield on 5-year bonds was 5.13%, as compared to that of the 5-year bond auction held in March 2005 (3.30%; see Chart 25).
Following a drop in the third quarter, the amount of government securities out-standing increased again by 15.2% (to 418.7 million lats) due to the impact ofprimary market transactions.
At the end of the fourth quarter, Latvian banks with 57.1%, residents with 36.0%and non-residents with 6.9% were the holders of the Latvian government securi-ties. Quarter-on-quarter structural changes were related to the Bank of Latviaholding 5.8% of the government securities in the third quarter.
The bid rate quoted on the RSE for 10-year (the original maturity) Treasury bondsmaturing in 2015 rose on the secondary government securities market from 4.83%to 5.00% and the bid rate for 12-month Treasury bills climbed from 4.12% to4.50% in the fourth quarter. The increase in interest rates observed from the be-ginning of the year continued as a result of high inflation and the government
58
MONETÂRAIS APSKATS · MONETARY REVIEW
budget deficit as well as the Bank of Latvia's interventions on the secondary secu-rities market in the previous two quarters. The bid rate quoted for Latvian Gov-ernment Eurobonds maturing in 2014 picked up from 3.83% to 4.15%. The riseresulted from the bond interest rate growth in Europe, while the interest ratespread vis-a-vis the respective maturity German Eurobonds increased by only 1 ba-sis point (to 20 basis points). The bid rate quoted on the RSE for the lats bonds ofthe SJSC Latvijas Hipotçku un zemes banka (maturing in 2013) posted a minimumchange in the fourth quarter (5.18%).
The stock of outstanding corporate debt securities denominated in lats and regis-tered with the LCD decreased from 77.4 million lats to 49.8 million lats in thefourth quarter. Five issues were redeemed, of them, two Norddeutsche Landesbank
Girozentrale long-term bond issues (13 million lats in total) were the largest andone issue (West LB AG long-term bond issue amounting to 13 million lats) wasredeemed prior to maturity. Only one new issue of the JSC SEB Latvijas Unibanka
short-term deposit certificates was released in the amount of 2.1 million lats.
In the fourth quarter, the turnover of debt securities on the RSE was 4.4 timeshigher quarter-on-quarter (611 thousand lats). The turnover of the SJSC Latvijas
Hipotçku un zemes banka mortgage bonds amounted to 64.3% of the turnover ofdebt securities (in the third quarter the mortgage bond turnover was 85.6% of thetotal turnover) and that of the government securities accounted for the rest.
OMX Riga grew by 7.9% and BALTIX increased by 19.1% in the fourth quarter.Although as a result of rising costs the notified nine month indicators were some-what lower than in the previous year, the overall future prospects remained posi-tive and the stock index continued to rise. Latvian stock market capitalisationincreased by 13.9% (to 1 430 million lats). In the fourth quarter, the RSE turn-over totalled 16.2 million lats, i.e. 62.0% higher quarter-on-quarter. The JSCGrindeks shares posted the highest turnover (6.0 million lats). The JSC Grindeks
put forth the share repurchase offer to the JSC Tallinn Pharmaceutical Plant mi-nority shareholders as well as increased investment in the production develop-ment. Foreign investors' interest regarding the JSC Grindeks shares could be ob-served.
On 5 October, the State owned shares of the JSC Ventspils nafta were sold, with38.6% of the total amount or 40.3 million shares being offered and the minimumprice set at LVL 1.81 per share. At the auction, the demand slightly exceeded thesupply and the shares were purchased by paying LVL 1.84 per share. The Nether-lands oil company Vitol Group bought 34% of the JSC Ventspils nafta shares, un-dertaking to increase the turnover of the JSC Ventspils nafta oil terminals.
MFI DEVELOPMENTS
At the end of the fourth quarter, 64 MFIs (excluding the Bank of Latvia), includ-ing 21 banks, three branches of foreign banks, 35 credit unions, three electronicmoney institutions and two money market funds, were registered in the Republicof Latvia.
The total paid-up share capital of MFIs was 590.1 million lats at the end of thefourth quarter, representing an increase of 1.4% over the end of the third quarter.The share of foreign investment in the paid-up share capital edged up slightly to68.6%.
As compared to the end of the third quarter, all major MFI indicators continuedto improve, including assets (excluding trust assets) increased by 11.0% to 15.9
`
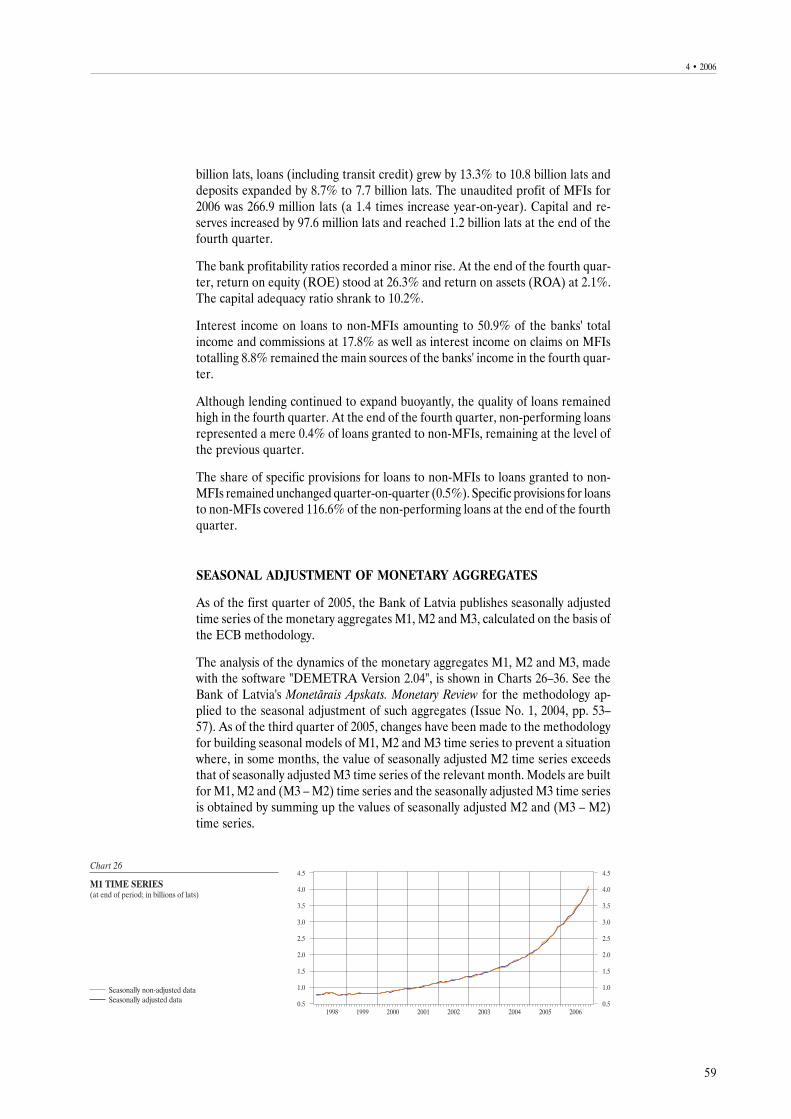
59
4 · 2006
billion lats, loans (including transit credit) grew by 13.3% to 10.8 billion lats anddeposits expanded by 8.7% to 7.7 billion lats. The unaudited profit of MFIs for2006 was 266.9 million lats (a 1.4 times increase year-on-year). Capital and re-serves increased by 97.6 million lats and reached 1.2 billion lats at the end of thefourth quarter.
The bank profitability ratios recorded a minor rise. At the end of the fourth quar-ter, return on equity (ROE) stood at 26.3% and return on assets (ROA) at 2.1%.The capital adequacy ratio shrank to 10.2%.
Interest income on loans to non-MFIs amounting to 50.9% of the banks' totalincome and commissions at 17.8% as well as interest income on claims on MFIstotalling 8.8% remained the main sources of the banks' income in the fourth quar-ter.
Although lending continued to expand buoyantly, the quality of loans remainedhigh in the fourth quarter. At the end of the fourth quarter, non-performing loansrepresented a mere 0.4% of loans granted to non-MFIs, remaining at the level ofthe previous quarter.
The share of specific provisions for loans to non-MFIs to loans granted to non-MFIs remained unchanged quarter-on-quarter (0.5%). Specific provisions for loansto non-MFIs covered 116.6% of the non-performing loans at the end of the fourthquarter.
SEASONAL ADJUSTMENT OF MONETARY AGGREGATES
As of the first quarter of 2005, the Bank of Latvia publishes seasonally adjustedtime series of the monetary aggregates M1, M2 and M3, calculated on the basis ofthe ECB methodology.
The analysis of the dynamics of the monetary aggregates M1, M2 and M3, madewith the software "DEMETRA Version 2.04", is shown in Charts 26–36. See theBank of Latvia's Monetârais Apskats. Monetary Review for the methodology ap-plied to the seasonal adjustment of such aggregates (Issue No. 1, 2004, pp. 53–57). As of the third quarter of 2005, changes have been made to the methodologyfor building seasonal models of M1, M2 and M3 time series to prevent a situationwhere, in some months, the value of seasonally adjusted M2 time series exceedsthat of seasonally adjusted M3 time series of the relevant month. Models are builtfor M1, M2 and (M3 – M2) time series and the seasonally adjusted M3 time seriesis obtained by summing up the values of seasonally adjusted M2 and (M3 – M2)time series.
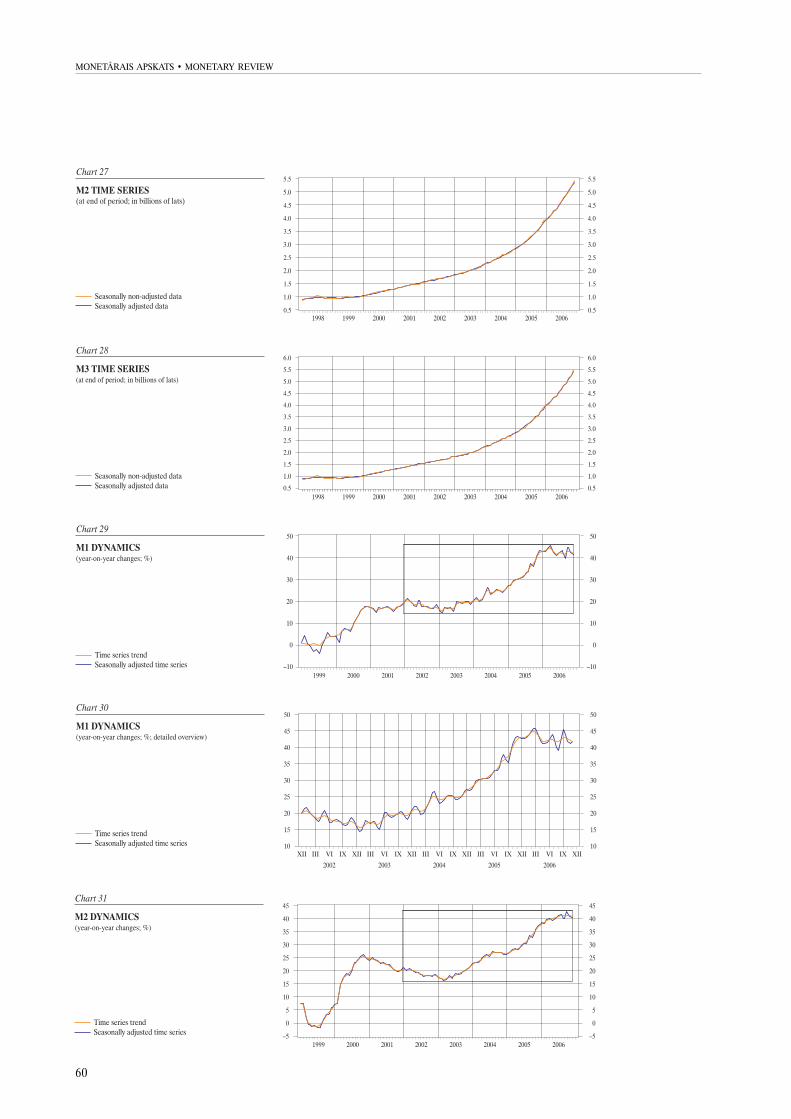
60
MONETÂRAIS APSKATS · MONETARY REVIEW
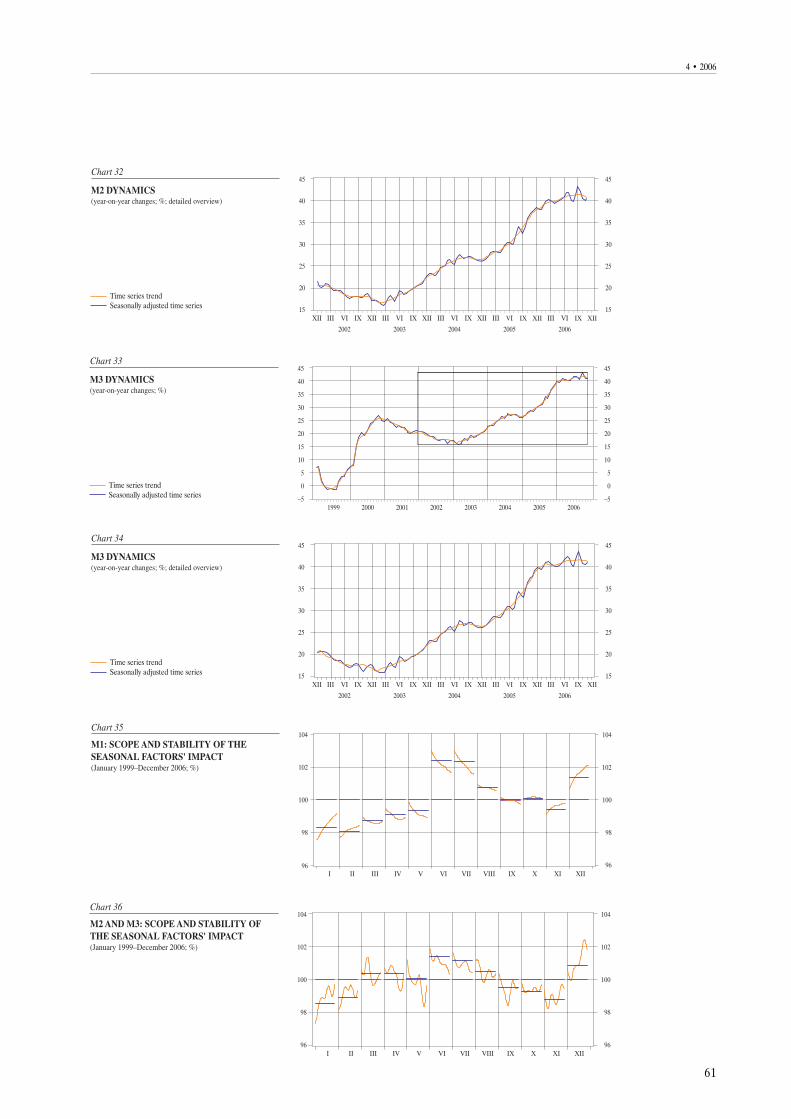
61
4 · 2006
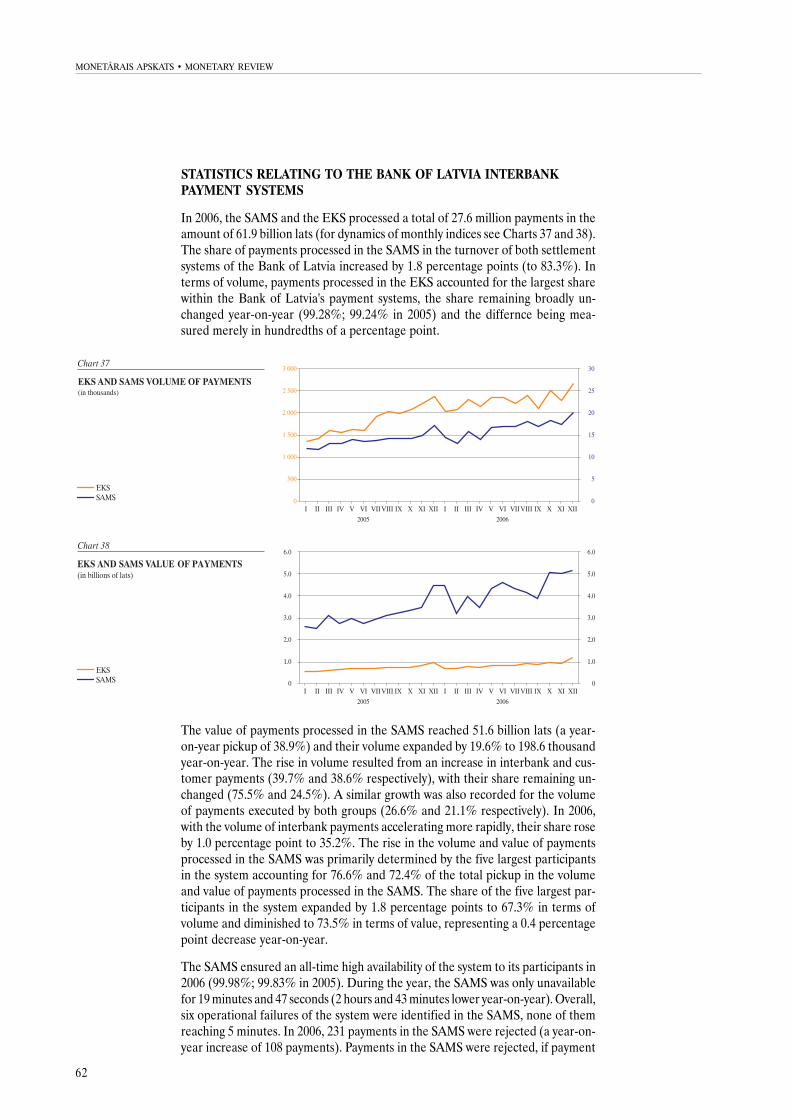
62
MONETÂRAIS APSKATS · MONETARY REVIEW
STATISTICS RELATING TO THE BANK OF LATVIA INTERBANKPAYMENT SYSTEMS
In 2006, the SAMS and the EKS processed a total of 27.6 million payments in theamount of 61.9 billion lats (for dynamics of monthly indices see Charts 37 and 38).The share of payments processed in the SAMS in the turnover of both settlementsystems of the Bank of Latvia increased by 1.8 percentage points (to 83.3%). Interms of volume, payments processed in the EKS accounted for the largest sharewithin the Bank of Latvia's payment systems, the share remaining broadly un-changed year-on-year (99.28%; 99.24% in 2005) and the differnce being mea-sured merely in hundredths of a percentage point.
The value of payments processed in the SAMS reached 51.6 billion lats (a year-on-year pickup of 38.9%) and their volume expanded by 19.6% to 198.6 thousandyear-on-year. The rise in volume resulted from an increase in interbank and cus-tomer payments (39.7% and 38.6% respectively), with their share remaining un-changed (75.5% and 24.5%). A similar growth was also recorded for the volumeof payments executed by both groups (26.6% and 21.1% respectively). In 2006,with the volume of interbank payments accelerating more rapidly, their share roseby 1.0 percentage point to 35.2%. The rise in the volume and value of paymentsprocessed in the SAMS was primarily determined by the five largest participantsin the system accounting for 76.6% and 72.4% of the total pickup in the volumeand value of payments processed in the SAMS. The share of the five largest par-ticipants in the system expanded by 1.8 percentage points to 67.3% in terms ofvolume and diminished to 73.5% in terms of value, representing a 0.4 percentagepoint decrease year-on-year.
The SAMS ensured an all-time high availability of the system to its participants in2006 (99.98%; 99.83% in 2005). During the year, the SAMS was only unavailablefor 19 minutes and 47 seconds (2 hours and 43 minutes lower year-on-year). Overall,six operational failures of the system were identified in the SAMS, none of themreaching 5 minutes. In 2006, 231 payments in the SAMS were rejected (a year-on-year increase of 108 payments). Payments in the SAMS were rejected, if payment
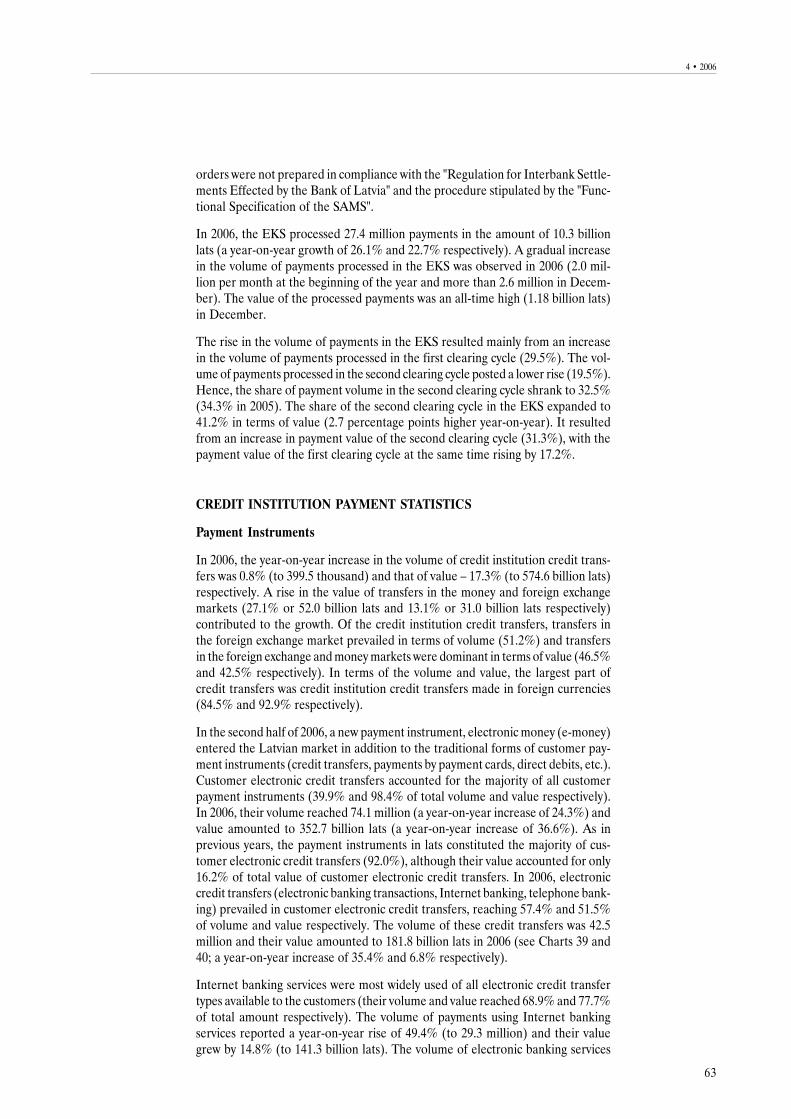
63
4 · 2006
orders were not prepared in compliance with the "Regulation for Interbank Settle-ments Effected by the Bank of Latvia" and the procedure stipulated by the "Func-tional Specification of the SAMS".
In 2006, the EKS processed 27.4 million payments in the amount of 10.3 billionlats (a year-on-year growth of 26.1% and 22.7% respectively). A gradual increasein the volume of payments processed in the EKS was observed in 2006 (2.0 mil-lion per month at the beginning of the year and more than 2.6 million in Decem-ber). The value of the processed payments was an all-time high (1.18 billion lats)in December.
The rise in the volume of payments in the EKS resulted mainly from an increasein the volume of payments processed in the first clearing cycle (29.5%). The vol-ume of payments processed in the second clearing cycle posted a lower rise (19.5%).Hence, the share of payment volume in the second clearing cycle shrank to 32.5%(34.3% in 2005). The share of the second clearing cycle in the EKS expanded to41.2% in terms of value (2.7 percentage points higher year-on-year). It resultedfrom an increase in payment value of the second clearing cycle (31.3%), with thepayment value of the first clearing cycle at the same time rising by 17.2%.
CREDIT INSTITUTION PAYMENT STATISTICS
Payment Instruments
In 2006, the year-on-year increase in the volume of credit institution credit trans-fers was 0.8% (to 399.5 thousand) and that of value – 17.3% (to 574.6 billion lats)respectively. A rise in the value of transfers in the money and foreign exchangemarkets (27.1% or 52.0 billion lats and 13.1% or 31.0 billion lats respectively)contributed to the growth. Of the credit institution credit transfers, transfers inthe foreign exchange market prevailed in terms of volume (51.2%) and transfersin the foreign exchange and money markets were dominant in terms of value (46.5%and 42.5% respectively). In terms of the volume and value, the largest part ofcredit transfers was credit institution credit transfers made in foreign currencies(84.5% and 92.9% respectively).
In the second half of 2006, a new payment instrument, electronic money (e-money)entered the Latvian market in addition to the traditional forms of customer pay-ment instruments (credit transfers, payments by payment cards, direct debits, etc.).Customer electronic credit transfers accounted for the majority of all customerpayment instruments (39.9% and 98.4% of total volume and value respectively).In 2006, their volume reached 74.1 million (a year-on-year increase of 24.3%) andvalue amounted to 352.7 billion lats (a year-on-year increase of 36.6%). As inprevious years, the payment instruments in lats constituted the majority of cus-tomer electronic credit transfers (92.0%), although their value accounted for only16.2% of total value of customer electronic credit transfers. In 2006, electroniccredit transfers (electronic banking transactions, Internet banking, telephone bank-ing) prevailed in customer electronic credit transfers, reaching 57.4% and 51.5%of volume and value respectively. The volume of these credit transfers was 42.5million and their value amounted to 181.8 billion lats in 2006 (see Charts 39 and40; a year-on-year increase of 35.4% and 6.8% respectively).
Internet banking services were most widely used of all electronic credit transfertypes available to the customers (their volume and value reached 68.9% and 77.7%of total amount respectively). The volume of payments using Internet bankingservices reported a year-on-year rise of 49.4% (to 29.3 million) and their valuegrew by 14.8% (to 141.3 billion lats). The volume of electronic banking services
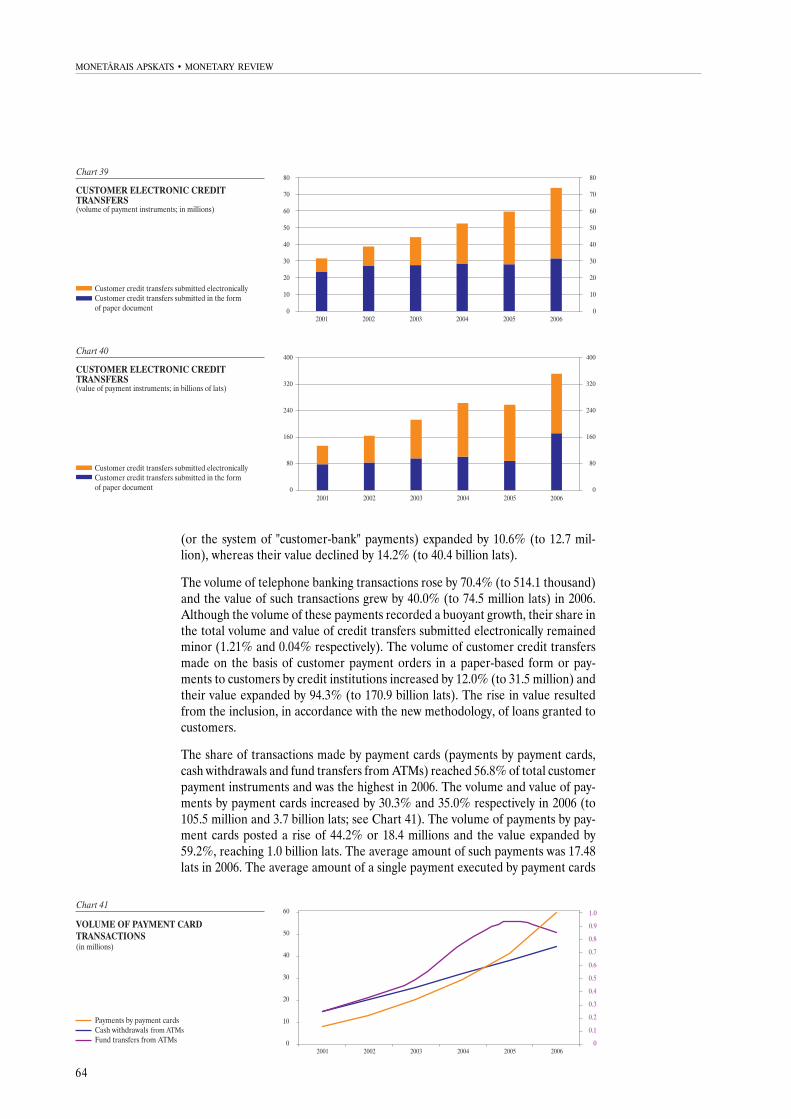
64
MONETÂRAIS APSKATS · MONETARY REVIEW
(or the system of "customer-bank" payments) expanded by 10.6% (to 12.7 mil-lion), whereas their value declined by 14.2% (to 40.4 billion lats).
The volume of telephone banking transactions rose by 70.4% (to 514.1 thousand)and the value of such transactions grew by 40.0% (to 74.5 million lats) in 2006.Although the volume of these payments recorded a buoyant growth, their share inthe total volume and value of credit transfers submitted electronically remainedminor (1.21% and 0.04% respectively). The volume of customer credit transfersmade on the basis of customer payment orders in a paper-based form or pay-ments to customers by credit institutions increased by 12.0% (to 31.5 million) andtheir value expanded by 94.3% (to 170.9 billion lats). The rise in value resultedfrom the inclusion, in accordance with the new methodology, of loans granted tocustomers.
The share of transactions made by payment cards (payments by payment cards,cash withdrawals and fund transfers from ATMs) reached 56.8% of total customerpayment instruments and was the highest in 2006. The volume and value of pay-ments by payment cards increased by 30.3% and 35.0% respectively in 2006 (to105.5 million and 3.7 billion lats; see Chart 41). The volume of payments by pay-ment cards posted a rise of 44.2% or 18.4 millions and the value expanded by59.2%, reaching 1.0 billion lats. The average amount of such payments was 17.48lats in 2006. The average amount of a single payment executed by payment cards
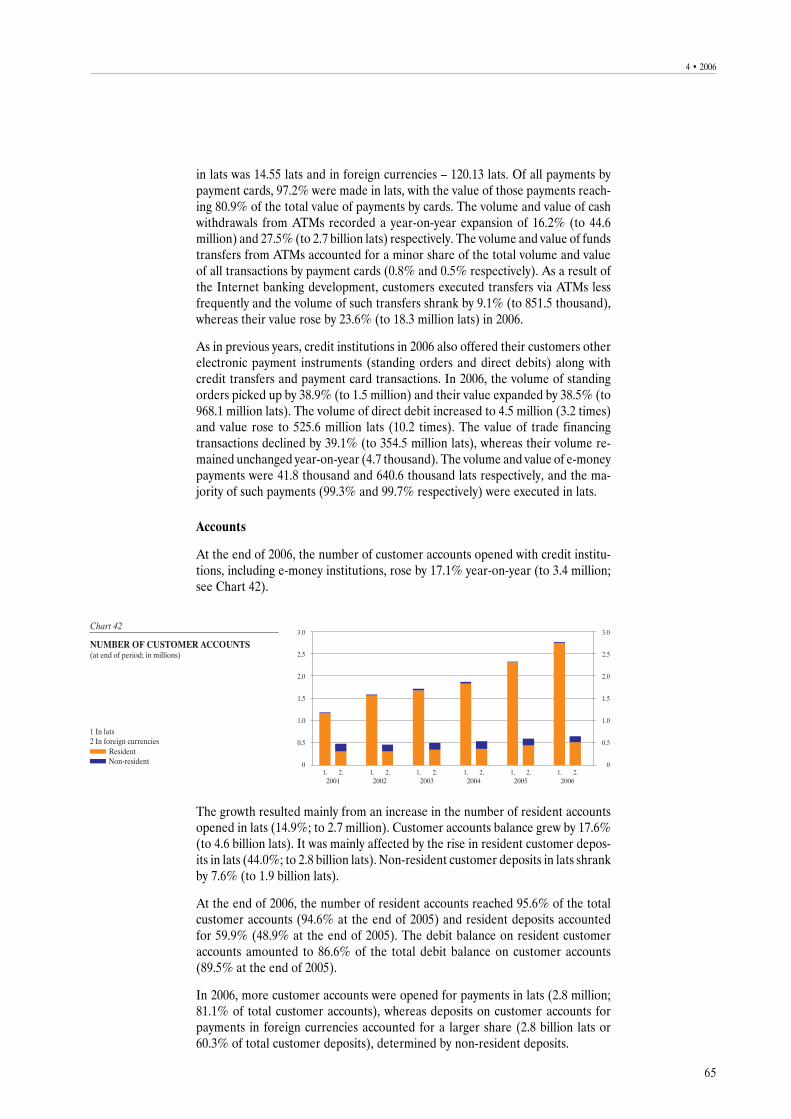
65
4 · 2006
in lats was 14.55 lats and in foreign currencies – 120.13 lats. Of all payments bypayment cards, 97.2% were made in lats, with the value of those payments reach-ing 80.9% of the total value of payments by cards. The volume and value of cashwithdrawals from ATMs recorded a year-on-year expansion of 16.2% (to 44.6million) and 27.5% (to 2.7 billion lats) respectively. The volume and value of fundstransfers from ATMs accounted for a minor share of the total volume and valueof all transactions by payment cards (0.8% and 0.5% respectively). As a result ofthe Internet banking development, customers executed transfers via ATMs lessfrequently and the volume of such transfers shrank by 9.1% (to 851.5 thousand),whereas their value rose by 23.6% (to 18.3 million lats) in 2006.
As in previous years, credit institutions in 2006 also offered their customers otherelectronic payment instruments (standing orders and direct debits) along withcredit transfers and payment card transactions. In 2006, the volume of standingorders picked up by 38.9% (to 1.5 million) and their value expanded by 38.5% (to968.1 million lats). The volume of direct debit increased to 4.5 million (3.2 times)and value rose to 525.6 million lats (10.2 times). The value of trade financingtransactions declined by 39.1% (to 354.5 million lats), whereas their volume re-mained unchanged year-on-year (4.7 thousand). The volume and value of e-moneypayments were 41.8 thousand and 640.6 thousand lats respectively, and the ma-jority of such payments (99.3% and 99.7% respectively) were executed in lats.
Accounts
At the end of 2006, the number of customer accounts opened with credit institu-tions, including e-money institutions, rose by 17.1% year-on-year (to 3.4 million;see Chart 42).
The growth resulted mainly from an increase in the number of resident accountsopened in lats (14.9%; to 2.7 million). Customer accounts balance grew by 17.6%(to 4.6 billion lats). It was mainly affected by the rise in resident customer depos-its in lats (44.0%; to 2.8 billion lats). Non-resident customer deposits in lats shrankby 7.6% (to 1.9 billion lats).
At the end of 2006, the number of resident accounts reached 95.6% of the totalcustomer accounts (94.6% at the end of 2005) and resident deposits accountedfor 59.9% (48.9% at the end of 2005). The debit balance on resident customeraccounts amounted to 86.6% of the total debit balance on customer accounts(89.5% at the end of 2005).
In 2006, more customer accounts were opened for payments in lats (2.8 million;81.1% of total customer accounts), whereas deposits on customer accounts forpayments in foreign currencies accounted for a larger share (2.8 billion lats or60.3% of total customer deposits), determined by non-resident deposits.
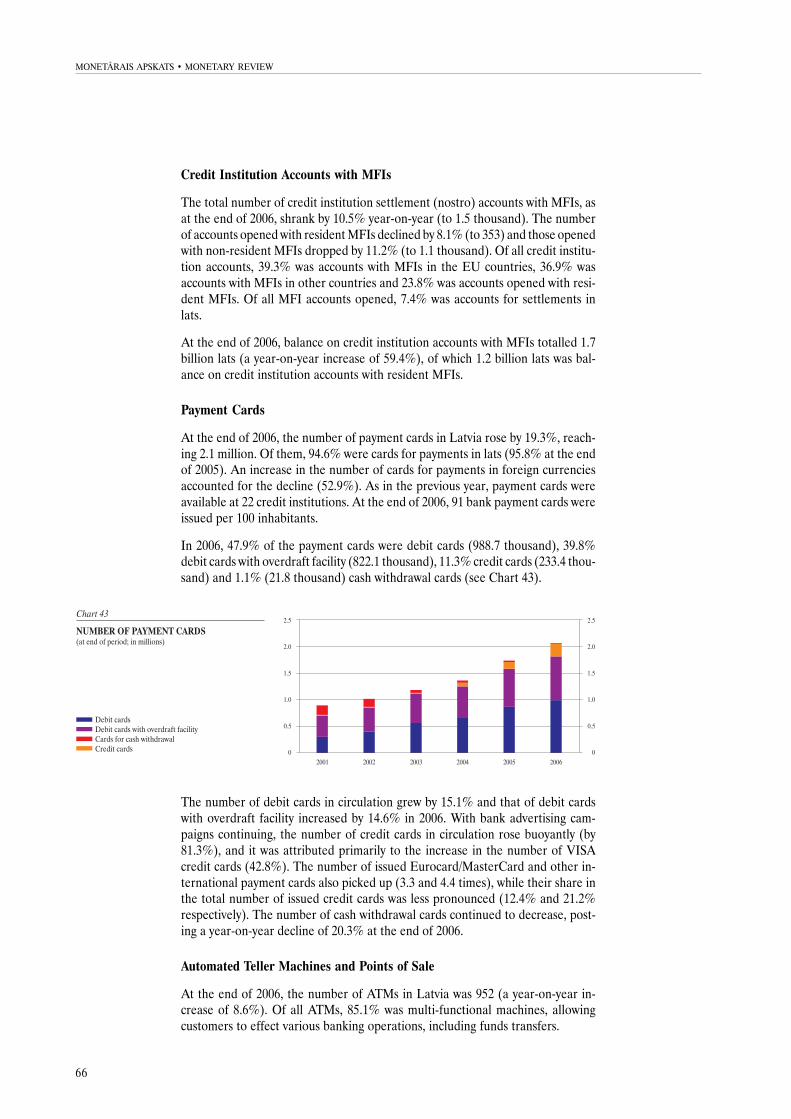
66
MONETÂRAIS APSKATS · MONETARY REVIEW
Credit Institution Accounts with MFIs
The total number of credit institution settlement (nostro) accounts with MFIs, asat the end of 2006, shrank by 10.5% year-on-year (to 1.5 thousand). The numberof accounts opened with resident MFIs declined by 8.1% (to 353) and those openedwith non-resident MFIs dropped by 11.2% (to 1.1 thousand). Of all credit institu-tion accounts, 39.3% was accounts with MFIs in the EU countries, 36.9% wasaccounts with MFIs in other countries and 23.8% was accounts opened with resi-dent MFIs. Of all MFI accounts opened, 7.4% was accounts for settlements inlats.
At the end of 2006, balance on credit institution accounts with MFIs totalled 1.7billion lats (a year-on-year increase of 59.4%), of which 1.2 billion lats was bal-ance on credit institution accounts with resident MFIs.
Payment Cards
At the end of 2006, the number of payment cards in Latvia rose by 19.3%, reach-ing 2.1 million. Of them, 94.6% were cards for payments in lats (95.8% at the endof 2005). An increase in the number of cards for payments in foreign currenciesaccounted for the decline (52.9%). As in the previous year, payment cards wereavailable at 22 credit institutions. At the end of 2006, 91 bank payment cards wereissued per 100 inhabitants.
In 2006, 47.9% of the payment cards were debit cards (988.7 thousand), 39.8%debit cards with overdraft facility (822.1 thousand), 11.3% credit cards (233.4 thou-sand) and 1.1% (21.8 thousand) cash withdrawal cards (see Chart 43).
The number of debit cards in circulation grew by 15.1% and that of debit cardswith overdraft facility increased by 14.6% in 2006. With bank advertising cam-paigns continuing, the number of credit cards in circulation rose buoyantly (by81.3%), and it was attributed primarily to the increase in the number of VISAcredit cards (42.8%). The number of issued Eurocard/MasterCard and other in-ternational payment cards also picked up (3.3 and 4.4 times), while their share inthe total number of issued credit cards was less pronounced (12.4% and 21.2%respectively). The number of cash withdrawal cards continued to decrease, post-ing a year-on-year decline of 20.3% at the end of 2006.
Automated Teller Machines and Points of Sale
At the end of 2006, the number of ATMs in Latvia was 952 (a year-on-year in-crease of 8.6%). Of all ATMs, 85.1% was multi-functional machines, allowingcustomers to effect various banking operations, including funds transfers.
67
4 · 2006
The number of POSs grew by 17.7% (to 16.2 thousand). Of them, 99.4% wereEFTPOSs (with an opportunity to effect payment card authorisation on-line).
At the end of 2006, four banks serviced their ATM networks and two banks theirPOS networks. Other banks used services of the limited liability company First
Data Latvia.
HIGHLIGHTS OF RESOLUTIONS AND REGULATIONS ADOPTED INPURSUIT OF THE BANK OF LATVIA'S MAIN TASKS (FOURTHQUARTER OF 2006)
16 November
The Council of the Bank of Latvia passed a resolution "On Interest Rates" (ineffect as of 17 November 2006), increasing the refinancing rate by 0.5 percentagepoint (to 5.0% per annum) as well as the interest rates on Lombard loans (to6.0% per annum, where the Lombard loan balance has been maintained for up to10 days in the last 30 days; to 7.0% per annum, where the Lombard loan balancehas been maintained for 11 to 20 days in the last 30 days, and to 8.0% per annum,where the Lombard loan balance has been maintained for 21 days and longer inthe last 30 days).
The Council of the Bank of Latvia approved the "Regulation for the Use of theBank of Latvia's Monetary Policy Instruments" (in effect as of 24 March 2007),consolidating the Bank of Latvia's regulations for particular monetary policy in-struments into one document and adjusting these instruments to the monetarypolicy instruments used by the Eurosystem.
The Council of the Bank of Latvia approved the "Regulation for the SecuritiesSettlement System of the Bank of Latvia" (in effect as of 24 March 2007).
The Council of the Bank of Latvia passed a resolution "On Amendments to the'Regulation for Calculating and Fulfilling the Minimum Reserve Requirement forBanks' " (in effect as of 24 March 2007).

STATISTISKÂ INFORMÂCIJASTATISTICS
69
70
TABULU SARAKSTS LIST OF TABLES 1. Monetārie rādītāji un procentu likmes
Monetary Indicators and Interest Rates 73
2.ab Reālā sektora rādītāji un cenas Real Sector Indicators and Prices 74
3. Latvijas Bankas naudas pārskats Monetary Base 76
4. Monetārie rādītāji un to sastāvdaļas Monetary Aggregates and Counterparts 77
5. Sezonāli izlīdzinātie naudas rādītāji Seasonally Adjusted Monetary Aggregates 78
6. Latvijas Bankas aktīvi un pasīvi The Bank of Latvia's Assets and Liabilities 79
7. MFI (izņemot Latvijas Banku) kopsavilkuma bilance Aggregated Balance Sheet of MFIs (excluding the Bank of Latvia) 80
8. MFI konsolidētā bilance Consolidated Balance Sheet of MFIs 81
9.ab MFI (izņemot Latvijas Banku) kopsavilkuma bilance Aggregated Balance Sheet of MFIs (excluding the Bank of Latvia) 82
10. Latvijas banku sistēmas naudas pārskats Monetary Survey 86
11.ab MFI (izņemot Latvijas Banku) ārzemju aktīvi un ārzemju pasīvi Foreign Assets and Liabilities of MFIs (excluding the Bank of Latvia) 87
12. MFI (izņemot Latvijas Banku) atsevišķu bilances ārzemju aktīvu un ārzemju pasīvu posteņu valstu dalījums Country Breakdown of MFI (excluding the Bank of Latvia) Selected Foreign Assets and Foreign Liabilities 88
13. Rezidentu finanšu iestāžu, nefinanšu sabiedrību un mājsaimniecību noguldījumi uz nakti un termiņnoguldījumi (latos un ārvalstu valūtā) Overnight and Time Deposits of Resident Financial Institutions, Non-Financial Corporations and Households (in lats and foreign currencies) 89
14.a Finanšu iestāžu noguldījumi (latos un ārvalstu valūtā) Deposits by Financial Institutions (in lats and foreign currencies) 90
14.b Nefinanšu sabiedrību noguldījumi (latos un ārvalstu valūtā) Deposits by Non-Financial Corporations (in lats and foreign currencies) 91
14.c Mājsaimniecību noguldījumi (latos un ārvalstu valūtā) Deposits by Households (in lats and foreign currencies) 92
14.d Valdības un nerezidentu noguldījumi (latos un ārvalstu valūtā) Deposits by Government and Non-Residents (in lats and foreign currencies) 92
15. Rezidentu finanšu iestādēm, nefinanšu sabiedrībām un mājsaimniecībām izsniegto kredītu termiņstruktūra (latos un ārvalstu valūtā) Maturity Profile of Loans to Resident Financial Institutions, Non-Financial Corporations and Households (in lats and foreign currencies) 93
16.a Finanšu iestādēm un nefinanšu sabiedrībām izsniegtie kredīti Loans to Financial Institutions and Non-Financial Corporations 93
16.b Mājsaimniecībām izsniegtie kredīti Loans to Households 94
16.c Valdībai un nerezidentiem izsniegtie kredīti Loans to Government and Non-Residents 95
17. Finanšu iestādēm un nefinanšu sabiedrībām izsniegto kredītu atlikumi tautsaimniecībā Loans to Financial Institutions and Non-Financial Corporations in the National Economy 96
71
18. Rezidentu finanšu iestādēm, nefinanšu sabiedrībām un mājsaimniecībām izsniegto kredītu veidi Lending to Resident Financial Institutions, Non-Financial Corporations and Households 97
19.a Neakciju vērtspapīru turējumi Holdings of Securities Other than Shares 98
19.b Akciju un citu kapitāla vērtspapīru turējumi Holdings of Shares and Other Equity 98
20.a Rezidentu noguldījumu valūtu dalījums Currency Breakdown of Resident Deposits 99
20.b Nerezidentu noguldījumu valūtu dalījums Currency Breakdown of Non-Resident Deposits 100
20.c Rezidentiem izsniegto kredītu valūtu dalījums Currency Breakdown of Loans to Residents 101
20.d Nerezidentiem izsniegto kredītu valūtu dalījums Currency Breakdown of Loans to Non-Residents 102
20.e Rezidentu neakciju vērtspapīru turējumu valūtu dalījums Currency Breakdown of Holdings of Resident Securities Other than Shares 103
20.f Nerezidentu neakciju vērtspapīru turējumu valūtu dalījums Currency Breakdown of Holdings of Non-Resident Securities Other than Shares 104
20.g MFI emitēto parāda vērtspapīru valūtu dalījums Currency Breakdown of Debt Securities Issued by MFIs 104
21.a Vidējās svērtās procentu likmes MFI darījumos ar rezidentu nefinanšu sabiedrībām un mājsaimniecībām latos Weighted Average Interest Rates Charged by MFIs in Transactions with Resident Non-Financial Corporations and Households in Lats 105
21.b Vidējās svērtās procentu likmes MFI darījumos ar rezidentu nefinanšu sabiedrībām un mājsaimniecībām eiro Weighted Average Interest Rates Charged by MFIs in Transactions with Resident Non-Financial Corporations and Households in Euros 110
21.c Vidējās svērtās procentu likmes MFI darījumos ar rezidentu nefinanšu sabiedrībām un mājsaimniecībām ASV dolāros Weighted Average Interest Rates Charged by MFIs in Transactions with Resident Non-Financial Corporations and Households in US Dollars 115
22. Starpbanku tirgos izsniegtie kredīti Lending in the Interbank Markets 120
23.a Kredītu procentu likmes iekšzemes starpbanku tirgū Interest Rates in the Domestic Interbank Market 121
23.b Latvijas Bankas noteiktās procentu likmes Interest Rates Set by the Bank of Latvia 121
23.c Latvijas Bankas organizētajās repo un īstermiņa valūtas mijmaiņas darījumu izsolēs noteiktās procentu likmes Interest Rates in Bank of Latvia Tenders of Repurchase Agreements and Short-Term Currency Swap Contracts 121
24. Galvenie ārvalstu valūtas pirkšanas un pārdošanas darījumi (veidu un dalībnieku dalījumā) Principal Foreign Exchange Transactions in the Banking Sector (by type and counterparty) 122
25. Ārvalstu valūtu pirkšana un pārdošana Foreign Exchange Transactions 122
26. Latvijas Bankas noteiktie ārvalstu valūtu kursi (vidēji mēnesī) Monthly Averages of the Exchange Rates Set by the Bank of Latvia 123
27. Vidējie svērtie ārvalstu valūtu (izņemot bezskaidrās naudas norēķinus) maiņas kursi Weighted Average Exchange Rates (excluding non-cash items) 123
28. Valsts iekšējā aizņēmuma vērtspapīru struktūra Structure of Government Securities 124
72
29. Valsts iekšējā aizņēmuma vērtspapīru sākotnējā tirgus izsoļu rezultāti Auctions of Government Securities in the Primary Market 124
30. Latvijas Bankas veiktie darījumi valsts iekšējā aizņēmuma vērtspapīru otrreizējā tirgū The Bank of Latvia's Transactions in the Secondary Market for Government Securities 125
31. Iekšzemes kopprodukta dinamika Dynamics of Gross Domestic Product 125
32. Strādājošo mēneša vidējās bruto darba samaksas un bezdarba līmeņa pārmaiņas Changes in the Average Monthly Gross Wages and Salaries and Unemployment 125
33. Latvijas ārējās tirdzniecības bilance Latvian Foreign Trade Balance 126
34. Svarīgākās preces Latvijas eksportā Main Export Goods of Latvia 126
35. Svarīgākās preces Latvijas importā Main Import Goods of Latvia 127
36. Partnervalstis Latvijas ārējā tirdzniecībā Latvian Foreign Trade Partners 128
37. Latvijas Bankas starpbanku maksājumu sistēmās apstrādātie maksājumi Payment Instructions Handled by the Bank of Latvia Interbank Funds Transfer Systems 129
38. Maksāšanas līdzekļu skaits Volume of Payment Instruments 130
39. Maksāšanas līdzekļu apjoms Value of Payment Instruments 131
40. Konti Accounts 132
41. Kredītiestāžu konti MFI Credit Institution Accounts with MFIs 133
42. Norēķinu karšu skaits Number of Payment Cards 134
43. Bankomātu un norēķinu karšu pieņemšanas vietu skaits Number of ATMs and POSs 134
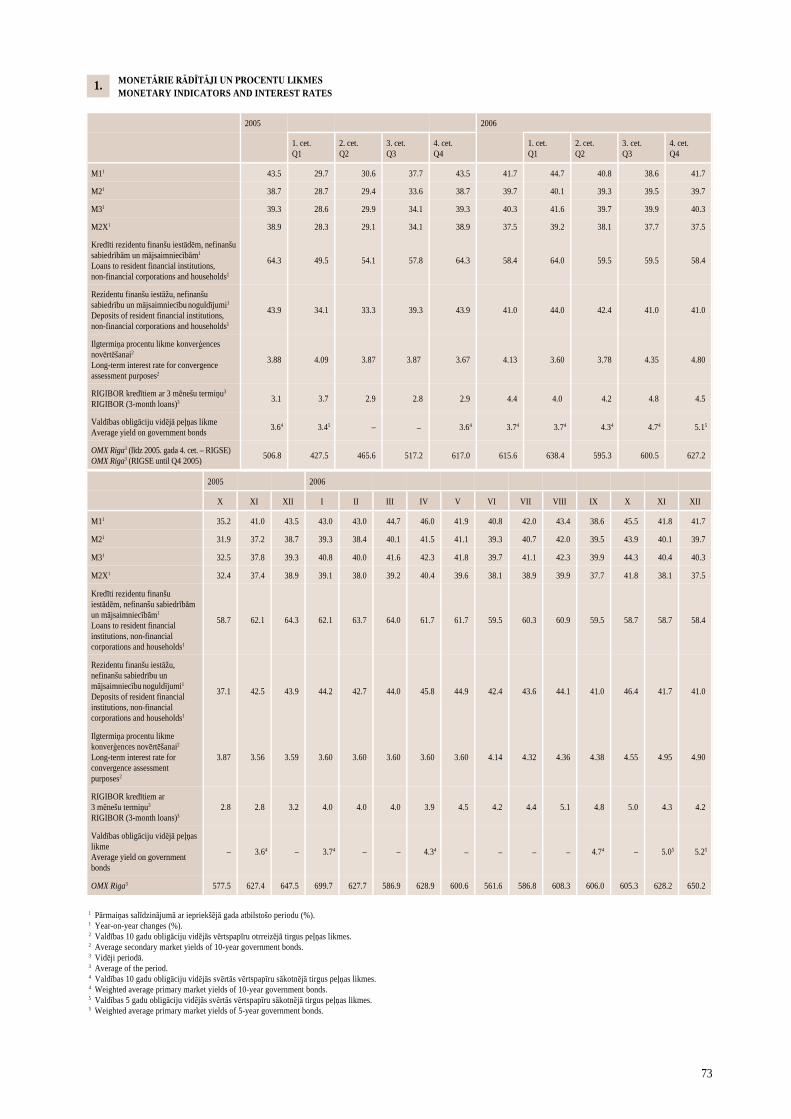
73
2005 2006
X XI XII I II III IV V VI VII VIII IX
M11 35.2 41.0 43.5 43.0 43.0 44.7 46.0 41.9 40.8 42.0 43.4 38.6
M21 31.9 37.2 38.7 39.3 38.4 40.1 41.5 41.1 39.3 40.7 42.0 39.5
M31 32.5 37.8 39.3 40.8 40.0 41.6 42.3 41.8 39.7 41.1 42.3 39.9
M2X1 32.4 37.4 38.9 39.1 38.0 39.2 40.4 39.6 38.1 38.9 39.9 37.7
Kredīti rezidentu finanšu iestādēm, nefinanšu sabiedrībām un mājsaimniecībām1 Loans to resident financial institutions, non-financial corporations and households1
58.7 62.1 64.3 62.1 63.7 64.0 61.7 61.7 59.5 60.3 60.9 59.5
Rezidentu finanšu iestāžu, nefinanšu sabiedrību un mājsaimniecību noguldījumi1 Deposits of resident financial institutions, non-financial corporations and households1
37.1 42.5 43.9 44.2 42.7 44.0 45.8 44.9 42.4 43.6 44.1 41.0
Ilgtermiņa procentu likme konverģences novērtēšanai2
Long-term interest rate for convergence assessment purposes2
3.87 3.56 3.59 3.60 3.60 3.60 3.60 3.60 4.14 4.32 4.36 4.38
RIGIBOR kredītiem ar 3 mēnešu termiņu3 RIGIBOR (3-month loans)3
2.8 2.8 3.2 4.0 4.0 4.0 3.9 4.5 4.2 4.4 5.1 4.8
Valdības obligāciju vidējā peļņas likme Average yield on government bonds
– 3.64 – 3.74 – – 4.34 – – – – 4.74
OMX Riga3 577.5 627.4 647.5 699.7 627.7 586.9 628.9 600.6 561.6 586.8 608.3 606.0
1 Pārmaiņas salīdzinājumā ar iepriekšējā gada atbilstošo periodu (%). 1 Year-on-year changes (%). 2 Valdības 10 gadu obligāciju vidējās vērtspapīru otrreizējā tirgus peļņas likmes. 2 Average secondary market yields of 10-year government bonds. 3 Vidēji periodā. 3 Average of the period. 4 Valdības 10 gadu obligāciju vidējās svērtās vērtspapīru sākotnējā tirgus peļņas likmes. 4 Weighted average primary market yields of 10-year government bonds. 5 Valdības 5 gadu obligāciju vidējās svērtās vērtspapīru sākotnējā tirgus peļņas likmes. 5 Weighted average primary market yields of 5-year government bonds.
X XI XII
45.5 41.8 41.7
43.9 40.1 39.7
44.3 40.4 40.3
41.8 38.1 37.5
58.7 58.7 58.4
46.4 41.7 41.0
4.55 4.95 4.90
5.0 4.3 4.2
– 5.05 5.25
605.3 628.2 650.2
MONETĀRIE RĀDĪTĀJI UN PROCENTU LIKMES MONETARY INDICATORS AND INTEREST RATES
2005
1. cet. Q1
2. cet. Q2
3. cet. Q3
4. cet. Q4
1. cet. Q1
2. cet. Q2
M11 43.5 29.7 30.6 37.7 43.5 44.7 40.8
M21 38.7 28.7 29.4 33.6 38.7 40.1 39.3
M31 39.3 28.6 29.9 34.1 39.3 41.6 39.7
M2X1 38.9 28.3 29.1 34.1 38.9 39.2 38.1
Kredīti rezidentu finanšu iestādēm, nefinanšu sabiedrībām un mājsaimniecībām1 Loans to resident financial institutions, non-financial corporations and households1
64.3 49.5 54.1 57.8 64.3 64.0 59.5
Rezidentu finanšu iestāžu, nefinanšu sabiedrību un mājsaimniecību noguldījumi1 Deposits of resident financial institutions, non-financial corporations and households1
43.9 34.1 33.3 39.3 43.9 44.0 42.4
Ilgtermiņa procentu likme konverģences novērtēšanai2 Long-term interest rate for convergence assessment purposes2
3.88 4.09 3.87 3.87 3.67 3.60 3.78
RIGIBOR kredītiem ar 3 mēnešu termiņu3 RIGIBOR (3-month loans)3 3.1 3.7 2.9 2.8 2.9 4.0 4.2
Valdības obligāciju vidējā peļņas likme Average yield on government bonds 3.64 3.45 – – 3.64 3.74 4.34
OMX Riga3 (līdz 2005. gada 4. cet. – RIGSE)
OMX Riga3 (RIGSE until Q4 2005) 506.8 427.5 465.6 517.2 617.0 638.4 595.3
2006
3. cet. Q3
38.6
39.5
39.9
37.7
59.5
41.0
4.35
4.8
4.74
600.5
4. cet. Q4
41.7
39.7
40.3
37.5
58.4
41.0
4.80
4.5
5.15
627.2
41.7
39.7
40.3
37.5
58.4
41.0
4.13
4.4
3.74
615.6
1.
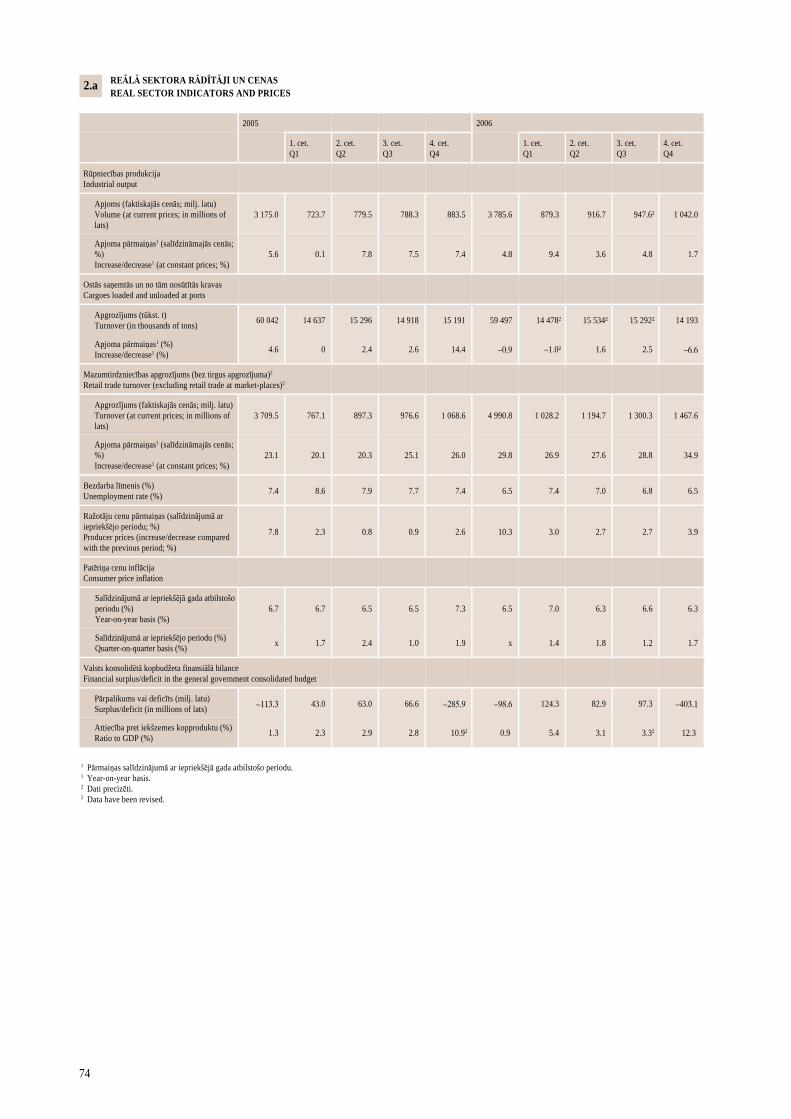
74
REĀLĀ SEKTORA RĀDĪTĀJI UN CENAS REAL SECTOR INDICATORS AND PRICES
2005 2006
1. cet. Q1
2. cet. Q2
3. cet. Q3
4. cet. Q4
1. cet. Q1
2. cet. Q2
3. cet. Q3
4. cet. Q4
Rūpniecības produkcija Industrial output
Apjoms (faktiskajās cenās; milj. latu) Volume (at current prices; in millions of lats)
3 175.0 723.7 779.5 788.3 883.5 3 785.6 879.3 916.7 947.6² 1 042.0
Apjoma pārmaiņas1 (salīdzināmajās cenās; %) Increase/decrease1 (at constant prices; %)
5.6 0.1 7.8 7.5 7.4 4.8 9.4 3.6 4.8 1.7
Ostās saņemtās un no tām nosūtītās kravas Cargoes loaded and unloaded at ports
Apgrozījums (tūkst. t) Turnover (in thousands of tons)
60 042 14 637 15 296 14 918 15 191 59 497 14 478² 15 534² 15 292² 14 193
Apjoma pārmaiņas1 (%) Increase/decrease1 (%)
4.6 0 2.4 2.6 14.4 –0.9 –1.0² 1.6 2.5 –6.6
Apgrozījums (faktiskajās cenās; milj. latu) Turnover (at current prices; in millions of lats)
3 709.5 767.1 897.3 976.6 1 068.6 4 990.8 1 028.2 1 194.7 1 300.3 1 467.6
Apjoma pārmaiņas1 (salīdzināmajās cenās; %) Increase/decrease1 (at constant prices; %)
23.1 20.1 20.3 25.1 26.0 29.8 26.9 27.6 28.8 34.9
Bezdarba līmenis (%) Unemployment rate (%)
7.4 8.6 7.9 7.7 7.4 6.5 7.4 7.0 6.8 6.5
Ražotāju cenu pārmaiņas (salīdzinājumā ar iepriekšējo periodu; %) Producer prices (increase/decrease compared with the previous period; %)
7.8 2.3 0.8 0.9 2.6 10.3 3.0 2.7 2.7 3.9
Patēriņa cenu inflācija Consumer price inflation
Salīdzinājumā ar iepriekšējā gada atbilstošo periodu (%) Year-on-year basis (%)
6.7 6.7 6.5 6.5 7.3 6.5 7.0 6.3 6.6 6.3
Salīdzinājumā ar iepriekšējo periodu (%) Quarter-on-quarter basis (%)
x 1.7 2.4 1.0 1.9 x 1.4 1.8 1.2 1.7
Valsts konsolidētā kopbudžeta finansiālā bilance Financial surplus/deficit in the general government consolidated budget
Pārpalikums vai deficīts (milj. latu) Surplus/deficit (in millions of lats) –113.3 43.0 63.0 66.6 –285.9 –98.6 124.3 82.9 97.3 –403.1
Attiecība pret iekšzemes kopproduktu (%) Ratio to GDP (%)
1.3 2.3 2.9 2.8 10.92 0.9 5.4 3.1 3.32 12.3
1 Pārmaiņas salīdzinājumā ar iepriekšējā gada atbilstošo periodu. 1 Year-on-year basis. 2 Dati precizēti. 2 Data have been revised.
Mazumtirdzniecības apgrozījums (bez tirgus apgrozījuma)2 Retail trade turnover (excluding retail trade at market-places)2
2.a
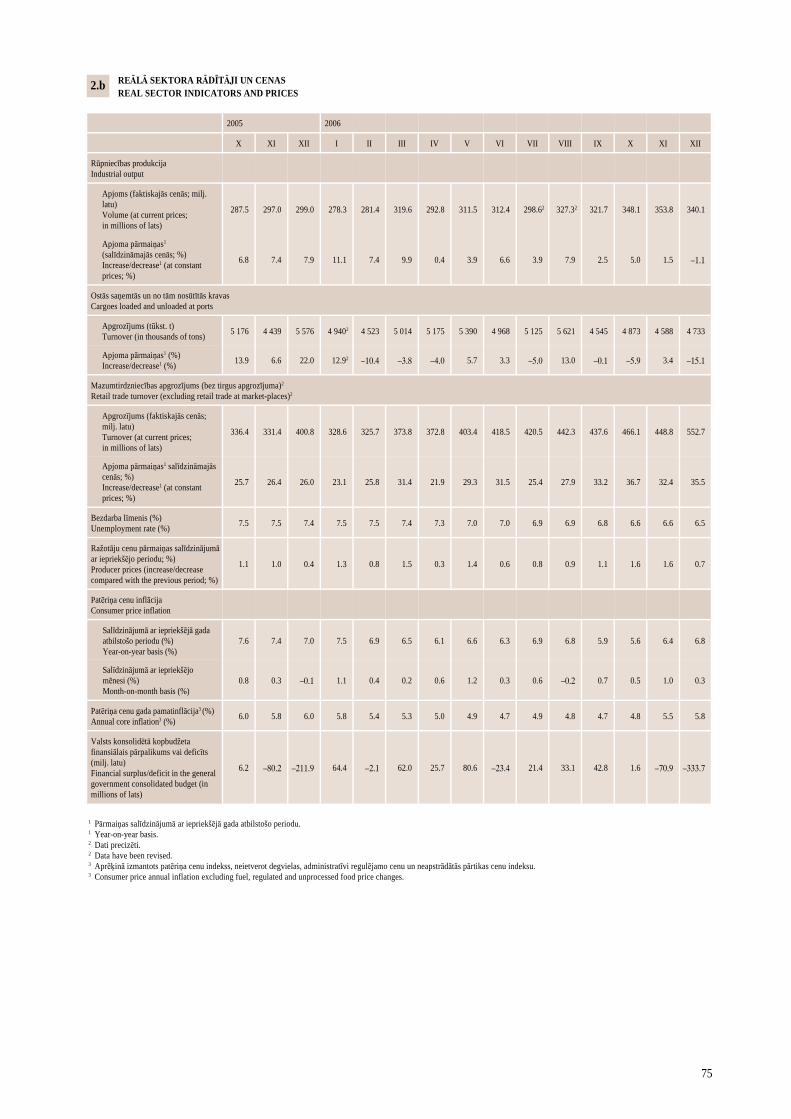
75
REĀLĀ SEKTORA RĀDĪTĀJI UN CENAS REAL SECTOR INDICATORS AND PRICES
2005 2006
X XI XII I II III IV V VI VII VIII IX
Rūpniecības produkcija Industrial output
Apjoms (faktiskajās cenās; milj. latu) Volume (at current prices; in millions of lats)
287.5 297.0 299.0 278.3 281.4 319.6 292.8 311.5 312.4 298.62 327.32 321.7
Apjoma pārmaiņas1 (salīdzināmajās cenās; %) Increase/decrease1 (at constant prices; %)
6.8 7.4 7.9 11.1 7.4 9.9 0.4 3.9 6.6 3.9 7.9 2.5
Ostās saņemtās un no tām nosūtītās kravas Cargoes loaded and unloaded at ports
Apgrozījums (tūkst. t) Turnover (in thousands of tons)
5 176 4 439 5 576 4 9402 4 523 5 014 5 175 5 390 4 968 5 125 5 621 4 545
Apjoma pārmaiņas1 (%) Increase/decrease1 (%)
13.9 6.6 22.0 12.92 –10.4 –3.8 –4.0 5.7 3.3 –5.0 13.0 –0.1
Mazumtirdzniecības apgrozījums (bez tirgus apgrozījuma)2 Retail trade turnover (excluding retail trade at market-places)2
Apgrozījums (faktiskajās cenās; milj. latu) Turnover (at current prices; in millions of lats)
336.4 331.4 400.8 328.6 325.7 373.8 372.8 403.4 418.5 420.5 442.3 437.6
Apjoma pārmaiņas1 salīdzināmajās cenās; %) Increase/decrease1 (at constant prices; %)
25.7 26.4 26.0 23.1 25.8 31.4 21.9 29.3 31.5 25.4 27.9 33.2
Bezdarba līmenis (%) Unemployment rate (%)
7.5 7.5 7.4 7.5 7.5 7.4 7.3 7.0 7.0 6.9 6.9 6.8
Ražotāju cenu pārmaiņas salīdzinājumā ar iepriekšējo periodu; %) Producer prices (increase/decrease compared with the previous period; %)
1.1 1.0 0.4 1.3 0.8 1.5 0.3 1.4 0.6 0.8 0.9 1.1
Patēriņa cenu inflācija Consumer price inflation
Salīdzinājumā ar iepriekšējā gada atbilstošo periodu (%) Year-on-year basis (%)
7.6 7.4 7.0 7.5 6.9 6.5 6.1 6.6 6.3 6.9 6.8 5.9
Salīdzinājumā ar iepriekšējo mēnesi (%) Month-on-month basis (%)
0.8 0.3 –0.1 1.1 0.4 0.2 0.6 1.2 0.3 0.6 –0.2 0.7
Patēriņa cenu gada pamatinflācija3 (%) Annual core inflation3 (%)
6.0 5.8 6.0 5.8 5.4 5.3 5.0 4.9 4.7 4.9 4.8 4.7
Valsts konsolidētā kopbudžeta finansiālais pārpalikums vai deficīts (milj. latu) Financial surplus/deficit in the general government consolidated budget (in millions of lats)
6.2 –80.2 –211.9 64.4 –2.1 62.0 25.7 80.6 –23.4 21.4 33.1 42.8
1 Pārmaiņas salīdzinājumā ar iepriekšējā gada atbilstošo periodu. 1 Year-on-year basis. 2 Dati precizēti. 2 Data have been revised. 3 Aprēķinā izmantots patēriņa cenu indekss, neietverot degvielas, administratīvi regulējamo cenu un neapstrādātās pārtikas cenu indeksu. 3 Consumer price annual inflation excluding fuel, regulated and unprocessed food price changes.
X XI XII
348.1 353.8 340.1
5.0 1.5 –1.1
4 873 4 588 4 733
–5.9 3.4 –15.1
466.1 448.8 552.7
36.7 32.4 35.5
6.6 6.6 6.5
1.6 1.6 0.7
5.6 6.4 6.8
0.5 1.0 0.3
4.8 5.5 5.8
1.6 –70.9 –333.7
2.b
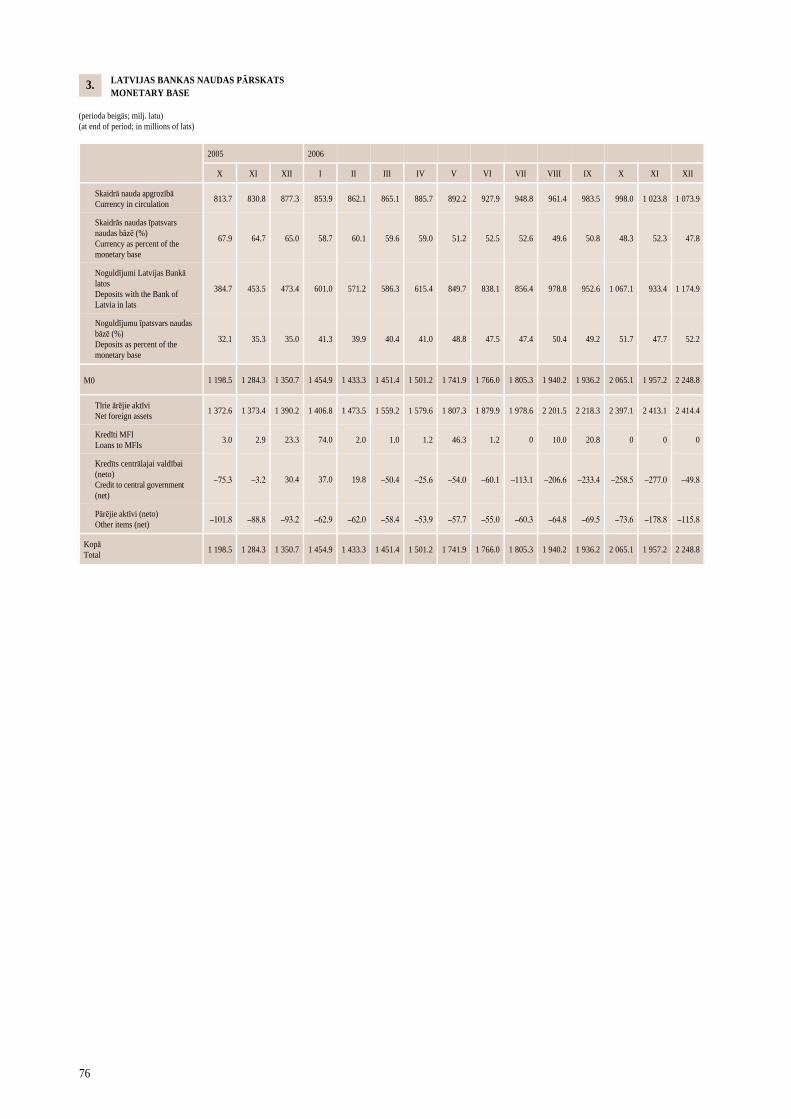
76
LATVIJAS BANKAS NAUDAS PĀRSKATS MONETARY BASE (perioda beigās; milj. latu) (at end of period; in millions of lats)
2005 2006
X XI XII I II III IV V VI VII VIII IX
Skaidrā nauda apgrozībā
Currency in circulation 813.7 830.8 877.3 853.9 862.1 865.1 885.7 892.2 927.9 948.8 961.4 983.5
Skaidrās naudas īpatsvars naudas bāzē (%) Currency as percent of the monetary base
67.9 64.7 65.0 58.7 60.1 59.6 59.0 51.2 52.5 52.6 49.6 50.8
Noguldījumi Latvijas Bankā latos Deposits with the Bank of Latvia in lats
384.7 453.5 473.4 601.0 571.2 586.3 615.4 849.7 838.1 856.4 978.8 952.6
Noguldījumu īpatsvars naudas bāzē (%) Deposits as percent of the monetary base
32.1 35.3 35.0 41.3 39.9 40.4 41.0 48.8 47.5 47.4 50.4 49.2
M0 1 198.5 1 284.3 1 350.7 1 454.9 1 433.3 1 451.4 1 501.2 1 741.9 1 766.0 1 805.3 1 940.2 1 936.2
Tīrie ārējie aktīvi Net foreign assets
1 372.6 1 373.4 1 390.2 1 406.8 1 473.5 1 559.2 1 579.6 1 807.3 1 879.9 1 978.6 2 201.5 2 218.3
Kredīti MFI Loans to MFIs
3.0 2.9 23.3 74.0 2.0 1.0 1.2 46.3 1.2 0 10.0 20.8
Kredīts centrālajai valdībai (neto) Credit to central government (net)
–75.3 –3.2 30.4 37.0 19.8 –50.4 –25.6 –54.0 –60.1 –113.1 –206.6 –233.4
Pārējie aktīvi (neto) Other items (net) –101.8 –88.8 –93.2 –62.9 –62.0 –58.4 –53.9 –57.7 –55.0 –60.3 –64.8 –69.5
Kopā Total
1 198.5 1 284.3 1 350.7 1 454.9 1 433.3 1 451.4 1 501.2 1 741.9 1 766.0 1 805.3 1 940.2 1 936.2
X XI XII
998.0 1 023.8 1 073.9
48.3 52.3 47.8
1 067.1 933.4 1 174.9
51.7 47.7 52.2
2 065.1 1 957.2 2 248.8
2 397.1 2 413.1 2 414.4
0 0 0
–258.5 –277.0 –49.8
–73.6 –178.8 –115.8
2 065.1 1 957.2 2 248.8
3.
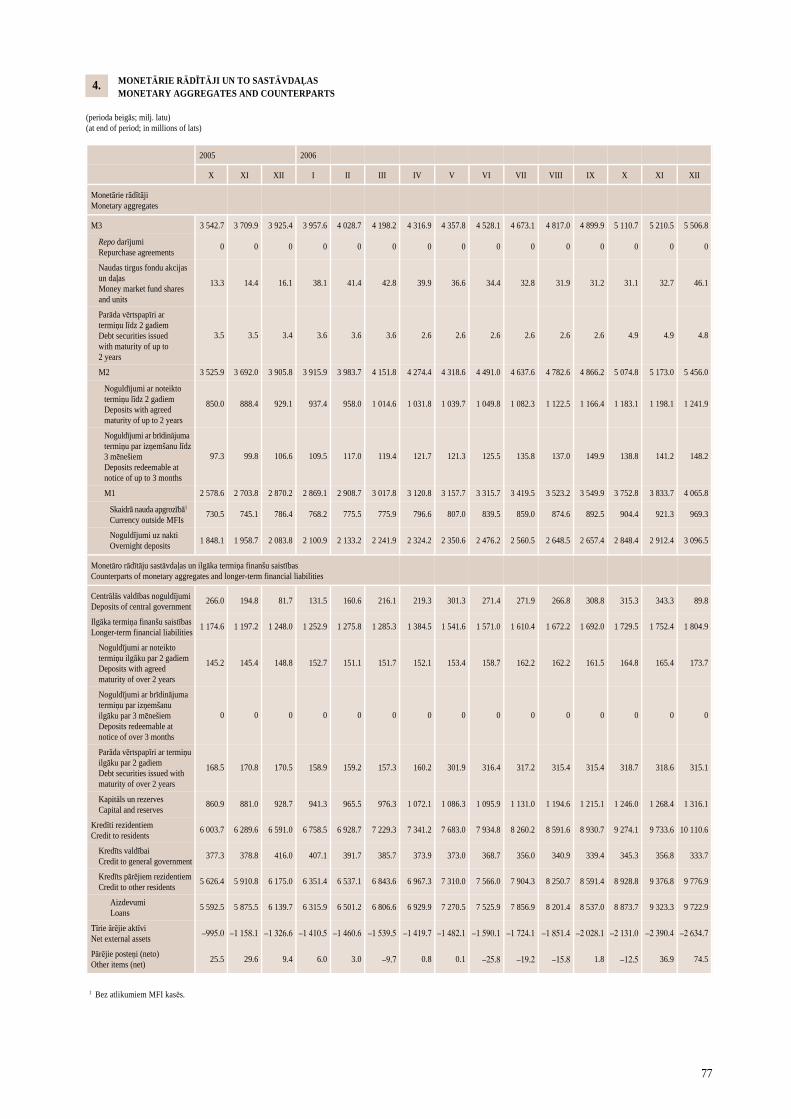
77
MONETĀRIE RĀDĪTĀJI UN TO SASTĀVDAĻAS MONETARY AGGREGATES AND COUNTERPARTS (perioda beigās; milj. latu) (at end of period; in millions of lats)
2005 2006
X XI XII I II III IV V VI VII VIII IX
Monetārie rādītāji Monetary aggregates
M3 3 542.7 3 709.9 3 925.4 3 957.6 4 028.7 4 198.2 4 316.9 4 357.8 4 528.1 4 673.1 4 817.0 4 899.9
Repo darījumi Repurchase agreements
0 0 0 0 0 0 0 0 0 0 0 0
Naudas tirgus fondu akcijas un daļas Money market fund shares and units
13.3 14.4 16.1 38.1 41.4 42.8 39.9 36.6 34.4 32.8 31.9 31.2
Parāda vērtspapīri ar termiņu līdz 2 gadiem Debt securities issued with maturity of up to 2 years
3.5 3.5 3.4 3.6 3.6 3.6 2.6 2.6 2.6 2.6 2.6 2.6
M2 3 525.9 3 692.0 3 905.8 3 915.9 3 983.7 4 151.8 4 274.4 4 318.6 4 491.0 4 637.6 4 782.6 4 866.2
Noguldījumi ar noteikto termiņu līdz 2 gadiem Deposits with agreed maturity of up to 2 years
850.0 888.4 929.1 937.4 958.0 1 014.6 1 031.8 1 039.7 1 049.8 1 082.3 1 122.5 1 166.4
Noguldījumi ar brīdinājuma termiņu par izņemšanu līdz 3 mēnešiem Deposits redeemable at notice of up to 3 months
97.3 99.8 106.6 109.5 117.0 119.4 121.7 121.3 125.5 135.8 137.0 149.9
M1 2 578.6 2 703.8 2 870.2 2 869.1 2 908.7 3 017.8 3 120.8 3 157.7 3 315.7 3 419.5 3 523.2 3 549.9
Skaidrā nauda apgrozībā1 Currency outside MFIs 730.5 745.1 786.4 768.2 775.5 775.9 796.6 807.0 839.5 859.0 874.6 892.5
Noguldījumi uz nakti Overnight deposits
1 848.1 1 958.7 2 083.8 2 100.9 2 133.2 2 241.9 2 324.2 2 350.6 2 476.2 2 560.5 2 648.5 2 657.4
Monetāro rādītāju sastāvdaļas un ilgāka termiņa finanšu saistības Counterparts of monetary aggregates and longer-term financial liabilities
Centrālās valdības noguldījumi Deposits of central government
266.0 194.8 81.7 131.5 160.6 216.1 219.3 301.3 271.4 271.9 266.8 308.8
Ilgāka termiņa finanšu saistības Longer-term financial liabilities
1 174.6 1 197.2 1 248.0 1 252.9 1 275.8 1 285.3 1 384.5 1 541.6 1 571.0 1 610.4 1 672.2 1 692.0
Noguldījumi ar noteikto termiņu ilgāku par 2 gadiem Deposits with agreed maturity of over 2 years
145.2 145.4 148.8 152.7 151.1 151.7 152.1 153.4 158.7 162.2 162.2 161.5
Noguldījumi ar brīdinājuma termiņu par izņemšanu ilgāku par 3 mēnešiem Deposits redeemable at notice of over 3 months
0 0 0 0 0 0 0 0 0 0 0 0
Parāda vērtspapīri ar termiņu ilgāku par 2 gadiem Debt securities issued with maturity of over 2 years
168.5 170.8 170.5 158.9 159.2 157.3 160.2 301.9 316.4 317.2 315.4 315.4
Kapitāls un rezerves Capital and reserves
860.9 881.0 928.7 941.3 965.5 976.3 1 072.1 1 086.3 1 095.9 1 131.0 1 194.6 1 215.1
Kredīti rezidentiem Credit to residents
6 003.7 6 289.6 6 591.0 6 758.5 6 928.7 7 229.3 7 341.2 7 683.0 7 934.8 8 260.2 8 591.6 8 930.7
Kredīts valdībai Credit to general government
377.3 378.8 416.0 407.1 391.7 385.7 373.9 373.0 368.7 356.0 340.9 339.4
Kredīts pārējiem rezidentiem Credit to other residents
5 626.4 5 910.8 6 175.0 6 351.4 6 537.1 6 843.6 6 967.3 7 310.0 7 566.0 7 904.3 8 250.7 8 591.4
Aizdevumi Loans
5 592.5 5 875.5 6 139.7 6 315.9 6 501.2 6 806.6 6 929.9 7 270.5 7 525.9 7 856.9 8 201.4 8 537.0
Tīrie ārējie aktīvi Net external assets
–995.0 –1 158.1 –1 326.6 –1 410.5 –1 460.6 –1 539.5 –1 419.7 –1 482.1 –1 590.1 –1 724.1 –1 851.4 –2 028.1
Pārējie posteņi (neto) Other items (net)
25.5 29.6 9.4 6.0 3.0 –9.7 0.8 0.1 –25.8 –19.2 –15.8 1.8
1 Bez atlikumiem MFI kasēs.
X XI XII
5 110.7 5 210.5 5 506.8
0 0 0
31.1 32.7 46.1
4.9 4.9 4.8
5 074.8 5 173.0 5 456.0
1 183.1 1 198.1 1 241.9
138.8 141.2 148.2
3 752.8 3 833.7 4 065.8
904.4 921.3 969.3
2 848.4 2 912.4 3 096.5
315.3 343.3 89.8
1 729.5 1 752.4 1 804.9
164.8 165.4 173.7
0 0 0
318.7 318.6 315.1
1 246.0 1 268.4 1 316.1
9 274.1 9 733.6 10 110.6
345.3 356.8 333.7
8 928.8 9 376.8 9 776.9
8 873.7 9 323.3 9 722.9
–2 131.0 –2 390.4 –2 634.7
–12.5 36.9 74.5
4.
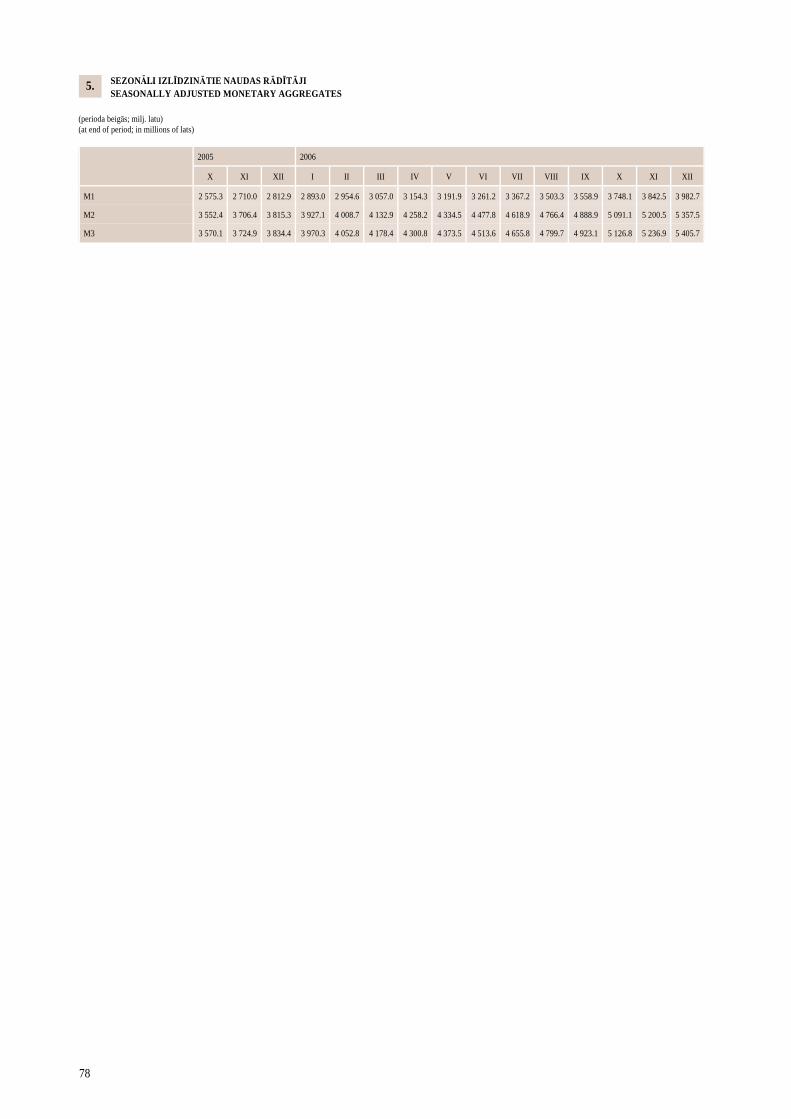
78
SEZONĀLI IZLĪDZINĀTIE NAUDAS RĀDĪTĀJI SEASONALLY ADJUSTED MONETARY AGGREGATES (perioda beigās; milj. latu) (at end of period; in millions of lats)
2005 2006
X XI XII I II III IV V VI VII VIII IX
M1 2 575.3 2 710.0 2 812.9 2 893.0 2 954.6 3 057.0 3 154.3 3 191.9 3 261.2 3 367.2 3 503.3 3 558.9
M2 3 552.4 3 706.4 3 815.3 3 927.1 4 008.7 4 132.9 4 258.2 4 334.5 4 477.8 4 618.9 4 766.4 4 888.9
M3 3 570.1 3 724.9 3 834.4 3 970.3 4 052.8 4 178.4 4 300.8 4 373.5 4 513.6 4 655.8 4 799.7 4 923.1
X XI XII
3 748.1 3 842.5 3 982.7
5 091.1 5 200.5 5 357.5
5 126.8 5 236.9 5 405.7
5.
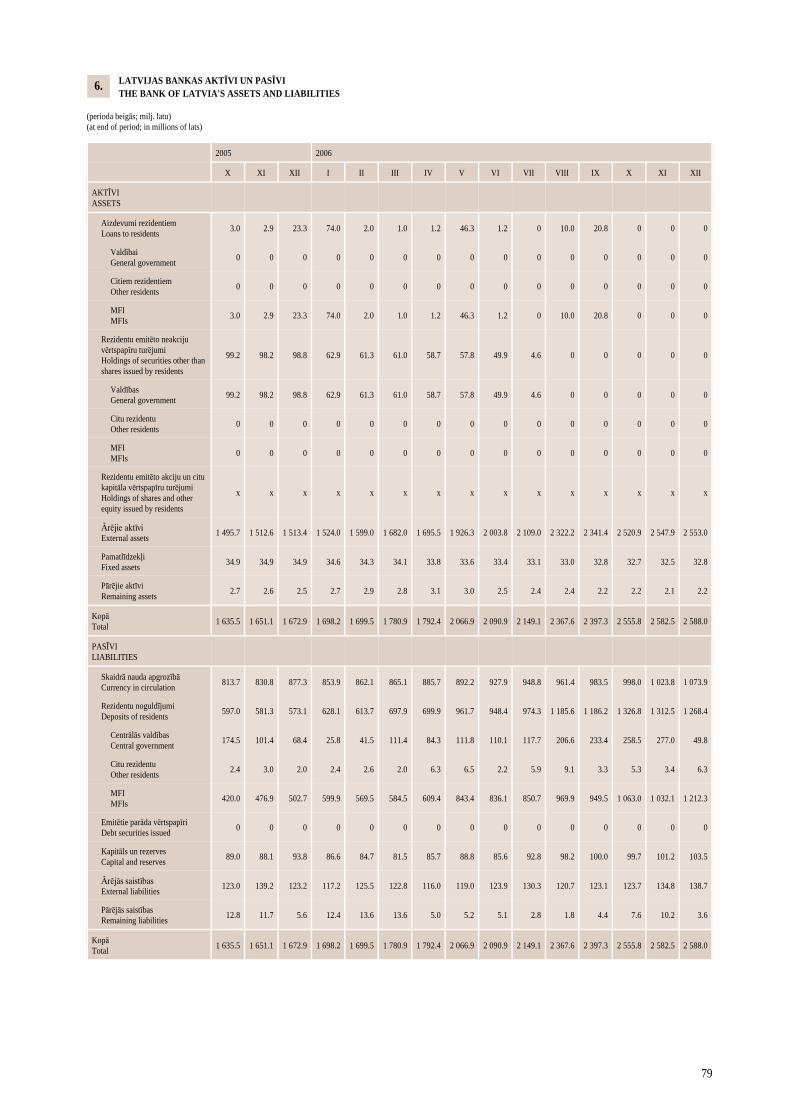
79
LATVIJAS BANKAS AKTĪVI UN PASĪVI THE BANK OF LATVIA'S ASSETS AND LIABILITIES (perioda beigās; milj. latu) (at end of period; in millions of lats)
2005 2006
X XI XII I II III IV V VI VII VIII IX
AKTĪVI ASSETS
Aizdevumi rezidentiem Loans to residents
3.0 2.9 23.3 74.0 2.0 1.0 1.2 46.3 1.2 0 10.0 20.8
Valdībai General government
0 0 0 0 0 0 0 0 0 0 0 0
Citiem rezidentiem Other residents
0 0 0 0 0 0 0 0 0 0 0 0
MFI MFIs
3.0 2.9 23.3 74.0 2.0 1.0 1.2 46.3 1.2 0 10.0 20.8
Rezidentu emitēto neakciju vērtspapīru turējumi Holdings of securities other than shares issued by residents
99.2 98.2 98.8 62.9 61.3 61.0 58.7 57.8 49.9 4.6 0 0
Valdības General government
99.2 98.2 98.8 62.9 61.3 61.0 58.7 57.8 49.9 4.6 0 0
Citu rezidentu Other residents
0 0 0 0 0 0 0 0 0 0 0 0
MFI MFIs
0 0 0 0 0 0 0 0 0 0 0 0
Rezidentu emitēto akciju un citu kapitāla vērtspapīru turējumi Holdings of shares and other equity issued by residents
x x x x x x x x x x x x
Ārējie aktīvi External assets
1 495.7 1 512.6 1 513.4 1 524.0 1 599.0 1 682.0 1 695.5 1 926.3 2 003.8 2 109.0 2 322.2 2 341.4
Pamatlīdzekļi Fixed assets
34.9 34.9 34.9 34.6 34.3 34.1 33.8 33.6 33.4 33.1 33.0 32.8
Pārējie aktīvi Remaining assets
2.7 2.6 2.5 2.7 2.9 2.8 3.1 3.0 2.5 2.4 2.4 2.2
Kopā Total
1 635.5 1 651.1 1 672.9 1 698.2 1 699.5 1 780.9 1 792.4 2 066.9 2 090.9 2 149.1 2 367.6 2 397.3
PASĪVI LIABILITIES
Skaidrā nauda apgrozībā Currency in circulation
813.7 830.8 877.3 853.9 862.1 865.1 885.7 892.2 927.9 948.8 961.4 983.5
Rezidentu noguldījumi Deposits of residents
597.0 581.3 573.1 628.1 613.7 697.9 699.9 961.7 948.4 974.3 1 185.6 1 186.2
Centrālās valdības Central government
174.5 101.4 68.4 25.8 41.5 111.4 84.3 111.8 110.1 117.7 206.6 233.4
Citu rezidentu Other residents
2.4 3.0 2.0 2.4 2.6 2.0 6.3 6.5 2.2 5.9 9.1 3.3
MFI MFIs
420.0 476.9 502.7 599.9 569.5 584.5 609.4 843.4 836.1 850.7 969.9 949.5
Emitētie parāda vērtspapīri Debt securities issued
0 0 0 0 0 0 0 0 0 0 0 0
Kapitāls un rezerves Capital and reserves
89.0 88.1 93.8 86.6 84.7 81.5 85.7 88.8 85.6 92.8 98.2 100.0
Ārējās saistības External liabilities
123.0 139.2 123.2 117.2 125.5 122.8 116.0 119.0 123.9 130.3 120.7 123.1
Pārējās saistības Remaining liabilities
12.8 11.7 5.6 12.4 13.6 13.6 5.0 5.2 5.1 2.8 1.8 4.4
Kopā Total
1 635.5 1 651.1 1 672.9 1 698.2 1 699.5 1 780.9 1 792.4 2 066.9 2 090.9 2 149.1 2 367.6 2 397.3
X XI XII
0 0 0
0 0 0
0 0 0
0 0 0
0 0 0
0 0 0
0 0 0
0 0 0
x x x
2 520.9 2 547.9 2 553.0
32.7 32.5 32.8
2.2 2.1 2.2
2 555.8 2 582.5 2 588.0
998.0 1 023.8 1 073.9
1 326.8 1 312.5 1 268.4
258.5 277.0 49.8
5.3 3.4 6.3
1 063.0 1 032.1 1 212.3
0 0 0
99.7 101.2 103.5
123.7 134.8 138.7
7.6 10.2 3.6
2 555.8 2 582.5 2 588.0
6.
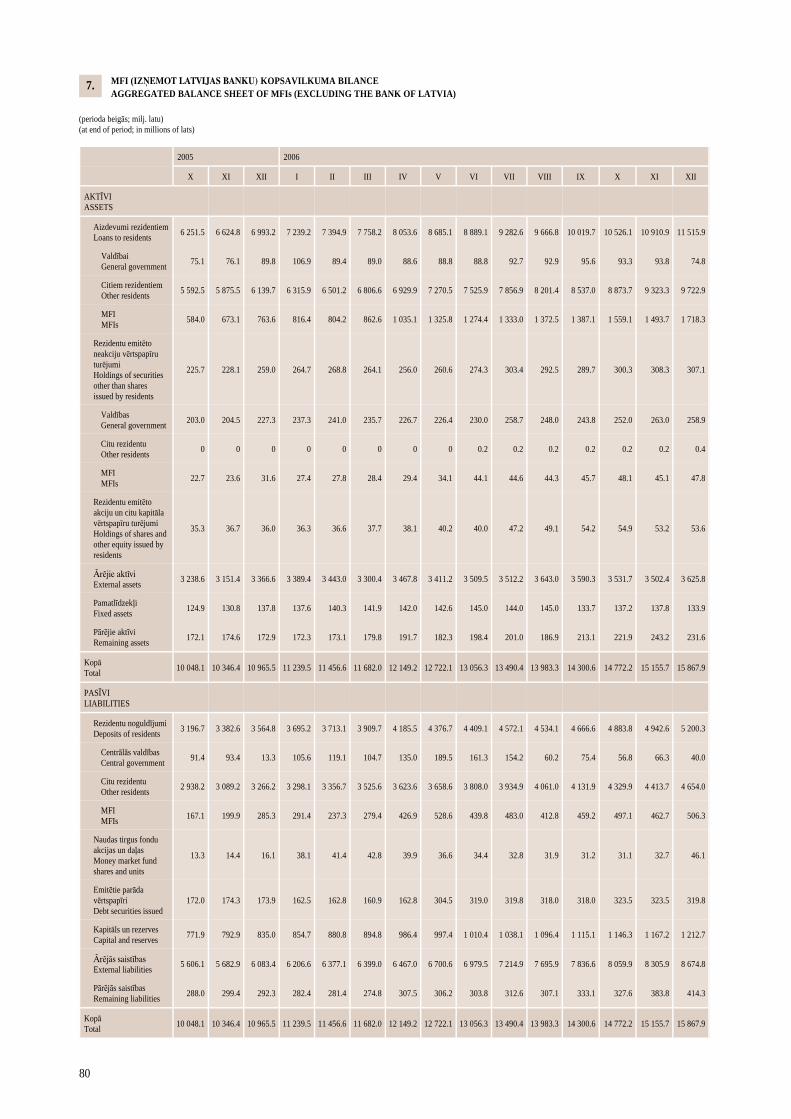
80
MFI (IZŅEMOT LATVIJAS BANKU) KOPSAVILKUMA BILANCE AGGREGATED BALANCE SHEET OF MFIs (EXCLUDING THE BANK OF LATVIA) (perioda beigās; milj. latu) (at end of period; in millions of lats)
2005 2006
X XI XII I II III IV V VI VII VIII IX
AKTĪVI ASSETS
Aizdevumi rezidentiem Loans to residents
6 251.5 6 624.8 6 993.2 7 239.2 7 394.9 7 758.2 8 053.6 8 685.1 8 889.1 9 282.6 9 666.8 10 019.7
Valdībai General government
75.1 76.1 89.8 106.9 89.4 89.0 88.6 88.8 88.8 92.7 92.9 95.6
Citiem rezidentiem Other residents
5 592.5 5 875.5 6 139.7 6 315.9 6 501.2 6 806.6 6 929.9 7 270.5 7 525.9 7 856.9 8 201.4 8 537.0
MFI MFIs
584.0 673.1 763.6 816.4 804.2 862.6 1 035.1 1 325.8 1 274.4 1 333.0 1 372.5 1 387.1
Rezidentu emitēto neakciju vērtspapīru turējumi Holdings of securities other than shares issued by residents
225.7 228.1 259.0 264.7 268.8 264.1 256.0 260.6 274.3 303.4 292.5 289.7
Valdības General government
203.0 204.5 227.3 237.3 241.0 235.7 226.7 226.4 230.0 258.7 248.0 243.8
Citu rezidentu Other residents
0 0 0 0 0 0 0 0 0.2 0.2 0.2 0.2
MFI MFIs
22.7 23.6 31.6 27.4 27.8 28.4 29.4 34.1 44.1 44.6 44.3 45.7
Rezidentu emitēto akciju un citu kapitāla vērtspapīru turējumi Holdings of shares and other equity issued by residents
35.3 36.7 36.0 36.3 36.6 37.7 38.1 40.2 40.0 47.2 49.1 54.2
Ārējie aktīvi External assets
3 238.6 3 151.4 3 366.6 3 389.4 3 443.0 3 300.4 3 467.8 3 411.2 3 509.5 3 512.2 3 643.0 3 590.3
Pamatlīdzekļi Fixed assets
124.9 130.8 137.8 137.6 140.3 141.9 142.0 142.6 145.0 144.0 145.0 133.7
Pārējie aktīvi Remaining assets
172.1 174.6 172.9 172.3 173.1 179.8 191.7 182.3 198.4 201.0 186.9 213.1
Kopā Total
10 048.1 10 346.4 10 965.5 11 239.5 11 456.6 11 682.0 12 149.2 12 722.1 13 056.3 13 490.4 13 983.3 14 300.6
PASĪVI LIABILITIES
Rezidentu noguldījumi Deposits of residents
3 196.7 3 382.6 3 564.8 3 695.2 3 713.1 3 909.7 4 185.5 4 376.7 4 409.1 4 572.1 4 534.1 4 666.6
Centrālās valdības Central government
91.4 93.4 13.3 105.6 119.1 104.7 135.0 189.5 161.3 154.2 60.2 75.4
Citu rezidentu Other residents
2 938.2 3 089.2 3 266.2 3 298.1 3 356.7 3 525.6 3 623.6 3 658.6 3 808.0 3 934.9 4 061.0 4 131.9
MFI MFIs
167.1 199.9 285.3 291.4 237.3 279.4 426.9 528.6 439.8 483.0 412.8 459.2
Naudas tirgus fondu akcijas un daļas Money market fund shares and units
13.3 14.4 16.1 38.1 41.4 42.8 39.9 36.6 34.4 32.8 31.9 31.2
Emitētie parāda vērtspapīri Debt securities issued
172.0 174.3 173.9 162.5 162.8 160.9 162.8 304.5 319.0 319.8 318.0 318.0
Kapitāls un rezerves Capital and reserves
771.9 792.9 835.0 854.7 880.8 894.8 986.4 997.4 1 010.4 1 038.1 1 096.4 1 115.1
Ārējās saistības External liabilities
5 606.1 5 682.9 6 083.4 6 206.6 6 377.1 6 399.0 6 467.0 6 700.6 6 979.5 7 214.9 7 695.9 7 836.6
Pārējās saistības Remaining liabilities
288.0 299.4 292.3 282.4 281.4 274.8 307.5 306.2 303.8 312.6 307.1 333.1
Kopā Total
10 048.1 10 346.4 10 965.5 11 239.5 11 456.6 11 682.0 12 149.2 12 722.1 13 056.3 13 490.4 13 983.3 14 300.6
X XI XII
10 526.1 10 910.9 11 515.9
93.3 93.8 74.8
8 873.7 9 323.3 9 722.9
1 559.1 1 493.7 1 718.3
300.3 308.3 307.1
252.0 263.0 258.9
0.2 0.2 0.4
48.1 45.1 47.8
54.9 53.2 53.6
3 531.7 3 502.4 3 625.8
137.2 137.8 133.9
221.9 243.2 231.6
14 772.2 15 155.7 15 867.9
4 883.8 4 942.6 5 200.3
56.8 66.3 40.0
4 329.9 4 413.7 4 654.0
497.1 462.7 506.3
31.1 32.7 46.1
323.5 323.5 319.8
1 146.3 1 167.2 1 212.7
8 059.9 8 305.9 8 674.8
327.6 383.8 414.3
14 772.2 15 155.7 15 867.9
7.
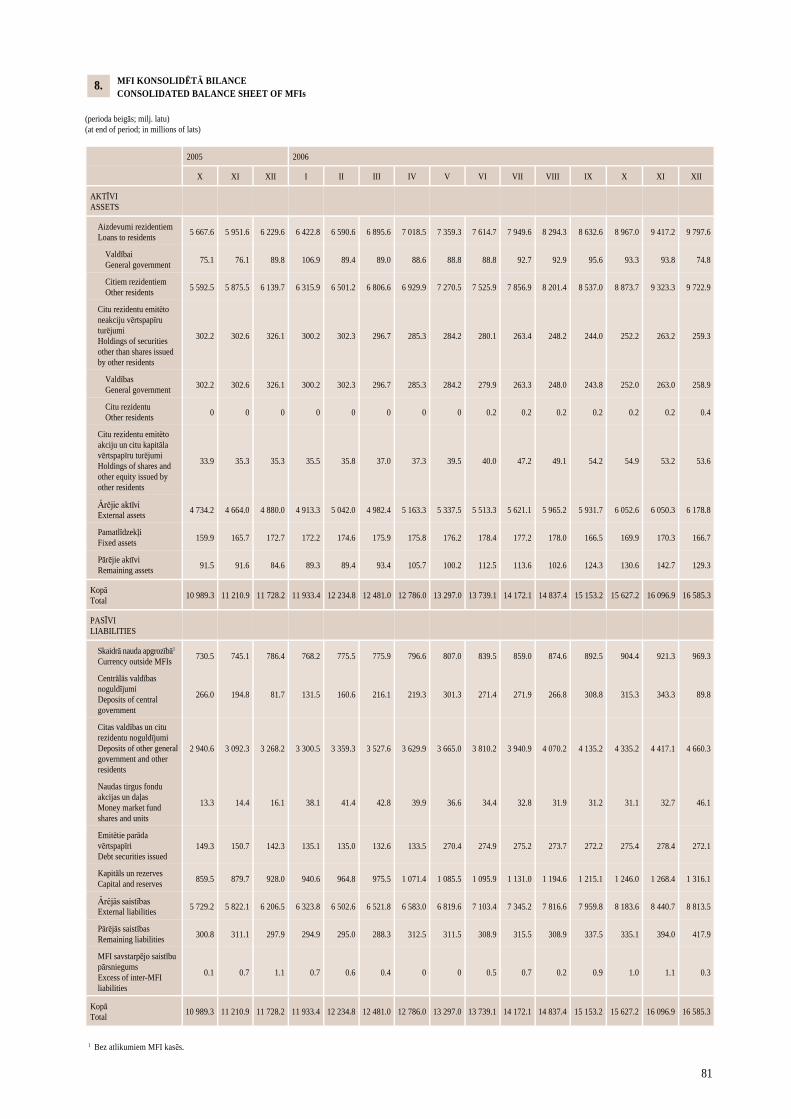
81
MFI KONSOLIDĒTĀ BILANCE CONSOLIDATED BALANCE SHEET OF MFIs (perioda beigās; milj. latu) (at end of period; in millions of lats)
2005 2006
X XI XII I II III IV V VI VII VIII IX
AKTĪVI ASSETS
Aizdevumi rezidentiem Loans to residents
5 667.6 5 951.6 6 229.6 6 422.8 6 590.6 6 895.6 7 018.5 7 359.3 7 614.7 7 949.6 8 294.3 8 632.6
Valdībai General government 75.1 76.1 89.8 106.9 89.4 89.0 88.6 88.8 88.8 92.7 92.9 95.6
Citiem rezidentiem Other residents 5 592.5 5 875.5 6 139.7 6 315.9 6 501.2 6 806.6 6 929.9 7 270.5 7 525.9 7 856.9 8 201.4 8 537.0
Citu rezidentu emitēto neakciju vērtspapīru turējumi Holdings of securities other than shares issued by other residents
302.2 302.6 326.1 300.2 302.3 296.7 285.3 284.2 280.1 263.4 248.2 244.0
Valdības General government 302.2 302.6 326.1 300.2 302.3 296.7 285.3 284.2 279.9 263.3 248.0 243.8
Citu rezidentu Other residents 0 0 0 0 0 0 0 0 0.2 0.2 0.2 0.2
Citu rezidentu emitēto akciju un citu kapitāla vērtspapīru turējumi Holdings of shares and other equity issued by other residents
33.9 35.3 35.3 35.5 35.8 37.0 37.3 39.5 40.0 47.2 49.1 54.2
Ārējie aktīvi External assets 4 734.2 4 664.0 4 880.0 4 913.3 5 042.0 4 982.4 5 163.3 5 337.5 5 513.3 5 621.1 5 965.2 5 931.7
Pamatlīdzekļi Fixed assets 159.9 165.7 172.7 172.2 174.6 175.9 175.8 176.2 178.4 177.2 178.0 166.5
Pārējie aktīvi Remaining assets 91.5 91.6 84.6 89.3 89.4 93.4 105.7 100.2 112.5 113.6 102.6 124.3
Kopā Total
10 989.3 11 210.9 11 728.2 11 933.4 12 234.8 12 481.0 12 786.0 13 297.0 13 739.1 14 172.1 14 837.4 15 153.2
PASĪVI LIABILITIES
Skaidrā nauda apgrozībā1 Currency outside MFIs
730.5 745.1 786.4 768.2 775.5 775.9 796.6 807.0 839.5 859.0 874.6 892.5
Centrālās valdības noguldījumi Deposits of central government
266.0 194.8 81.7 131.5 160.6 216.1 219.3 301.3 271.4 271.9 266.8 308.8
Citas valdības un citu rezidentu noguldījumi Deposits of other general government and other residents
2 940.6 3 092.3 3 268.2 3 300.5 3 359.3 3 527.6 3 629.9 3 665.0 3 810.2 3 940.9 4 070.2 4 135.2
Naudas tirgus fondu akcijas un daļas Money market fund shares and units
13.3 14.4 16.1 38.1 41.4 42.8 39.9 36.6 34.4 32.8 31.9 31.2
Emitētie parāda vērtspapīri Debt securities issued
149.3 150.7 142.3 135.1 135.0 132.6 133.5 270.4 274.9 275.2 273.7 272.2
Kapitāls un rezerves Capital and reserves 859.5 879.7 928.0 940.6 964.8 975.5 1 071.4 1 085.5 1 095.9 1 131.0 1 194.6 1 215.1
Ārējās saistības External liabilities 5 729.2 5 822.1 6 206.5 6 323.8 6 502.6 6 521.8 6 583.0 6 819.6 7 103.4 7 345.2 7 816.6 7 959.8
Pārējās saistības Remaining liabilities 300.8 311.1 297.9 294.9 295.0 288.3 312.5 311.5 308.9 315.5 308.9 337.5
MFI savstarpējo saistību pārsniegums Excess of inter-MFI liabilities
0.1 0.7 1.1 0.7 0.6 0.4 0 0 0.5 0.7 0.2 0.9
Kopā Total
10 989.3 11 210.9 11 728.2 11 933.4 12 234.8 12 481.0 12 786.0 13 297.0 13 739.1 14 172.1 14 837.4 15 153.2
1 Bez atlikumiem MFI kasēs.
X XI XII
8 967.0 9 417.2 9 797.6
93.3 93.8 74.8
8 873.7 9 323.3 9 722.9
252.2 263.2 259.3
252.0 263.0 258.9
0.2 0.2 0.4
54.9 53.2 53.6
6 052.6 6 050.3 6 178.8
169.9 170.3 166.7
130.6 142.7 129.3
15 627.2 16 096.9 16 585.3
904.4 921.3 969.3
315.3 343.3 89.8
4 335.2 4 417.1 4 660.3
31.1 32.7 46.1
275.4 278.4 272.1
1 246.0 1 268.4 1 316.1
8 183.6 8 440.7 8 813.5
335.1 394.0 417.9
1.0 1.1 0.3
15 627.2 16 096.9 16 585.3
8.
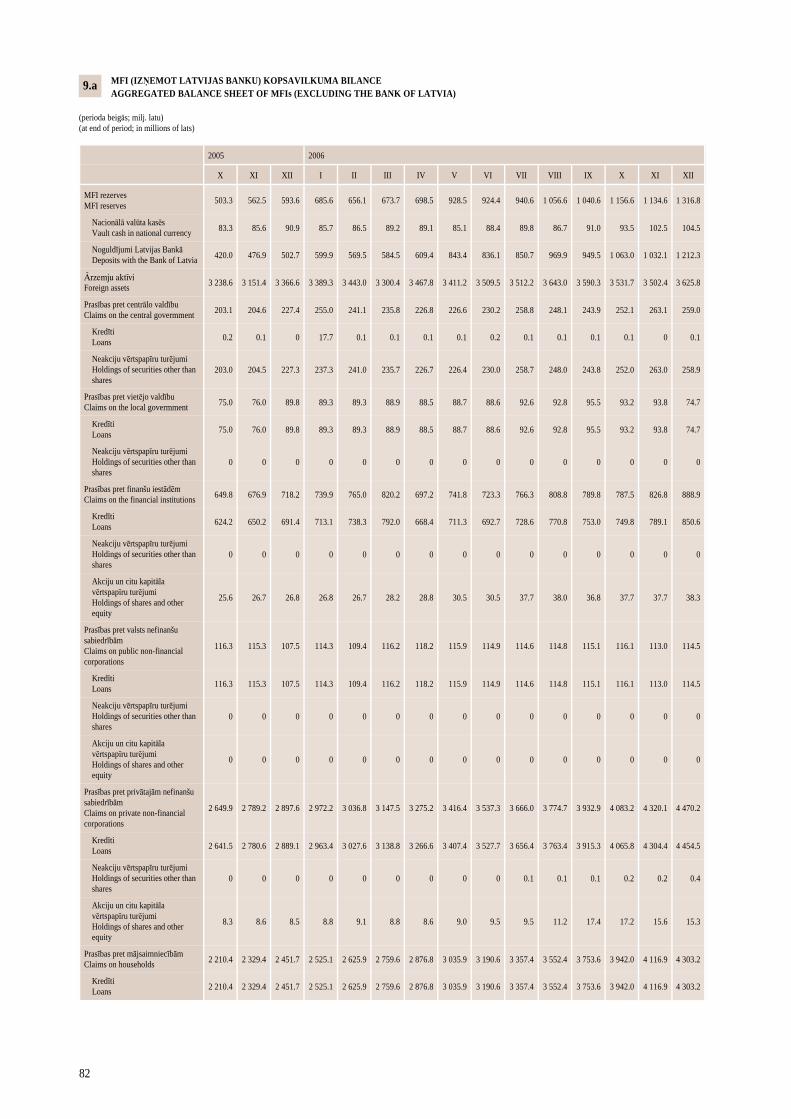
82
MFI (IZŅEMOT LATVIJAS BANKU) KOPSAVILKUMA BILANCE AGGREGATED BALANCE SHEET OF MFIs (EXCLUDING THE BANK OF LATVIA) (perioda beigās; milj. latu) (at end of period; in millions of lats)
2005 2006
X XI XII I II III IV V VI VII VIII IX
MFI rezerves MFI reserves
503.3 562.5 593.6 685.6 656.1 673.7 698.5 928.5 924.4 940.6 1 056.6 1 040.6
Nacionālā valūta kasēs Vault cash in national currency 83.3 85.6 90.9 85.7 86.5 89.2 89.1 85.1 88.4 89.8 86.7 91.0
Noguldījumi Latvijas Bankā Deposits with the Bank of Latvia 420.0 476.9 502.7 599.9 569.5 584.5 609.4 843.4 836.1 850.7 969.9 949.5
Ārzemju aktīvi Foreign assets 3 238.6 3 151.4 3 366.6 3 389.3 3 443.0 3 300.4 3 467.8 3 411.2 3 509.5 3 512.2 3 643.0 3 590.3
Prasības pret centrālo valdību Claims on the central govermment 203.1 204.6 227.4 255.0 241.1 235.8 226.8 226.6 230.2 258.8 248.1 243.9
Kredīti Loans 0.2 0.1 0 17.7 0.1 0.1 0.1 0.1 0.2 0.1 0.1 0.1
Neakciju vērtspapīru turējumi Holdings of securities other than shares
203.0 204.5 227.3 237.3 241.0 235.7 226.7 226.4 230.0 258.7 248.0 243.8
Prasības pret vietējo valdību Claims on the local govermment 75.0 76.0 89.8 89.3 89.3 88.9 88.5 88.7 88.6 92.6 92.8 95.5
Kredīti Loans 75.0 76.0 89.8 89.3 89.3 88.9 88.5 88.7 88.6 92.6 92.8 95.5
Neakciju vērtspapīru turējumi Holdings of securities other than shares
0 0 0 0 0 0 0 0 0 0 0 0
Prasības pret finanšu iestādēm Claims on the financial institutions 649.8 676.9 718.2 739.9 765.0 820.2 697.2 741.8 723.3 766.3 808.8 789.8
Kredīti Loans 624.2 650.2 691.4 713.1 738.3 792.0 668.4 711.3 692.7 728.6 770.8 753.0
Neakciju vērtspapīru turējumi Holdings of securities other than shares
0 0 0 0 0 0 0 0 0 0 0 0
Akciju un citu kapitāla vērtspapīru turējumi Holdings of shares and other equity
25.6 26.7 26.8 26.8 26.7 28.2 28.8 30.5 30.5 37.7 38.0 36.8
Prasības pret valsts nefinanšu sabiedrībām Claims on public non-financial corporations
116.3 115.3 107.5 114.3 109.4 116.2 118.2 115.9 114.9 114.6 114.8 115.1
Kredīti Loans 116.3 115.3 107.5 114.3 109.4 116.2 118.2 115.9 114.9 114.6 114.8 115.1
Neakciju vērtspapīru turējumi Holdings of securities other than shares
0 0 0 0 0 0 0 0 0 0 0 0
Akciju un citu kapitāla vērtspapīru turējumi Holdings of shares and other equity
0 0 0 0 0 0 0 0 0 0 0 0
Prasības pret privātajām nefinanšu sabiedrībām Claims on private non-financial corporations
2 649.9 2 789.2 2 897.6 2 972.2 3 036.8 3 147.5 3 275.2 3 416.4 3 537.3 3 666.0 3 774.7 3 932.9
Kredīti Loans 2 641.5 2 780.6 2 889.1 2 963.4 3 027.6 3 138.8 3 266.6 3 407.4 3 527.7 3 656.4 3 763.4 3 915.3
Neakciju vērtspapīru turējumi Holdings of securities other than shares
0 0 0 0 0 0 0 0 0 0.1 0.1 0.1
Akciju un citu kapitāla vērtspapīru turējumi Holdings of shares and other equity
8.3 8.6 8.5 8.8 9.1 8.8 8.6 9.0 9.5 9.5 11.2 17.4
Prasības pret mājsaimniecībām Claims on households 2 210.4 2 329.4 2 451.7 2 525.1 2 625.9 2 759.6 2 876.8 3 035.9 3 190.6 3 357.4 3 552.4 3 753.6
Kredīti Loans 2 210.4 2 329.4 2 451.7 2 525.1 2 625.9 2 759.6 2 876.8 3 035.9 3 190.6 3 357.4 3 552.4 3 753.6
X XI XII
1 156.6 1 134.6 1 316.8
93.5 102.5 104.5
1 063.0 1 032.1 1 212.3
3 531.7 3 502.4 3 625.8
252.1 263.1 259.0
0.1 0 0.1
252.0 263.0 258.9
93.2 93.8 74.7
93.2 93.8 74.7
0 0 0
787.5 826.8 888.9
749.8 789.1 850.6
0 0 0
37.7 37.7 38.3
116.1 113.0 114.5
116.1 113.0 114.5
0 0 0
0 0 0
4 083.2 4 320.1 4 470.2
4 065.8 4 304.4 4 454.5
0.2 0.2 0.4
17.2 15.6 15.3
3 942.0 4 116.9 4 303.2
3 942.0 4 116.9 4 303.2
9.a
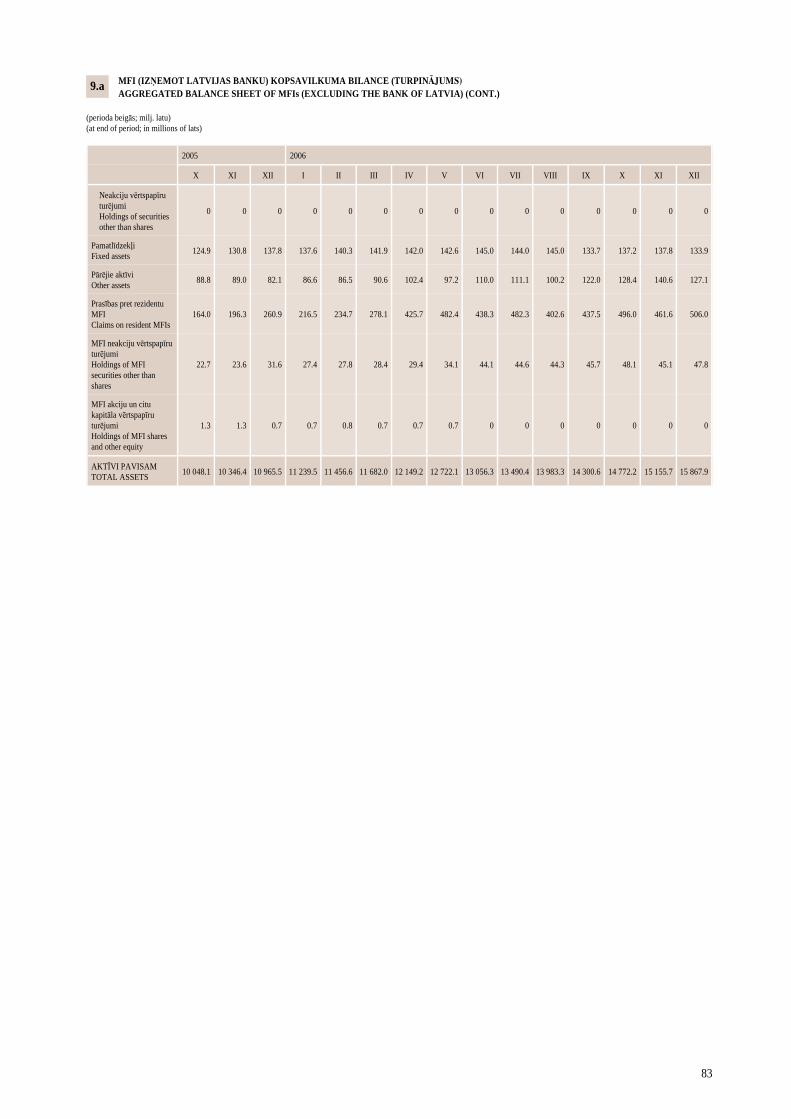
83
MFI (IZŅEMOT LATVIJAS BANKU) KOPSAVILKUMA BILANCE (TURPINĀJUMS) AGGREGATED BALANCE SHEET OF MFIs (EXCLUDING THE BANK OF LATVIA) (CONT.) (perioda beigās; milj. latu) (at end of period; in millions of lats)
2005
X XI XII I II III IV V VI VII VIII IX X XI XII
Neakciju vērtspapīru turējumi Holdings of securities other than shares
0 0 0 0 0 0 0 0 0 0 0 0 0 0 0
Pamatlīdzekļi Fixed assets
124.9 130.8 137.8 137.6 140.3 141.9 142.0 142.6 145.0 144.0 145.0 133.7 137.2 137.8 133.9
Pārējie aktīvi Other assets
88.8 89.0 82.1 86.6 86.5 90.6 102.4 97.2 110.0 111.1 100.2 122.0 128.4 140.6 127.1
Prasības pret rezidentu MFI Claims on resident MFIs
164.0 196.3 260.9 216.5 234.7 278.1 425.7 482.4 438.3 482.3 402.6 437.5 496.0 461.6 506.0
MFI neakciju vērtspapīru turējumi Holdings of MFI securities other than shares
22.7 23.6 31.6 27.4 27.8 28.4 29.4 34.1 44.1 44.6 44.3 45.7 48.1 45.1 47.8
MFI akciju un citu kapitāla vērtspapīru turējumi Holdings of MFI shares and other equity
1.3 1.3 0.7 0.7 0.8 0.7 0.7 0.7 0 0 0 0 0 0 0
AKTĪVI PAVISAM TOTAL ASSETS
10 048.1 10 346.4 10 965.5 11 239.5 11 456.6 11 682.0 12 149.2 12 722.1 13 056.3 13 490.4 13 983.3 14 300.6 14 772.2 15 155.7 15 867.9
2006
9.a
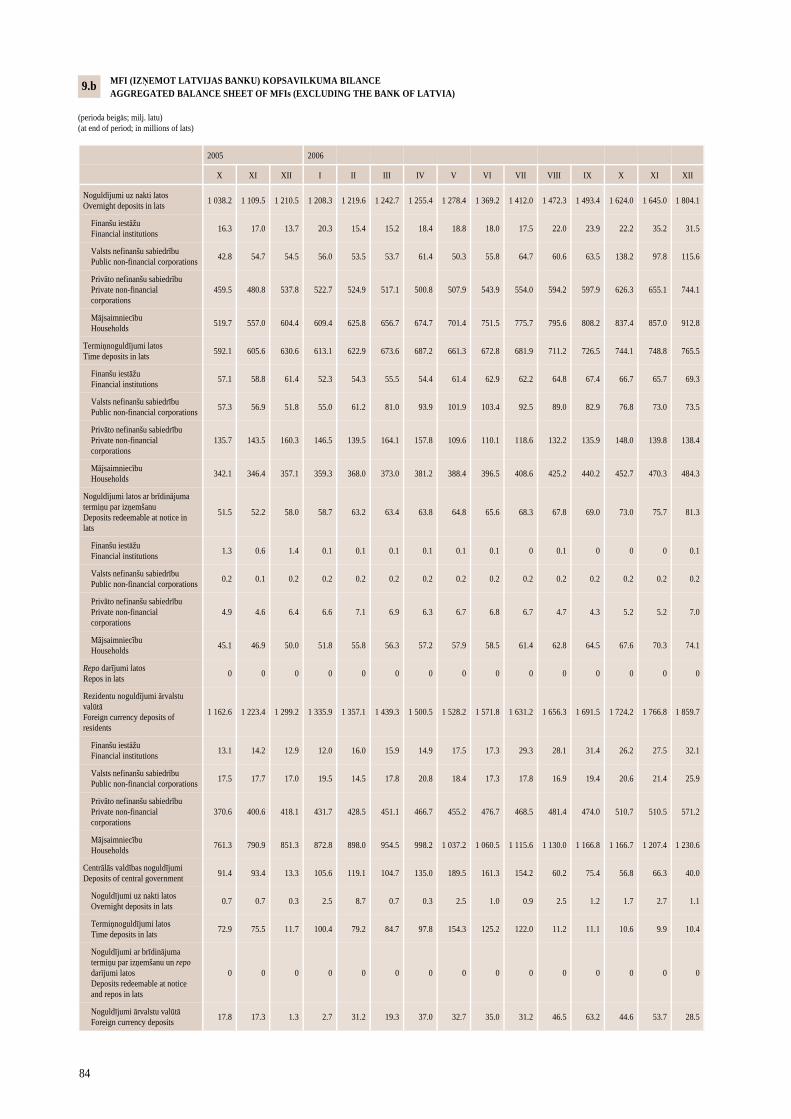
84
MFI (IZŅEMOT LATVIJAS BANKU) KOPSAVILKUMA BILANCE AGGREGATED BALANCE SHEET OF MFIs (EXCLUDING THE BANK OF LATVIA) (perioda beigās; milj. latu) (at end of period; in millions of lats)
2005 2006
X XI XII I II III IV V VI VII VIII IX
Noguldījumi uz nakti latos Overnight deposits in lats
1 038.2 1 109.5 1 210.5 1 208.3 1 219.6 1 242.7 1 255.4 1 278.4 1 369.2 1 412.0 1 472.3 1 493.4
Finanšu iestāžu Financial institutions 16.3 17.0 13.7 20.3 15.4 15.2 18.4 18.8 18.0 17.5 22.0 23.9
Valsts nefinanšu sabiedrību Public non-financial corporations 42.8 54.7 54.5 56.0 53.5 53.7 61.4 50.3 55.8 64.7 60.6 63.5
Privāto nefinanšu sabiedrību Private non-financial corporations
459.5 480.8 537.8 522.7 524.9 517.1 500.8 507.9 543.9 554.0 594.2 597.9
Mājsaimniecību Households 519.7 557.0 604.4 609.4 625.8 656.7 674.7 701.4 751.5 775.7 795.6 808.2
Termiņnoguldījumi latos Time deposits in lats 592.1 605.6 630.6 613.1 622.9 673.6 687.2 661.3 672.8 681.9 711.2 726.5
Finanšu iestāžu Financial institutions 57.1 58.8 61.4 52.3 54.3 55.5 54.4 61.4 62.9 62.2 64.8 67.4
Valsts nefinanšu sabiedrību Public non-financial corporations 57.3 56.9 51.8 55.0 61.2 81.0 93.9 101.9 103.4 92.5 89.0 82.9
Privāto nefinanšu sabiedrību Private non-financial corporations
135.7 143.5 160.3 146.5 139.5 164.1 157.8 109.6 110.1 118.6 132.2 135.9
Mājsaimniecību Households 342.1 346.4 357.1 359.3 368.0 373.0 381.2 388.4 396.5 408.6 425.2 440.2
Noguldījumi latos ar brīdinājuma termiņu par izņemšanu Deposits redeemable at notice in lats
51.5 52.2 58.0 58.7 63.2 63.4 63.8 64.8 65.6 68.3 67.8 69.0
Finanšu iestāžu Financial institutions 1.3 0.6 1.4 0.1 0.1 0.1 0.1 0.1 0.1 0 0.1 0
Valsts nefinanšu sabiedrību Public non-financial corporations 0.2 0.1 0.2 0.2 0.2 0.2 0.2 0.2 0.2 0.2 0.2 0.2
Privāto nefinanšu sabiedrību Private non-financial corporations
4.9 4.6 6.4 6.6 7.1 6.9 6.3 6.7 6.8 6.7 4.7 4.3
Mājsaimniecību Households 45.1 46.9 50.0 51.8 55.8 56.3 57.2 57.9 58.5 61.4 62.8 64.5
Repo darījumi latos Repos in lats 0 0 0 0 0 0 0 0 0 0 0 0
Rezidentu noguldījumi ārvalstu valūtā Foreign currency deposits of residents
1 162.6 1 223.4 1 299.2 1 335.9 1 357.1 1 439.3 1 500.5 1 528.2 1 571.8 1 631.2 1 656.3 1 691.5
Finanšu iestāžu Financial institutions 13.1 14.2 12.9 12.0 16.0 15.9 14.9 17.5 17.3 29.3 28.1 31.4
Valsts nefinanšu sabiedrību Public non-financial corporations 17.5 17.7 17.0 19.5 14.5 17.8 20.8 18.4 17.3 17.8 16.9 19.4
Privāto nefinanšu sabiedrību Private non-financial corporations
370.6 400.6 418.1 431.7 428.5 451.1 466.7 455.2 476.7 468.5 481.4 474.0
Mājsaimniecību Households 761.3 790.9 851.3 872.8 898.0 954.5 998.2 1 037.2 1 060.5 1 115.6 1 130.0 1 166.8
Centrālās valdības noguldījumi Deposits of central government 91.4 93.4 13.3 105.6 119.1 104.7 135.0 189.5 161.3 154.2 60.2 75.4
Noguldījumi uz nakti latos Overnight deposits in lats 0.7 0.7 0.3 2.5 8.7 0.7 0.3 2.5 1.0 0.9 2.5 1.2
Termiņnoguldījumi latos Time deposits in lats 72.9 75.5 11.7 100.4 79.2 84.7 97.8 154.3 125.2 122.0 11.2 11.1
Noguldījumi ar brīdinājuma termiņu par izņemšanu un repo darījumi latos Deposits redeemable at notice and repos in lats
0 0 0 0 0 0 0 0 0 0 0 0
Noguldījumi ārvalstu valūtā Foreign currency deposits 17.8 17.3 1.3 2.7 31.2 19.3 37.0 32.7 35.0 31.2 46.5 63.2
X XI XII
1 624.0 1 645.0 1 804.1
22.2 35.2 31.5
138.2 97.8 115.6
626.3 655.1 744.1
837.4 857.0 912.8
744.1 748.8 765.5
66.7 65.7 69.3
76.8 73.0 73.5
148.0 139.8 138.4
452.7 470.3 484.3
73.0 75.7 81.3
0 0 0.1
0.2 0.2 0.2
5.2 5.2 7.0
67.6 70.3 74.1
0 0 0
1 724.2 1 766.8 1 859.7
26.2 27.5 32.1
20.6 21.4 25.9
510.7 510.5 571.2
1 166.7 1 207.4 1 230.6
56.8 66.3 40.0
1.7 2.7 1.1
10.6 9.9 10.4
0 0 0
44.6 53.7 28.5
9.b
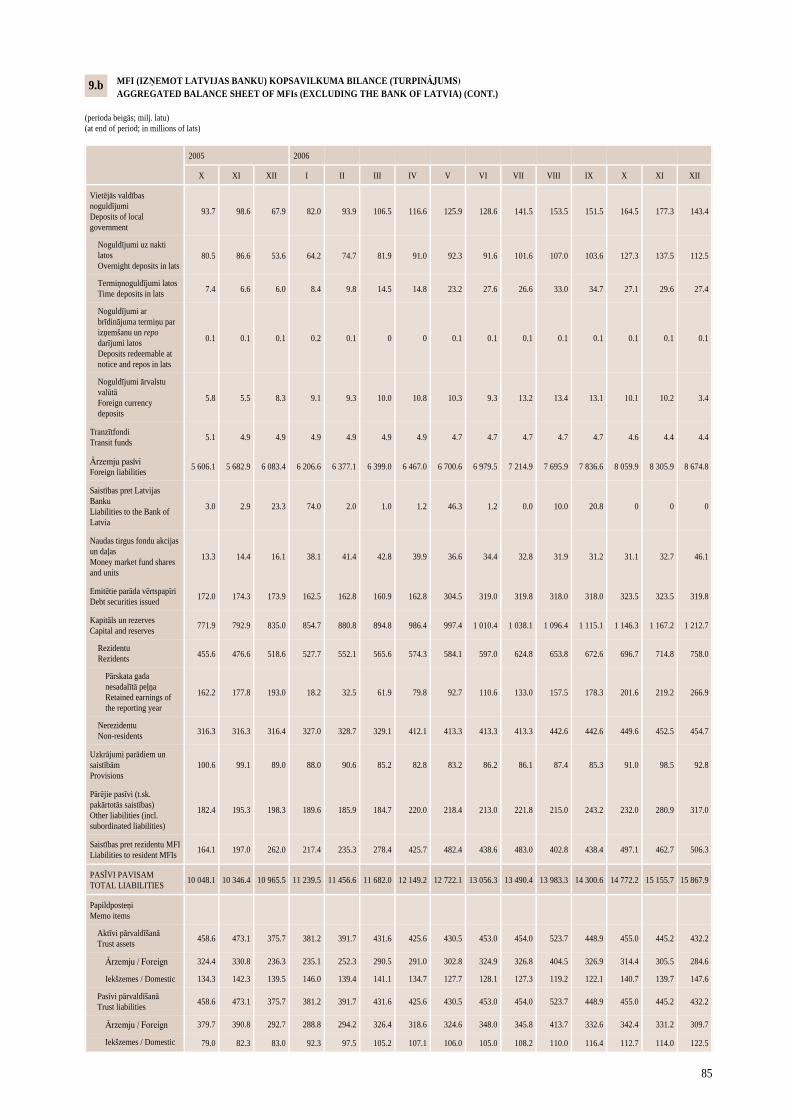
85
MFI (IZŅEMOT LATVIJAS BANKU) KOPSAVILKUMA BILANCE (TURPINĀJUMS) AGGREGATED BALANCE SHEET OF MFIs (EXCLUDING THE BANK OF LATVIA) (CONT.) (perioda beigās; milj. latu) (at end of period; in millions of lats)
2005 2006
X XI XII I II III IV V VI VII VIII IX
Vietējās valdības noguldījumi Deposits of local government
93.7 98.6 67.9 82.0 93.9 106.5 116.6 125.9 128.6 141.5 153.5 151.5
Noguldījumi uz nakti latos Overnight deposits in lats
80.5 86.6 53.6 64.2 74.7 81.9 91.0 92.3 91.6 101.6 107.0 103.6
Termiņnoguldījumi latos Time deposits in lats 7.4 6.6 6.0 8.4 9.8 14.5 14.8 23.2 27.6 26.6 33.0 34.7
Noguldījumi ar brīdinājuma termiņu par izņemšanu un repo darījumi latos Deposits redeemable at notice and repos in lats
0.1 0.1 0.1 0.2 0.1 0 0 0.1 0.1 0.1 0.1 0.1
Noguldījumi ārvalstu valūtā Foreign currency deposits
5.8 5.5 8.3 9.1 9.3 10.0 10.8 10.3 9.3 13.2 13.4 13.1
Tranzītfondi Transit funds
5.1 4.9 4.9 4.9 4.9 4.9 4.9 4.7 4.7 4.7 4.7 4.7
Ārzemju pasīvi Foreign liabilities
5 606.1 5 682.9 6 083.4 6 206.6 6 377.1 6 399.0 6 467.0 6 700.6 6 979.5 7 214.9 7 695.9 7 836.6
Saistības pret Latvijas Banku Liabilities to the Bank of Latvia
3.0 2.9 23.3 74.0 2.0 1.0 1.2 46.3 1.2 0.0 10.0 20.8
Naudas tirgus fondu akcijas un daļas Money market fund shares and units
13.3 14.4 16.1 38.1 41.4 42.8 39.9 36.6 34.4 32.8 31.9 31.2
Emitētie parāda vērtspapīri Debt securities issued
172.0 174.3 173.9 162.5 162.8 160.9 162.8 304.5 319.0 319.8 318.0 318.0
Kapitāls un rezerves Capital and reserves
771.9 792.9 835.0 854.7 880.8 894.8 986.4 997.4 1 010.4 1 038.1 1 096.4 1 115.1
Rezidentu Rezidents 455.6 476.6 518.6 527.7 552.1 565.6 574.3 584.1 597.0 624.8 653.8 672.6
Pārskata gada nesadalītā peļņa Retained earnings of the reporting year
162.2 177.8 193.0 18.2 32.5 61.9 79.8 92.7 110.6 133.0 157.5 178.3
Nerezidentu Non-residents 316.3 316.3 316.4 327.0 328.7 329.1 412.1 413.3 413.3 413.3 442.6 442.6
Uzkrājumi parādiem un saistībām Provisions
100.6 99.1 89.0 88.0 90.6 85.2 82.8 83.2 86.2 86.1 87.4 85.3
Pārējie pasīvi (t.sk. pakārtotās saistības) Other liabilities (incl. subordinated liabilities)
182.4 195.3 198.3 189.6 185.9 184.7 220.0 218.4 213.0 221.8 215.0 243.2
Saistības pret rezidentu MFI Liabilities to resident MFIs
164.1 197.0 262.0 217.4 235.3 278.4 425.7 482.4 438.6 483.0 402.8 438.4
PASĪVI PAVISAM TOTAL LIABILITIES
10 048.1 10 346.4 10 965.5 11 239.5 11 456.6 11 682.0 12 149.2 12 722.1 13 056.3 13 490.4 13 983.3 14 300.6
Papildposteņi Memo items
Aktīvi pārvaldīšanā Trust assets 458.6 473.1 375.7 381.2 391.7 431.6 425.6 430.5 453.0 454.0 523.7 448.9
Ārzemju / Foreign 324.4 330.8 236.3 235.1 252.3 290.5 291.0 302.8 324.9 326.8 404.5 326.9
Iekšzemes / Domestic 134.3 142.3 139.5 146.0 139.4 141.1 134.7 127.7 128.1 127.3 119.2 122.1
Pasīvi pārvaldīšanā Trust liabilities 458.6 473.1 375.7 381.2 391.7 431.6 425.6 430.5 453.0 454.0 523.7 448.9
Ārzemju / Foreign 379.7 390.8 292.7 288.8 294.2 326.4 318.6 324.6 348.0 345.8 413.7 332.6
Iekšzemes / Domestic 79.0 82.3 83.0 92.3 97.5 105.2 107.1 106.0 105.0 108.2 110.0 116.4
X XI XII
164.5 177.3 143.4
127.3 137.5 112.5
27.1 29.6 27.4
0.1 0.1 0.1
10.1 10.2 3.4
4.6 4.4 4.4
8 059.9 8 305.9 8 674.8
0 0 0
31.1 32.7 46.1
323.5 323.5 319.8
1 146.3 1 167.2 1 212.7
696.7 714.8 758.0
201.6 219.2 266.9
449.6 452.5 454.7
91.0 98.5 92.8
232.0 280.9 317.0
497.1 462.7 506.3
14 772.2 15 155.7 15 867.9
455.0 445.2 432.2
314.4 305.5 284.6
140.7 139.7 147.6
455.0 445.2 432.2
342.4 331.2 309.7
112.7 114.0 122.5
9.b
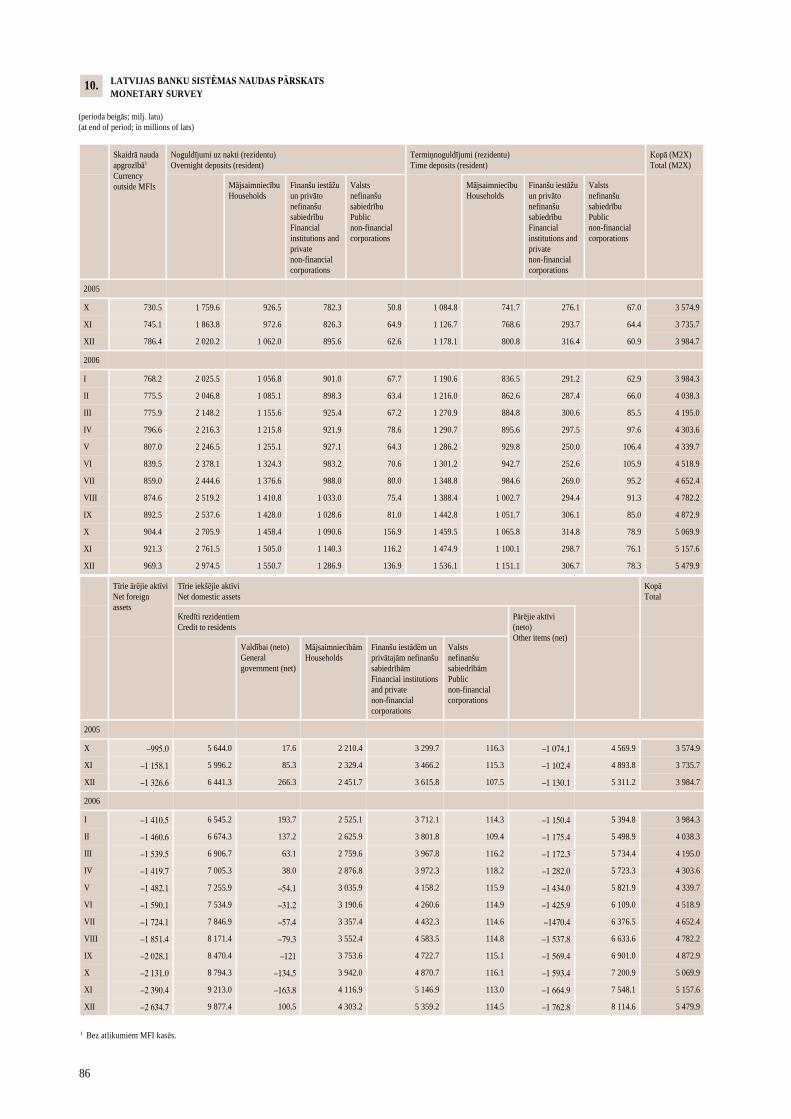
86
Tīrie ārējie aktīvi Net foreign assets
Tīrie iekšējie aktīvi Net domestic assets
Kopā Total
Kredīti rezidentiem Credit to residents
Pārējie aktīvi (neto) Other items (net)
Valdībai (neto) General government (net)
Mājsaimniecībām Households
Finanšu iestādēm un privātajām nefinanšu sabiedrībām Financial institutions and private non-financial corporations
Valsts nefinanšu sabiedrībām Public non-financial corporations
2005
X –995.0 5 644.0 17.6 2 210.4 3 299.7 116.3 –1 074.1 4 569.9 3 574.9
XI –1 158.1 5 996.2 85.3 2 329.4 3 466.2 115.3 –1 102.4 4 893.8 3 735.7
XII –1 326.6 6 441.3 266.3 2 451.7 3 615.8 107.5 –1 130.1 5 311.2 3 984.7
2006
I –1 410.5 6 545.2 193.7 2 525.1 3 712.1 114.3 –1 150.4 5 394.8 3 984.3
II –1 460.6 6 674.3 137.2 2 625.9 3 801.8 109.4 –1 175.4 5 498.9 4 038.3
III –1 539.5 6 906.7 63.1 2 759.6 3 967.8 116.2 –1 172.3 5 734.4 4 195.0
IV –1 419.7 7 005.3 38.0 2 876.8 3 972.3 118.2 –1 282.0 5 723.3 4 303.6
V –1 482.1 7 255.9 –54.1 3 035.9 4 158.2 115.9 –1 434.0 5 821.9 4 339.7
VI –1 590.1 7 534.9 –31.2 3 190.6 4 260.6 114.9 –1 425.9 6 109.0 4 518.9
VII –1 724.1 7 846.9 –57.4 3 357.4 4 432.3 114.6 –1470.4 6 376.5 4 652.4
VIII –1 851.4 8 171.4 –79.3 3 552.4 4 583.5 114.8 –1 537.8 6 633.6 4 782.2
IX –2 028.1 8 470.4 –121 3 753.6 4 722.7 115.1 –1 569.4 6 901.0 4 872.9
1 Bez atlikumiem MFI kasēs.
X –2 131.0 8 794.3 –134.5 3 942.0 4 870.7 116.1 –1 593.4 7 200.9 5 069.9
XI –2 390.4 9 213.0 –163.8 4 116.9 5 146.9 113.0 –1 664.9 7 548.1 5 157.6
XII –2 634.7 9 877.4 100.5 4 303.2 5 359.2 114.5 –1 762.8 8 114.6 5 479.9
LATVIJAS BANKU SISTĒMAS NAUDAS PĀRSKATS MONETARY SURVEY (perioda beigās; milj. latu) (at end of period; in millions of lats)
Skaidrā nauda apgrozībā1
Currency outside MFIs
Noguldījumi uz nakti (rezidentu) Overnight deposits (resident)
Termiņnoguldījumi (rezidentu) Time deposits (resident)
Kopā (M2X) Total (M2X)
Mājsaimniecību Households
Finanšu iestāžu un privāto nefinanšu sabiedrību Financial institutions and private non-financial corporations
Valsts nefinanšu sabiedrību Public non-financial corporations
Mājsaimniecību Households
Finanšu iestāžu un privāto nefinanšu sabiedrību Financial institutions and private non-financial corporations
Valsts nefinanšu sabiedrību Public non-financial corporations
2005
X 730.5 1 759.6 926.5 782.3 50.8 1 084.8 741.7 276.1 67.0 3 574.9
XI 745.1 1 863.8 972.6 826.3 64.9 1 126.7 768.6 293.7 64.4 3 735.7
XII 786.4 2 020.2 1 062.0 895.6 62.6 1 178.1 800.8 316.4 60.9 3 984.7
2006
I 768.2 2 025.5 1 056.8 901.0 67.7 1 190.6 836.5 291.2 62.9 3 984.3
II 775.5 2 046.8 1 085.1 898.3 63.4 1 216.0 862.6 287.4 66.0 4 038.3
III 775.9 2 148.2 1 155.6 925.4 67.2 1 270.9 884.8 300.6 85.5 4 195.0
IV 796.6 2 216.3 1 215.8 921.9 78.6 1 290.7 895.6 297.5 97.6 4 303.6
V 807.0 2 246.5 1 255.1 927.1 64.3 1 286.2 929.8 250.0 106.4 4 339.7
VI 839.5 2 378.1 1 324.3 983.2 70.6 1 301.2 942.7 252.6 105.9 4 518.9
VII 859.0 2 444.6 1 376.6 988.0 80.0 1 348.8 984.6 269.0 95.2 4 652.4
VIII 874.6 2 519.2 1 410.8 1 033.0 75.4 1 388.4 1 002.7 294.4 91.3 4 782.2
IX 892.5 2 537.6 1 428.0 1 028.6 81.0 1 442.8 1 051.7 306.1 85.0 4 872.9
X 904.4 2 705.9 1 458.4 1 090.6 156.9 1 459.5 1 065.8 314.8 78.9 5 069.9
XI 921.3 2 761.5 1 505.0 1 140.3 116.2 1 474.9 1 100.1 298.7 76.1 5 157.6
XII 969.3 2 974.5 1 550.7 1 286.9 136.9 1 536.1 1 151.1 306.7 78.3 5 479.9
10.
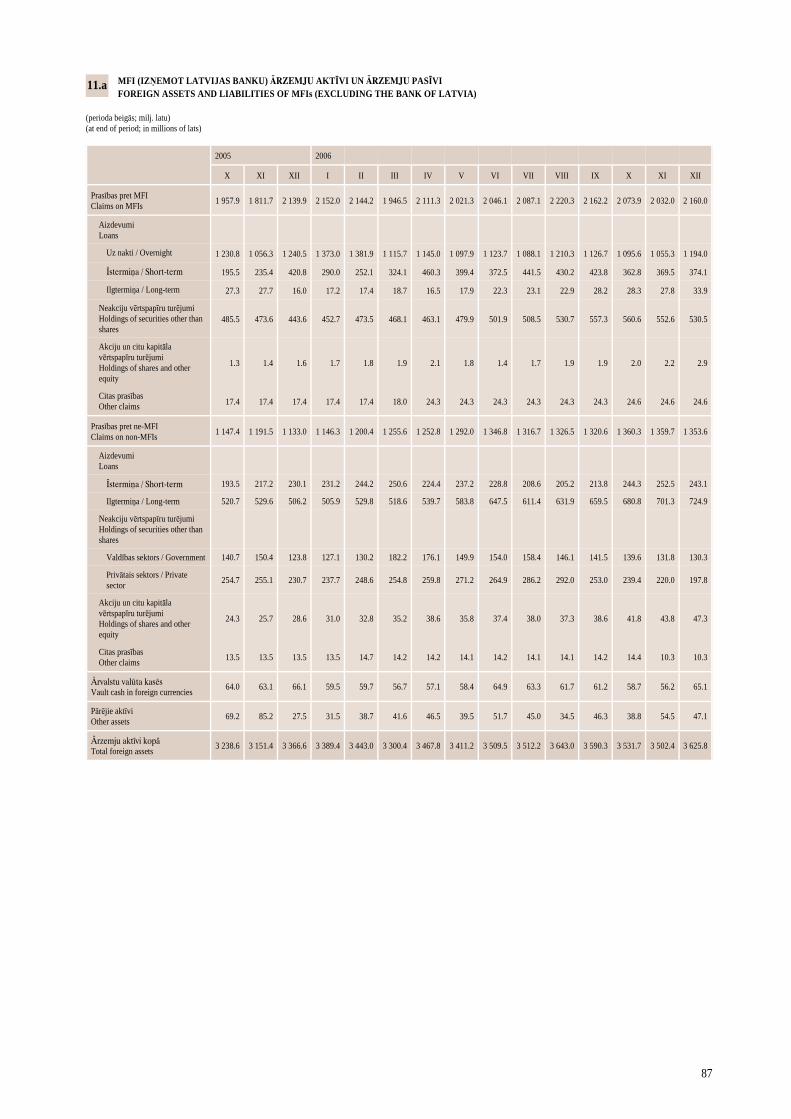
87
MFI (IZŅEMOT LATVIJAS BANKU) ĀRZEMJU AKTĪVI UN ĀRZEMJU PASĪVI FOREIGN ASSETS AND LIABILITIES OF MFIs (EXCLUDING THE BANK OF LATVIA) (perioda beigās; milj. latu) (at end of period; in millions of lats)
2005 2006
X XI XII I II III IV V VI VII VIII IX
Prasības pret MFI Claims on MFIs
1 957.9 1 811.7 2 139.9 2 152.0 2 144.2 1 946.5 2 111.3 2 021.3 2 046.1 2 087.1 2 220.3 2 162.2
Aizdevumi Loans
Uz nakti / Overnight 1 230.8 1 056.3 1 240.5 1 373.0 1 381.9 1 115.7 1 145.0 1 097.9 1 123.7 1 088.1 1 210.3 1 126.7
Īstermiņa / Short-term 195.5 235.4 420.8 290.0 252.1 324.1 460.3 399.4 372.5 441.5 430.2 423.8
Ilgtermiņa / Long-term 27.3 27.7 16.0 17.2 17.4 18.7 16.5 17.9 22.3 23.1 22.9 28.2
Neakciju vērtspapīru turējumi Holdings of securities other than shares
485.5 473.6 443.6 452.7 473.5 468.1 463.1 479.9 501.9 508.5 530.7 557.3
Akciju un citu kapitāla vērtspapīru turējumi Holdings of shares and other equity
1.3 1.4 1.6 1.7 1.8 1.9 2.1 1.8 1.4 1.7 1.9 1.9
Citas prasības Other claims 17.4 17.4 17.4 17.4 17.4 18.0 24.3 24.3 24.3 24.3 24.3 24.3
Prasības pret ne-MFI Claims on non-MFIs
1 147.4 1 191.5 1 133.0 1 146.3 1 200.4 1 255.6 1 252.8 1 292.0 1 346.8 1 316.7 1 326.5 1 320.6
Aizdevumi Loans
Īstermiņa / Short-term 193.5 217.2 230.1 231.2 244.2 250.6 224.4 237.2 228.8 208.6 205.2 213.8
Ilgtermiņa / Long-term 520.7 529.6 506.2 505.9 529.8 518.6 539.7 583.8 647.5 611.4 631.9 659.5
Neakciju vērtspapīru turējumi Holdings of securities other than shares
Valdības sektors / Government 140.7 150.4 123.8 127.1 130.2 182.2 176.1 149.9 154.0 158.4 146.1 141.5
Privātais sektors / Private sector 254.7 255.1 230.7 237.7 248.6 254.8 259.8 271.2 264.9 286.2 292.0 253.0
Akciju un citu kapitāla vērtspapīru turējumi Holdings of shares and other equity
24.3 25.7 28.6 31.0 32.8 35.2 38.6 35.8 37.4 38.0 37.3 38.6
Citas prasības Other claims 13.5 13.5 13.5 13.5 14.7 14.2 14.2 14.1 14.2 14.1 14.1 14.2
Ārvalstu valūta kasēs Vault cash in foreign currencies
64.0 63.1 66.1 59.5 59.7 56.7 57.1 58.4 64.9 63.3 61.7 61.2
Pārējie aktīvi Other assets 69.2 85.2 27.5 31.5 38.7 41.6 46.5 39.5 51.7 45.0 34.5 46.3
Ārzemju aktīvi kopā Total foreign assets
3 238.6 3 151.4 3 366.6 3 389.4 3 443.0 3 300.4 3 467.8 3 411.2 3 509.5 3 512.2 3 643.0 3 590.3
X XI XII
2 073.9 2 032.0 2 160.0
1 095.6 1 055.3 1 194.0
362.8 369.5 374.1
28.3 27.8 33.9
560.6 552.6 530.5
2.0 2.2 2.9
24.6 24.6 24.6
1 360.3 1 359.7 1 353.6
244.3 252.5 243.1
680.8 701.3 724.9
139.6 131.8 130.3
239.4 220.0 197.8
41.8 43.8 47.3
14.4 10.3 10.3
58.7 56.2 65.1
38.8 54.5 47.1
3 531.7 3 502.4 3 625.8
11.a
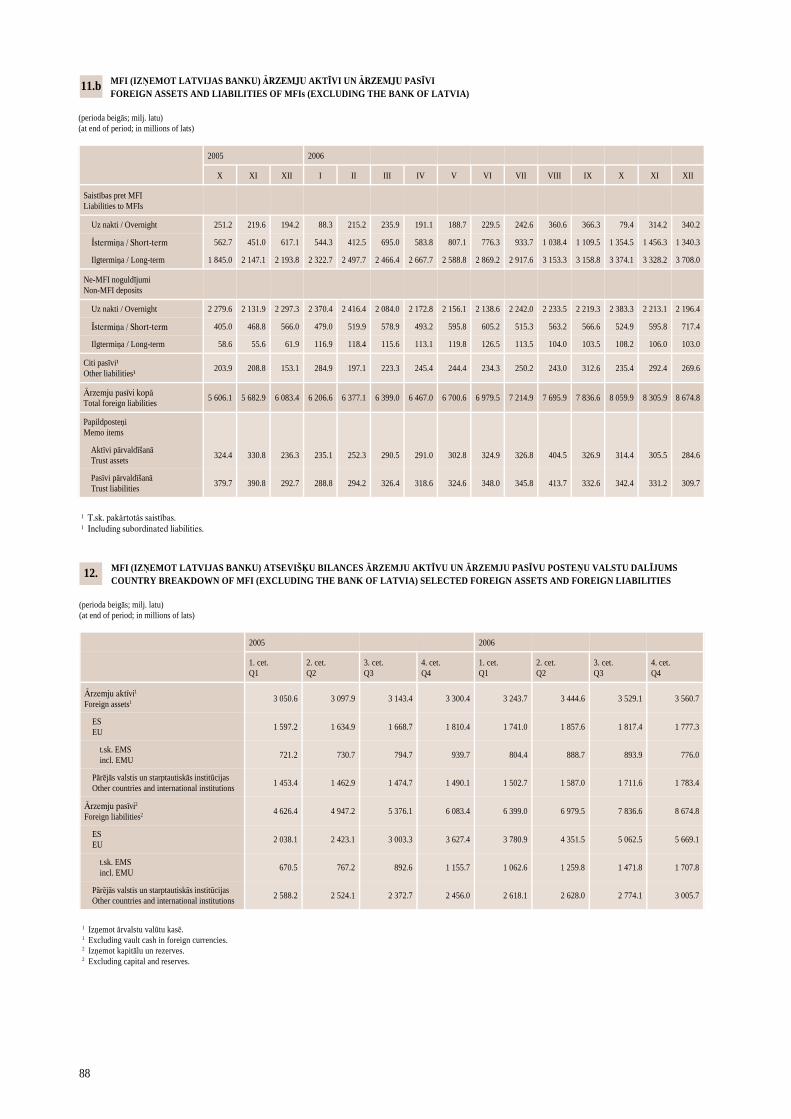
88
MFI (IZŅEMOT LATVIJAS BANKU) ĀRZEMJU AKTĪVI UN ĀRZEMJU PASĪVI FOREIGN ASSETS AND LIABILITIES OF MFIs (EXCLUDING THE BANK OF LATVIA) (perioda beigās; milj. latu) (at end of period; in millions of lats)
2005 2006
X XI XII I II III IV V VI VII VIII IX
Saistības pret MFI Liabilities to MFIs
Uz nakti / Overnight 251.2 219.6 194.2 88.3 215.2 235.9 191.1 188.7 229.5 242.6 360.6 366.3
Īstermiņa / Short-term 562.7 451.0 617.1 544.3 412.5 695.0 583.8 807.1 776.3 933.7 1 038.4 1 109.5
Ilgtermiņa / Long-term 1 845.0 2 147.1 2 193.8 2 322.7 2 497.7 2 466.4 2 667.7 2 588.8 2 869.2 2 917.6 3 153.3 3 158.8
Ne-MFI noguldījumi Non-MFI deposits
Uz nakti / Overnight 2 279.6 2 131.9 2 297.3 2 370.4 2 416.4 2 084.0 2 172.8 2 156.1 2 138.6 2 242.0 2 233.5 2 219.3
Īstermiņa / Short-term 405.0 468.8 566.0 479.0 519.9 578.9 493.2 595.8 605.2 515.3 563.2 566.6
Ilgtermiņa / Long-term 58.6 55.6 61.9 116.9 118.4 115.6 113.1 119.8 126.5 113.5 104.0 103.5
Citi pasīvi¹ Other liabilities¹ 203.9 208.8 153.1 284.9 197.1 223.3 245.4 244.4 234.3 250.2 243.0 312.6
Ārzemju pasīvi kopā Total foreign liabilities
5 606.1 5 682.9 6 083.4 6 206.6 6 377.1 6 399.0 6 467.0 6 700.6 6 979.5 7 214.9 7 695.9 7 836.6
Papildposteņi Memo items
Aktīvi pārvaldīšanā Trust assets 324.4 330.8 236.3 235.1 252.3 290.5 291.0 302.8 324.9 326.8 404.5 326.9
Pasīvi pārvaldīšanā Trust liabilities 379.7 390.8 292.7 288.8 294.2 326.4 318.6 324.6 348.0 345.8 413.7 332.6
¹ T.sk. pakārtotās saistības. ¹ Including subordinated liabilities.
X XI XII
79.4 314.2 340.2
1 354.5 1 456.3 1 340.3
3 374.1 3 328.2 3 708.0
2 383.3 2 213.1 2 196.4
524.9 595.8 717.4
108.2 106.0 103.0
235.4 292.4 269.6
8 059.9 8 305.9 8 674.8
314.4 305.5 284.6
342.4 331.2 309.7
11.b
MFI (IZŅEMOT LATVIJAS BANKU) ATSEVIŠĶU BILANCES ĀRZEMJU AKTĪVU UN ĀRZEMJU PASĪVU POSTEŅU VALSTU DALĪJUMS COUNTRY BREAKDOWN OF MFI (EXCLUDING THE BANK OF LATVIA) SELECTED FOREIGN ASSETS AND FOREIGN LIABILITIES (perioda beigās; milj. latu) (at end of period; in millions of lats)
2005 2006
1. cet. Q1
2. cet. Q2
3. cet. Q3
4. cet. Q4
1. cet. Q1
Ārzemju aktīvi1
Foreign assets1 3 050.6 3 097.9 3 143.4 3 300.4 3 243.7
ES EU 1 597.2 1 634.9 1 668.7 1 810.4 1 741.0
t.sk. EMS incl. EMU 721.2 730.7 794.7 939.7 804.4
Pārējās valstis un starptautiskās institūcijas Other countries and international institutions 1 453.4 1 462.9 1 474.7 1 490.1 1 502.7
Ārzemju pasīvi2
Foreign liabilities2 4 626.4 4 947.2 5 376.1 6 083.4 6 399.0
ES EU 2 038.1 2 423.1 3 003.3 3 627.4 3 780.9
t.sk. EMS incl. EMU 670.5 767.2 892.6 1 155.7 1 062.6
Pārējās valstis un starptautiskās institūcijas Other countries and international institutions 2 588.2 2 524.1 2 372.7 2 456.0 2 618.1
1 Izņemot ārvalstu valūtu kasē. 1 Excluding vault cash in foreign currencies. 2 Izņemot kapitālu un rezerves. 2 Excluding capital and reserves.
2. cet. Q2
3 444.6
1 857.6
888.7
1 587.0
6 979.5
4 351.5
1 259.8
2 628.0
3. cet. Q3
3 529.1
1 817.4
893.9
1 711.6
7 836.6
5 062.5
1 471.8
2 774.1
4. cet. Q4
3 560.7
1 777.3
776.0
1 783.4
8 674.8
5 669.1
1 707.8
3 005.7
12.
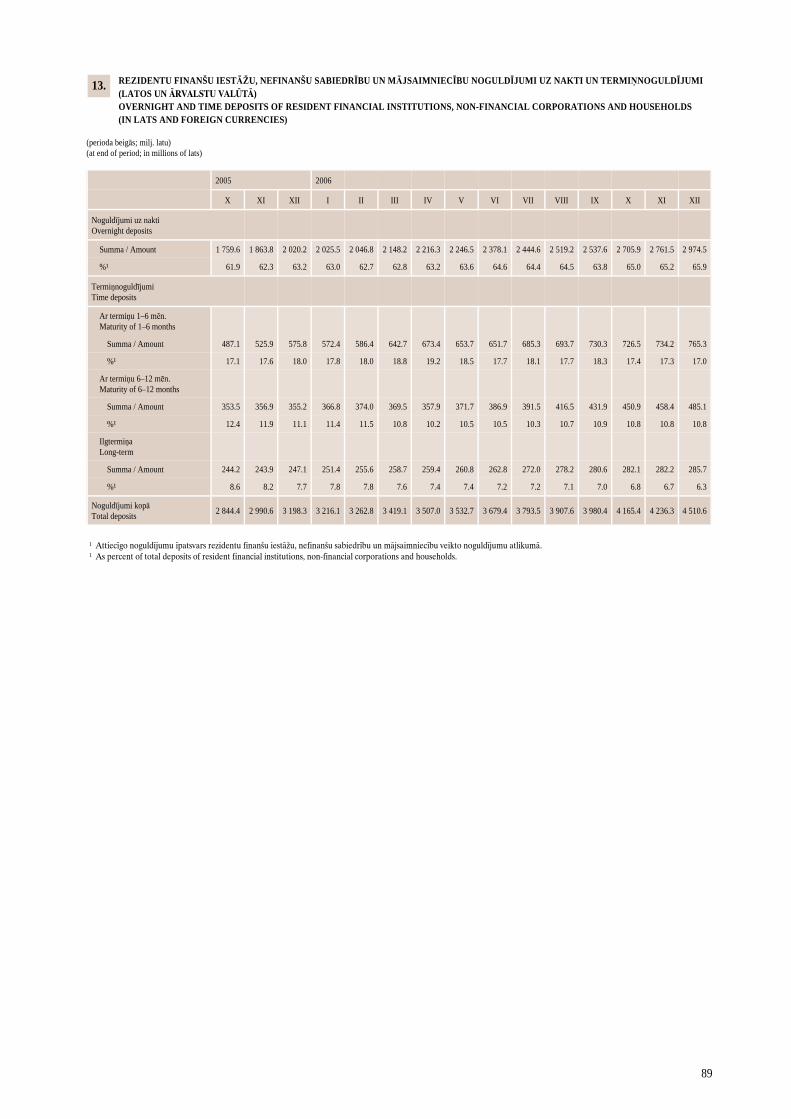
89
REZIDENTU FINANŠU IESTĀŽU, NEFINANŠU SABIEDRĪBU UN MĀJSAIMNIECĪBU NOGULDĪJUMI UZ NAKTI UN TERMIŅNOGULDĪJUMI (LATOS UN ĀRVALSTU VALŪTĀ) OVERNIGHT AND TIME DEPOSITS OF RESIDENT FINANCIAL INSTITUTIONS, NON-FINANCIAL CORPORATIONS AND HOUSEHOLDS (IN LATS AND FOREIGN CURRENCIES) (perioda beigās; milj. latu) (at end of period; in millions of lats)
2005 2006
X XI XII I II III IV V VI VII VIII IX
Noguldījumi uz nakti Overnight deposits
Summa / Amount 1 759.6 1 863.8 2 020.2 2 025.5 2 046.8 2 148.2 2 216.3 2 246.5 2 378.1 2 444.6 2 519.2 2 537.6
%¹ 61.9 62.3 63.2 63.0 62.7 62.8 63.2 63.6 64.6 64.4 64.5 63.8
Termiņnoguldījumi Time deposits
Ar termiņu 1–6 mēn. Maturity of 1–6 months
Summa / Amount 487.1 525.9 575.8 572.4 586.4 642.7 673.4 653.7 651.7 685.3 693.7 730.3
%¹ 17.1 17.6 18.0 17.8 18.0 18.8 19.2 18.5 17.7 18.1 17.7 18.3
Ar termiņu 6–12 mēn. Maturity of 6–12 months
Summa / Amount 353.5 356.9 355.2 366.8 374.0 369.5 357.9 371.7 386.9 391.5 416.5 431.9
%¹ 12.4 11.9 11.1 11.4 11.5 10.8 10.2 10.5 10.5 10.3 10.7 10.9
Ilgtermiņa Long-term
Summa / Amount 244.2 243.9 247.1 251.4 255.6 258.7 259.4 260.8 262.8 272.0 278.2 280.6
%¹ 8.6 8.2 7.7 7.8 7.8 7.6 7.4 7.4 7.2 7.2 7.1 7.0
Noguldījumi kopā Total deposits 2 844.4 2 990.6 3 198.3 3 216.1 3 262.8 3 419.1 3 507.0 3 532.7 3 679.4 3 793.5 3 907.6 3 980.4
¹ Attiecīgo noguldījumu īpatsvars rezidentu finanšu iestāžu, nefinanšu sabiedrību un mājsaimniecību veikto noguldījumu atlikumā. ¹ As percent of total deposits of resident financial institutions, non-financial corporations and households.
X XI XII
2 705.9 2 761.5 2 974.5
65.0 65.2 65.9
726.5 734.2 765.3
17.4 17.3 17.0
450.9 458.4 485.1
10.8 10.8 10.8
282.1 282.2 285.7
6.8 6.7 6.3
4 165.4 4 236.3 4 510.6
13.
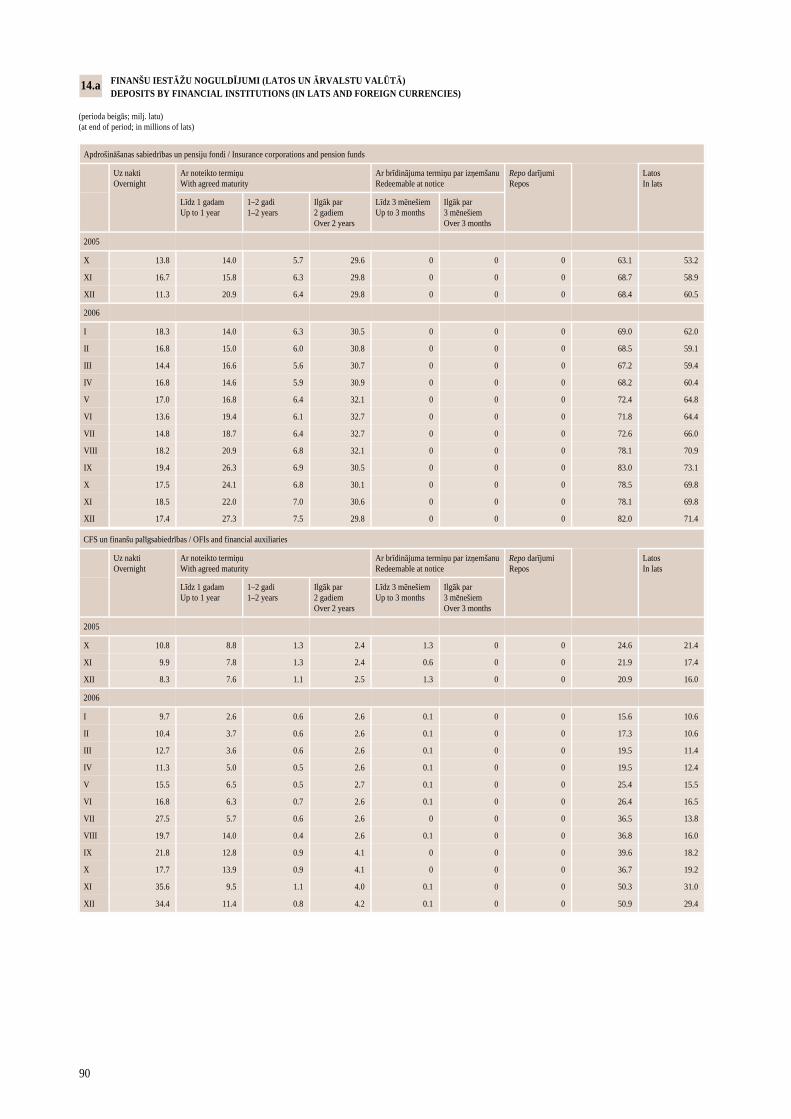
90
CFS un finanšu palīgsabiedrības / OFIs and financial auxiliaries
Uz nakti Overnight
Ar noteikto termiņu With agreed maturity
Ar brīdinājuma termiņu par izņemšanu Redeemable at notice
Repo darījumi Repos
Latos In lats
Līdz 1 gadam Up to 1 year
1–2 gadi 1–2 years
Ilgāk par 2 gadiem Over 2 years
Līdz 3 mēnešiem Up to 3 months
Ilgāk par 3 mēnešiem Over 3 months
2005
X 10.8 8.8 1.3 2.4 1.3 0 0 24.6 21.4
XI 9.9 7.8 1.3 2.4 0.6 0 0 21.9 17.4
XII 8.3 7.6 1.1 2.5 1.3 0 0 20.9 16.0
2006
I 9.7 2.6 0.6 2.6 0.1 0 0 15.6 10.6
II 10.4 3.7 0.6 2.6 0.1 0 0 17.3 10.6
III 12.7 3.6 0.6 2.6 0.1 0 0 19.5 11.4
IV 11.3 5.0 0.5 2.6 0.1 0 0 19.5 12.4
V 15.5 6.5 0.5 2.7 0.1 0 0 25.4 15.5
VI 16.8 6.3 0.7 2.6 0.1 0 0 26.4 16.5
VII 27.5 5.7 0.6 2.6 0 0 0 36.5 13.8
VIII 19.7 14.0 0.4 2.6 0.1 0 0 36.8 16.0
IX 21.8 12.8 0.9 4.1 0 0 0 39.6 18.2
X 17.7 13.9 0.9 4.1 0 0 0 36.7 19.2
XI 35.6 9.5 1.1 4.0 0.1 0 0 50.3 31.0
XII 34.4 11.4 0.8 4.2 0.1 0 0 50.9 29.4
FINANŠU IESTĀŽU NOGULDĪJUMI (LATOS UN ĀRVALSTU VALŪTĀ) DEPOSITS BY FINANCIAL INSTITUTIONS (IN LATS AND FOREIGN CURRENCIES) (perioda beigās; milj. latu) (at end of period; in millions of lats)
Apdrošināšanas sabiedrības un pensiju fondi / Insurance corporations and pension funds
Uz nakti Overnight
Ar noteikto termiņu With agreed maturity
Ar brīdinājuma termiņu par izņemšanu Redeemable at notice
Repo darījumi Repos
Latos In lats
Līdz 1 gadam Up to 1 year
1–2 gadi 1–2 years
Ilgāk par 2 gadiem Over 2 years
Līdz 3 mēnešiem Up to 3 months
Ilgāk par 3 mēnešiem Over 3 months
2005
X 13.8 14.0 5.7 29.6 0 0 0 63.1 53.2
XI 16.7 15.8 6.3 29.8 0 0 0 68.7 58.9
XII 11.3 20.9 6.4 29.8 0 0 0 68.4 60.5
2006
I 18.3 14.0 6.3 30.5 0 0 0 69.0 62.0
II 16.8 15.0 6.0 30.8 0 0 0 68.5 59.1
III 14.4 16.6 5.6 30.7 0 0 0 67.2 59.4
IV 16.8 14.6 5.9 30.9 0 0 0 68.2 60.4
V 17.0 16.8 6.4 32.1 0 0 0 72.4 64.8
VI 13.6 19.4 6.1 32.7 0 0 0 71.8 64.4
VII 14.8 18.7 6.4 32.7 0 0 0 72.6 66.0
VIII 18.2 20.9 6.8 32.1 0 0 0 78.1 70.9
IX 19.4 26.3 6.9 30.5 0 0 0 83.0 73.1
X 17.5 24.1 6.8 30.1 0 0 0 78.5 69.8
XI 18.5 22.0 7.0 30.6 0 0 0 78.1 69.8
XII 17.4 27.3 7.5 29.8 0 0 0 82.0 71.4
14.a
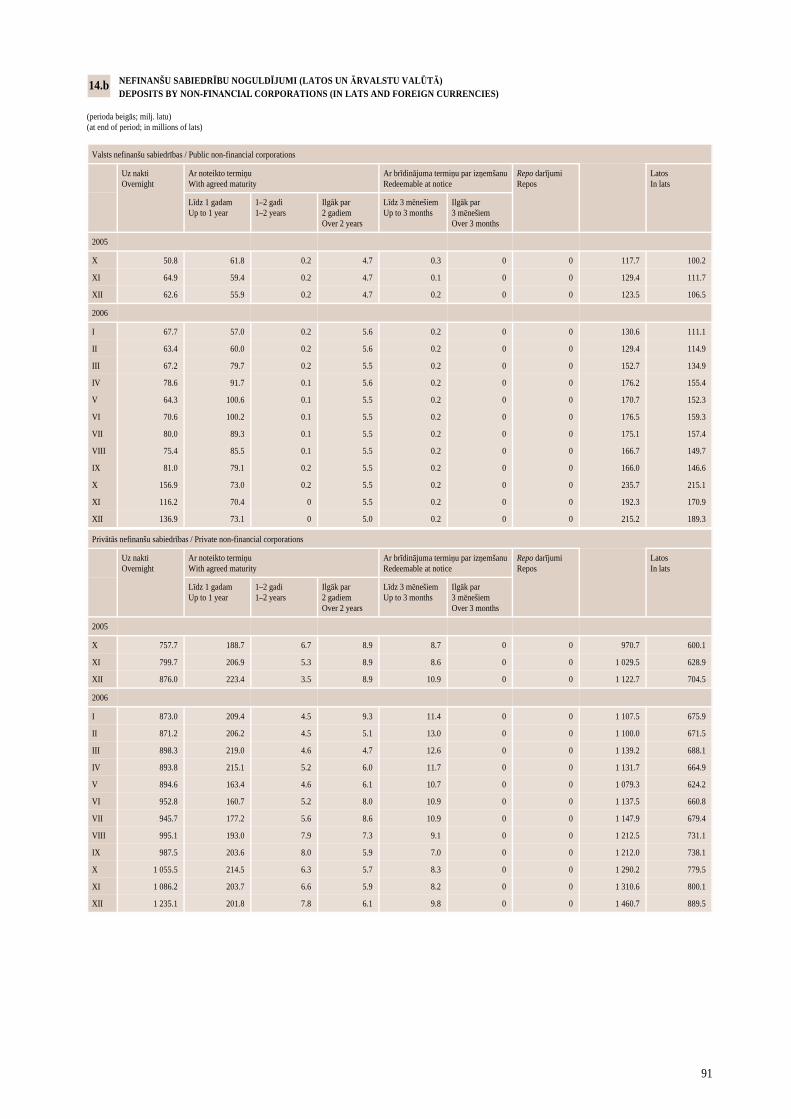
91
Privātās nefinanšu sabiedrības / Private non-financial corporations
Uz nakti Overnight
Ar noteikto termiņu With agreed maturity
Ar brīdinājuma termiņu par izņemšanu Redeemable at notice
Repo darījumi Repos
Latos In lats
Līdz 1 gadam Up to 1 year
1–2 gadi 1–2 years
Ilgāk par 2 gadiem Over 2 years
Līdz 3 mēnešiem Up to 3 months
Ilgāk par 3 mēnešiem Over 3 months
2005
X 757.7 188.7 6.7 8.9 8.7 0 0 970.7 600.1
XI 799.7 206.9 5.3 8.9 8.6 0 0 1 029.5 628.9
XII 876.0 223.4 3.5 8.9 10.9 0 0 1 122.7 704.5
2006
I 873.0 209.4 4.5 9.3 11.4 0 0 1 107.5 675.9
II 871.2 206.2 4.5 5.1 13.0 0 0 1 100.0 671.5
III 898.3 219.0 4.6 4.7 12.6 0 0 1 139.2 688.1
IV 893.8 215.1 5.2 6.0 11.7 0 0 1 131.7 664.9
V 894.6 163.4 4.6 6.1 10.7 0 0 1 079.3 624.2
VI 952.8 160.7 5.2 8.0 10.9 0 0 1 137.5 660.8
VII 945.7 177.2 5.6 8.6 10.9 0 0 1 147.9 679.4
VIII 995.1 193.0 7.9 7.3 9.1 0 0 1 212.5 731.1
IX 987.5 203.6 8.0 5.9 7.0 0 0 1 212.0 738.1
X 1 055.5 214.5 6.3 5.7 8.3 0 0 1 290.2 779.5
XI 1 086.2 203.7 6.6 5.9 8.2 0 0 1 310.6 800.1
XII 1 235.1 201.8 7.8 6.1 9.8 0 0 1 460.7 889.5
NEFINANŠU SABIEDRĪBU NOGULDĪJUMI (LATOS UN ĀRVALSTU VALŪTĀ) DEPOSITS BY NON-FINANCIAL CORPORATIONS (IN LATS AND FOREIGN CURRENCIES) (perioda beigās; milj. latu) (at end of period; in millions of lats)
Valsts nefinanšu sabiedrības / Public non-financial corporations
Uz nakti Overnight
Ar noteikto termiņu With agreed maturity
Ar brīdinājuma termiņu par izņemšanu Redeemable at notice
Repo darījumi Repos
Latos In lats
Līdz 1 gadam Up to 1 year
1–2 gadi 1–2 years
Ilgāk par 2 gadiem Over 2 years
Līdz 3 mēnešiem Up to 3 months
Ilgāk par 3 mēnešiem Over 3 months
2005
X 50.8 61.8 0.2 4.7 0.3 0 0 117.7 100.2
XI 64.9 59.4 0.2 4.7 0.1 0 0 129.4 111.7
XII 62.6 55.9 0.2 4.7 0.2 0 0 123.5 106.5
2006
I 67.7 57.0 0.2 5.6 0.2 0 0 130.6 111.1
II 63.4 60.0 0.2 5.6 0.2 0 0 129.4 114.9
III 67.2 79.7 0.2 5.5 0.2 0 0 152.7 134.9
IV 78.6 91.7 0.1 5.6 0.2 0 0 176.2 155.4
V 64.3 100.6 0.1 5.5 0.2 0 0 170.7 152.3
VI 70.6 100.2 0.1 5.5 0.2 0 0 176.5 159.3
VII 80.0 89.3 0.1 5.5 0.2 0 0 175.1 157.4
VIII 75.4 85.5 0.1 5.5 0.2 0 0 166.7 149.7
IX 81.0 79.1 0.2 5.5 0.2 0 0 166.0 146.6
X 156.9 73.0 0.2 5.5 0.2 0 0 235.7 215.1
XI 116.2 70.4 0 5.5 0.2 0 0 192.3 170.9
XII 136.9 73.1 0 5.0 0.2 0 0 215.2 189.3
14.b
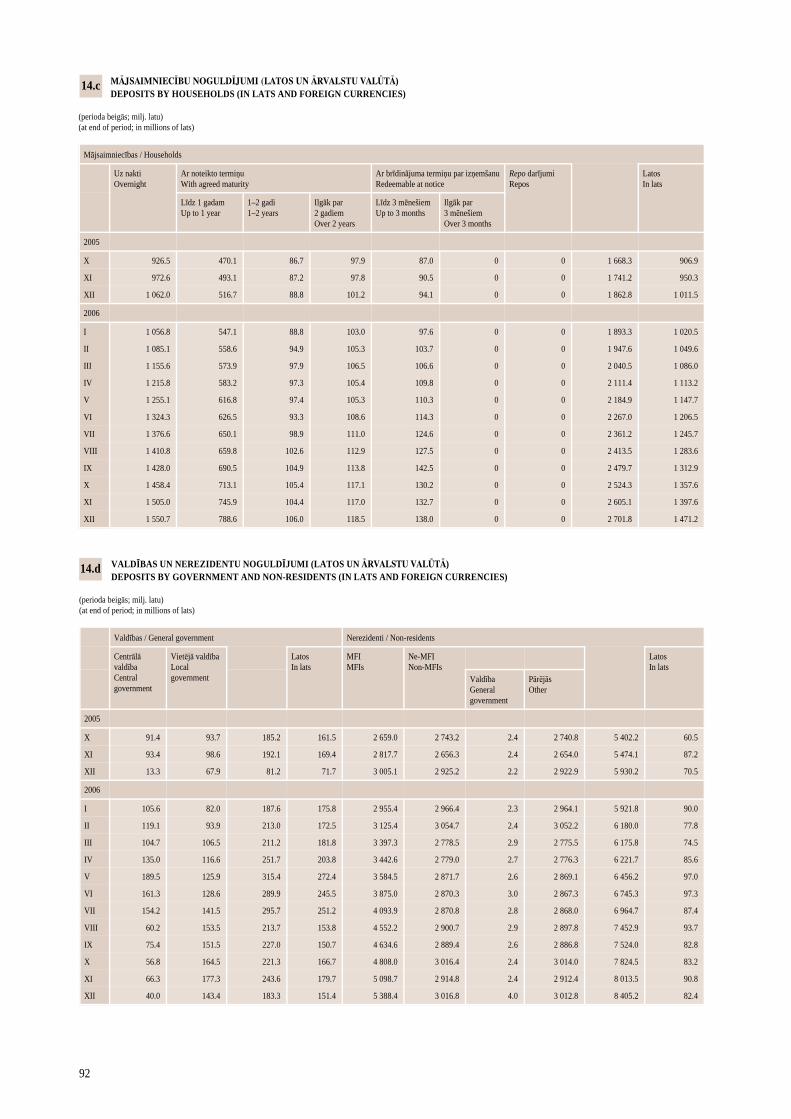
92
MĀJSAIMNIECĪBU NOGULDĪJUMI (LATOS UN ĀRVALSTU VALŪTĀ) DEPOSITS BY HOUSEHOLDS (IN LATS AND FOREIGN CURRENCIES) (perioda beigās; milj. latu) (at end of period; in millions of lats)
Mājsaimniecības / Households
Uz nakti Overnight
Ar noteikto termiņu With agreed maturity
Ar brīdinājuma termiņu par izņemšanu Redeemable at notice
Repo darījumi Repos
Latos In lats
Līdz 1 gadam Up to 1 year
1–2 gadi 1–2 years
Ilgāk par 2 gadiem Over 2 years
Līdz 3 mēnešiem Up to 3 months
Ilgāk par 3 mēnešiem Over 3 months
2005
X 926.5 470.1 86.7 97.9 87.0 0 0 1 668.3 906.9
XI 972.6 493.1 87.2 97.8 90.5 0 0 1 741.2 950.3
XII 1 062.0 516.7 88.8 101.2 94.1 0 0 1 862.8 1 011.5
2006
I 1 056.8 547.1 88.8 103.0 97.6 0 0 1 893.3 1 020.5
II 1 085.1 558.6 94.9 105.3 103.7 0 0 1 947.6 1 049.6
III 1 155.6 573.9 97.9 106.5 106.6 0 0 2 040.5 1 086.0
IV 1 215.8 583.2 97.3 105.4 109.8 0 0 2 111.4 1 113.2
V 1 255.1 616.8 97.4 105.3 110.3 0 0 2 184.9 1 147.7
VI 1 324.3 626.5 93.3 108.6 114.3 0 0 2 267.0 1 206.5
VII 1 376.6 650.1 98.9 111.0 124.6 0 0 2 361.2 1 245.7
VIII 1 410.8 659.8 102.6 112.9 127.5 0 0 2 413.5 1 283.6
IX 1 428.0 690.5 104.9 113.8 142.5 0 0 2 479.7 1 312.9
X 1 458.4 713.1 105.4 117.1 130.2 0 0 2 524.3 1 357.6
XI 1 505.0 745.9 104.4 117.0 132.7 0 0 2 605.1 1 397.6
XII 1 550.7 788.6 106.0 118.5 138.0 0 0 2 701.8 1 471.2
14.c
VALDĪBAS UN NEREZIDENTU NOGULDĪJUMI (LATOS UN ĀRVALSTU VALŪTĀ) DEPOSITS BY GOVERNMENT AND NON-RESIDENTS (IN LATS AND FOREIGN CURRENCIES) (perioda beigās; milj. latu) (at end of period; in millions of lats)
Valdības / General government Nerezidenti / Non-residents
Centrālā valdība Central government
Vietējā valdība Local government
Latos In lats
MFI MFIs
Ne-MFI Non-MFIs
Latos In lats
Valdība General government
Pārējās Other
2005
X 91.4 93.7 185.2 161.5 2 659.0 2 743.2 2.4 2 740.8 5 402.2 60.5
XI 93.4 98.6 192.1 169.4 2 817.7 2 656.3 2.4 2 654.0 5 474.1 87.2
XII 13.3 67.9 81.2 71.7 3 005.1 2 925.2 2.2 2 922.9 5 930.2 70.5
2006
I 105.6 82.0 187.6 175.8 2 955.4 2 966.4 2.3 2 964.1 5 921.8 90.0
II 119.1 93.9 213.0 172.5 3 125.4 3 054.7 2.4 3 052.2 6 180.0 77.8
III 104.7 106.5 211.2 181.8 3 397.3 2 778.5 2.9 2 775.5 6 175.8 74.5
IV 135.0 116.6 251.7 203.8 3 442.6 2 779.0 2.7 2 776.3 6 221.7 85.6
V 189.5 125.9 315.4 272.4 3 584.5 2 871.7 2.6 2 869.1 6 456.2 97.0
VI 161.3 128.6 289.9 245.5 3 875.0 2 870.3 3.0 2 867.3 6 745.3 97.3
VII 154.2 141.5 295.7 251.2 4 093.9 2 870.8 2.8 2 868.0 6 964.7 87.4
VIII 60.2 153.5 213.7 153.8 4 552.2 2 900.7 2.9 2 897.8 7 452.9 93.7
IX 75.4 151.5 227.0 150.7 4 634.6 2 889.4 2.6 2 886.8 7 524.0 82.8
X 56.8 164.5 221.3 166.7 4 808.0 3 016.4 2.4 3 014.0 7 824.5 83.2
XI 66.3 177.3 243.6 179.7 5 098.7 2 914.8 2.4 2 912.4 8 013.5 90.8
XII 40.0 143.4 183.3 151.4 5 388.4 3 016.8 4.0 3 012.8 8 405.2 82.4
14.d
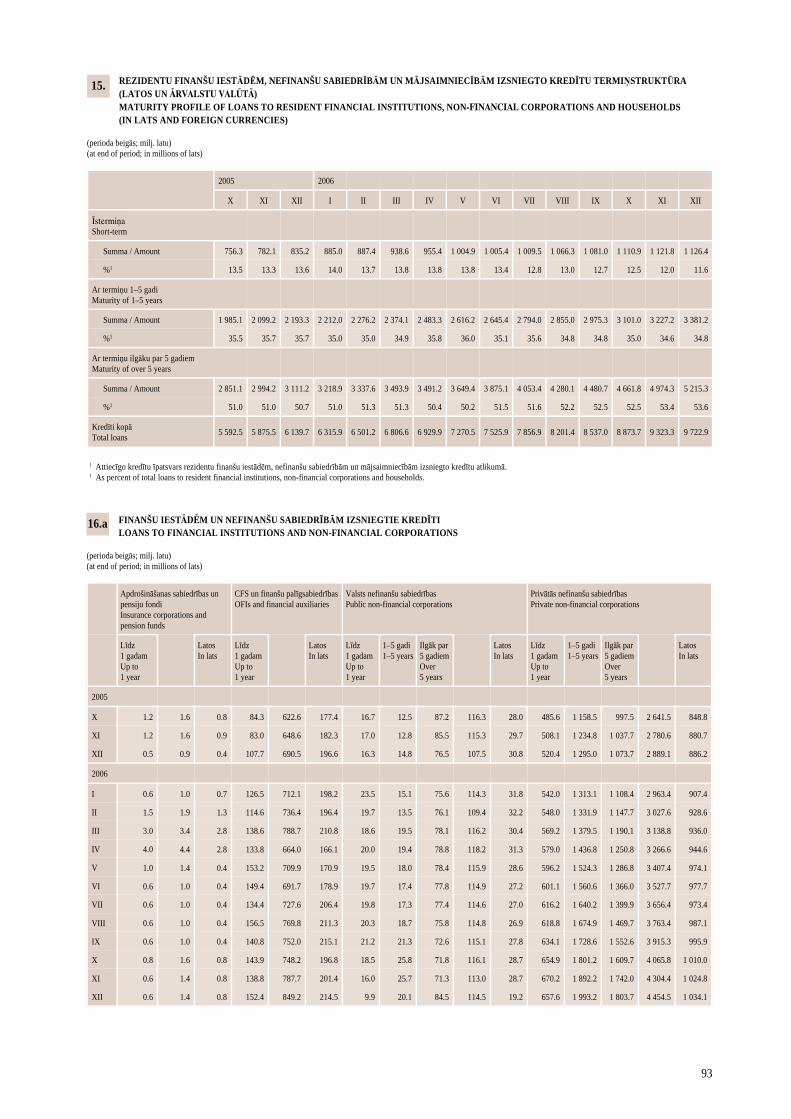
93
REZIDENTU FINANŠU IESTĀDĒM, NEFINANŠU SABIEDRĪBĀM UN MĀJSAIMNIECĪBĀM IZSNIEGTO KREDĪTU TERMIŅSTRUKTŪRA (LATOS UN ĀRVALSTU VALŪTĀ) MATURITY PROFILE OF LOANS TO RESIDENT FINANCIAL INSTITUTIONS, NON-FINANCIAL CORPORATIONS AND HOUSEHOLDS (IN LATS AND FOREIGN CURRENCIES) (perioda beigās; milj. latu) (at end of period; in millions of lats)
2005 2006
X XI XII I II III IV V VI VII VIII IX
Īstermiņa Short-term
Summa / Amount 756.3 782.1 835.2 885.0 887.4 938.6 955.4 1 004.9 1 005.4 1 009.5 1 066.3 1 081.0
%1 13.5 13.3 13.6 14.0 13.7 13.8 13.8 13.8 13.4 12.8 13.0 12.7
Ar termiņu 1–5 gadi Maturity of 1–5 years
Summa / Amount 1 985.1 2 099.2 2 193.3 2 212.0 2 276.2 2 374.1 2 483.3 2 616.2 2 645.4 2 794.0 2 855.0 2 975.3
%1 35.5 35.7 35.7 35.0 35.0 34.9 35.8 36.0 35.1 35.6 34.8 34.8
Ar termiņu ilgāku par 5 gadiem Maturity of over 5 years
Summa / Amount 2 851.1 2 994.2 3 111.2 3 218.9 3 337.6 3 493.9 3 491.2 3 649.4 3 875.1 4 053.4 4 280.1 4 480.7
%1 51.0 51.0 50.7 51.0 51.3 51.3 50.4 50.2 51.5 51.6 52.2 52.5
Kredīti kopā Total loans
5 592.5 5 875.5 6 139.7 6 315.9 6 501.2 6 806.6 6 929.9 7 270.5 7 525.9 7 856.9 8 201.4 8 537.0
1 Attiecīgo kredītu īpatsvars rezidentu finanšu iestādēm, nefinanšu sabiedrībām un mājsaimniecībām izsniegto kredītu atlikumā. 1 As percent of total loans to resident financial institutions, non-financial corporations and households.
X XI XII
1 110.9 1 121.8 1 126.4
12.5 12.0 11.6
3 101.0 3 227.2 3 381.2
35.0 34.6 34.8
4 661.8 4 974.3 5 215.3
52.5 53.4 53.6
8 873.7 9 323.3 9 722.9
15.
FINANŠU IESTĀDĒM UN NEFINANŠU SABIEDRĪBĀM IZSNIEGTIE KREDĪTI LOANS TO FINANCIAL INSTITUTIONS AND NON-FINANCIAL CORPORATIONS (perioda beigās; milj. latu) (at end of period; in millions of lats)
Apdrošināšanas sabiedrības un pensiju fondi Insurance corporations and pension funds
CFS un finanšu palīgsabiedrības OFIs and financial auxiliaries
Valsts nefinanšu sabiedrības Public non-financial corporations
Privātās nefinanšu sabiedrības Private non-financial corporations
Līdz 1 gadam Up to 1 year
Latos In lats
Līdz 1 gadam Up to 1 year
Latos In lats
Līdz 1 gadam Up to 1 year
1–5 gadi 1–5 years
Ilgāk par 5 gadiem Over 5 years
Latos In lats
Līdz 1 gadam Up to 1 year
1–5 gadi 1–5 years
Ilgāk par 5 gadiem Over 5 years
Latos In lats
2005
X 1.2 1.6 0.8 84.3 622.6 177.4 16.7 12.5 87.2 116.3 28.0 485.6 1 158.5 997.5 2 641.5 848.8
XI 1.2 1.6 0.9 83.0 648.6 182.3 17.0 12.8 85.5 115.3 29.7 508.1 1 234.8 1 037.7 2 780.6 880.7
XII 0.5 0.9 0.4 107.7 690.5 196.6 16.3 14.8 76.5 107.5 30.8 520.4 1 295.0 1 073.7 2 889.1 886.2
2006
I 0.6 1.0 0.7 126.5 712.1 198.2 23.5 15.1 75.6 114.3 31.8 542.0 1 313.1 1 108.4 2 963.4 907.4
II 1.5 1.9 1.3 114.6 736.4 196.4 19.7 13.5 76.1 109.4 32.2 548.0 1 331.9 1 147.7 3 027.6 928.6
III 3.0 3.4 2.8 138.6 788.7 210.8 18.6 19.5 78.1 116.2 30.4 569.2 1 379.5 1 190.1 3 138.8 936.0
IV 4.0 4.4 2.8 133.8 664.0 166.1 20.0 19.4 78.8 118.2 31.3 579.0 1 436.8 1 250.8 3 266.6 944.6
V 1.0 1.4 0.4 153.2 709.9 170.9 19.5 18.0 78.4 115.9 28.6 596.2 1 524.3 1 286.8 3 407.4 974.1
VI 0.6 1.0 0.4 149.4 691.7 178.9 19.7 17.4 77.8 114.9 27.2 601.1 1 560.6 1 366.0 3 527.7 977.7
VII 0.6 1.0 0.4 134.4 727.6 206.4 19.8 17.3 77.4 114.6 27.0 616.2 1 640.2 1 399.9 3 656.4 973.4
VIII 0.6 1.0 0.4 156.5 769.8 211.3 20.3 18.7 75.8 114.8 26.9 618.8 1 674.9 1 469.7 3 763.4 987.1
IX 0.6 1.0 0.4 140.8 752.0 215.1 21.2 21.3 72.6 115.1 27.8 634.1 1 728.6 1 552.6 3 915.3 995.9
X 0.8 1.6 0.8 143.9 748.2 196.8 18.5 25.8 71.8 116.1 28.7 654.9 1 801.2 1 609.7 4 065.8 1 010.0
XI 0.6 1.4 0.8 138.8 787.7 201.4 16.0 25.7 71.3 113.0 28.7 670.2 1 892.2 1 742.0 4 304.4 1 024.8
XII 0.6 1.4 0.8 152.4 849.2 214.5 9.9 20.1 84.5 114.5 19.2 657.6 1 993.2 1 803.7 4 454.5 1 034.1
16.a
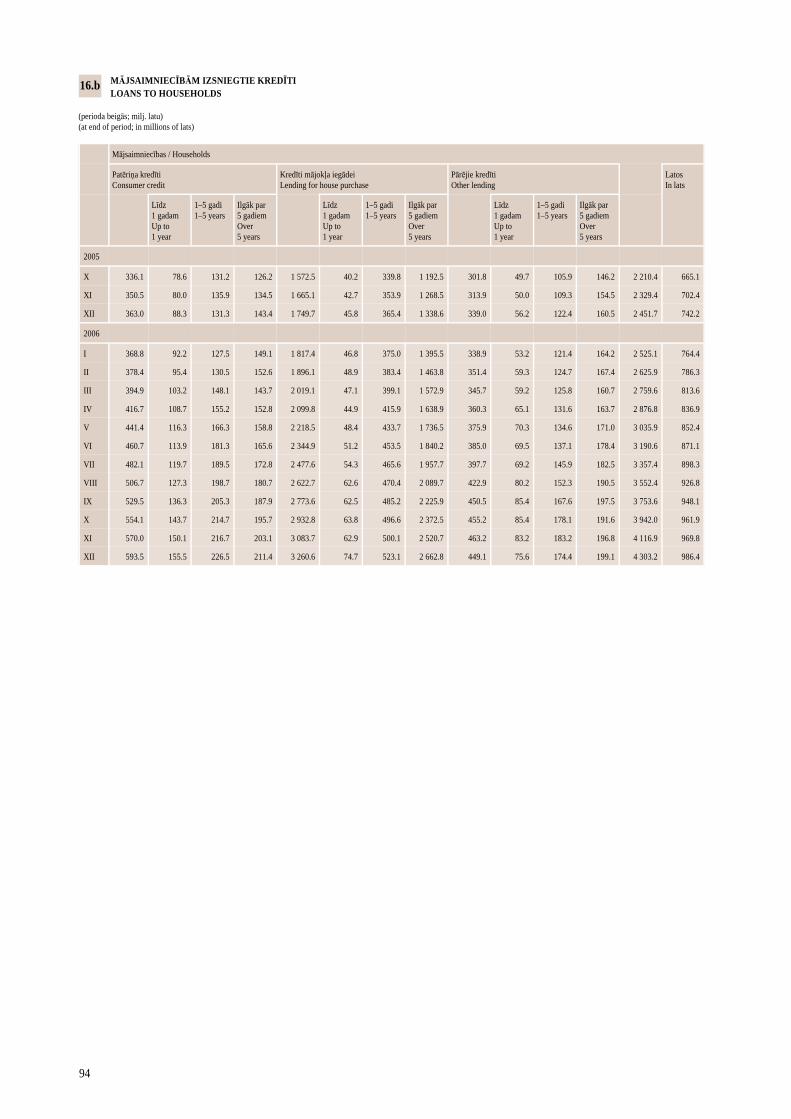
94
MĀJSAIMNIECĪBĀM IZSNIEGTIE KREDĪTI LOANS TO HOUSEHOLDS (perioda beigās; milj. latu) (at end of period; in millions of lats)
Mājsaimniecības / Households
Patēriņa kredīti Consumer credit
Kredīti mājokļa iegādei Lending for house purchase
Pārējie kredīti Other lending
Latos In lats
Līdz 1 gadam Up to 1 year
1–5 gadi 1–5 years
Ilgāk par 5 gadiem Over 5 years
Līdz 1 gadam Up to 1 year
1–5 gadi 1–5 years
Ilgāk par 5 gadiem Over 5 years
Līdz 1 gadam Up to 1 year
1–5 gadi 1–5 years
Ilgāk par 5 gadiem Over 5 years
2005
X 336.1 78.6 131.2 126.2 1 572.5 40.2 339.8 1 192.5 301.8 49.7 105.9 146.2 2 210.4 665.1
XI 350.5 80.0 135.9 134.5 1 665.1 42.7 353.9 1 268.5 313.9 50.0 109.3 154.5 2 329.4 702.4
XII 363.0 88.3 131.3 143.4 1 749.7 45.8 365.4 1 338.6 339.0 56.2 122.4 160.5 2 451.7 742.2
2006
I 368.8 92.2 127.5 149.1 1 817.4 46.8 375.0 1 395.5 338.9 53.2 121.4 164.2 2 525.1 764.4
II 378.4 95.4 130.5 152.6 1 896.1 48.9 383.4 1 463.8 351.4 59.3 124.7 167.4 2 625.9 786.3
III 394.9 103.2 148.1 143.7 2 019.1 47.1 399.1 1 572.9 345.7 59.2 125.8 160.7 2 759.6 813.6
IV 416.7 108.7 155.2 152.8 2 099.8 44.9 415.9 1 638.9 360.3 65.1 131.6 163.7 2 876.8 836.9
V 441.4 116.3 166.3 158.8 2 218.5 48.4 433.7 1 736.5 375.9 70.3 134.6 171.0 3 035.9 852.4
VI 460.7 113.9 181.3 165.6 2 344.9 51.2 453.5 1 840.2 385.0 69.5 137.1 178.4 3 190.6 871.1
VII 482.1 119.7 189.5 172.8 2 477.6 54.3 465.6 1 957.7 397.7 69.2 145.9 182.5 3 357.4 898.3
VIII 506.7 127.3 198.7 180.7 2 622.7 62.6 470.4 2 089.7 422.9 80.2 152.3 190.5 3 552.4 926.8
IX 529.5 136.3 205.3 187.9 2 773.6 62.5 485.2 2 225.9 450.5 85.4 167.6 197.5 3 753.6 948.1
X 554.1 143.7 214.7 195.7 2 932.8 63.8 496.6 2 372.5 455.2 85.4 178.1 191.6 3 942.0 961.9
XI 570.0 150.1 216.7 203.1 3 083.7 62.9 500.1 2 520.7 463.2 83.2 183.2 196.8 4 116.9 969.8
XII 593.5 155.5 226.5 211.4 3 260.6 74.7 523.1 2 662.8 449.1 75.6 174.4 199.1 4 303.2 986.4
16.b
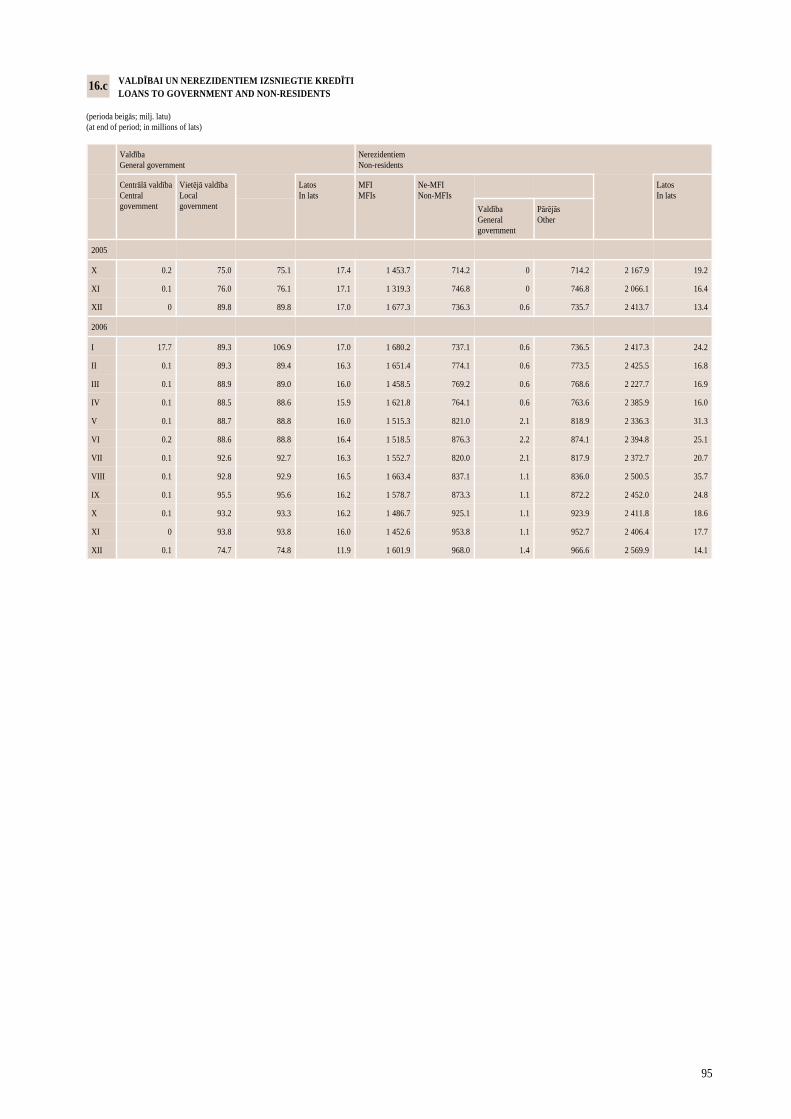
95
VALDĪBAI UN NEREZIDENTIEM IZSNIEGTIE KREDĪTI LOANS TO GOVERNMENT AND NON-RESIDENTS (perioda beigās; milj. latu) (at end of period; in millions of lats)
Valdība General government
Nerezidentiem Non-residents
Centrālā valdība Central government
Vietējā valdība Local government
Latos In lats
MFI MFIs
Ne-MFI Non-MFIs
Latos In lats
Valdība General government
Pārējās Other
2005
X 0.2 75.0 75.1 17.4 1 453.7 714.2 0 714.2 2 167.9 19.2
XI 0.1 76.0 76.1 17.1 1 319.3 746.8 0 746.8 2 066.1 16.4
XII 0 89.8 89.8 17.0 1 677.3 736.3 0.6 735.7 2 413.7 13.4
2006
I 17.7 89.3 106.9 17.0 1 680.2 737.1 0.6 736.5 2 417.3 24.2
II 0.1 89.3 89.4 16.3 1 651.4 774.1 0.6 773.5 2 425.5 16.8
III 0.1 88.9 89.0 16.0 1 458.5 769.2 0.6 768.6 2 227.7 16.9
IV 0.1 88.5 88.6 15.9 1 621.8 764.1 0.6 763.6 2 385.9 16.0
V 0.1 88.7 88.8 16.0 1 515.3 821.0 2.1 818.9 2 336.3 31.3
VI 0.2 88.6 88.8 16.4 1 518.5 876.3 2.2 874.1 2 394.8 25.1
VII 0.1 92.6 92.7 16.3 1 552.7 820.0 2.1 817.9 2 372.7 20.7
VIII 0.1 92.8 92.9 16.5 1 663.4 837.1 1.1 836.0 2 500.5 35.7
IX 0.1 95.5 95.6 16.2 1 578.7 873.3 1.1 872.2 2 452.0 24.8
X 0.1 93.2 93.3 16.2 1 486.7 925.1 1.1 923.9 2 411.8 18.6
XI 0 93.8 93.8 16.0 1 452.6 953.8 1.1 952.7 2 406.4 17.7
XII 0.1 74.7 74.8 11.9 1 601.9 968.0 1.4 966.6 2 569.9 14.1
16.c
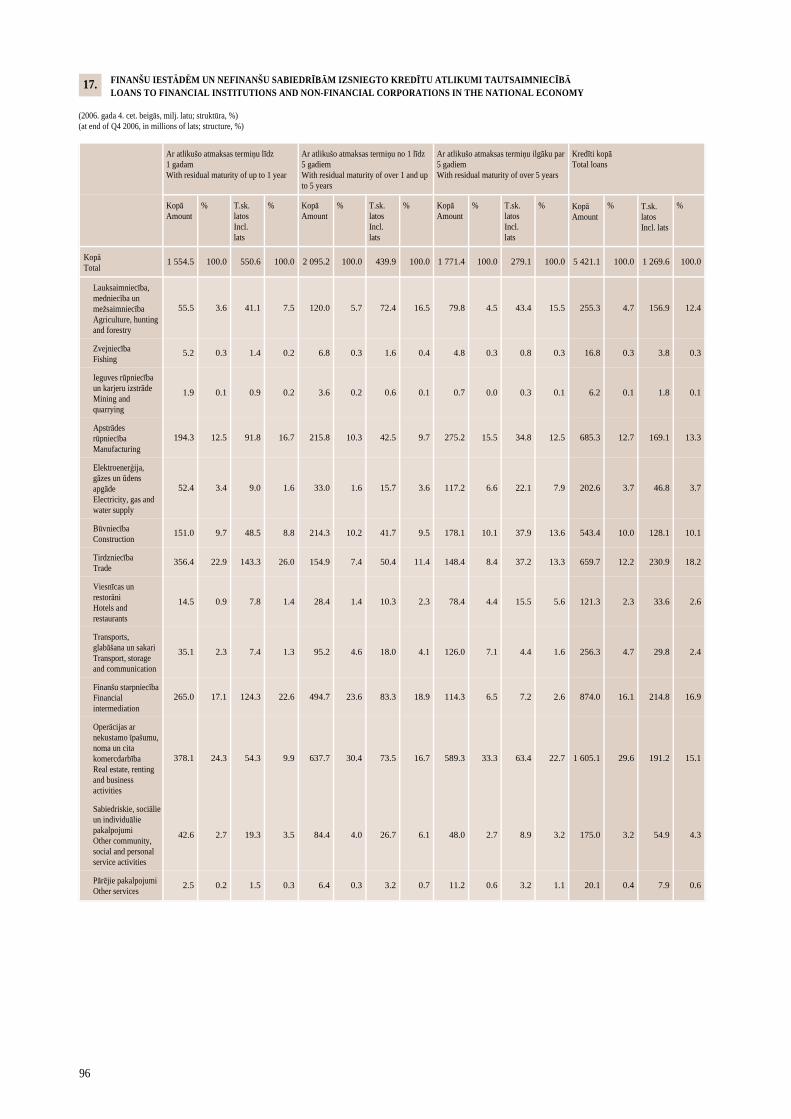
96
FINANŠU IESTĀDĒM UN NEFINANŠU SABIEDRĪBĀM IZSNIEGTO KREDĪTU ATLIKUMI TAUTSAIMNIECĪBĀ LOANS TO FINANCIAL INSTITUTIONS AND NON-FINANCIAL CORPORATIONS IN THE NATIONAL ECONOMY (2006. gada 4. cet. beigās, milj. latu; struktūra, %) (at end of Q4 2006, in millions of lats; structure, %)
Ar atlikušo atmaksas termiņu līdz 1 gadam With residual maturity of up to 1 year
Ar atlikušo atmaksas termiņu no 1 līdz 5 gadiem With residual maturity of over 1 and up to 5 years
Ar atlikušo atmaksas termiņu ilgāku par 5 gadiem With residual maturity of over 5 years
Kopā Amount
% T.sk. latos Incl. lats
% Kopā Amount
% T.sk. latos Incl. lats
% Kopā Amount
% T.sk. latos Incl. lats
% Kopā Amount
% T.sk. latos Incl. lats
%
Kopā Total
1 554.5 100.0 550.6 100.0 2 095.2 100.0 439.9 100.0 1 771.4 100.0 279.1 100.0 5 421.1 100.0 1 269.6 100.0
Lauksaimniecība, medniecība un mežsaimniecība Agriculture, hunting and forestry
55.5 3.6 41.1 7.5 120.0 5.7 72.4 16.5 79.8 4.5 43.4 15.5 255.3 4.7 156.9 12.4
Zvejniecība Fishing
5.2 0.3 1.4 0.2 6.8 0.3 1.6 0.4 4.8 0.3 0.8 0.3 16.8 0.3 3.8 0.3
Ieguves rūpniecība un karjeru izstrāde Mining and quarrying
1.9 0.1 0.9 0.2 3.6 0.2 0.6 0.1 0.7 0.0 0.3 0.1 6.2 0.1 1.8 0.1
Apstrādes rūpniecība Manufacturing
194.3 12.5 91.8 16.7 215.8 10.3 42.5 9.7 275.2 15.5 34.8 12.5 685.3 12.7 169.1 13.3
Elektroenerģija, gāzes un ūdens apgāde Electricity, gas and water supply
52.4 3.4 9.0 1.6 33.0 1.6 15.7 3.6 117.2 6.6 22.1 7.9 202.6 3.7 46.8 3.7
Būvniecība Construction
151.0 9.7 48.5 8.8 214.3 10.2 41.7 9.5 178.1 10.1 37.9 13.6 543.4 10.0 128.1 10.1
Tirdzniecība Trade
356.4 22.9 143.3 26.0 154.9 7.4 50.4 11.4 148.4 8.4 37.2 13.3 659.7 12.2 230.9 18.2
Viesnīcas un restorāni Hotels and restaurants
14.5 0.9 7.8 1.4 28.4 1.4 10.3 2.3 78.4 4.4 15.5 5.6 121.3 2.3 33.6 2.6
Transports, glabāšana un sakari Transport, storage and communication
35.1 2.3 7.4 1.3 95.2 4.6 18.0 4.1 126.0 7.1 4.4 1.6 256.3 4.7 29.8 2.4
Finanšu starpniecība Financial intermediation
265.0 17.1 124.3 22.6 494.7 23.6 83.3 18.9 114.3 6.5 7.2 2.6 874.0 16.1 214.8 16.9
Operācijas ar nekustamo īpašumu, noma un cita komercdarbība Real estate, renting and business activities
378.1 24.3 54.3 9.9 637.7 30.4 73.5 16.7 589.3 33.3 63.4 22.7 1 605.1 29.6 191.2 15.1
Sabiedriskie, sociālie un individuālie pakalpojumi Other community, social and personal service activities
42.6 2.7 19.3 3.5 84.4 4.0 26.7 6.1 48.0 2.7 8.9 3.2 175.0 3.2 54.9 4.3
Pārējie pakalpojumi Other services
2.5 0.2 1.5 0.3 6.4 0.3 3.2 0.7 11.2 0.6 3.2 1.1 20.1 0.4 7.9 0.6
Kredīti kopā Total loans
17.
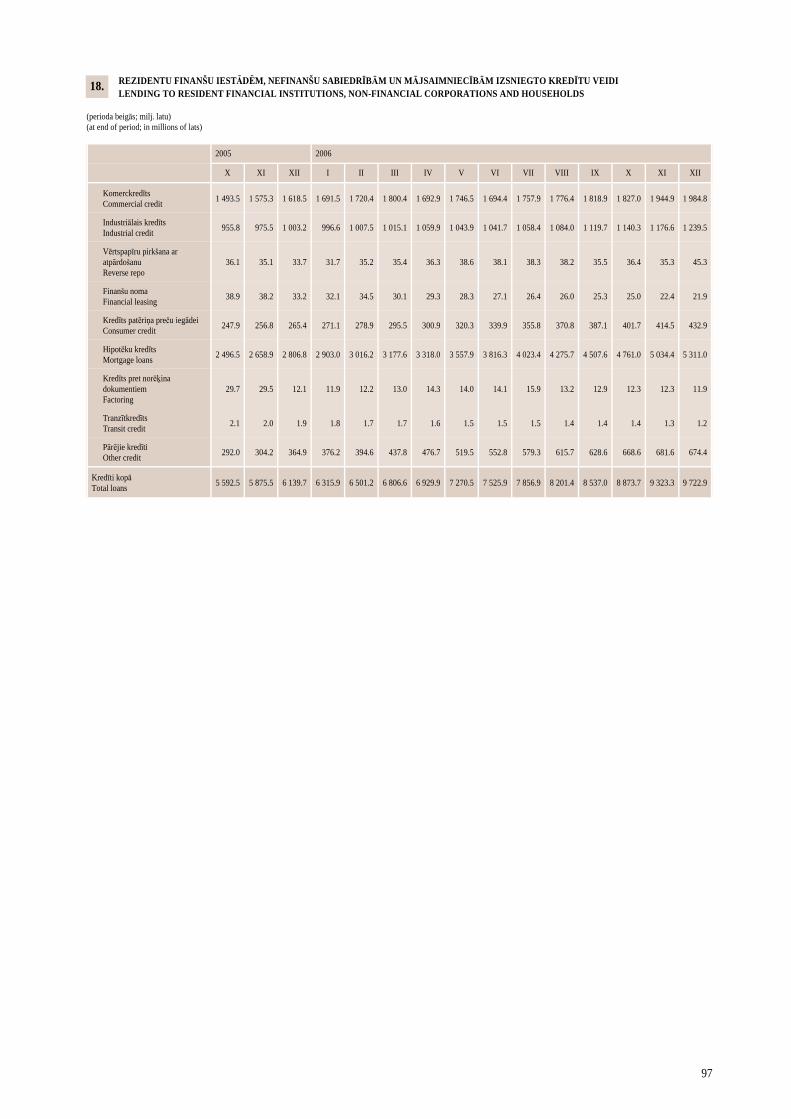
97
REZIDENTU FINANŠU IESTĀDĒM, NEFINANŠU SABIEDRĪBĀM UN MĀJSAIMNIECĪBĀM IZSNIEGTO KREDĪTU VEIDI LENDING TO RESIDENT FINANCIAL INSTITUTIONS, NON-FINANCIAL CORPORATIONS AND HOUSEHOLDS (perioda beigās; milj. latu) (at end of period; in millions of lats)
2005
X XI XII I II III IV V VI VII VIII IX X XI XII
Komerckredīts Commercial credit
1 493.5 1 575.3 1 618.5 1 691.5 1 720.4 1 800.4 1 692.9 1 746.5 1 694.4 1 757.9 1 776.4 1 818.9 1 827.0 1 944.9 1 984.8
Industriālais kredīts Industrial credit
955.8 975.5 1 003.2 996.6 1 007.5 1 015.1 1 059.9 1 043.9 1 041.7 1 058.4 1 084.0 1 119.7 1 140.3 1 176.6 1 239.5
Vērtspapīru pirkšana ar atpārdošanu Reverse repo
36.1 35.1 33.7 31.7 35.2 35.4 36.3 38.6 38.1 38.3 38.2 35.5 36.4 35.3 45.3
Finanšu noma Financial leasing
38.9 38.2 33.2 32.1 34.5 30.1 29.3 28.3 27.1 26.4 26.0 25.3 25.0 22.4 21.9
Kredīts patēriņa preču iegādei Consumer credit
247.9 256.8 265.4 271.1 278.9 295.5 300.9 320.3 339.9 355.8 370.8 387.1 401.7 414.5 432.9
Hipotēku kredīts Mortgage loans
2 496.5 2 658.9 2 806.8 2 903.0 3 016.2 3 177.6 3 318.0 3 557.9 3 816.3 4 023.4 4 275.7 4 507.6 4 761.0 5 034.4 5 311.0
Kredīts pret norēķina dokumentiem Factoring
29.7 29.5 12.1 11.9 12.2 13.0 14.3 14.0 14.1 15.9 13.2 12.9 12.3 12.3 11.9
Tranzītkredīts Transit credit 2.1 2.0 1.9 1.8 1.7 1.7 1.6 1.5 1.5 1.5 1.4 1.4 1.4 1.3 1.2
Pārējie kredīti Other credit
292.0 304.2 364.9 376.2 394.6 437.8 476.7 519.5 552.8 579.3 615.7 628.6 668.6 681.6 674.4
Kredīti kopā Total loans
5 592.5 5 875.5 6 139.7 6 315.9 6 501.2 6 806.6 6 929.9 7 270.5 7 525.9 7 856.9 8 201.4 8 537.0 8 873.7 9 323.3 9 722.9
2006
18.
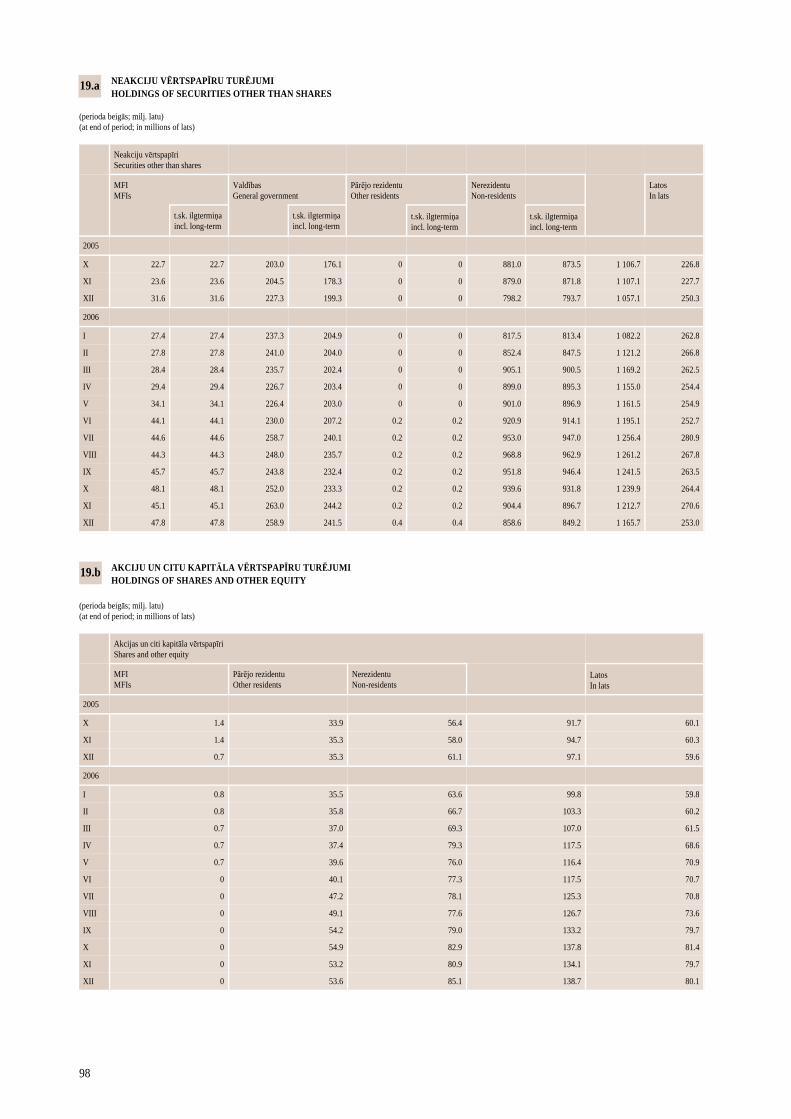
98
AKCIJU UN CITU KAPITĀLA VĒRTSPAPĪRU TURĒJUMI HOLDINGS OF SHARES AND OTHER EQUITY (perioda beigās; milj. latu) (at end of period; in millions of lats)
Akcijas un citi kapitāla vērtspapīri Shares and other equity
MFI MFIs
Pārējo rezidentu Other residents
Nerezidentu Non-residents
Latos In lats
2005
X 1.4 33.9 56.4 91.7 60.1
XI 1.4 35.3 58.0 94.7 60.3
XII 0.7 35.3 61.1 97.1 59.6
2006
I 0.8 35.5 63.6 99.8 59.8
II 0.8 35.8 66.7 103.3 60.2
III 0.7 37.0 69.3 107.0 61.5
IV 0.7 37.4 79.3 117.5 68.6
V 0.7 39.6 76.0 116.4 70.9
VI 0 40.1 77.3 117.5 70.7
VII 0 47.2 78.1 125.3 70.8
VIII 0 49.1 77.6 126.7 73.6
IX 0 54.2 79.0 133.2 79.7
X 0 54.9 82.9 137.8 81.4
XI 0 53.2 80.9 134.1 79.7
XII 0 53.6 85.1 138.7 80.1
19.b
NEAKCIJU VĒRTSPAPĪRU TURĒJUMI HOLDINGS OF SECURITIES OTHER THAN SHARES (perioda beigās; milj. latu) (at end of period; in millions of lats)
Neakciju vērtspapīri Securities other than shares
MFI MFIs
Valdības General government
Pārējo rezidentu Other residents
Nerezidentu Non-residents
Latos In lats
t.sk. ilgtermiņa incl. long-term
t.sk. ilgtermiņa incl. long-term
t.sk. ilgtermiņa incl. long-term
t.sk. ilgtermiņa incl. long-term
2005
X 22.7 22.7 203.0 176.1 0 0 881.0 873.5 1 106.7 226.8
XI 23.6 23.6 204.5 178.3 0 0 879.0 871.8 1 107.1 227.7
XII 31.6 31.6 227.3 199.3 0 0 798.2 793.7 1 057.1 250.3
2006
I 27.4 27.4 237.3 204.9 0 0 817.5 813.4 1 082.2 262.8
II 27.8 27.8 241.0 204.0 0 0 852.4 847.5 1 121.2 266.8
III 28.4 28.4 235.7 202.4 0 0 905.1 900.5 1 169.2 262.5
IV 29.4 29.4 226.7 203.4 0 0 899.0 895.3 1 155.0 254.4
V 34.1 34.1 226.4 203.0 0 0 901.0 896.9 1 161.5 254.9
VI 44.1 44.1 230.0 207.2 0.2 0.2 920.9 914.1 1 195.1 252.7
VII 44.6 44.6 258.7 240.1 0.2 0.2 953.0 947.0 1 256.4 280.9
VIII 44.3 44.3 248.0 235.7 0.2 0.2 968.8 962.9 1 261.2 267.8
IX 45.7 45.7 243.8 232.4 0.2 0.2 951.8 946.4 1 241.5 263.5
X 48.1 48.1 252.0 233.3 0.2 0.2 939.6 931.8 1 239.9 264.4
XI 45.1 45.1 263.0 244.2 0.2 0.2 904.4 896.7 1 212.7 270.6
XII 47.8 47.8 258.9 241.5 0.4 0.4 858.6 849.2 1 165.7 253.0
19.a
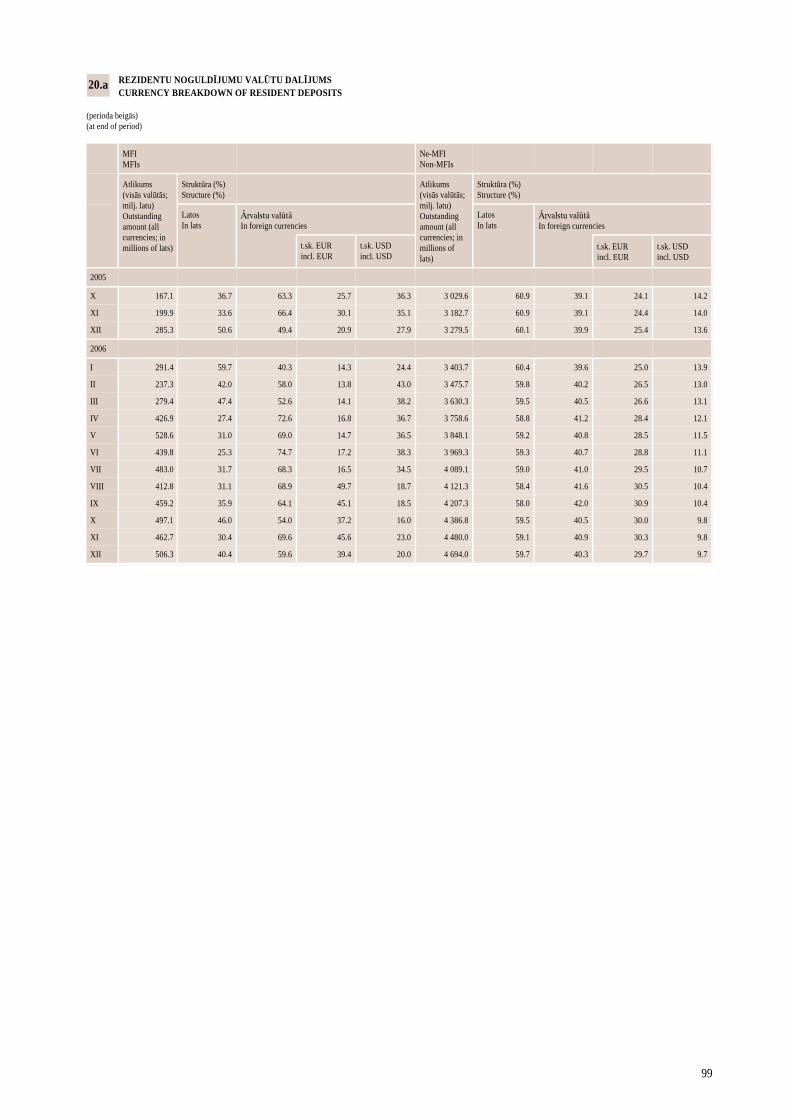
99
REZIDENTU NOGULDĪJUMU VALŪTU DALĪJUMS CURRENCY BREAKDOWN OF RESIDENT DEPOSITS (perioda beigās) (at end of period)
MFI MFIs
Ne-MFI Non-MFIs
Atlikums (visās valūtās; milj. latu) Outstanding amount (all currencies; in millions of lats)
Struktūra (%) Structure (%)
Atlikums (visās valūtās; milj. latu) Outstanding amount (all currencies; in millions of lats)
Struktūra (%) Structure (%)
Latos In lats
Ārvalstu valūtā In foreign currencies
Latos In lats
Ārvalstu valūtā In foreign currencies
t.sk. EUR incl. EUR
t.sk. USD incl. USD
t.sk. EUR incl. EUR
t.sk. USD incl. USD
2005
X 167.1 36.7 63.3 25.7 36.3 3 029.6 60.9 39.1 24.1 14.2
XI 199.9 33.6 66.4 30.1 35.1 3 182.7 60.9 39.1 24.4 14.0
XII 285.3 50.6 49.4 20.9 27.9 3 279.5 60.1 39.9 25.4 13.6
2006
I 291.4 59.7 40.3 14.3 24.4 3 403.7 60.4 39.6 25.0 13.9
II 237.3 42.0 58.0 13.8 43.0 3 475.7 59.8 40.2 26.5 13.0
III 279.4 47.4 52.6 14.1 38.2 3 630.3 59.5 40.5 26.6 13.1
IV 426.9 27.4 72.6 16.8 36.7 3 758.6 58.8 41.2 28.4 12.1
V 528.6 31.0 69.0 14.7 36.5 3 848.1 59.2 40.8 28.5 11.5
VI 439.8 25.3 74.7 17.2 38.3 3 969.3 59.3 40.7 28.8 11.1
VII 483.0 31.7 68.3 16.5 34.5 4 089.1 59.0 41.0 29.5 10.7
VIII 412.8 31.1 68.9 49.7 18.7 4 121.3 58.4 41.6 30.5 10.4
IX 459.2 35.9 64.1 45.1 18.5 4 207.3 58.0 42.0 30.9 10.4
X 497.1 46.0 54.0 37.2 16.0 4 386.8 59.5 40.5 30.0 9.8
XI 462.7 30.4 69.6 45.6 23.0 4 480.0 59.1 40.9 30.3 9.8
XII 506.3 40.4 59.6 39.4 20.0 4 694.0 59.7 40.3 29.7 9.7
20.a
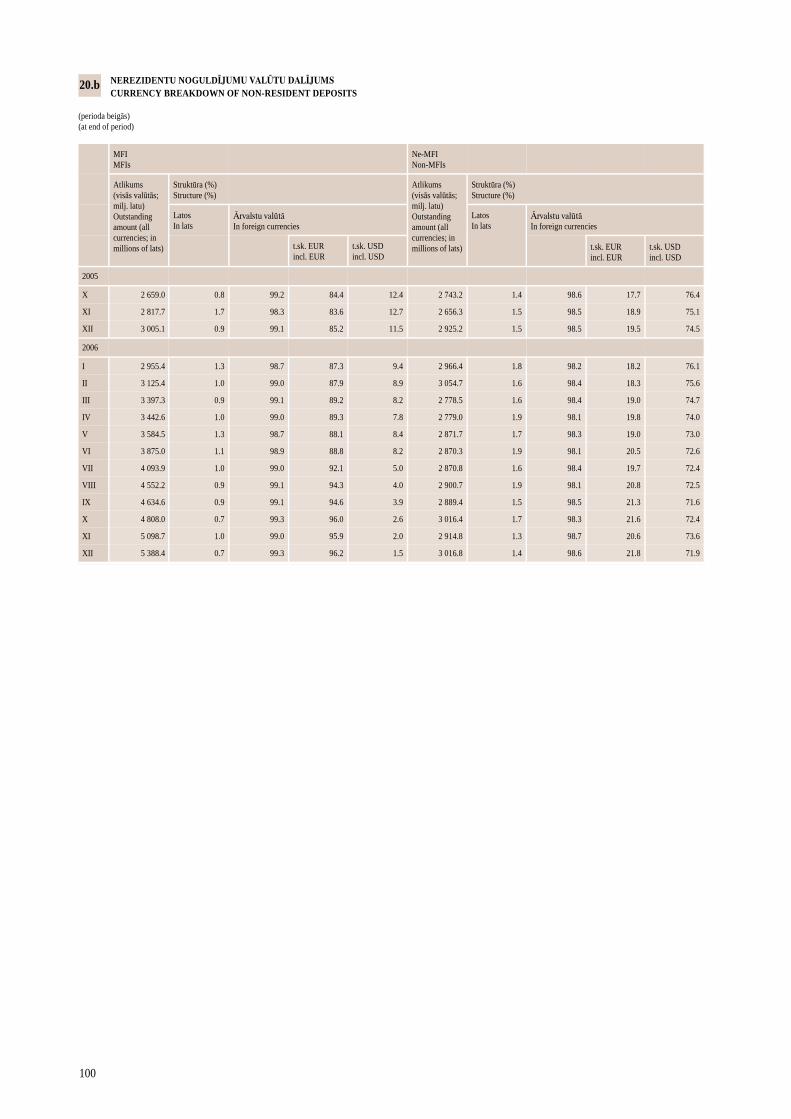
100
NEREZIDENTU NOGULDĪJUMU VALŪTU DALĪJUMS CURRENCY BREAKDOWN OF NON-RESIDENT DEPOSITS (perioda beigās) (at end of period)
MFI MFIs
Ne-MFI Non-MFIs
Atlikums (visās valūtās; milj. latu) Outstanding amount (all currencies; in millions of lats)
Struktūra (%) Structure (%)
Atlikums (visās valūtās; milj. latu) Outstanding amount (all currencies; in millions of lats)
Struktūra (%) Structure (%)
Latos In lats
Ārvalstu valūtā In foreign currencies
Latos In lats
Ārvalstu valūtā In foreign currencies
t.sk. EUR incl. EUR
t.sk. USD incl. USD
t.sk. EUR incl. EUR
t.sk. USD incl. USD
2005
X 2 659.0 0.8 99.2 84.4 12.4 2 743.2 1.4 98.6 17.7 76.4
XI 2 817.7 1.7 98.3 83.6 12.7 2 656.3 1.5 98.5 18.9 75.1
XII 3 005.1 0.9 99.1 85.2 11.5 2 925.2 1.5 98.5 19.5 74.5
2006
I 2 955.4 1.3 98.7 87.3 9.4 2 966.4 1.8 98.2 18.2 76.1
II 3 125.4 1.0 99.0 87.9 8.9 3 054.7 1.6 98.4 18.3 75.6
III 3 397.3 0.9 99.1 89.2 8.2 2 778.5 1.6 98.4 19.0 74.7
IV 3 442.6 1.0 99.0 89.3 7.8 2 779.0 1.9 98.1 19.8 74.0
V 3 584.5 1.3 98.7 88.1 8.4 2 871.7 1.7 98.3 19.0 73.0
VI 3 875.0 1.1 98.9 88.8 8.2 2 870.3 1.9 98.1 20.5 72.6
VII 4 093.9 1.0 99.0 92.1 5.0 2 870.8 1.6 98.4 19.7 72.4
VIII 4 552.2 0.9 99.1 94.3 4.0 2 900.7 1.9 98.1 20.8 72.5
IX 4 634.6 0.9 99.1 94.6 3.9 2 889.4 1.5 98.5 21.3 71.6
X 4 808.0 0.7 99.3 96.0 2.6 3 016.4 1.7 98.3 21.6 72.4
XI 5 098.7 1.0 99.0 95.9 2.0 2 914.8 1.3 98.7 20.6 73.6
XII 5 388.4 0.7 99.3 96.2 1.5 3 016.8 1.4 98.6 21.8 71.9
20.b
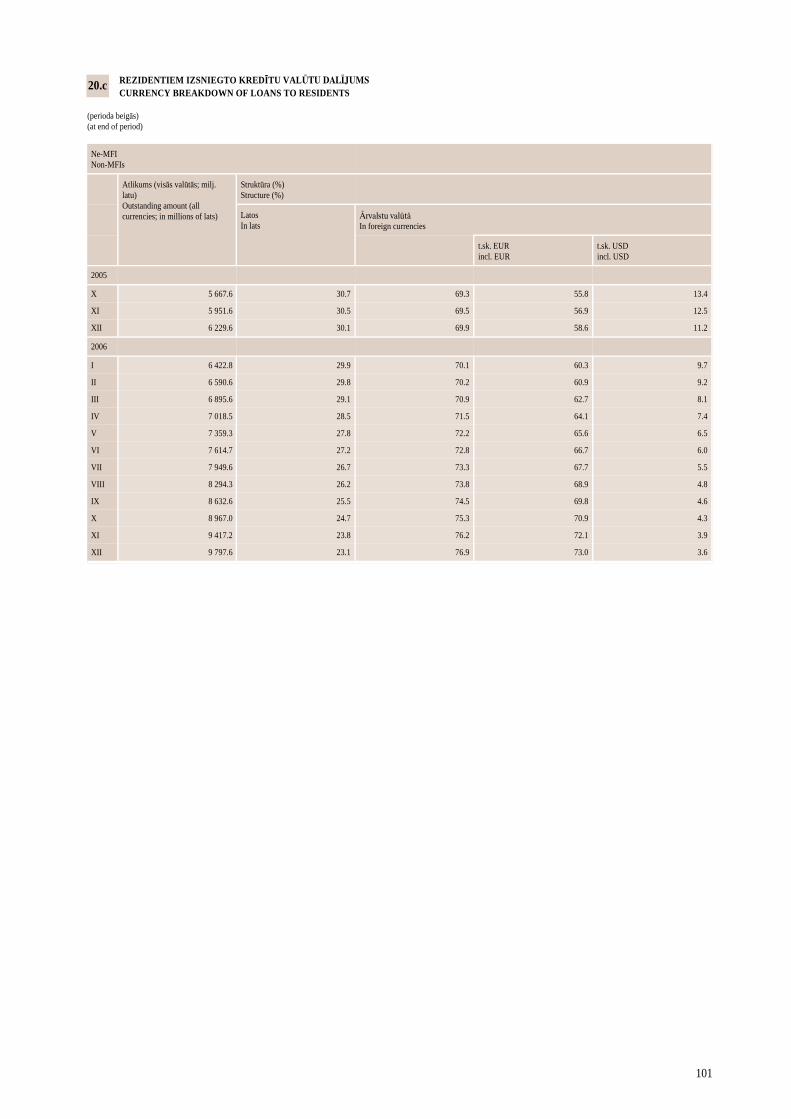
101
REZIDENTIEM IZSNIEGTO KREDĪTU VALŪTU DALĪJUMS CURRENCY BREAKDOWN OF LOANS TO RESIDENTS (perioda beigās) (at end of period)
Ne-MFI Non-MFIs
Atlikums (visās valūtās; milj. latu) Outstanding amount (all currencies; in millions of lats)
Struktūra (%) Structure (%)
Latos In lats
Ārvalstu valūtā In foreign currencies
t.sk. EUR incl. EUR
t.sk. USD incl. USD
2005
X 5 667.6 30.7 69.3 55.8 13.4
XI 5 951.6 30.5 69.5 56.9 12.5
XII 6 229.6 30.1 69.9 58.6 11.2
2006
I 6 422.8 29.9 70.1 60.3 9.7
II 6 590.6 29.8 70.2 60.9 9.2
III 6 895.6 29.1 70.9 62.7 8.1
IV 7 018.5 28.5 71.5 64.1 7.4
V 7 359.3 27.8 72.2 65.6 6.5
VI 7 614.7 27.2 72.8 66.7 6.0
VII 7 949.6 26.7 73.3 67.7 5.5
VIII 8 294.3 26.2 73.8 68.9 4.8
IX 8 632.6 25.5 74.5 69.8 4.6
X 8 967.0 24.7 75.3 70.9 4.3
XI 9 417.2 23.8 76.2 72.1 3.9
XII 9 797.6 23.1 76.9 73.0 3.6
20.c
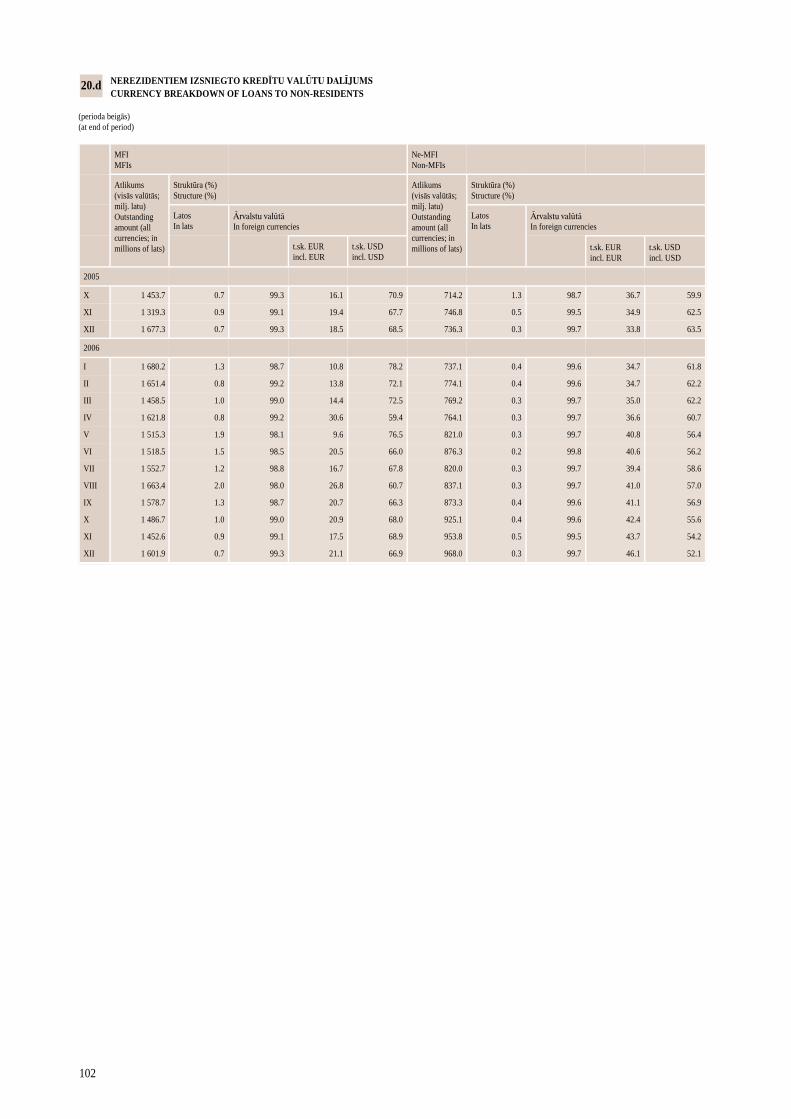
102
NEREZIDENTIEM IZSNIEGTO KREDĪTU VALŪTU DALĪJUMS CURRENCY BREAKDOWN OF LOANS TO NON-RESIDENTS (perioda beigās) (at end of period)
MFI MFIs
Ne-MFI Non-MFIs
Atlikums (visās valūtās; milj. latu) Outstanding amount (all currencies; in millions of lats)
Struktūra (%) Structure (%)
Atlikums (visās valūtās; milj. latu) Outstanding amount (all currencies; in millions of lats)
Struktūra (%) Structure (%)
Latos In lats
Ārvalstu valūtā In foreign currencies
Latos In lats
Ārvalstu valūtā In foreign currencies
t.sk. EUR incl. EUR
t.sk. USD incl. USD
t.sk. EUR incl. EUR
t.sk. USD incl. USD
2005
X 1 453.7 0.7 99.3 16.1 70.9 714.2 1.3 98.7 36.7 59.9
XI 1 319.3 0.9 99.1 19.4 67.7 746.8 0.5 99.5 34.9 62.5
XII 1 677.3 0.7 99.3 18.5 68.5 736.3 0.3 99.7 33.8 63.5
2006
I 1 680.2 1.3 98.7 10.8 78.2 737.1 0.4 99.6 34.7 61.8
II 1 651.4 0.8 99.2 13.8 72.1 774.1 0.4 99.6 34.7 62.2
III 1 458.5 1.0 99.0 14.4 72.5 769.2 0.3 99.7 35.0 62.2
IV 1 621.8 0.8 99.2 30.6 59.4 764.1 0.3 99.7 36.6 60.7
V 1 515.3 1.9 98.1 9.6 76.5 821.0 0.3 99.7 40.8 56.4
VI 1 518.5 1.5 98.5 20.5 66.0 876.3 0.2 99.8 40.6 56.2
VII 1 552.7 1.2 98.8 16.7 67.8 820.0 0.3 99.7 39.4 58.6
VIII 1 663.4 2.0 98.0 26.8 60.7 837.1 0.3 99.7 41.0 57.0
IX 1 578.7 1.3 98.7 20.7 66.3 873.3 0.4 99.6 41.1 56.9
X 1 486.7 1.0 99.0 20.9 68.0 925.1 0.4 99.6 42.4 55.6
XI 1 452.6 0.9 99.1 17.5 68.9 953.8 0.5 99.5 43.7 54.2
XII 1 601.9 0.7 99.3 21.1 66.9 968.0 0.3 99.7 46.1 52.1
20.d
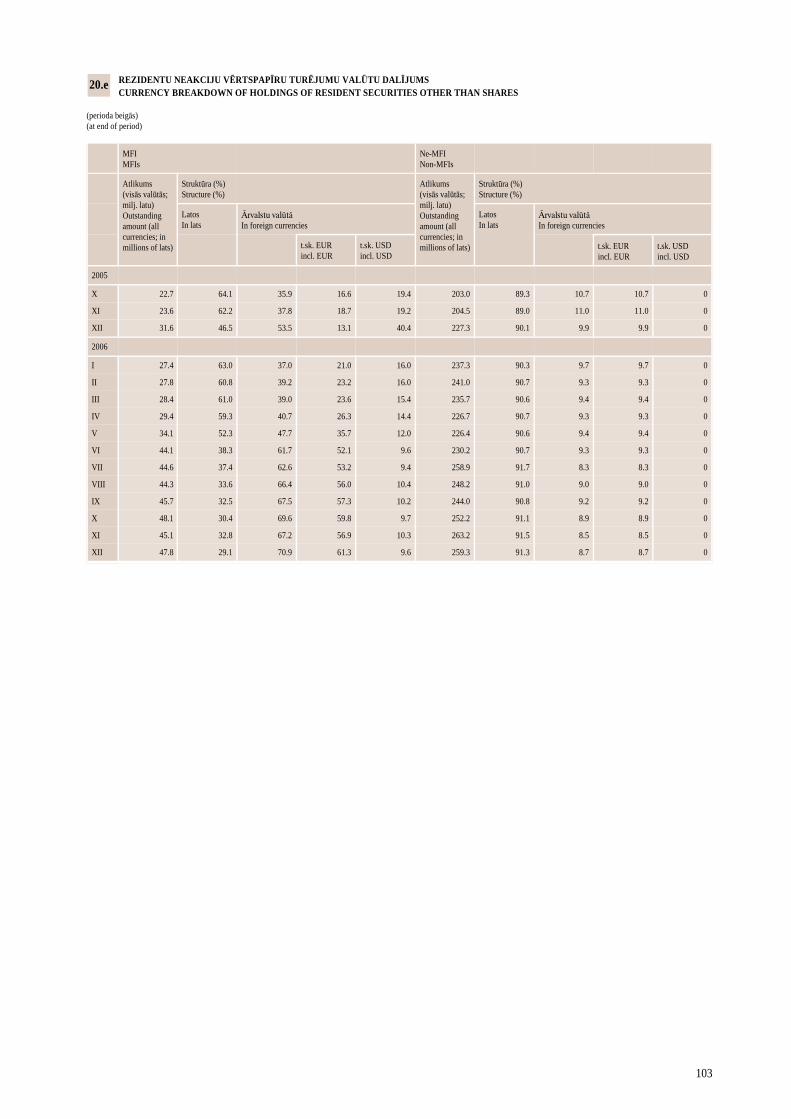
103
REZIDENTU NEAKCIJU VĒRTSPAPĪRU TURĒJUMU VALŪTU DALĪJUMS CURRENCY BREAKDOWN OF HOLDINGS OF RESIDENT SECURITIES OTHER THAN SHARES (perioda beigās) (at end of period)
MFI MFIs
Ne-MFI Non-MFIs
Atlikums (visās valūtās; milj. latu) Outstanding amount (all currencies; in millions of lats)
Struktūra (%) Structure (%)
Atlikums (visās valūtās; milj. latu) Outstanding amount (all currencies; in millions of lats)
Struktūra (%) Structure (%)
Latos In lats
Ārvalstu valūtā In foreign currencies
Latos In lats
Ārvalstu valūtā In foreign currencies
t.sk. EUR incl. EUR
t.sk. USD incl. USD
t.sk. EUR incl. EUR
t.sk. USD incl. USD
2005
X 22.7 64.1 35.9 16.6 19.4 203.0 89.3 10.7 10.7 0
XI 23.6 62.2 37.8 18.7 19.2 204.5 89.0 11.0 11.0 0
XII 31.6 46.5 53.5 13.1 40.4 227.3 90.1 9.9 9.9 0
2006
I 27.4 63.0 37.0 21.0 16.0 237.3 90.3 9.7 9.7 0
II 27.8 60.8 39.2 23.2 16.0 241.0 90.7 9.3 9.3 0
III 28.4 61.0 39.0 23.6 15.4 235.7 90.6 9.4 9.4 0
IV 29.4 59.3 40.7 26.3 14.4 226.7 90.7 9.3 9.3 0
V 34.1 52.3 47.7 35.7 12.0 226.4 90.6 9.4 9.4 0
VI 44.1 38.3 61.7 52.1 9.6 230.2 90.7 9.3 9.3 0
VII 44.6 37.4 62.6 53.2 9.4 258.9 91.7 8.3 8.3 0
VIII 44.3 33.6 66.4 56.0 10.4 248.2 91.0 9.0 9.0 0
IX 45.7 32.5 67.5 57.3 10.2 244.0 90.8 9.2 9.2 0
X 48.1 30.4 69.6 59.8 9.7 252.2 91.1 8.9 8.9 0
XI 45.1 32.8 67.2 56.9 10.3 263.2 91.5 8.5 8.5 0
XII 47.8 29.1 70.9 61.3 9.6 259.3 91.3 8.7 8.7 0
20.e
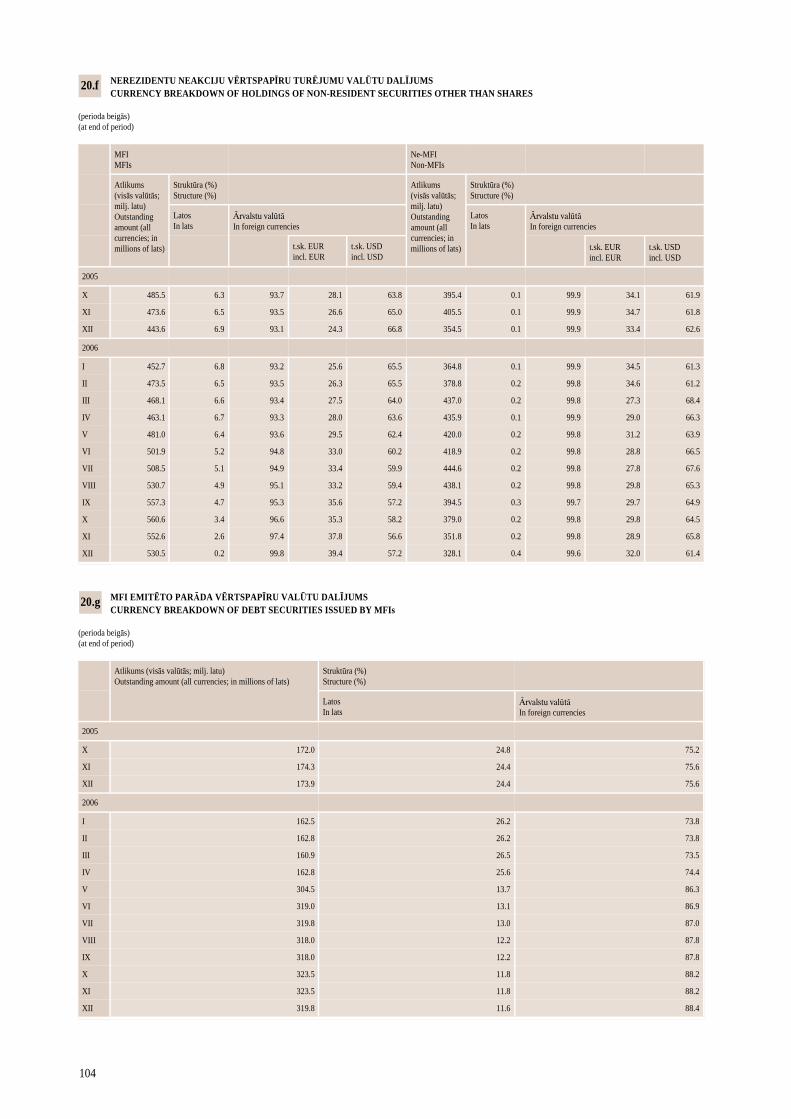
104
MFI EMITĒTO PARĀDA VĒRTSPAPĪRU VALŪTU DALĪJUMS CURRENCY BREAKDOWN OF DEBT SECURITIES ISSUED BY MFIs (perioda beigās) (at end of period)
Atlikums (visās valūtās; milj. latu) Outstanding amount (all currencies; in millions of lats)
Struktūra (%) Structure (%)
Latos In lats
Ārvalstu valūtā In foreign currencies
2005
X 172.0 24.8 75.2
XI 174.3 24.4 75.6
XII 173.9 24.4 75.6
2006
I 162.5 26.2 73.8
II 162.8 26.2 73.8
III 160.9 26.5 73.5
IV 162.8 25.6 74.4
V 304.5 13.7 86.3
VI 319.0 13.1 86.9
VII 319.8 13.0 87.0
VIII 318.0 12.2 87.8
IX 318.0 12.2 87.8
X 323.5 11.8 88.2
XI 323.5 11.8 88.2
XII 319.8 11.6 88.4
20.g
NEREZIDENTU NEAKCIJU VĒRTSPAPĪRU TURĒJUMU VALŪTU DALĪJUMS CURRENCY BREAKDOWN OF HOLDINGS OF NON-RESIDENT SECURITIES OTHER THAN SHARES (perioda beigās) (at end of period)
MFI MFIs
Ne-MFI Non-MFIs
Atlikums (visās valūtās; milj. latu) Outstanding amount (all currencies; in millions of lats)
Struktūra (%) Structure (%)
Atlikums (visās valūtās; milj. latu) Outstanding amount (all currencies; in millions of lats)
Struktūra (%) Structure (%)
Latos In lats
Ārvalstu valūtā In foreign currencies
Latos In lats
Ārvalstu valūtā In foreign currencies
t.sk. EUR incl. EUR
t.sk. USD incl. USD
t.sk. EUR incl. EUR
t.sk. USD incl. USD
2005
X 485.5 6.3 93.7 28.1 63.8 395.4 0.1 99.9 34.1 61.9
XI 473.6 6.5 93.5 26.6 65.0 405.5 0.1 99.9 34.7 61.8
XII 443.6 6.9 93.1 24.3 66.8 354.5 0.1 99.9 33.4 62.6
2006
I 452.7 6.8 93.2 25.6 65.5 364.8 0.1 99.9 34.5 61.3
II 473.5 6.5 93.5 26.3 65.5 378.8 0.2 99.8 34.6 61.2
III 468.1 6.6 93.4 27.5 64.0 437.0 0.2 99.8 27.3 68.4
IV 463.1 6.7 93.3 28.0 63.6 435.9 0.1 99.9 29.0 66.3
V 481.0 6.4 93.6 29.5 62.4 420.0 0.2 99.8 31.2 63.9
VI 501.9 5.2 94.8 33.0 60.2 418.9 0.2 99.8 28.8 66.5
VII 508.5 5.1 94.9 33.4 59.9 444.6 0.2 99.8 27.8 67.6
VIII 530.7 4.9 95.1 33.2 59.4 438.1 0.2 99.8 29.8 65.3
IX 557.3 4.7 95.3 35.6 57.2 394.5 0.3 99.7 29.7 64.9
X 560.6 3.4 96.6 35.3 58.2 379.0 0.2 99.8 29.8 64.5
XI 552.6 2.6 97.4 37.8 56.6 351.8 0.2 99.8 28.9 65.8
XII 530.5 0.2 99.8 39.4 57.2 328.1 0.4 99.6 32.0 61.4
20.f
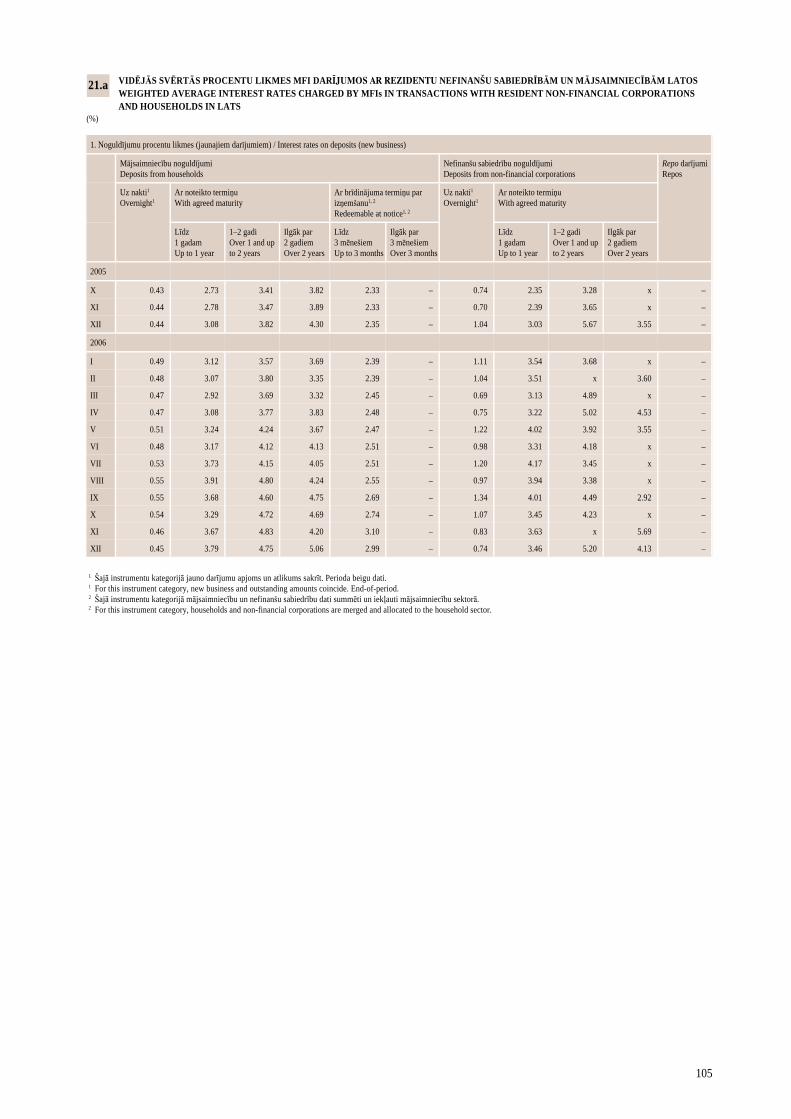
105
1 Šajā instrumentu kategorijā jauno darījumu apjoms un atlikums sakrīt. Perioda beigu dati. 1 For this instrument category, new business and outstanding amounts coincide. End-of-period. 2 Šajā instrumentu kategorijā mājsaimniecību un nefinanšu sabiedrību dati summēti un iekļauti mājsaimniecību sektorā. 2 For this instrument category, households and non-financial corporations are merged and allocated to the household sector.
1. Noguldījumu procentu likmes (jaunajiem darījumiem) / Interest rates on deposits (new business)
Mājsaimniecību noguldījumi Deposits from households
Nefinanšu sabiedrību noguldījumi Deposits from non-financial corporations
Repo darījumi Repos
Uz nakti1 Overnight1
Ar noteikto termiņu With agreed maturity
Ar brīdinājuma termiņu par izņemšanu1, 2 Redeemable at notice1, 2
Uz nakti1 Overnight1
Ar noteikto termiņu With agreed maturity
Līdz 1 gadam Up to 1 year
1–2 gadi Over 1 and up to 2 years
Ilgāk par 2 gadiem Over 2 years
Līdz 3 mēnešiem Up to 3 months
Ilgāk par 3 mēnešiem Over 3 months
Līdz 1 gadam Up to 1 year
1–2 gadi Over 1 and up to 2 years
Ilgāk par 2 gadiem Over 2 years
2005
X 0.43 2.73 3.41 3.82 2.33 – 0.74 2.35 3.28 x –
XI 0.44 2.78 3.47 3.89 2.33 – 0.70 2.39 3.65 x –
XII 0.44 3.08 3.82 4.30 2.35 – 1.04 3.03 5.67 3.55 –
2006
I 0.49 3.12 3.57 3.69 2.39 – 1.11 3.54 3.68 x –
II 0.48 3.07 3.80 3.35 2.39 – 1.04 3.51 x 3.60 –
III 0.47 2.92 3.69 3.32 2.45 – 0.69 3.13 4.89 x –
IV 0.47 3.08 3.77 3.83 2.48 – 0.75 3.22 5.02 4.53 –
V 0.51 3.24 4.24 3.67 2.47 – 1.22 4.02 3.92 3.55 –
VI 0.48 3.17 4.12 4.13 2.51 – 0.98 3.31 4.18 x –
VII 0.53 3.73 4.15 4.05 2.51 – 1.20 4.17 3.45 x –
VIII 0.55 3.91 4.80 4.24 2.55 – 0.97 3.94 3.38 x –
IX 0.55 3.68 4.60 4.75 2.69 – 1.34 4.01 4.49 2.92 –
X 0.54 3.29 4.72 4.69 2.74 – 1.07 3.45 4.23 x –
XI 0.46 3.67 4.83 4.20 3.10 – 0.83 3.63 x 5.69 –
XII 0.45 3.79 4.75 5.06 2.99 – 0.74 3.46 5.20 4.13 –
VIDĒJĀS SVĒRTĀS PROCENTU LIKMES MFI DARĪJUMOS AR REZIDENTU NEFINANŠU SABIEDRĪBĀM UN MĀJSAIMNIECĪBĀM LATOS WEIGHTED AVERAGE INTEREST RATES CHARGED BY MFIs IN TRANSACTIONS WITH RESIDENT NON-FINANCIAL CORPORATIONS AND HOUSEHOLDS IN LATS (%)
21.a
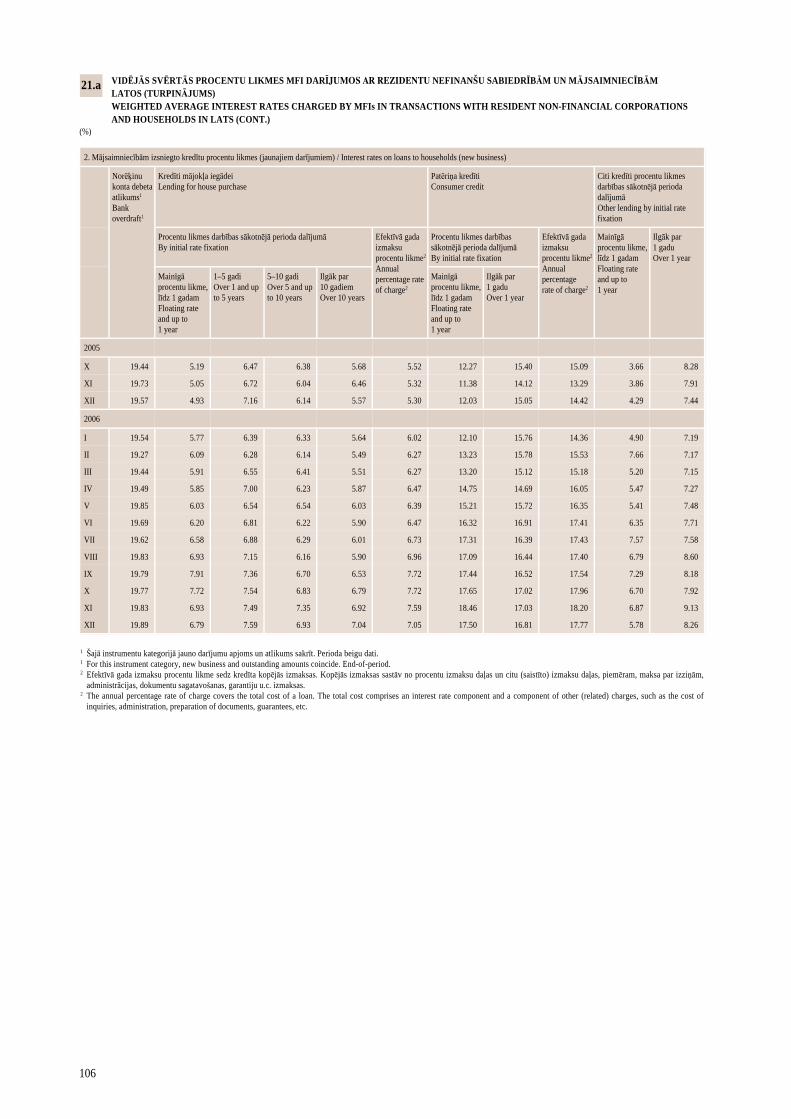
106
2. Mājsaimniecībām izsniegto kredītu procentu likmes (jaunajiem darījumiem) / Interest rates on loans to households (new business)
Norēķinu konta debeta atlikums1 Bank overdraft1
Kredīti mājokļa iegādei Lending for house purchase
Patēriņa kredīti Consumer credit
Citi kredīti procentu likmes darbības sākotnējā perioda dalījumā Other lending by initial rate fixation
Procentu likmes darbības sākotnējā perioda dalījumā By initial rate fixation
Efektīvā gada izmaksu procentu likme2 Annual percentage rate of charge2
Procentu likmes darbības sākotnējā perioda dalījumā By initial rate fixation
Efektīvā gada izmaksu procentu likme2 Annual percentage rate of charge2
Mainīgā procentu likme, līdz 1 gadam Floating rate and up to 1 year
Ilgāk par 1 gadu Over 1 year
Mainīgā procentu likme, līdz 1 gadam Floating rate and up to 1 year
1–5 gadi Over 1 and up to 5 years
5–10 gadi Over 5 and up to 10 years
Ilgāk par 10 gadiem Over 10 years
Mainīgā procentu likme, līdz 1 gadam Floating rate and up to 1 year
Ilgāk par 1 gadu Over 1 year
2005
X 19.44 5.19 6.47 6.38 5.68 5.52 12.27 15.40 15.09 3.66 8.28
XI 19.73 5.05 6.72 6.04 6.46 5.32 11.38 14.12 13.29 3.86 7.91
XII 19.57 4.93 7.16 6.14 5.57 5.30 12.03 15.05 14.42 4.29 7.44
2006
I 19.54 5.77 6.39 6.33 5.64 6.02 12.10 15.76 14.36 4.90 7.19
II 19.27 6.09 6.28 6.14 5.49 6.27 13.23 15.78 15.53 7.66 7.17
III 19.44 5.91 6.55 6.41 5.51 6.27 13.20 15.12 15.18 5.20 7.15
IV 19.49 5.85 7.00 6.23 5.87 6.47 14.75 14.69 16.05 5.47 7.27
V 19.85 6.03 6.54 6.54 6.03 6.39 15.21 15.72 16.35 5.41 7.48
VI 19.69 6.20 6.81 6.22 5.90 6.47 16.32 16.91 17.41 6.35 7.71
VII 19.62 6.58 6.88 6.29 6.01 6.73 17.31 16.39 17.43 7.57 7.58
VIII 19.83 6.93 7.15 6.16 5.90 6.96 17.09 16.44 17.40 6.79 8.60
IX 19.79 7.91 7.36 6.70 6.53 7.72 17.44 16.52 17.54 7.29 8.18
X 19.77 7.72 7.54 6.83 6.79 7.72 17.65 17.02 17.96 6.70 7.92
XI 19.83 6.93 7.49 7.35 6.92 7.59 18.46 17.03 18.20 6.87 9.13
XII 19.89 6.79 7.59 6.93 7.04 7.05 17.50 16.81 17.77 5.78 8.26
VIDĒJĀS SVĒRTĀS PROCENTU LIKMES MFI DARĪJUMOS AR REZIDENTU NEFINANŠU SABIEDRĪBĀM UN MĀJSAIMNIECĪBĀM LATOS (TURPINĀJUMS) WEIGHTED AVERAGE INTEREST RATES CHARGED BY MFIs IN TRANSACTIONS WITH RESIDENT NON-FINANCIAL CORPORATIONS AND HOUSEHOLDS IN LATS (CONT.) (%)
21.a
1 Šajā instrumentu kategorijā jauno darījumu apjoms un atlikums sakrīt. Perioda beigu dati. 1 For this instrument category, new business and outstanding amounts coincide. End-of-period. 2 Efektīvā gada izmaksu procentu likme sedz kredīta kopējās izmaksas. Kopējās izmaksas sastāv no procentu izmaksu daļas un citu (saistīto) izmaksu daļas, piemēram, maksa par izziņām, administrācijas, dokumentu sagatavošanas, garantiju u.c. izmaksas. 2 The annual percentage rate of charge covers the total cost of a loan. The total cost comprises an interest rate component and a component of other (related) charges, such as the cost of inquiries, administration, preparation of documents, guarantees, etc.
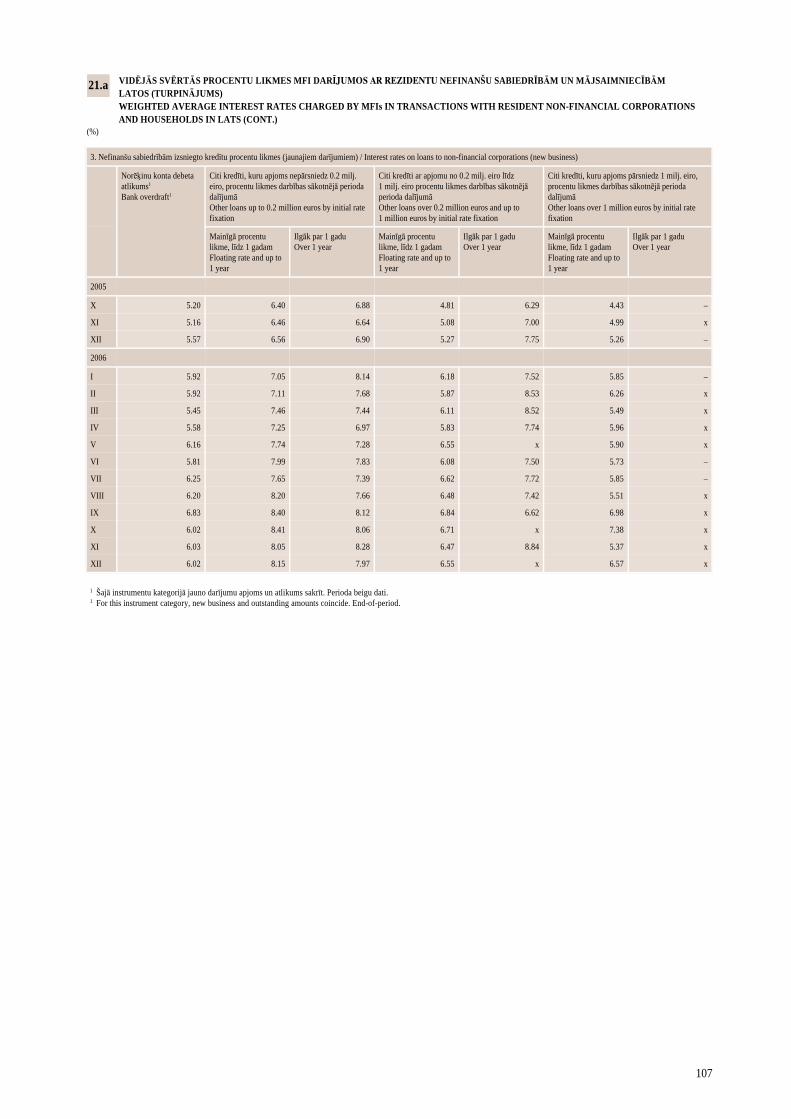
107
1 Šajā instrumentu kategorijā jauno darījumu apjoms un atlikums sakrīt. Perioda beigu dati. 1 For this instrument category, new business and outstanding amounts coincide. End-of-period.
3. Nefinanšu sabiedrībām izsniegto kredītu procentu likmes (jaunajiem darījumiem) / Interest rates on loans to non-financial corporations (new business)
Norēķinu konta debeta atlikums1 Bank overdraft1
Citi kredīti, kuru apjoms nepārsniedz 0.2 milj. eiro, procentu likmes darbības sākotnējā perioda dalījumā Other loans up to 0.2 million euros by initial rate fixation
Citi kredīti ar apjomu no 0.2 milj. eiro līdz 1 milj. eiro procentu likmes darbības sākotnējā perioda dalījumā Other loans over 0.2 million euros and up to 1 million euros by initial rate fixation
Citi kredīti, kuru apjoms pārsniedz 1 milj. eiro, procentu likmes darbības sākotnējā perioda dalījumā Other loans over 1 million euros by initial rate fixation
Mainīgā procentu likme, līdz 1 gadam Floating rate and up to 1 year
Ilgāk par 1 gadu Over 1 year
Mainīgā procentu likme, līdz 1 gadam Floating rate and up to 1 year
Ilgāk par 1 gadu Over 1 year
Mainīgā procentu likme, līdz 1 gadam Floating rate and up to 1 year
Ilgāk par 1 gadu Over 1 year
2005
X 5.20 6.40 6.88 4.81 6.29 4.43 –
XI 5.16 6.46 6.64 5.08 7.00 4.99 x
XII 5.57 6.56 6.90 5.27 7.75 5.26 –
2006
I 5.92 7.05 8.14 6.18 7.52 5.85 –
II 5.92 7.11 7.68 5.87 8.53 6.26 x
III 5.45 7.46 7.44 6.11 8.52 5.49 x
IV 5.58 7.25 6.97 5.83 7.74 5.96 x
V 6.16 7.74 7.28 6.55 x 5.90 x
VI 5.81 7.99 7.83 6.08 7.50 5.73 –
VII 6.25 7.65 7.39 6.62 7.72 5.85 –
VIII 6.20 8.20 7.66 6.48 7.42 5.51 x
IX 6.83 8.40 8.12 6.84 6.62 6.98 x
X 6.02 8.41 8.06 6.71 x 7.38 x
XI 6.03 8.05 8.28 6.47 8.84 5.37 x
XII 6.02 8.15 7.97 6.55 x 6.57 x
VIDĒJĀS SVĒRTĀS PROCENTU LIKMES MFI DARĪJUMOS AR REZIDENTU NEFINANŠU SABIEDRĪBĀM UN MĀJSAIMNIECĪBĀM LATOS (TURPINĀJUMS) WEIGHTED AVERAGE INTEREST RATES CHARGED BY MFIs IN TRANSACTIONS WITH RESIDENT NON-FINANCIAL CORPORATIONS AND HOUSEHOLDS IN LATS (CONT.) (%)
21.a
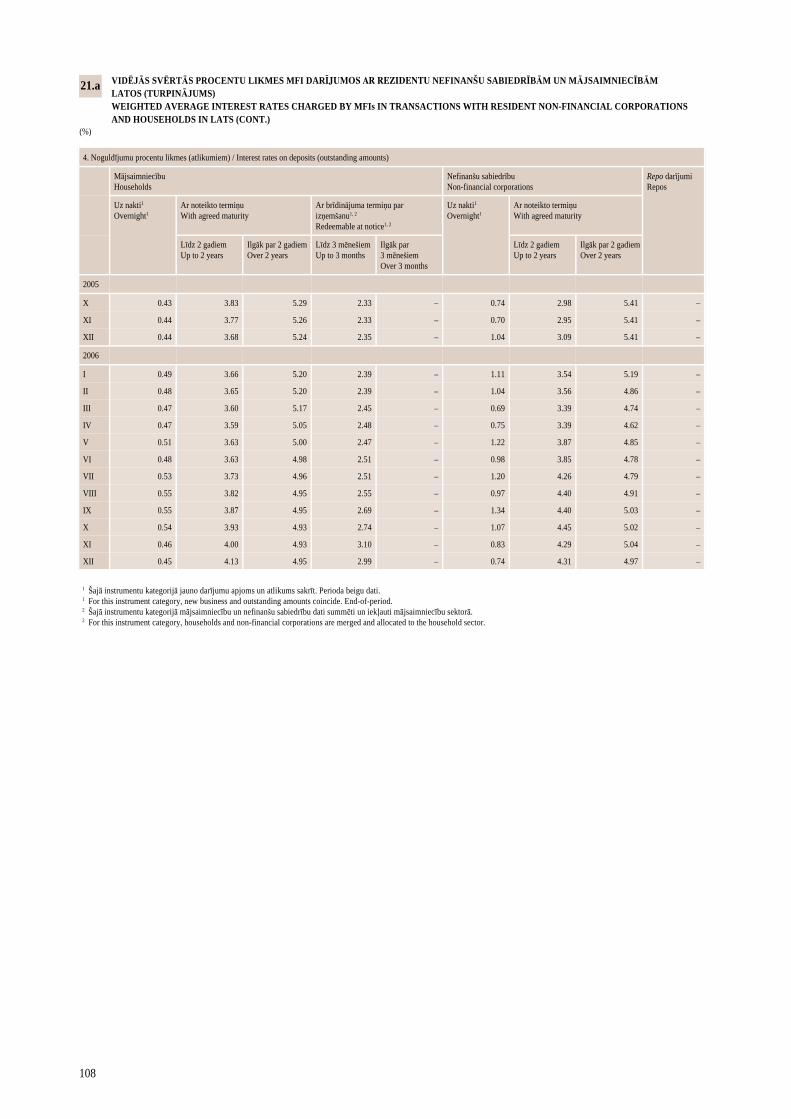
108
4. Noguldījumu procentu likmes (atlikumiem) / Interest rates on deposits (outstanding amounts)
Mājsaimniecību Households
Nefinanšu sabiedrību Non-financial corporations
Repo darījumi Repos
Uz nakti1 Overnight1
Ar noteikto termiņu With agreed maturity
Ar brīdinājuma termiņu par izņemšanu1, 2 Redeemable at notice1, 2
Uz nakti1 Overnight1
Ar noteikto termiņu With agreed maturity
Līdz 2 gadiem Up to 2 years
Ilgāk par 2 gadiem Over 2 years
Līdz 3 mēnešiem Up to 3 months
Ilgāk par 3 mēnešiem Over 3 months
Līdz 2 gadiem Up to 2 years
Ilgāk par 2 gadiem Over 2 years
2005
X 0.43 3.83 5.29 2.33 – 0.74 2.98 5.41 –
XI 0.44 3.77 5.26 2.33 – 0.70 2.95 5.41 –
XII 0.44 3.68 5.24 2.35 – 1.04 3.09 5.41 –
2006
I 0.49 3.66 5.20 2.39 – 1.11 3.54 5.19 –
II 0.48 3.65 5.20 2.39 – 1.04 3.56 4.86 –
III 0.47 3.60 5.17 2.45 – 0.69 3.39 4.74 –
IV 0.47 3.59 5.05 2.48 – 0.75 3.39 4.62 –
V 0.51 3.63 5.00 2.47 – 1.22 3.87 4.85 –
VI 0.48 3.63 4.98 2.51 – 0.98 3.85 4.78 –
VII 0.53 3.73 4.96 2.51 – 1.20 4.26 4.79 –
VIII 0.55 3.82 4.95 2.55 – 0.97 4.40 4.91 –
IX 0.55 3.87 4.95 2.69 – 1.34 4.40 5.03 –
X 0.54 3.93 4.93 2.74 – 1.07 4.45 5.02 –
XI 0.46 4.00 4.93 3.10 – 0.83 4.29 5.04 –
XII 0.45 4.13 4.95 2.99 – 0.74 4.31 4.97 –
1 Šajā instrumentu kategorijā jauno darījumu apjoms un atlikums sakrīt. Perioda beigu dati. 1 For this instrument category, new business and outstanding amounts coincide. End-of-period. 2 Šajā instrumentu kategorijā mājsaimniecību un nefinanšu sabiedrību dati summēti un iekļauti mājsaimniecību sektorā. 2 For this instrument category, households and non-financial corporations are merged and allocated to the household sector.
VIDĒJĀS SVĒRTĀS PROCENTU LIKMES MFI DARĪJUMOS AR REZIDENTU NEFINANŠU SABIEDRĪBĀM UN MĀJSAIMNIECĪBĀM LATOS (TURPINĀJUMS) WEIGHTED AVERAGE INTEREST RATES CHARGED BY MFIs IN TRANSACTIONS WITH RESIDENT NON-FINANCIAL CORPORATIONS AND HOUSEHOLDS IN LATS (CONT.) (%)
21.a
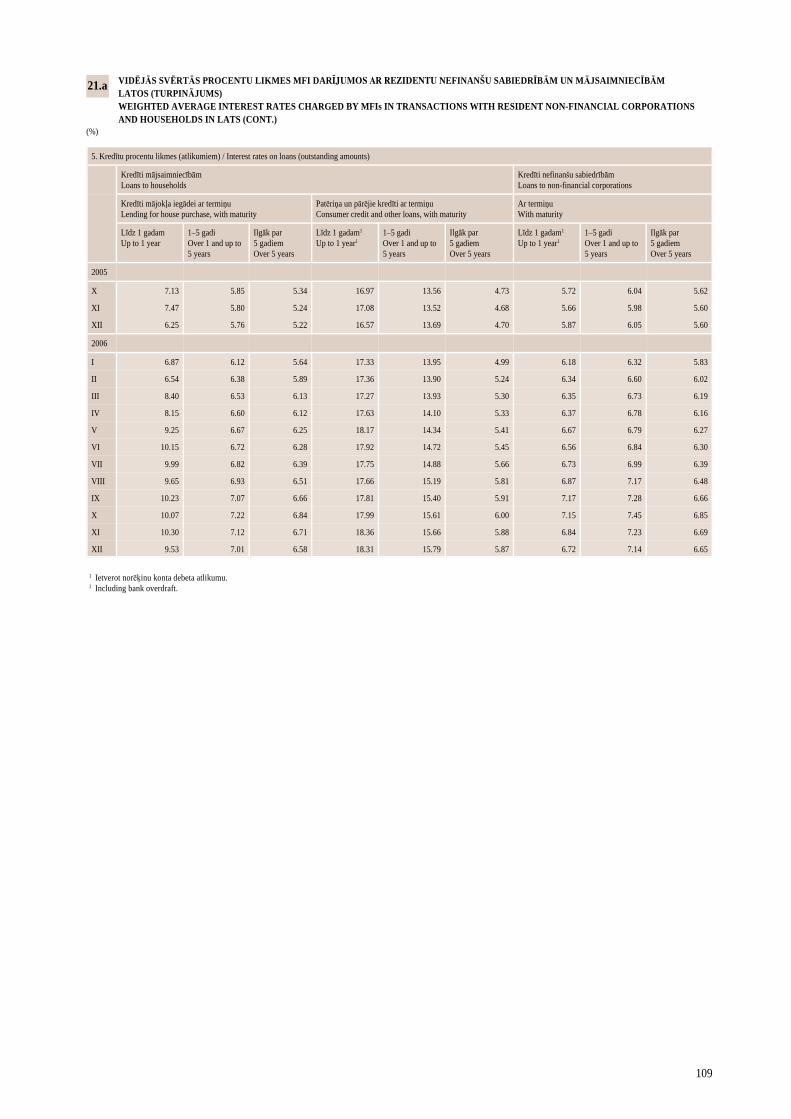
109
VIDĒJĀS SVĒRTĀS PROCENTU LIKMES MFI DARĪJUMOS AR REZIDENTU NEFINANŠU SABIEDRĪBĀM UN MĀJSAIMNIECĪBĀM LATOS (TURPINĀJUMS) WEIGHTED AVERAGE INTEREST RATES CHARGED BY MFIs IN TRANSACTIONS WITH RESIDENT NON-FINANCIAL CORPORATIONS AND HOUSEHOLDS IN LATS (CONT.) (%)
5. Kredītu procentu likmes (atlikumiem) / Interest rates on loans (outstanding amounts)
Kredīti mājsaimniecībām Loans to households
Kredīti nefinanšu sabiedrībām Loans to non-financial corporations
Kredīti mājokļa iegādei ar termiņu Lending for house purchase, with maturity
Patēriņa un pārējie kredīti ar termiņu Consumer credit and other loans, with maturity
Ar termiņu With maturity
Līdz 1 gadam Up to 1 year
1–5 gadi Over 1 and up to 5 years
Ilgāk par 5 gadiem Over 5 years
Līdz 1 gadam1 Up to 1 year1
1–5 gadi Over 1 and up to 5 years
Ilgāk par 5 gadiem Over 5 years
Līdz 1 gadam1 Up to 1 year1
1–5 gadi Over 1 and up to 5 years
Ilgāk par 5 gadiem Over 5 years
2005
X 7.13 5.85 5.34 16.97 13.56 4.73 5.72 6.04 5.62
XI 7.47 5.80 5.24 17.08 13.52 4.68 5.66 5.98 5.60
XII 6.25 5.76 5.22 16.57 13.69 4.70 5.87 6.05 5.60
2006
I 6.87 6.12 5.64 17.33 13.95 4.99 6.18 6.32 5.83
II 6.54 6.38 5.89 17.36 13.90 5.24 6.34 6.60 6.02
III 8.40 6.53 6.13 17.27 13.93 5.30 6.35 6.73 6.19
IV 8.15 6.60 6.12 17.63 14.10 5.33 6.37 6.78 6.16
V 9.25 6.67 6.25 18.17 14.34 5.41 6.67 6.79 6.27
VI 10.15 6.72 6.28 17.92 14.72 5.45 6.56 6.84 6.30
VII 9.99 6.82 6.39 17.75 14.88 5.66 6.73 6.99 6.39
VIII 9.65 6.93 6.51 17.66 15.19 5.81 6.87 7.17 6.48
IX 10.23 7.07 6.66 17.81 15.40 5.91 7.17 7.28 6.66
X 10.07 7.22 6.84 17.99 15.61 6.00 7.15 7.45 6.85
XI 10.30 7.12 6.71 18.36 15.66 5.88 6.84 7.23 6.69
XII 9.53 7.01 6.58 18.31 15.79 5.87 6.72 7.14 6.65
21.a
1 Ietverot norēķinu konta debeta atlikumu. 1 Including bank overdraft.
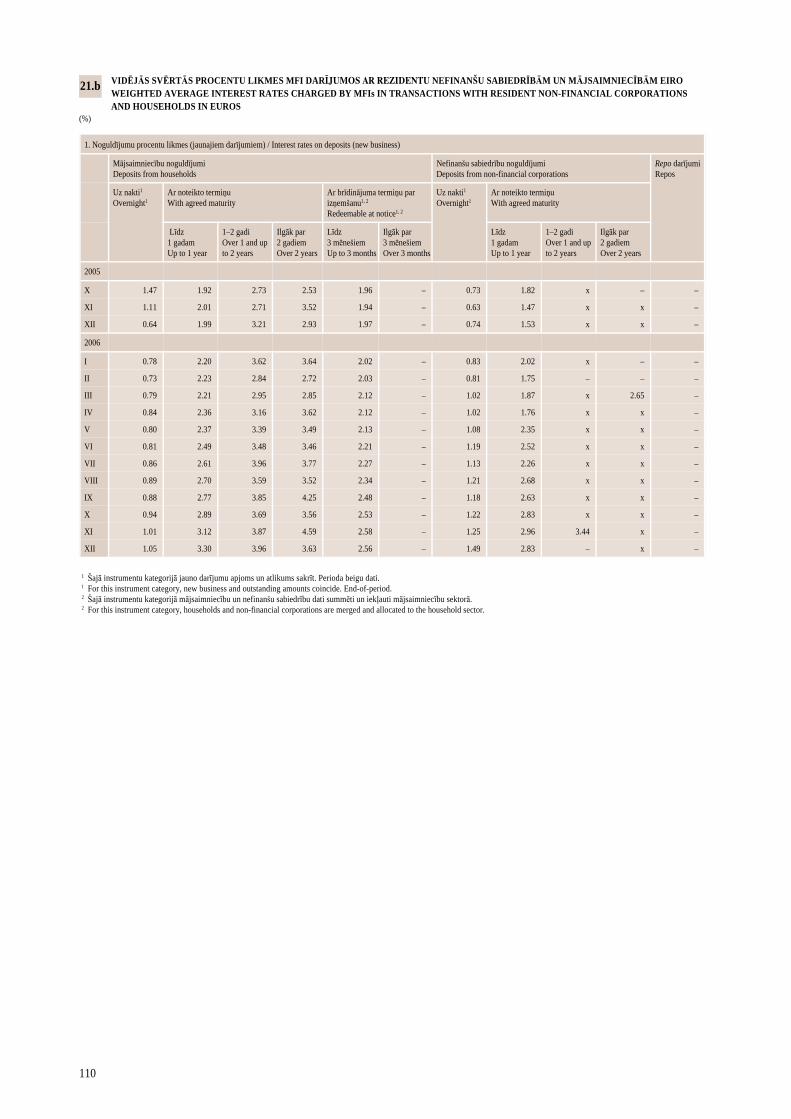
110
1 Šajā instrumentu kategorijā jauno darījumu apjoms un atlikums sakrīt. Perioda beigu dati. 1 For this instrument category, new business and outstanding amounts coincide. End-of-period. 2 Šajā instrumentu kategorijā mājsaimniecību un nefinanšu sabiedrību dati summēti un iekļauti mājsaimniecību sektorā. 2 For this instrument category, households and non-financial corporations are merged and allocated to the household sector.
VIDĒJĀS SVĒRTĀS PROCENTU LIKMES MFI DARĪJUMOS AR REZIDENTU NEFINANŠU SABIEDRĪBĀM UN MĀJSAIMNIECĪBĀM EIRO WEIGHTED AVERAGE INTEREST RATES CHARGED BY MFIs IN TRANSACTIONS WITH RESIDENT NON-FINANCIAL CORPORATIONS AND HOUSEHOLDS IN EUROS (%)
21.b
1. Noguldījumu procentu likmes (jaunajiem darījumiem) / Interest rates on deposits (new business)
Mājsaimniecību noguldījumi Deposits from households
Nefinanšu sabiedrību noguldījumi Deposits from non-financial corporations
Repo darījumi Repos
Uz nakti1 Overnight1
Ar noteikto termiņu With agreed maturity
Ar brīdinājuma termiņu par izņemšanu1, 2 Redeemable at notice1, 2
Uz nakti1 Overnight1
Ar noteikto termiņu With agreed maturity
Līdz 1 gadam Up to 1 year
1–2 gadi Over 1 and up to 2 years
Ilgāk par 2 gadiem Over 2 years
Līdz 3 mēnešiem Up to 3 months
Ilgāk par 3 mēnešiem Over 3 months
Līdz 1 gadam Up to 1 year
1–2 gadi Over 1 and up to 2 years
Ilgāk par 2 gadiem Over 2 years
2005
X 1.47 1.92 2.73 2.53 1.96 – 0.73 1.82 x – –
XI 1.11 2.01 2.71 3.52 1.94 – 0.63 1.47 x x –
XII 0.64 1.99 3.21 2.93 1.97 – 0.74 1.53 x x –
2006
I 0.78 2.20 3.62 3.64 2.02 – 0.83 2.02 x – –
II 0.73 2.23 2.84 2.72 2.03 – 0.81 1.75 – – –
III 0.79 2.21 2.95 2.85 2.12 – 1.02 1.87 x 2.65 –
IV 0.84 2.36 3.16 3.62 2.12 – 1.02 1.76 x x –
V 0.80 2.37 3.39 3.49 2.13 – 1.08 2.35 x x –
VI 0.81 2.49 3.48 3.46 2.21 – 1.19 2.52 x x –
VII 0.86 2.61 3.96 3.77 2.27 – 1.13 2.26 x x –
VIII 0.89 2.70 3.59 3.52 2.34 – 1.21 2.68 x x –
IX 0.88 2.77 3.85 4.25 2.48 – 1.18 2.63 x x –
X 0.94 2.89 3.69 3.56 2.53 – 1.22 2.83 x x –
XI 1.01 3.12 3.87 4.59 2.58 – 1.25 2.96 3.44 x –
XII 1.05 3.30 3.96 3.63 2.56 – 1.49 2.83 – x –
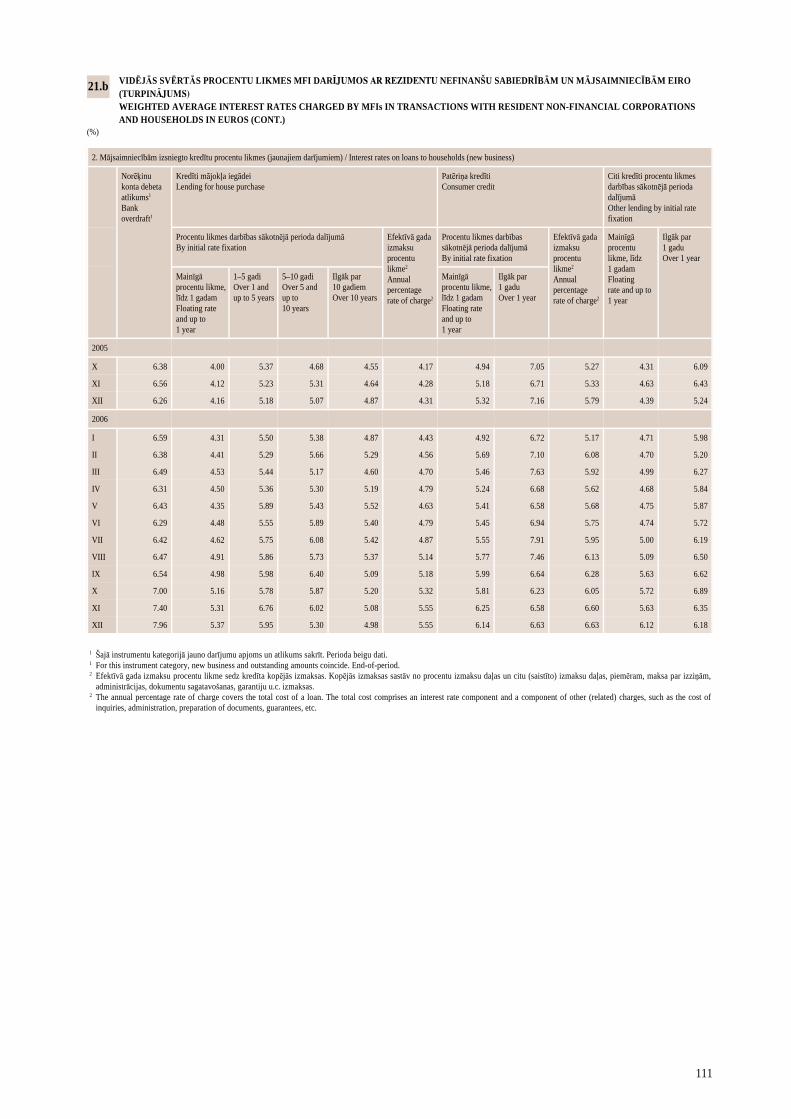
111
2. Mājsaimniecībām izsniegto kredītu procentu likmes (jaunajiem darījumiem) / Interest rates on loans to households (new business)
Norēķinu konta debeta atlikums1 Bank overdraft1
Kredīti mājokļa iegādei Lending for house purchase
Patēriņa kredīti Consumer credit
Citi kredīti procentu likmes darbības sākotnējā perioda dalījumā Other lending by initial rate fixation
Procentu likmes darbības sākotnējā perioda dalījumā By initial rate fixation
Efektīvā gada izmaksu procentu likme2 Annual percentage rate of charge2
Procentu likmes darbības sākotnējā perioda dalījumā By initial rate fixation
Efektīvā gada izmaksu procentu likme2 Annual percentage rate of charge2
Mainīgā procentu likme, līdz 1 gadam Floating rate and up to 1 year
Ilgāk par 1 gadu Over 1 year
Mainīgā procentu likme, līdz 1 gadam Floating rate and up to 1 year
1–5 gadi Over 1 and up to 5 years
5–10 gadi Over 5 and up to 10 years
Ilgāk par 10 gadiem Over 10 years
Mainīgā procentu likme, līdz 1 gadam Floating rate and up to 1 year
Ilgāk par 1 gadu Over 1 year
2005
X 6.38 4.00 5.37 4.68 4.55 4.17 4.94 7.05 5.27 4.31 6.09
XI 6.56 4.12 5.23 5.31 4.64 4.28 5.18 6.71 5.33 4.63 6.43
XII 6.26 4.16 5.18 5.07 4.87 4.31 5.32 7.16 5.79 4.39 5.24
2006
I 6.59 4.31 5.50 5.38 4.87 4.43 4.92 6.72 5.17 4.71 5.98
II 6.38 4.41 5.29 5.66 5.29 4.56 5.69 7.10 6.08 4.70 5.20
III 6.49 4.53 5.44 5.17 4.60 4.70 5.46 7.63 5.92 4.99 6.27
IV 6.31 4.50 5.36 5.30 5.19 4.79 5.24 6.68 5.62 4.68 5.84
V 6.43 4.35 5.89 5.43 5.52 4.63 5.41 6.58 5.68 4.75 5.87
VI 6.29 4.48 5.55 5.89 5.40 4.79 5.45 6.94 5.75 4.74 5.72
VII 6.42 4.62 5.75 6.08 5.42 4.87 5.55 7.91 5.95 5.00 6.19
VIII 6.47 4.91 5.86 5.73 5.37 5.14 5.77 7.46 6.13 5.09 6.50
IX 6.54 4.98 5.98 6.40 5.09 5.18 5.99 6.64 6.28 5.63 6.62
X 7.00 5.16 5.78 5.87 5.20 5.32 5.81 6.23 6.05 5.72 6.89
XI 7.40 5.31 6.76 6.02 5.08 5.55 6.25 6.58 6.60 5.63 6.35
XII 7.96 5.37 5.95 5.30 4.98 5.55 6.14 6.63 6.63 6.12 6.18
1 Šajā instrumentu kategorijā jauno darījumu apjoms un atlikums sakrīt. Perioda beigu dati. 1 For this instrument category, new business and outstanding amounts coincide. End-of-period. 2 Efektīvā gada izmaksu procentu likme sedz kredīta kopējās izmaksas. Kopējās izmaksas sastāv no procentu izmaksu daļas un citu (saistīto) izmaksu daļas, piemēram, maksa par izziņām, administrācijas, dokumentu sagatavošanas, garantiju u.c. izmaksas. 2 The annual percentage rate of charge covers the total cost of a loan. The total cost comprises an interest rate component and a component of other (related) charges, such as the cost of inquiries, administration, preparation of documents, guarantees, etc.
VIDĒJĀS SVĒRTĀS PROCENTU LIKMES MFI DARĪJUMOS AR REZIDENTU NEFINANŠU SABIEDRĪBĀM UN MĀJSAIMNIECĪBĀM EIRO (TURPINĀJUMS) WEIGHTED AVERAGE INTEREST RATES CHARGED BY MFIs IN TRANSACTIONS WITH RESIDENT NON-FINANCIAL CORPORATIONS AND HOUSEHOLDS IN EUROS (CONT.) (%)
21.b
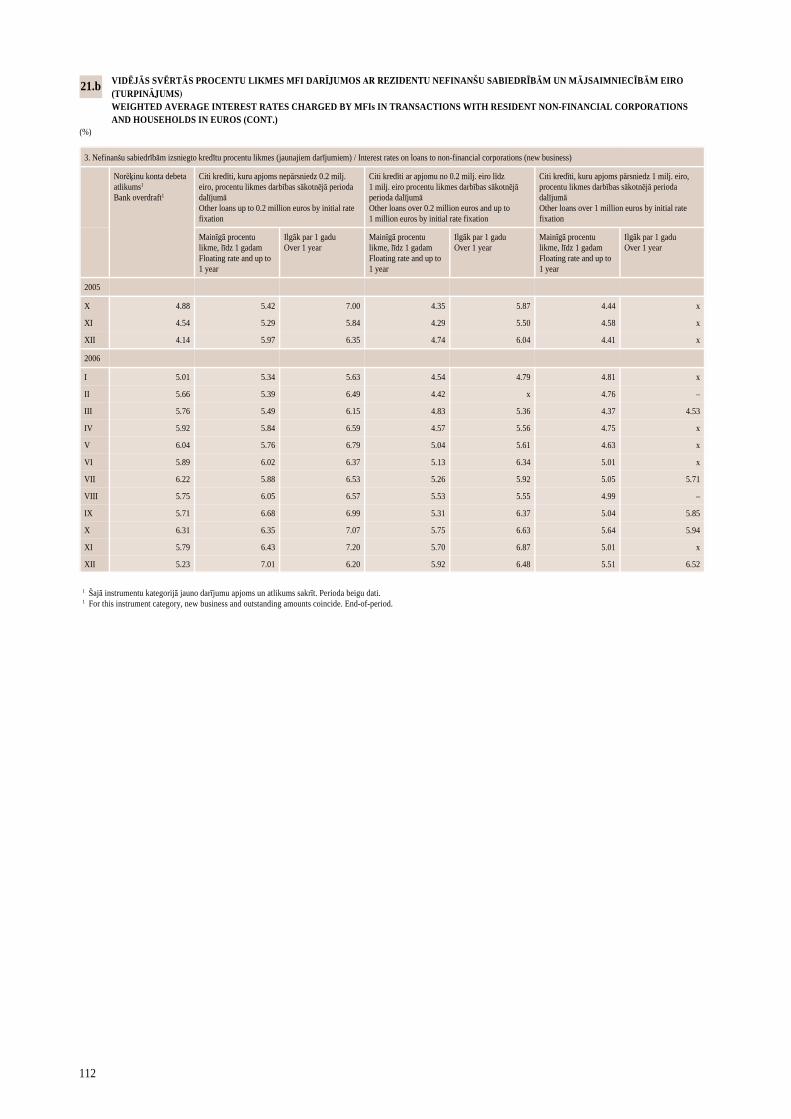
112
VIDĒJĀS SVĒRTĀS PROCENTU LIKMES MFI DARĪJUMOS AR REZIDENTU NEFINANŠU SABIEDRĪBĀM UN MĀJSAIMNIECĪBĀM EIRO (TURPINĀJUMS) WEIGHTED AVERAGE INTEREST RATES CHARGED BY MFIs IN TRANSACTIONS WITH RESIDENT NON-FINANCIAL CORPORATIONS AND HOUSEHOLDS IN EUROS (CONT.) (%)
3. Nefinanšu sabiedrībām izsniegto kredītu procentu likmes (jaunajiem darījumiem) / Interest rates on loans to non-financial corporations (new business)
Norēķinu konta debeta atlikums1 Bank overdraft1
Citi kredīti, kuru apjoms nepārsniedz 0.2 milj. eiro, procentu likmes darbības sākotnējā perioda dalījumā Other loans up to 0.2 million euros by initial rate fixation
Citi kredīti ar apjomu no 0.2 milj. eiro līdz 1 milj. eiro procentu likmes darbības sākotnējā perioda dalījumā Other loans over 0.2 million euros and up to 1 million euros by initial rate fixation
Citi kredīti, kuru apjoms pārsniedz 1 milj. eiro, procentu likmes darbības sākotnējā perioda dalījumā Other loans over 1 million euros by initial rate fixation
Mainīgā procentu likme, līdz 1 gadam Floating rate and up to 1 year
Ilgāk par 1 gadu Over 1 year
Mainīgā procentu likme, līdz 1 gadam Floating rate and up to 1 year
Ilgāk par 1 gadu Over 1 year
Mainīgā procentu likme, līdz 1 gadam Floating rate and up to 1 year
Ilgāk par 1 gadu Over 1 year
2005
X 4.88 5.42 7.00 4.35 5.87 4.44 x
XI 4.54 5.29 5.84 4.29 5.50 4.58 x
XII 4.14 5.97 6.35 4.74 6.04 4.41 x
2006
I 5.01 5.34 5.63 4.54 4.79 4.81 x
II 5.66 5.39 6.49 4.42 x 4.76 –
III 5.76 5.49 6.15 4.83 5.36 4.37 4.53
IV 5.92 5.84 6.59 4.57 5.56 4.75 x
V 6.04 5.76 6.79 5.04 5.61 4.63 x
VI 5.89 6.02 6.37 5.13 6.34 5.01 x
VII 6.22 5.88 6.53 5.26 5.92 5.05 5.71
VIII 5.75 6.05 6.57 5.53 5.55 4.99 –
IX 5.71 6.68 6.99 5.31 6.37 5.04 5.85
X 6.31 6.35 7.07 5.75 6.63 5.64 5.94
XI 5.79 6.43 7.20 5.70 6.87 5.01 x
XII 5.23 7.01 6.20 5.92 6.48 5.51 6.52
21.b
1 Šajā instrumentu kategorijā jauno darījumu apjoms un atlikums sakrīt. Perioda beigu dati. 1 For this instrument category, new business and outstanding amounts coincide. End-of-period.
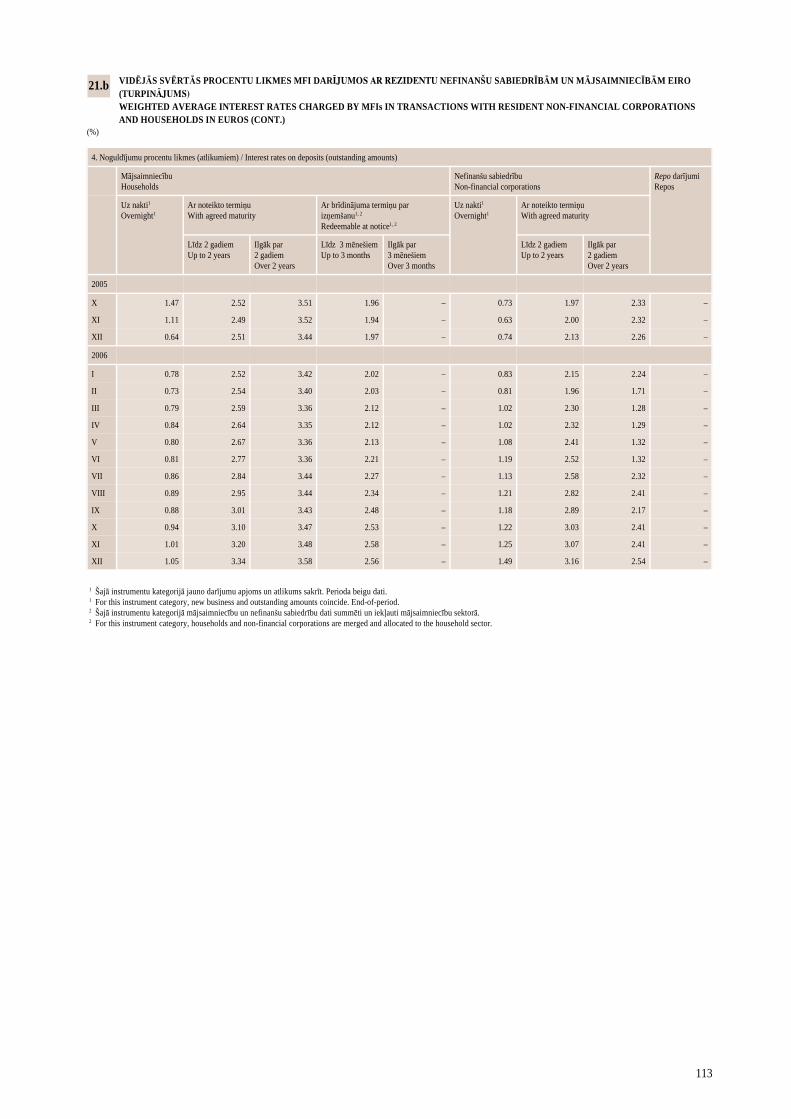
113
4. Noguldījumu procentu likmes (atlikumiem) / Interest rates on deposits (outstanding amounts)
Mājsaimniecību Households
Nefinanšu sabiedrību Non-financial corporations
Repo darījumi Repos
Uz nakti1 Overnight1
Ar noteikto termiņu With agreed maturity
Ar brīdinājuma termiņu par izņemšanu1, 2 Redeemable at notice1, 2
Uz nakti1 Overnight1
Ar noteikto termiņu With agreed maturity
Līdz 2 gadiem Up to 2 years
Ilgāk par 2 gadiem Over 2 years
Līdz 3 mēnešiem Up to 3 months
Ilgāk par 3 mēnešiem Over 3 months
Līdz 2 gadiem Up to 2 years
Ilgāk par 2 gadiem Over 2 years
2005
X 1.47 2.52 3.51 1.96 – 0.73 1.97 2.33 –
XI 1.11 2.49 3.52 1.94 – 0.63 2.00 2.32 –
XII 0.64 2.51 3.44 1.97 – 0.74 2.13 2.26 –
2006
I 0.78 2.52 3.42 2.02 – 0.83 2.15 2.24 –
II 0.73 2.54 3.40 2.03 – 0.81 1.96 1.71 –
III 0.79 2.59 3.36 2.12 – 1.02 2.30 1.28 –
IV 0.84 2.64 3.35 2.12 – 1.02 2.32 1.29 –
V 0.80 2.67 3.36 2.13 – 1.08 2.41 1.32 –
VI 0.81 2.77 3.36 2.21 – 1.19 2.52 1.32 –
VII 0.86 2.84 3.44 2.27 – 1.13 2.58 2.32 –
VIII 0.89 2.95 3.44 2.34 – 1.21 2.82 2.41 –
IX 0.88 3.01 3.43 2.48 – 1.18 2.89 2.17 –
X 0.94 3.10 3.47 2.53 – 1.22 3.03 2.41 –
XI 1.01 3.20 3.48 2.58 – 1.25 3.07 2.41 –
XII 1.05 3.34 3.58 2.56 – 1.49 3.16 2.54 –
VIDĒJĀS SVĒRTĀS PROCENTU LIKMES MFI DARĪJUMOS AR REZIDENTU NEFINANŠU SABIEDRĪBĀM UN MĀJSAIMNIECĪBĀM EIRO (TURPINĀJUMS) WEIGHTED AVERAGE INTEREST RATES CHARGED BY MFIs IN TRANSACTIONS WITH RESIDENT NON-FINANCIAL CORPORATIONS AND HOUSEHOLDS IN EUROS (CONT.) (%)
21.b
1 Šajā instrumentu kategorijā jauno darījumu apjoms un atlikums sakrīt. Perioda beigu dati. 1 For this instrument category, new business and outstanding amounts coincide. End-of-period. 2 Šajā instrumentu kategorijā mājsaimniecību un nefinanšu sabiedrību dati summēti un iekļauti mājsaimniecību sektorā. 2 For this instrument category, households and non-financial corporations are merged and allocated to the household sector.
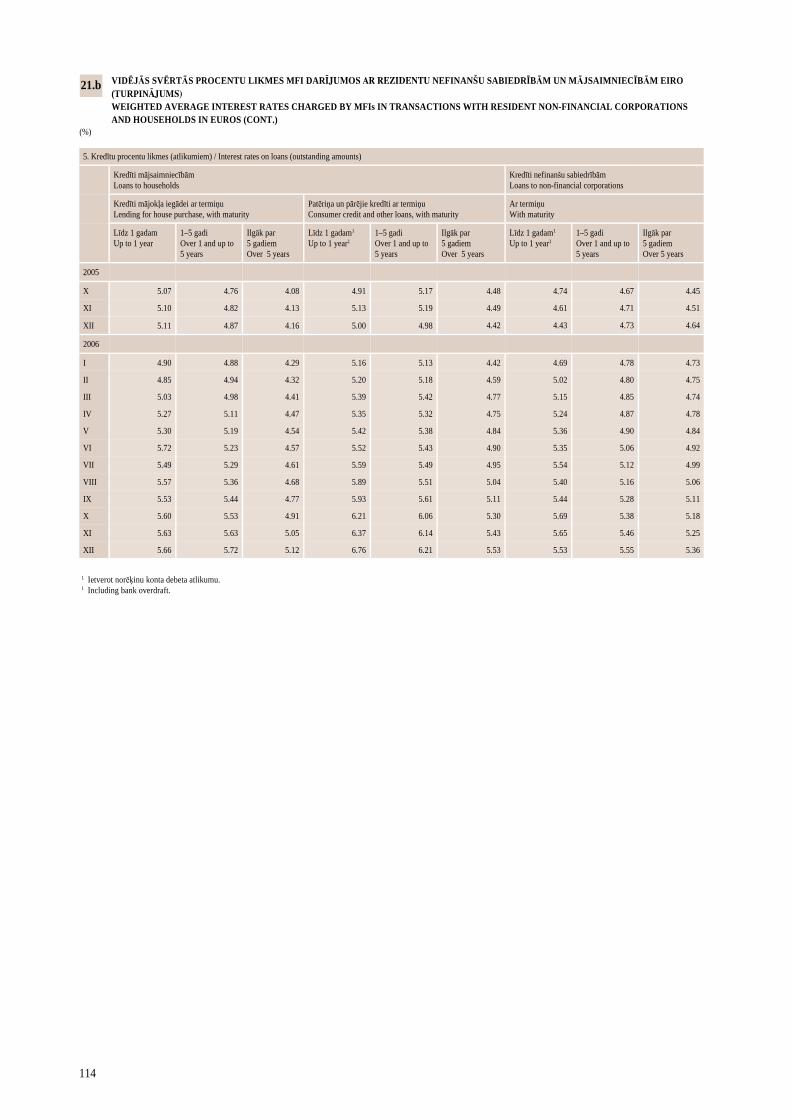
114
5. Kredītu procentu likmes (atlikumiem) / Interest rates on loans (outstanding amounts)
Kredīti mājsaimniecībām Loans to households
Kredīti nefinanšu sabiedrībām Loans to non-financial corporations
Kredīti mājokļa iegādei ar termiņu Lending for house purchase, with maturity
Patēriņa un pārējie kredīti ar termiņu Consumer credit and other loans, with maturity
Ar termiņu With maturity
Līdz 1 gadam Up to 1 year
1–5 gadi Over 1 and up to 5 years
Ilgāk par 5 gadiem Over 5 years
Līdz 1 gadam1 Up to 1 year1
1–5 gadi Over 1 and up to 5 years
Ilgāk par 5 gadiem Over 5 years
Līdz 1 gadam1 Up to 1 year1
1–5 gadi Over 1 and up to 5 years
Ilgāk par 5 gadiem Over 5 years
2005
X 5.07 4.76 4.08 4.91 5.17 4.48 4.74 4.67 4.45
XI 5.10 4.82 4.13 5.13 5.19 4.49 4.61 4.71 4.51
XII 5.11 4.87 4.16 5.00 4.98 4.42 4.43 4.73 4.64
2006
I 4.90 4.88 4.29 5.16 5.13 4.42 4.69 4.78 4.73
II 4.85 4.94 4.32 5.20 5.18 4.59 5.02 4.80 4.75
III 5.03 4.98 4.41 5.39 5.42 4.77 5.15 4.85 4.74
IV 5.27 5.11 4.47 5.35 5.32 4.75 5.24 4.87 4.78
V 5.30 5.19 4.54 5.42 5.38 4.84 5.36 4.90 4.84
VI 5.72 5.23 4.57 5.52 5.43 4.90 5.35 5.06 4.92
VII 5.49 5.29 4.61 5.59 5.49 4.95 5.54 5.12 4.99
VIII 5.57 5.36 4.68 5.89 5.51 5.04 5.40 5.16 5.06
IX 5.53 5.44 4.77 5.93 5.61 5.11 5.44 5.28 5.11
X 5.60 5.53 4.91 6.21 6.06 5.30 5.69 5.38 5.18
XI 5.63 5.63 5.05 6.37 6.14 5.43 5.65 5.46 5.25
XII 5.66 5.72 5.12 6.76 6.21 5.53 5.53 5.55 5.36
VIDĒJĀS SVĒRTĀS PROCENTU LIKMES MFI DARĪJUMOS AR REZIDENTU NEFINANŠU SABIEDRĪBĀM UN MĀJSAIMNIECĪBĀM EIRO (TURPINĀJUMS) WEIGHTED AVERAGE INTEREST RATES CHARGED BY MFIs IN TRANSACTIONS WITH RESIDENT NON-FINANCIAL CORPORATIONS AND HOUSEHOLDS IN EUROS (CONT.) (%)
21.b
1 Ietverot norēķinu konta debeta atlikumu. 1 Including bank overdraft.
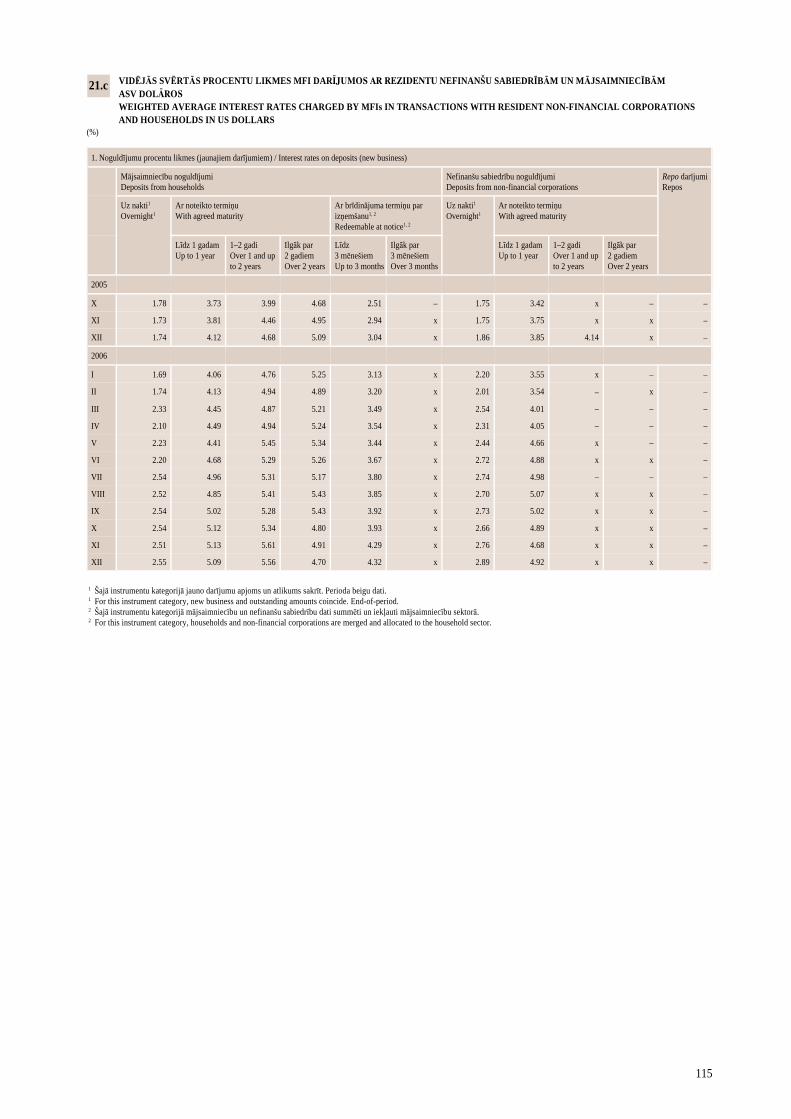
115
VIDĒJĀS SVĒRTĀS PROCENTU LIKMES MFI DARĪJUMOS AR REZIDENTU NEFINANŠU SABIEDRĪBĀM UN MĀJSAIMNIECĪBĀM ASV DOLĀROS WEIGHTED AVERAGE INTEREST RATES CHARGED BY MFIs IN TRANSACTIONS WITH RESIDENT NON-FINANCIAL CORPORATIONS AND HOUSEHOLDS IN US DOLLARS (%)
21.c
1 Šajā instrumentu kategorijā jauno darījumu apjoms un atlikums sakrīt. Perioda beigu dati. 1 For this instrument category, new business and outstanding amounts coincide. End-of-period. 2 Šajā instrumentu kategorijā mājsaimniecību un nefinanšu sabiedrību dati summēti un iekļauti mājsaimniecību sektorā. 2 For this instrument category, households and non-financial corporations are merged and allocated to the household sector.
1. Noguldījumu procentu likmes (jaunajiem darījumiem) / Interest rates on deposits (new business)
Mājsaimniecību noguldījumi Deposits from households
Nefinanšu sabiedrību noguldījumi Deposits from non-financial corporations
Repo darījumi Repos
Uz nakti1 Overnight1
Ar noteikto termiņu With agreed maturity
Ar brīdinājuma termiņu par izņemšanu1, 2 Redeemable at notice1, 2
Uz nakti1 Overnight1
Ar noteikto termiņu With agreed maturity
Līdz 1 gadam Up to 1 year
1–2 gadi Over 1 and up to 2 years
Ilgāk par 2 gadiem Over 2 years
Līdz 3 mēnešiem Up to 3 months
Ilgāk par 3 mēnešiem Over 3 months
Līdz 1 gadam Up to 1 year
1–2 gadi Over 1 and up to 2 years
Ilgāk par 2 gadiem Over 2 years
2005
X 1.78 3.73 3.99 4.68 2.51 – 1.75 3.42 x – –
XI 1.73 3.81 4.46 4.95 2.94 x 1.75 3.75 x x –
XII 1.74 4.12 4.68 5.09 3.04 x 1.86 3.85 4.14 x –
2006
I 1.69 4.06 4.76 5.25 3.13 x 2.20 3.55 x – –
II 1.74 4.13 4.94 4.89 3.20 x 2.01 3.54 – x –
III 2.33 4.45 4.87 5.21 3.49 x 2.54 4.01 – – –
IV 2.10 4.49 4.94 5.24 3.54 x 2.31 4.05 – – –
V 2.23 4.41 5.45 5.34 3.44 x 2.44 4.66 x – –
VI 2.20 4.68 5.29 5.26 3.67 x 2.72 4.88 x x –
VII 2.54 4.96 5.31 5.17 3.80 x 2.74 4.98 – – –
VIII 2.52 4.85 5.41 5.43 3.85 x 2.70 5.07 x x –
IX 2.54 5.02 5.28 5.43 3.92 x 2.73 5.02 x x –
X 2.54 5.12 5.34 4.80 3.93 x 2.66 4.89 x x –
XI 2.51 5.13 5.61 4.91 4.29 x 2.76 4.68 x x –
XII 2.55 5.09 5.56 4.70 4.32 x 2.89 4.92 x x –
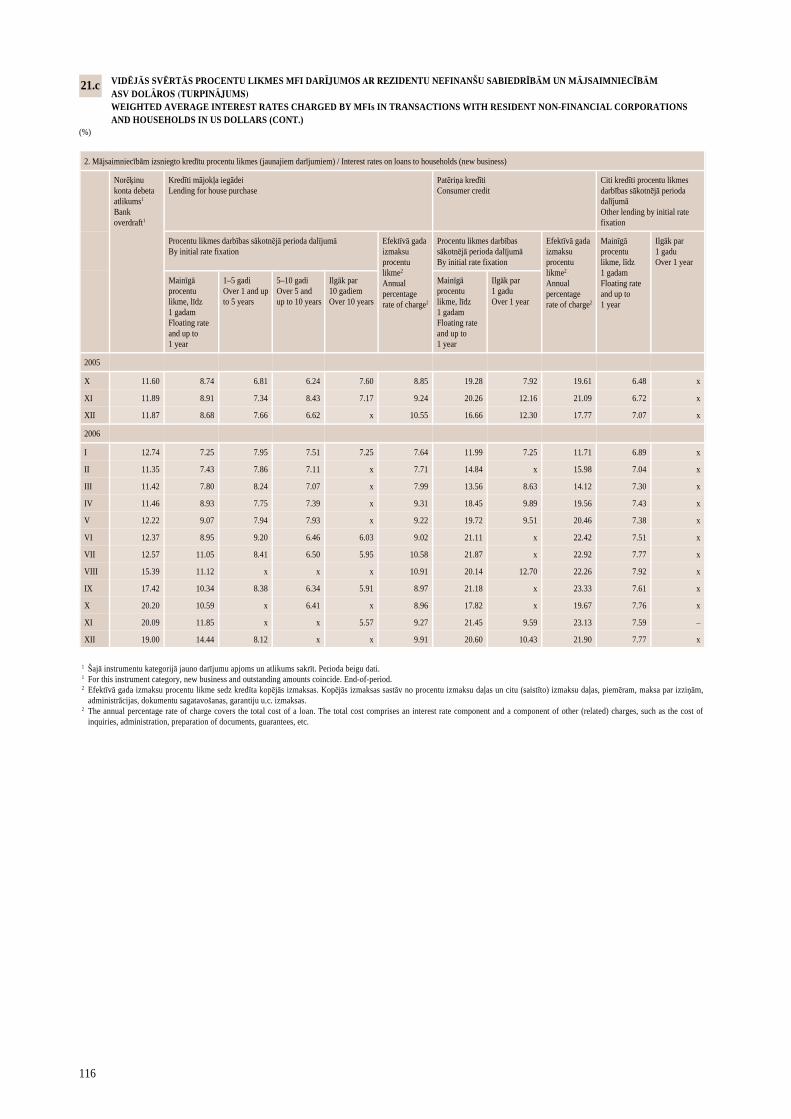
116
2. Mājsaimniecībām izsniegto kredītu procentu likmes (jaunajiem darījumiem) / Interest rates on loans to households (new business)
Norēķinu konta debeta atlikums1 Bank overdraft1
Kredīti mājokļa iegādei Lending for house purchase
Patēriņa kredīti Consumer credit
Citi kredīti procentu likmes darbības sākotnējā perioda dalījumā Other lending by initial rate fixation
Procentu likmes darbības sākotnējā perioda dalījumā By initial rate fixation
Efektīvā gada izmaksu procentu likme2 Annual percentage rate of charge2
Procentu likmes darbības sākotnējā perioda dalījumā By initial rate fixation
Efektīvā gada izmaksu procentu likme2 Annual percentage rate of charge2
Mainīgā procentu likme, līdz 1 gadam Floating rate and up to 1 year
Ilgāk par 1 gadu Over 1 year
Mainīgā procentu likme, līdz 1 gadam Floating rate and up to 1 year
1–5 gadi Over 1 and up to 5 years
5–10 gadi Over 5 and up to 10 years
Ilgāk par 10 gadiem Over 10 years
Mainīgā procentu likme, līdz 1 gadam Floating rate and up to 1 year
Ilgāk par 1 gadu Over 1 year
2005
X 11.60 8.74 6.81 6.24 7.60 8.85 19.28 7.92 19.61 6.48 x
XI 11.89 8.91 7.34 8.43 7.17 9.24 20.26 12.16 21.09 6.72 x
XII 11.87 8.68 7.66 6.62 x 10.55 16.66 12.30 17.77 7.07 x
2006
I 12.74 7.25 7.95 7.51 7.25 7.64 11.99 7.25 11.71 6.89 x
II 11.35 7.43 7.86 7.11 x 7.71 14.84 x 15.98 7.04 x
III 11.42 7.80 8.24 7.07 x 7.99 13.56 8.63 14.12 7.30 x
IV 11.46 8.93 7.75 7.39 x 9.31 18.45 9.89 19.56 7.43 x
V 12.22 9.07 7.94 7.93 x 9.22 19.72 9.51 20.46 7.38 x
VI 12.37 8.95 9.20 6.46 6.03 9.02 21.11 x 22.42 7.51 x
VII 12.57 11.05 8.41 6.50 5.95 10.58 21.87 x 22.92 7.77 x
VIII 15.39 11.12 x x x 10.91 20.14 12.70 22.26 7.92 x
IX 17.42 10.34 8.38 6.34 5.91 8.97 21.18 x 23.33 7.61 x
X 20.20 10.59 x 6.41 x 8.96 17.82 x 19.67 7.76 x
XI 20.09 11.85 x x 5.57 9.27 21.45 9.59 23.13 7.59 –
XII 19.00 14.44 8.12 x x 9.91 20.60 10.43 21.90 7.77 x
VIDĒJĀS SVĒRTĀS PROCENTU LIKMES MFI DARĪJUMOS AR REZIDENTU NEFINANŠU SABIEDRĪBĀM UN MĀJSAIMNIECĪBĀM ASV DOLĀROS (TURPINĀJUMS) WEIGHTED AVERAGE INTEREST RATES CHARGED BY MFIs IN TRANSACTIONS WITH RESIDENT NON-FINANCIAL CORPORATIONS AND HOUSEHOLDS IN US DOLLARS (CONT.) (%)
21.c
1 Šajā instrumentu kategorijā jauno darījumu apjoms un atlikums sakrīt. Perioda beigu dati. 1 For this instrument category, new business and outstanding amounts coincide. End-of-period. 2 Efektīvā gada izmaksu procentu likme sedz kredīta kopējās izmaksas. Kopējās izmaksas sastāv no procentu izmaksu daļas un citu (saistīto) izmaksu daļas, piemēram, maksa par izziņām, administrācijas, dokumentu sagatavošanas, garantiju u.c. izmaksas. 2 The annual percentage rate of charge covers the total cost of a loan. The total cost comprises an interest rate component and a component of other (related) charges, such as the cost of inquiries, administration, preparation of documents, guarantees, etc.
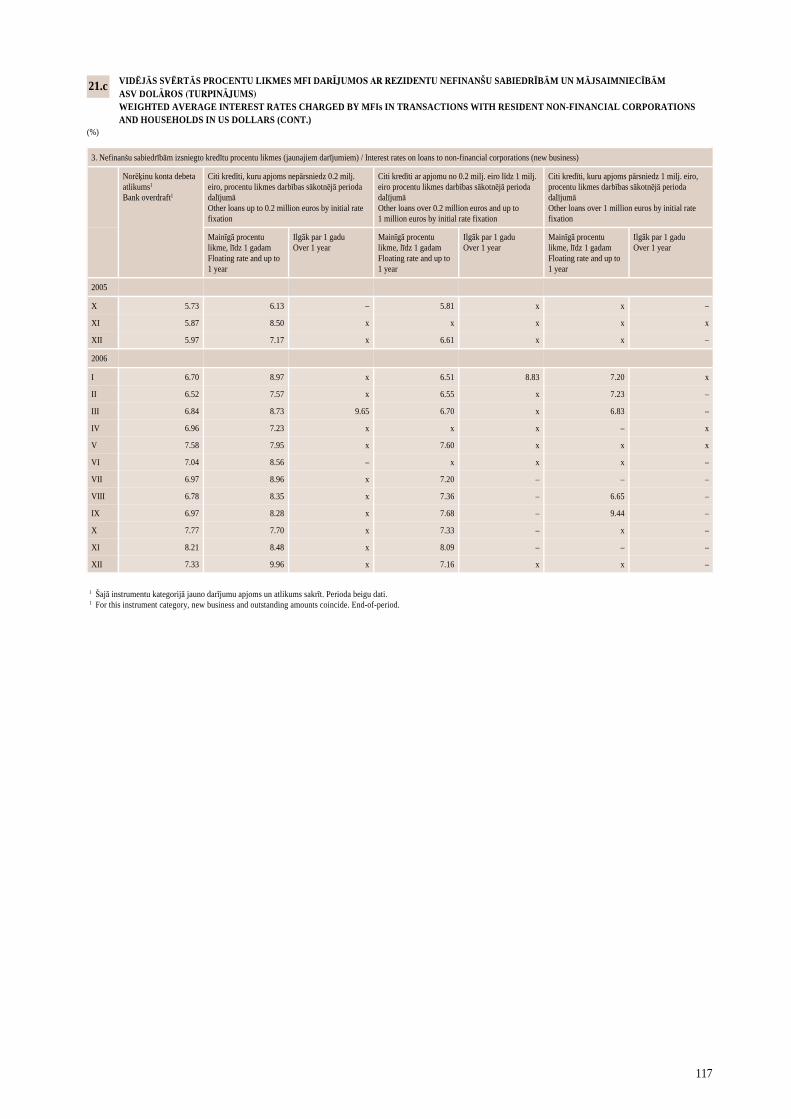
117
3. Nefinanšu sabiedrībām izsniegto kredītu procentu likmes (jaunajiem darījumiem) / Interest rates on loans to non-financial corporations (new business)
Norēķinu konta debeta atlikums1 Bank overdraft1
Citi kredīti, kuru apjoms nepārsniedz 0.2 milj. eiro, procentu likmes darbības sākotnējā perioda dalījumā Other loans up to 0.2 million euros by initial rate fixation
Citi kredīti ar apjomu no 0.2 milj. eiro līdz 1 milj. eiro procentu likmes darbības sākotnējā perioda dalījumā Other loans over 0.2 million euros and up to 1 million euros by initial rate fixation
Citi kredīti, kuru apjoms pārsniedz 1 milj. eiro, procentu likmes darbības sākotnējā perioda dalījumā Other loans over 1 million euros by initial rate fixation
Mainīgā procentu likme, līdz 1 gadam Floating rate and up to 1 year
Ilgāk par 1 gadu Over 1 year
Mainīgā procentu likme, līdz 1 gadam Floating rate and up to 1 year
Ilgāk par 1 gadu Over 1 year
Mainīgā procentu likme, līdz 1 gadam Floating rate and up to 1 year
Ilgāk par 1 gadu Over 1 year
2005
X 5.73 6.13 – 5.81 x x –
XI 5.87 8.50 x x x x x
XII 5.97 7.17 x 6.61 x x –
2006
I 6.70 8.97 x 6.51 8.83 7.20 x
II 6.52 7.57 x 6.55 x 7.23 –
III 6.84 8.73 9.65 6.70 x 6.83 –
IV 6.96 7.23 x x x – x
V 7.58 7.95 x 7.60 x x x
VI 7.04 8.56 – x x x –
VII 6.97 8.96 x 7.20 – – –
VIII 6.78 8.35 x 7.36 – 6.65 –
IX 6.97 8.28 x 7.68 – 9.44 –
X 7.77 7.70 x 7.33 – x –
XI 8.21 8.48 x 8.09 – – –
XII 7.33 9.96 x 7.16 x x –
1 Šajā instrumentu kategorijā jauno darījumu apjoms un atlikums sakrīt. Perioda beigu dati. 1 For this instrument category, new business and outstanding amounts coincide. End-of-period.
VIDĒJĀS SVĒRTĀS PROCENTU LIKMES MFI DARĪJUMOS AR REZIDENTU NEFINANŠU SABIEDRĪBĀM UN MĀJSAIMNIECĪBĀM ASV DOLĀROS (TURPINĀJUMS) WEIGHTED AVERAGE INTEREST RATES CHARGED BY MFIs IN TRANSACTIONS WITH RESIDENT NON-FINANCIAL CORPORATIONS AND HOUSEHOLDS IN US DOLLARS (CONT.) (%)
21.c
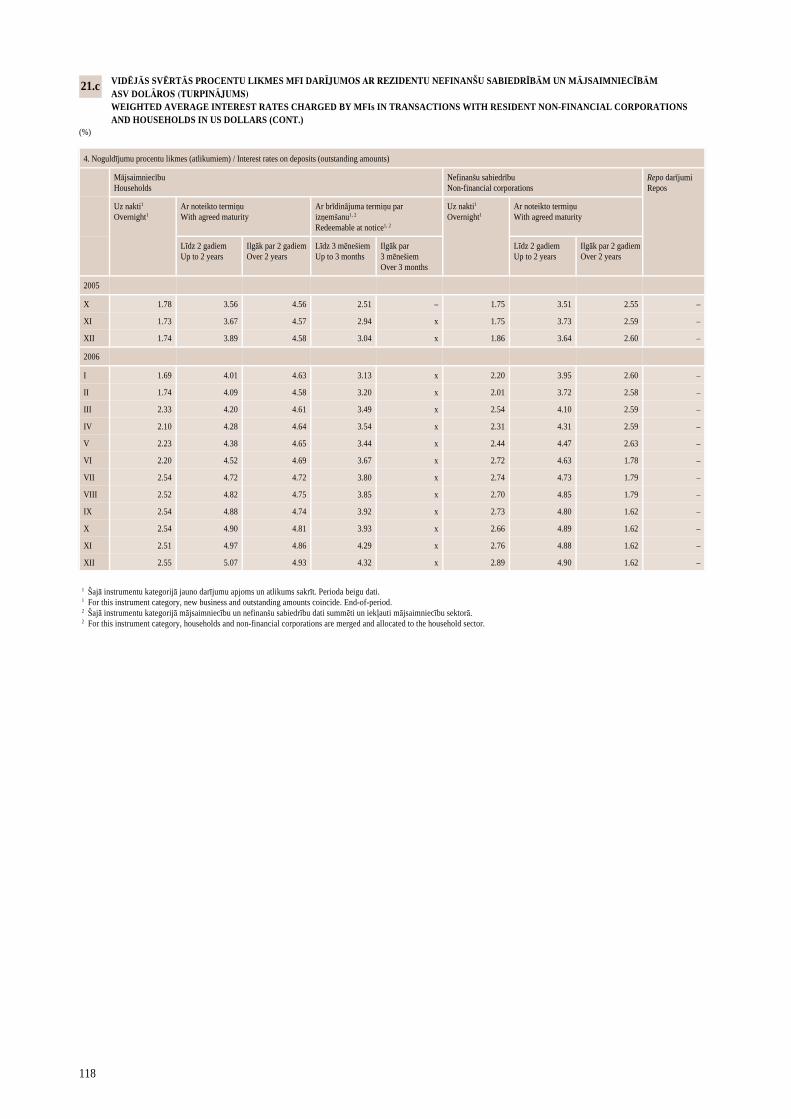
118
4. Noguldījumu procentu likmes (atlikumiem) / Interest rates on deposits (outstanding amounts)
Mājsaimniecību Households
Nefinanšu sabiedrību Non-financial corporations
Repo darījumi Repos
Uz nakti1 Overnight1
Ar noteikto termiņu With agreed maturity
Ar brīdinājuma termiņu par izņemšanu1, 2 Redeemable at notice1, 2
Uz nakti1 Overnight1
Ar noteikto termiņu With agreed maturity
Līdz 2 gadiem Up to 2 years
Ilgāk par 2 gadiem Over 2 years
Līdz 3 mēnešiem Up to 3 months
Ilgāk par 3 mēnešiem Over 3 months
Līdz 2 gadiem Up to 2 years
Ilgāk par 2 gadiem Over 2 years
2005
X 1.78 3.56 4.56 2.51 – 1.75 3.51 2.55 –
XI 1.73 3.67 4.57 2.94 x 1.75 3.73 2.59 –
XII 1.74 3.89 4.58 3.04 x 1.86 3.64 2.60 –
2006
I 1.69 4.01 4.63 3.13 x 2.20 3.95 2.60 –
II 1.74 4.09 4.58 3.20 x 2.01 3.72 2.58 –
III 2.33 4.20 4.61 3.49 x 2.54 4.10 2.59 –
IV 2.10 4.28 4.64 3.54 x 2.31 4.31 2.59 –
V 2.23 4.38 4.65 3.44 x 2.44 4.47 2.63 –
VI 2.20 4.52 4.69 3.67 x 2.72 4.63 1.78 –
VII 2.54 4.72 4.72 3.80 x 2.74 4.73 1.79 –
VIII 2.52 4.82 4.75 3.85 x 2.70 4.85 1.79 –
IX 2.54 4.88 4.74 3.92 x 2.73 4.80 1.62 –
X 2.54 4.90 4.81 3.93 x 2.66 4.89 1.62 –
XI 2.51 4.97 4.86 4.29 x 2.76 4.88 1.62 –
XII 2.55 5.07 4.93 4.32 x 2.89 4.90 1.62 –
1 Šajā instrumentu kategorijā jauno darījumu apjoms un atlikums sakrīt. Perioda beigu dati. 1 For this instrument category, new business and outstanding amounts coincide. End-of-period. 2 Šajā instrumentu kategorijā mājsaimniecību un nefinanšu sabiedrību dati summēti un iekļauti mājsaimniecību sektorā. 2 For this instrument category, households and non-financial corporations are merged and allocated to the household sector.
VIDĒJĀS SVĒRTĀS PROCENTU LIKMES MFI DARĪJUMOS AR REZIDENTU NEFINANŠU SABIEDRĪBĀM UN MĀJSAIMNIECĪBĀM ASV DOLĀROS (TURPINĀJUMS) WEIGHTED AVERAGE INTEREST RATES CHARGED BY MFIs IN TRANSACTIONS WITH RESIDENT NON-FINANCIAL CORPORATIONS AND HOUSEHOLDS IN US DOLLARS (CONT.) (%)
21.c
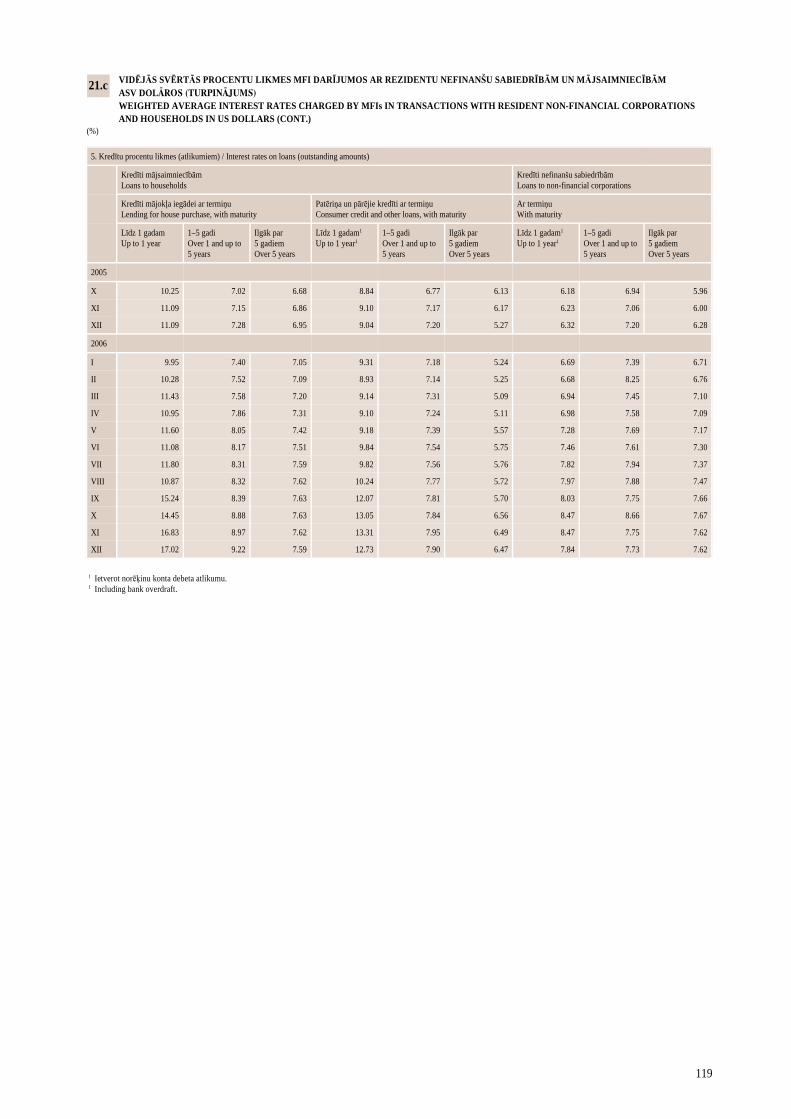
119
1 Ietverot norēķinu konta debeta atlikumu. 1 Including bank overdraft.
VIDĒJĀS SVĒRTĀS PROCENTU LIKMES MFI DARĪJUMOS AR REZIDENTU NEFINANŠU SABIEDRĪBĀM UN MĀJSAIMNIECĪBĀM ASV DOLĀROS (TURPINĀJUMS) WEIGHTED AVERAGE INTEREST RATES CHARGED BY MFIs IN TRANSACTIONS WITH RESIDENT NON-FINANCIAL CORPORATIONS AND HOUSEHOLDS IN US DOLLARS (CONT.) (%)
21.c
5. Kredītu procentu likmes (atlikumiem) / Interest rates on loans (outstanding amounts)
Kredīti mājsaimniecībām Loans to households
Kredīti nefinanšu sabiedrībām Loans to non-financial corporations
Kredīti mājokļa iegādei ar termiņu Lending for house purchase, with maturity
Patēriņa un pārējie kredīti ar termiņu Consumer credit and other loans, with maturity
Ar termiņu With maturity
Līdz 1 gadam Up to 1 year
1–5 gadi Over 1 and up to 5 years
Ilgāk par 5 gadiem Over 5 years
Līdz 1 gadam1 Up to 1 year1
1–5 gadi Over 1 and up to 5 years
Ilgāk par 5 gadiem Over 5 years
Līdz 1 gadam1 Up to 1 year1
1–5 gadi Over 1 and up to 5 years
Ilgāk par 5 gadiem Over 5 years
2005
X 10.25 7.02 6.68 8.84 6.77 6.13 6.18 6.94 5.96
XI 11.09 7.15 6.86 9.10 7.17 6.17 6.23 7.06 6.00
XII 11.09 7.28 6.95 9.04 7.20 5.27 6.32 7.20 6.28
2006
I 9.95 7.40 7.05 9.31 7.18 5.24 6.69 7.39 6.71
II 10.28 7.52 7.09 8.93 7.14 5.25 6.68 8.25 6.76
III 11.43 7.58 7.20 9.14 7.31 5.09 6.94 7.45 7.10
IV 10.95 7.86 7.31 9.10 7.24 5.11 6.98 7.58 7.09
V 11.60 8.05 7.42 9.18 7.39 5.57 7.28 7.69 7.17
VI 11.08 8.17 7.51 9.84 7.54 5.75 7.46 7.61 7.30
VII 11.80 8.31 7.59 9.82 7.56 5.76 7.82 7.94 7.37
VIII 10.87 8.32 7.62 10.24 7.77 5.72 7.97 7.88 7.47
IX 15.24 8.39 7.63 12.07 7.81 5.70 8.03 7.75 7.66
X 14.45 8.88 7.63 13.05 7.84 6.56 8.47 8.66 7.67
XI 16.83 8.97 7.62 13.31 7.95 6.49 8.47 7.75 7.62
XII 17.02 9.22 7.59 12.73 7.90 6.47 7.84 7.73 7.62
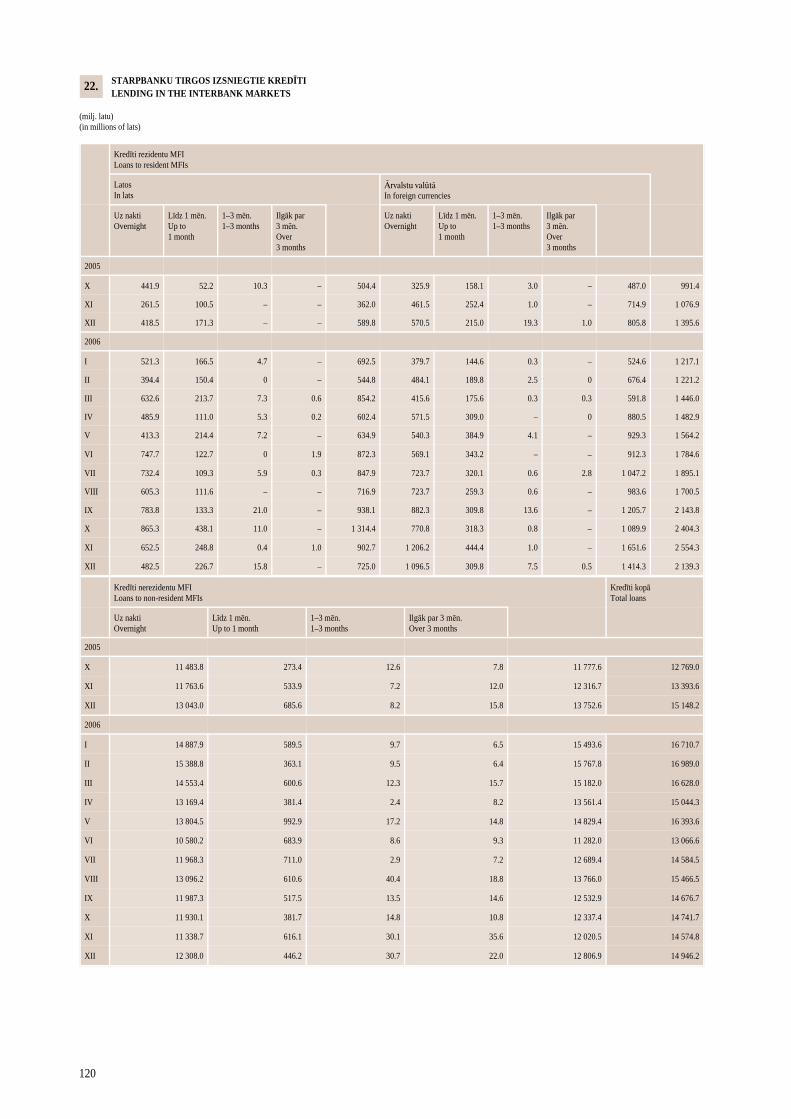
120
STARPBANKU TIRGOS IZSNIEGTIE KREDĪTI LENDING IN THE INTERBANK MARKETS (milj. latu) (in millions of lats)
Kredīti rezidentu MFI Loans to resident MFIs
Latos In lats
Ārvalstu valūtā In foreign currencies
Uz nakti Overnight
Līdz 1 mēn. Up to 1 month
1–3 mēn. 1–3 months
Ilgāk par 3 mēn. Over 3 months
Uz nakti Overnight
Līdz 1 mēn. Up to 1 month
1–3 mēn. 1–3 months
Ilgāk par 3 mēn. Over 3 months
2005
X 441.9 52.2 10.3 – 504.4 325.9 158.1 3.0 – 487.0 991.4
XI 261.5 100.5 – – 362.0 461.5 252.4 1.0 – 714.9 1 076.9
XII 418.5 171.3 – – 589.8 570.5 215.0 19.3 1.0 805.8 1 395.6
2006
I 521.3 166.5 4.7 – 692.5 379.7 144.6 0.3 – 524.6 1 217.1
II 394.4 150.4 0 – 544.8 484.1 189.8 2.5 0 676.4 1 221.2
III 632.6 213.7 7.3 0.6 854.2 415.6 175.6 0.3 0.3 591.8 1 446.0
IV 485.9 111.0 5.3 0.2 602.4 571.5 309.0 – 0 880.5 1 482.9
V 413.3 214.4 7.2 – 634.9 540.3 384.9 4.1 – 929.3 1 564.2
VI 747.7 122.7 0 1.9 872.3 569.1 343.2 – – 912.3 1 784.6
VII 732.4 109.3 5.9 0.3 847.9 723.7 320.1 0.6 2.8 1 047.2 1 895.1
VIII 605.3 111.6 – – 716.9 723.7 259.3 0.6 – 983.6 1 700.5
IX 783.8 133.3 21.0 – 938.1 882.3 309.8 13.6 – 1 205.7 2 143.8
X 865.3 438.1 11.0 – 1 314.4 770.8 318.3 0.8 – 1 089.9 2 404.3
XI 652.5 248.8 0.4 1.0 902.7 1 206.2 444.4 1.0 – 1 651.6 2 554.3
XII 482.5 226.7 15.8 – 725.0 1 096.5 309.8 7.5 0.5 1 414.3 2 139.3
22.
Kredīti nerezidentu MFI Loans to non-resident MFIs
Kredīti kopā Total loans
Uz nakti Overnight
Līdz 1 mēn. Up to 1 month
1–3 mēn. 1–3 months
Ilgāk par 3 mēn. Over 3 months
2005
X 11 483.8 273.4 12.6 7.8 11 777.6 12 769.0
XI 11 763.6 533.9 7.2 12.0 12 316.7 13 393.6
XII 13 043.0 685.6 8.2 15.8 13 752.6 15 148.2
2006
I 14 887.9 589.5 9.7 6.5 15 493.6 16 710.7
II 15 388.8 363.1 9.5 6.4 15 767.8 16 989.0
III 14 553.4 600.6 12.3 15.7 15 182.0 16 628.0
IV 13 169.4 381.4 2.4 8.2 13 561.4 15 044.3
V 13 804.5 992.9 17.2 14.8 14 829.4 16 393.6
VI 10 580.2 683.9 8.6 9.3 11 282.0 13 066.6
VII 11 968.3 711.0 2.9 7.2 12 689.4 14 584.5
VIII 13 096.2 610.6 40.4 18.8 13 766.0 15 466.5
IX 11 987.3 517.5 13.5 14.6 12 532.9 14 676.7
X 11 930.1 381.7 14.8 10.8 12 337.4 14 741.7
XI 11 338.7 616.1 30.1 35.6 12 020.5 14 574.8
XII 12 308.0 446.2 30.7 22.0 12 806.9 14 946.2
22.
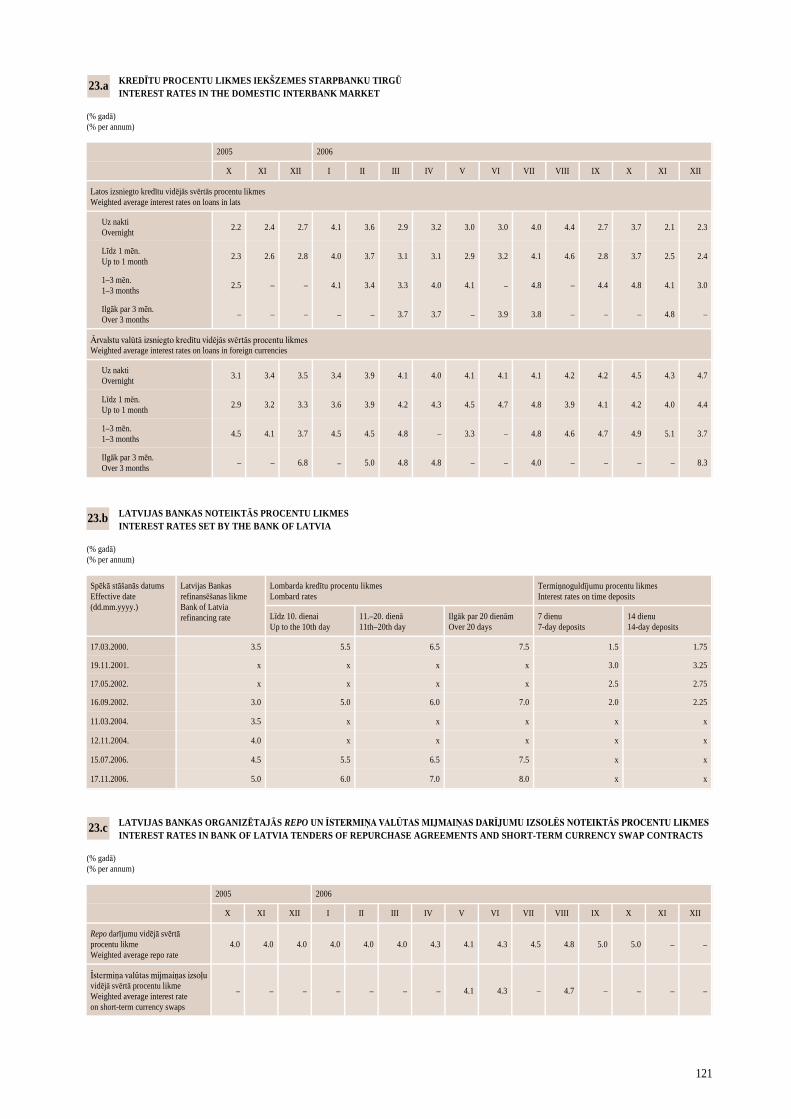
121
KREDĪTU PROCENTU LIKMES IEKŠZEMES STARPBANKU TIRGŪ INTEREST RATES IN THE DOMESTIC INTERBANK MARKET (% gadā) (% per annum)
2005
X XI XII I II III IV V VI VII VIII IX X XI XII
Latos izsniegto kredītu vidējās svērtās procentu likmes Weighted average interest rates on loans in lats
Uz nakti Overnight 2.2 2.4 2.7 4.1 3.6 2.9 3.2 3.0 3.0 4.0 4.4 2.7 3.7 2.1 2.3
Līdz 1 mēn. Up to 1 month
2.3 2.6 2.8 4.0 3.7 3.1 3.1 2.9 3.2 4.1 4.6 2.8 3.7 2.5 2.4
1–3 mēn. 1–3 months
2.5 – – 4.1 3.4 3.3 4.0 4.1 – 4.8 – 4.4 4.8 4.1 3.0
Ilgāk par 3 mēn. Over 3 months
– – – – – 3.7 3.7 – 3.9 3.8 – – – 4.8 –
Ārvalstu valūtā izsniegto kredītu vidējās svērtās procentu likmes Weighted average interest rates on loans in foreign currencies
Uz nakti Overnight 3.1 3.4 3.5 3.4 3.9 4.1 4.0 4.1 4.1 4.1 4.2 4.2 4.5 4.3 4.7
Līdz 1 mēn. Up to 1 month 2.9 3.2 3.3 3.6 3.9 4.2 4.3 4.5 4.7 4.8 3.9 4.1 4.2 4.0 4.4
1–3 mēn. 1–3 months 4.5 4.1 3.7 4.5 4.5 4.8 – 3.3 – 4.8 4.6 4.7 4.9 5.1 3.7
Ilgāk par 3 mēn. Over 3 months – – 6.8 – 5.0 4.8 4.8 – – 4.0 – – – – 8.3
2006
23.a
LATVIJAS BANKAS NOTEIKTĀS PROCENTU LIKMES INTEREST RATES SET BY THE BANK OF LATVIA (% gadā) (% per annum)
Spēkā stāšanās datums Effective date (dd.mm.yyyy.)
Lombarda kredītu procentu likmes Lombard rates
Termiņnoguldījumu procentu likmes Interest rates on time deposits
Līdz 10. dienai Up to the 10th day
11.–20. dienā 11th–20th day
Ilgāk par 20 dienām Over 20 days
7 dienu 7-day deposits
14 dienu 14-day deposits
17.03.2000. 3.5 5.5 6.5 7.5 1.5 1.75
19.11.2001. x x x x 3.0 3.25
17.05.2002. x x x x 2.5 2.75
16.09.2002. 3.0 5.0 6.0 7.0 2.0 2.25
11.03.2004. 3.5 x x x x x
Latvijas Bankas refinansēšanas likme Bank of Latvia refinancing rate
12.11.2004. 4.0 x x x x x
15.07.2006. 4.5 5.5 6.5 7.5 x x
17.11.2006. 5.0 6.0 7.0 8.0 x x
23.b
LATVIJAS BANKAS ORGANIZĒTAJĀS REPO UN ĪSTERMIŅA VALŪTAS MIJMAIŅAS DARĪJUMU IZSOLĒS NOTEIKTĀS PROCENTU LIKMES INTEREST RATES IN BANK OF LATVIA TENDERS OF REPURCHASE AGREEMENTS AND SHORT-TERM CURRENCY SWAP CONTRACTS (% gadā) (% per annum)
2005
X XI XII I II III IV V VI VII VIII IX X XI XII
Repo darījumu vidējā svērtā procentu likme Weighted average repo rate
4.0 4.0 4.0 4.0 4.0 4.0 4.3 4.1 4.3 4.5 4.8 5.0 5.0 – –
Īstermiņa valūtas mijmaiņas izsoļu vidējā svērtā procentu likme Weighted average interest rate on short-term currency swaps
– – – – – – – 4.1 4.3 – 4.7 – – – –
2006
23.c
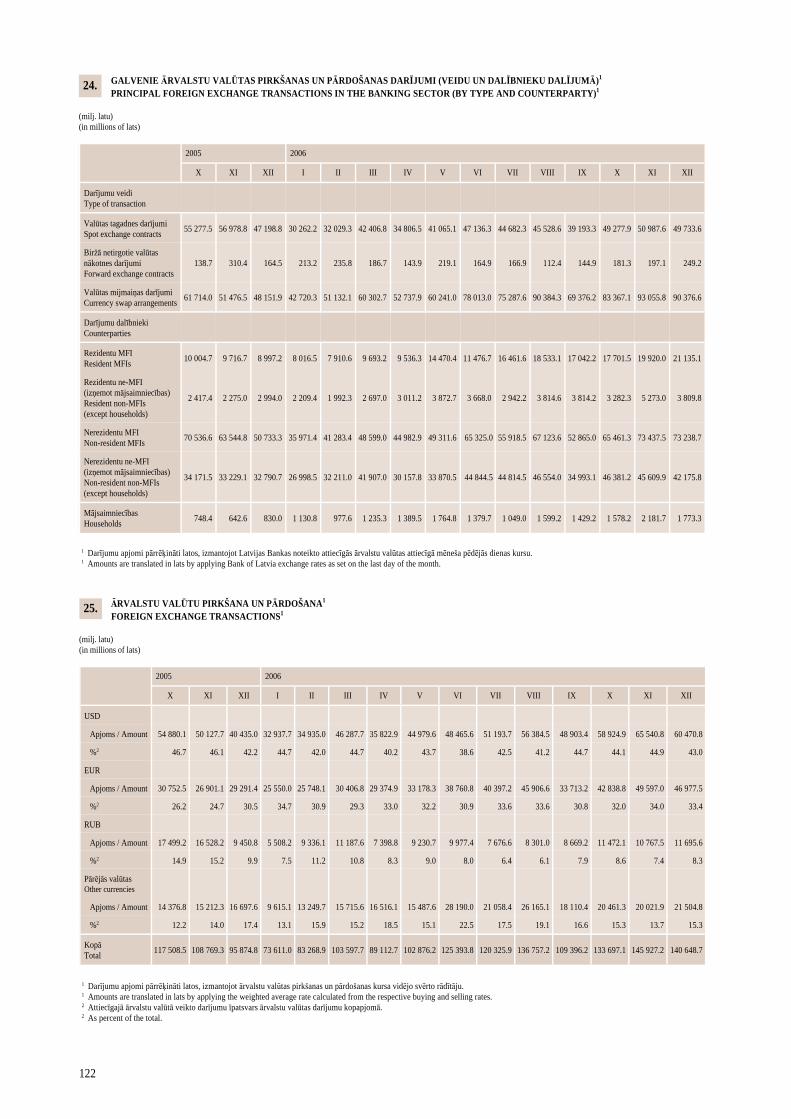
122
GALVENIE ĀRVALSTU VALŪTAS PIRKŠANAS UN PĀRDOŠANAS DARĪJUMI (VEIDU UN DALĪBNIEKU DALĪJUMĀ)1 PRINCIPAL FOREIGN EXCHANGE TRANSACTIONS IN THE BANKING SECTOR (BY TYPE AND COUNTERPARTY)1 (milj. latu) (in millions of lats)
2005
X XI XII I II III IV V VI VII VIII IX X XI XII
Darījumu veidi Type of transaction
Valūtas tagadnes darījumi Spot exchange contracts
55 277.5 56 978.8 47 198.8 30 262.2 32 029.3 42 406.8 34 806.5 41 065.1 47 136.3 44 682.3 45 528.6 39 193.3 49 277.9 50 987.6 49 733.6
Biržā netirgotie valūtas nākotnes darījumi Forward exchange contracts
138.7 310.4 164.5 213.2 235.8 186.7 143.9 219.1 164.9 166.9 112.4 144.9 181.3 197.1 249.2
Valūtas mijmaiņas darījumi Currency swap arrangements
61 714.0 51 476.5 48 151.9 42 720.3 51 132.1 60 302.7 52 737.9 60 241.0 78 013.0 75 287.6 90 384.3 69 376.2 83 367.1 93 055.8 90 376.6
Darījumu dalībnieki Counterparties
Rezidentu MFI Resident MFIs
10 004.7 9 716.7 8 997.2 8 016.5 7 910.6 9 693.2 9 536.3 14 470.4 11 476.7 16 461.6 18 533.1 17 042.2 17 701.5 19 920.0 21 135.1
Rezidentu ne-MFI (izņemot mājsaimniecības) Resident non-MFIs (except households)
2 417.4 2 275.0 2 994.0 2 209.4 1 992.3 2 697.0 3 011.2 3 872.7 3 668.0 2 942.2 3 814.6 3 814.2 3 282.3 5 273.0 3 809.8
Nerezidentu MFI Non-resident MFIs
70 536.6 63 544.8 50 733.3 35 971.4 41 283.4 48 599.0 44 982.9 49 311.6 65 325.0 55 918.5 67 123.6 52 865.0 65 461.3 73 437.5 73 238.7
Nerezidentu ne-MFI (izņemot mājsaimniecības) Non-resident non-MFIs (except households)
34 171.5 33 229.1 32 790.7 26 998.5 32 211.0 41 907.0 30 157.8 33 870.5 44 844.5 44 814.5 46 554.0 34 993.1 46 381.2 45 609.9 42 175.8
Mājsaimniecības Households
748.4 642.6 830.0 1 130.8 977.6 1 235.3 1 389.5 1 764.8 1 379.7 1 049.0 1 599.2 1 429.2 1 578.2 2 181.7 1 773.3
1 Darījumu apjomi pārrēķināti latos, izmantojot Latvijas Bankas noteikto attiecīgās ārvalstu valūtas attiecīgā mēneša pēdējās dienas kursu. 1 Amounts are translated in lats by applying Bank of Latvia exchange rates as set on the last day of the month.
2006
24.
ĀRVALSTU VALŪTU PIRKŠANA UN PĀRDOŠANA1 FOREIGN EXCHANGE TRANSACTIONS1 (milj. latu) (in millions of lats)
2005
X XI XII I II III IV V VI VII VIII IX X XI XII
USD
Apjoms / Amount 54 880.1 50 127.7 40 435.0 32 937.7 34 935.0 46 287.7 35 822.9 44 979.6 48 465.6 51 193.7 56 384.5 48 903.4 58 924.9 65 540.8 60 470.8
%2 46.7 46.1 42.2 44.7 42.0 44.7 40.2 43.7 38.6 42.5 41.2 44.7 44.1 44.9 43.0
EUR
Apjoms / Amount 30 752.5 26 901.1 29 291.4 25 550.0 25 748.1 30 406.8 29 374.9 33 178.3 38 760.8 40 397.2 45 906.6 33 713.2 42 838.8 49 597.0 46 977.5
%2 26.2 24.7 30.5 34.7 30.9 29.3 33.0 32.2 30.9 33.6 33.6 30.8 32.0 34.0 33.4
RUB
Apjoms / Amount 17 499.2 16 528.2 9 450.8 5 508.2 9 336.1 11 187.6 7 398.8 9 230.7 9 977.4 7 676.6 8 301.0 8 669.2 11 472.1 10 767.5 11 695.6
%2 14.9 15.2 9.9 7.5 11.2 10.8 8.3 9.0 8.0 6.4 6.1 7.9 8.6 7.4 8.3
Pārējās valūtas Other currencies
Apjoms / Amount 14 376.8 15 212.3 16 697.6 9 615.1 13 249.7 15 715.6 16 516.1 15 487.6 28 190.0 21 058.4 26 165.1 18 110.4 20 461.3 20 021.9 21 504.8
%2 12.2 14.0 17.4 13.1 15.9 15.2 18.5 15.1 22.5 17.5 19.1 16.6 15.3 13.7 15.3
Kopā Total
117 508.5 108 769.3 95 874.8 73 611.0 83 268.9 103 597.7 89 112.7 102 876.2 125 393.8 120 325.9 136 757.2 109 396.2 133 697.1 145 927.2 140 648.7
1 Darījumu apjomi pārrēķināti latos, izmantojot ārvalstu valūtas pirkšanas un pārdošanas kursa vidējo svērto rādītāju. 1 Amounts are translated in lats by applying the weighted average rate calculated from the respective buying and selling rates. 2 Attiecīgajā ārvalstu valūtā veikto darījumu īpatsvars ārvalstu valūtas darījumu kopapjomā. 2 As percent of the total.
2006
25.
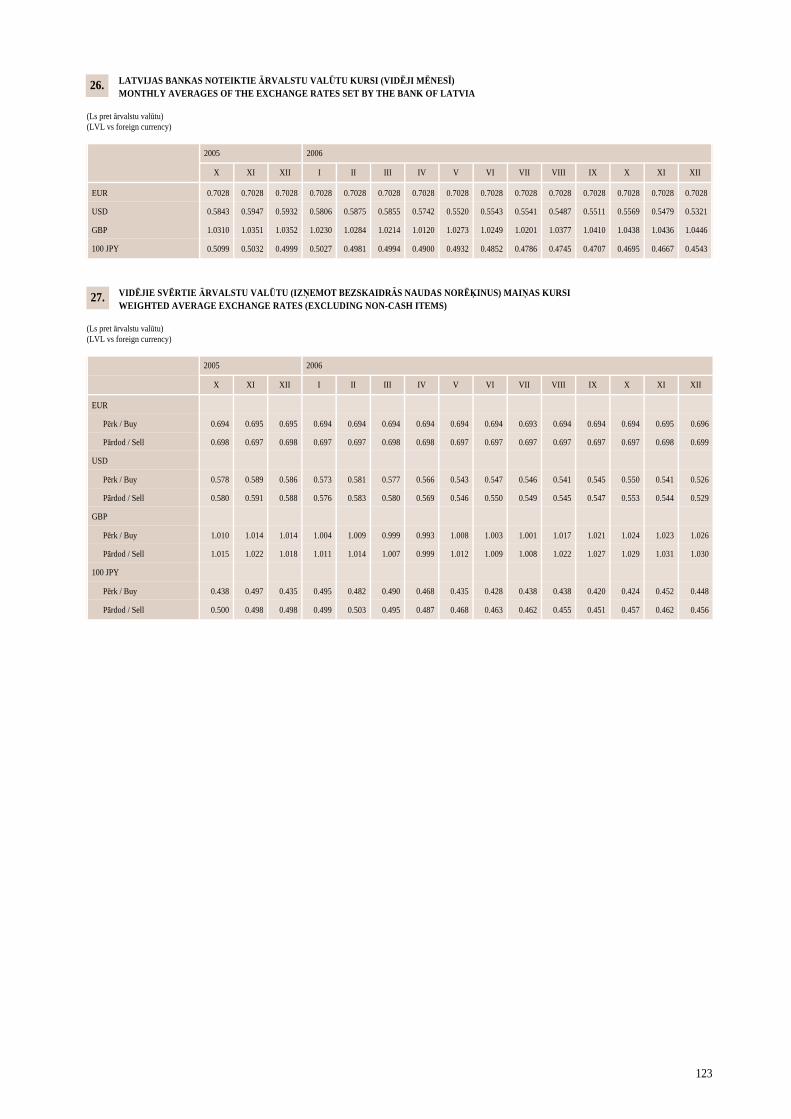
123
VIDĒJIE SVĒRTIE ĀRVALSTU VALŪTU (IZŅEMOT BEZSKAIDRĀS NAUDAS NORĒĶINUS) MAIŅAS KURSI WEIGHTED AVERAGE EXCHANGE RATES (EXCLUDING NON-CASH ITEMS) (Ls pret ārvalstu valūtu) (LVL vs foreign currency)
2005
X XI XII I II III IV V VI VII VIII IX X XI XII
EUR
Pērk / Buy 0.694 0.695 0.695 0.694 0.694 0.694 0.694 0.694 0.694 0.693 0.694 0.694 0.694 0.695 0.696
Pārdod / Sell 0.698 0.697 0.698 0.697 0.697 0.698 0.698 0.697 0.697 0.697 0.697 0.697 0.697 0.698 0.699
USD
Pērk / Buy 0.578 0.589 0.586 0.573 0.581 0.577 0.566 0.543 0.547 0.546 0.541 0.545 0.550 0.541 0.526
Pārdod / Sell 0.580 0.591 0.588 0.576 0.583 0.580 0.569 0.546 0.550 0.549 0.545 0.547 0.553 0.544 0.529
GBP
Pērk / Buy 1.010 1.014 1.014 1.004 1.009 0.999 0.993 1.008 1.003 1.001 1.017 1.021 1.024 1.023 1.026
Pārdod / Sell 1.015 1.022 1.018 1.011 1.014 1.007 0.999 1.012 1.009 1.008 1.022 1.027 1.029 1.031 1.030
100 JPY
Pērk / Buy 0.438 0.497 0.435 0.495 0.482 0.490 0.468 0.435 0.428 0.438 0.438 0.420 0.424 0.452 0.448
Pārdod / Sell 0.500 0.498 0.498 0.499 0.503 0.495 0.487 0.468 0.463 0.462 0.455 0.451 0.457 0.462 0.456
2006
LATVIJAS BANKAS NOTEIKTIE ĀRVALSTU VALŪTU KURSI (VIDĒJI MĒNESĪ) MONTHLY AVERAGES OF THE EXCHANGE RATES SET BY THE BANK OF LATVIA (Ls pret ārvalstu valūtu) (LVL vs foreign currency)
2005
X XI XII I II III IV V VI VII VIII IX X XI XII
EUR 0.7028 0.7028 0.7028 0.7028 0.7028 0.7028 0.7028 0.7028 0.7028 0.7028 0.7028 0.7028 0.7028 0.7028 0.7028
USD 0.5843 0.5947 0.5932 0.5806 0.5875 0.5855 0.5742 0.5520 0.5543 0.5541 0.5487 0.5511 0.5569 0.5479 0.5321
GBP 1.0310 1.0351 1.0352 1.0230 1.0284 1.0214 1.0120 1.0273 1.0249 1.0201 1.0377 1.0410 1.0438 1.0436 1.0446
100 JPY 0.5099 0.5032 0.4999 0.5027 0.4981 0.4994 0.4900 0.4932 0.4852 0.4786 0.4745 0.4707 0.4695 0.4667 0.4543
2006
26.
27.
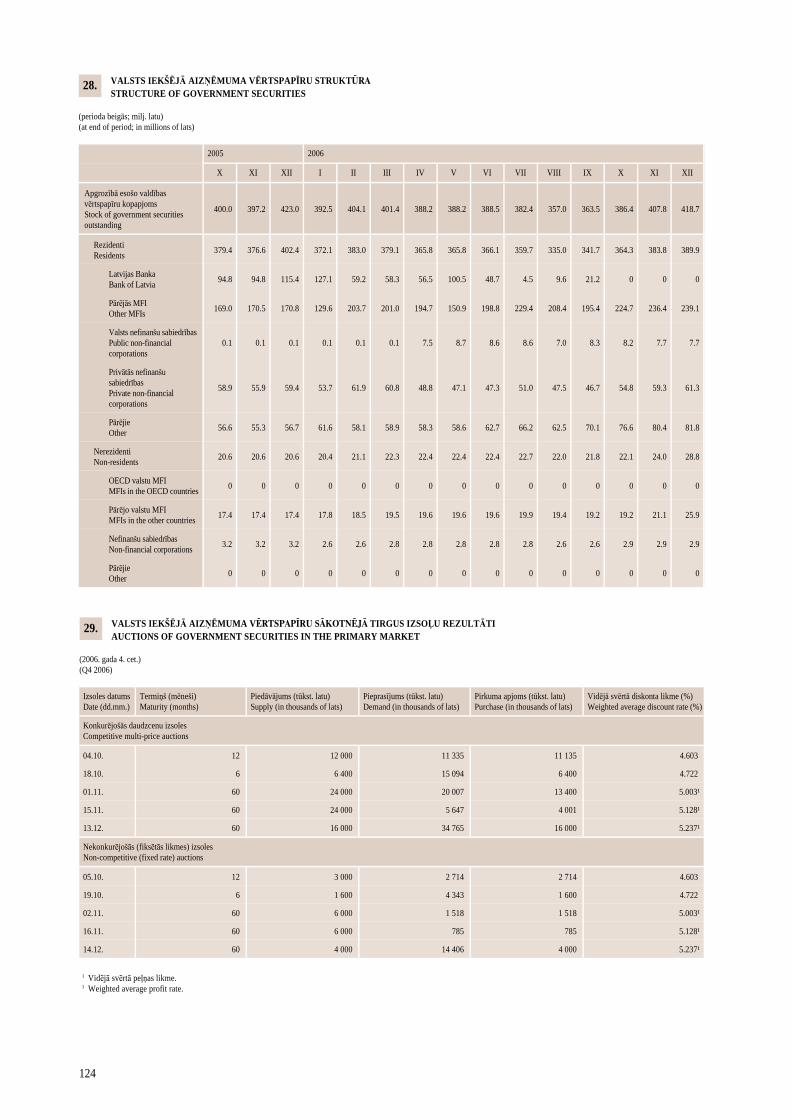
124
VALSTS IEKŠĒJĀ AIZŅĒMUMA VĒRTSPAPĪRU STRUKTŪRA STRUCTURE OF GOVERNMENT SECURITIES (perioda beigās; milj. latu) (at end of period; in millions of lats)
2005
X XI XII I II III IV V VI VII VIII IX X XI XII
Apgrozībā esošo valdības vērtspapīru kopapjoms Stock of government securities outstanding
400.0 397.2 423.0 392.5 404.1 401.4 388.2 388.2 388.5 382.4 357.0 363.5 386.4 407.8 418.7
Rezidenti Residents
379.4 376.6 402.4 372.1 383.0 379.1 365.8 365.8 366.1 359.7 335.0 341.7 364.3 383.8 389.9
Latvijas Banka Bank of Latvia
94.8 94.8 115.4 127.1 59.2 58.3 56.5 100.5 48.7 4.5 9.6 21.2 0 0 0
Pārējās MFI Other MFIs
169.0 170.5 170.8 129.6 203.7 201.0 194.7 150.9 198.8 229.4 208.4 195.4 224.7 236.4 239.1
Valsts nefinanšu sabiedrības Public non-financial corporations
0.1 0.1 0.1 0.1 0.1 0.1 7.5 8.7 8.6 8.6 7.0 8.3 8.2 7.7 7.7
Privātās nefinanšu sabiedrības Private non-financial corporations
58.9 55.9 59.4 53.7 61.9 60.8 48.8 47.1 47.3 51.0 47.5 46.7 54.8 59.3 61.3
Pārējie Other
56.6 55.3 56.7 61.6 58.1 58.9 58.3 58.6 62.7 66.2 62.5 70.1 76.6 80.4 81.8
Nerezidenti Non-residents
20.6 20.6 20.6 20.4 21.1 22.3 22.4 22.4 22.4 22.7 22.0 21.8 22.1 24.0 28.8
OECD valstu MFI MFIs in the OECD countries
0 0 0 0 0 0 0 0 0 0 0 0 0 0 0
Pārējo valstu MFI MFIs in the other countries
17.4 17.4 17.4 17.8 18.5 19.5 19.6 19.6 19.6 19.9 19.4 19.2 19.2 21.1 25.9
Nefinanšu sabiedrības Non-financial corporations
3.2 3.2 3.2 2.6 2.6 2.8 2.8 2.8 2.8 2.8 2.6 2.6 2.9 2.9 2.9
Pārējie Other
0 0 0 0 0 0 0 0 0 0 0 0 0 0 0
2006
28.
VALSTS IEKŠĒJĀ AIZŅĒMUMA VĒRTSPAPĪRU SĀKOTNĒJĀ TIRGUS IZSOĻU REZULTĀTI AUCTIONS OF GOVERNMENT SECURITIES IN THE PRIMARY MARKET (2006. gada 4. cet.) (Q4 2006)
Izsoles datums Date (dd.mm.)
Termiņš (mēneši) Maturity (months)
Piedāvājums (tūkst. latu) Supply (in thousands of lats)
Pieprasījums (tūkst. latu) Demand (in thousands of lats)
Pirkuma apjoms (tūkst. latu) Purchase (in thousands of lats)
Vidējā svērtā diskonta likme (%) Weighted average discount rate (%)
Konkurējošās daudzcenu izsoles Competitive multi-price auctions
04.10. 12 12 000 11 335 11 135 4.603
13.12. 60 16 000 34 765 16 000 5.237¹
Nekonkurējošās (fiksētās likmes) izsoles Non-competitive (fixed rate) auctions
14.12. 60 4 000 14 406 4 000 5.237¹
1 Vidējā svērtā peļņas likme. 1 Weighted average profit rate.
15.11. 60 24 000 5 647 4 001 5.128¹
18.10. 6 6 400 15 094 6 400 4.722
01.11. 60 24 000 20 007 13 400 5.003¹
16.11. 60 6 000 785 785 5.128¹
02.11. 60 6 000 1 518 1 518 5.003¹
19.10. 6 1 600 4 343 1 600 4.722
05.10. 12 3 000 2 714 2 714 4.603
29.
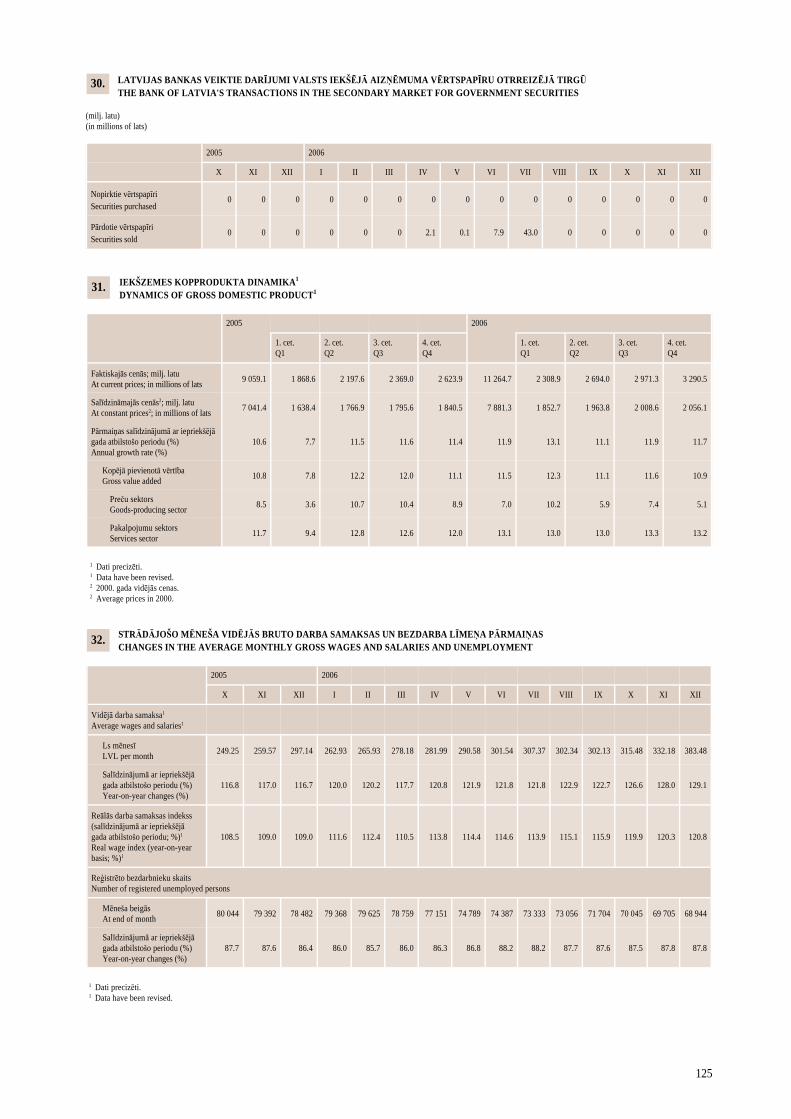
125
STRĀDĀJOŠO MĒNEŠA VIDĒJĀS BRUTO DARBA SAMAKSAS UN BEZDARBA LĪMEŅA PĀRMAIŅAS CHANGES IN THE AVERAGE MONTHLY GROSS WAGES AND SALARIES AND UNEMPLOYMENT
2005 2006
X XI XII I II III IV V VI VII VIII IX
Vidējā darba samaksa1 Average wages and salaries1
Ls mēnesī LVL per month
249.25 259.57 297.14 262.93 265.93 278.18 281.99 290.58 301.54 307.37 302.34 302.13
Salīdzinājumā ar iepriekšējā gada atbilstošo periodu (%) Year-on-year changes (%)
116.8 117.0 116.7 120.0 120.2 117.7 120.8 121.9 121.8 121.8 122.9 122.7
Reālās darba samaksas indekss (salīdzinājumā ar iepriekšējā gada atbilstošo periodu; %)1
Real wage index (year-on-year basis; %)1
108.5 109.0 109.0 111.6 112.4 110.5 113.8 114.4 114.6 113.9 115.1 115.9
Reģistrēto bezdarbnieku skaits Number of registered unemployed persons
Mēneša beigās At end of month
80 044 79 392 78 482 79 368 79 625 78 759 77 151 74 789 74 387 73 333 73 056 71 704
Salīdzinājumā ar iepriekšējā gada atbilstošo periodu (%) Year-on-year changes (%)
87.7 87.6 86.4 86.0 85.7 86.0 86.3 86.8 88.2 88.2 87.7 87.6
1 Dati precizēti. 1 Data have been revised.
X XI XII
315.48 332.18 383.48
126.6 128.0 129.1
119.9 120.3 120.8
70 045 69 705 68 944
87.5 87.8 87.8
32.
LATVIJAS BANKAS VEIKTIE DARĪJUMI VALSTS IEKŠĒJĀ AIZŅĒMUMA VĒRTSPAPĪRU OTRREIZĒJĀ TIRGŪ THE BANK OF LATVIA'S TRANSACTIONS IN THE SECONDARY MARKET FOR GOVERNMENT SECURITIES (milj. latu) (in millions of lats)
2005
X XI XII I II III IV V VI VII VIII IX X XI XII
Nopirktie vērtspapīri Securities purchased
0 0 0 0 0 0 0 0 0 0 0 0 0 0 0
Pārdotie vērtspapīri Securities sold
0 0 0 0 0 0 2.1 0.1 7.9 43.0 0 0 0 0 0
2006
30.
IEKŠZEMES KOPPRODUKTA DINAMIKA1 DYNAMICS OF GROSS DOMESTIC PRODUCT1
2005
1. cet. Q1
2. cet. Q2
3. cet. Q3
4. cet. Q4
1. cet. Q1
2. cet. Q2
3. cet. Q3
4. cet. Q4
Faktiskajās cenās; milj. latu At current prices; in millions of lats
9 059.1 1 868.6 2 197.6 2 369.0 2 623.9 11 264.7 2 308.9 2 694.0 2 971.3 3 290.5
Salīdzināmajās cenās2; milj. latu
At constant prices2; in millions of lats 7 041.4 1 638.4 1 766.9 1 795.6 1 840.5 7 881.3 1 852.7 1 963.8 2 008.6 2 056.1
Pārmaiņas salīdzinājumā ar iepriekšējā gada atbilstošo periodu (%) Annual growth rate (%)
10.6 7.7 11.5 11.6 11.4 11.9 13.1 11.1 11.9 11.7
Kopējā pievienotā vērtība Gross value added
10.8 7.8 12.2 12.0 11.1 11.5 12.3 11.1 11.6 10.9
Preču sektors Goods-producing sector
8.5 3.6 10.7 10.4 8.9 7.0 10.2 5.9 7.4 5.1
Pakalpojumu sektors Services sector
11.7 9.4 12.8 12.6 12.0 13.1 13.0 13.0 13.3 13.2
1 Dati precizēti. 1 Data have been revised. 2 2000. gada vidējās cenas. 2 Average prices in 2000.
2006
31.
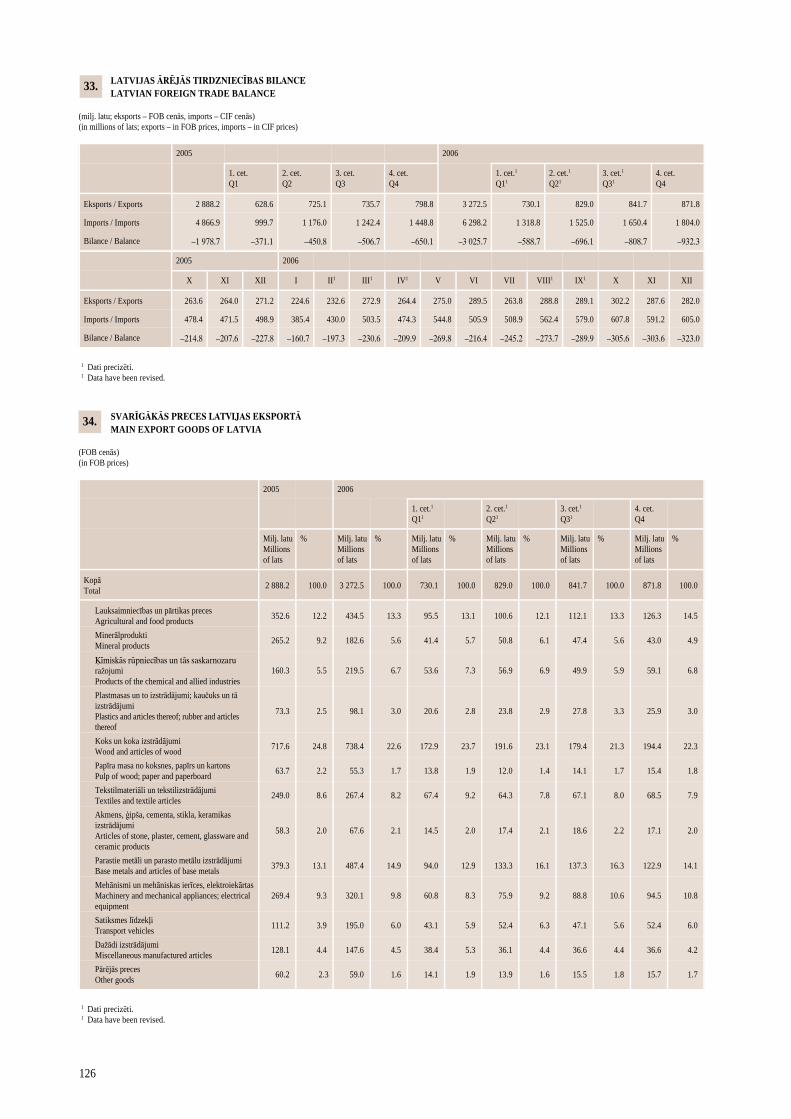
126
SVARĪGĀKĀS PRECES LATVIJAS EKSPORTĀ MAIN EXPORT GOODS OF LATVIA (FOB cenās) (in FOB prices)
2005
1. cet.1 Q11
2. cet.1 Q21
3. cet.1 Q31
4. cet. Q4
Milj. latu Millions of lats
% Milj. latu Millions of lats
% Milj. latu Millions of lats
% Milj. latu Millions of lats
% Milj. latu Millions of lats
% Milj. latu Millions of lats
%
Kopā Total
2 888.2 100.0 3 272.5 100.0 730.1 100.0 829.0 100.0 841.7 100.0 871.8 100.0
Lauksaimniecības un pārtikas preces Agricultural and food products
352.6 12.2 434.5 13.3 95.5 13.1 100.6 12.1 112.1 13.3 126.3 14.5
Minerālprodukti Mineral products
265.2 9.2 182.6 5.6 41.4 5.7 50.8 6.1 47.4 5.6 43.0 4.9
Ķīmiskās rūpniecības un tās saskarnozaru ražojumi Products of the chemical and allied industries
160.3 5.5 219.5 6.7 53.6 7.3 56.9 6.9 49.9 5.9 59.1 6.8
Plastmasas un to izstrādājumi; kaučuks un tā izstrādājumi Plastics and articles thereof; rubber and articles thereof
73.3 2.5 98.1 3.0 20.6 2.8 23.8 2.9 27.8 3.3 25.9 3.0
Koks un koka izstrādājumi Wood and articles of wood
717.6 24.8 738.4 22.6 172.9 23.7 191.6 23.1 179.4 21.3 194.4 22.3
Papīra masa no koksnes, papīrs un kartons Pulp of wood; paper and paperboard
63.7 2.2 55.3 1.7 13.8 1.9 12.0 1.4 14.1 1.7 15.4 1.8
Tekstilmateriāli un tekstilizstrādājumi Textiles and textile articles
249.0 8.6 267.4 8.2 67.4 9.2 64.3 7.8 67.1 8.0 68.5 7.9
Akmens, ģipša, cementa, stikla, keramikas izstrādājumi Articles of stone, plaster, cement, glassware and ceramic products
58.3 2.0 67.6 2.1 14.5 2.0 17.4 2.1 18.6 2.2 17.1 2.0
Parastie metāli un parasto metālu izstrādājumi Base metals and articles of base metals
379.3 13.1 487.4 14.9 94.0 12.9 133.3 16.1 137.3 16.3 122.9 14.1
Mehānismi un mehāniskas ierīces, elektroiekārtas Machinery and mechanical appliances; electrical equipment
269.4 9.3 320.1 9.8 60.8 8.3 75.9 9.2 88.8 10.6 94.5 10.8
Satiksmes līdzekļi Transport vehicles
111.2 3.9 195.0 6.0 43.1 5.9 52.4 6.3 47.1 5.6 52.4 6.0
Dažādi izstrādājumi Miscellaneous manufactured articles
128.1 4.4 147.6 4.5 38.4 5.3 36.1 4.4 36.6 4.4 36.6 4.2
Pārējās preces Other goods
60.2 2.3 59.0 1.6 14.1 1.9 13.9 1.6 15.5 1.8 15.7 1.7
1 Dati precizēti. 1 Data have been revised.
2006
34.
LATVIJAS ĀRĒJĀS TIRDZNIECĪBAS BILANCE LATVIAN FOREIGN TRADE BALANCE (milj. latu; eksports – FOB cenās, imports – CIF cenās) (in millions of lats; exports – in FOB prices, imports – in CIF prices)
2005
1. cet. Q1
2. cet. Q2
3. cet. Q3
4. cet. Q4
1. cet.1 Q11
2. cet.1 Q21
3. cet.1 Q31
4. cet. Q4
Eksports / Exports 2 888.2 628.6 725.1 735.7 798.8 3 272.5 730.1 829.0 841.7 871.8
Imports / Imports 4 866.9 999.7 1 176.0 1 242.4 1 448.8 6 298.2 1 318.8 1 525.0 1 650.4 1 804.0
Bilance / Balance –1 978.7 –371.1 –450.8 –506.7 –650.1 –3 025.7 –588.7 –696.1 –808.7 –932.3
2006
33.
2005 2006
X XI XII I II1 III1 IV1 V VI VII VIII1 IX1
Eksports / Exports 263.6 264.0 271.2 224.6 232.6 272.9 264.4 275.0 289.5 263.8 288.8 289.1
Imports / Imports 478.4 471.5 498.9 385.4 430.0 503.5 474.3 544.8 505.9 508.9 562.4 579.0
Bilance / Balance –214.8 –207.6 –227.8 –160.7 –197.3 –230.6 –209.9 –269.8 –216.4 –245.2 –273.7 –289.9
1 Dati precizēti. 1 Data have been revised.
X XI XII
302.2 287.6 282.0
607.8 591.2 605.0
–305.6 –303.6 –323.0
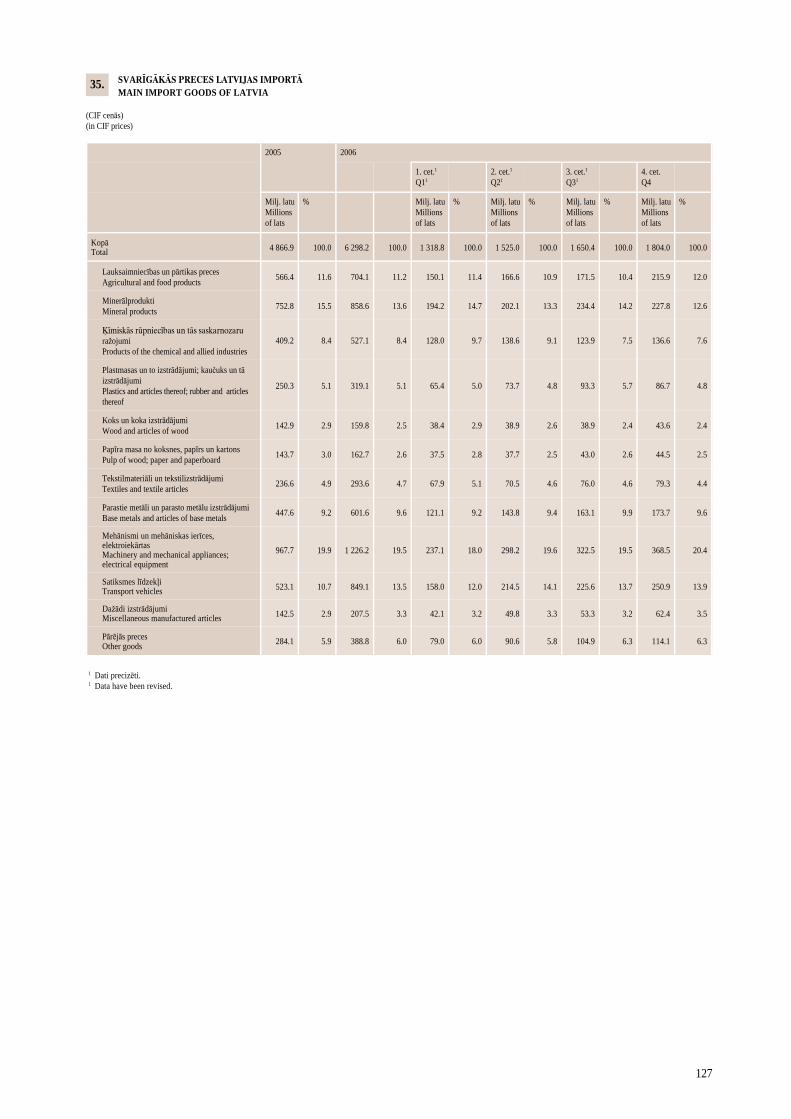
127
SVARĪGĀKĀS PRECES LATVIJAS IMPORTĀ MAIN IMPORT GOODS OF LATVIA (CIF cenās) (in CIF prices)
2005
1. cet.1 Q11
2. cet.1 Q21
3. cet.1 Q31
4. cet. Q4
Milj. latu Millions of lats
% Milj. latu Millions of lats
% Milj. latu Millions of lats
% Milj. latu Millions of lats
% Milj. latu Millions of lats
%
Kopā Total 4 866.9 100.0 6 298.2 100.0 1 318.8 100.0 1 525.0 100.0 1 650.4 100.0 1 804.0 100.0
Lauksaimniecības un pārtikas preces Agricultural and food products
566.4 11.6 704.1 11.2 150.1 11.4 166.6 10.9 171.5 10.4 215.9 12.0
Minerālprodukti Mineral products
752.8 15.5 858.6 13.6 194.2 14.7 202.1 13.3 234.4 14.2 227.8 12.6
Ķīmiskās rūpniecības un tās saskarnozaru ražojumi Products of the chemical and allied industries
409.2 8.4 527.1 8.4 128.0 9.7 138.6 9.1 123.9 7.5 136.6 7.6
Plastmasas un to izstrādājumi; kaučuks un tā izstrādājumi Plastics and articles thereof; rubber and articles thereof
250.3 5.1 319.1 5.1 65.4 5.0 73.7 4.8 93.3 5.7 86.7 4.8
Koks un koka izstrādājumi Wood and articles of wood
142.9 2.9 159.8 2.5 38.4 2.9 38.9 2.6 38.9 2.4 43.6 2.4
Papīra masa no koksnes, papīrs un kartons Pulp of wood; paper and paperboard
143.7 3.0 162.7 2.6 37.5 2.8 37.7 2.5 43.0 2.6 44.5 2.5
Tekstilmateriāli un tekstilizstrādājumi Textiles and textile articles
236.6 4.9 293.6 4.7 67.9 5.1 70.5 4.6 76.0 4.6 79.3 4.4
Parastie metāli un parasto metālu izstrādājumi Base metals and articles of base metals
447.6 9.2 601.6 9.6 121.1 9.2 143.8 9.4 163.1 9.9 173.7 9.6
Mehānismi un mehāniskas ierīces, elektroiekārtas Machinery and mechanical appliances; electrical equipment
967.7 19.9 1 226.2 19.5 237.1 18.0 298.2 19.6 322.5 19.5 368.5 20.4
Satiksmes līdzekļi Transport vehicles 523.1 10.7 849.1 13.5 158.0 12.0 214.5 14.1 225.6 13.7 250.9 13.9
Dažādi izstrādājumi Miscellaneous manufactured articles 142.5 2.9 207.5 3.3 42.1 3.2 49.8 3.3 53.3 3.2 62.4 3.5
Pārējās preces Other goods 284.1 5.9 388.8 6.0 79.0 6.0 90.6 5.8 104.9 6.3 114.1 6.3
1 Dati precizēti. 1 Data have been revised.
2006
35.
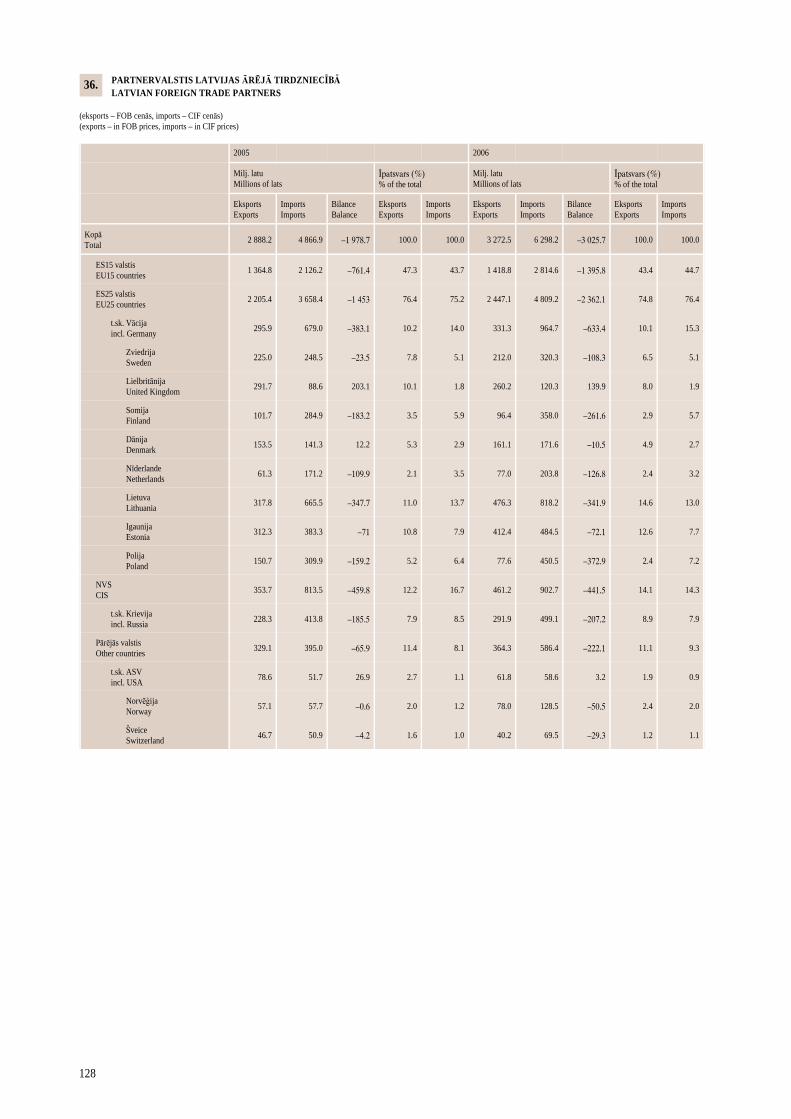
128
PARTNERVALSTIS LATVIJAS ĀRĒJĀ TIRDZNIECĪBĀ LATVIAN FOREIGN TRADE PARTNERS (eksports – FOB cenās, imports – CIF cenās) (exports – in FOB prices, imports – in CIF prices)
2005 2006
Milj. latu Millions of lats
Īpatsvars (%) % of the total
Milj. latu Millions of lats
Īpatsvars (%) % of the total
Eksports Exports
Imports Imports
Bilance Balance
Eksports Exports
Imports Imports
Eksports Exports
Imports Imports
Bilance Balance
Eksports Exports
Imports Imports
Kopā Total
2 888.2 4 866.9 –1 978.7 100.0 100.0 3 272.5 6 298.2 –3 025.7 100.0 100.0
ES15 valstis EU15 countries
1 364.8 2 126.2 –761.4 47.3 43.7 1 418.8 2 814.6 –1 395.8 43.4 44.7
ES25 valstis EU25 countries
2 205.4 3 658.4 –1 453 76.4 75.2 2 447.1 4 809.2 –2 362.1 74.8 76.4
t.sk. Vācija incl. Germany
295.9 679.0 –383.1 10.2 14.0 331.3 964.7 –633.4 10.1 15.3
Zviedrija Sweden
225.0 248.5 –23.5 7.8 5.1 212.0 320.3 –108.3 6.5 5.1
Lielbritānija United Kingdom
291.7 88.6 203.1 10.1 1.8 260.2 120.3 139.9 8.0 1.9
Somija Finland
101.7 284.9 –183.2 3.5 5.9 96.4 358.0 –261.6 2.9 5.7
Dānija Denmark
153.5 141.3 12.2 5.3 2.9 161.1 171.6 –10.5 4.9 2.7
Nīderlande Netherlands
61.3 171.2 –109.9 2.1 3.5 77.0 203.8 –126.8 2.4 3.2
Lietuva Lithuania
317.8 665.5 –347.7 11.0 13.7 476.3 818.2 –341.9 14.6 13.0
Igaunija Estonia
312.3 383.3 –71 10.8 7.9 412.4 484.5 –72.1 12.6 7.7
Polija Poland
150.7 309.9 –159.2 5.2 6.4 77.6 450.5 –372.9 2.4 7.2
NVS CIS
353.7 813.5 –459.8 12.2 16.7 461.2 902.7 –441.5 14.1 14.3
t.sk. Krievija incl. Russia
228.3 413.8 –185.5 7.9 8.5 291.9 499.1 –207.2 8.9 7.9
Pārējās valstis Other countries
329.1 395.0 –65.9 11.4 8.1 364.3 586.4 –222.1 11.1 9.3
t.sk. ASV incl. USA
78.6 51.7 26.9 2.7 1.1 61.8 58.6 3.2 1.9 0.9
Norvēģija Norway
57.1 57.7 –0.6 2.0 1.2 78.0 128.5 –50.5 2.4 2.0
Šveice Switzerland
46.7 50.9 –4.2 1.6 1.0 40.2 69.5 –29.3 1.2 1.1
36.
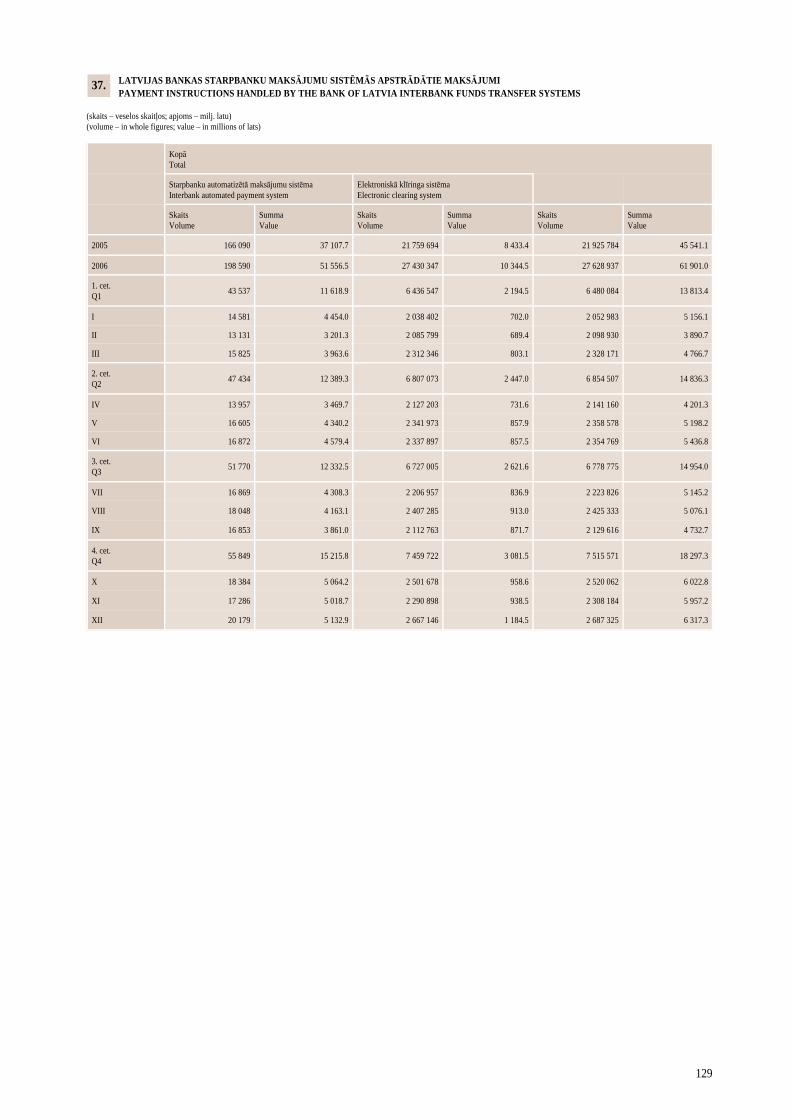
129
LATVIJAS BANKAS STARPBANKU MAKSĀJUMU SISTĒMĀS APSTRĀDĀTIE MAKSĀJUMI PAYMENT INSTRUCTIONS HANDLED BY THE BANK OF LATVIA INTERBANK FUNDS TRANSFER SYSTEMS (skaits – veselos skaitļos; apjoms – milj. latu) (volume – in whole figures; value – in millions of lats)
Kopā Total
Starpbanku automatizētā maksājumu sistēma Interbank automated payment system
Elektroniskā klīringa sistēma Electronic clearing system
Skaits Volume
Summa Value
Skaits Volume
Summa Value
Skaits Volume
Summa Value
2005 166 090 37 107.7 21 759 694 8 433.4 21 925 784 45 541.1
2006 198 590 51 556.5 27 430 347 10 344.5 27 628 937 61 901.0
1. cet. Q1
43 537 11 618.9 6 436 547 2 194.5 6 480 084 13 813.4
I 14 581 4 454.0 2 038 402 702.0 2 052 983 5 156.1
II 13 131 3 201.3 2 085 799 689.4 2 098 930 3 890.7
III 15 825 3 963.6 2 312 346 803.1 2 328 171 4 766.7
2. cet. Q2
47 434 12 389.3 6 807 073 2 447.0 6 854 507 14 836.3
IV 13 957 3 469.7 2 127 203 731.6 2 141 160 4 201.3
V 16 605 4 340.2 2 341 973 857.9 2 358 578 5 198.2
VI 16 872 4 579.4 2 337 897 857.5 2 354 769 5 436.8
3. cet. Q3
51 770 12 332.5 6 727 005 2 621.6 6 778 775 14 954.0
VII 16 869 4 308.3 2 206 957 836.9 2 223 826 5 145.2
VIII 18 048 4 163.1 2 407 285 913.0 2 425 333 5 076.1
IX 16 853 3 861.0 2 112 763 871.7 2 129 616 4 732.7
4. cet. Q4
55 849 15 215.8 7 459 722 3 081.5 7 515 571 18 297.3
X 18 384 5 064.2 2 501 678 958.6 2 520 062 6 022.8
XI 17 286 5 018.7 2 290 898 938.5 2 308 184 5 957.2
XII 20 179 5 132.9 2 667 146 1 184.5 2 687 325 6 317.3
37.
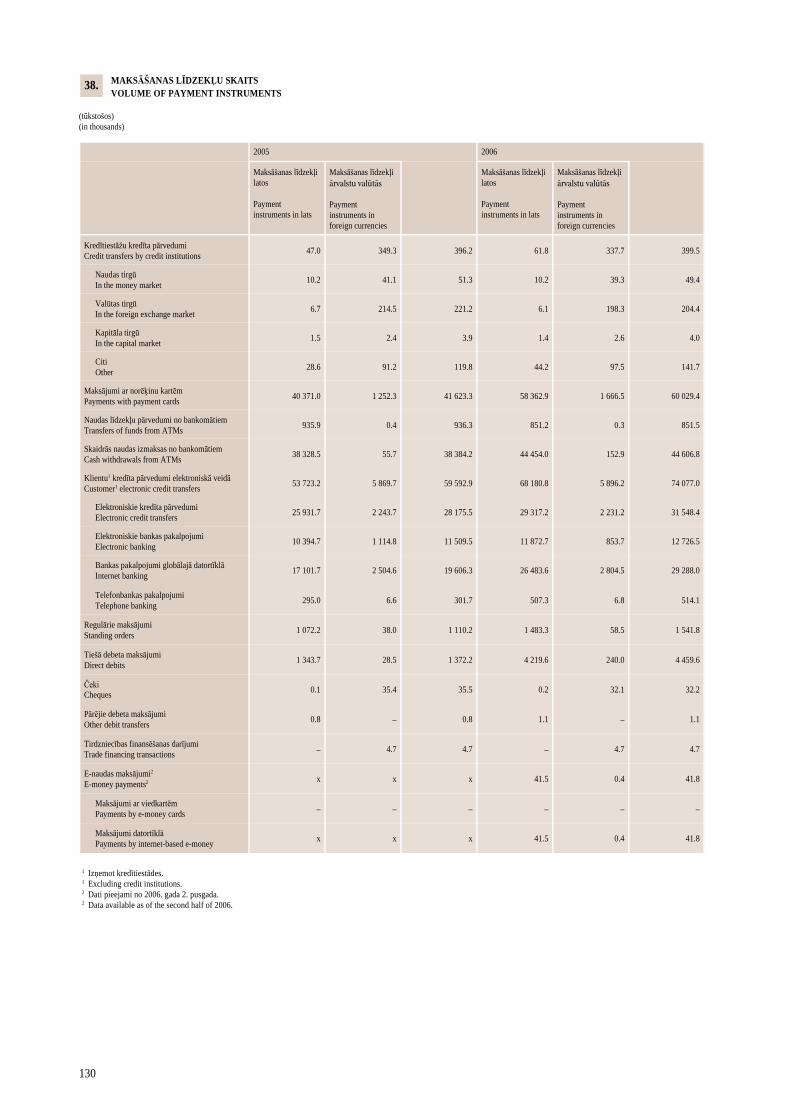
130
MAKSĀŠANAS LĪDZEKĻU SKAITS VOLUME OF PAYMENT INSTRUMENTS (tūkstošos) (in thousands)
2005 2006
Maksāšanas līdzekļi latos Payment instruments in lats
Maksāšanas līdzekļi ārvalstu valūtās Payment instruments in foreign currencies
Maksāšanas līdzekļi latos Payment instruments in lats
Maksāšanas līdzekļi ārvalstu valūtās Payment instruments in foreign currencies
Kredītiestāžu kredīta pārvedumi Credit transfers by credit institutions
47.0 349.3 396.2 61.8 337.7 399.5
Naudas tirgū In the money market
10.2 41.1 51.3 10.2 39.3 49.4
Valūtas tirgū In the foreign exchange market
6.7 214.5 221.2 6.1 198.3 204.4
Kapitāla tirgū In the capital market
1.5 2.4 3.9 1.4 2.6 4.0
Citi Other
28.6 91.2 119.8 44.2 97.5 141.7
Maksājumi ar norēķinu kartēm Payments with payment cards
40 371.0 1 252.3 41 623.3 58 362.9 1 666.5 60 029.4
Naudas līdzekļu pārvedumi no bankomātiem Transfers of funds from ATMs
935.9 0.4 936.3 851.2 0.3 851.5
Skaidrās naudas izmaksas no bankomātiem Cash withdrawals from ATMs
38 328.5 55.7 38 384.2 44 454.0 152.9 44 606.8
Klientu1 kredīta pārvedumi elektroniskā veidā Customer1 electronic credit transfers
53 723.2 5 869.7 59 592.9 68 180.8 5 896.2 74 077.0
Elektroniskie kredīta pārvedumi Electronic credit transfers
25 931.7 2 243.7 28 175.5 29 317.2 2 231.2 31 548.4
Elektroniskie bankas pakalpojumi Electronic banking
10 394.7 1 114.8 11 509.5 11 872.7 853.7 12 726.5
Bankas pakalpojumi globālajā datortīklā Internet banking
17 101.7 2 504.6 19 606.3 26 483.6 2 804.5 29 288.0
Telefonbankas pakalpojumi Telephone banking
295.0 6.6 301.7 507.3 6.8 514.1
Regulārie maksājumi Standing orders
1 072.2 38.0 1 110.2 1 483.3 58.5 1 541.8
Tiešā debeta maksājumi Direct debits
1 343.7 28.5 1 372.2 4 219.6 240.0 4 459.6
Čeki Cheques 0.1 35.4 35.5 0.2 32.1 32.2
Pārējie debeta maksājumi Other debit transfers
0.8 – 0.8 1.1 – 1.1
Tirdzniecības finansēšanas darījumi Trade financing transactions – 4.7 4.7 – 4.7 4.7
1 Izņemot kredītiestādes. 1 Excluding credit institutions. 2 Dati pieejami no 2006. gada 2. pusgada. 2 Data available as of the second half of 2006.
E-naudas maksājumi2 E-money payments2 x x x 41.5 0.4 41.8
Maksājumi ar viedkartēm Payments by e-money cards – – – – – –
Maksājumi datortīklā Payments by internet-based e-money
x x x 41.5 0.4 41.8
38.
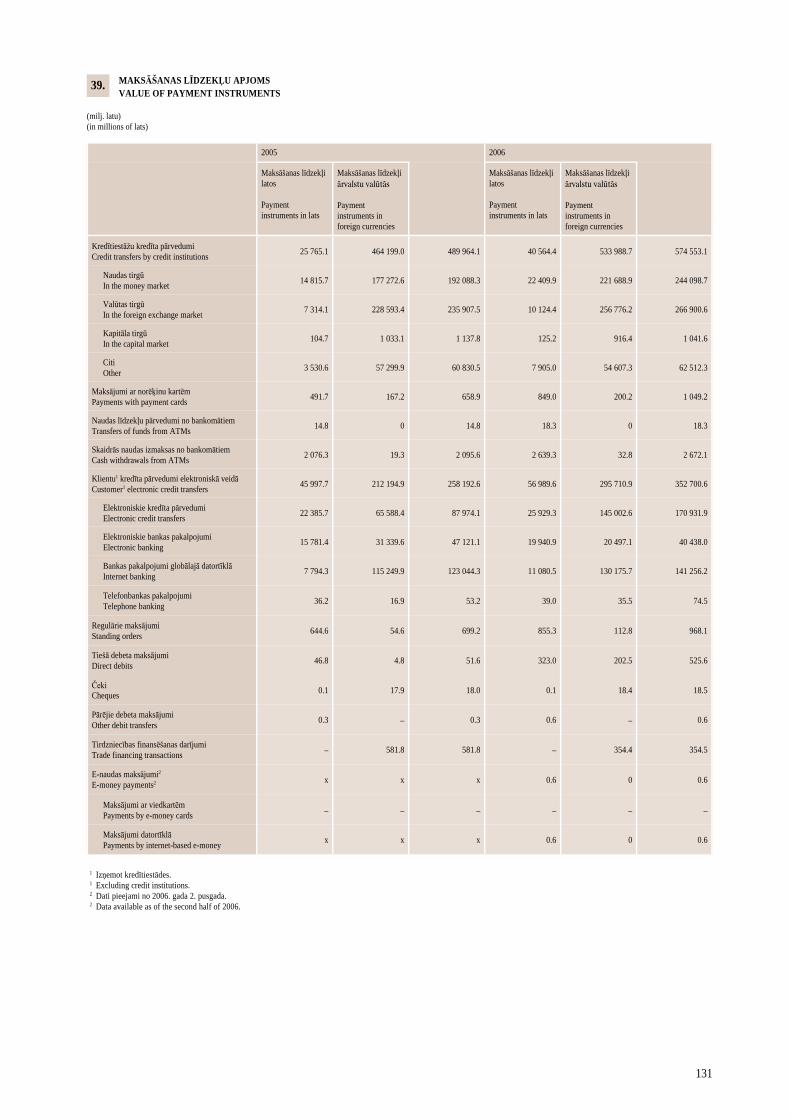
131
MAKSĀŠANAS LĪDZEKĻU APJOMS VALUE OF PAYMENT INSTRUMENTS (milj. latu) (in millions of lats)
2005 2006
Maksāšanas līdzekļi latos Payment instruments in lats
Maksāšanas līdzekļi ārvalstu valūtās Payment instruments in foreign currencies
Maksāšanas līdzekļi latos Payment instruments in lats
Maksāšanas līdzekļi ārvalstu valūtās Payment instruments in foreign currencies
Kredītiestāžu kredīta pārvedumi Credit transfers by credit institutions
25 765.1 464 199.0 489 964.1 40 564.4 533 988.7 574 553.1
Naudas tirgū In the money market
14 815.7 177 272.6 192 088.3 22 409.9 221 688.9 244 098.7
Valūtas tirgū In the foreign exchange market
7 314.1 228 593.4 235 907.5 10 124.4 256 776.2 266 900.6
Kapitāla tirgū In the capital market
104.7 1 033.1 1 137.8 125.2 916.4 1 041.6
Citi Other
3 530.6 57 299.9 60 830.5 7 905.0 54 607.3 62 512.3
Maksājumi ar norēķinu kartēm Payments with payment cards
491.7 167.2 658.9 849.0 200.2 1 049.2
Naudas līdzekļu pārvedumi no bankomātiem Transfers of funds from ATMs
14.8 0 14.8 18.3 0 18.3
Skaidrās naudas izmaksas no bankomātiem Cash withdrawals from ATMs
2 076.3 19.3 2 095.6 2 639.3 32.8 2 672.1
Klientu1 kredīta pārvedumi elektroniskā veidā Customer1 electronic credit transfers
45 997.7 212 194.9 258 192.6 56 989.6 295 710.9 352 700.6
Elektroniskie kredīta pārvedumi Electronic credit transfers
22 385.7 65 588.4 87 974.1 25 929.3 145 002.6 170 931.9
Elektroniskie bankas pakalpojumi Electronic banking
15 781.4 31 339.6 47 121.1 19 940.9 20 497.1 40 438.0
Bankas pakalpojumi globālajā datortīklā Internet banking
7 794.3 115 249.9 123 044.3 11 080.5 130 175.7 141 256.2
Telefonbankas pakalpojumi Telephone banking
36.2 16.9 53.2 39.0 35.5 74.5
Regulārie maksājumi Standing orders
644.6 54.6 699.2 855.3 112.8 968.1
Tiešā debeta maksājumi Direct debits
46.8 4.8 51.6 323.0 202.5 525.6
Čeki Cheques 0.1 17.9 18.0 0.1 18.4 18.5
Pārējie debeta maksājumi Other debit transfers
0.3 – 0.3 0.6 – 0.6
Tirdzniecības finansēšanas darījumi Trade financing transactions – 581.8 581.8 – 354.4 354.5
1 Izņemot kredītiestādes. 1 Excluding credit institutions. 2 Dati pieejami no 2006. gada 2. pusgada. 2 Data available as of the second half of 2006.
E-naudas maksājumi2 E-money payments2 x x x 0.6 0 0.6
Maksājumi ar viedkartēm Payments by e-money cards – – – – – –
Maksājumi datortīklā Payments by internet-based e-money
x x x 0.6 0 0.6
39.
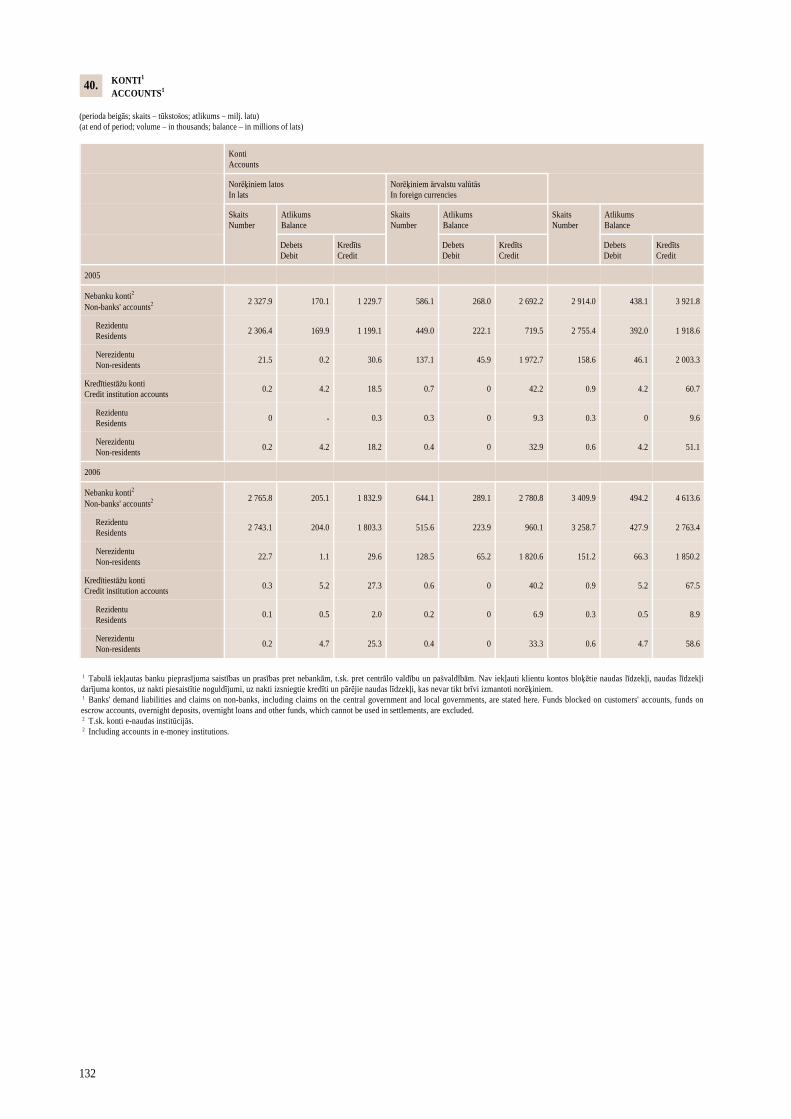
132
KONTI1 ACCOUNTS1 (perioda beigās; skaits – tūkstošos; atlikums – milj. latu) (at end of period; volume – in thousands; balance – in millions of lats)
Konti Accounts
Norēķiniem latos In lats
Norēķiniem ārvalstu valūtās In foreign currencies
Skaits Number
Atlikums Balance
Skaits Number
Atlikums Balance
Skaits Number
Atlikums Balance
Debets Debit
Kredīts Credit
Debets Debit
Kredīts Credit
Debets Debit
Kredīts Credit
2005
Nebanku konti2 Non-banks' accounts2 2 327.9 170.1 1 229.7 586.1 268.0 2 692.2 2 914.0 438.1 3 921.8
Rezidentu Residents
2 306.4 169.9 1 199.1 449.0 222.1 719.5 2 755.4 392.0 1 918.6
Nerezidentu Non-residents
21.5 0.2 30.6 137.1 45.9 1 972.7 158.6 46.1 2 003.3
Kredītiestāžu konti Credit institution accounts
0.2 4.2 18.5 0.7 0 42.2 0.9 4.2 60.7
Rezidentu Residents
0 - 0.3 0.3 0 9.3 0.3 0 9.6
Nerezidentu Non-residents
0.2 4.2 18.2 0.4 0 32.9 0.6 4.2 51.1
2006
Nebanku konti2 Non-banks' accounts2 2 765.8 205.1 1 832.9 644.1 289.1 2 780.8 3 409.9 494.2 4 613.6
Rezidentu Residents
2 743.1 204.0 1 803.3 515.6 223.9 960.1 3 258.7 427.9 2 763.4
Nerezidentu Non-residents
22.7 1.1 29.6 128.5 65.2 1 820.6 151.2 66.3 1 850.2
Kredītiestāžu konti Credit institution accounts
0.3 5.2 27.3 0.6 0 40.2 0.9 5.2 67.5
Rezidentu Residents
0.1 0.5 2.0 0.2 0 6.9 0.3 0.5 8.9
Nerezidentu Non-residents
0.2 4.7 25.3 0.4 0 33.3 0.6 4.7 58.6
1 Tabulā iekļautas banku pieprasījuma saistības un prasības pret nebankām, t.sk. pret centrālo valdību un pašvaldībām. Nav iekļauti klientu kontos bloķētie naudas līdzekļi, naudas līdzekļi darījuma kontos, uz nakti piesaistītie noguldījumi, uz nakti izsniegtie kredīti un pārējie naudas līdzekļi, kas nevar tikt brīvi izmantoti norēķiniem. 1 Banks' demand liabilities and claims on non-banks, including claims on the central government and local governments, are stated here. Funds blocked on customers' accounts, funds on escrow accounts, overnight deposits, overnight loans and other funds, which cannot be used in settlements, are excluded. 2 T.sk. konti e-naudas institūcijās. 2 Including accounts in e-money institutions.
40.
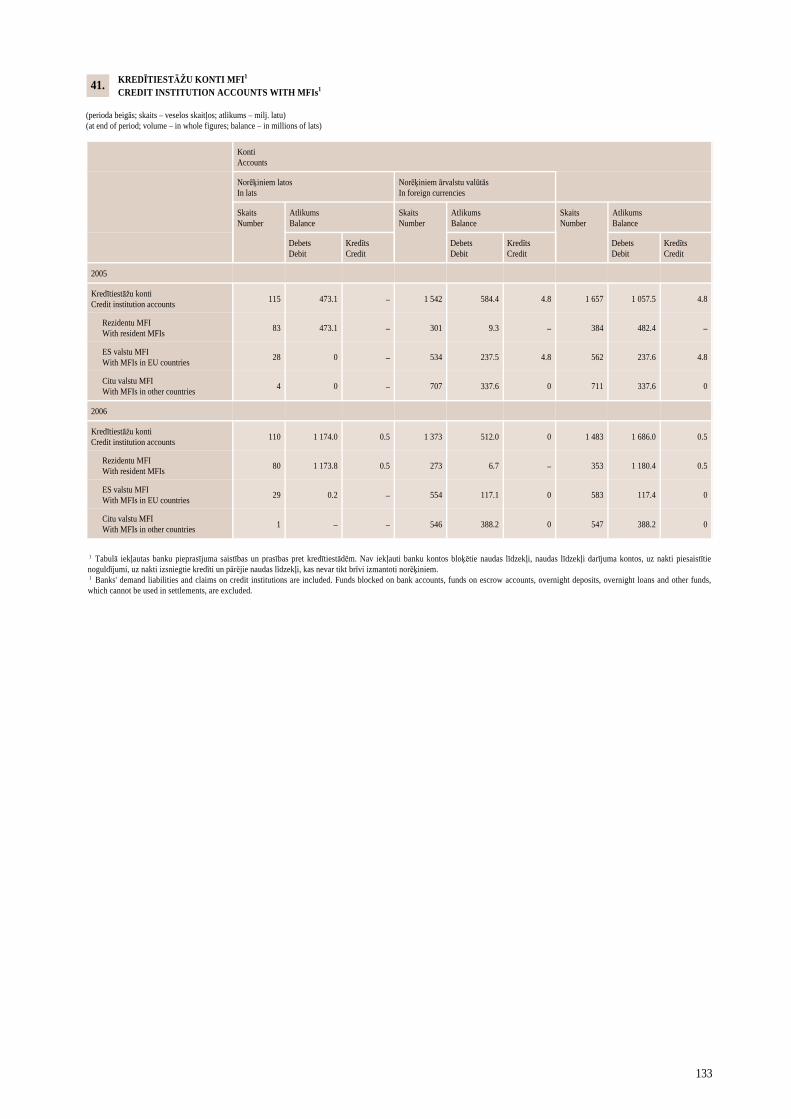
133
KREDĪTIESTĀŽU KONTI MFI1 CREDIT INSTITUTION ACCOUNTS WITH MFIs1 (perioda beigās; skaits – veselos skaitļos; atlikums – milj. latu) (at end of period; volume – in whole figures; balance – in millions of lats)
Konti Accounts
Norēķiniem latos In lats
Norēķiniem ārvalstu valūtās In foreign currencies
Skaits Number
Atlikums Balance
Skaits Number
Atlikums Balance
Skaits Number
Atlikums Balance
Debets Debit
Kredīts Credit
Debets Debit
Kredīts Credit
Debets Debit
Kredīts Credit
2005
Kredītiestāžu konti Credit institution accounts
115 473.1 – 1 542 584.4 4.8 1 657 1 057.5 4.8
Rezidentu MFI With resident MFIs
83 473.1 – 301 9.3 – 384 482.4 –
ES valstu MFI With MFIs in EU countries
28 0 – 534 237.5 4.8 562 237.6 4.8
Citu valstu MFI With MFIs in other countries
4 0 – 707 337.6 0 711 337.6 0
2006
Kredītiestāžu konti Credit institution accounts
110 1 174.0 0.5 1 373 512.0 0 1 483 1 686.0 0.5
Rezidentu MFI With resident MFIs
80 1 173.8 0.5 273 6.7 – 353 1 180.4 0.5
ES valstu MFI With MFIs in EU countries
29 0.2 – 554 117.1 0 583 117.4 0
Citu valstu MFI With MFIs in other countries 1 – – 546 388.2 0 547 388.2 0
1 Tabulā iekļautas banku pieprasījuma saistības un prasības pret kredītiestādēm. Nav iekļauti banku kontos bloķētie naudas līdzekļi, naudas līdzekļi darījuma kontos, uz nakti piesaistītie noguldījumi, uz nakti izsniegtie kredīti un pārējie naudas līdzekļi, kas nevar tikt brīvi izmantoti norēķiniem. 1 Banks' demand liabilities and claims on credit institutions are included. Funds blocked on bank accounts, funds on escrow accounts, overnight deposits, overnight loans and other funds, which cannot be used in settlements, are excluded.
41.
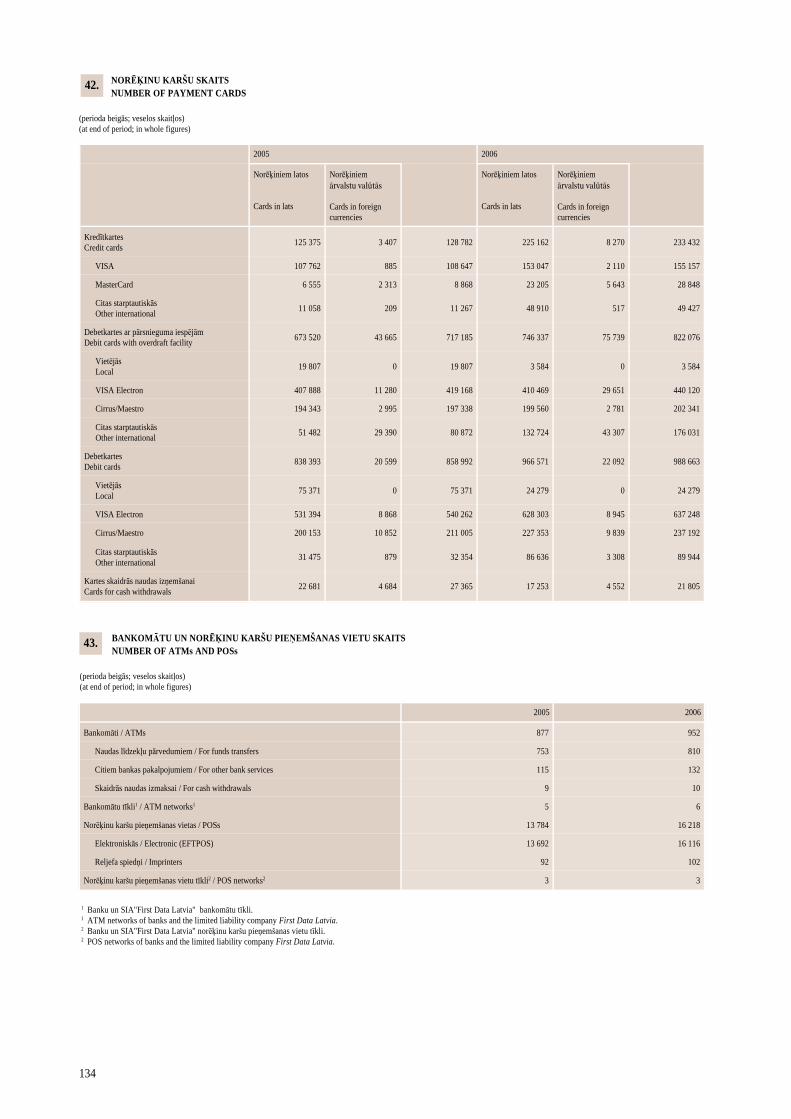
134
NORĒĶINU KARŠU SKAITS NUMBER OF PAYMENT CARDS (perioda beigās; veselos skaitļos) (at end of period; in whole figures)
2005 2006
Norēķiniem latos Cards in lats
Norēķiniem ārvalstu valūtās Cards in foreign currencies
Norēķiniem latos Cards in lats
Norēķiniem ārvalstu valūtās Cards in foreign currencies
Kredītkartes Credit cards
125 375 3 407 128 782 225 162 8 270 233 432
VISA 107 762 885 108 647 153 047 2 110 155 157
MasterCard 6 555 2 313 8 868 23 205 5 643 28 848
Citas starptautiskās Other international
11 058 209 11 267 48 910 517 49 427
Debetkartes ar pārsnieguma iespējām Debit cards with overdraft facility
673 520 43 665 717 185 746 337 75 739 822 076
Vietējās Local
19 807 0 19 807 3 584 0 3 584
VISA Electron 407 888 11 280 419 168 410 469 29 651 440 120
Cirrus/Maestro 194 343 2 995 197 338 199 560 2 781 202 341
Citas starptautiskās Other international
51 482 29 390 80 872 132 724 43 307 176 031
Debetkartes Debit cards
838 393 20 599 858 992 966 571 22 092 988 663
Vietējās Local
75 371 0 75 371 24 279 0 24 279
VISA Electron 531 394 8 868 540 262 628 303 8 945 637 248
Cirrus/Maestro 200 153 10 852 211 005 227 353 9 839 237 192
Citas starptautiskās Other international
31 475 879 32 354 86 636 3 308 89 944
Kartes skaidrās naudas izņemšanai Cards for cash withdrawals
22 681 4 684 27 365 17 253 4 552 21 805
42.
BANKOMĀTU UN NORĒĶINU KARŠU PIEŅEMŠANAS VIETU SKAITS NUMBER OF ATMs AND POSs (perioda beigās; veselos skaitļos) (at end of period; in whole figures)
43.
2005 2006
Bankomāti / ATMs 877 952
Naudas līdzekļu pārvedumiem / For funds transfers 753 810
Citiem bankas pakalpojumiem / For other bank services 115 132
Skaidrās naudas izmaksai / For cash withdrawals 9 10
Bankomātu tīkli1 / ATM networks1 5 6
Norēķinu karšu pieņemšanas vietas / POSs 13 784 16 218
Elektroniskās / Electronic (EFTPOS) 13 692 16 116
Reljefa spiedņi / Imprinters 92 102
Norēķinu karšu pieņemšanas vietu tīkli2 / POS networks2 3 3
1 Banku un SIA"First Data Latvia" bankomātu tīkli. 1 ATM networks of banks and the limited liability company First Data Latvia. 2 Banku un SIA"First Data Latvia" norēķinu karšu pieņemšanas vietu tīkli. 2 POS networks of banks and the limited liability company First Data Latvia.
PAPILDINFORMÂCIJA
Vispârçjâs piezîmes
Izdevumâ "Monetârais Apskats. Monetary Review" izmantota CSP, Latvijas Republikas Finanðu ministrijas, Finanðu unkapitâla tirgus komisijas, RFB un Latvijas Bankas informâcija.
Grafiskajos attçlos (5., 14. un 18.–24. att.) ar punktiem atzîmçts râdîtâja faktiskais lielums, ar lînijâm – ðo râdîtâju aproksi-mçjoðâ lîkne. Grafiskos attçlus sagatavojot, izmantota Reuters (1. un 2. att.), CSP (3.–5. att.), Finanðu ministrijas (6.–11. att.)un Latvijas Bankas (3., 12.–24. un 26.–43. att.) informâcija.
Tabulas sagatavojot, izmantota Latvijas Bankas (1., 3.–28., 30. un 37.–43. tabula), RFB (1. tabula), Finanðu ministrijas(2.ab un 29. tabula) un CSP (2.ab un 31.–36. tabula) informâcija.
Daþos gadîjumos skaitïu noapaïoðanas rezultâtâ komponentu summa atðíiras no kopsummas.
FOB cena ir preces cena, kuru veido preces vçrtîba, ieskaitot transporta un apdroðinâðanas izmaksas lîdz eksportçtâjvalstsrobeþai.
CIF cena ir preces cena, kuru veido preces vçrtîba, ieskaitot transporta un apdroðinâðanas izmaksas lîdz importçtâjvalstsrobeþai.
Tabulâs apzîmçjums "–" nozîmç, ka attiecîgajâ periodâ nav darîjumu, un apzîmçjums "x" – dati nav pieejami, râdîtâjus naviespçjams aprçíinât vai respondentu skaits ir nepietiekams datu publiskoðanai.
Nauda un banku darbîba
Monetâro râdîtâju aprçíinâ tiek iekïauti Latvijas Bankas bilances dati un pârçjo MFI bilanèu pârskatu informâcija, kas tieksagatavota saskaòâ ar Latvijas Bankas noteikto metodoloìiju (sk. Latvijas Bankas interneta lapâ ar Latvijas Bankas padomes12.07.2001. lçmumu Nr. 88/7 apstiprinâtos "Monetâro finanðu iestâþu mçneða bilances pârskata un pielikumu sagatavoðanasnoteikumus"), kas pamatojas uz ECB Regulu "Par monetâro finanðu institûciju konsolidçto bilanci" (ECB/2001/13).
Lai saskaòotu terminu lietojumu ar ECB "Mçneða Biïetenu", sâkot ar Latvijas Bankas izdevuma "Monetârais Apskats.Monetary Review" 2004. gada 3. numuru, izmantoti ðâdi termini.
MFI – finanðu sabiedrîbas, kas veido naudas emisijas sektoru. Latvijâ MFI ir Latvijas Banka, kredîtiestâdes u.c. MFI saskaòâar Latvijas Bankas sagatavoto "Latvijas Republikas monetâro finanðu iestâþu sarakstu". ES MFI ietver ECB, eiro zonasvalstu centrâlâs bankas, kredîtiestâdes un citas MFI (naudas tirgus fondus) saskaòâ ar ECB publicçto MFI sarakstu.
Ne-MFI – vienîbas, kuras nav MFI.
Finanðu iestâdes – citi finanðu starpnieki, izòemot apdroðinâðanas sabiedrîbas un pensiju fondus (CFS), finanðu palîgsa-biedrîbas, apdroðinâðanas sabiedrîbas un pensiju fondi.
CFS – finanðu sabiedrîbas, kuras iesaistîtas galvenokârt finanðu starpniecîbâ, uzòemoties tâdas saistîbas, kas nav valûta,noguldîjumi un noguldîjumu aizstâjçji no klientiem, kas nav MFI, vai apdroðinâðanas tehniskâs rezerves. CFS ir kreditçðanâiesaistîtâs sabiedrîbas (piemçram, finanðu lîzinga sabiedrîbas, faktûrkreditçðanas sabiedrîbas, eksporta vai importa finan-sçðanas sabiedrîbas), ieguldîjumu fondi, ieguldîjumu brokeru sabiedrîbas, finanðu instrumentsabiedrîbas (financial vehicle
corporations), finanðu pârvaldîtâjsabiedrîbas, riska kapitâla sabiedrîbas (venture capital corporations). CFS datos tiek iekïautiarî finanðu palîgsabiedrîbu dati.
Finanðu palîgsabiedrîbas – finanðu sabiedrîbas, kuras iesaistîtas galvenokârt finanðu palîgdarbîbâs, t.i., darbîbâs, kuras cieðisaistîtas ar finanðu starpniecîbu, bet nav finanðu starpniecîba, piemçram, ieguldîjumu brokeri, kas neveic finanðu starpnie-cîbas pakalpojumus savâ vârdâ, sabiedrîbas, kas nodroðina finanðu tirgu infrastruktûru, finanðu institûciju un finanðu tirgucentrâlâs uzraudzîbas iestâdes, ja tâs ir atseviðías institucionâlas vienîbas. Latvijâ par finanðu palîgsabiedrîbu uzskatâmaarî Finanðu un kapitâla tirgus komisija un Rîgas Fondu birþa. Finanðu palîgsabiedrîbu dati tiek iekïauti CFS datos.
Nefinanðu sabiedrîbas – saimnieciskâs vienîbas, kuras veic preèu raþoðanu vai sniedz nefinansiâlus pakalpojumus nolûkâgût peïòu vai citus augïus.
Mâjsaimniecîbas – fiziskâs personas vai fizisko personu grupas, kuru pamatdarbîba ir patçriòð un kuras raþo preces unpakalpojumus vienîgi paðu patçriòam, kâ arî privâtpersonas apkalpojoðâs bezpeïòas institûcijas. Latvijâ mâjsaimniecîbusektorâ iekïaujami arî individuâlâ darba veicçji, ja viòi nav reìistrçjuði savu darbîbu Latvijas Republikas Uzòçmumu reìistrakomercreìistrâ.
Neakciju vçrtspapîru turçjumi – finanðu aktîvi, kuri ir uzrâdîtâja instrumenti, parasti ir apgrozâmi, tos tirgo otrreizçjos
135
tirgos vai par tiem tirgû var saòemt atlîdzîbu un kuri negarantç to turçtâjam nekâdas îpaðuma tiesîbas uz institucionâlovienîbu, kas ðos finanðu aktîvus emitçjusi.
Saskaòâ ar ECB metodoloìiju tiek publicçta ðâda informâcija:
1) Latvijas Bankas aktîvi un pasîvi (6. tabula), paplaðinot uzrâdâmo finanðu instrumentu loku;
2) MFI (izòemot Latvijas Banku) kopsavilkuma bilance, t.i., Latvijas MFI, izòemot Latvijas Banku, saskaòoto bilanèusumma (7. tabula);
3) MFI konsolidçtâ bilance, kas iegûta, aprçíinot Latvijas MFI kopsavilkuma bilances pozîciju saldo (8. tabula). Sakarâ arto, ka uzskaites paòçmieni mazliet atðíiras, MFI savstarpçjo posteòu summa ne vienmçr ir vienâda ar nulli, tâpçc atlikumstiek ietverts MFI savstarpçjo saistîbu pârsniegumâ;
4) monetârie râdîtâji un to sastâvdaïas (4. tabula) atspoguïo Latvijas monetâros râdîtâjus un atbilstoðos bilances posteòus.Tie iegûti no MFI konsolidçtâs bilances. Sezonâli izlîdzinâtie monetârie râdîtâji atspoguïoti 5. tabulâ. Tiek aprçíinâti unpublicçti ðâdi monetârie râdîtâji.
M1 – ðaurâs naudas râdîtâjs, kas ietver skaidro naudu apgrozîbâ (Latvijas Bankas emitçtâs latu banknotes un monçtas,neieskaitot to atlikumus pârçjo MFI kasçs) un visâs valûtâs MFI uz nakti veiktos noguldîjumus.
M2 – vidçjâs naudas râdîtâjs, kas ietver M1 un visâs valûtâs veiktos noguldîjumus ar brîdinâjuma termiòu par izòemðanulîdz 3 mçneðiem ieskaitot (îstermiòa krâjnoguldîjumi), kâ arî visâs valûtâs veiktos noguldîjumus MFI ar noteikto termiòulîdz 2 gadiem ieskaitot (îstermiòa noguldîjumi).
M3 – plaðâs naudas râdîtâjs, kas ietver M2, repo darîjumus, MFI emitçtos parâda vçrtspapîrus ar termiòu lîdz 2 gadiemieskaitot un naudas tirgus fondu akcijas un daïas.
Saskaòâ ar Latvijas Bankas metodoloìiju joprojâm tiek publicçts Latvijas Bankas naudas pârskats (3. tabula) un Latvijasbanku sistçmas naudas pârskats (10. tabula). Saskaòâ ar ðo metodoloìiju aprçíinâto monetâro râdîtâju skaidrojums ir ðâds.
M0 – naudas bâze, kas ietver Latvijas Bankas emitçtâs latu banknotes un monçtas un rezidentu MFI latos veiktos pieprasîjumanoguldîjumus (noguldîjumus uz nakti) Latvijas Bankâ.
M2X – plaðâ nauda, kas ietver skaidro naudu apgrozîbâ (Latvijas Bankas emitçtâs latu banknotes un monçtas, neieskaitotto atlikumus MFI kasçs), MFI latos veiktos noguldîjumus uz nakti un termiònoguldîjumus (t.sk. noguldîjumus ar brîdinâjumatermiòu par izòemðanu un repo darîjumus), kâ arî ârvalstu valûtâ veiktos noguldîjumus MFI. M2X paðvaldîbu noguldîjumitiek ietverti kâ neto râdîtâjs pieprasîjuma pusç.
Ievçrojot to, ka Latvijas Banka apkopo plaðâku informâciju, papildus tiek publicçta:
1) Latvijas MFI (izòemot Latvijas Banku) kopsavilkuma bilance, kas ir saskaòoto bilanèu summa (9.ab tabula);
2) MFI (izòemot Latvijas Banku) ârzemju aktîvus un ârzemju pasîvus raksturojoðâ informâcija (11.ab tabula), t.sk. arîatseviðíi bilances posteòi valstu grupu dalîjumâ (12. tabula);
3) Latvijas finanðu iestâþu, nefinanðu sabiedrîbu un mâjsaimniecîbu noguldîjumu MFI (izòemot Latvijas Banku)termiòstruktûru un noguldîjumu veidus, t.sk. repo, raksturojoðâ informâcija (13. un 14.abc tabula), kâ arî valdîbas un nere-zidentu noguldîjumus raksturojoðâ informâcija (14.d tabula). Noguldîjumi ar brîdinâjuma termiòu par izòemðanu grupçtiatbilstoði brîdinâjuma termiòam. Ilgtermiòa noguldîjumi ietver noguldîjumus, kuru sâkotnçjais termiòð ir ilgâks par 1 gadu.MFI (izòemot Latvijas Banku) veikto noguldîjumu valûtu dalîjums atspoguïots 20.ab tabulâ;
4) MFI (izòemot Latvijas Banku) Latvijas finanðu iestâdçm, nefinanðu sabiedrîbâm un mâjsaimniecîbâm izsniegto kredîtutermiòstruktûru un kredîtu veidus raksturojoðâ informâcija (15., 16.ab, 17. un 18. tabula), kâ arî valdîbas un nerezidentukredîtus raksturojoðâ informâcija (16.c tabula). MFI (izòemot Latvijas Banku) izsniegto kredîtu valûtu dalîjums atspoguïots20.cd tabulâ;
5) MFI (izòemot Latvijas Banku) vçrtspapîru turçjumus raksturojoðâ informâcija (19.ab un 20.ef tabula);
6) MFI (izòemot Latvijas Banku) emitçtos parâda vçrtspapîrus raksturojoðâ informâcija (20.g tabula).
Procentu likmes
Ar 2004. gada janvâri Latvijas Banka ieviesusi jaunu procentu likmju statistikas metodoloìiju (sk. Latvijas Bankas internetalapâ ar Latvijas Bankas padomes 15.05.2003. lçmumu Nr. 102/3 apstiprinâtos "Procentu likmju pârskatu sagatavoðanasnoteikumus"). Izmantojot ðo metodoloìiju, Latvijas Republikâ reìistrçtajâm bankâm, ârvalstu banku filiâlçm un krâjaizdevusabiedrîbâm jâsniedz informâcija par noguldîjumu un kredîtu procentu likmçm, kas tiek piemçrotas darîjumos ar iekð-
136
zemes nefinanðu sabiedrîbâm un mâjsaimniecîbâm. Iepriekð lietotâ procentu likmju statistikas metodoloìija bija spçkâkopð 1997. gada maija. Ievieðot jauno metodoloìiju, panâkta procentu likmju statistikas saskaòoðana ar ECB prasîbu nor-mâm, kas izklâstîtas Regulâ ECB/2001/18 "Par to procentu likmju statistiku, kuras monetârâs finanðu institûcijas piemçromâjsaimniecîbu un nefinanðu korporâciju noguldîjumiem un kredîtiem". Procentu likmju statistika sniedz ievçrojami plaðâkuinformâciju par makroekonomisko attîstîbu un strukturâlajâm pârmaiòâm, tomçr statistisko informâciju nevar tieði salîdzinâtar iepriekð publicçto, jo bûtiski mainîjusies statistikas sagatavoðanas metodoloìija.
Tiek apkopota Latvijas Republikâ reìistrçto banku, ârvalstu banku filiâïu un krâjaizdevu sabiedrîbu sniegtâ informâcijapar noguldîjumu un kredîtu procentu likmçm, kas tiek piemçrotas darîjumos ar nefinanðu sabiedrîbâm un mâjsaimniecî-bâm (21. tabula). Procentu likmju statistika tiek apkopota par jaunajiem darîjumiem un darîjumu atlikumiem. Visas procentulikmju statistikâ ietvertâs likmes ir vidçjâs svçrtâs procentu likmes. Procentu likmju statistikas sagatavoðanâ kredîtiestâdesizmanto nolîgto gada likmi (annualised agreed rate, AAR) vai ðauri definçto efektîvo likmi (narrowly defined effective rate,NDER) un efektîvo gada izmaksu procentu likmi (annual percentage rate of charge, APRC). AAR vai NDER likmes aprçíinskredîtiestâdçm jâizvçlas, pamatojoties uz lîguma nosacîjumiem. NDER var aprçíinât jebkuram noguldîjumam vai aizdevu-mam. Kredîtiem privâtpersonâm mâjokïa iegâdei un patçriòa kredîtiem papildus AAR vai NDER uzrâdîta arî APRC.
Noguldîjumu uz nakti un noguldîjumu ar brîdinâjuma termiòu par izòemðanu jauno darîjumu un atlikumu procentu likmessakrît.
No jauna izsniegto kredîtu procentu likmes tiek atspoguïotas saskaòâ ar lîgumâ noteikto procentu likmes darbîbas sâkotnçjoperiodu. Savukârt norçíinu konta debeta atlikuma (overdraft) procentu likmes tiek uzrâdîtas ðâ kredîta atlikumam.
Atspoguïojot mâjsaimniecîbâm izsniegto patçriòa un pârçjo kredîtu ar termiòu lîdz 1 gadam un nefinanðu sabiedrîbâmizsniegto kredîtu ar termiòu lîdz 1 gadam procentu likmes, tiek ietvertas norçíinu konta debeta atlikuma procentu likmes.
Kredîtu procentu likmes starpbanku tirgû (23.a tabula) tiek atspoguïotas kâ vidçjâs svçrtâs jauno darîjumu procentu likmes,apkopojot banku iesniegto informâciju, kas sagatavota atbilstoði Latvijas Bankas metodoloìijai (sk. Latvijas Bankas inter-neta lapâ ar Latvijas Bankas padomes 17.07.2003. lçmumu Nr. 104/3 apstiprinâtos ""Naudas tirgus darîjumu pârskata"sagatavoðanas noteikumus").
Valûtu darîjumi un valûtu kursi
Ârvalstu valûtu pirkðanas un pârdoðanas darîjumus raksturojoðâ informâcija tiek apkopota, izmantojot Latvijas Bankasmetodoloìiju (sk. Latvijas Bankas interneta lapâ ar Latvijas Bankas padomes 09.09.2004. lçmumu Nr. 114/5 apstiprinâtos"Ârvalstu valûtu skaidrâs naudas pirkðanas un pârdoðanas noteikumus" un ar Latvijas Bankas valdes 24.04.1997. lçmumuNr. 259/8 apstiprinâto "Ârvalstu valûtu pirkðanas un pârdoðanas pârskatu"). Galvenie ârvalstu valûtu pirkðanas un pârdoðanasdarîjumi (24. tabula) ietver skaidrâ un bezskaidrâ naudâ veiktos MFI (izòemot Latvijas Banku) darîjumus, kas atspoguïotidarîjuma veidu un darîjuma partneru dalîjumâ, ar mâjsaimniecîbâm veiktos darîjumus atspoguïojot atseviðíi. Savukârtârvalstu valûtu pirkðanas un pârdoðanas darîjumi (25. tabula) ietver skaidrâ un bezskaidrâ naudâ veiktos MFI un valûtasmaiòas iestâþu darîjumus, kas atspoguïoti nozîmîgâko valûtu dalîjumâ.
Latvijas Bankas noteiktie valûtu kursi (26. tabula) atspoguïoti kâ aritmçtiski vidçjie mçneða râdîtâji. Vidçjie svçrtie ârvalstuvalûtu kursi (izòemot bezskaidrâs naudas norçíinus; 27. tabula) apkopoti, izmantojot MFI (izòemot Latvijas Banku) unvalûtas maiòas iestâþu sniegto informâciju.
Sâkot ar 2006. gada 1. numuru, lata reâlâ efektîvâ kursa dati tiek publiskoti izdevumâ "Latvijas Maksâjumu Bilance".
Kredîtiestâþu maksâjumu statistika
Kredîtiestâþu maksâjumu statistika (37.–43. tabula) tiek apkopota saskaòâ ar Latvijas Bankas padomes 13.05.1999. lçmumuNr. 57/2 apstiprinâtajiem "Kredîtiestâþu maksâjumu statistikas sagatavoðanas noteikumiem" un Latvijas Bankas Maksâjumusistçmu pârvaldes 04.07.2000. papildu skaidrojumiem kredîtiestâþu maksâjumu statistikas pârskata sagatavoðanai.
38.–41. tabulâ sniegtajâ informâcijâ termins "klients" ietver fiziskâs un juridiskâs personas, kuras nav kredîtiestâdes unkurâm kredîtiestâdes sniedz maksâjumu pakalpojumus.
137
ADDITIONAL INFORMATION
General Notes
The Bank of Latvia's publication Monetârais Apskats. Monetary Review is based on data provided by the CSB, the Ministryof Finance of the Republic of Latvia, the Financial and Capital Market Commission, the RSE and the Bank of Latvia.
For Charts 5, 14 and 18–24, the dots indicate the actual data, and the lines reflect the smoothing approximation of the data.Data sources for charts are Reuters (Charts 1 and 2), the CSB (Charts 3–5), the Ministry of Finance (Charts 6–11 and 25)and the Bank of Latvia (Charts 3, 12–24 and 26–43).
Data sources for tables are the Bank of Latvia (Tables 1, 3–28, 30 and 37–43), the RSE (Table 1), the Ministry of Finance(Tables 2ab and 29) and the CSB (Tables 2ab and 31–36).
Details may not add because of rounding-off.
FOB value is the price of a commodity on the border of the exporting country, including the transportation and insurancecosts only up to the border.
CIF value is the price of a commodity on the border of the importing country, including the transportation and insurancecosts only up to the border.
"–" – no transactions in the period; "x" – no data available, no computation of indicators possible or insufficient number ofrespondents to publish information.
Money and banking sector
Calculation of monetary aggregates includes the Bank of Latvia's balance sheet data and information from the financialposition reports of other MFIs, prepared using the Bank of Latvia's methodology (see the Bank of Latvia Website for the"Regulation for Compiling Monthly Financial Position Report of Monetary Financial Institutions and Its Appendices"approved by the Bank of Latvia Council's Resolution No. 88/7 of July 12, 2001), based on the ECB Regulation concerningthe consolidated balance sheet of the monetary financial institutions sector (ECB/2001/13).
For the purpose of harmonising the terminology with the ECB "Monthly Bulletin", starting with 2004 Q3 publication of theBank of Latvia's Monetârais Apskats. Monetary Review, the following terms have been used:
MFIs – financial institutions forming the money-issuing sector. In Latvia, MFIs include the Bank of Latvia, credit institu-tions and other MFIs in compliance with the List of Monetary Financial Institutions of the Republic of Latvia compiled bythe Bank of Latvia. In the EU, MFIs include the ECB, the national central banks of the euro area, credit institutions andother monetary financial institutions (money market funds) in compliance with the original List of Monetary FinancialInstitutions published by the ECB.
Non-MFIs – entities other than MFIs.
Financial institutions – other financial intermediaries, excluding insurance corporations and pension funds, (hereinafter,OFIs), financial auxiliaries, insurance corporations and pension funds.
OFIs – financial corporations that are primarily engaged in financial intermediation by incurring liabilities in forms otherthan currency, deposits and close substitutes for deposits from their customers other than MFIs, or insurance technicalreserves. OFIs are corporations engaged in lending (e.g. financial leasing companies, factoring companies, export/importfinancing companies), investment funds, investment brokerage companies, financial vehicle corporations, financial holdingcorporations, venture capital corporations. OFIs data include also financial auxiliaries data.
Financial auxiliaries – financial corporations that are primarily engaged in auxiliary financial activities, i.e. activities thatare closely related to financial intermediation but are not financial intermediation themselves, e.g. investment brokers whodo not engage in financial intermediation services on their own behalf, corporations that provide infrastructure for finan-cial markets, central supervisory institutions of financial institutions and the financial market provided that they are sepa-rate institutional units. The Financial and Capital Market Commission and the RSE shall be regarded as financial auxilia-ries. Financial auxiliaries data are included in OFIs data.
Non-financial corporations – economic entities producing goods or providing non-financial services with the aim of gainingprofit or other yield.
Households – natural persons or groups of natural persons whose principal activity is consumption and who produce goodsand services exclusively for their own consumption, as well as non-profit institutions serving households. The following arealso regarded as households in the Republic of Latvia: persons engaged in individual entrepreneurship provided that theyhave not registered their activity with the Commercial Register of the Enterprise Register of the Republic of Latvia.
138
Holdings of securities other than shares – financial assets, which are instruments of the holder, usually negotiable andtraded or compensated on secondary markets and which do not grant the holder any ownership rights over the issuinginstitutional unit.
The following information is published in accordance with the ECB methodology:
1) The Bank of Latvia's assets and liabilities (Table 6), expanding the range of reported financial instruments;
2) Aggregated balance sheet of MFIs (excluding the Bank of Latvia), i.e. the sum of the harmonised balance sheets ofLatvia's MFIs, excluding the Bank of Latvia (Table 7);
3) Consolidated balance sheet of MFIs, obtained by netting out inter-MFI positions on the aggregated MFI balance sheet(Table 8). Due to slight differences in accounting techniques, the sum of inter-MFI positions does not always equal zero;therefore, the balance is included in the item "Excess of inter-MFI liabilities";
4) Monetary aggregates and counterparts (Table 4) comprise Latvia's monetary aggregates and their balance sheet counter-parts derived from the consolidated balance sheet of MFIs. See Table 5 for seasonally adjusted monetary aggregates. Thefollowing monetary aggregates are calculated and published:
M1: narrow monetary aggregate, comprising currency in circulation (the lats banknotes and coins issued by the Bank ofLatvia excluding vault cash of MFIs) plus overnight deposits in all currencies held with MFIs.
M2: intermediate monetary aggregate comprising M1 and deposits redeemable at a period of notice of up to and including3 months (i.e. short-term savings deposits) made in all currencies and deposits with an agreed maturity of up to and includ-ing 2 years (i.e. short-term time deposits) in all currencies held with MFIs.
M3: broad monetary aggregate comprising M2, repurchase agreements, and debt securities with a maturity of up to andincluding 2 years issued by MFIs, and money market fund shares and units.
In compliance with the Bank of Latvia's methodology, the monetary base (Table 3) and monetary survey (Table 10) ispublished. According to this methodology, the calculated monetary aggregates comprise the following:
M0 – monetary base, comprising the lats banknotes and coins issued by the Bank of Latvia and resident MFI overnightdeposits in lats with the Bank of Latvia.
M2X – broad money, comprising currency in circulation (the lats banknotes and coins issued by the Bank of Latvia lessvault cash of MFIs), MFI overnight deposits and time deposits in lats (including deposits redeemable at notice and repos),as well as foreign currency deposits with MFIs. M2X incorporate deposits made by local governments as a net item on thedemand side.
In view of the fact that the Bank of Latvia collects more comprehensive information, the following is also published:
1) Aggregated balance sheet of Latvia's MFIs (excluding the Bank of Latvia) which is the sum of the harmonised balancesheets (Tables 9ab);
2) Information characterising foreign assets and foreign liabilities of MFIs (excluding the Bank of Latvia; Tables 11ab),including a breakdown of selected balance sheet items by country (Table 12);
3) Information characterising the maturity profile and types of deposits (including repos) of Latvia's financial institutions,non-financial corporations and households with MFIs (excluding the Bank of Latvia; Tables 13 and 14abc) as well as Govern-ment and non-resident deposits (Table 14d). Deposits redeemable at notice have been grouped by period of notice. Long-term deposits include deposits with the original maturity of over 1 year. The breakdown of MFI (excluding the Bank ofLatvia) deposits by currency is provided in Tables 20ab;
4) Information characterising the maturity profile and types of MFI (excluding the Bank of Latvia) loans to Latvia's finan-cial institutions, non-financial corporations and households (Tables 15, 16ab, 17 and 18) as well as Government and non-resident loans (Table 16c). The breakdown of MFI (excluding the Bank of Latvia) loans by currency is provided in Tables20cd;
5) Information characterising MFI (excluding the Bank of Latvia) securities holdings other than shares (Tables 19ab and 20ef);
6) Information characterising debt securities issued by MFIs (excluding the Bank of Latvia; Table 20g).
Interest Rates
In January 2004, the Bank of Latvia introduced new methodology for interest rate statistics (see the Bank of Latvia Websitefor the "Regulation for Compiling Interest Rate Reports" approved by the Bank of Latvia Council's Resolution No. 102/3 ofMay 15, 2003). Using this methodology, banks, branches of foreign banks and credit unions registered in the Republic of
139
Latvia have to provide information on interest rates on deposits and loans applied in transactions with resident non-finan-cial corporations and households. The previously applied interest rate statistics methodology was effective since May 1997.Introduction of the new methodology enabled harmonisation of the interest rate statistics with the ECB requirements laiddown in Regulation ECB/2001/18 concerning statistics on interest rates applied by monetary financial institutions to depos-its and loans vis-a-vis households and non-financial corporations. The interest rate statistics provide considerably widerinformation on macroeconomic development and structural changes; nevertheless, the statistical information does notdirectly compare with the one published previously, as the methodology for preparing it has changed considerably.
Information on interest rates on deposits and loans applied in transactions with non-financial corporations and householdsprovided by banks, branches of foreign banks and credit unions registered in the Republic of Latvia is collected (Table 21).Interest rate statistics is collected on new business and outstanding amounts. All rates included in the interest rate statisticsare weighted average rates. When preparing the interest rate statistics, credit institutions use annualised agreed rates(AAR) or narrowly defined effective rates (NDER) and annual percentage rate of charge (APRC). Credit institutions haveto select the calculation of the AAR or the NDER based on the terms and conditions of the agreement. The NDER can becalculated on any deposit or loan. In addition to the AAR or the NDER, the APRC is reported for loans to households forhouse purchase and consumer credits.
The interest rates on new business with overnight deposits and deposits redeemable at notice and their outstanding amountscoincide.
Interest rates on new loans are reported on the basis of the initial rate fixation period set in the agreement, whereasoverdraft interest rates are reported on loan balances.
When reporting the interest rates on consumer credit and other credit to households with the maturity of up to 1 year andloans to non-financial corporations with the maturity of up to 1 year, interest rates on overdraft are included.
Interbank market lending interest rates (Table 23a) are reported as weighted average interest rates on new business, aggre-gating the information submitted by banks, prepared based on the Bank of Latvia's methodology (see the Bank of LatviaWebsite for the "Regulation for Compiling the 'Report on Money Market Transactions' " approved by the Bank of LatviaCouncil's Resolution No. 104/3 of July 17, 2003).
Foreign exchange and exchange rates
Information characterising the foreign currency selling and buying transactions is reported based on the Bank of Latvia'smethodology (see the Bank of Latvia Website for the "Regulation for Buying and Selling Cash Foreign Currency" approvedby the Bank of Latvia Council's Resolution No. 114/5 of September 9, 2004 and the "Report on Buying and Selling ofForeign Currency" approved by the Bank of Latvia Board's Resolution No. 259/8 of April 24, 1997. The major transactionsin buying and selling foreign currency (Table 24) comprise the cash and non-cash transactions conducted by MFIs (exclud-ing the Bank of Latvia), reported by transaction type and partner, presenting transactions with households separately.Transactions in buying and selling foreign currency (Table 25) comprise the cash and non-cash transactions conducted byMFIs and currency exchange bureaus, reported by major currency.
Exchange rates set by the Bank of Latvia (Table 26) are reported as monthly mathematical averages. Weighted averageexchange rates (excluding non-cash payments; Table 27) are reported based on the information provided by MFIs (exclud-ing the Bank of Latvia) and currency exchange bureaus.
Starting with the first issue of 2006, the data on the real effective exchange rate of the lats are published in the Latvia'sBalance of Payments.
Credit Institution Payment Statistics
Credit institution payment statistics (Tables 37–43) is compiled in line with the "Regulation for Compiling Credit Institu-tion Payment Statistics" approved by the Bank of Latvia Council's Resolution No. 57/2 of May 13, 1999 and aditional notesfor compiling credit institution payment statistics reports issued by the Payment Systems Department of the Bank of Latviaon July 4, 2000.
The term "customer" used in Tables 38–41 denotes natural and legal entities who are not credit institutions and to whomcredit institutions provide payment services.
`
140