Embed Size (px)
Citation preview

Gravity and Height References in the São Paulo state
Session: Gravimetry and Geoid
V. C. SILVA¹; D. BLIZTKOW¹; F. G. V. ALMEIDA FILHO¹; A. C. O. C. MATOS²; I. M. BJORKSTROM³
Escola Politécnica da Universidade de São [email protected]
2019

2
GLOBAL GEODETIC OBSERVING SYSTEM
Unified Height System GeohazardMonitoring
Sea level Change, variabilityand Forecasting
Geodetic Space WeatherResearch
INTRODUCTION
• IAG Resolution (No. 1) for the definition and realization of an International Height Reference System (IHRS).
• IAG Resolution (No. 2) for the establishment of a Global Gravity Reference System.
IAG 2015

INTERNATIONAL GRAVITY REFERENCE SYSTEM
1) International Gravity Standardization Net 1971 (IGSN71)• 24.000 relative gravity meters;• 200 pendulum gravity meters;• 10 balistics gravity meters;• Accuracy: 100 µGal.
2) IGSN71 in Brasil• 20 relative measurements;• Accuracy: ≅ 50/100 µGal.
3) Brazilian Fundamental Gravimetric Network• 620 gravity stations (ON).
4) Further gravimetric data• IBGE• IGC• EPUSP 3
• UFPR• PETROBRAS
Source: ON (1980).
Fig. 1 – BFGN 1980.
INTRODUCTION

GRAVITY REFERENCE SYSTEM (GRS) IN SÃO PAULO
1) Hannover University• Jilag#3
Accuracy: 100 µGalNumber of stations: 1
2)Observatorio Nacional• A10#11
Accuracy: 10 µGalNumber of stations: 4
3) CENEGEO/IGC/LTG• A10#32
Accuracy : 10 µGalNumber of stations : 15
4
Fig. 2– Location of the GRS-SP stations
INTRODUCTION

5
OBJECTIVE
• To contribute to IHRF by computing the gravity potential at four stations: Presidente Prudente (PPTE), São
José do Rio Preto (SJRP), São Carlos (EESC) and Botucatu (SPBOP).
• To quantify and to analyze the connection of the gravimetric densification network of São Paulo state to the
Gravity Reference System (GRS).
• To analyze the residuals (geopotential model and RTM) in the study area.

The connection of the relative gravimetric network to the Gravity Reference System of São Paulo
• Connection of the relative gravimetric network:
• Analysis of the absolute gravity measurements.
Assis 2010
Ourinhos
Densification
São Paulo (ABS)
Itatinga 2009
Itatinga
Densification
Ourinhos
Piratininga 2009
Itatinga
Piratininga
Densification
Fig. 4 – Schem of the of gravimetric network update.
6
METHODOLOGYR
efer
ence
Surv
eys
Fig. 3– A-10 Gravity meter.
Source: Micro-g LaCoste.
reprocessing;application of an off-set according to gravity reference;field survey.

STUDY AREAFig. 5– IHRF stations.

𝑇𝑅𝐸𝑆(𝛿𝑔−𝛿𝑔𝐺𝐺𝑀(𝑛𝑚𝑎𝑥:100))
Disturbing Potential
𝑇𝑅𝐸𝑆 =𝑅
4𝜋 𝐻(𝜓)𝛿𝑔𝑅𝐸𝑆𝜕𝜎
𝑇𝑅𝐸𝑆(𝛿𝑔−𝛿𝑔𝐺𝐺𝑀(𝑛𝑚𝑎𝑥:100) − 𝛿𝑔𝑅𝑇𝑀)
8
METHODOLOGY
𝑇𝑅𝐸𝑆(𝛿𝑔−𝛿𝑔𝐺𝐺𝑀(𝑛𝑚𝑎𝑥:200))
𝑇𝑅𝐸𝑆(𝛿𝑔−𝛿𝑔𝐺𝐺𝑀(𝑛𝑚𝑎𝑥:200) − 𝛿𝑔𝑅𝑇𝑀)
𝛿𝑔𝑅𝐸𝑆𝐼𝐷𝑈𝐴𝐼𝑆
𝛿𝑔𝑅𝐸𝑆 (𝛿𝑔−𝑔𝐺𝐺𝑀(𝑛𝑚𝑎𝑥:200)− 𝛿𝑔𝑅𝑇𝑀)
𝛿𝑔𝑅𝐸𝑆 (𝛿𝑔−𝑔𝐺𝐺𝑀 𝑛𝑚𝑎𝑥100 )
𝛿𝑔𝑅𝐸𝑆 (𝛿𝑔−𝑔𝐺𝐺𝑀(𝑛𝑚𝑎𝑥:100)− 𝛿𝑔𝑅𝑇𝑀)
𝛿𝑔𝑅𝐸𝑆 (𝛿𝑔−𝑔𝐺𝐺𝑀 𝑛𝑚𝑎𝑥:200 )• Geopotential model:
GOCO05S nmax=200 GOCO05S nmax=100
• Residual Terrain Model:
ALOS
• Ocean gravity disturbances:
SAND14
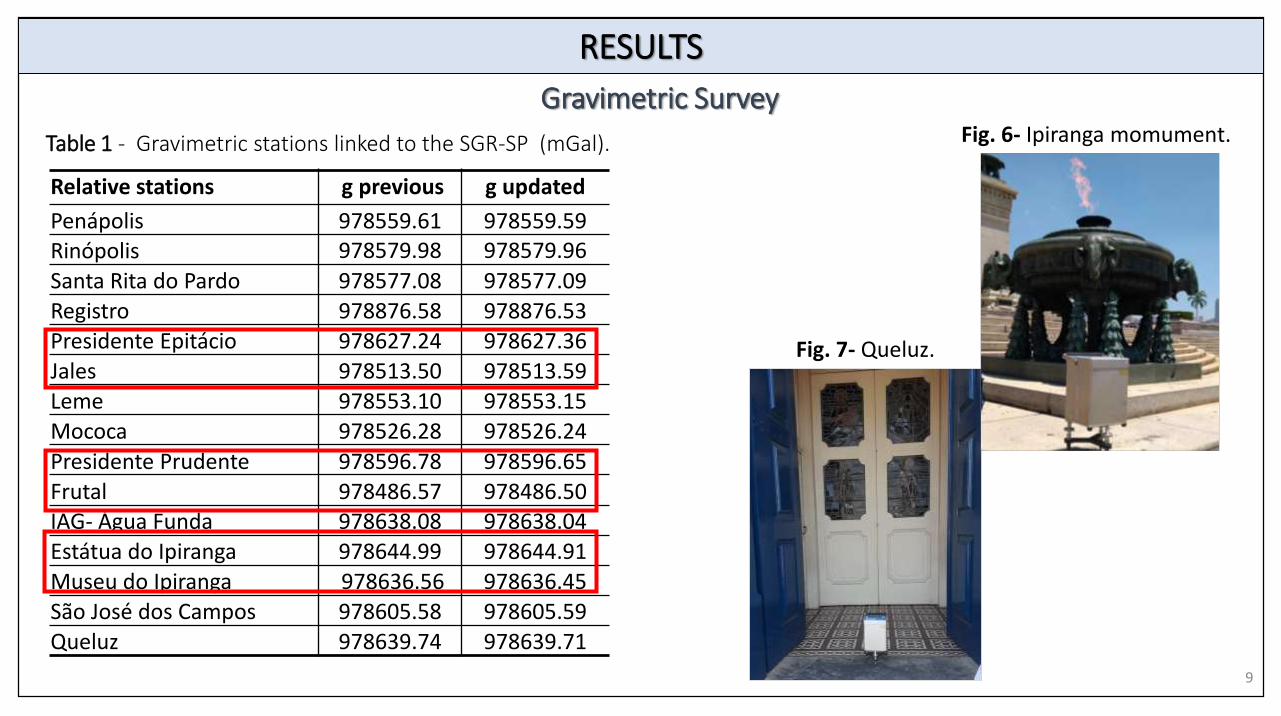
Gravimetric Survey
Relative stations g previous g updated
Penápolis 978559.61 978559.59Rinópolis 978579.98 978579.96
Santa Rita do Pardo 978577.08 978577.09
Registro 978876.58 978876.53
Presidente Epitácio 978627.24 978627.36
Jales 978513.50 978513.59
Leme 978553.10 978553.15
Mococa 978526.28 978526.24
Presidente Prudente 978596.78 978596.65
Frutal 978486.57 978486.50IAG- Água Funda 978638.08 978638.04
Estátua do Ipiranga 978644.99 978644.91
Museu do Ipiranga 978636.56 978636.45
São José dos Campos 978605.58 978605.59
Queluz 978639.74 978639.71
Table 1 - Gravimetric stations linked to the SGR-SP (mGal).
9
RESULTS
Fig. 6- Ipiranga momument.
Fig. 7- Queluz.

Minimum 0.00
Maximum 0.28
Mean 0.05Standard Deviation 0.05Number of stations 4704
Updated gravimetric network of São Paulo
Table 2- Statistics of the updated gravimetricnetwork (mGal)
Fig. 8 – Discrepancies of the gravimetric stations with the connection to SGR-SP.
10
RESULTS

11
RESULTS
Fig. 9- Gravity Disturbances Residuals (1- No RTM-MGG100 ;2- RTM reduced –MGG100; 3- No RTM-MGG200 ;4- RTM reduced –MGG200;
1 2
3 4

Statistics 𝜹𝒈𝑹𝑬𝑺 (𝑹𝑻𝑴) 𝜹𝒈𝑹𝑬𝑺 (𝒏𝒎𝒂𝒙:𝟏𝟎𝟎) 𝜹𝒈𝑹𝑬𝑺 (𝒏𝒎𝒂𝒙:𝟐𝟎𝟎)Mean -0.16 1.22 -0.01
Median 0.14 2.98 0.17Standard Deviation 12.92 19.6 16.02
RMSD 12.92 19.64 16.01Positive Maximum value 137.33 108.60 112.18
Negative minimum value -110.26 -89.80 -89.91 12
(𝒏𝒎𝒂𝒙: 𝟏𝟎𝟎
RESULTS
Fig.10- Gravity Disturbances Residuals (1- No RTM-MGG100 ;2- RTM reduced –MGG100; 3- No RTM-MGG200 ;4- RTM reduced –MGG200).
Table 3 – GDR statistics (mGal).
1 2 3 4
Statistics of the residual gravity disturbances in the study area
𝒏𝒎𝒂𝒙: 𝟏𝟎𝟎 𝒏𝒎𝒂𝒙: 𝟐𝟎𝟎
Fig. 11- Gravity disturbances residuais obtained by RTM reduction.

São José do Rio Preto
RESULTS
Table 4 – GDR statistics- São José do Rio Preto (mGal).
Fig. 12- Gravity Disturbances Residuals (1- No RTM-MGG100 ;2- RTM reduced –MGG100; 3- No RTM-MGG200 ;4- RTM reduced –MGG200;
1 2 3 4
Statistics 𝜹𝒈𝑹𝑬𝑺 (𝑹𝑻𝑴) 𝜹𝒈𝑹𝑬𝑺 (𝒏𝒎𝒂𝒙:𝟏𝟎𝟎) 𝜹𝒈𝑹𝑬𝑺 (𝒏𝒎𝒂𝒙:𝟐𝟎𝟎)Mean 0.46 -0.65 -0.78
Median 0.15 -1.19 -0.85Standard Deviation 5.88 12.26 10.77
RMSD 5.90 12.27 10.79Positive Maximum value 21.24 50.59 53.64Negative minimum value -24.56 -48.75 -43.47
𝒏𝒎𝒂𝒙: 𝟏𝟎𝟎 𝒏𝒎𝒂𝒙: 𝟐𝟎𝟎

Table 5 – Disturbing potential (𝑇) (𝑚2𝑠−2).
São José do Rio Preto
GOCO05S 𝐠𝐠𝐦 𝐧𝐦𝐚𝐱𝟏𝟎𝟎 𝐠𝐠𝐦 𝐧𝐦𝐚𝐱𝟐𝟎𝟎
𝛅𝐠𝐑𝐄𝐒 RTM reduced no RTM RTM reduced no RTM
𝑇𝑝 -62.778 -62.852 -64.723 -64.192
Fig. 15- Digital Terrain Model ALOS.
RESULTS
• The 𝑇𝑝 differences between RTM and without RTM
are less than 0.6 𝑚2𝑠−2.
• The 𝑇𝑝 differences between order and degree are
around 1.6 𝑚2𝑠−2.
Fig. 13- R.G.D. RTM reduced. nxm:100. Fig. 14- R.G.D. RTM reduced. nxm:200.

RESULTS
15
São CarlosFig. 16- Gravity Disturbances Residuals (1- No RTM-MGG100 ;2- RTM reduced –MGG100; 3- No RTM-MGG200 ;4- RTM reduced –MGG200).
1 2 3 4
Table 6 – GDR statistics- São José do Rio Preto (mGal).
Statistics 𝜹𝒈𝑹𝑬𝑺 (𝑹𝑻𝑴) 𝜹𝒈𝑹𝑬𝑺 (𝒏𝒎𝒂𝒙:𝟏𝟎𝟎) 𝜹𝒈𝑹𝑬𝑺 (𝒏𝒎𝒂𝒙:𝟐𝟎𝟎)Mean 0.23 0.86 -0.01
Median -0.75 -0.91 -0.24Standard Deviation 10.75 14.47 13.52
RMSD 10.75 14.50 13.52Positive Maximum value 61.03 76.69 53.64
Negative minimum value -110.26 -41.87 -50.4
𝒏𝒎𝒂𝒙: 𝟏𝟎𝟎 𝒏𝒎𝒂𝒙: 𝟐𝟎𝟎

RESULTS
16
São Carlos
GOCO05S 𝒈𝒈𝒎 𝒏𝒎𝒂𝒙𝟏𝟎𝟎 𝒈𝒈𝒎 𝒏𝒎𝒂𝒙𝟐𝟎𝟎𝛿𝑔𝑅𝐸𝑆 RTM without RTM RTM without RTM
𝑇𝑝 -53.372 -56.021 -60.267 -57.855
Fig. 19- Digital Terrain Model ALOS.
Table 7 – Disturbing potential (𝑇) (𝑚2𝑠−2).
• The 𝑇𝑝 differences between RTM and without RTM are
around 2.5𝑚2𝑠−2 .
• The differences between the GGM are 6.9 𝑚2𝑠−2
using RTM reduction and 1.8𝑚2𝑠−2 without using.
Fig. 17- R.G.D. RTM reduced. nxm:100. Fig. 18- R.G.D. RTM reduced. nxm:200.

Statistics 𝜹𝒈𝑹𝑬𝑺 (𝑹𝑻𝑴) 𝜹𝒈𝑹𝑬𝑺 (𝒏𝒎𝒂𝒙:𝟏𝟎𝟎) 𝜹𝒈𝑹𝑬𝑺 (𝒏𝒎𝒂𝒙:𝟐𝟎𝟎)Mean -0.80 -3.12 -1.66Median -1.24 -3.45 -1.35
Standard Deviation 10.82 14.65 12.23RMSD 10.85 14.98 12.34Positive Maximum value 55.09 48.69 56.23
Negative minimum value -110.26 -78.42 -76.08
RESULTS
17
Botucatu
Fig 20- Gravity Disturbances Residuals (1- No RTM-MGG100 ;2- RTM reduced –MGG100; 3- No RTM-MGG200 ;4- RTM reduced –MGG200;1 2 3
Table 8 – GDR statistics (mGal).
𝒏𝒎𝒂𝒙: 𝟏𝟎𝟎 𝒏𝒎𝒂𝒙: 𝟐𝟎𝟎
4

RESULTS
18
GOCO05S 𝒈𝒈𝒎 𝒏𝒎𝒂𝒙𝟏𝟎𝟎 𝒈𝒈𝒎 𝒏𝒎𝒂𝒙𝟐𝟎𝟎
𝛿𝑔𝑅𝐸𝑆 RTM reduced no RTM RTM reduced no RTM
𝑇𝑝 -46.556 -47.787 -49.265 -47.900
Botucatu
Table 9 – Disturbing potential (𝑇) (𝑚2𝑠−2).
Fig. 23- Digital Terrain Model ALOS.
• The 𝑇𝑝 differences between RTM and without RTM are
around 1.3𝑚2𝑠−2 .
• The differences between the GGM are 0.11 𝑚2𝑠−2 using theRTM and 2.7𝑚2𝑠−2 without using.
Fig.21- R.G.D. RTM reduced. nxm:100. Fig. 22- R.G.D. RTM reduced. nxm:200.

RESULTS
19
Presidente PrudenteFig 24- Gravity Disturbances Residuals (1- No RTM-MGG100 ;2- RTM reduced –MGG100; 3- No RTM-MGG200 ;4- RTM reduced –MGG200;
1 2 3 4
Table 10 – GDR statistics (mGal).
Statistics 𝜹𝒈𝑹𝑬𝑺 (𝑹𝑻𝑴) 𝜹𝒈𝑹𝑬𝑺 (𝒏𝒎𝒂𝒙:𝟏𝟎𝟎) 𝜹𝒈𝑹𝑬𝑺 (𝒏𝒎𝒂𝒙:𝟐𝟎𝟎)Mean 1.22 1.45 0.76
Median 0.72 2.13 0.13
Standard Deviation 7.20 12.3 10.54RMSD 7.30 12.39 10.57
Positive Maximum value 50.00 46.23 53.06Negative minimum value -26.96 -40.77 -30.54
𝒏𝒎𝒂𝒙: 𝟏𝟎𝟎 𝒏𝒎𝒂𝒙: 𝟐𝟎𝟎

RESULTS
20
Table 11 – Disturbing potential (𝑇) (𝑚2𝑠−2).
Figure 27- Digital Terrain Model ALOS.
Presidente Prudente
GOCO05S 𝒈𝒈𝒎 𝒏𝒎𝒂𝒙𝟏𝟎𝟎 𝒈𝒈𝒎 𝒏𝒎𝒂𝒙𝟐𝟎𝟎
𝛿𝑔𝑅𝐸𝑆 RTM reduced no RTM RTM reduced no RTM
𝑇𝑝 -50.507 -50.760 -46.734 -46.693
• The RTM reduction wasn't significative.
• The 𝑇𝑝 results show a difference around 4 𝑚2𝑠−2
between GGM.
Figura 25- R.G.D. with RTM. nxm:200. Figura 26- R.G.D. without RTM. nxm:200.

21
GOCO05S 𝒈𝒈𝒎 𝒏𝒎𝒂𝒙𝟏𝟎𝟎 𝒈𝒈𝒎 𝒏𝒎𝒂𝒙𝟐𝟎𝟎𝛿𝑔𝑅𝐸𝑆 RTM reduced no RTM RTM reduced no RTM
Botucatu 62628896.80 62628895.57 62628894.09 62628895.45São Carlos 62628672.19 62628669.54 62628665.29 62628667.70P Prudente 62632532.03 62632531.77 62632535.80 62632535.84S J do Rio Preto 62631481.77 62631481.69 62631479.82 62631480.35
GOCO05S 𝒈𝒈𝒎 𝒏𝒎𝒂𝒙𝟏𝟎𝟎 𝒈𝒈𝒎 𝒏𝒎𝒂𝒙𝟐𝟎𝟎
𝛿𝑔𝑅𝐸𝑆 RTM reduced no RTM RTM reduced no RTM
Botucatu 813.0869 813.2127 813.3638 813.2242
São Carlos 836.0919 836.3626 836.7965 836.5500Presidente Prudente 441.5713 441.5972 441.1858 441.1816São José do Rio Preto 548.9545 548.9621 549.1533 549.0990
Table 12 – Gravity potential (m/𝑠2).
Table 13 – Normal Height (m).
RESULTS
IBGE 𝐻𝑁= 436.3673
Final Considerations
22
• The gravity distribution for IHRF in São Paulo is an example on what has to be done at otherstations.
• An ideal coverage may be difficult to reach in many cases.
• The present geopotential models have a small commission error up to d/o 250 and theommission error will decrease from that order (ICGEM).
• The present tendency based on the results is to adopt d/o for the MGG of up to nmax:200 with an integration radius of, approximately, 100 kilometers.
• A further study will be performed to investigate different geopotential the models.

REFERENCE
• ESCOBAR. I.P. Métodos de levantamentos e ajustamento de observações gravimétricas visando aimplantação da rede gravimétrica fundamental brasileira. Observatório Nacional. Brasil v. 1, p. 1-150,1980.
• HEISKANEN, W. A.; MORITZ, H. Physical Geodesy. W.H. Aalto University, 1967.
• HOFMANN-WELLENHOF, B.; MORITIZ, H. Physical Geodesy. Springer Wi ed. New York, 2006.
• IAG. IAG Resolution (No. 1) for the definition and realization of an International Height ReferenceSystem (IHRS). 2015.
• IHDE, J. et al. Definition and Proposed Realization of the International Height Reference System (IHRS). Surveys in Geophysics, v. 38, n. 3, p. 549–570, 2017.
• MÄKINEN, J.; IHDE, J. The Permanent Tide In Height Systems. International Association of Geodesy Symposia, v. 133, p. 81–87, 2009.
• SÁNCHEZ, L. et al. Strategy for the Realization of the International Height Reference System ( IHRS ).2016.
23

Obrigada!
24
This study was financed in part by the Coordenação de Aperfeiçoamento de Pessoal de Nível Superior - Brasil (CAPES) -Finance Code : 88882.377456/2019-01 .