Embed Size (px)
Citation preview

Session: Adaptation Opportunities and Capacity
Second AIACC Regional Workshop for Latin America and the CaribbeanRegente Palace Hotel, Buenos Aires, Argentina, 24-27 August 2004
Integrated Assessment of Social Vulnerability and Adaptation to Climate Variability and Change Among Farmers in Mexico and
Argentina
AIACC LA-29
“Assessing adaptive capacity of farmers in Argentina and Mexico.”
Mónica B. Wehbe and Hallie C. Eakin with Luis Bojórquez

Sensitivity of farm unitsPerceptions
Multiple stressors
Adaptive CapacityFlexibilityStability
Access to Resources
SOCIAL VULNERABILITY
Sensitivity indicators:• Climate impacts on farmers, crops, livestock and infrastructure• Other stressors on livelihoods security
Capacity indicators: Weighted measure of resource endowments and access, management and actions
Social Vulnerability
Impacts Adaptations

Objectives and Challenges
• OBJECTIVE: Understand the relationship between livelihoods and vulnerability in two regions (Cordoba, Argentina and Gonzalez, Mexico)
To develop methods for integrating vulnerability attributes (e.g., sensitivity, adaptive capacity)
To explore which are most important variables in determining differences in vulnerability within each region
• CHALLENGES: The absence of the dependent variables “vulnerability” “sensitivity” “adaptation”
• CHALLENGES: The multivariate nature of vulnerability and its attributes:
How to integrate qualitative and quantitative data, rigorously?
How to capture complexity and uncertainty?
• CHALLENGES: The lack of temporal data in one-time surveys
AIACC LA-29

Approaches
• Farm household surveys– Data collected on: production, climate risk and impacts,
resource use and access– n = 240 Cordoba, Arg; – n = 234 Gonzalez, Mex (and n = 60 Veracruz, Mex)
• Survey data used to:– Classify population according to production systems and size
of landholding– Differentiate production systems by sensitivity and adaptive
capacity indices– Integrate sensitivity and adaptive capacity scores– Compare vulnerability of production systems in each location
and between locations, based on the above indices
AIACC LA-29

South-center of Cordoba Province•The Region:
Survey:
–Average worked area: 653 hs.
–Average rented area: 44%
– 91 % has finished primary school
– 42 % has finished secondary school
National Agriculture Census:
•Number production units:
1988: 20,817 2002: 13,128
•Bovine cattle
1988: 4,876,752 2002: 3,819,795
•Farmer’s production strategies highly focused on soybeans mono cropping
•Drought, Hail and Flooding greatest climate concerns (survey data)
AIACC LA-29
Laboulaye
Oncativo
Marcos JuarezRio Cuarto

Sensitivity
Main climatic events affecting each main crop, frequency of adverse events, percentage of area affected, and type of damage. Each response has been given a value, representing (0) no impact; (1) low impact; (2) medium impact; (3) high impact.
R1g= (freq * affa * typd)
For each crop, these values were weighted by proportion of agriculture producers concerned with each particular event within their group and by area dedicated to that particular crop related to the total worked area by each producer, including crop lost (differences between planted and harvested area).
R2g= (R1g * (ne/Ng) * (%aded) * ( %nhara) )
To get a measure of sensitivity for a whole location, each group has been weighted by the number of the group related to the number of producers of that location and summed.
Wig = [R2g* (Ng/NL)]
AIACC LA-29
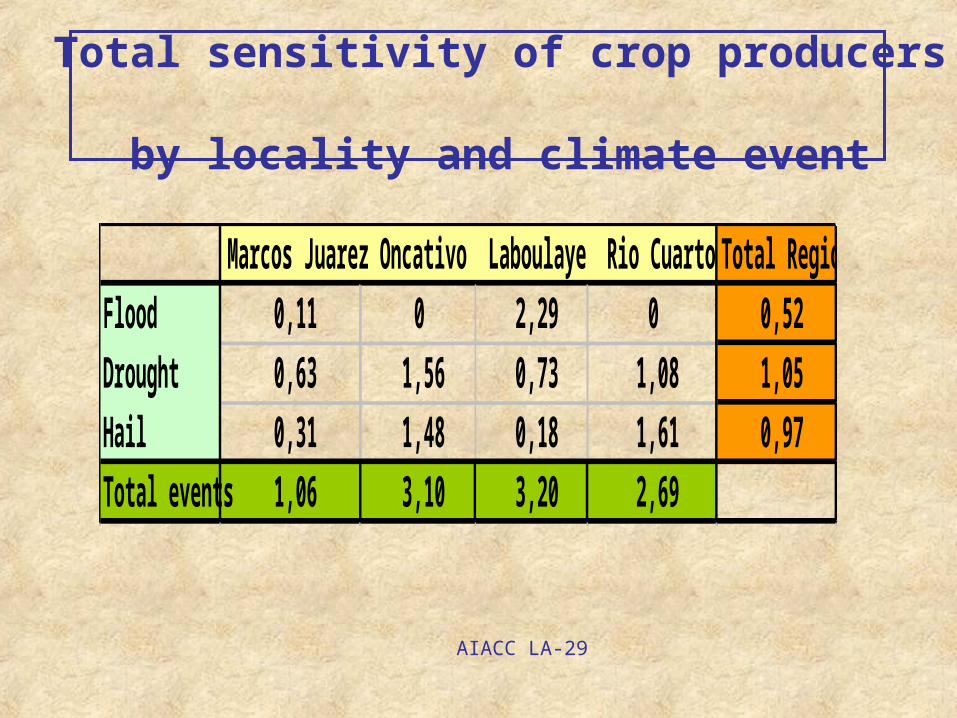
Total sensitivity of crop producers by locality and climate event
AIACC LA-29
Marcos Juarez Oncativo Laboulaye Rio Cuarto Total Region
Flood 0,11 0 2,29 0 0,52
Drought 0,63 1,56 0,73 1,08 1,05
Hail 0,31 1,48 0,18 1,61 0,97
Total events 1,06 3,10 3,20 2,69

Total sensitivity of agriculture producers by group
AIACC LA-29
Locality Group Cropping Livestock Infrastructure Total
Crop small 1,68 1,68
Crop large 0,61 0,61
Marcos Juárez Mixed small 1,38 1,38
Mixed large 0,68 0,68
Livestock 0,75 0,75
All (weighted) 1,06 0,06 1,12Crop small 3,01 0,05 3,06
Oncativo Crop large 3,30 3,30
Mixed 3,00 3,00
All (weighted) 3,10 0,03 3,13Crop 1,27 1,27
Laboulaye Mixed small 4,36 0,85 5,21Mixed large 4,92 0,75 5,67Livestock 1,35 0,54 1,89
All (weighted) 3,20 0,37 0,64 4,21Crop small 1,08 1,08
Río Cuarto Crop large 3,05 3,05Mixed small 3,42 0,07 3,49Mixed large 2,08 0,18 2,26
All (weighted) 2,69 0,07 2,76

Adaptive Capacity
Indicators defined for the three attributes have been classified into:
Material Resources: Worked area; Soil quality; Machinery; Net income
Human Resources: Experience; Schooling; Participation in organizations; Official technical assistance; Private technical assistance
Management Capacity: Percentage of hired area; Crop diversity; Percentage of cattle income; Buying land; Selling land; Other important income
Adaptations: Number of blocks; Hail insurance; Use of climate information; Change in cattle management; Change in crop management
AIACC LA-29

Adaptive Capacity
Laboulaye
AIACC LA-29
Physical/material resources Total Cropping Mixed small Mixed large Livestock
Worked area 1,03 0,78 0,67 3,11 0,55
Soil quality 1,03 0,43 0,84 0,48 0,86
Machinery 0,81 0,70 0,66 0,92 0,31
Net income 1,47 1,03 0,33 4,00 -0,06
Total 4,34 2,94 2,50 8,52 1,66
Social/human resources Total Cropping Mixed small Mixed large Livestock
Experience 1,11 0,89 1,10 1,03 1,32
Schooling 0,98 1,16 0,89 1,22 0,70
Participation in organizations 1,17 1,30 1,56 1,47 1,30
Official tecnical assistance 0,90 0,00 1,30 0,81 1,08
Private tecnical assistance 1,06 0,78 0,86 1,57 1,31
Total 5,23 4,14 5,72 6,09 5,71
Management capacity Total Cropping Mixed small Mixed large Livestock
% hired area 0,96 1,70 0,74 0,99 0,85
Crop diversity 0,87 0,82 0,92 1,34 0,07
% cattle income 1,79 0,35 2,42 1,23 6,00
Buying land 0,84 0,00 0,61 1,15 0,00
Selling land 1,04 1,67 1,00 0,00 1,67
Other important income 0,93 0,92 1,38 0,69 3,22
Total 6,44 5,46 7,08 5,41 11,83
Adaptations Total Cropping Mixed small Mixed large Livestock
Number of blocks 1,04 0,94 1,04 1,12 0,87
Hail insurance 0,93 0,56 0,67 1,27 0,14
Use of climate information 0,92 1,01 1,21 0,60 1,01
Change in cattle management 1,20 0,88 2,63 3,95 0,44
Change in crop management 1,02 1,36 1,53 1,53 0,34
Total 5,10 4,75 7,09 8,47 2,79
Variables weightedthrough consultationwith farmers

Agriculture producers
0
2
4
6
8
10
12
14
16
0 1 2 3 4 5 6Sensitivity
Adaptive capacity
Indices display
AIACC LA-29
Vulnerabilidad

AIACC LA-29
Current Vulnerability Group LocationMixed small LaboulayeMixed large Laboulaye
HIGH Crop small OncativoMixed OncativoMixed small Rio CuartoCrop large OncativoCrop large Rio CuartoLivestock LaboulayeMixed large Rio Cuarto
MEDIUM Crop small Marcos JuarezLivestock Marcos JuarezMixed small Marcos JuarezCrop LaboulayeCrop small Rio Cuarto
LOW Mixed large Marcos JuarezCrop large Marcos Juarez

Vulnerability
0
50
100
150
200
250
300
worked area
gross margin
soil quality
technical assistance
other sources of income
%hired landhail insurance
sens crop flood
sens crop drought
sens crop hail
sens infrast.
HighModerateLow
AIACC LA-29

Vulnerability Context: Gonzalez, Tamaulipas
• The municipio:– 85% EAP earn less than 2 minimum
salaries
– 57% adults lack primary school
– 70% farmers are communal, w/ only 34% land
• Planted area primarily in sorghum/safflower
• Farmers face declining grain prices, rising input costs
• Credit, technical assistance, insurance very limited, farmers dependent on government intervention
• Current policy: Crop conversion (sorghum to pasture), commercialization, specialization
• Drought and high temperature greatest climate concerns
AIACC LA-29
Area Planted in Principal Winter Crops, Gonzalez
0
2000
4000
6000
8000
10000
12000
14000
198519871989199119931995199719992001
hectares maize and sorghum
0
20000
40000
60000
80000
100000
120000
hectares safflower
Safflower
Sorghum
Maize

1. Define variables to be used in determining Sensitivity and Adaptive Capacity
2. Apply a multi-criteria model to develop a Sensitivity index and an Adaptive Capacity index
• is obtained through Analytical Hierarchy Process (AHP), which determine weights (e.g., importance) of each variable
• is obtained through value functions, which transform the natural scales of all variables or criteria into a scale of 0 - 1
3. Aggregate the two indices through Fuzzy Logic
Methodology (Mexico)
??
?n
iijijj cwI
1
ijw
ijc
AIACC LA-29

Adaptive Capacity
Human Resources Material Resources Financial Resources Information Diversity
Age, Education (Hh-head)Adults w/primary Adults/ Hh
Total areaTotal animal unitsIrrigationTractorLand rentalFarm tenure type
CreditInsurancePROCAMPOOportunidades
Technical assistanceClimate information Sources Types
IncomeLand useCrops
Sensitivity
Principal Crop (Spr/Fall)Crop losses Past climate eventsPerception of climate changePest sensitivity
Agricultural Sensitivity Livelihood Sensitivity
Change in income Migration of Hh members % of Income from cropsChannel of commercialization
AIACC LA-29

Fuzzy Sets for Vulnerability
0.0
0.2
0.4
0.6
0.8
1.0
0.0 0.1 0.2 0.3 0.4 0.5 0.6 0.7 0.8 0.9 1.0
Index
μ(x)
These Linguistic Variables are transformed to Fuzzy Sets, as follows:
Vulnerability is defined by Linguistic Variables: Low Vulnerability, Moderate Vulnerability, and High Vulnerability
Low Moderate High
AIACC LA-29

0.0
0.2
0.4
0.6
0.8
1.0
0.0 0.1 0.2 0.3 0.4 0.5 0.6 0.7 0.8 0.9 1.0
Index
35.01
==∑=
n
iijijj cwsα'=0.33
α=0.67
0.0
0.2
0.4
0.6
0.8
1.0
0.0 0.1 0.2 0.3 0.4 0.5 0.6 0.7 0.8 0.9 1.0
Index
Fuzzy Sets for Sensitivity
0.0
0.2
0.4
0.6
0.8
1.0
0.0 0.1 0.2 0.3 0.4 0.5 0.6 0.7 0.8 0.9 1.0
Sensitivity Index
Low Moderate High
μ(x)
Fuzzy Sets for Sensitivity
0.0
0.2
0.4
0.6
0.8
1.0
0.0 0.1 0.2 0.3 0.4 0.5 0.6 0.7 0.8 0.9 1.0
Sensitivity Index
Low Moderate High
μ(x)
43.01
==∑=
n
iijijj cwa
α'=0.20
α=0.80
Fuzzy Sets for Adaptive Capacity
0.0
0.2
0.4
0.6
0.8
1.0
0.00.10.20.30.40.50.60.70.80.91.0
Capacity Index
Low Moderate High
μ(x)
Fuzzy Sets for Adaptive Capacity
0.0
0.2
0.4
0.6
0.8
1.0
0.00.10.20.30.40.50.60.70.80.91.0
Capacity Index
Low Moderate High
μ(x)
FuzzyficationCombinationFuzzy AdditionDefuzzyfication
0.0
0.2
0.4
0.6
0.8
1.0
0.0 0.1 0.2 0.3 0.4 0.5 0.6 0.7 0.8 0.9 1.0
Index
Crispy Value
Fuzzy solution space

Vulnerability Classes
0
20
40
60
80
100
HIGH MOD LOW
Vulnerability Class
Cases (%)
High Sensitivity Moderate Sensitivity Low Sensitivity
High Capacity Moderate Capacity Low Capacity
AIACC LA-29
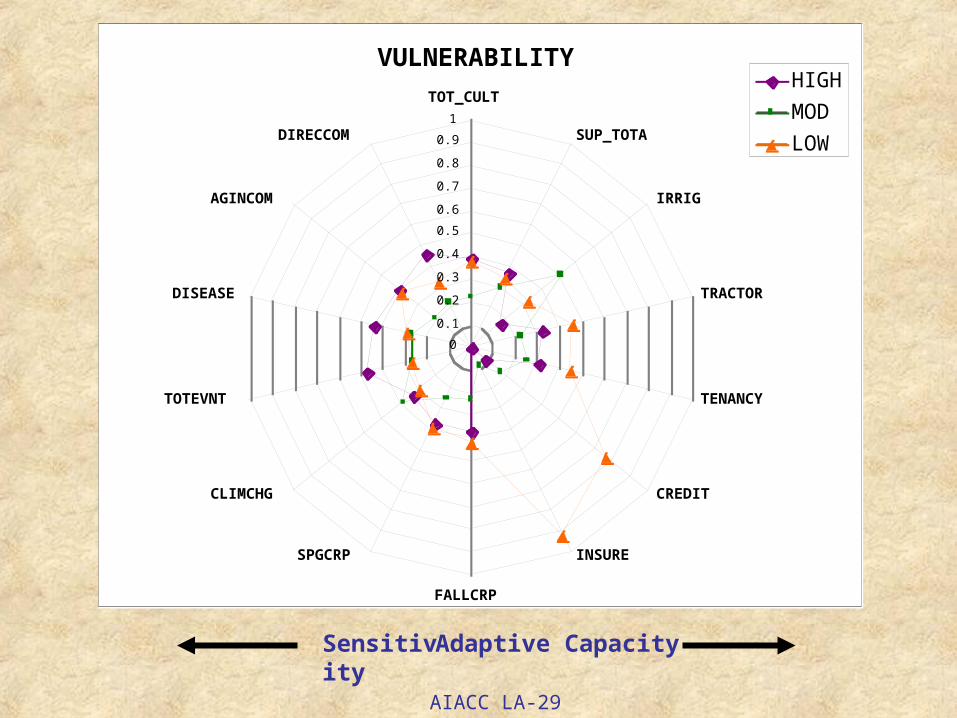
VULNERABILITY
0
0.1
0.2
0.3
0.4
0.5
0.6
0.7
0.8
0.9
1
TOT_CULT
SUP_TOTA
IRRIG
TRACTOR
TENANCY
CREDIT
INSURE
FALLCRP
SPGCRP
CLIMCHG
TOTEVNT
DISEASE
AGINCOM
DIRECCOM
HIGH
MOD
LOW
Adaptive Capacity Sensitivity
AIACC LA-29

Vulnerability and Farm Systems
0%10%20%30%40%50%60%70%80%90%
100%
% of cases
livestock non-farm
crop/livestockcrop/non-farm
crop
livestock/non-farm
Farm Systems
Vulnerability of Farm Systems
Low
Moderate
High
Farm Systems*livestock 4.3%crop/livestock 6.8%livestock/non-farm 7.3%crop 17.5%non-farm 28.6%crop/non-farm 35.5%
100.0%* defined by >= 66% of income
AIACC LA-29

Validation
Generic Adaptation: Made any important investment in production (e.g., irrigation infrastructure, changing crops, expanding area planted)
• Those with moderate to high capacity (χ2 = 6.26, p < 0.05)• Those classified as moderately vulnerable (χ2 =5.96, p <
0.05)
Specific Adaptation: Took action with respect to climate risk
• Those with high sensitivity (χ2 = 19.53, p < .001)• Those classified as highly vulnerable (χ2 = 8.635, p = 0.07)• Those with moderate to high capacity (not significant, p =
.567)
AIACC LA-29

Advantages of AHP/Fuzzy Logic Approach
• Uncertainty in classification is made explicit• Enables direct participation of stakeholders/ experts
in determining variable weights• Variable weights can be adjusted to reflect different
future socio-economic scenarios– e.g., advantage of crop diversity vs. crop specialization
• Enables simultaneous and transparent consideration of multiple attributes of vulnerability
AIACC LA-29

Conclusions Approach:• Successfully identified differences in vulnerability
within each case study• Identified factors contributing to sensitivity and
capacity • Illustrates complex interaction of attributes in defining
vulnerability: No one variable is sufficient for explaining vulnerability, capacity or sensitivity
Flexible methodology: • Variables change to suit circumstances, but indicators
allow comparison within and between case studies
AIACC LA-29


Actions With Respect to Climate Risk
Principal Actions of Those Farmers Undertaking Mulitple Strategies
0
10
20
30
40
50
60
70
Change cattle
breed
Change inputmanagementChange crops
Changeplanting dateChange crop
variety
% of respondants
Top Five Resposes to Climatic Risk
0
5
10
15
20
25
30
Changecattle breed
Change crop Changeplanting date
None Multiplestrategies
% of respondants