Embed Size (px)
Citation preview

8/6/2019 Session 9- "Nonmotorized Transport and Climate Change" by Bob Noland
http://slidepdf.com/reader/full/session-9-nonmotorized-transport-and-climate-change-by-bob-noland 1/9
Non-motorized transport andclimate change
Bob Noland
Alan M. Voorhees Transportation Center
Bloustein School of Planning and Public Policy
Rutgers University, New Brunswick, NJ

8/6/2019 Session 9- "Nonmotorized Transport and Climate Change" by Bob Noland
http://slidepdf.com/reader/full/session-9-nonmotorized-transport-and-climate-change-by-bob-noland 2/9
US GHG emissions by sector (2006)
33%
28%
19%
8%
6%
5% 1%
Electricity Generation
Transportation
Industry
AgricultureCommercial
Residential
Other

8/6/2019 Session 9- "Nonmotorized Transport and Climate Change" by Bob Noland
http://slidepdf.com/reader/full/session-9-nonmotorized-transport-and-climate-change-by-bob-noland 3/9
GHG emissions from transport sector
35%
28%
20%
7%
3%
1%0%
2%1%
2% 1%
Passenger Cars
Light-Duty Trucks
Medium- and Heavy-Duty Trucks
Buses
M torcycles
Commercial Aircraft - Domestic
Other Aircraft ± Domestic
Ships and Boats ± Domestic
Rail
PipelinesLubricants
About 17% of total from ground passenger transport

8/6/2019 Session 9- "Nonmotorized Transport and Climate Change" by Bob Noland
http://slidepdf.com/reader/full/session-9-nonmotorized-transport-and-climate-change-by-bob-noland 4/9
Transport & Climate policy
� US must reduce GHG emissions by 98% by2100
± Current target in some states
� 80% reduction by 2050 (from 1990 levels)
� 20% reduction by 2020 (from 1990 levels)
� Small amounts matter
± A 10% shift of all travel to non-motorized gives a
1.7% reduction in total GHG emissions
± Life cycle effects of reducing car production and
petroleum refining lead to further decreases
8/6/2019 Session 9- "Nonmotorized Transport and Climate Change" by Bob Noland
http://slidepdf.com/reader/full/session-9-nonmotorized-transport-and-climate-change-by-bob-noland 5/9
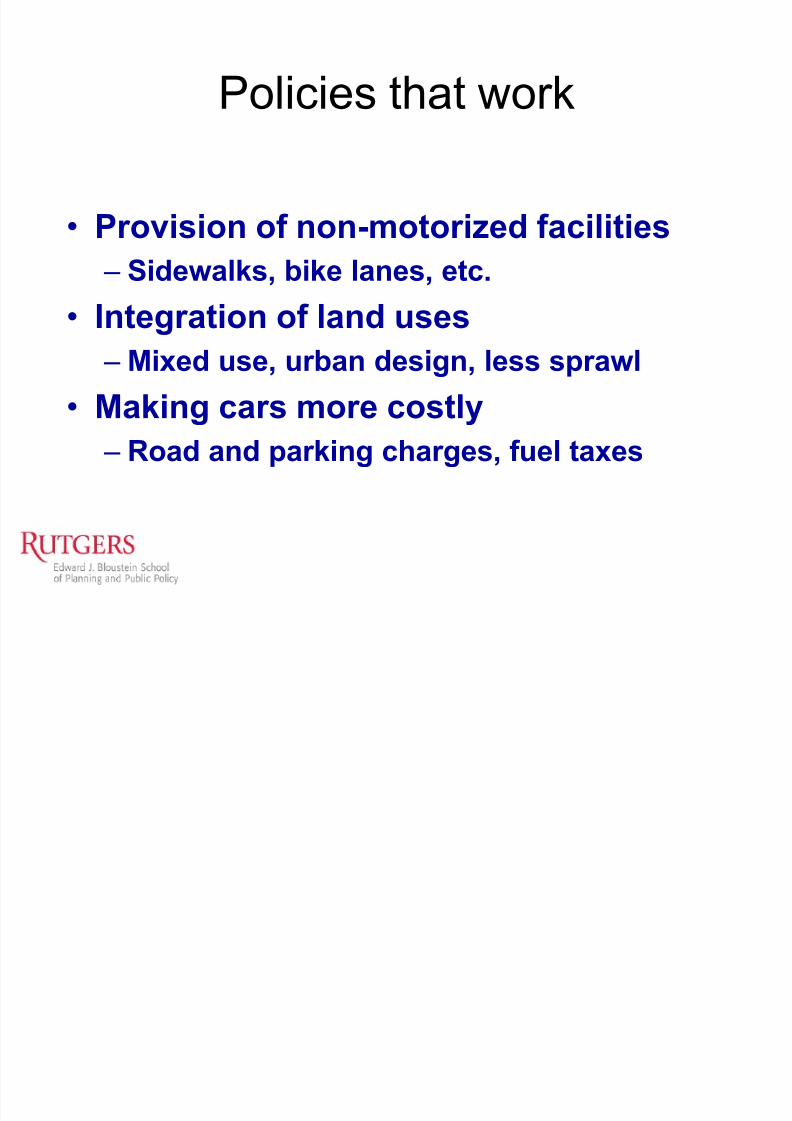
Policies that work
� Provision of non-motorized facilities
± Sidewalks, bike lanes, etc.� Integration of land uses
± Mixed use, urban design, less sprawl
� Making cars more costly ± Road and parking charges, fuel taxes

8/6/2019 Session 9- "Nonmotorized Transport and Climate Change" by Bob Noland
http://slidepdf.com/reader/full/session-9-nonmotorized-transport-and-climate-change-by-bob-noland 6/9
Developing countries

8/6/2019 Session 9- "Nonmotorized Transport and Climate Change" by Bob Noland
http://slidepdf.com/reader/full/session-9-nonmotorized-transport-and-climate-change-by-bob-noland 7/9
Developing countries
� Most large cities are developing without
considering non-motorized options
� Funding is typically biased towards large
infrastructure projects
� Cars are seen as symbol of development
8/6/2019 Session 9- "Nonmotorized Transport and Climate Change" by Bob Noland
http://slidepdf.com/reader/full/session-9-nonmotorized-transport-and-climate-change-by-bob-noland 8/9
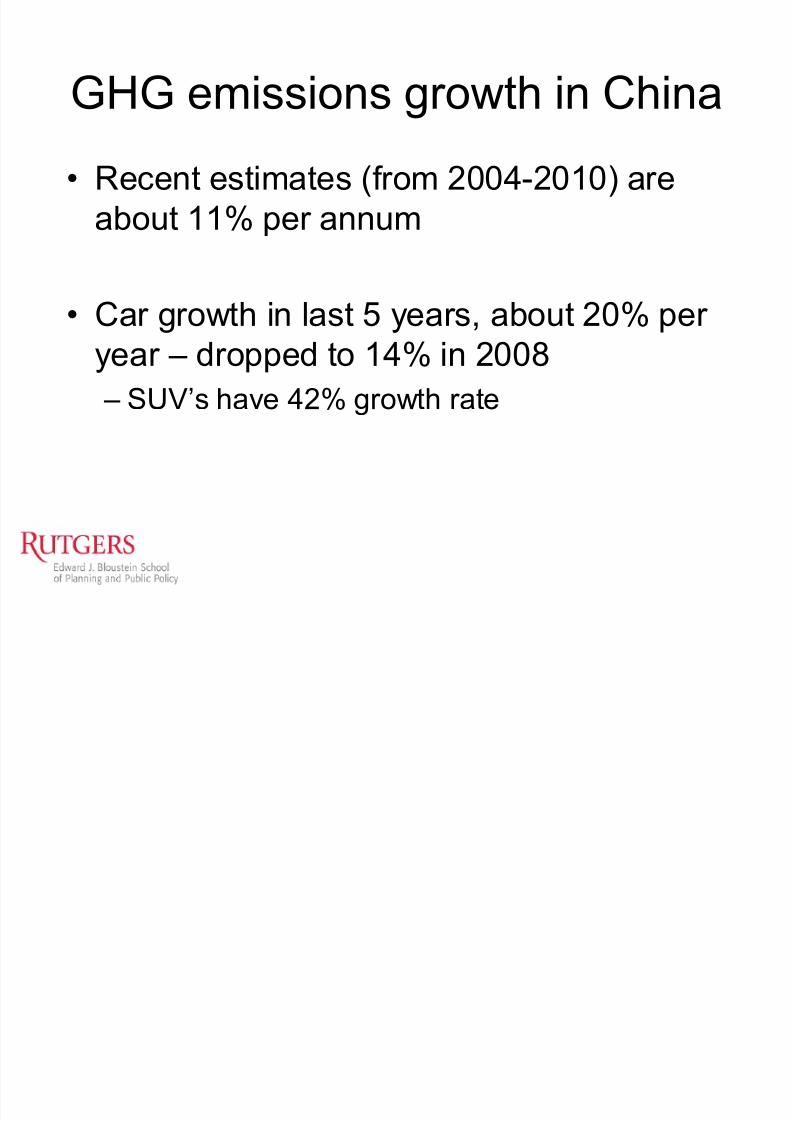
GHG emissions growth in China
� Recent estimates (from 2004-2010) are
about 11% per annum
� Car growth in last 5 years, about 20% per
year ± dropped to 14% in 2008
± SUV¶s have 42% growth rate

8/6/2019 Session 9- "Nonmotorized Transport and Climate Change" by Bob Noland
http://slidepdf.com/reader/full/session-9-nonmotorized-transport-and-climate-change-by-bob-noland 9/9
Conclusions
� To shift to non-motorized travel we
generally know what policies to implement
� However, equally important to prevent
those policies and plans that work against
non-motorized travel