Embed Size (px)
Citation preview

1
1
HNP and the Poor: Applying the Lifecycle Framework
and Going Beyond Country Averages
Authors: Mariam Claeson
Leslie Elder Davidson GwatkinMilla McLachlanThomas Merrick
Session 2
This is the second of a series of six session focusing on the linkages between health, nutrition, population and poverty. This session will exp lore the use of the life cycle framework and motivate the need for going beyond country averages when using health outcome and output data.
The authors are:
Mariam Claeson, (Lead Public Health Specialist)
Leslie Elder (Nutrition Specialist)
Milla Mclachlan ( Nutrition Advisor, HNP)
Davidson Gwatkin (Senior Advisor, Poverty)
Thomas Merrick (Senior Advisor, Population and Reproductive Health).
Charito Hofilena Hain has contributed to the preparation of the slides.
This session draws extensively on the lessons learned from World Bank operations, in applying the lifecycle approach in sector work and lending operations.

2
2
Session Objectives
This session will answer the questions:
• Why is it important to take a lifecycle approach to poverty reduction?
• How can the lifecycle approach be used?• What have we learned to date from
applying the lifecycle approach?• How to look at the distributional
dimension of health outcomes and outputs data?
Additional questions to think about as you go through this session:
What is pro-poor about the lifecycle?
Is it just a nice concept or operationally useful?

3
3
Session Outline
1. Why is a lifecycle approach important?2. What is it and how can it be used?
– To assess risks and gaps – To identify key interventions – To identify and measure outcomes among the poor– To identify external influences– As an input to prioritization of interventions for the
poor 3. What have we learned and summary of
applications4. How to look at the distributional dimension of
health outcomes and outputs?
In this session we will first discuss why a lifecycle approach is important to poverty reduction, providing the rationale for the lifecycle application.
We will then describe briefly what it is, including the stages, and how it can be used to assess risks and gaps, key interventions and corresponding measures. We will also briefly describe how it can help to identify external influences (non-health determinants to improve HNP outcomes of the poor at all stages of the lifecycle). This is also discussed in more depth in another module, Session 5: Critical Factors Outside the Health Sector --. We will review how it can be used as an input to the process of prioritization of basic services for the poor. Regional and country examples will illustrate these applications.
This session will also provide a summary of lessons learned from the applications in Bank operations: i.e. from sector work, project preparation, supervision and programming.
The final segment of this session will

4
4
It helps in understanding that:
• Maximum benefits in one age group can be derived from interventions in an earlier age group
• Interventions at several points across the lifecycle are needed to sustain improvements in health outcomes
• There are intergenerational risks and benefits
WHY is a lifecycle approach important?
Advantages
Why is a lifecycle approach important?
What are the advantages of a lifecycle approach in achieving greater impact on the health outcomes of the poor?
First, maximum benefit in one age group can be derived from interventions in an earlier age group. For example, performance in school and school attendance is significantly influenced by health and nutrition interventions during pre school years, especially in the first three years of life.This is of particular importance among the poor, where the likelihood of poor nutritional start in life is greater – and as a result, increased risk of poor school and work performance later in life.
Second, disease-specific interventions or other single interventions ( i.e. immunization, treatment of illness, antenatal visits ) by themselves are unlikely to reduce overall mortality and increase life expectancy of the poor due to the many risks throughout the lifespan. By addressing risks at different stages of life – in childhood, school years, adolescence, adulthood and the periods of pregnancy and childbirth – and throughout the continuum of care (early prevention, care at first level facility and referral levels) the likelihood to further sustain and improve health outcomes, significantly increase.
Third, the effects are intergenerational. Improving the nutritional status of young women impacts the birth outcome of the next generation. Poor nutritional status of women is a major determinant of low birth weight – more common among poor than rich. Positive HIV/AIDS status of the mother puts her infant at risk. A lifecycle approach helps to increase our understanding of the need to review multiple risks and intervene at different ages with multiple interventions in order to measure overall improvements in health, nutrition and population outcomes among the poor.

5
5
Case fatality rates in children under five from different diseases by nutritional status
0
10
20
30
40
50
60
70
Malaria CerebralMalaria
Meningitis Pneumonia Gastroenteritis All Diseases
Disease
Cas
e fa
talit
y
none
mild
moderate
severe
Malnutrition
Source: WHO
WHY is a lifecycle approach important?
Nutrition and Health Synergy
Fourth, the lifecycle approach recognizes that health, nutritionand reproductive interventions have a cumulative effect and that there is a synergy between nutrition and health risks (and interventions) at different stages of the lifecycle, and between stages and generations. For example, as shown in this slide, the degree of malnutrition influences the case fatality rates in children under five from individual diseases: malaria, pneumonia, diarrhea. Therefore, integrated approaches have greater impact on health outcomes of the poor (who are more likely to be exposed to multiple risks and to suffer from multiple problems) than disease-specific or nutrition specific approaches alone.
Note that mild malnutrition influences case-fatality rates from infectious diseases.
This data is from WHO, Child and Adolescent Division.

6
6
The lifecycle approach can help to:
• Recognize age-specific vulnerabilityamong the poor throughout the lifecycle
• Assess multiple risks and gaps, more common among the poor than the rich
• Identify interventions that are likely to benefit the poorspecifically
WHY is a lifecycle approach important?
HNP Outcomes of the Poor
Why is a lifecycle approach important for the poor specifically?
Vulnerability. As shown in the previous slide, poor children are more likely to suffer from multiple risks (i.e. nutrition and illness) that influence HNP and other outcomes in that age group and in later stages of the lifecycle. For example, of the 11 million deaths in children under five are almost all ((99%) in low income groups, and most children suffer from more than one illness. Similarly, poor households are more vulnerable to catastrophic illness among adults, than rich households. Recognizing the vulnerability at different stages of the lifecycle is important for effective planning and programming for poor.
Risks and gaps. A lifecycle approach can help to identify dis-proportionate risks and gaps. For example, poor households are dis-proportionally exposed to several external risk factors ( e.g., lack of clean water, indoor air pollution and crowding). And, they are less likely to have access to those interventions that they are likely to benefit the most from. As will be shown in upcoming slides, they are less likely to have access to preventive and curative services, including the “best buys” ( potentially cost-effective, affordable, feasible, culturally appropriate interventions for poor communities and households). As discussed in other modules, there has to be targeted efforts to reach the poor, to increase their demand and effective utilization of preventive and curative services that can influence their HNP outcomes throughout the lifecycle. This will be discussed further in this module and in others.

7
7
30-44 (7.62%)
45-59 (7.43%)
60-69 (6.47%)70+ (6.35%)
0-4 (55.57%)
5-14 (8.82%)
Contribution of High Mortality at Each Age among the World’s Poor, to Total Mortality Gap between World’s
Poorest and Richest 20%
Source: The Burden of Disease among the Global Poor, World Bank
15-29 (7.75)
WHY is a lifecycle approach important?
Global Poor-Rich Health Gap, 1990
This slide illustrates age specific vulnerability of the global poor. the contribution of high mortality at each age among the world’s poor, to the total mortality gap between the world’s poorest and richest 20%. It shows that the age group 0-4 contribute with more than 50% to the mortality gap.
A similar pie chart exists for India (in a later slide) showing about 55% excess deaths among the poor in in the 0 – 5 age group.
How to make these calculations? We refer to the World Bank Human Development publication The Burden of Disease among the Global Poor, by Michel Guillot and Davidson Gwatkin.

8
8
What is it and how can it be used?
7days
28 days
1 year
Birth
5 years
10 years
20 years
Early neonatal period
Perinatal period
Neonatal periodPregnancy
Adulthood
Infancy
Adolescence
Childhood
The main stages in the lifecycle
Reproductive period
Aging
Death
"Pre-school years
"School-age"
Source: Child and Adolescent Health and Development Department (CAH), WHO
The HNP Lifecycle – what is it and how can it be used in program design?
This slide describes what the lifecycle is – the main stages. The lifecycle is often divided into infancy (the first year of life) with a neonatal period up to 28 days, followed by the rest of the childhood years, the school age period of life, early adolescence, adulthood and aging. The reproductive period covers adolescence and adulthood. Each of these periods carry its own risks. At each stage, poor are at increased risk of diseases, disability and death compared to rich.
Why a life “cycle” and not just a lifespan? The lifecycle comes full circle when the reproductive period of a women results in pregnancy and child birth. The concept of a lifecycle emphasizes the intergenerational effects – that the health and nutrition outcomes at one stage of life determines to some extent the outcomes of a later stage of life – and into the next generation. Several examples will be given in upcoming slides. For example, the education, health and nutritional status of a woman – before and during pregnancy -- are key determinants for the health and nutritional outcomes of her infant – including the survival of the newborn.
The lifecycle is not a new concept; only the increased applications of it in the context of improving HNP outcomes of the poor.

9
9
Using the Life Cycle
1. To Assess Risks and Gaps
5 years10 years
20 years
Adolescence Poor nutritionPoor developmentDrug use/abuseViolenceDeath
))
)))
Reproductive periodSTDsEarly/unwanted/ unsafe sexEarly/unwanted pregnancy
)))
Example: Main risks of childhood, adolescence and reproductive period
"School-age"
Poor nutrition, growth and developmentInjuryHelminth infectionsAbuse and neglect
)
)))
ChildhoodPoor, nutrition growth and developmentFrequent illnessInjuryAbuse and neglectDeath
)
))))
First, the lifecycle can be used to assess risks to the poor and gaps.
We will use the example of childhood, school age and adolescence to assess risks and gaps.
During childhood, the poor are at increased risk of poor nutrition, growth and development and they are more often at risk of illness than richare (for example, increased incidence of diarrhea, pneumonia and other infectious diseases influenced by increased exposure of poor households to poor hygiene practices and lack of clean water); children are are also subject to injury, abuse and neglect – and death. 11 million children every year do not reach their fifth birthday in developing countries.
During the school age period and adolescence, the risks of poor nutrition, growth and development continues, as does exposure to injury, abuse and neglect. Helminth (worms) carry an additional burden on poor school age children who are already at risk.
During the reproductive period, poor and illiterate women are at increased risk, compared to rich and educated, for STDs, early unwanted and unsafe sex and pregnancy.

10
10
7days
28 days
1 year
Birth
5 years
10 years
20 years
LBWAsphyxia
Low temperature
Perinatal period
Neonatal period
Neonatal TetanusPregnancy
Adulthood
Infancy
Adolescence
STDs, HIV/AIDS, Abortions,Mental problems
Childhood
China: Possible Risk factors influencing MCH outcomes of the poor
ReproductivePeriod
STDs, Hepatitis B,Reproductive Tract Infections
Aging
Death
PneumoniaLack of knowledgeIndoor Air Pollution
"School-age“
Injury, Cavities, Nutritional problems
Using the Life Cycle (Assessing Risks)
China Country Example
This slide shows one example of the use of the lifecycle in a Bank supervision mission. The Health VI project in China, which support MCH services in poor counties, included this lifecycle presentation (translated into Chinese) to inform a discussion among provincial program managers about their current MCH program priorities and activities. During a brainstorm about current and emerging risks to poor women and children in their provinces, they identified these risks:
At birth: Asphyxia, hypothermia, low birth weight and overall premature mortality;
Neonatal period: Neonatal tetanus;
Children under five: Pneumonia and outcomes influenced by overall lack of knowledge among the poor and indoor air pollution;
School children: Injury, nutritional problems, cavities;
Adolescents: STDs, HIV/AIDS, abortions and mental health problems;
Reproductive period: STDs, Hepatitis B, and Reproductive Tract Infections.
The need to further validates the magnitude of these risk factors, and to assess outcomes by income level were discussed. Participants found this analysis very useful in reviewing their priorities – while some risks are being addressed by ongoing projects, others will require more attention and emphasis to further reduce the MCH outcomes among the poorest. The results of this discussion also helped inform another ongoing review of basic services and priorities for the poor –including how to address the systemic constraints to achieve inc reased programmatic effectiveness.

11
11
10.9
43.9
63.6
75.8
41.0
23.3
13.315.113.1
0102030405060708090
100
Global Poorest 20% World Average Global Richest 20%
% o
f Tot
al D
AL
Y L
oss
Communicable Diseases Noncommunicable Diseases Injuries
Source: The Burden of Disease among the Global Poor, World Bank
Using the Life Cycle (Assessing Risks)
Problems of the global poorest
Although poor communities are at increased risk for almost all health risks of global importance (communicable diseases, injury and non-communicable diseases) at all stages of the lifecycle, some problems have shown to be of particular relative importance among the poor. Communicable diseases account for the largest share of the disease burden of the poor, while NCDs play a relative larger role among the rich.
Most vulnerable to communicable diseases (for example, malaria) are children (as shown in an earlier slide) and pregnant women – those are the most vulnerable stages of the lifecycle as measured by premature mortality. However, ill health in adults of both gender, including non-communicable diseases are also a major factor in influencing the household economy and contributing to poverty.
Many countries face the dual burden of the poorest and the richest – having to deal with the unfinished agenda of the poor and addressing the emerging problems of both poor and rich.
The data in this slide is from the work by David Gwatkin et al. The Burden of Disease among the Global Poor, HD World Bank. More information on the analysis of disease burden by income and age is available in the World Bank HNP Poverty and Health website:
http://www.worldbank.org/poverty/health/data/index. htm

12
12
Social risk management in Latin American countries
• Social protection provides a collection of measures to improve & protect the poor. The lifecycle has been used for risk assessment in several countries in Latin America to:– identify vulnerable groups, lifecycle specific
interventions and their coverage; – identify emerging groups at risk: i.e., the aging
population.
Using the Life Cycle (Assessing Risks)
Lessons from Latin America
This second example of a lifecycle application in risk assessment is from social protection projects. Social risk management using a lifecycle approach has been carried out in several Latin American countries (LAC). It has been a useful Bank instrument to help identify all the vulnerable age groups and the specific interventions that help in the social protection of those age groups. For example, the approach has helped to identify a commonly neglected age group – the elderly.

13
13
• The policy implications:
– Jamaica: Coverage of safety nets for all age groups at risk; identification of critical life stages and corresponding HNP preventive strategies.
– Dominican Republic: Identification of key risks by age & income group, risk indicators and coverage rates; inefficient strategies (i.e. food distribution programs) also identified.
Using the Life Cycle (Assessing Risks)
Lessons from Latin America
The lessons learned are: the need to identify all vulnerable groups and that there are age specific interventions in health, nutrition and population that correspond to those age-specific risks. Such a systematic approach also helped to identify ongoing interventions that are inefficient and ineffective.
14
14
Age Group
Main Risks Role for Health, Education and Infra.
Services
Role for Safety Nets Social Insurance Social Assistance
0-5 Stunted child development
PHC ServicesPre-school education
Early Child Development Programs
Nutrition programs of small children and mothers.
6-13 Low human capital development
Improve quality of primary educationReduce late entry and repetition
-- --
14-24 Low human capital developmentUnemployment, low wages
Teen pregnancy, STDs
Improve access/quality of secondary educationRemedial education
Reproductive health programs
--Scholarship/return -to-school incentive programs
25-64 Low income (unemployment/underemployment)
Promote labor-intensive growth. Emphasis in agriculture and rural development where poor live.
--Income transfers, training and/or job search assistance.
65 and Over
Chronic diseasesLow income
Health insurance
Social security (contributory pensions)
Income transfer(non-contributory pensions)
Health care
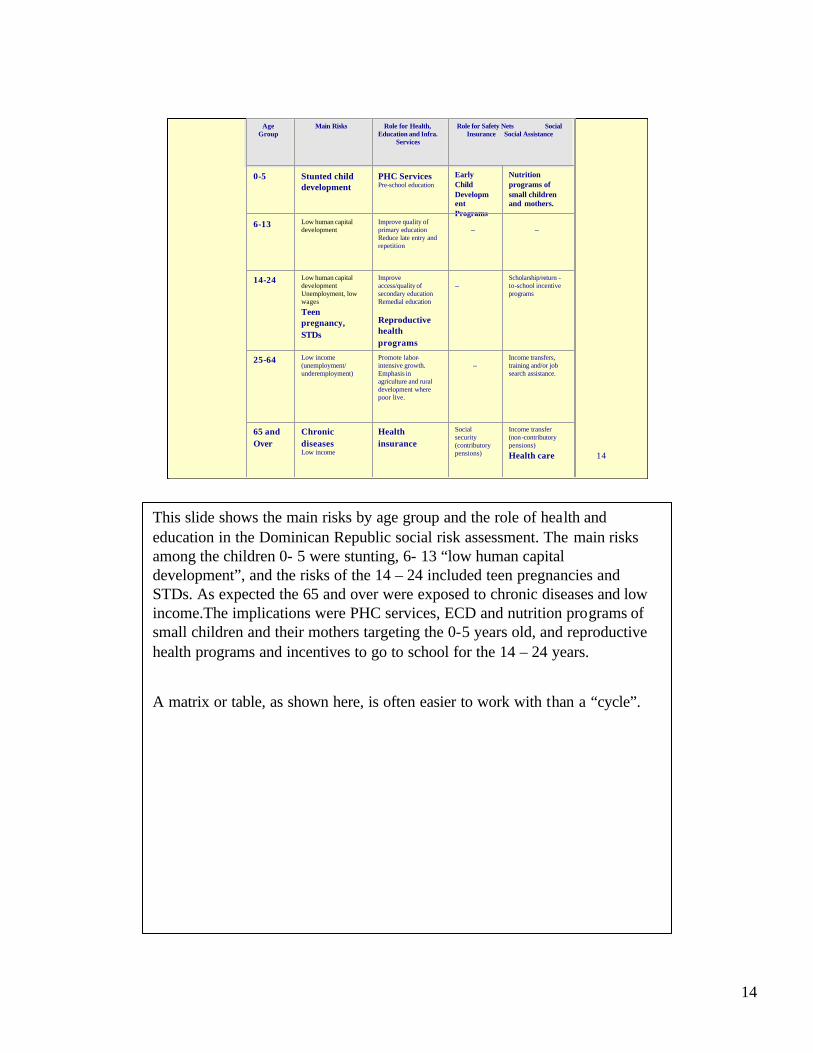
This slide shows the main risks by age group and the role of health and education in the Dominican Republic social risk assessment. The main risks among the children 0- 5 were stunting, 6- 13 “low human capital development”, and the risks of the 14 – 24 included teen pregnancies and STDs. As expected the 65 and over were exposed to chronic diseases and low income.The implications were PHC services, ECD and nutrition programs of small children and their mothers targeting the 0-5 years old, and reproductive health programs and incentives to go to school for the 14 – 24 years.
A matrix or table, as shown here, is often easier to work with than a “cycle”.

15
15
5 years10 years
20 years
Adolescence Adolescent-friendlyhealth servicesInterventions to promote a safe and supportive environment Nutrition interventionsAdolescent development
)
)
))
ChildhoodNutrition interventionsDisease prevention and managementCare for developmentAccident prevention
))
))
Reproductive periodEssential reproductive health servicesContraceptive servicesSTD care
)
))
"School-age" School health programmes)
IMCI
FRESH start
Example: Main strategies & interventions in childhood, adolescence and reproductive period
Using the Life Cycle
2. To Identify Key Interventions
Second, another utility of the lifecycle approach is to identify key interventions at all critical stages of the lifecycle.
Once risks and gaps have been identified, it is important to review the potentially most cost-effective, affordable, feasible to implement and culturally appropriate interventions to address those risks and gaps. A set of “best buys” have been developed, and efforts have been made to “package’ those for wide-scale implementation. For example IMCI (Integrated Management of Childhood Illness) which helps prevent and treat pneumonia, diarrhea, measles, malnutrition and malaria (and HIV/AIDS and locally important problems), or FRESH (Focused Resources on Effective School Health). There is also a minimum nutrition package and IMPAC – integrated management of pregnancy and childbirth. The IMCI approach is designed for use at peripheral facilities with little technological backup, and is based on assessing signs and symptoms, followed by low-cost treatment, prevention and referral. It is an example of an approach that is more effective in populations with an under-five mortality of more than 40 per 1000 – than in populations with lower child mortality rates.
For more information on the best buys, including the evidence base, we refer to the Public Health at a glance Fact sheets available at <www.worldbank.org/hnp> or from the HNP anchor team, see next slide.

16
16
• Easy access to the state of the art in HNP
• Key facts, evidence-based intervention, indicators
• Implementation lessons learned, selected sources
• Websites with Terms of Reference, PADs & useful links
Using the Life Cycle (Identify Interventions)
PH at a Glance Fact Sheets
This information is available from the HNP website for:
•nutrition, key determinant throughout the lifecycle
•malaria, TB and HIV/AIDS, responsible for premature mortality throughout the lifecycle of the poor
•reproductive health, covering men and women of reproductive age and care at birth
•IMCI and immunization, the key interventions during childhood
•school health, targeting the school age group
•mental health of increasing importance throughout the lifecycle
•and tobacco, a major risk factor from school age and beyond.
We will add other best buys as more information becomes available on for example NCDs.

17
17
32.4
54.1 56
.9
76.4
35
69.2
25.6
83.7
0
20
40
60
80
100
ARI treatment ORS use Immunization Delivery Care
Poorest quintile Richest quintile
Source: Davidson R. Gwatkin, World Bank
Using the Life Cycle (Identify Interventions)
Distributional Coverage of Best Buys
Although coverage of the best buys (discussed in previous slides) is on the increase in many places, there is still a wide gap between the coverage of those interventions among the poor compared with the rich as shown in this slide. ARI (acute respiratory illness) treatment and ORS for diarrhea (both core interventions in IMCI), immunization and delivery care have lower coverage rates among the poor who carry the largest burden of these diseases than among the rich. This data is from Demographic and Health Surveys. Source: Davidson R. Gwatkin, World Bank.
By reviewing and increasing the coverage of best buys for the problems identified at the different lifecycle stages the likelihood increases of actually improving overall health outcomes and reducing inequities. Focusing on one problem with one single disease specific solution will not significantly reduce the overall disease burden or improve health outcomes of any age group.
This analysis of coverage of key intervention by income is available in a series of country analysis of Demographic Health Surveys (DHSs) prepared by the Poverty Thematic Group, HNP network.
In many places information on access and use of key public health and clinical services by income is not available to policy makers and program managers and there is a risk that overall trends mask great discrepancies between rich and poor.

18
18
• Linking School health with ECD and IMCI in Sub Saharan Africa
• Scenario: Access to, and performance in, basic education have had a major effect on poor children’s escape from poverty. However, from 1990 to 2000, the number of children w/o access to school increased.
• The rationale for a lifecycle approach: Interventions to improve school performance and attendance act at different stages of the lifecycle.
Using the Life Cycle (Identify Interventions)
School Health in Africa
This third example from operations, show a lifecycle approach to school health, IMCI and Early Child Development programming in Africa. It is an attempt at policy and program levels to link different strategie s and interventions at different stages to achieve greater synergy. The education sector is promoting and investing in school health, FRESH (Focused Resources of Effective School Health). FRESH is primarily an education intervention – its aim is to improve school performance through health and nutrition interventions. However, it is also well documented tha t school performance is influenced by what happens early in life – I.e. by ECD programs that support health, nutrition and development of young children, preparing them for the school age period. Both ECD and FRESH require functional linkages to the health services – to a responsive health system that can address the needs of children who are ill and/or malnourished. The ECD and FRESH interventions targets children at different age.

19
19
• Policy implication: Coordinated implementation of these interventions (ECD, IMCI and FRESH) can achieve synergy on HNP & educational outcomes. Country examples:
Country
EritreaMadagascar
IMCI
ECD projectHNP project
ECD
ECD projectNUT project
FRESH
ECD& HNPNUT project
MaliMauritaniaSenegalUganda
HSIPprojectHSIPNUTECD&NUT
ED projectEDEDED
ED projectEDEDED
T
Using the Life Cycle (Identify Interventions)
School Health in Africa
This table shows the list of countries in which a concerted effo rt is made in Bank supported operations to link IMCI, ECD and FRESH to achieve synergy and improve education, health and nutrition outcomes among the poor.
This exemplifies how a lifecycle approach is used (i) to target different age groups, (ii) to seek complementary and synergy of interventions and (iii) to increase access to the poor by provision of preventive and treatment services through different channels: the health system (IMCI), the community (ECD, IMCI) and the school system (FRESH). The challenge is to ensure that the policy dialogue and the planning at national level, translates into linkages of ECD, IMCI and FRESH at district and community levels – reaching the poor communities and families.

20
20
5 years10 years
20 years
Reproductive periodFertility rateSTD infection rates
))
"School-age" School performance)
AdolescenceAge-specific morbidity and mortality rates
)
ChildhoodAnthropometryUnder 5 and 1-4 year mortality ratesDisease incidence rates
))
)
Example: Main outcome measures of childhood, adolescence and thereproductive stages
Using the Life Cycle
3. To Measure Outcomes
Third, the gaps and risks identified throughout the lifecycle can be measured. Some of the selected indicators shown here correspond to the International Development Goals. Others are important non-health measures of HNP interventions, for example school performance. Key indicators that measure progress towards these HNP outcomes, are the coverage rates of the best buys(I.e. immunization rates among the poor, the rate of exclusive breastfeeding of infants, IMCI coverage rates among the poor etc).
These diagnostics are discussed in more depths in other sessions of the PRSP series.
The value added of a lifecycle approach is that it can help select a few key indicators at different stages of the lifecycle, instead of selecting indicators that only reflect the HNP status at one stage of the cycle (i.e., childhood) –missing out of the full benefit of a lifecycle approach.
More information and example of useful indicators can be found in the PRSP Source book, Health Chapter, in the Technical Lifecycle Annex and also in the Public Health at a glance fact sheets at <www.worldbank.org/hnp>.

21
21
Improving child health outcomes in India; sector work
• Scenario: The decline in national and some state level childmortality rates is leveling off.
• The focus on child mortality reduction has been on child survival interventions.
• However, key determinants of under five mortality are maternal health and nutrition status, reproductive and neonatal health services.
Using the Life Cycle (Measure Outcomes)
Lessons from India
This example from India is from sector work done by the Reproduc tive and Child Health project; it reviewed trends in health outcomes and resulted in the recommendation to take a lifecycle approach to achieve further improvements. For more information: Reducing child mortality in India in the new millenium. Bulletin of the WHO, 2000, 78: 1192-1199 M Claeson, E Bos, T Mawji and I Pathmanathan).
The case study is India where child mortality trends are leveling off at national level and in some states. One of the reasons is the focus to date on scaling up child survival interventions that mainly reduce deaths in the post neonatal period, but that do not emphasize scaling up of maternal/reproductive health interventions, nutrition interventions for girls and young women nor the specific risks of the neonatal period – these are also critical determinants to achieve significant reduction in neonatal morbidity and mortality.

22
22
14657
9744
Medical maternity careNo antenatal careAntenatal & delivery care
U5MR
14184
IMR
10163
Mothers educationIlliterateLiterate
Source: NFHS 1992 - 93
Using the Life Cycle (Measure Outcomes)
Lessons from India
This slide shows how child mortality rates are influenced by maternal characteristics: mother’s education, maternity care – and also by place pf delivery, mother’s age at birth, previous birth interval and birth order (not shown here). This is from NFHS 1992-93 (National Family Health Survey, India). Clearly influencing maternal factors not only benefits the woman but also the child – the intergenerational effects on health outcomes.
Further reduction in child mortality rates are unlikely without a gender, poverty and lifecycle perspective.

23
23
• The policy option: A lifecycle approach to improving child health outcomes in the new millenium:– female education and nutrition– access to pregnancy and neonatal services– bridging the gender gap in child mortality by a
focus on health and nutrition of the girl child– socio economic environmental, behavioral, health
and nutrition influences on the lifecycle– focus on urban poor; innovative approaches to
health services delivery.
Using the Life Cycle (Measure Outcomes)
Lessons from India
The policy option for continuing reduction in child mortality among the poor are listed here. The lifecycle approach to improving child mortality rates acknowledges the multiple determinants, including the role of ma ternal health, nutrition and education in influencing child and infant mortality levels.
In addition to the selection of interventions, a major reduction in overall child mortality can be achieved by closing the gender gap in childhood mortality –by bringing girls’ mortality levels down to those of boys. And, by targeting the poor with the services though innovative approaches – involving the private sector where most poor seek care.

24
24
7days
28 days
1 year
Birth
5 years10 years
20 years
Improved interuterine
growth
Fewer birth complications
Fewer less severe infections and
quicker recovery
Improved growth and development
Improved cognitive function and school performance
Improved birth weights
Improved growth and developmentBetter health during
pregnancy
Consequences of improved nutrition around the MCH cycle
Using the Life Cycle
Nutrition Programming
Important health benefits accrue from improved nutrition during key stages of the lifecycle.
The positive consequences of adequate nutrition include health, cognitive development, and productivity benefits at all stages of life. Intergenerational benefits result from the causal links between the nutrition and health status of the mother (reaching as far back as the mother’s own fetal nutritional status) and that of her child.
•Adequate maternal nutrition reduces the risk of a child born with low birth weight (<2500g) or low body stores of micronutrients such as iron. Starting life without these risk factors improves the baby’s chances of surviving her first year of life. Normal birth weight children become taller adults with greater capacity to perform physical work. There is also evidence that fetal malnutrition increases the risk of non-communicable diseases (e.g., cardiovascular disease, diabetes, and hypertension) in adulthood.
•The benefits of improved nutritional status are cumulative. With adequate growth during early childhood, a child is more apt to be sent to school and he is better able to learn. Recent evidence suggests that some cognitive deficits due to nut ritional deficiencies inutero or during the first years of life may be irreversible. This underscores the fact that the maximum benefits of improved nutrition for one age often occur by intervening at an earlier life stage.
•Better nutritional status among adolescent girls (e.g., sufficient iron, vitamin A, iodine, protein, and energy) contributes to improved performance in school. It also sets the stage for better health during pregnancy, decreased risks of obstetrical emergencies, better infant outcomes, and (in the absence of anemia) improved materna l care-giving practices.

25
25
7days
28 days
1 year
Birth
5 years10 years
20 years
Immediate initiation of breastfeeding
Exclusive breastfeeding to 6m
Continued breastfeeding
Adequate complementary feeding from 6m
Micronutrient supplementation as
necessary
Energy and nutrient adequate diet
Micronutrient supplementation as
necessarySchool meals
Adolescent dietary advice
Diet and micronutrients during pregnancy
Pre-pregnancy dietary advice for adolescent
girls and women
Nutrition interventions around the MCH cycle
Using the Life Cycle
Nutrition Programming
There are proven, cost effective interventions for better nutrit ion at key stages of the lifecycle.
Clearly, there are powerful reasons for addressing nutrition at key stages in the lifecycle. Which nutrition interventions should be included in Bank-assisted projects?
•For some of the most cost-effective interventions, few additional household resources are needed. They depend largely on individual nutrition behavior change. For example, immediate initiation of exclusive breastfeeding continued for the first 6 months of life requires minimal additional nutrition inputs for the mother, but the health benefits for the infant are profound. There is extensive program experience with strategies for promotion and support for optimal breastfeeding practices.
•Micronutrient supplementation and fortification of foods are widely accepted as cost-effective strategies. Implemented in tandem with small changes in household infant and young child feeding practices, widespread micronutrient deficiencies can be eliminated. Strategies to improve and support child feeding practices, including such techniques as Trials of Improved Practices (TIPS) have been tested, including in Bank HNP projects.
•Less is known about intervening with adolescents. But there is evidence that this population group is open to behavior change messages about the payoffs of improved school and work performance. Evaluation of anemia control projects in India and Peru document that adolescent girls like how they feel when they are not anemic.
•We know that improving the quality of antenatal care services is crucial for delivering nutrition interventions to pregnant women. Just as with girls, women will take iron supplements during pregnancy when they: understand the health benefits to mother and baby; feel stronger; and know how to manage minor side effects of iron.

26
26
7days
28 days
1 year
Birth
5 years10 years
20 years
Parental education
Water and sanitation
Family and community practices
Peer behaviors
Physical environment
Access to quality health care
Family income
Marketing of infant foods
Socio-political context
Example: External factors influence MCH outcomes throughout the lifecycle
Using the Life Cycle
4. To Identify External Influences
Fourth, it is also important to identify the major risks to health from influences beyond the health sector. This slide shows the multiple risks to maternal and child health from external factors such as parental education, access to plenty of clean water, access to latrines and disposal facilities, family and community practices, peer behaviors, family income, socio political context and marketing of infant formula.
The non-health determinants to health are discussed in more depth in Session 5.
Question:
Are there any other important external influences that impact the health status of the poor?
Two examples will be given in the next slides: the example of the influences of the physical environment and of improved family and community best practices on MCH outcomes.

27
27
0 2 4 6 8 10 12 14 16
Malnutrition
Water/sanitation
Unsafe sex
Alcohol
Indoor air pollution
Tobacco
Occupation
Hypertension
Physical inactivity
Illicit drugs
Outdoor air pollution
% of global DALY
Burden of disease due to selected Burden of disease due to selected risk factors, 1995risk factors, 1995
As shown here, globally, the most important risk factors include malnutrition, water and sanitation, unsafe sex, indoor air pollution (IAP) and tobacco – these risk factors dis-proportionally affects the poor.

28
28
AIR POLLUTION and HEALTHAIR POLLUTION and HEALTH
• Most attention on effects of outdoor air pollution in cities of the developed world
• Indoor air pollution among rural and urban poor has been overlooked
In some countries, IAP is a major – and neglected-- risk factor to the health of the poor

29
29
BIOMASS: BIOMASS: Still an important fuel for the poorStill an important fuel for the poor
• Biomass use declined during 20th century
• Still primary fuel for 60 to 90% people in developing countries: 3.5 billion people
• Use increasing with growing poverty
0
20
40
60
80
18
75
19
00
19
25
19
50
19
75
20
00
BIOMASS OIL/GAS
COAL
% energy from fuel
Biomass still very important
It is important to note also that the relatively high per capita energy consumption of wealthier countries, and their predominant use of modern (cleaner) fuels, hides the fact that very large numbers of poorer people still depend on biomass as their main household fuel. It is also widely used for small-scale commercial enterprises.
Numbers using biofuels
Estimates suggest that around two-thirds of households in the developing world still rely on biomass as their main fuel, amounting to 3.5 billion people. In sub-Saharan Africa, the percentage relying on biomass rises to at least 80% of the population (Source: World Resources: 1998/99 - A guide to the Global Environment. WRI 1998)
Future use
Biomass is expected to remain a very important fuel for many years. In areas of growing poverty, the use of biomass is increasing.
For more information on Indoor Air Pollution, including the evidence for health impact, we refer to the World Bank HNP Public Health website:
http://www-int.worldbank.org/intranet/jsp/sectors_view.jsp?tab=2&gwitem=473992

30
30
HEALTH EFFECTS OF INDOOR HEALTH EFFECTS OF INDOOR AIR POLLUTIONAIR POLLUTION
• Chronic obstructive lung disease (especially among women)
• ALRI • Cancer (lung - coal only);
oropharynx, larynx• Low birth weight • TB • Stoves - burns, etc.
Overview:
This slide gives an introductory overview of the evidence for health effects.
How much evidence?
Chronic obstructive ling disease (COLD) has been studied in a number of developing country settings, with good evidence especially in light of the historical data on air pollution and COLD, and also smoking. There are a number of studies reporting increased risk of lung cancer, but only for coal use (mainly China). LBW effect based on study from Guatemala (Boy E et al, submitted for publication), with findings line with evidence for ETS and LBW. For TB one large Indian study, based on analysis of self-reported information on TB. For eye disease, only anecdotal reports (possible cataract, a lot of irritation) - needs to be reviewed.

31
31
WHAT FACTORS INCREASE WHAT FACTORS INCREASE THE RISK OF PNEUMONIA?THE RISK OF PNEUMONIA?
• Poverty, poor housing• Overcrowding• Malnutrition, LBW• Lack of breast feeding• Micro nutrient
deficiencies• Air pollution: ETS,
ambient, indoor
What factors increasing risk of ALRI (Acute Lower Respiratory Illness)? There is a substantial body of published research, which has identified a wide range of risk factors for ALRI. Evidence for some is stronger than for others:
Well established: Malnutriton, Low birth weight, Lack of breast feeding, Overcrowding, poor socio-economic conditions.
Less well established:
•Micronutrients, Zinc
•Air pollution: Research has examined the risk associated with environmental tobacco smoke (ETS), ambient (outdoor, e.g. urban) air pollution, and indoor air pollution. Will return to the evidence from these sources later in the presentation. For the majority of developing country communities with highest rates of pneumonia, indoor air pollution is more important than outdoor (although in urban slums, these sources are both important). ETS varies: smoking rates are low in many rural areas of developing countries, especially among women, although there are exceptions such as Nepal.General point:
Many of these risk factors relate to the home environment of the child. Poverty, nutrition, crowding, household energy use, the outdoor environment, etc., are all linked. This will have implications for policy.
Question: What is the role of the health sector?
Behavioral change, advocacy, measuring health outcomes.

32
32
Key Family and Community Practices
• Reproductive health behaviors• Infant and child feeding practices• Immunization practices• Home health practices
– Prevention– Treatment
• Care seeking practices
A list of key household behaviors or practices for reducing child mortality has been identified. They can be grouped into reproductive health, infant and child feeding, immunization, homecare and care seeking practices.
Best practices and their key indicators, agreed on by partners and technical specialists, are listed in the child health section of the PRSP Sourcebook Technical Lifecycle annex. They are important because they are are key determinants or influencing factors for achieving improved HNP outcomes of the poor. Household and community factors are discussed in more in depth in another session in this PRSP series on The roles and constraints of Households and communities
Examples of best practices are:
Women should take iron supplementation during pregnancy and seek antenatal care at least twice.
Mothers should breastfeed their children for six months.
Infants should be taken for routine vaccination even if sick and pregnant women and other women of childbearing age should should seek tetanus toxoid vaccine at every opportunity.
All children should sleep under impregnated bednets, in malaria endemic areas.
Seek appropriate care when infant or child is recognized as being sick – danger signs need to be locally defined.
Family and community practices also critical for prevention and care of HIV/AIDS, malaria, TB and other communicable diseases as they depend on early recognition, preventive practices at household level, home care and factors to reduce stigma associated with illnesses.

33
33
Session Outline
1. Why is a lifecycle approach important?2. What is it and how can it be used?
– To assess risks and gaps – To identify key interventions – To identify and measure outcomes among the poor– To identify external influences– As an input to prioritization of interventions for the
poor3. What have we learned and summary of
applications4. How to look at the distributional dimension of
health outcomes and outputs?
Finally, a lifecycle approach can serve as an input to priority setting of interventions for the poor. Howeaver, identification of risks and corresponding interventions often result in many risks and a long list of prio rity interventions that will compete for limited resources.
Once problems have been identified and the interventions have been selected; it is often necessary to further “prioritize among the prioritie s” in the provision of services for the poor. This is a challenge, familiar to most who have been involved in the process of trying to identify and agree on a basic, essential or a minimum list of services or in the design of a benefits package for the poor.
We would like to propose an approach that goes beyond simple Burden of Disease (BOD) analysis and the use of DALYs – as shown in the next slide.

34
34
What information is available regarding:– affordability of intervention – for the poor?
– efficiency of implementation strategy – in reaching the poor?
– equity - potential for positive impact on the poor?
– cultural appropriateness ?
– feasibility of implementation in reaching the poor?
Using the Life Cycle (Inputs into Prioritization)
Type of Information
An approach to prioritize among priorities are to ask these ques tions, and, if available, use local data to answer these kinds of questions:
Is the intervention affordable for the poor? What are the financing mechanisms? Risk pooling? Subsidies?
Is the implementation or delivery strategy efficient? For example, is it efficient to try to reach the poor with a targeted intervention or to build capacity for disease specific interventions? Can integrated approaches help increase the efficiency (i.e. IMPAC, IMCI, Minimum Nutrition package FRESH, immunization plus…)?
Which interventions are likely to bridge the equity gap in service coverage and have the greatest impact on the poor?
Is the proposed intervention culturally appropriate – has the community been involved?
Is the delivery strategy feasible?
Other question:
Which criteria are the most important in selecting and prioritizing cost-effective interventions for the poor?
Affordability, efficiency, equity, cultural appropriateness and/or feasibility of implementation – all of the above? Other important criteria?
Using a lifecycle approach and conducting further analysis as proposed here, provides an alternative to a straight forward Burden of Disease analysis; these questions take other factors (I.e., feasibility of implementation and demand factors) into account in the prioritization process.
Prioritization is a difficult step – the process is as important as the results and should ideally involve all stakeholders: technical specialist, academia, program managers, consumers and both public and private providers. The lifecycle can be used to structure dialogue with stakeholders about important events and risks that influence health and the demand for services throughout the lifecycle, and help inform decision making.

35
35
Prioritizing reproductive health services at community level in The Philippines
• The scenario: – MCH funds primarily for child health with shortage
of services for women. MMR at 200 per 100,000 live births and TFR at 4.3.
– A safe motherhood project included a lifecycle pilot to cover the stages before and during pregnancy, at childbirth, postnatal stage and in the first five years.
– Outreach identified poor women at risk who enrolled in family planning program; and, registered pregnant women.
Using the Life Cycle (Inputs into Prioritization)
Lessons from East Asia
An example of how the lifecycle approach can be used to re-prioritize interventions are given by the Philippine Safe motherhood project. Although MMR remained high, the major emphasis and resources had been focused on child survival interventions. The project management decided to use a lifecycle approach – to systematically review risks to poor throughout the MCH cycle. This resulted in a shift and broadening of focus to the stages before pregnancy, during pregnancy and child birth, to after child birth –including poor women in reproductive age, pregnant women and the ir children during the first five years of life. They piloted efforts to reach out to poor women at risk and to enroll them in family planning and to register the pregnant women.

36
36
• Rationale for lifecycle approach:
– Improve efficiency - focus services on women at risk
– Enhance equity– Improve quality of client/provider
relationship– Foster sustainability
Using the Life Cycle (Inputs into Prioritization)
Lessons from East Asia
The project rational for a lifecycle approach were to improve efficiency (target risks), enhance equity (reaching the poor), improve quality and foster sustainability.

37
37
The policy implications:– Reordering of priorities; Managing risks
reduced scope & work load on public health system
– Reorientation of policy makers, health providers & community
– Retraining of health providers– Community participation essential– New information and reporting system– Infrastructure and resources for effective
referral system
Using the Life Cycle (Inputs into Prioritization)
Lessons from East Asia
The policy implications were reordering of priorities, reorientation, retraining, community participation, effective referral (to deal with risks).
Instead of a narrow focus on children only, the project covered the periods from before pregnancy to childhood; and shifted resources to address the continuum of care from family planning to essential obstetric care, newborn and childhood interventions.

38
38
What have we learned ?
• of applying the lifecycle approach to addressing the outcomes of the poor?
– to assess risk in social protection– to increase impact through synergy in HNP &
education– to identify gaps in reproductive health services for
the poor– to identify gaps in achieving improved child health
outcomes– to improve nutrition outcomes throughout the
lifecycle
Finally, what have we learnt from the lifecycle applications in the Bank’s work?
That it can be used to: assess risks in social protection; for programming to aim at increased impact on HNP and education outcomes; to assess and plan interventions at community level that address risks and gaps of the poor; and, as a tool in sector work to identify options for improved healthand nutrition outcomes of the poor.
Questions:
Are there other lessons learned of lifecycle applications in poverty reduction?
In what contexts would the lifecycle approach be useful?
Do you think that a lifecycle approach would add value to the work you are doing?

39
39
Lifecycle summary of applications
• Assessment tool• to identify gaps, risks, interventions & outcomes
• Project planning tool• to facilitate prioritization & target the poor
• Advocacy, communications and ESW tool• to draw attention to multiple determinants of illhealth
• Intersectoral tool• to identify risks & actions beyond the health sector
To summarize the operational experiences of the lifecycle approach in the Bank, to date:
First, it has been used as an assessment tool, i.e., in Social protection projects in Latin America; and, in project supervision to re-examine priorities in MCH and basic services, i.e. in China Health VI and Health VIII.
Second, as a project programming tool, i.e., in HNP Safe motherhood project in The Philippines;
Third, as an advocacy and communication tool and in economic sector work (ESW) in India child mortality review and also in Brazil family health sector work.
As an advocacy instrument, it has helped catalyze intrasectoral collaboration –between health, nutrition and population– and linkages between HNP and education.
Fourth, to identify risks and action beyond the health sector. For example, it has helped stimulate intersectoral collaboration at global level to reduce risk factors such as Indoor Air Pollution, Water and Sanitation, and other environmental health problems – between the HNP public health thematic group and other departments in the Bank. And, most importantly resulted in intersectoral actions at country level, i.e. the Bank is planning an IAP project and hand washing projects which aims to improve health outcomes of the poor.
40
40
The HNP Lifecycle – more information?
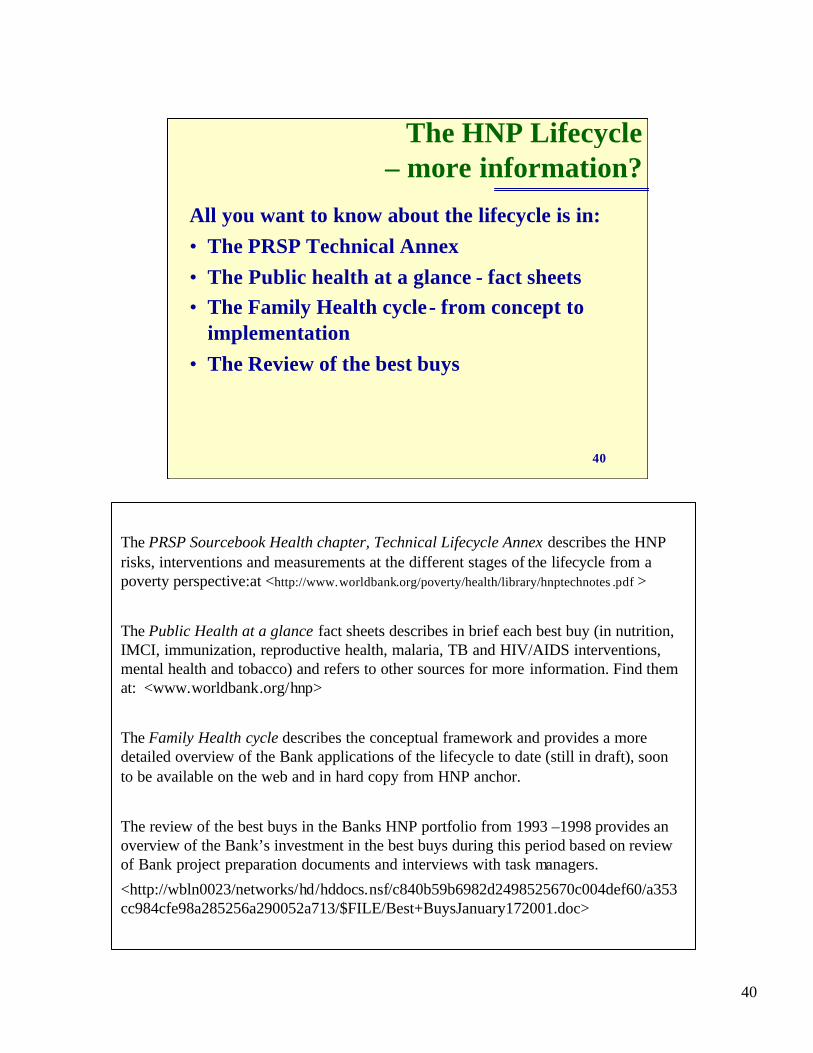
All you want to know about the lifecycle is in:• The PRSP Technical Annex • The Public health at a glance - fact sheets• The Family Health cycle- from concept to
implementation• The Review of the best buys
The PRSP Sourcebook Health chapter, Technical Lifecycle Annex describes the HNP risks, interventions and measurements at the different stages of the lifecycle from a poverty perspective:at <http://www.worldbank.org/poverty/health/library/hnptechnotes .pdf >
The Public Health at a glance fact sheets describes in brief each best buy (in nutrition, IMCI, immunization, reproductive health, malaria, TB and HIV/AIDS interventions, mental health and tobacco) and refers to other sources for more information. Find them at: <www.worldbank.org/hnp>
The Family Health cycle describes the conceptual framework and provides a more detailed overview of the Bank applications of the lifecycle to date (still in draft), soon to be available on the web and in hard copy from HNP anchor.
The review of the best buys in the Banks HNP portfolio from 1993 –1998 provides an overview of the Bank’s investment in the best buys during this period based on review of Bank project preparation documents and interviews with task managers.
<http://wbln0023/networks/hd/hddocs.nsf/c840b59b6982d2498525670c004def60/a353cc984cfe98a285256a290052a713/$FILE/Best+BuysJanuary172001.doc>

41
41
Session Outline
1. Why is a lifecycle approach important?2. What is it and how can it be used?
– To assess risks and gaps – To identify key interventions – To identify and measure outcomes among the poor– To identify external influences– As an input to prioritization of interventions for the
poor 3. What have we learned and summary of
applications4. How to look at the distributional dimension of
health outcomes and outputs?
The last segment of this session focuses on poor-rich differences in HNP outcomes.

42
42
Poor-Rich Differences
Using Household Data
Household level data can be used to estimate:
• The Stages of the Life Cycle Most Responsible for the Poor-Rich Health Gap
• Other Poor-Rich HNP Differences: Infant and Child Mortality, Nutritional Status, Fertility, Immunization, Use of Public and Private Facilities, Contraceptive Prevalence, and More
Self Explanatory slide.

43
43
Poor-Rich Differences
What is Needed
1. Household data set that has critical information on wealth and HNP and is representative and relatively large
2. A Statistician/Demographer/Economist familiar with the use of a statistical package, like SPSS or STATA, and Model Life Tables
WHAT YOU NEED:
1. A Household data set that
--has information about:
a) The Households’ Socio-Economic Status (Assets, Expenditures, or Income
b) HNP Indicators of Interest: e.g. Births and Deaths (Necessary for Life Cycle Estimates), Nutritional Status, Immunization, Use of Public/Private Health Facilities, Contraceptive Use, etc.
--is Large Enough to Permit Examination of 4-5 Population Subgroups (Probably about 5-10,000 households, for the purpose of the estimates of interest here.)
2. A Statistician/Demographer Familiar with the Use of:
--A Statistical package like SPSS or STATA (Especially the Principal Components Analysis Unit if Working with Household Assets)
-- Model Life Tables (Necessary for Life Cycle Estimates, But Not for Others)

44
44
Poor-Rich Differences
Three Illustrations from India
• The Contribution of Poor-Rich Mortality Differences at Each Stage of the Life Cycle to the Total Poor-Rich Health Gap• Poor-Rich Differences in HNP Status Indicators Like: Infant Mortality, Stunting, Total Fertility• Poor-Rich Differences in Use of HNP Services Like Immunization, Delivery Attendance, and Modern Contraception
WHAT YOU CAN GET:
In the next three slides you will see three illustrations using Demographic and Health Survey (DHS) data from India.

45
45
0-5(55%)
5-14(7%)
15-29(5%)
30-44(6%)
45-59(9%)
70+(8%)60-69
(10%)
0-5
5-14
15-29
30-44
45-59
60-69
70+
Provisional Figures
Poor-Rich Differences
First India Illustration

46
46
0
20
40
60
80
100
120
Poorest20%
Next Middle20%
Next Richest20%
HNP Status Differences
IMRStunting Rate
Poor-Rich Differences
Second India Illustration
POPULATION GROUP
Infant Mortality Rate
Stunting Rate
Total Fertility
RatePoorest 20% 109.2 55.6 4.1Next Poorest 20%
106.3 54 3.6
Middle 20% 89.7 48.6 3.2
Next Richest 20%
65.6 43.3 2.8
Richest 20% 44 30.9 2.1INEQUALITY MEASUREPoor-Rich Ratio 2.48 1.8 1.95Concentration Index
-0.149 -0.092 -0.125
HNP STATUS INDICATOR

47
47
0
20
40
60
80
Poorest20%
Next Middle20%
Next Richest20%
HNP Service Use
Immunization Rate Attended Deliveries Contraceptive Use
Poor-Rich Differences
Third India Illustration
POPULATION GROUP
Full Immunization
Rate
Percentage of Deliveries
Attended by a Medically Trained
Person
Percentage of Married Women Using Modern Contraception
Poorest 20% 17.1 11.9 24.9Next Poorest 20%
21.7 18.2 27.5
Middle 20% 34.7 30.1 36.1
Next Richest 20%
48.2 47.9 42
Richest 20% 65 78.7 50.6INEQUALITY MEASURERich-Poor Ratio 3.8 6.61 2.03Concentration Index
0.262 0.351 0.145
HNP SERVICE USE INDICATOR

48
48
• Technical Annexes to Any of the Country Studies at: www.worldbank.org/poverty/health/data/index.htm
• Davidson R. Gwatkin and Nathan R. Jones, “The Age of Death among the Global Poor”
Poor-Rich Differences
Additional Information
WHERE YOU CAN GET FURTHER INFORMATION ABOUT METHODS:
• For Estimating the Stages of the Life Cycle Most Responsible for the Poor-Rich Health Gap:
-- Davidson R. Gwatkin and Nathan R. Jones, “The Age of Death among the Global Poor” (Forthcoming). In the meantime, ask Dave Gwatkin, who can arrange for a consultant to a) provide an estimate for any of the 44 countries covered by the project described below; or b) introduce a demographer working on data from another country to the simple methodology involved.)
• For Estimating Other Poor-Rich HNP Differences:
-- From the Technical Annexes to Any of the Country Studies at: www.worldbank.org/poverty/health/data/index.htm.


![Christ University Faculty of Engineering Mechanical · PDF file · 2016-08-23and Ranking by COMEDK. OR 2) ... [Cumulative GPA] is calculated by adding the total number of earned](https://img.pdfslide.us/doc/110x75/5aad41aa7f8b9a9c2e8dfcac/christ-university-faculty-of-engineering-mechanical-ranking-by-comedk-or-2.jpg)


