Embed Size (px)
Citation preview

Session 1Session 1
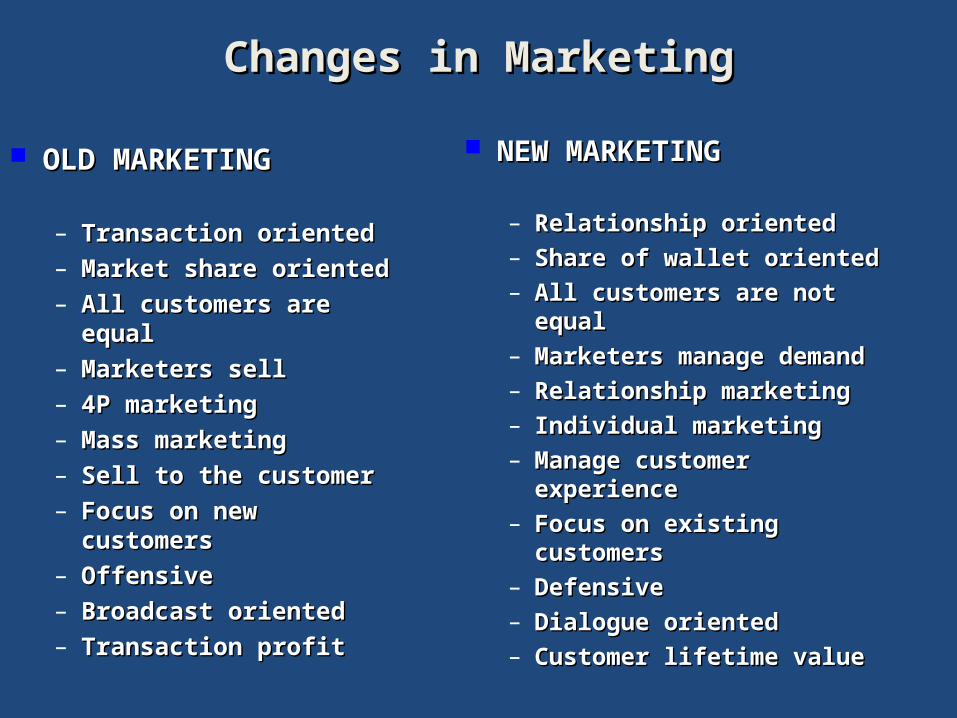
Changes in MarketingChanges in Marketing
OLD MARKETINGOLD MARKETING
– Transaction orientedTransaction oriented– Market share orientedMarket share oriented– All customers are equalAll customers are equal– Marketers sellMarketers sell– 4P marketing4P marketing– Mass marketingMass marketing– Sell to the customerSell to the customer– Focus on new Focus on new
customerscustomers– OffensiveOffensive– Broadcast orientedBroadcast oriented– Transaction profitTransaction profit
NEW MARKETINGNEW MARKETING
– Relationship orientedRelationship oriented– Share of wallet orientedShare of wallet oriented– All customers are not equalAll customers are not equal– Marketers manage demandMarketers manage demand– Relationship marketingRelationship marketing– Individual marketingIndividual marketing– Manage customer Manage customer
experienceexperience– Focus on existing Focus on existing
customerscustomers– DefensiveDefensive– Dialogue orientedDialogue oriented– Customer lifetime valueCustomer lifetime value
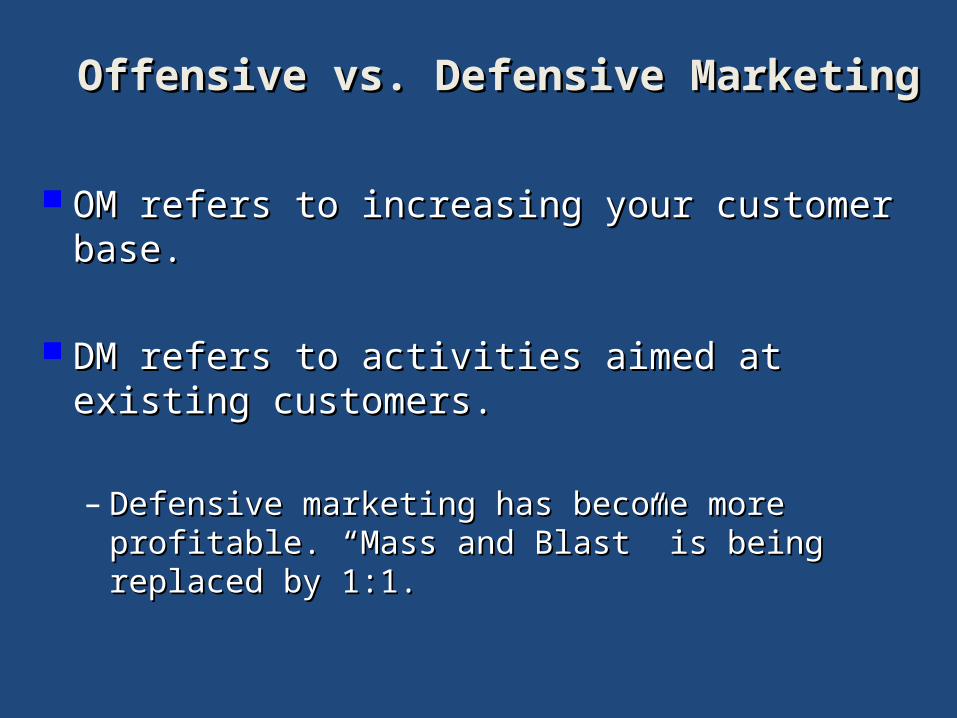
Offensive vs. Defensive MarketingOffensive vs. Defensive Marketing
OM refers to increasing your customer base.OM refers to increasing your customer base.
DM refers to activities aimed at existing DM refers to activities aimed at existing customers.customers.
– Defensive marketing has become more Defensive marketing has become more profitable. “Mass and Blast” is being replaced by profitable. “Mass and Blast” is being replaced by 1:1. 1:1.
Customer ?Customer ?
Human beingHuman being
Person-who has acquired or thinking of Person-who has acquired or thinking of acquiring our product or serviceacquiring our product or service
CRM Case of a Bank Manager.doc
Importance of Customer FocusImportance of Customer Focus
Let us hear Mr. Jayant KocharLet us hear Mr. Jayant Kochar
..\Importance of customer focus\start.exe
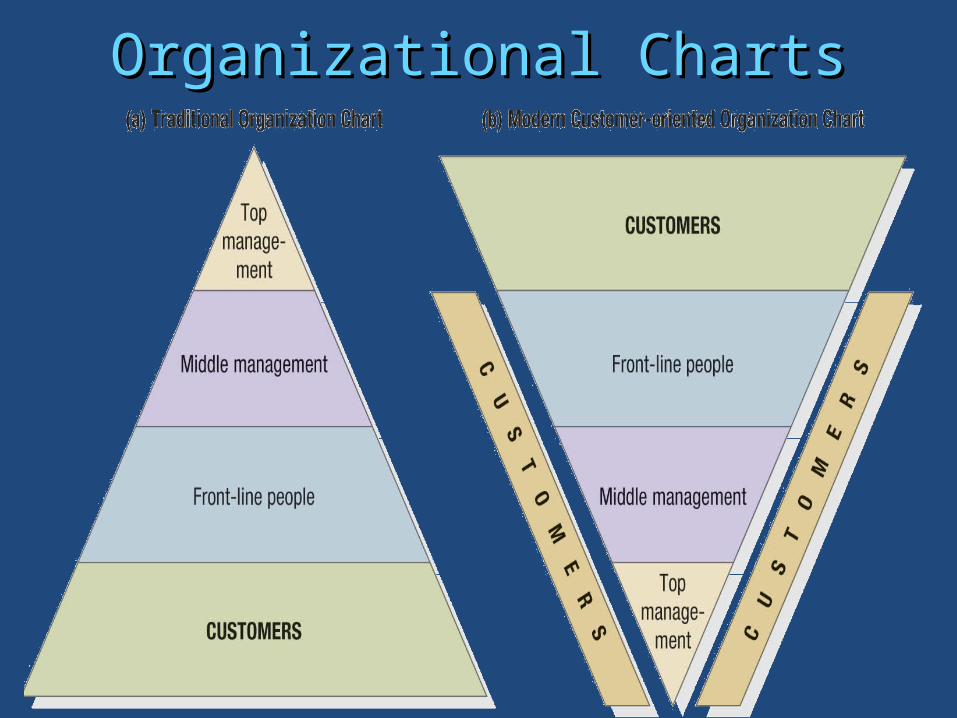
Organizational ChartsOrganizational Charts
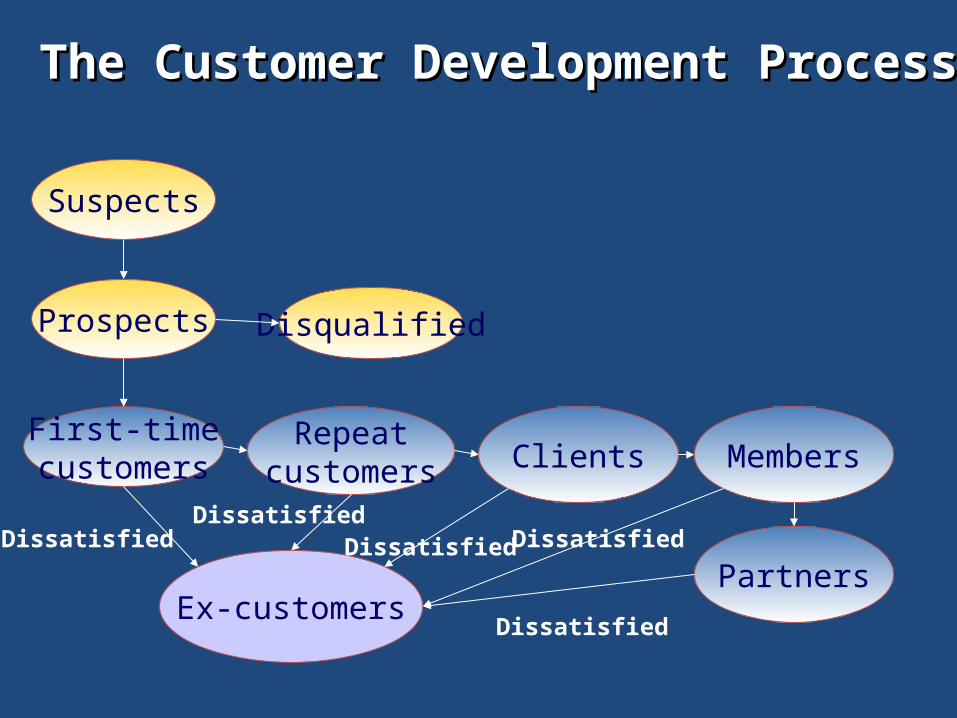
The Customer Development ProcessThe Customer Development Process
Prospects
Suspects
Disqualified
First-timecustomers
Repeatcustomers Clients Members
PartnersEx-customers
Dissatisfied
Dissatisfied Dissatisfied
Dissatisfied Dissatisfied
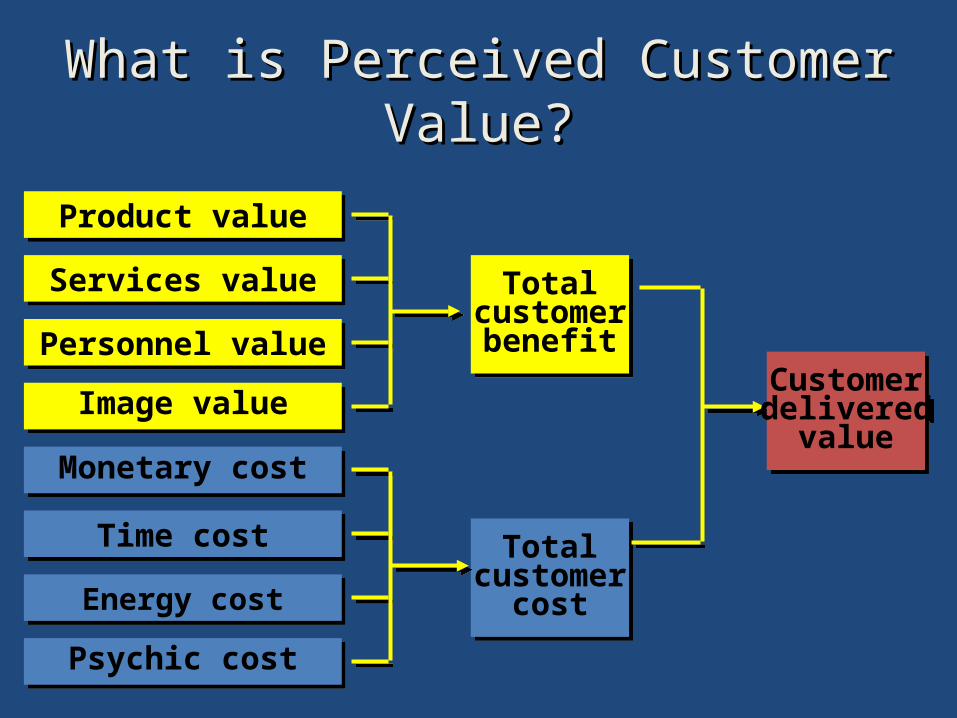
What is Perceived Customer What is Perceived Customer Value?Value?
Product valueProduct value
Services valueServices value
Personnel valuePersonnel value
Image valueImage value
Totalcustomer
benefit
Totalcustomer
benefit
Monetary costMonetary cost
Time costTime cost
Energy costEnergy cost
Psychic costPsychic cost
Totalcustomer
cost
Totalcustomer
cost
Customerdelivered
value
Customerdelivered
value
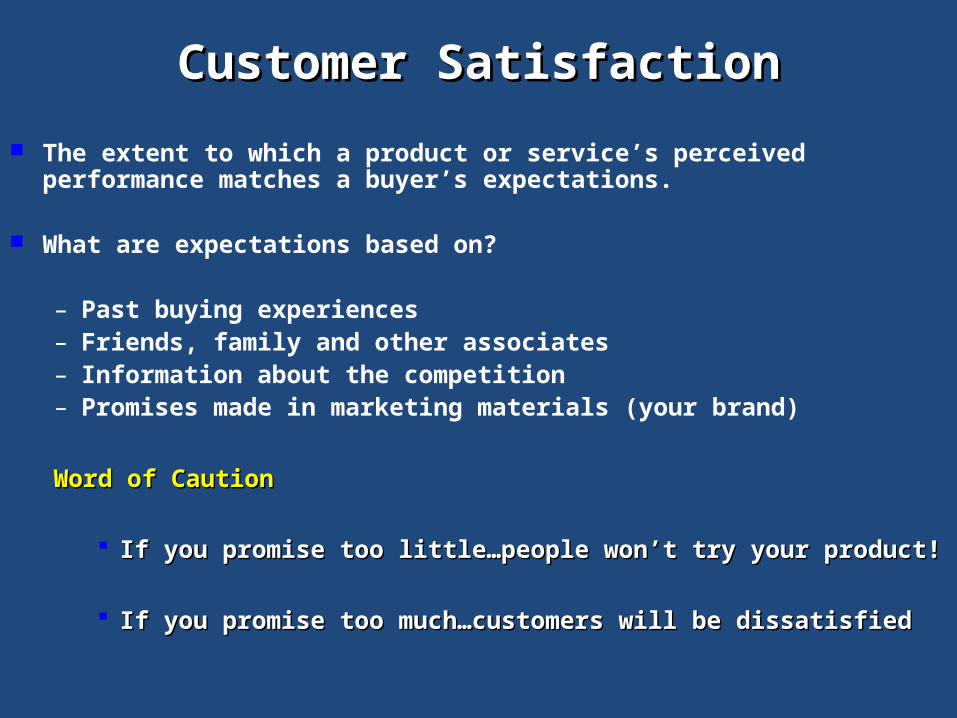
Customer SatisfactionCustomer Satisfaction
The extent to which a product or service’s perceived performance matches a buyer’s expectations.
What are expectations based on?
– Past buying experiences– Friends, family and other associates– Information about the competition– Promises made in marketing materials (your brand)
Word of Caution Word of Caution
If you promise too little…people won’t try your product!If you promise too little…people won’t try your product!
If you promise too much…customers will be dissatisfiedIf you promise too much…customers will be dissatisfied
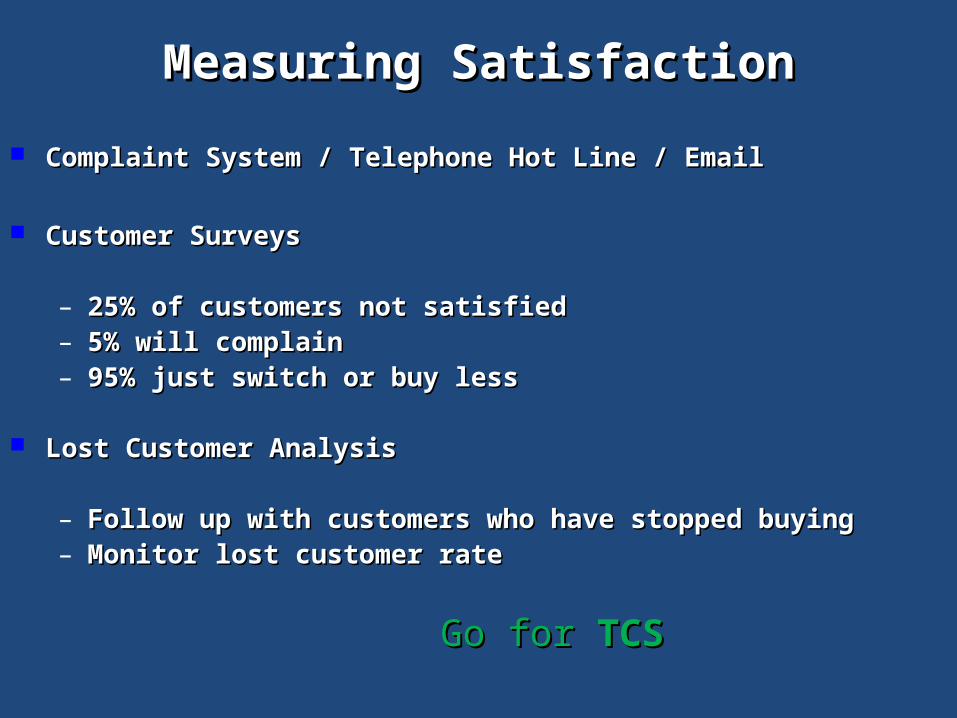
Measuring SatisfactionMeasuring Satisfaction
Complaint System / Telephone Hot Line / EmailComplaint System / Telephone Hot Line / Email
Customer SurveysCustomer Surveys
– 25% of customers not satisfied25% of customers not satisfied– 5% will complain5% will complain– 95% just switch or buy less95% just switch or buy less
Lost Customer AnalysisLost Customer Analysis
– Follow up with customers who have stopped buyingFollow up with customers who have stopped buying– Monitor lost customer rateMonitor lost customer rate
Go for Go for TCSTCS
Techniques for Exceeding Techniques for Exceeding Customers’ ExpectationsCustomers’ Expectations
Live up to their expectations.Live up to their expectations.
Become familiar with your customers.Become familiar with your customers.
Ask your customers what their expectations are.Ask your customers what their expectations are.
Tell your customers what they can expect.Tell your customers what they can expect.
Maintain consistency.Maintain consistency.
Ask “ Why are they using your product”Ask “ Why are they using your product”
Delivering customer value & satisfaction
Not just the people in charge of marketing are in charge of marketing.
Must have an effective value chain focused on serving the customer.
Employees need to be trained and understand what expectations are for customer service – and
Need to be empowered to address certain situations.
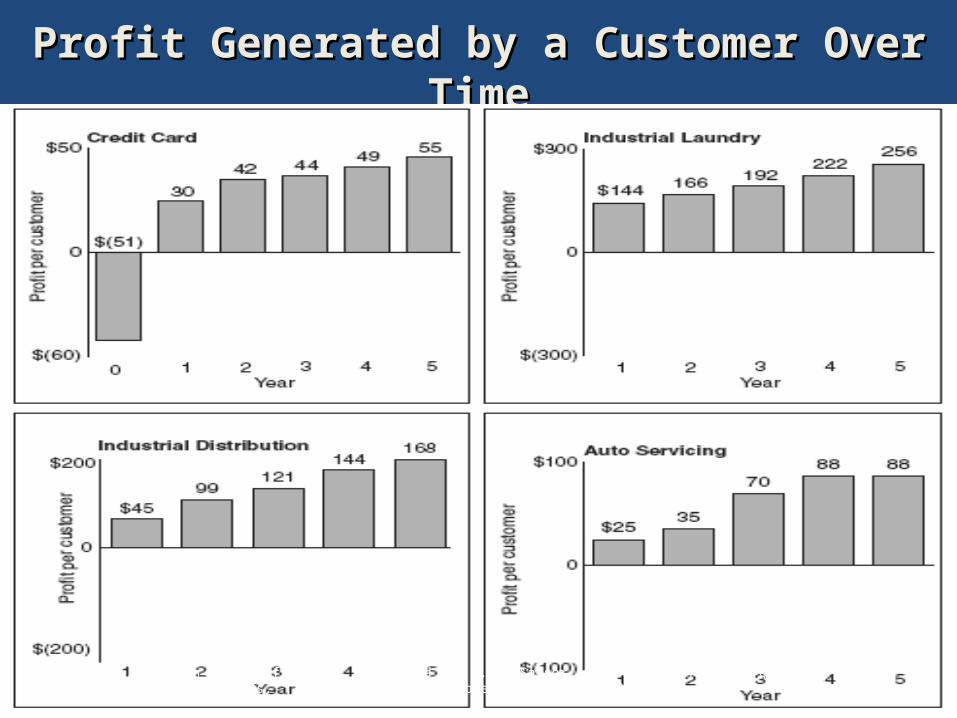
Profit Generated by a Customer Over Profit Generated by a Customer Over TimeTime
Source: An exhibit from F. F. Reichheld and W. E. Sasser, Jr., “Zero Defection: Quality Comes to Services,’’ Harvard Business Review, September–October 1990.
Customer Satisfaction
Highly satisfied customers are:
– Less price sensitive– More likely to talk favorably about you – More likely to refer you to others– Remain loyal for longer
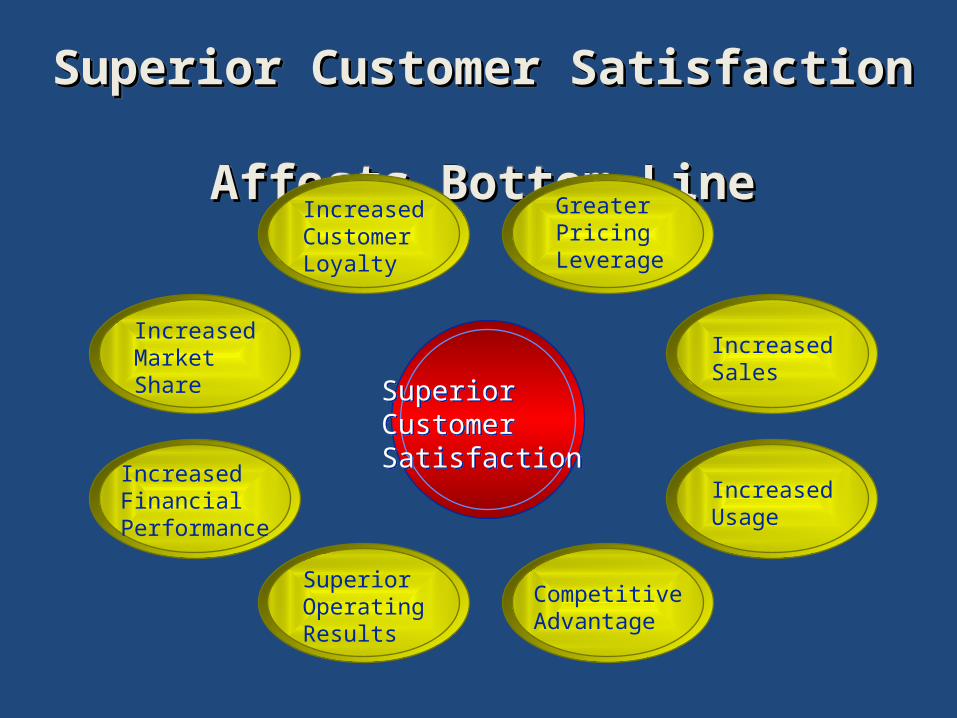
Superior Customer Satisfaction Superior Customer Satisfaction Affects Bottom LineAffects Bottom Line
Superior Customer Satisfaction Superior Customer Satisfaction Affects Bottom LineAffects Bottom Line
IncreasedSales
IncreasedUsage
GreaterPricingLeverage
CompetitiveAdvantage
IncreasedCustomerLoyalty
IncreasedMarketShare
IncreasedFinancialPerformance
SuperiorOperatingResults
SuperiorCustomerSatisfaction
SuperiorCustomerSatisfaction
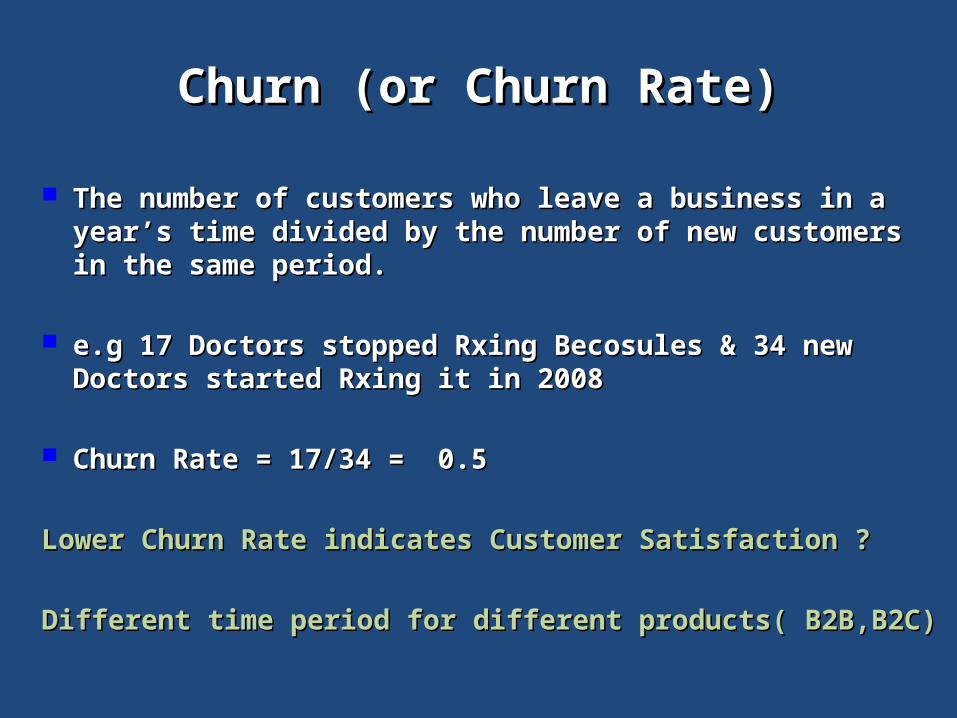
Churn (or Churn Rate)Churn (or Churn Rate)
The number of customers who leave a business in a The number of customers who leave a business in a year’s time divided by the number of new year’s time divided by the number of new customers in the same period.customers in the same period.
e.g 17 Doctors stopped Rxing Becosules & 34 new e.g 17 Doctors stopped Rxing Becosules & 34 new Doctors started Rxing it in 2008Doctors started Rxing it in 2008
Churn Rate = 17/34 = 0.5Churn Rate = 17/34 = 0.5
Lower Churn Rate indicates Customer Satisfaction ? Lower Churn Rate indicates Customer Satisfaction ?
Different time period for different products( B2B,B2C)Different time period for different products( B2B,B2C)
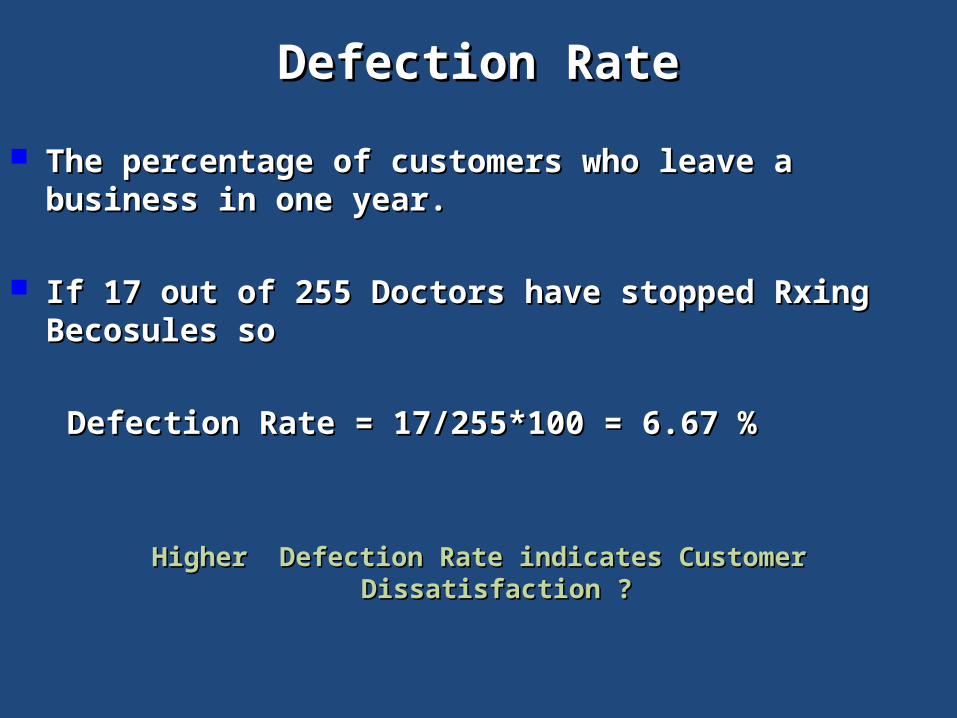
Defection RateDefection Rate
The percentage of customers who leave a The percentage of customers who leave a business in one year.business in one year.
If 17 out of 255 Doctors have stopped Rxing If 17 out of 255 Doctors have stopped Rxing Becosules soBecosules so
Defection Rate = 17/255*100 = 6.67 %Defection Rate = 17/255*100 = 6.67 %
Higher Defection Rate indicates Customer Dissatisfaction ?Higher Defection Rate indicates Customer Dissatisfaction ?
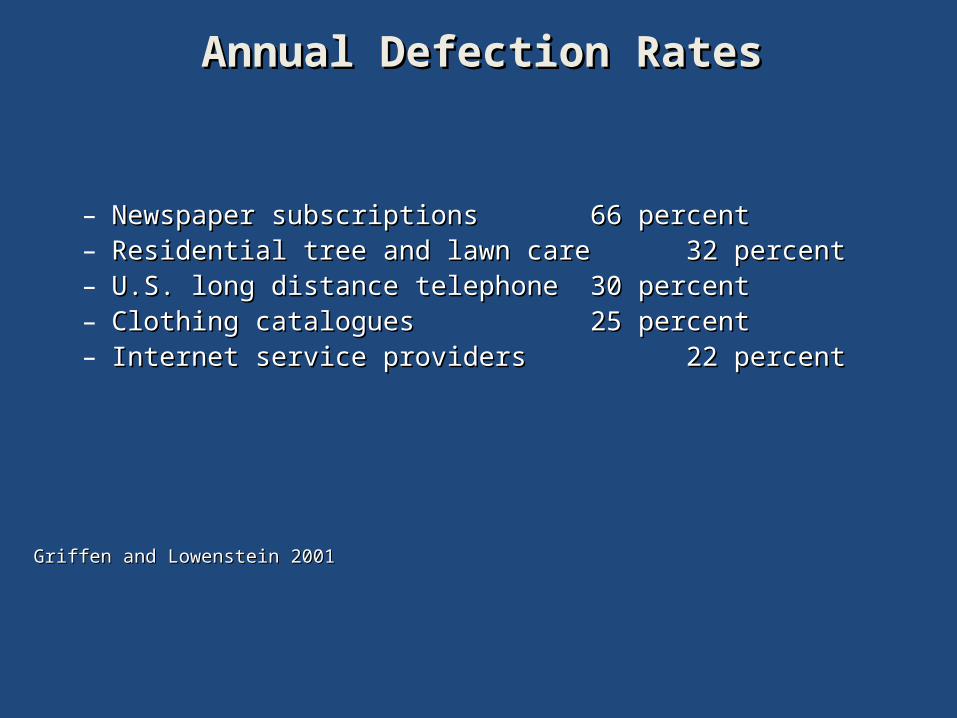
Annual Defection Rates Annual Defection Rates
– Newspaper subscriptionsNewspaper subscriptions 66 percent66 percent– Residential tree and lawn care Residential tree and lawn care 32 percent32 percent– U.S. long distance telephoneU.S. long distance telephone 30 percent30 percent– Clothing cataloguesClothing catalogues 25 percent25 percent– Internet service providersInternet service providers 22 percent22 percent
Griffen and Lowenstein 2001Griffen and Lowenstein 2001
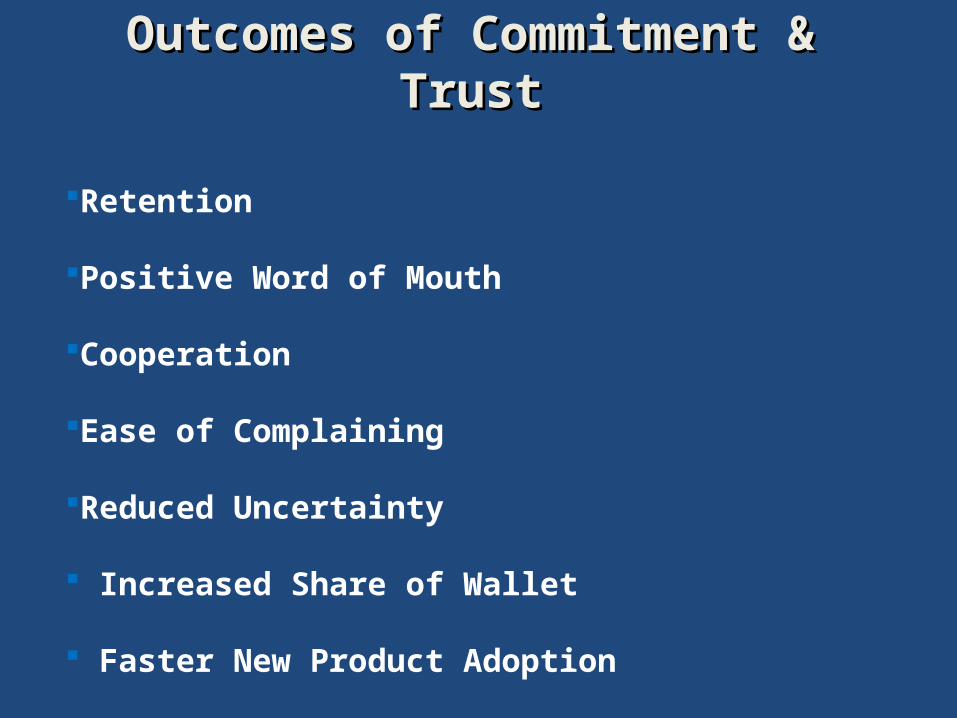
Outcomes of Commitment & Outcomes of Commitment & TrustTrust
Retention
Positive Word of Mouth
Cooperation
Ease of Complaining
Reduced Uncertainty
Increased Share of Wallet
Faster New Product Adoption
How do we generate Commitment How do we generate Commitment & Trust?& Trust?
Economic ContentEconomic Content
Resource ContentResource Content
Social ContentSocial Content
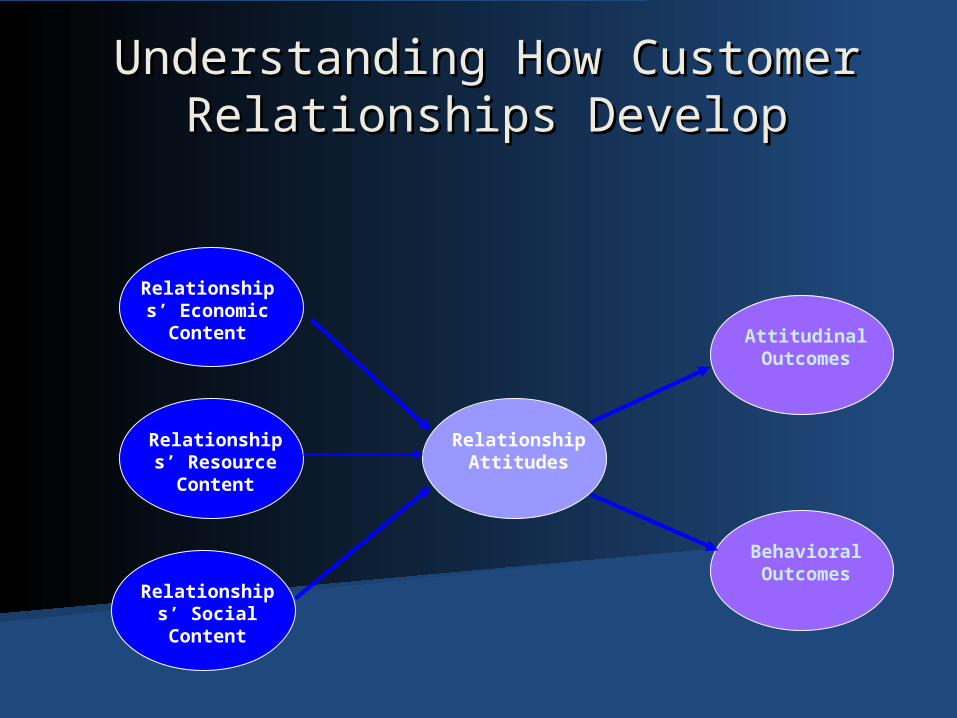
Understanding How Customer Understanding How Customer Relationships DevelopRelationships Develop
RelationshipAttitudes
Relationships’ Economic
Content
Relationships’ SocialContent
Relationships’ Resource
Content
AttitudinalOutcomes
BehavioralOutcomes
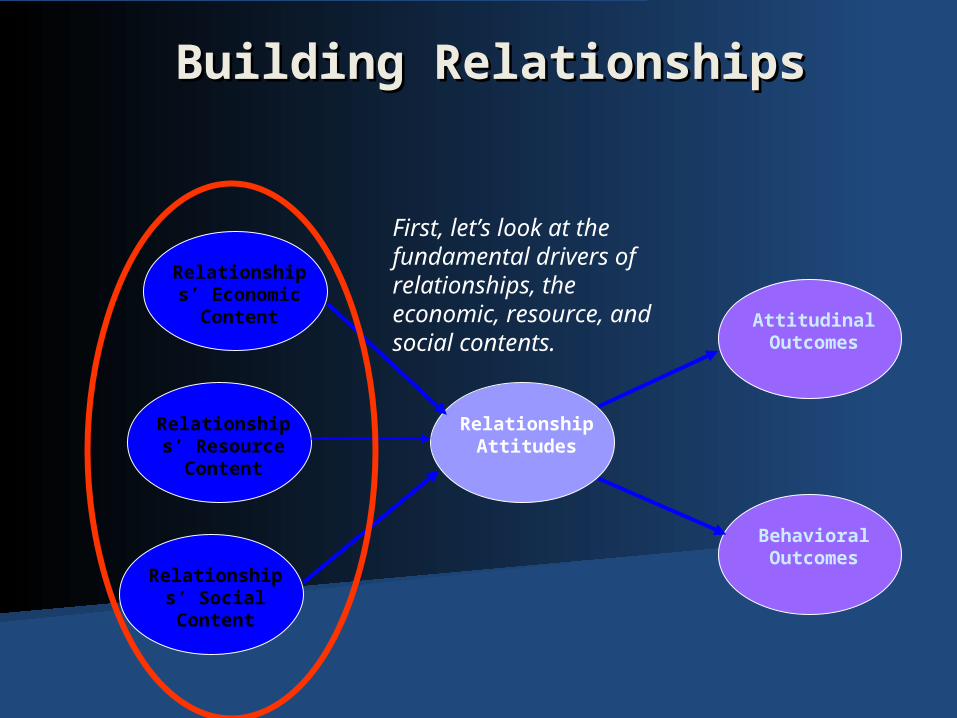
Building RelationshipsBuilding Relationships
RelationshipAttitudes
Relationships’ Economic
Content
Relationships’ SocialContent
Relationships’ Resource
Content
AttitudinalOutcomes
BehavioralOutcomes
First, let’s look at the fundamental drivers of relationships, the economic, resource, and social contents.
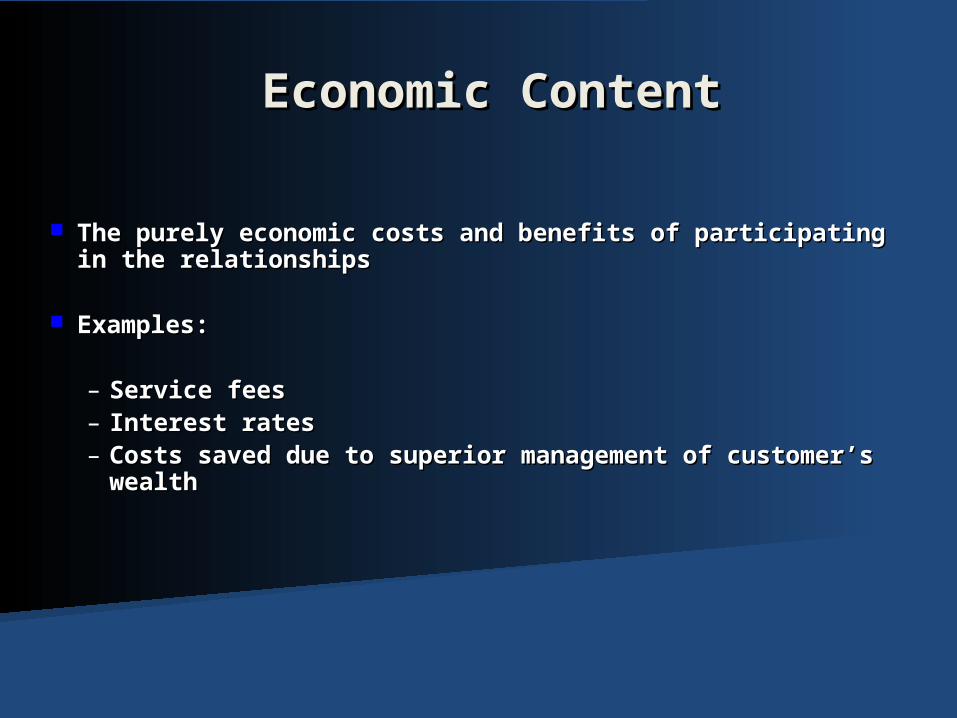
Economic ContentEconomic Content
The purely economic costs and benefits of participating The purely economic costs and benefits of participating in the relationshipsin the relationships
Examples:Examples:
– Service feesService fees– Interest ratesInterest rates– Costs saved due to superior management of Costs saved due to superior management of
customer’s wealthcustomer’s wealth
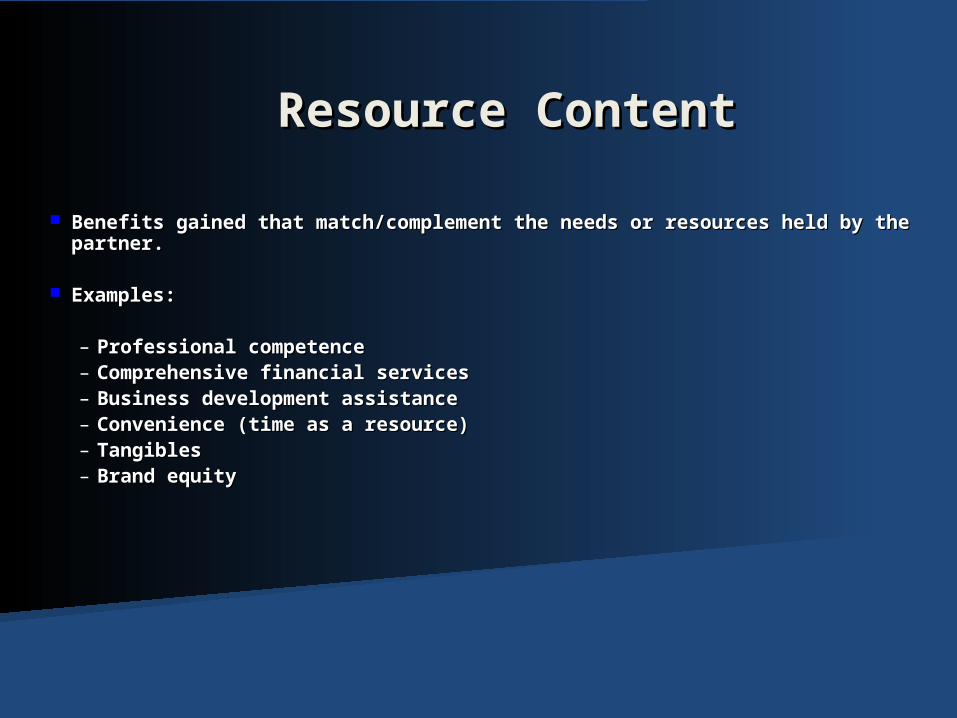
Resource ContentResource Content
Benefits gained that match/complement the needs or resources held by Benefits gained that match/complement the needs or resources held by the partner.the partner.
Examples:Examples:
– Professional competenceProfessional competence– Comprehensive financial servicesComprehensive financial services– Business development assistanceBusiness development assistance– Convenience (time as a resource)Convenience (time as a resource)– TangiblesTangibles– Brand equityBrand equity
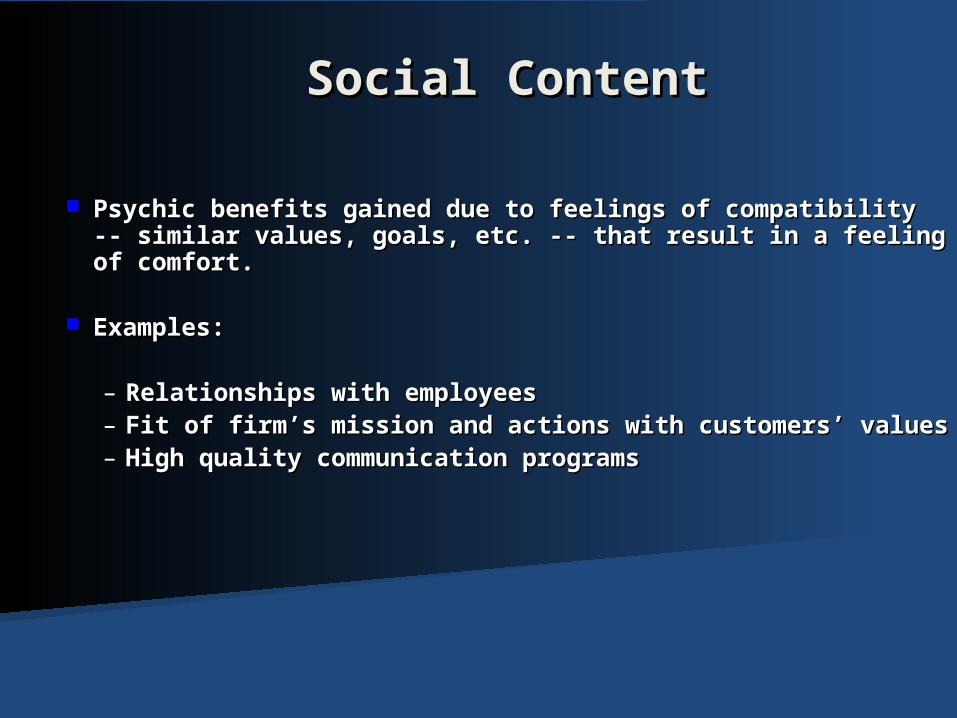
Social ContentSocial Content
Psychic benefits gained due to feelings of compatibility -- Psychic benefits gained due to feelings of compatibility -- similar values, goals, etc. -- that result in a feeling of similar values, goals, etc. -- that result in a feeling of comfort.comfort.
Examples:Examples:
– Relationships with employeesRelationships with employees– Fit of firm’s mission and actions with customers’ valuesFit of firm’s mission and actions with customers’ values– High quality communication programsHigh quality communication programs
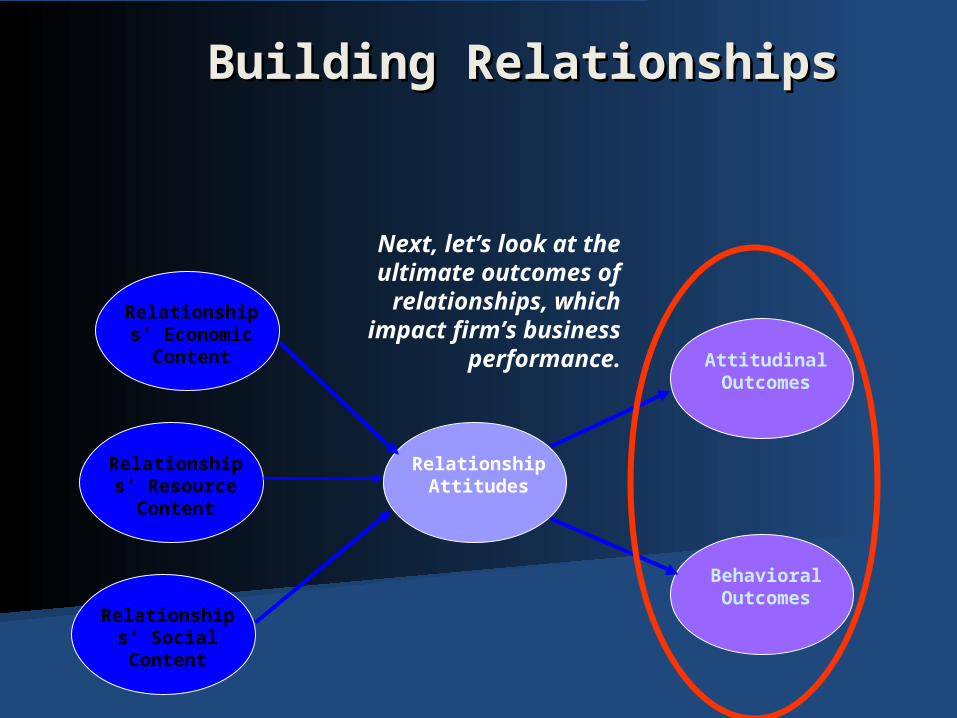
Building RelationshipsBuilding Relationships
RelationshipAttitudes
Relationships’ Economic
Content
Relationships’ SocialContent
Relationships’ Resource
Content
AttitudinalOutcomes
BehavioralOutcomes
Next, let’s look at the ultimate outcomes of relationships, which
impact firm’s business
performance.
Attitudinal OutcomesAttitudinal Outcomes
Customer beliefs that result from relationship Customer beliefs that result from relationship dynamics, these attitudes can go on to impact dynamics, these attitudes can go on to impact behaviors and the development of even behaviors and the development of even stronger attitudes.stronger attitudes.
Examples:Examples:
Reduced uncertaintyReduced uncertaintyBrand equityBrand equity
CooperationCooperation
Behavioral OutcomesBehavioral Outcomes
Partner behaviors and intended behaviors that directly or indirectly impact Partner behaviors and intended behaviors that directly or indirectly impact the firm’s performance.the firm’s performance.
Examples:Examples:– RetentionRetention– Positive word of mouthPositive word of mouth– ComplainingComplaining– Faster New Product AdoptionFaster New Product Adoption– Increased Share of WalletIncreased Share of Wallet
Consumer Buying BehaviorConsumer Buying Behavior
Video: Marketing Psychology & Consumer Buying BehaviorVideo: Marketing Psychology & Consumer Buying Behavior
ExerciseExercise
Think of a service provider/product to Think of a service provider/product to whom you are loyal.whom you are loyal.
What do you do (your behaviors, actions, What do you do (your behaviors, actions, feelings) that indicates you are loyal?feelings) that indicates you are loyal?
Why are you loyal to this provider?Why are you loyal to this provider?
What factors have influenced the formation What factors have influenced the formation of your loyalty?of your loyalty?
Loyalty
Loyality is an emotion
Helps in maintaining a close relationship
A series of positive experiences
Leads to commitment & trust
Leads to Customer Alchemy
A Loyal Customer is one who…A Loyal Customer is one who…
Show Behavioral CommitmentShow Behavioral Commitment– Buys from one supplier (sole loyalty)Buys from one supplier (sole loyalty)– Buys a large proportion, increasingly Buys a large proportion, increasingly
buys morebuys more– Provides constructive Provides constructive
feedback/suggestionsfeedback/suggestions
Exhibits Psychological CommitmentExhibits Psychological Commitment– Commitment-doesn’t consider Commitment-doesn’t consider
terminating the relationshipterminating the relationship– Has a positive attitude towardHas a positive attitude toward– Say good things aboutSay good things about
3333
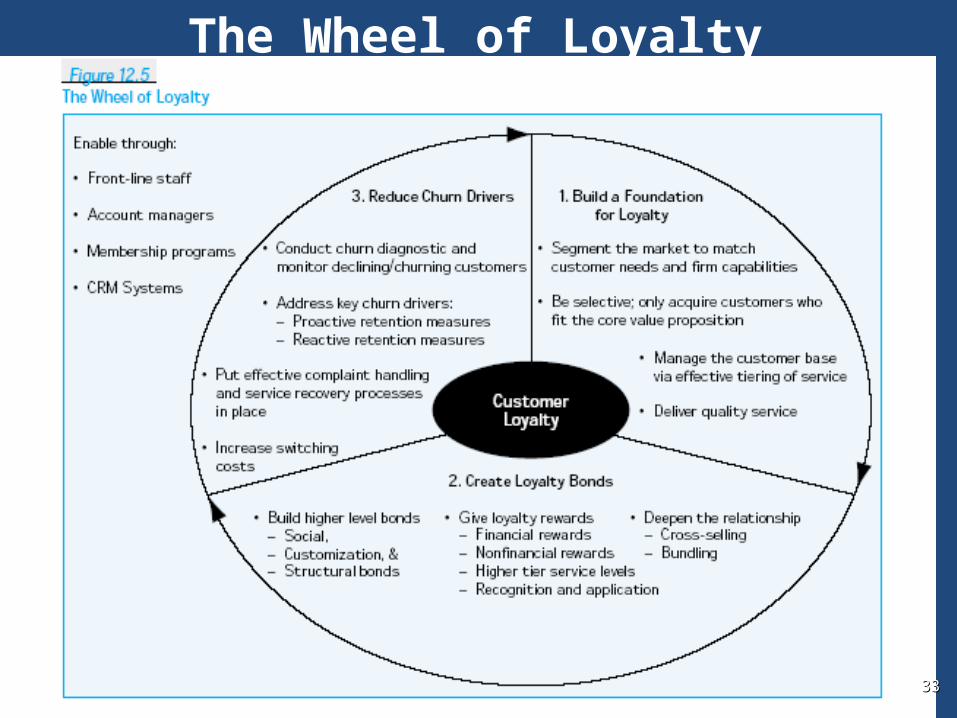
The Wheel of Loyalty
3434
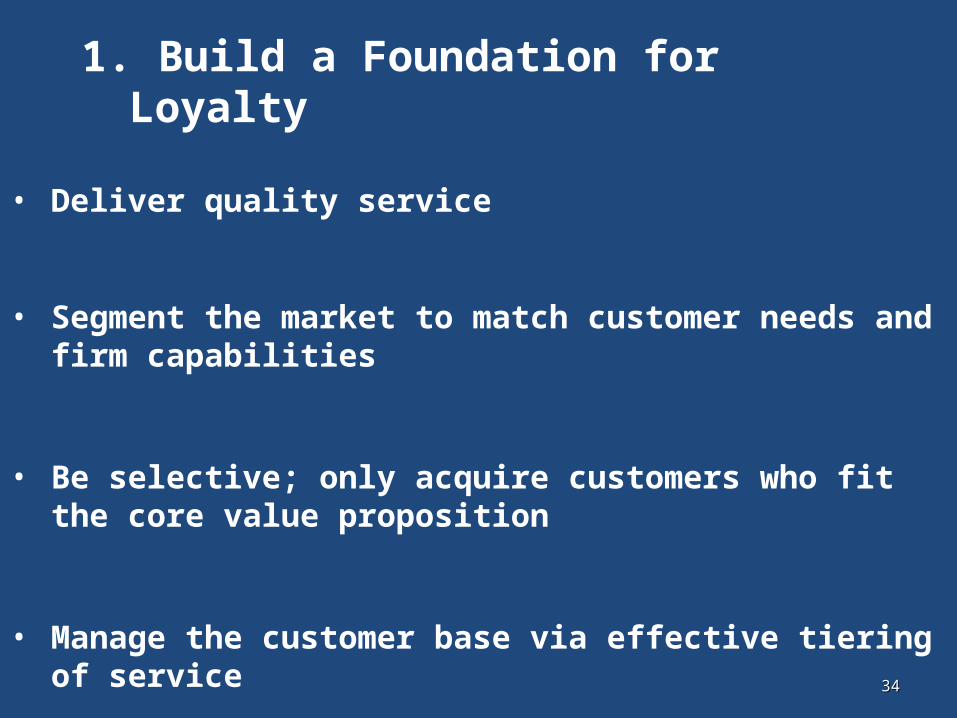
• Deliver quality service
• Segment the market to match customer needs and firm capabilities
• Be selective; only acquire customers who fit the core value proposition
• Manage the customer base via effective tiering of service
1. Build a Foundation for Loyalty
3535
Deepen the relationship
Cross-selling/Bundling
Build higher level bonds
Social
Customization
Structural bonds
2. Create Loyalty Bonds
Social BondsSocial Bonds
Personal RelationshipsPersonal Relationships
Memberships/ Formal & InformalMemberships/ Formal & Informal
Affinity ProgramsAffinity Programs
CustomizationCustomization
Mass Customization – Mass Customization – Dell computerDell computer
Customer Intimacy- Customer Intimacy- Infosys, AccentureInfosys, Accenture
Anticipation/ innovation – Anticipation/ innovation – AppleApple
Nectar – Stretch DiscountsNectar – Stretch Discounts
Structural BondsStructural Bonds
Integrated information systems
Joint investments
Shared processes and equipment
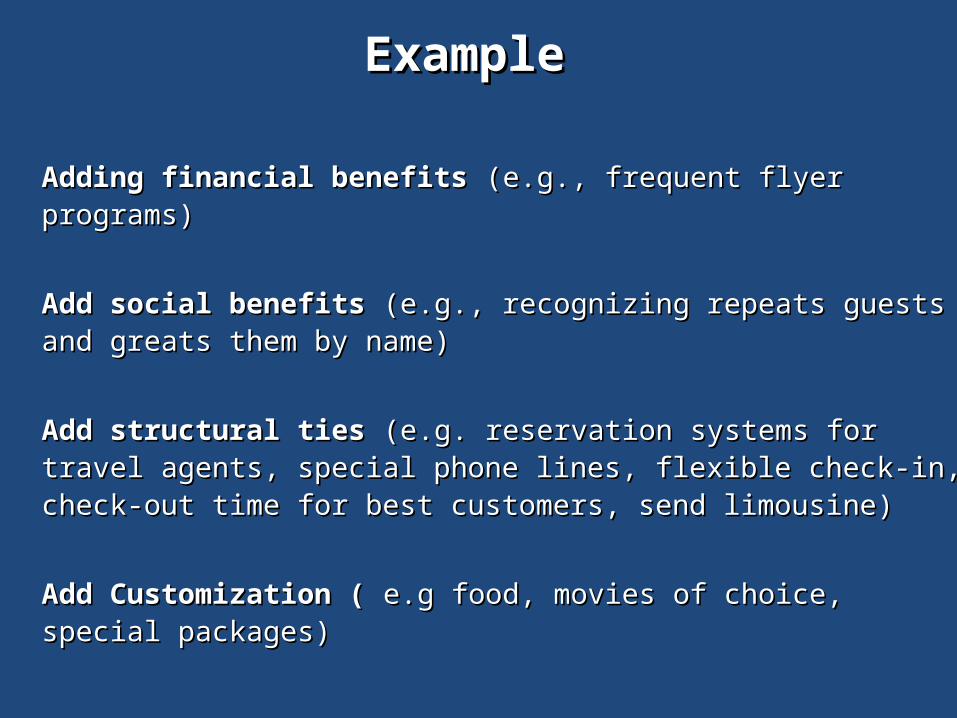
Adding financial benefits Adding financial benefits (e.g., frequent flyer programs)(e.g., frequent flyer programs)
Add social benefitsAdd social benefits (e.g., recognizing repeats guests and (e.g., recognizing repeats guests and greats them by name)greats them by name)
Add structural tiesAdd structural ties (e.g. reservation systems for travel (e.g. reservation systems for travel agents, special phone lines, flexible check-in, check-out agents, special phone lines, flexible check-in, check-out time for best customers, send limousine)time for best customers, send limousine)
Add Customization ( Add Customization ( e.g food, movies of choice, special e.g food, movies of choice, special packages)packages)
Example Example
4040
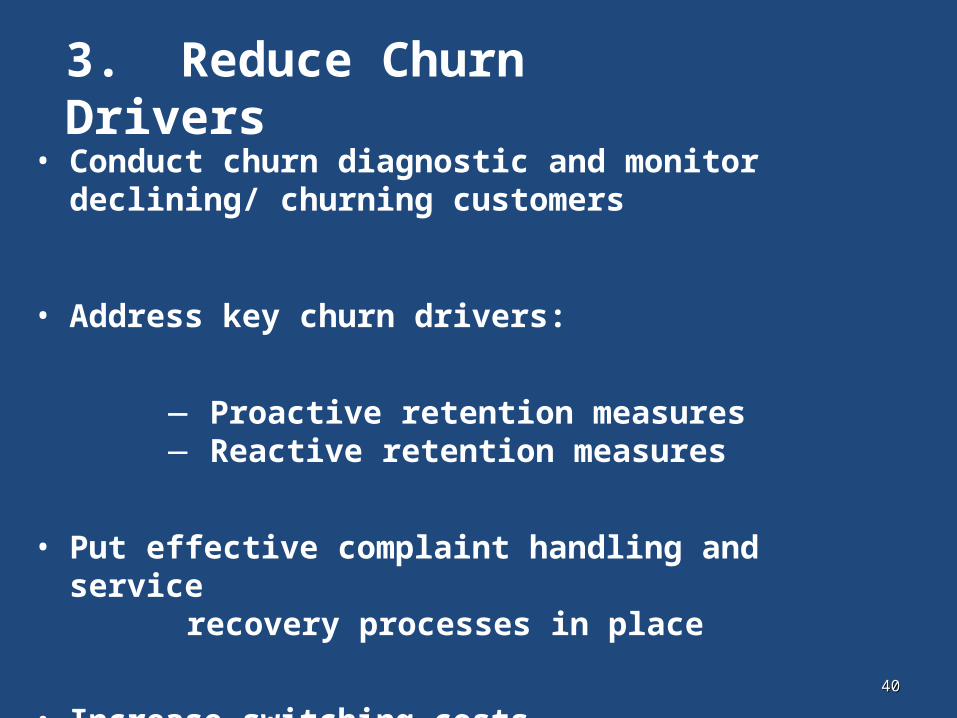
• Conduct churn diagnostic and monitor declining/ churning customers
• Address key churn drivers:
Proactive retention measures Reactive retention measures
• Put effective complaint handling and service recovery processes in place
• Increase switching costs
3. Reduce Churn Drivers
Dating your Customer