Embed Size (px)
Citation preview

SERVICE QUALITY DIMENSIONS AND CUSTOMER
SATISFACTION IN BARCLAYS BANK OF KENYA
DAMARIS MORAA OANDA
D61/73185/2009
A MANAGEMENT RESEARCH PROJECT SUBMITTED IN PARTIAL
FULFILMENT OF THE REQUIREMENTS FOR THE AWARD OF
MASTER OF BUSINESS ADMINISTRATION, SCHOOL OF BUSINESS,
UNIVERSITY OF NAIROBI
2015

ii
DECLARATION
This research project is my original work and has not been submitted for
examination in any other university.
Signature: _______________________ Date: ___________
DAMARIS MORAA OANDA
D61/73185/2009
This project has been submitted for examination with my approval as University of
Nairobi supervisor.
Signature ___________________ Date: ______________
ONSERIO NYAMWANGE
LECTURER
SCHOOL OF BUSINESS
UNIVERSITY OF NAIROBI
iii
DEDICATION
This research project is dedicated to my loving mother Tabitha Kwamboka Ongaro
for her continuous support, encouragement and prayers during my entire course.
Special mention goes to my siblings for their support throughout the entire period
of study. God bless them abundantly.
iv
ACKNOWLEDGEMENTS
All glory goes to the Lord Almighty for giving me strength, resources and
provision during the entire study period.
I would like to express my sincere thanks to my supervisor Onserio Nyamwange,
lecturer university of Nairobi, for the support, guidance and rich learning
experience gathered during my research.
I am grateful to my moderator Tom Kongere for the support during the research
work.
v
ABSTRACT
The study focused on assessing the service quality dimensions and customer satisfaction in
Barclays bank of Kenya. The specific objectives were to determine levels of service quality and
levels of customer satisfaction using the SERVQUAL dimensions do an intersegment
comparison and finally establish a relationship between service quality and customer satisfaction.
The data was collected by use of self –administered questionnaires. Data collected was purely
quantitative and was analyzed by descriptive analysis. Descriptive statistics such as frequency,
mean, standard deviation range and standard error of mean and sum were used to analyze the
data. Tables were used to summarize responses for further analysis and facilitate comparison.
ANOVA tests were used to analyze disparities in means and correlations were done to ascertain
relationships among variables,i.e perceptions of service quality and customer satisfaction in
Barclays bank of Kenya. The study found that service quality levels were perceived to be quite
high with superior service in the affluent segment this being a resultant of segmentation, as the
mass segment service was inferior. The ranking of SERVQUAL dimensions was in the following
order, empathy first, assurance second, tangibles third, responsiveness fourth and reliability last.
Customers were satisfied on very few attributes and on the SERVQUAL dimensions customers
were generally dissatisfied with an exception of the empathy dimension whereby the
expectations were just met. The customer satisfaction was not exceptional despite the perceived
quality being superior. Service quality is generally good in Barclays bank of Kenya but there is
need for improvement as customers are not satisfied in most areas. More can be done to exceed
customers ‘expectations on all the dimensions of service quality i.e. tangibility, reliability,
responsiveness, assurance and empathy. Segmentation has improved service quality especially in
the affluent segment as per indication of superior service. The mass segment needs to be
addressed especially on the reliability dimension. The affluent segment is very sensitive, despite
service quality being high, this segment needs a lot of personalized service and expectations are
relatively high. In the business segment, transactions’ being done within SLA’s is critical and
should be adhered to.

vi
TABLE OF CONTENTS
DECLARATION ..................................................................................................... ii
DEDICATION ........................................................................................................ iii
ACKNOWLEDGEMENT ...................................................................................... iv
ABSTRACT .............................................................................................................. v
LIST OF TABLES ................................................................................................. viii
LIST OF ABBREVIATIONS .................................................................................. ix
CHAPTER ONE: INTRODUCTION .................................................................... 1
1.1 Background ........................................................................................................ 1
1.1.1 Service Quality ......................................................................................... 2
1.1.2 Customer Satisfaction ............................................................................... 3
1.1.3 Barclays Bank of Kenya Market Segment Differentiation .......................4
1.2 Statement of the problem ................................................................................... 6
1.3 Research Objectives .......................................................................................... 8
1.4 Value of the Study ....................................................................................... 8
CHAPTER TWO:LITERATURE REVIEW ........................................................ 9
2.1 Introduction .......................................................................................................... 9
2.2 Service Quality .................................................................................................... 9
2.2.1 Service Quality and its Determinants ......................................................11
2.2.2 Measuring Service Quality ......................................................................12
2.3 Customer Satisfaction ........................................................................................13
2.4. Service Quality and Customer Satisfaction ......................................................14
2.5 Service Quality and Market Segmentation ........................................................15
2.6 Theoretical framework .....................................................................................16
2.7 Empirical Studies ..............................................................................................17
2.8 Summary and conceptual framework ................................................................19

vii
CHAPTER THREE:RESEARCH METHODOLOGY .....................................21
3.1 Introduction ........................................................................................................ 21
3.2 Research Design ................................................................................................. 21
3.3 Population .......................................................................................................... 21
3.4 Sample Design ................................................................................................... 21
3.5 Data Collection .................................................................................................. 22
3.4 Data Analysis ..................................................................................................... 23
CHAPTERFOUR:DATAPRESENTATION AND INTERPRATATION .......24
4.1 Introduction ........................................................................................................ 24
4.2 Demographic Profile of Respondents ............................................................... 24
4.3 Respondents perceptions of Service Quality ..................................................... 27
4.3.1 Dimensional ranking of Service Quality .................................................... 30
4.3.2 Test of Differences in the Service quality mean rankings ........................ 31
4.4 Gap Analysis to measure Customer Satisfcation levels P-E scores .................. 33
4.4.1 Test of Differences in the P-E GAP rankings .......................................... 37
4.5 Linking Service quality to Customers Satisfaction ........................................... 39
4.5.1 Intersegment linking Service Quality to customers satisfaction .............. 40
CHAPTER FIVE:DISCUSSIONS OF FINDINGS,CONCLUSIONS AND
RECOMMENDATIONS ......................................................................................42
5.1 Introduction ........................................................................................................ 42
5.2 Discussions ....................................................................................................... 42
5.3 Conclusion ......................................................................................................... 43
5.4 Recommendations .............................................................................................. 44
5.5 Limitations of the study ................................................................................... 44
5.6 Suggestions for further study ........................................................................... 44
REFERENCES ......................................................................................................45

viii
Appendix 1: Questionnaire ...................................................................................50
LIST OF TABLES AND FIGURES
Figure 2.1 Conceptual framework................................................................................... 20
Table 3.1 Questionnaire distribution as per branches in each Segment...........................23
Table 4.1 Gender ..............................................................................................................24
Table 4.2 Age of respondents.......................................................................................... .25
Table 4.3 Years banked……………….............................................................................25
Table 4.4 Customer occupation…………………............................................................26
Table 4.5 Products with the bank......................................................................................26
Table 4.6 Customers perceptions of service quality.........................................................27
Table 4.7 Ranking of SERVQUAL dimensions and Intersegment Comparison..............30
Table 4.8 Intersegment Dimensional ANOVA analysis.……...........................................31
Table 4.9 GAP Analysis P-E Scores……………….........................................................34
Table 4.10 Intersegment Dimensional ANOVA analysis.……........................................37
Table 4.11a Link of Service quality and Customer Satisfaction……..............................39
Table 4.11b Correlation statistics linking Service quality and customer Satisfaction….39
Table 4.11c Graph representation-Link of service quality and customer satisfaction.......39
Table 4.12 Intersegment Dimensional correlations………………………...………........40

ix
LIST OF ABBREVIATIONS
CBK Central Bank of Kenya
SERVPERF Service Performance model
SERVQUAL Service Quality Model
P-E Perception-Expectations
Std Dev Standard Deviation
SPSS Statistical Package for Social Sciences
ATM’s Automated Teller Machines
SLA’s Service Level Agreements
USA Unites States of America
US United States
1
CHAPTER ONE: INTRODUCTION
1.1Background
Commercial banks, assaulted by the pressures of globalization, competition from non-
banking financial institutions, and volatile market dynamics are constantly seeking new
ways to add value to their services. Financial services compete in the marketplace with
generally undifferentiated products and thus, service quality becomes a primary
competitive weapon (Stafford, 1996). Technological changes are causing banks to rethink
their strategies for services offered to both commercial and individual customers
(Hossain and Sherloy, 2010).
Banks that excel in quality service can have a distinct marketing edge since improved
levels of service quality are related to higher revenues, increased cross-sales, higher
customer retention (Bennett and Higgins, 1988), and expanded market share (Bowen and
Hedges, 1993). Therefore, banks should focus on service quality as a core competitive
strategy (Chaoprasert and Elsey, 2004).Within this background customer satisfaction and
service quality are compelling the attention of all banking institutions around the world
and in recent years, academicians and practitioners give more attention in this area as it
assumed that service quality is a critical measure of firm performance (Lasser, 2000; Bick
2004; Andreassen and Olsen, 2008).
Service process performance in the banking industry should be measured continuously.
Building customer relationship means delivering superior value over competitors to the
target customers (Kotler, 2002). Higher levels of quality lead to higher levels of customer
satisfaction (Kotler and Keller, 2009). It has been proven by an author that “an
organization that consistently satisfies its customers enjoys higher retention levels and
greater profitability due to increased customer loyalty” (Wicks and Roethlein, 2009).
Customer satisfaction not only means, satisfying the customers but also customer
retention. The organization should solve the complaints through various service recovery
strategies. It is mandatory to identify the impact of service failure through customer
feedback.
2
1.1.1 Service Quality
Service quality is a concept that has aroused considerable interest and debate in the
research literature because of the difficulties in both defining it and measuring it with no
overall consensus emerging on either (Wisniewski and Donnelly, 1996). There are a
number of different "definitions" as to what is meant by service quality. One that is
commonly used defines service quality as the extent to which a service meets customers’
needs or expectations (Wisniewski and Donnelly, 1996).
Nowadays service quality has become one of the important determinants in measuring the
success of industries. Marketers agree that service quality has truly presented a
significant influence on customers to distinguish competing organizations and contribute
effectively to customer satisfaction (Parasuraman, Zeithaml and Berry, 1985). Service
quality can be defined as the difference between customer expectation for service
performance prior to the service encounter and their perceptions of the service received
(Asubonteng, McCleary and Swan 1996)
Service quality is the delivery of excellent or superior service relative to customer
expectations (Zeithaml and Bitner 1996). Service quality is recognized as a
multidimensional construct. Service quality revolve around the idea that it is the result of
the comparison that customers make between their expectations about a service and their
perception of the way the service has been performed (Lewis and Booms 1983).
Service quality can thus be defined as the difference between customer expectations of
service and perceived service. If expectations are greater than performance, then
perceived quality is less than satisfactory and hence customer dissatisfaction occurs
(Parasuraman et al., 1985). Always there exists an important question: why should
service quality be measured? Measurement allows for comparison before and after
changes, for the location of quality related problems and for the establishment of clear
standards for service delivery. Edvardsen (1994) states that, the starting point in
developing quality in service is analysis and measurement. The SERVQUAL is the most
common method for measuring service quality.
3
Among general the most popular model used for evaluation of service quality is
SERVQUAL, a well-known scale developed by (Parasuraman et al., 1985). The attributes
of (Parasuraman et al., 1985) were tangibles, reliability, responsiveness, competency,
courtesy, assurance, credibility, security, access and understanding. Parasuraman et al.,
1988 later reduced these ten dimensions into five by using a factor analysis. Based on
(Parasuraman et al 1988) conceptualization of service quality, the original SERVQUAL
instrument included 22 items. The data on the 22 attributes were grouped into five
dimensions. Tangible: well-maintained waiting queues, clear and easy bank statements,
convenient location and faster operation with modern technology. Reliability: provide
services when promised. Responsiveness: Employees’ attention in solving problems,
employees’ full service, prompt errors correction. Assurance: safe feeling on transactions,
competitive loan rates, interest rates on saving and time deposits, helpful employees.
Empathy: employees search for solution.
1.1.2 Customer Satisfaction
Customer satisfaction is one of the key factors in modern marketing and customers’
behavior analysis. Generally speaking, if the customers are satisfied with the provided
goods or services, the probability that they use the services again increases. Satisfied
customers will most probably talk enthusiastically about their buying or the use of a
particular service. This will lead to positive advertising. Customer satisfaction is often
considered the most important factor thriving in today’s highly competitive business
world. Services have unique characteristics that distinguish them from the physical goods
(Zeithaml and Bitner, 1996). Services are often characterized by intangibility,
inseparability, heterogeneity, and perishability (Lovelock, 1996).
Customer satisfaction is often considered the most important factor thriving in today’s
highly competitive business world. Services have unique characteristics that distinguish
them from the physical goods (Zeithaml and Bitner, 1996). Services are often
characterized by intangibility, inseparability, heterogeneity, and perishability (Lovelock,
1996). The importance of the above characterizations is that using them for evaluation
before, while, and after using a particular service by the customers is often very hard
4
(Legg and Baker, 1996). Because of the quality of being intangible, understanding how
the customers would evaluate the quality of the organization’s services is often very hard
(Zeithaml and Bitner, 1996).
Kotler and Armstrong (2012) preach that satisfaction is the post-purchase evaluation of
products or services taking into consideration the expectations. Researchers are divided
over the antecedents of service quality and satisfaction. The studies of Sulieman (2011)
suggests service quality leads to customer satisfaction. To achieve a high level of
customer satisfaction, most researchers suggest that a high level of service quality should
be delivered by the service provider as service quality is normally considered an
antecedent of customer satisfaction.
Banking is one of the numerous services in which the customer satisfaction has had an
ever increasing importance in the corresponding research areas. This is essentially
because the banking sector is becoming more and more competitive (Levesque and
McDougall, 1996). Retail banks are pursuing this strategy, in part, because of the
difficulty in differentiating based on the service offering. Typically, customers perceive
very little difference in the services offered by retail banks and any new offering is
quickly matched by competitors (Coskun and Frohlich, 1992) and (Devlin,1995).
Other economic systems are also experiencing the same changes occurring in their
external environments. In such systems, moving toward privatization and economic
liberalization have increased the rivalry and have prepared the system for foreign rivals.
The outcome of this increasing rivalry is that a lot of financial institutions are focusing on
increasing the customer satisfaction and trying to keep them by any possible means
(Levesque and McDougall, 1996).
1.1.3 Barclays Bank of Kenya Market Segment Differentiation
The companies act, the banking act, the Central bank of Kenya act and the various
prudential guidelines issued by the Central bank of Kenya (CBK), govern the banking
industry in Kenya. As at 31st December 2009, the banking sector was composed of 46
institutions (CBK bank supervision annual report, 2009). The banks offer corporate and
5
retail banking services but a small number, mainly comprising the larger banks, offer
other services including investment banking.
The Kenyan banking sector has demonstrated a solid growth over the past few years.
According to Central bank of Kenya, the number of deposit accounts has increased from
2.55 million in 2005 to nearly 12 million at end of September 2010 (CBK 2010). The
industry continues to offer significant profit opportunities for the major participants.
Banks generally earn their revenues from taking in funds and lending them out at a higher
rate. The spread between deposits and loans continues to be around 10.5%(international
norms are 5-6%), offering much profit potential. Overall the banking sector is solid with
a low level of non-performing advances, strong liquidity, solid profitability and well
capitalised (Kenya’s banking sector performance 2010). In 2010, the 43 banks recorded
a total net profit of kes 57 billion with the top 7 banks contributing 70%.
Barclays has operated in Kenya for over 90 years. Financial strength coupled with
extensive local and international resources have positioned Barclays bank of Kenya as a
foremost provider of financial services. Barclays bank of Kenya is a leading financial
services provider in the country and has established an extensive network of 117 outlets
with over 230 ATMs spread across the country. The bank's financial performance over
the years has built confidence among the bank's shareholders, with a reputation as one of
the leading blue chip companies on the Nairobi stock exchange.
According to the Banking survey part IV (2004), Barclays bank is a market leader in the
retail segment (mass and affluent) and corporate/ business. The products offered by the
bank can be classified into liability and assets products. Liability products include current
and savings accounts that are disaggregated into various market segments. For this study
Barclays is segmented into mass market (standard), affluent (prestige, premier) and
business/corporate segments. The products within the segments are also differentiated.
The mass segments asset products are Barclay loans, scheme loans, and liability products
are savings, payroll and fixed deposit accounts respectively. The banking halls are
standard and the queuing system is a characteristic of this segment, charges are minimal
in comparison to the other segments and the operation hours are limited, Barclays current
6
account and saving account product pack (2013). This segment targets the low to medium
class in terms of earnings and the students respectively.
Affluent segment’s liability products are prestige loan, premier loans, executive loans and
credit cards. This segment also enjoys longer banking hours, refreshments during
banking, minimal queues, personalised services, boardrooms and state of the art
ambience in the banking in addition to the services, Barclays current account and saving
account product pack (2013).The charges on the services are high; the segment targets the
upper class income earners.
Business segment’s liability products are business loans, overdrafts and other lending
services including letters of credit and guarantees. This segment is mostly relationship
managed and the services are tailor made to specification, the charges are relatively high
owing to the turnover and the cash movement involved. This segment targets the
businessmen specifically the small and medium sized enterprises and corporates,
Barclays current account and saving account Product Pack (2013). The bank offers
various credit cards products through its flagship international credit card brand
Barclaycard a products accessible to all segments.
There has been a tremendous change in the way of banking between the year 2005 and
2009, and customers have also rightly demanded world class quality services from the
banks. With multiple choices available, customers are not willing to put up with anything
less than the best. Banks have recognized the need to meet customers’ aspirations as
different customers have different personalities, so it is an urgent drive for the banks to
establish the determinants of customer loyalty in the banking sector in order to enhance
customer loyalty and retention.
1.2 Statement of the Problem
In the changing banking scenario of the 21st century, banks have had to build a strong
identity to provide world-class services. The banks have had to be of high standard,
committed to excellence in customers, shareholders and employees’ satisfaction, and to
play a leading role in the expanding and diversifying of financial sector. The perceived
service quality has had positive effect on satisfaction of customers. Previous studies had

7
revealed that perceived service quality had positive effect on satisfaction of customer in
four service sectors i.e. dry cleaning, fast food, pest control and banking (Cronin and
Taylor 1992). Bei and Chiao (2006) also reported positive influence of perceived service
quality on three service providers i.e. petrol station, automobile repair and banking.
Significant correlations had been found between overall customer satisfaction and service
quality dimensions (Buttle 2002). The service quality in banking industry related to
assurance, empathy, responsiveness and reliability (Johnston 1995).
Reliability and assurance had strong influence on banking sector service quality and
customer satisfaction (Zhou 2004). Study carried out on the USA, Netherland, Hong
Kong, Morocco and Australian banking sector reported direct impact of service quality
on customer satisfaction (Brady and Cronin, 2001). Mbogua (2007), study on customer
perceived qualities of service in the banking sector found that majority of the respondents
were satisfied with the services offered by banks. Magori (2011), study on customers’
perception of the quality of services offered by Kenya Commercial bank branches in
Nairobi revealed that service rendered was mainly perceived to be of average quality
thereby signifying that the customers’ expectations of the quality were higher than the
delivered service. Studies on service quality and customer satisfaction had been done
targeting businesses as an entity and specialization had not been done to segment level.
The research gap was to identify the most important service quality dimensions for each
banking segment and analyze the relationship between the customer demographic
variables and the bank status of ownership, as demographic characteristics were an
accepted basis for segmenting markets and customers (Blech 1993; Kotler and
Armstrong, 1991). Investigating these aspects was to add to the existing body of
knowledge since there was lack of research at segment level. The study intended to find
answers to the following research questions: What were the customers’ perceptions on
quality of service using the service quality dimensions and levels of quality in the
segments? Were customers satisfied, and what where the satisfaction levels in market
segments in BBK? What was the link in service quality trends and customer satisfaction
in BBK?
8
1.3 Research Objectives
The specific objectives of this study were:
i. To determine customers perceptions on the quality of service using the service
quality dimensions and do comparison within the segments in BBK.
ii. To determine if customer were satisfied and do a comparison of satisfaction levels
within the market segments in BBK.
iii. To link perceived service quality trends with customer satisfaction in BBK.
1.4 Value of the Study
Barclays bank had a relatively big market share in Kenya and thus such a research was to
be applied across all other banks in the same category. The feedback was to be used to
evaluate differentiation of service quality within the market segments and its efficacy
towards achieving customer satisfaction. The study also evaluated the specific parameters
on a dimensional basis that were emphasized in a specific market segment in comparison
to what was actually required. This would enable a perfect fit towards provision of
quality services. The study would enable a cost benefit analysis as the satisfaction was to
be compared to the level of investment in the segment and would point out the specific
areas of emphasis as far as investment is concerned in specific segments and ensure that
the service aligned to the prevailing market conditions and customer needs, while
preserving value for the bank.
9
CHAPTER TWO: LITERATURE REVIEW
2.1 Introduction
This chapter reviewed the literature on the key aspects of this study which were service
quality, customer satisfaction and market segmentation. Service quality, its determinants
and measurements were analyzed and this was compared to customer satisfaction. The
relationship between service quality and customer satisfaction was illustrated through a
conceptual framework.
2.2 Service Quality
The concept of service comes from business literature. Many scholars offered various
definitions of service. For example, Ramaswamy(1996) described service as "the
business transactions that take place between a donor (service provider) and receiver
(customer) in order to produce an outcome that satisfies the customer. For Zeithaml and
Bitner (1996) they defined service as "deeds, processes, and performances". Whereby,
Gronroos (1990) pointed out that: a service is an activity or series of activities of more or
less intangible nature that normally, but not necessarily, take place in interactions
between the customer and service employees and /or systems of the service provider,
which are provided as solutions to customer problems.
Some researchers view service from the perspective of a system-thinking paradigm: a
production system where various inputs are processed transformed and value added to
produce some outputs which have utility to the service seekers. This is not merely in an
economic sense but from supporting the life of the human system in general, even may be
for the sake of pleasure (Lakhe and Mohanty, 1995). Yong (2000) reviewed these
definitions of service and pointed out that the following features of service are
noteworthy in order to better understand the concept. First, service is a performance, it
happens through the interaction between consumers and service providers (Gronroos,
1990; Ramaswamy, 1996). Second, other factors such as physical resources or
environments play an important medium role in the process of service production and
consumption (Gronnroos, 1990). Third, service is needed by consumers to provide certain
10
functions such as problem-solving (Gronroos, 1990; Ramaswamy, 1996). These points
put together lead to the conclusion that, "a service, combined with goods products, is
experienced and evaluated by customers who have particular goals and motivations for
consumers for consuming the service".
Although there have been many efforts made to understand the concept of service, there
is no consensus among researchers on the characteristics of service. Furthermore,
according to Yong (2000), the conceptualization could be divided into two groups. First,
some researchers view the concept from the perspective of service itself - they pay
attention to the discrepancy between the marketing strategies of service and goods. This
approach differentiates service (intangible) from goods (tangible), which suggests that
different marketing strategies should be taken for each of these concepts. Parasuraman,
Zeithaml, and Berry (1985), and Zeithaml and Bitner (1996) identified four features of
service that distinguish it from goods. Service is intangible, heterogeneous, and
simultaneous in production and consumption, and perishable.
This approach distinguishes service from goods, by pointing out the unique features of
service. It advances the understanding of the concept. However, it has drawn many
critiques. On the one hand, the four characteristics mentioned above are not universal in
all service sectors. Wright (1995) criticized this first approach for four reasons. First, a
service industry depends more on tangible equipment to satisfy customers' demand while
some customers do not care about whether goods are tangible or not. Second, some
service businesses are well standardized such as franchise industries. In addition, in some
cases, customers value the equality and fairness from the service provided. Third, many
services are not simultaneously produced and consumed. Fourth, highly technological or
equipment based services could be standardized. On the other hand, this approach focuses
on service and ignores the role of customers (Wyckham, Fitzroy, and Mandry, 1975).
The second approach is based on the ideas of some researchers who view service from
the perspective of service customers - they focus on the utility and total value that the
service provides for the consumer. This approach points out that service combines
tangible and intangible aspects to satisfy customers during the business transaction
(Gronroos. 1990; Ramaswamy, 1996). It is implied that because consumers evaluate
11
service quality in terms of their experiences, customers' subjective perceptions have great
impact upon service success or failure (Shostack, 1997).
2.2.1 Service Quality and Its Determinants
Service quality has been defined as customers’ overall impressions of an organization’s
services in terms of relative superiority or inferiority (Johnston, 1995). Further, service
quality is considered to not only meet but to exceed customer expectations, and should
include a continuous improvement process (Lloyd-Walker and Cheung, 1998).
Customers evaluate banks’ performance mainly on the process of their interpersonal
contacts and interactions (Grönroos, 1990). Service quality arises from a comparison of
the difference between service expectations developed before an encounter with banks
and the performance perceptions gained from the service delivery based on the service
quality dimensions (Bloemer, 1998). Berry, (1985) and Zeithaml and Bitner (1996)
indicated that service quality consisted of five dimensions.
Tangibles refer to appearance of physical facilities, equipment, personnel and written
materials. Reliability refers to the ability to perform the promised service dependably and
accurately. Responsiveness refers willingness to help customers and provide prompt
service. Assurance refers to knowledge and courtesy of employee and their ability to
inspire trust and confidence and empathy refers to caring, individualized attention the
firm provides its customers. In the study by Berry, (1994) with more than 1,900
customers of five large famous US corporations, they found that (32%) placed emphasis
on reliability, followed by responsiveness (22%), assurance (19%), empathy (16%) and
tangibles (11%). Thus, reliability is considered the essential core of service quality. In
addition, other dimensions will matter to customers only if a service is reliable, as those
dimensions for example, responsiveness and empathy from service staff compensate for
unreliable service delivery. Further, they found that more companies were deficient in
reliability than in other service dimensions, but their best performance was on the least
essential dimensions of tangibles.
12
2.2.2 Measuring Service Quality
Measuring service quality has proven to be challenging for both the researchers and
companies due to its characteristics (Tiernan, 2008; Parasumaran, 1985; Johnson, 1995).
Different from product quality, a set of specifications or by physical aspects such as
defects cannot be applied to service quality due to service intangibility and simultaneous
production and consumption (Tiernan, 2008). In addition, service quality cannot be
measured by evaluating outcomes of service process only (Johnson, 1995), but as well
has to consider service production process – e.g. employee training and customer-
employee interaction. Hence, measuring all aspects of service production is essential to
understand the quality of a service. Researchers have developed a number of
measurement instruments, and some of them will be discussed. Probably the most famous
service quality model is SERVQUAL, developed by Parasumaran et al. in 1985. The
researchers say that quality is a comparison between expectations and performance, i.e.
how well the service that is delivered matches customers’ expectations. Gronroos (1982)
also made similar conclusions. The SERVQUAL-model measures discrepancy between
what customers expect from the service and how customer perceives it.
Johnson et al. (1995) suggest that service quality depends on quality of each three
dimensions: quality of inputs, quality of processes and quality of outputs. Input quality
refers to e.g. equipment that is up-to-date, waiting areas that are clean and comfortable,
service personnel with skills and knowledge and appropriately attired. Next, process
quality is a quality of interaction between provider and customer. Often, customers are
directly affected by service production process; thus, accessibility, availability and
service provider’s willingness to help are parts of process quality. Output quality refers to
the result of service provision and includes both tangible results and intangible benefits; it
means changes in the customer’s physical/mental state or a change in something that the
customer possesses. By testing systems approach, Johnson,(1995) conclude that the
consumers evaluate quality by considering various aspects of output, process and input,
with output being most important and input almost insignificant. Process was important
in e.g. transportation industry.

13
2.3 Customer Satisfaction
Customer satisfaction is an applied term that determines on how products and services
supplied by a company meet or surpass customer expectation. Cronin (2000),
conceptualized customer satisfaction to be an evaluation of an emotion, reflecting the
degree to which the customer believes the service provider evokes positive feelings.
Customer satisfaction reflects the degree to which a consumer believes that the
possession or use of a service evokes positive feelings. Cronin (2000) various models and
theories that have been developed to this end (Oliver, 1980; Anderson and Sullivan,
1993), indicate that customer satisfaction is related to the size and direction of
disconfirmation, which is defined as the difference between the post-purchase and post-
usage evaluation of the performance of the product/service and the expectations held
prior to the purchase (Sharma and Ojha, 2004).
The dream of every organizations; having a satisfied customer will be injection for its
success and basis to continue its business lifecycle, if achieved through continuous
delivery of satisfactions by reducing resistance and reluctance of the customers towards
offered products and services. If not, just a respite and waste of time and fund. Customer
retention is also dependent on a number of other factors. These include a wider range of
product choices, greater convenience, better prices, and enhanced income (Storbacka,
1994).Whereas Ioanna (2002) further proposed that product differentiation is impossible
in a competitive environment. Organisations everywhere are delivering the same
products. For example, there is usually only minimal variation in interest rates charged or
the range of products available to customers. Prices are fixed and driven by the
marketplace. Thus, organisations tend to differentiate their firm from competitors through
service quality. Service quality is an imperative element impacting customers’
satisfaction level in organisations. Quality is a multi-variable concept, which includes
differing types of convenience, reliability, services portfolio, and critically, the staff
delivering the service.
Studies showed that increased use of service quality and professional behaviours (such as
formal greetings) improved customer satisfaction and reduced customer attrition. Several
14
studies are conducted in this setting regarding the customer satisfaction. In those studies,
the contradiction occurs in variables that affect the customer satisfaction. In some studies,
price and variety of product/services are major factors affecting the customer satisfaction
while in some other studies there is an inverse finding that there is no possibility to
differentiate their price and services, thereby they have less or no impact in customer
satisfaction.
2.4 Service Quality and Customer Satisfaction
Previous reference has been made to the concept of customer satisfaction in the context
of customer-perceived service quality. Indeed, a review of the literature will reveal that
both terms are quite often used interchangeably, which has caused confusion. While both
concepts are related and appear to be merging, there are still gaps in the understanding of
the two constructs, their relationship to each other, and their antecedents and
consequences (Gwynne, Devlin, and Ennew, 1998). A distinction needs to be made
between both. According to Cronin and Taylor (1992), this distinction is important to
both managers and researchers alike, because service providers need to know whether
their objective should be to have consumers who are satisfied with their performance or
to deliver the maximum level of perceived service quality." Oliver (1981) takes the view
that satisfaction is "the emotional reaction following a disconfirmation experience." Getty
and Thompson (1994) define it as a "summary psychological state experienced by the
consumer when confirmed or disconfirmed expectations exist with respect to a specific
service transaction or experience."
The most commonly used representation of customer satisfaction is the disconfirmation
approach (Ramaswamy, 1996), in which satisfaction is related to the variation between a
customer’s pre-purchase expectations and their post purchase perceptions of the actual
service performance. According to disconfirmation theory, the extent of satisfaction or
dissatisfaction that a customer has with a particular service is determined by the
difference between the customers’ expectations of performance and the actual perceived
performance of the service (Oliver, 1996). Any difference between them is referred to as
disconfirmation. If the service experienced is better than expected, then positive
15
disconfirmation or high levels of satisfaction will result. If, however, the service
performance falls short of what was expected, then negative disconfirmation or
dissatisfaction will result. Confirmation or zero disconfirmation results when perceived
performance just meets the customer’s expectations or when the service experience is
much as expected in the customers.
2.5 Service Quality and Market Segmentation
The real need of market segmentation was investigated by Laurent (1979) employing a
factor analysis centred around five banks that differed from each other on seven main
attributes: friendliness, quality of service, community spirit, standard of facilities,
convenience, range of services and ownership. The main findings revealed that on the
basis of perceptions of the overall image of the five banks relative to each other, there
existed three distinct market segments: convenience, service, and staff friendliness -
oriented segments. Laroche (1986) studied diverse demographic segments to find the
services used and factors considered important in selecting a bank. Key findings included
importance of location convenience, speed of service, competence and friendliness of
bank personnel.
Ricky (1993) conducted a study on the banking behaviour of college students that
confirmed several findings from western countries like limited banking, demand of
students, popularity of split banking in account ownership, price consciousness of
students, and importance of location convenience and on campus promotion. In a study
by Clifford and Russ (1994) the factors that predict the successful sale of financial
services to affluent investors were gone into, by collecting data using a new set of scales
that measure traits, selling strategies, and compliance gaining tactics. Results suggest that
effective relationship managers to sell the services of financial service institutions to
various; geographically diverse, affluent investors
Raj and Everett (1996) used benefit segmentation by factor analysis group customers in
relation to their particular attitudes and behaviour instead of geographic, demographic,
socio-economic, and psychological characteristics to segment the market for financial
services. The study identified eight benefits, in order of their popularity as personal

16
service, investment, limited banking, accessible cash, cash card, advice, money
management, and full banking. Achim and Sebastian (2001) studied the use of
segmentation by demographic factors in bank marketing and found that the correlation of
such factors with the needs of customers is often weak. Finding is that segmentation by
expected benefits and attitudes could enhance a bank's ability to address the conflict
between individual service and cost-saving standardisation. Niels (1995) in his study
found that the bank customers may be divided into an Internet banking segment and a
branch banking segment and that the former is growing and the latter is declining,
necessitating the development of technology in bank marketing.
2.6 Theoretical Framework
The construct of service quality as conceptualized in the service marketing literature
centers on perceived quality, defined as a consumer’s judgment about an entity’s overall
excellence or superiority (Zeithaml, 1987). While the SERVQUAL instrument has been
widely used, it has been subject to criticism (Asubonteng et al., 1996; Buttle, 1996).
Criticisms include the use of difference scores, dimensionality, applicability and the lack
of validity of the model, especially with respect to the dependence or independence of the
five main variables (Babakus and Boller, 1992; Carman, 1990; Cronin and Taylor, 1992).
The criticism of note to this study is the point that SERVQUAL focuses on the service
delivery process and does not address the service encounter outcomes (Gro¨nroos, 1990;
Mangold and Babakus, 1991). It is interesting to note that the developers of SERVQUAL
initially suggested that service quality consists of functional (process) and technical
(outcome) dimensions (Parasuraman et al., 1985). However, the SERVQUAL instrument
does not include any measure of the technical quality dimension. Essentially, technical
quality has been neglected in efforts to study and measure service quality
Although the elements listed in SERVQUAL model have been proven to be the main
method for evaluating service quality from the consumer’s perspective (Brown et al.,
1993), drawbacks in using SERVQUAL in measuring service quality has been the reason
that the SERVPERF scale was proposed by Cronin and Taylor (1992), cited in Jain et al.
(2004) after they called into question the conceptual basis of the SERVQUAL, having

17
found it, led to confusion with service satisfaction (Jain et al., 2004). These researchers
discarded the ´E´ for ´expectation` claiming instead that ´P´ for ´performance´ alone
should be used. They meant that higher perceived performance entails higher quality
service. Unfortunately, during this past century, customers have changed their behaviors
in ways that do not suit organizational behavior. Till date, it is unclear as to which of
SERVQUAL and SERVPERF is superior in measuring service quality (Jain et al., 2004).
2.7 Empirical Studies
Several researchers have argued for the addition of items and/or dimensions to
SERVQUAL. For example, from a less sociological and more operational perspective,
Crosby (1979) defines quality as conformance to requirements and argues that those
requirements should be specifically defined to measure quality. From Crosby's (1979)
view and the general total quality management perspective. Certain aspects of quality (of
services or otherwise) intuitively ought to be incorporated, along these lines, in applying
SERVQUAL to measure perceived quality of retail financial services.
In developing SERVQUAL, Parasuraman Zeithaml, and Berry followed a general
procedure of qualitative research (interviews and focus groups) to develop the initial
scale and then performed quantitative surveys to refine and empirically test the scale.
These interviews and surveys included retail consumers of appliance repair or
maintenance, retail banking, long-distance telephone service, securities brokers, and
credit card services. Additional research has expanded the use of SERVQUAL to include
retail consumers of health care, residential utilities, job placement, pest control, dry
cleaning, financial services, and fast-food services, and the resultant dimensions have
ranged from one to eight (e.g. Babakus and Boller 1992;Cronin and Taylor 1992;
Parasuraman et al., 1985).
Customer satisfaction is generally defined as the full meeting of one’s expectations
(Oliver, 1980) and can be described as the feeling or attitude of a customer towards a
product or service after it has been used. Numerous studies from different service sectors
have investigated the relationship between service quality and customer satisfaction.
Although researchers have agreed that there is a relationship between the two constructs,
18
there has been no consensus regarding the direction of this relationship. Some researchers
have proposed a causal link from customer satisfaction to service quality (Bitner et al.,
1990), whereas others researchers have proposed a causal link in the opposite direction
(Bolton and Drew, 1991).
While a substantial amount of research has reported a causal link between service quality
and customer satisfaction (e.g. Anderson and Sullivan, 1993; Bolton and Drew, 1991;
Cronin and Taylor, 1992), few have investigated the link between each of the service
quality dimensions and satisfaction and have reported some mixed results (Johnston,
1995; Lassar et al., 2000; Zhou, 2004; Arasli et al., 2005). For example, Arasli et al.
(2005) reported that assurance, reliability, empathy and tangibles dimensions of service
quality were predictors of customer satisfaction in the Cyprus banking sector. Additional
support comes from Zhou (2004), who reported that reliability and assurance were
important predictors of satisfaction for bank customers in China.
Service quality is an important tool to measure customer satisfaction. Empirical studies
show that the quality of service offered is related to overall satisfaction of the customer.
According to Jamal and Naser (2002), reliability, tangibility and empathy are positively
related with customer satisfaction. Joshua and Moli (2005), in their study on ‘expectation
and perception of service quality in old and new generation banks’, observed that the
performance of the new generation banks across all the service quality dimensions are
better than those of old generation banks. Al-Fazwan (2005) in his study found that the
bank should concentrate on the accessibility dimension. He stated that the particular bank
should make maximum efforts to raise the level of services to meet the customer
expectations.
Sudesh (2007) revealed that poor service quality in public sector banks is mainly because
of deficiencies in tangibility, lack of responsiveness and empathy. Private sector banks,
on the other hand, were found to be more reformed in this respect. Above all, foreign
banks were relatively close to the expectations of their customers with regard to various
dimensions of service quality. Further, the study revealed that there existed service
quality variations across demographic variables and suggested that the management of
19
banks should pay attention to potential failure points and responsive to customer
problems.
Koushiki (2007) in his study suggests that customers perceive four dimensions of service
quality in the case of the retail banking industry in India, namely, attitude, competence,
tangibles and convenience. Identifying the underlying dimensions of the service quality
construct in the Indian retail banking industry is the first step in the definition, and hence,
provision of quality service. The paper has drawn upon the findings of the service quality
dimensions to determine the initiatives that bank managers can take to enhance their
employees’ skills and attitudes and instill a customer-service culture.
Musyoka (2010) in his study implied that service quality accounted for 73.9% of library
user satisfaction among universities in Kenya. The findings further revealed that
reliability dimension contributed most towards user satisfaction while empathy
dimension contributed the least. The results also indicate that the libraries cannot afford
to ignore any of these other dimensions since they all appear to influence customer
satisfaction although at different degrees.
Mugambi (2009) in his study concluded that the e-banking customers seem to be quite
satisfied in the following areas: security, efficiency, accurate records, convenience and
accurate transactions.
2.8 Summary and Conceptual Framework
SERVQUAL is a well-known research instrument for evaluating service quality in
banking industry. SERVQUAL perfectly covers the dimensions that are considered by a
customer in evaluating quality of service in a bank. SERVQUAL can generally be
applied for evaluating service quality in any service sector ((Parasuraman et al. 1988).
Most of the studies have utilized SERVQUAL for evaluating service quality of banking
industry (Arasli. 2005; Zhou 2004). This will form the conceptual framework of this
study

20
Figure 2.1 Conceptual framework
Independent Variable Dependent Variable
SERVQUAL DIMENSIONS
Source: Own Compilation 2015
Tangibility
Reliability
Responsiveness
CUSTOMER SATISFACTION
Brand loyalty
Cross sales
Repeat purchase
Positive feedback
Customer retention
Customer referrals
Assurance
Empathy
21
CHAPTER THREE: RESEARCH METHODOLOGY
3.1 Introduction
The chapter presented the research design and methodology of the study. In this stage,
decisions were made on how research was done, the approach, as well as when, where
and how it is was completed. The chapter therefore entailed the way the study was
designed, the data collection techniques and the data analysis procedure.
3.2 Research Design
This study adopted a descriptive survey approach. A descriptive study attempts to
describe the state of affairs as it exists then (Kothari, 2004). According to Mugenda and
Mugenda (1999), a descriptive study ensured that the observer eliminated subjectivity by
administering a standard stimulus to all respondents, the study was therefore able to
generalize the findings to the three major segments of emphasis in Barclays bank i.e.
mass, business and affluent banking respectively.
3.3 Population
Population is a total of all that conform to a given characteristic (Mugenda and Mugenda,
2002). The target population in this study consisted of all the customers in the branches
of Nairobi as the segmentation was distinct in these branches; Barclays Nairobi had 37
branches specializing in mass, 11 in affluent and 15 in business segment respectively.
3.4 Sample Design
According to Cooper et al. (2003) the basic idea about sampling is that by selecting some
of the elements in a population, conclusions were drawn about the entire population. The
researcher used judgmental and convenience sampling to randomly select 50 respondents
for the study. The number was limited to 50 respondents as the products offered within
the segments were quite homogenous.
22
3.5 Data Collection
Primary data was used and obtained through the administering of a structured
questionnaire to 50 Customers as the products offered in the segments were quite
homogenous. Statistically, in order for generalization to take place, a sample of at least
30 elements (respondents) must exist (Cooper and Schindler, 2003).
The Questionnaire was divided into three sections. Section A aimed at gathering
demographic profile of the respondents which provided the general information about
respondents on age, gender, market segments represented , number of products and years
banked with Barclays. This enabled the researcher get a better understanding of the type
of respondents and related it to how they perceived service quality. Section B was to
measure the service quality offered by the bank this was by measuring customer
perceptions. Section C was to measure level of customers satisfaction with service
rendered by the bank this was analyzed by the P-E scores .The data collected on section
B and C was analyzed further to ascertain the impact of service quality on customer
perception. This was presented on a graph to establish the trends on the two parameters,
i.e. service perception and customer satisfaction.
It was quite difficult to ascertain the number of customers at any one given time,most
customers had more than one product and thus operating multiple account,other
customers had dormant accounts. The branch distribution was subsequently used as a
guide for questionnaire distribution. The branch distribution had a format of 37 branches
specializing in mass, 15 in business and 11 in the affluent segments respectively.
Distribution of the 50 questionnaires was random and based on convenient and
judgmental sampling. Questionnaires were distributed using the segment branch network
as a basis, as per table 3.1 below.
23
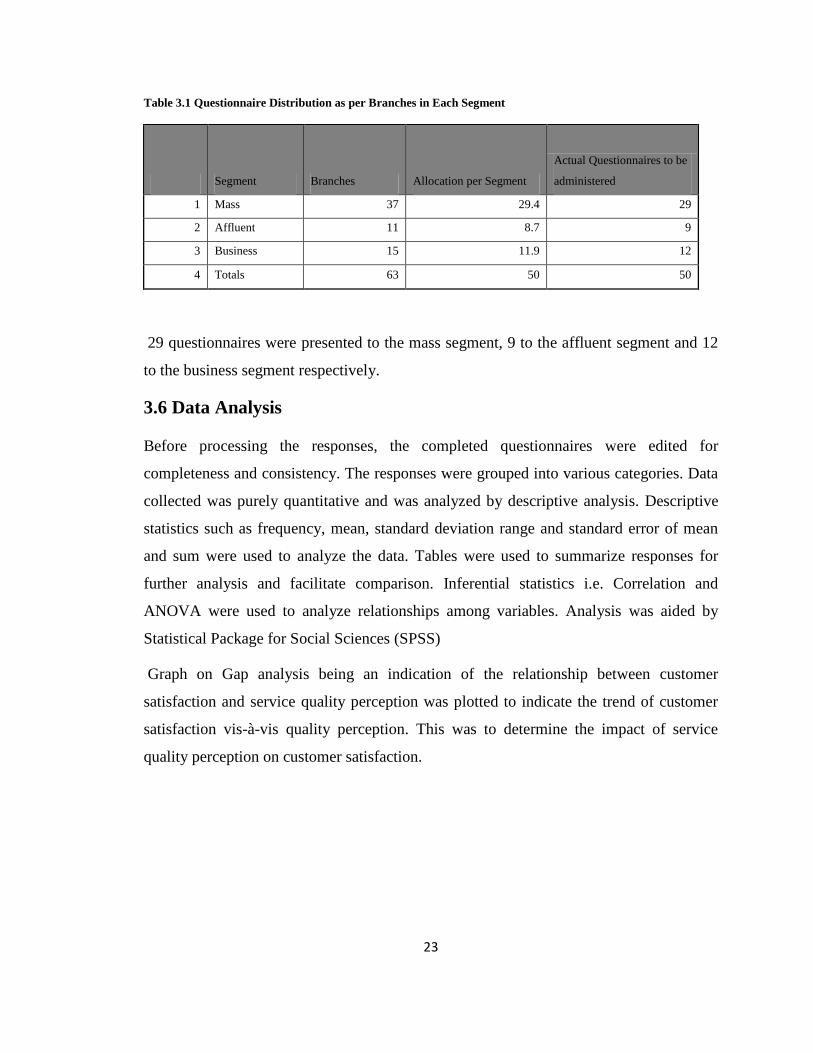
Table 3.1 Questionnaire Distribution as per Branches in Each Segment
Segment Branches Allocation per Segment
Actual Questionnaires to be
administered
1 Mass 37 29.4 29
2 Affluent 11 8.7 9
3 Business 15 11.9 12
4 Totals 63 50 50
29 questionnaires were presented to the mass segment, 9 to the affluent segment and 12
to the business segment respectively.
3.6 Data Analysis
Before processing the responses, the completed questionnaires were edited for
completeness and consistency. The responses were grouped into various categories. Data
collected was purely quantitative and was analyzed by descriptive analysis. Descriptive
statistics such as frequency, mean, standard deviation range and standard error of mean
and sum were used to analyze the data. Tables were used to summarize responses for
further analysis and facilitate comparison. Inferential statistics i.e. Correlation and
ANOVA were used to analyze relationships among variables. Analysis was aided by
Statistical Package for Social Sciences (SPSS)
Graph on Gap analysis being an indication of the relationship between customer
satisfaction and service quality perception was plotted to indicate the trend of customer
satisfaction vis-à-vis quality perception. This was to determine the impact of service
quality perception on customer satisfaction.
24
CHAPTER FOUR: DATA ANALYSIS, FINDINGS AND
INTERPRETATION
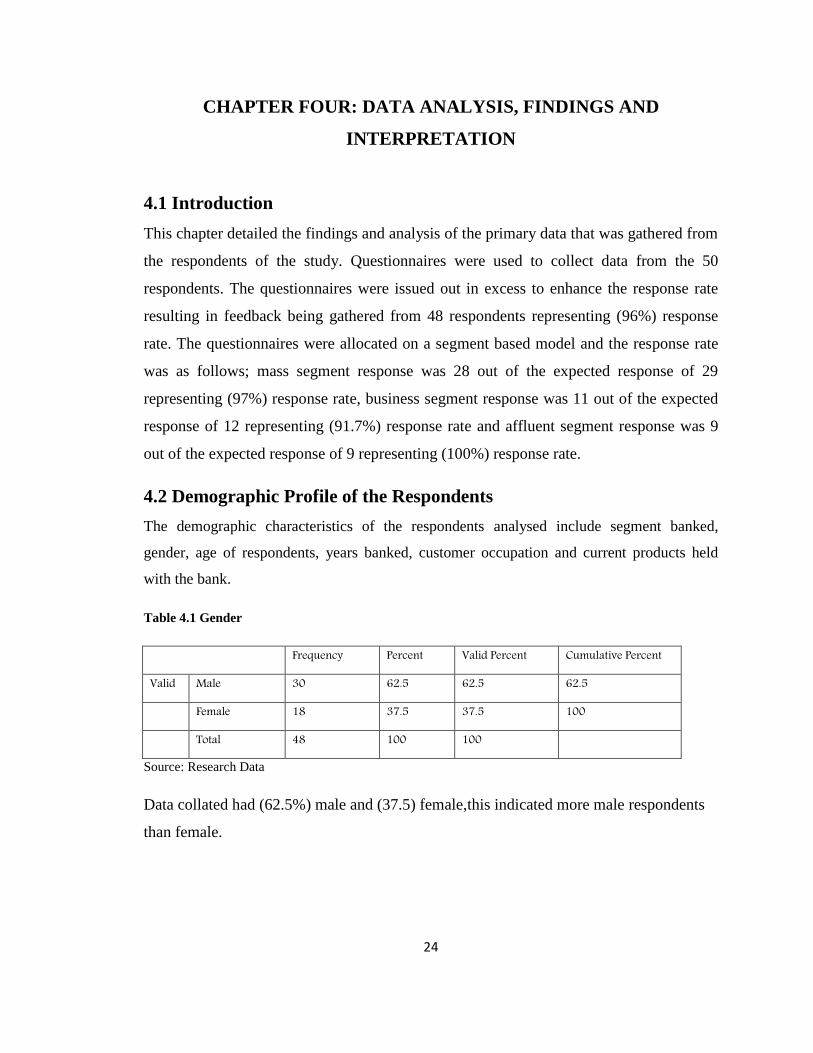
4.1 Introduction
This chapter detailed the findings and analysis of the primary data that was gathered from
the respondents of the study. Questionnaires were used to collect data from the 50
respondents. The questionnaires were issued out in excess to enhance the response rate
resulting in feedback being gathered from 48 respondents representing (96%) response
rate. The questionnaires were allocated on a segment based model and the response rate
was as follows; mass segment response was 28 out of the expected response of 29
representing (97%) response rate, business segment response was 11 out of the expected
response of 12 representing (91.7%) response rate and affluent segment response was 9
out of the expected response of 9 representing (100%) response rate.
4.2 Demographic Profile of the Respondents
The demographic characteristics of the respondents analysed include segment banked,
gender, age of respondents, years banked, customer occupation and current products held
with the bank.
Table 4.1 Gender
Frequency Percent Valid Percent Cumulative Percent
Valid Male 30 62.5 62.5 62.5
Female 18 37.5 37.5 100
Total 48 100 100
Source: Research Data
Data collated had (62.5%) male and (37.5) female,this indicated more male respondents
than female.
25
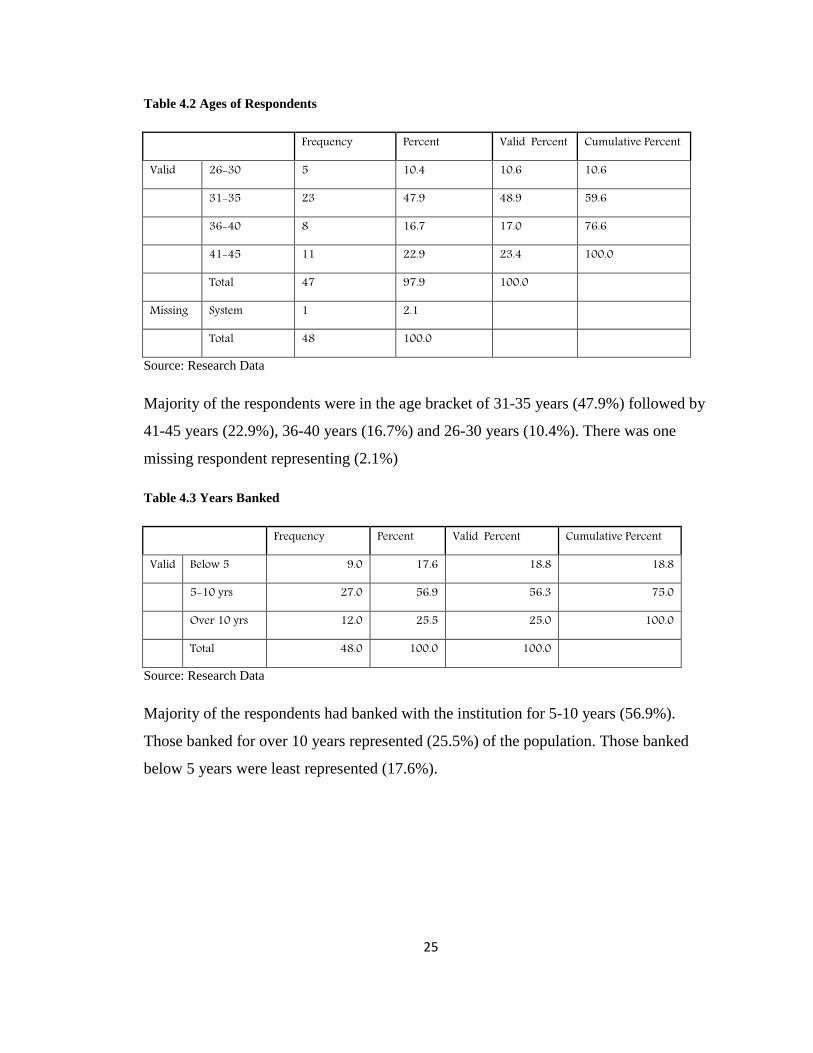
Table 4.2 Ages of Respondents
Frequency Percent Valid Percent Cumulative Percent
Valid 26-30 5 10.4 10.6 10.6
31-35 23 47.9 48.9 59.6
36-40 8 16.7 17.0 76.6
41-45 11 22.9 23.4 100.0
Total 47 97.9 100.0
Missing System 1 2.1
Total 48 100.0
Source: Research Data
Majority of the respondents were in the age bracket of 31-35 years (47.9%) followed by
41-45 years (22.9%), 36-40 years (16.7%) and 26-30 years (10.4%). There was one
missing respondent representing (2.1%)
Table 4.3 Years Banked
Frequency Percent Valid Percent Cumulative Percent
Valid Below 5 9.0 17.6 18.8 18.8
5-10 yrs 27.0 56.9 56.3 75.0
Over 10 yrs 12.0 25.5 25.0 100.0
Total 48.0 100.0 100.0
Source: Research Data
Majority of the respondents had banked with the institution for 5-10 years (56.9%).
Those banked for over 10 years represented (25.5%) of the population. Those banked
below 5 years were least represented (17.6%).
26
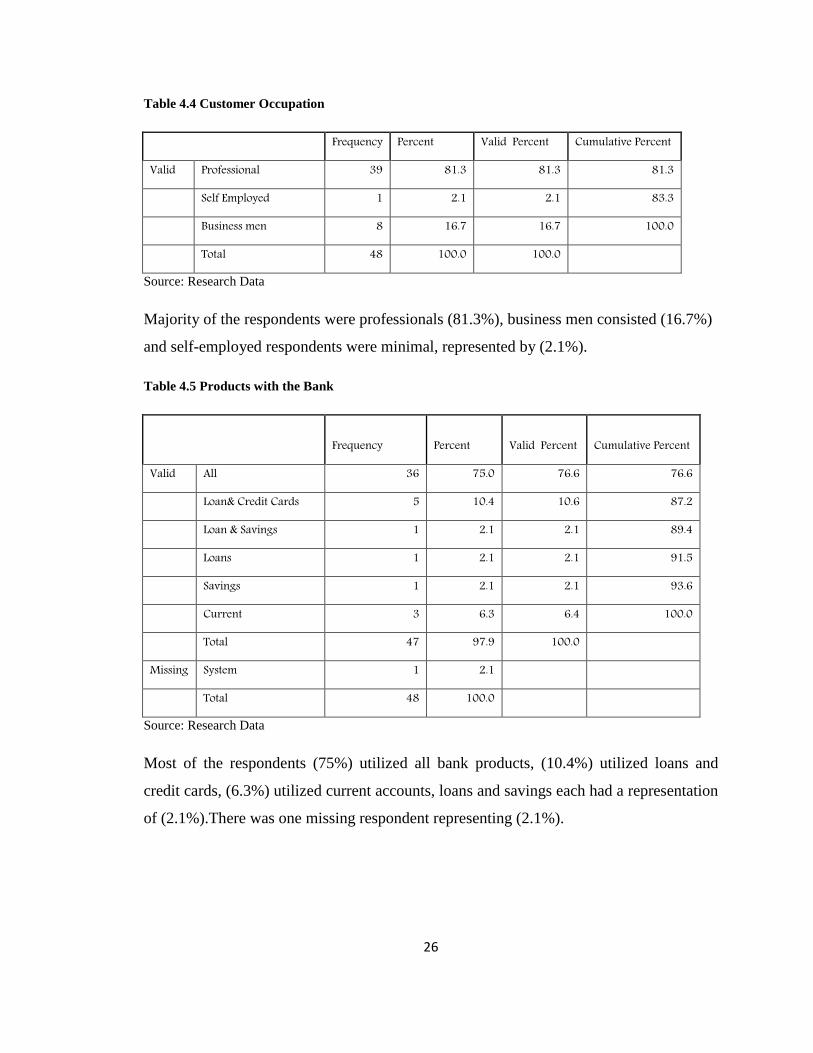
Table 4.4 Customer Occupation
Frequency Percent Valid Percent Cumulative Percent
Valid Professional 39 81.3 81.3 81.3
Self Employed 1 2.1 2.1 83.3
Business men 8 16.7 16.7 100.0
Total 48 100.0 100.0
Source: Research Data
Majority of the respondents were professionals (81.3%), business men consisted (16.7%)
and self-employed respondents were minimal, represented by (2.1%).
Table 4.5 Products with the Bank
Frequency Percent Valid Percent Cumulative Percent
Valid All 36 75.0 76.6 76.6
Loan& Credit Cards 5 10.4 10.6 87.2
Loan & Savings 1 2.1 2.1 89.4
Loans 1 2.1 2.1 91.5
Savings 1 2.1 2.1 93.6
Current 3 6.3 6.4 100.0
Total 47 97.9 100.0
Missing System 1 2.1
Total 48 100.0
Source: Research Data
Most of the respondents (75%) utilized all bank products, (10.4%) utilized loans and
credit cards, (6.3%) utilized current accounts, loans and savings each had a representation
of (2.1%).There was one missing respondent representing (2.1%).
27
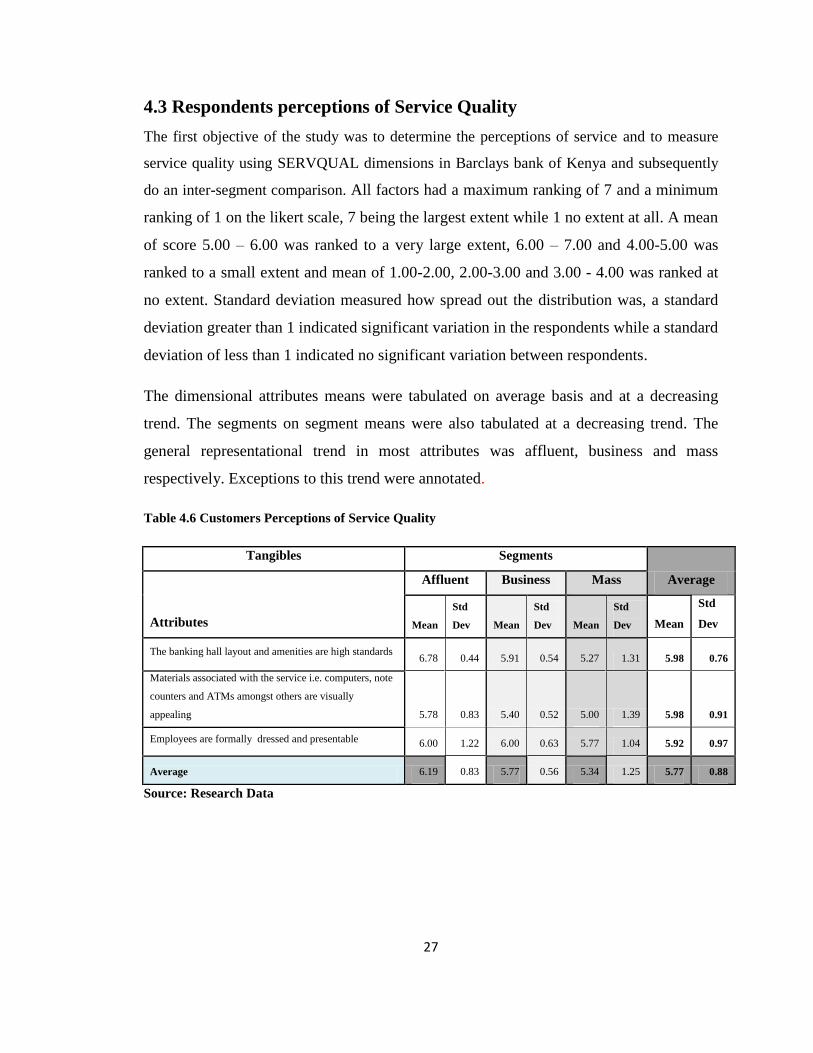
4.3 Respondents perceptions of Service Quality
The first objective of the study was to determine the perceptions of service and to measure
service quality using SERVQUAL dimensions in Barclays bank of Kenya and subsequently
do an inter-segment comparison. All factors had a maximum ranking of 7 and a minimum
ranking of 1 on the likert scale, 7 being the largest extent while 1 no extent at all. A mean
of score 5.00 – 6.00 was ranked to a very large extent, 6.00 – 7.00 and 4.00-5.00 was
ranked to a small extent and mean of 1.00-2.00, 2.00-3.00 and 3.00 - 4.00 was ranked at
no extent. Standard deviation measured how spread out the distribution was, a standard
deviation greater than 1 indicated significant variation in the respondents while a standard
deviation of less than 1 indicated no significant variation between respondents.
The dimensional attributes means were tabulated on average basis and at a decreasing
trend. The segments on segment means were also tabulated at a decreasing trend. The
general representational trend in most attributes was affluent, business and mass
respectively. Exceptions to this trend were annotated.
Table 4.6 Customers Perceptions of Service Quality
Tangibles Segments
Average
Attributes
Affluent Business Mass
Mean
Std
Dev Mean
Std
Dev Mean
Std
Dev Mean
Std
Dev
The banking hall layout and amenities are high standards 6.78 0.44 5.91 0.54 5.27 1.31 5.98 0.76
Materials associated with the service i.e. computers, note
counters and ATMs amongst others are visually
appealing 5.78 0.83 5.40 0.52 5.00 1.39 5.98 0.91
Employees are formally dressed and presentable 6.00 1.22 6.00 0.63 5.77 1.04 5.92 0.97
Average 6.19 0.83 5.77 0.56 5.34 1.25 5.77 0.88
Source: Research Data
28
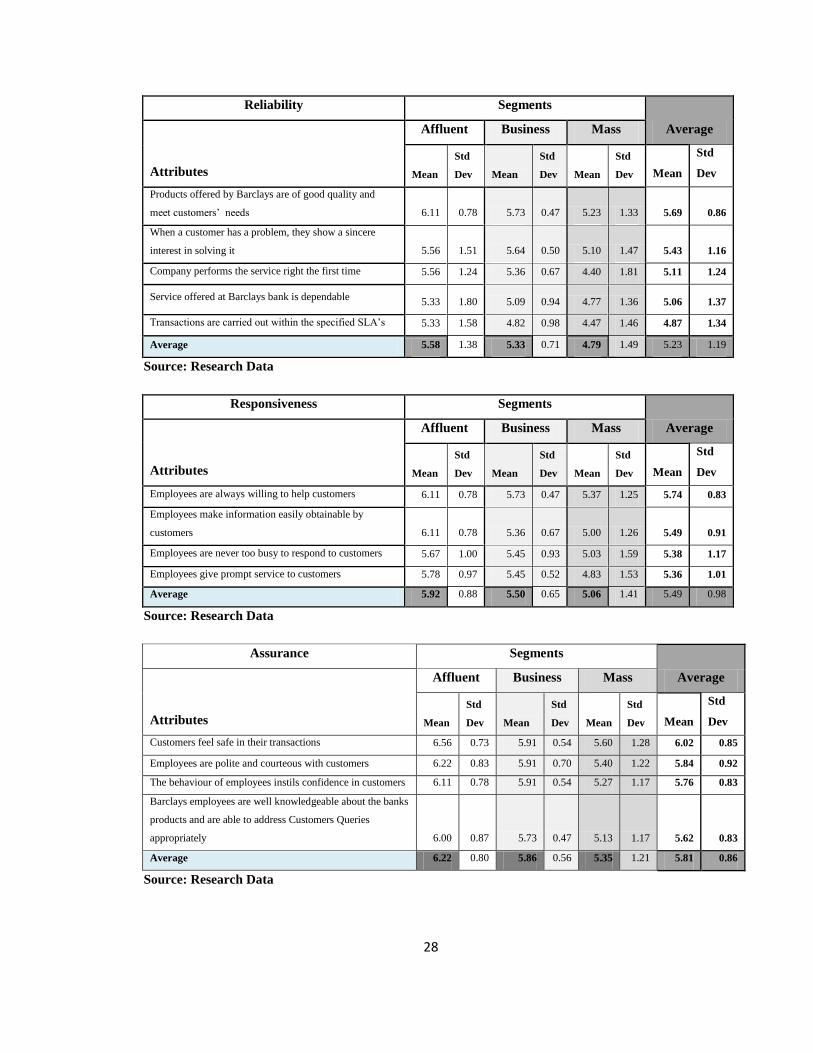
Reliability Segments
Average
Attributes
Affluent Business Mass
Mean
Std
Dev Mean
Std
Dev Mean
Std
Dev Mean
Std
Dev
Products offered by Barclays are of good quality and
meet customers’ needs 6.11 0.78 5.73 0.47 5.23 1.33 5.69 0.86
When a customer has a problem, they show a sincere
interest in solving it 5.56 1.51 5.64 0.50 5.10 1.47 5.43 1.16
Company performs the service right the first time 5.56 1.24 5.36 0.67 4.40 1.81 5.11 1.24
Service offered at Barclays bank is dependable 5.33 1.80 5.09 0.94 4.77 1.36 5.06 1.37
Transactions are carried out within the specified SLA’s 5.33 1.58 4.82 0.98 4.47 1.46 4.87 1.34
Average 5.58 1.38 5.33 0.71 4.79 1.49 5.23 1.19
Source: Research Data
Responsiveness Segments
Average
Attributes
Affluent Business Mass
Mean
Std
Dev Mean
Std
Dev Mean
Std
Dev Mean
Std
Dev
Employees are always willing to help customers 6.11 0.78 5.73 0.47 5.37 1.25 5.74 0.83
Employees make information easily obtainable by
customers 6.11 0.78 5.36 0.67 5.00 1.26 5.49 0.91
Employees are never too busy to respond to customers 5.67 1.00 5.45 0.93 5.03 1.59 5.38 1.17
Employees give prompt service to customers 5.78 0.97 5.45 0.52 4.83 1.53 5.36 1.01
Average 5.92 0.88 5.50 0.65 5.06 1.41 5.49 0.98
Source: Research Data
Assurance Segments
Average
Attributes
Affluent Business Mass
Mean
Std
Dev Mean
Std
Dev Mean
Std
Dev Mean
Std
Dev
Customers feel safe in their transactions 6.56 0.73 5.91 0.54 5.60 1.28 6.02 0.85
Employees are polite and courteous with customers 6.22 0.83 5.91 0.70 5.40 1.22 5.84 0.92
The behaviour of employees instils confidence in customers 6.11 0.78 5.91 0.54 5.27 1.17 5.76 0.83
Barclays employees are well knowledgeable about the banks
products and are able to address Customers Queries
appropriately 6.00 0.87 5.73 0.47 5.13 1.17 5.62 0.83
Average 6.22 0.80 5.86 0.56 5.35 1.21 5.81 0.86
Source: Research Data
29
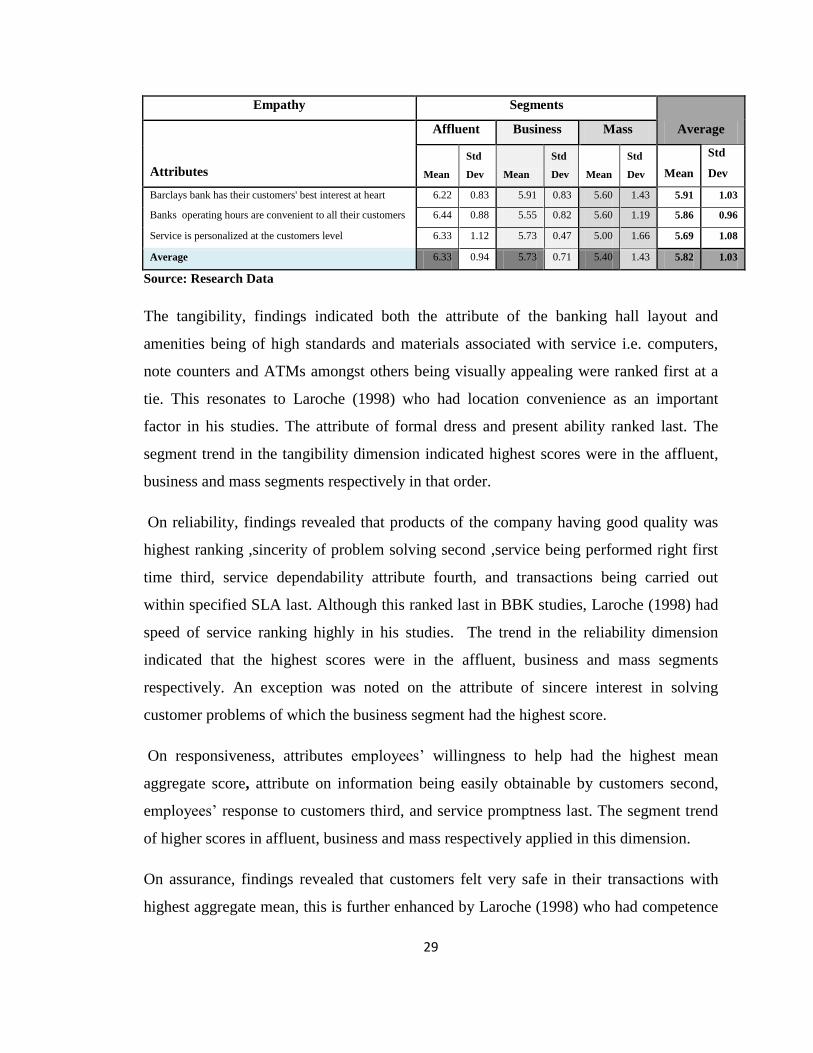
Empathy Segments
Average
Attributes
Affluent Business Mass
Mean
Std
Dev Mean
Std
Dev Mean
Std
Dev Mean
Std
Dev
Barclays bank has their customers' best interest at heart 6.22 0.83 5.91 0.83 5.60 1.43 5.91 1.03
Banks operating hours are convenient to all their customers 6.44 0.88 5.55 0.82 5.60 1.19 5.86 0.96
Service is personalized at the customers level 6.33 1.12 5.73 0.47 5.00 1.66 5.69 1.08
Average 6.33 0.94 5.73 0.71 5.40 1.43 5.82 1.03
Source: Research Data
The tangibility, findings indicated both the attribute of the banking hall layout and
amenities being of high standards and materials associated with service i.e. computers,
note counters and ATMs amongst others being visually appealing were ranked first at a
tie. This resonates to Laroche (1998) who had location convenience as an important
factor in his studies. The attribute of formal dress and present ability ranked last. The
segment trend in the tangibility dimension indicated highest scores were in the affluent,
business and mass segments respectively in that order.
On reliability, findings revealed that products of the company having good quality was
highest ranking ,sincerity of problem solving second ,service being performed right first
time third, service dependability attribute fourth, and transactions being carried out
within specified SLA last. Although this ranked last in BBK studies, Laroche (1998) had
speed of service ranking highly in his studies. The trend in the reliability dimension
indicated that the highest scores were in the affluent, business and mass segments
respectively. An exception was noted on the attribute of sincere interest in solving
customer problems of which the business segment had the highest score.
On responsiveness, attributes employees’ willingness to help had the highest mean
aggregate score, attribute on information being easily obtainable by customers second,
employees’ response to customers third, and service promptness last. The segment trend
of higher scores in affluent, business and mass respectively applied in this dimension.
On assurance, findings revealed that customers felt very safe in their transactions with
highest aggregate mean, this is further enhanced by Laroche (1998) who had competence
30
in the same category in his studies. Employees’ politeness to customers came in second,
employees instilling confidence third and knowledge ability of products to address
queries last. The segment trend of affluent, business and mass respectively was applicable
in this dimension.
On empathy, findings revealed that Barclays having customers interest ranked first,
convenience of the banking hours attribute ranked second and personalization of services
last. Applicable to this dimension was the segment trend of affluent, business and mass
respectively. Clifford and Russ (1994) in their study suggested that effective relationship
managers were to sell financial services institutions to various; geographically diverse,
affluent investors and this resonated with the BBK dimensional segment trends that
indicated superior service in the affluent segment.
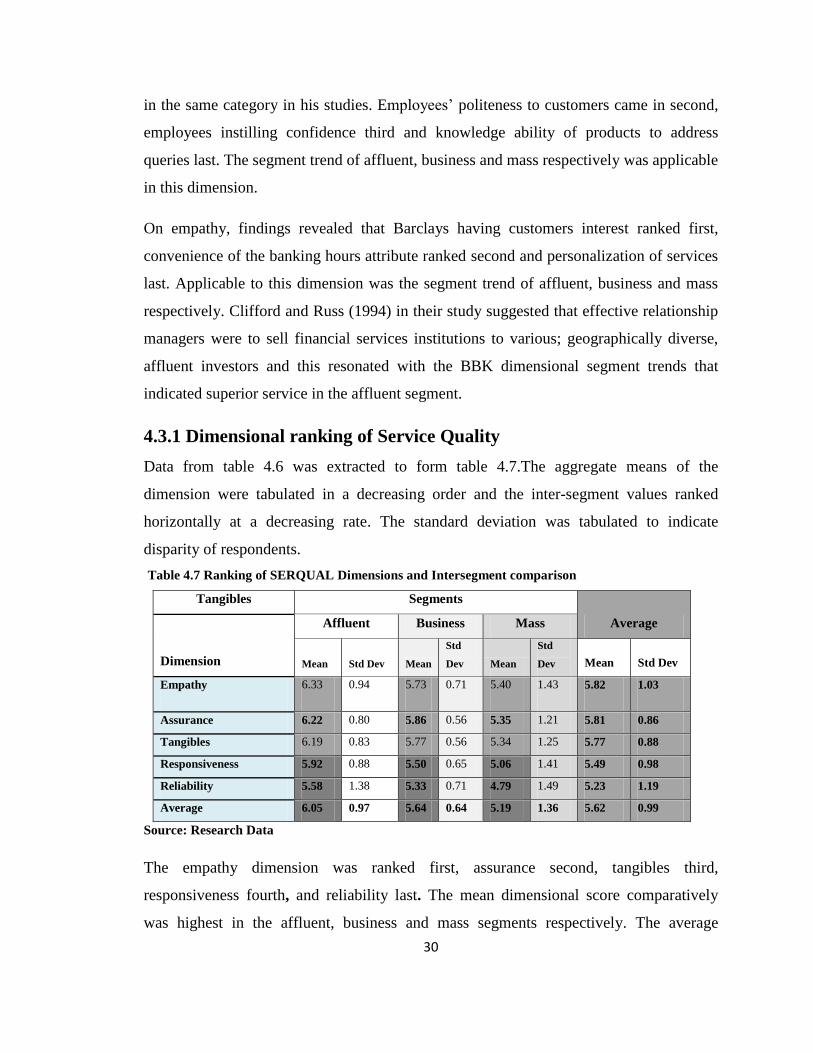
4.3.1 Dimensional ranking of Service Quality
Data from table 4.6 was extracted to form table 4.7.The aggregate means of the
dimension were tabulated in a decreasing order and the inter-segment values ranked
horizontally at a decreasing rate. The standard deviation was tabulated to indicate
disparity of respondents.
Table 4.7 Ranking of SERQUAL Dimensions and Intersegment comparison
Tangibles Segments
Average
Dimension
Affluent Business Mass
Mean Std Dev Mean
Std
Dev Mean
Std
Dev Mean Std Dev
Empathy 6.33 0.94 5.73 0.71 5.40 1.43 5.82 1.03
Assurance 6.22 0.80 5.86 0.56 5.35 1.21 5.81 0.86
Tangibles 6.19 0.83 5.77 0.56 5.34 1.25 5.77 0.88
Responsiveness 5.92 0.88 5.50 0.65 5.06 1.41 5.49 0.98
Reliability 5.58 1.38 5.33 0.71 4.79 1.49 5.23 1.19
Average 6.05 0.97 5.64 0.64 5.19 1.36 5.62 0.99
Source: Research Data
The empathy dimension was ranked first, assurance second, tangibles third,
responsiveness fourth, and reliability last. The mean dimensional score comparatively
was highest in the affluent, business and mass segments respectively. The average
31
standard deviation was highest in the mass and lowest on the affluent and business
segments in that order. In dissonance to BBK findings, study by Berry, (1994) with more
than 1,900 customers of five large famous US corporations, found that emphasis on the
dimensions on a decreasing order was most on reliability, followed by responsiveness,
assurance, empathy and tangibles. Thus, reliability was considered the essential core of
service quality. Further, they found that more companies were deficient in reliability than
in other service dimensions, but their best performance was on the least essential
dimensions of tangibles. Sudesh (2007) revealed that poor service quality in public sector
banks is mainly because of deficiencies in tangibility, lack of responsiveness and
empathy. Private sector banks, on the other hand, were found to be more reformed in this
respect. This was further supported by the BBK studies that indicated overall superior
service quality.
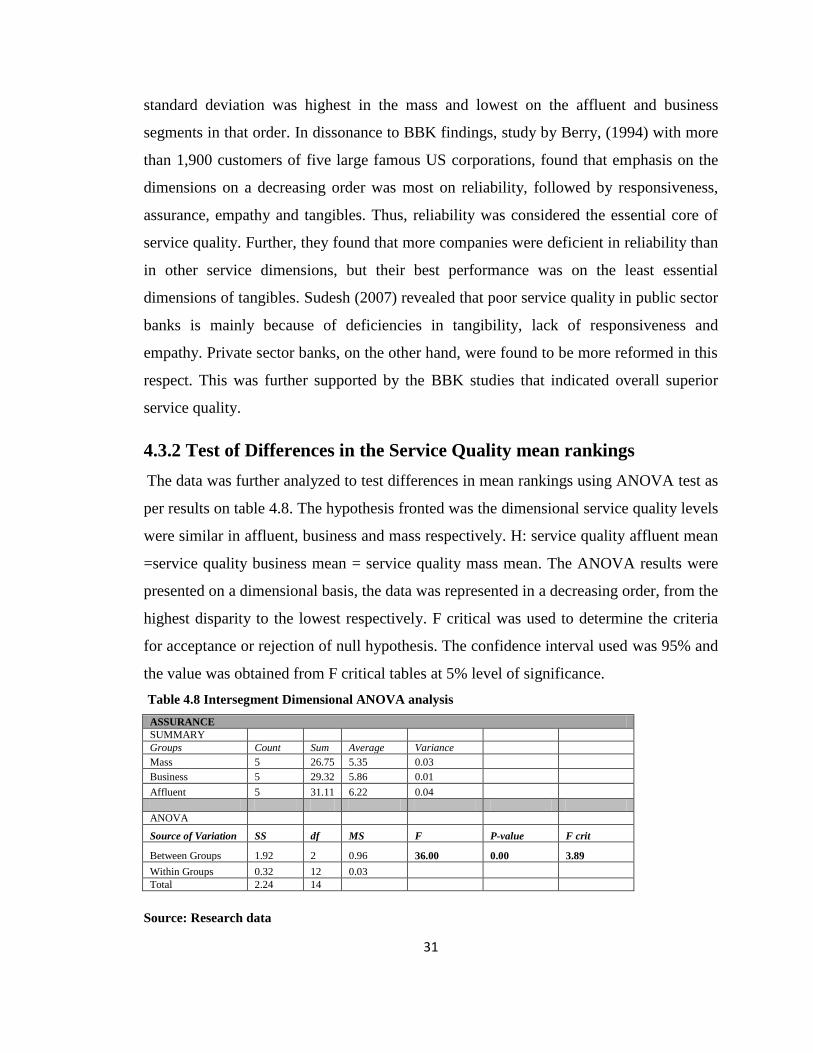
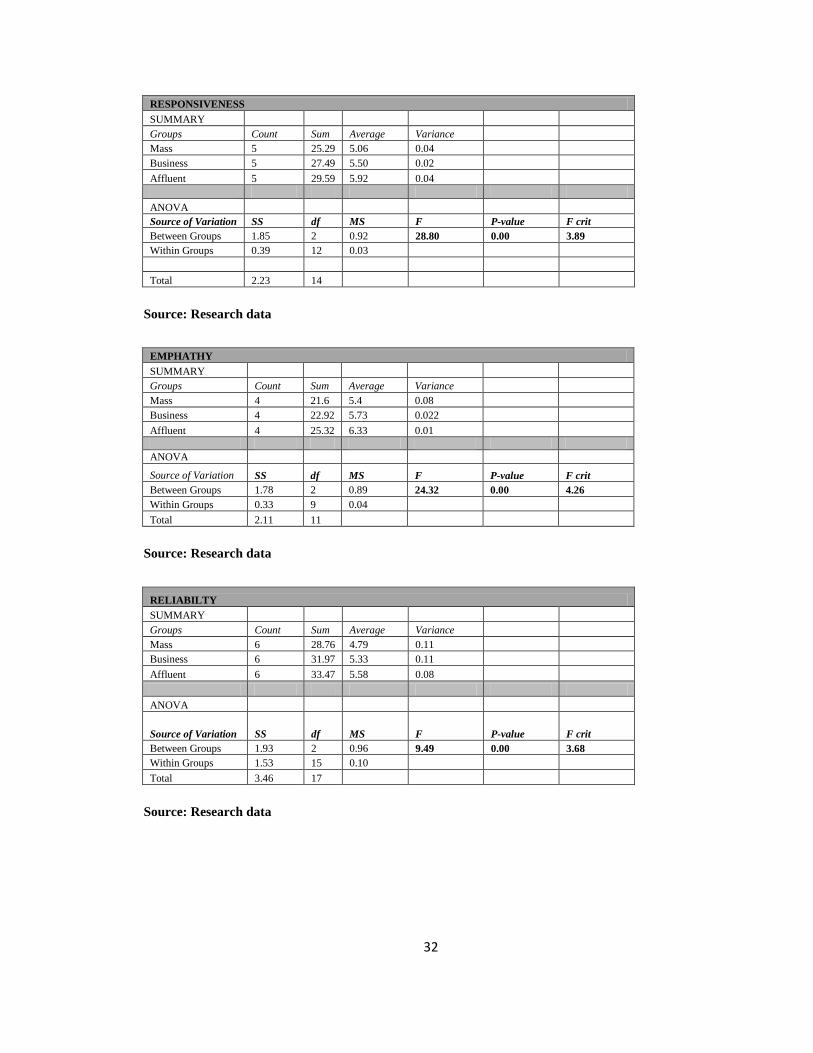
4.3.2 Test of Differences in the Service Quality mean rankings
The data was further analyzed to test differences in mean rankings using ANOVA test as
per results on table 4.8. The hypothesis fronted was the dimensional service quality levels
were similar in affluent, business and mass respectively. H: service quality affluent mean
=service quality business mean = service quality mass mean. The ANOVA results were
presented on a dimensional basis, the data was represented in a decreasing order, from the
highest disparity to the lowest respectively. F critical was used to determine the criteria
for acceptance or rejection of null hypothesis. The confidence interval used was 95% and
the value was obtained from F critical tables at 5% level of significance.
Table 4.8 Intersegment Dimensional ANOVA analysis
ASSURANCE
SUMMARY
Groups Count Sum Average Variance
Mass 5 26.75 5.35 0.03
Business 5 29.32 5.86 0.01
Affluent 5 31.11 6.22 0.04
ANOVA
Source of Variation SS df MS F P-value F crit
Between Groups 1.92 2 0.96 36.00 0.00 3.89
Within Groups 0.32 12 0.03
Total 2.24 14
Source: Research data
32
RESPONSIVENESS
SUMMARY
Groups Count Sum Average Variance
Mass 5 25.29 5.06 0.04
Business 5 27.49 5.50 0.02
Affluent 5 29.59 5.92 0.04
ANOVA
Source of Variation SS df MS F P-value F crit
Between Groups 1.85 2 0.92 28.80 0.00 3.89
Within Groups 0.39 12 0.03
Total 2.23 14
Source: Research data
EMPHATHY
SUMMARY
Groups Count Sum Average Variance
Mass 4 21.6 5.4 0.08
Business 4 22.92 5.73 0.022
Affluent 4 25.32 6.33 0.01
ANOVA
Source of Variation SS df MS F P-value F crit
Between Groups 1.78 2 0.89 24.32 0.00 4.26
Within Groups 0.33 9 0.04
Total 2.11 11
Source: Research data
RELIABILTY
SUMMARY
Groups Count Sum Average Variance
Mass 6 28.76 4.79 0.11
Business 6 31.97 5.33 0.11
Affluent 6 33.47 5.58 0.08
ANOVA
Source of Variation SS df MS F P-value F crit
Between Groups 1.93 2 0.96 9.49 0.00 3.68
Within Groups 1.53 15 0.10
Total 3.46 17
Source: Research data
33
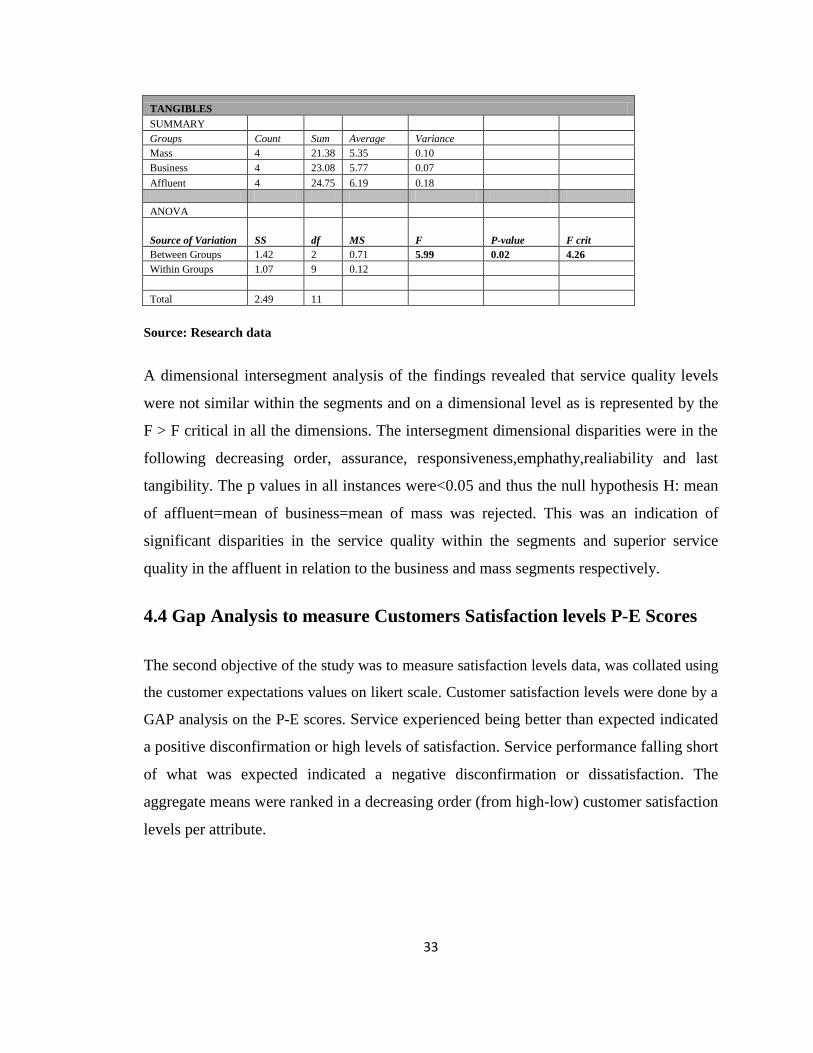
TANGIBLES
SUMMARY
Groups Count Sum Average Variance
Mass 4 21.38 5.35 0.10
Business 4 23.08 5.77 0.07
Affluent 4 24.75 6.19 0.18
ANOVA
Source of Variation SS df MS F P-value F crit
Between Groups 1.42 2 0.71 5.99 0.02 4.26
Within Groups 1.07 9 0.12
Total 2.49 11
Source: Research data
A dimensional intersegment analysis of the findings revealed that service quality levels
were not similar within the segments and on a dimensional level as is represented by the
F > F critical in all the dimensions. The intersegment dimensional disparities were in the
following decreasing order, assurance, responsiveness,emphathy,realiability and last
tangibility. The p values in all instances were<0.05 and thus the null hypothesis H: mean
of affluent=mean of business=mean of mass was rejected. This was an indication of
significant disparities in the service quality within the segments and superior service
quality in the affluent in relation to the business and mass segments respectively.
4.4 Gap Analysis to measure Customers Satisfaction levels P-E Scores
The second objective of the study was to measure satisfaction levels data, was collated using
the customer expectations values on likert scale. Customer satisfaction levels were done by a
GAP analysis on the P-E scores. Service experienced being better than expected indicated
a positive disconfirmation or high levels of satisfaction. Service performance falling short
of what was expected indicated a negative disconfirmation or dissatisfaction. The
aggregate means were ranked in a decreasing order (from high-low) customer satisfaction
levels per attribute.
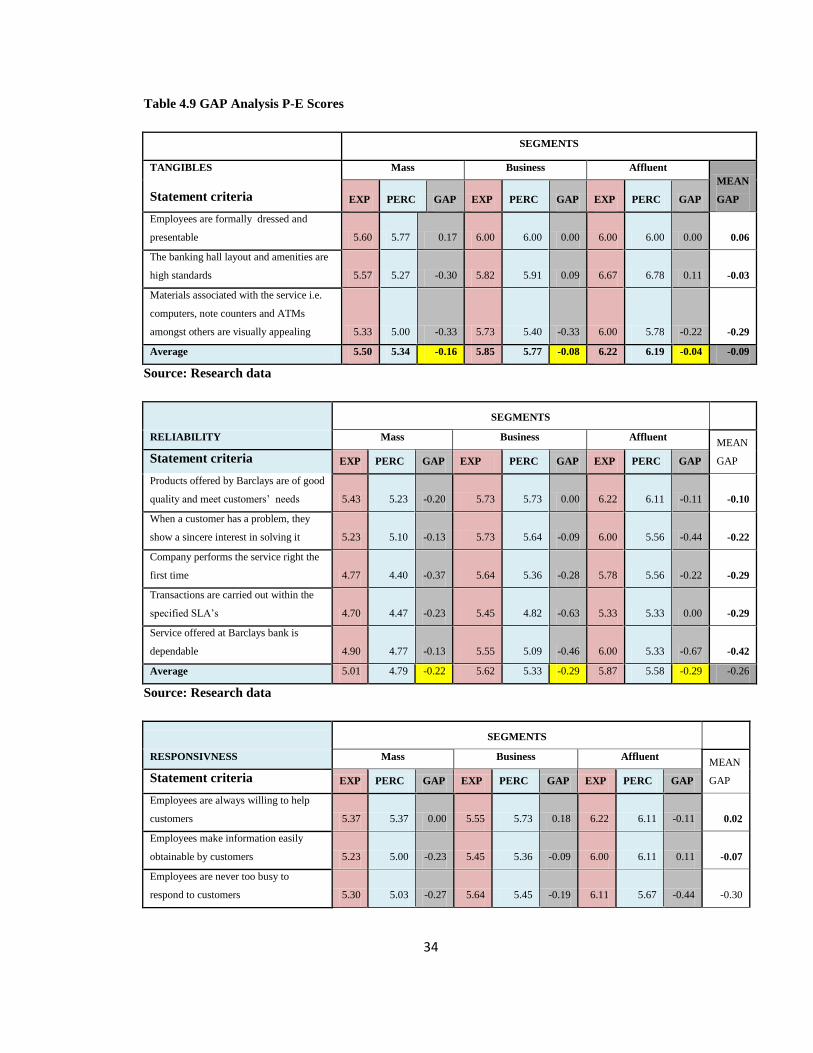
34
Table 4.9 GAP Analysis P-E Scores
SEGMENTS
TANGIBLES Mass Business Affluent
MEAN
GAP Statement criteria EXP PERC GAP EXP PERC GAP EXP PERC GAP
Employees are formally dressed and
presentable 5.60 5.77 0.17 6.00 6.00 0.00 6.00 6.00 0.00 0.06
The banking hall layout and amenities are
high standards 5.57 5.27 -0.30 5.82 5.91 0.09 6.67 6.78 0.11 -0.03
Materials associated with the service i.e.
computers, note counters and ATMs
amongst others are visually appealing 5.33 5.00 -0.33 5.73 5.40 -0.33 6.00 5.78 -0.22 -0.29
Average 5.50 5.34 -0.16 5.85 5.77 -0.08 6.22 6.19 -0.04 -0.09
Source: Research data
SEGMENTS
RELIABILITY Mass Business Affluent MEAN
GAP Statement criteria EXP PERC GAP EXP PERC GAP EXP PERC GAP
Products offered by Barclays are of good
quality and meet customers’ needs 5.43 5.23 -0.20 5.73 5.73 0.00 6.22 6.11 -0.11 -0.10
When a customer has a problem, they
show a sincere interest in solving it 5.23 5.10 -0.13 5.73 5.64 -0.09 6.00 5.56 -0.44 -0.22
Company performs the service right the
first time 4.77 4.40 -0.37 5.64 5.36 -0.28 5.78 5.56 -0.22 -0.29
Transactions are carried out within the
specified SLA’s 4.70 4.47 -0.23 5.45 4.82 -0.63 5.33 5.33 0.00 -0.29
Service offered at Barclays bank is
dependable 4.90 4.77 -0.13 5.55 5.09 -0.46 6.00 5.33 -0.67 -0.42
Average 5.01 4.79 -0.22 5.62 5.33 -0.29 5.87 5.58 -0.29 -0.26
Source: Research data
SEGMENTS
RESPONSIVNESS Mass Business Affluent MEAN
GAP Statement criteria EXP PERC GAP EXP PERC GAP EXP PERC GAP
Employees are always willing to help
customers 5.37 5.37 0.00 5.55 5.73 0.18 6.22 6.11 -0.11 0.02
Employees make information easily
obtainable by customers 5.23 5.00 -0.23 5.45 5.36 -0.09 6.00 6.11 0.11 -0.07
Employees are never too busy to
respond to customers 5.30 5.03 -0.27 5.64 5.45 -0.19 6.11 5.67 -0.44 -0.30
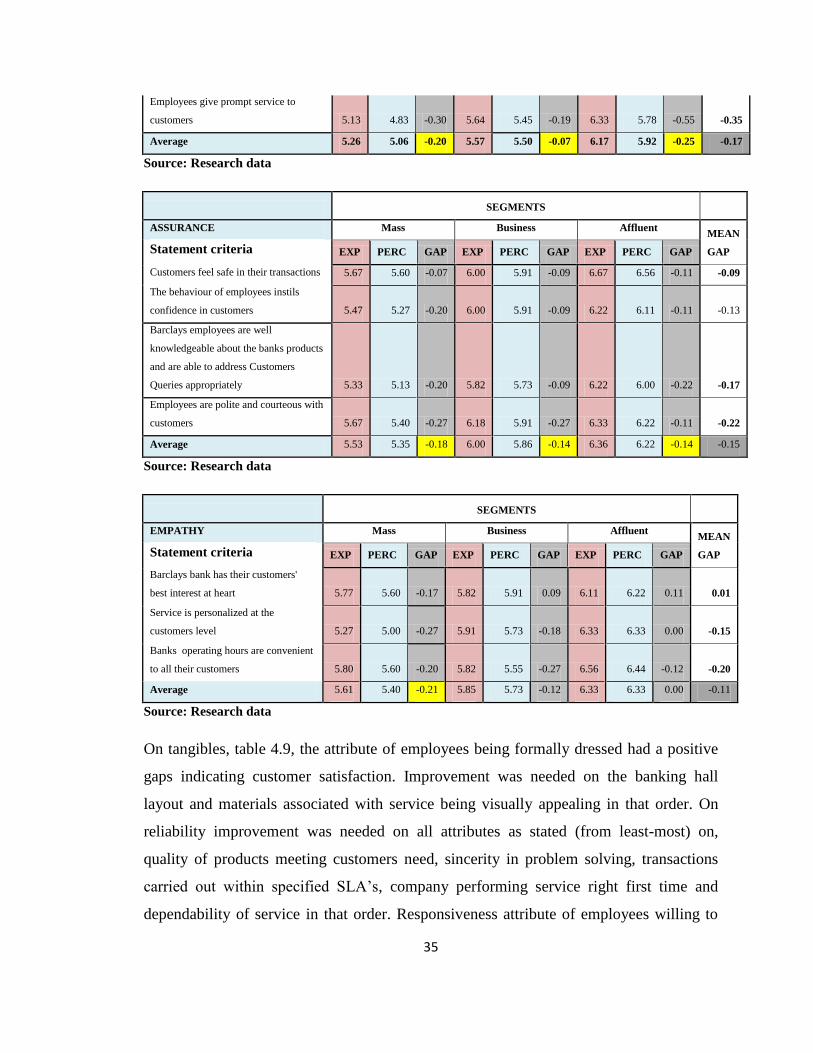
35
Employees give prompt service to
customers 5.13 4.83 -0.30 5.64 5.45 -0.19 6.33 5.78 -0.55 -0.35
Average 5.26 5.06 -0.20 5.57 5.50 -0.07 6.17 5.92 -0.25 -0.17
Source: Research data
SEGMENTS
ASSURANCE Mass Business Affluent MEAN
GAP Statement criteria EXP PERC GAP EXP PERC GAP EXP PERC GAP
Customers feel safe in their transactions 5.67 5.60 -0.07 6.00 5.91 -0.09 6.67 6.56 -0.11 -0.09
The behaviour of employees instils
confidence in customers 5.47 5.27 -0.20 6.00 5.91 -0.09 6.22 6.11 -0.11 -0.13
Barclays employees are well
knowledgeable about the banks products
and are able to address Customers
Queries appropriately 5.33 5.13 -0.20 5.82 5.73 -0.09 6.22 6.00 -0.22 -0.17
Employees are polite and courteous with
customers 5.67 5.40 -0.27 6.18 5.91 -0.27 6.33 6.22 -0.11 -0.22
Average 5.53 5.35 -0.18 6.00 5.86 -0.14 6.36 6.22 -0.14 -0.15
Source: Research data
SEGMENTS
EMPATHY Mass Business Affluent MEAN
GAP Statement criteria EXP PERC GAP EXP PERC GAP EXP PERC GAP
Barclays bank has their customers'
best interest at heart 5.77 5.60 -0.17 5.82 5.91 0.09 6.11 6.22 0.11 0.01
Service is personalized at the
customers level 5.27 5.00 -0.27 5.91 5.73 -0.18 6.33 6.33 0.00 -0.15
Banks operating hours are convenient
to all their customers 5.80 5.60 -0.20 5.82 5.55 -0.27 6.56 6.44 -0.12 -0.20
Average 5.61 5.40 -0.21 5.85 5.73 -0.12 6.33 6.33 0.00 -0.11
Source: Research data
On tangibles, table 4.9, the attribute of employees being formally dressed had a positive
gaps indicating customer satisfaction. Improvement was needed on the banking hall
layout and materials associated with service being visually appealing in that order. On
reliability improvement was needed on all attributes as stated (from least-most) on,
quality of products meeting customers need, sincerity in problem solving, transactions
carried out within specified SLA’s, company performing service right first time and
dependability of service in that order. Responsiveness attribute of employees willing to

36
help customers was satisfactory. Improvement was needed on all other attributes as
stated in a decreasing order (from least-most) on, obtainability of information,
responsiveness to customers and prompt service to customers. On Assurance
Improvement was needed on all other attributes as stated in a decreasing order (from
least-most) on, customers feeling safe in their transactions, behavior of employees
instilling confidence, knowledge ability of products, and employee’s politeness and
courtesy to customers. On empathy customers were satisfied with Barclays bank having
customers’ best interest at heart. Service personalization at customer level and
convenience of banking operating hours were unsatisfactory in that order.
On attribute analysis, the highest positive gaps indicating customer satisfaction were on
employees willingness to help customers in business segment (responsiveness), formal
dress on employees in mass segment (tangibles), banking layout and amenities standards
in affluent segment (tangibles) at a tie with Barclays bank having customers interest at
heart (empathy) in affluent segment, and banking layout and amenities standards in
business segment (tangibles) in that order, (from high-low) customer satisfaction. On the
aggregate gaps on attributes, positive gaps indicating customer satisfaction (from high to
low) were on formal dress (tangibles), employees’ willingness to help customers
(responsiveness) and Barclays having customers best interest at heart (empathy).
All other attributes had negative gaps (indicating customer dissatisfaction)with the
highest negative gaps in dependability of service (reliability) in affluent segment,
transactions being carried out within specified SLA’s (reliability) in business segment,
prompt service to customers (responsiveness) in affluent segment and employees never
too busy to respond to customers in affluent segment at a tie with sincere interest towards
problem solving in affluent segment (responsiveness)(reliability) in that order,( from
high-low)levels of customer satisfaction respectively. On aggregate gaps majority of the
attributes had negative gaps (indicating overall dissatisfaction).
Nil gaps represented zero disconfirmation results when perceived performance just met
the customer’s expectations or when the service experience was much as expected in the
customers. Such gaps were on were on willingness to help customers(responsiveness)and

37
employee formal dress (tangibles) in mass segment, quality of products (reliability) and
formal dress(tangibles) in business segment, transactions carried out within
SLA’s(reliability) and service personalized(empathy) at customers’ level in affluent
segment. On a dimensional analysis all other SERVQUAL dimensions had negative
scores with empathy having a nil mean gap (0.00).
4.4.1 Test of Differences in P-E GAP Rankings
The data was further analyzed to test the differences in the GAP mean rankings using
ANOVA test. The results were as presented on table 4.10. The hypothesis fronted was the
dimensional service quality levels were similar in affluent, business and mass
respectively H: Gap affluent mean =Gap business mean = Gap mass mean. The ANOVA
results are presented in a decreasing order, on a dimensional basis from the highest
disparity to the lowest respectively.
Table 4.10 Intersegments Dimensional ANOVA
EMPATHY
SUMMARY
Groups Count Sum Average Variance
Mass 3.00 -0.64 -0.21 0.00
Business 3.00 -0.36 -0.12 0.04
Affluent 3.00 -0.01 0.00 0.01
ANOVA
Source of Variation SS df MS F P-value F crit
Between Groups 0.07 2.00 0.03 1.95 0.22 5.14
Within Groups 0.10 6.00 0.02
Total 0.17 8.00
Source: Research Data
RESPONSIVENESS
SUMMARY
Groups Count Sum Average Variance
Mass 4.00 -0.80 -0.20 0.02
Business 4.00 -0.29 -0.07 0.03
Affluent 4.00 -0.99 -0.25 0.09
ANOVA
Source of Variation SS df MS F P-value F crit
Between Groups 0.07 2.00 0.03 0.70 0.52 4.26
Within Groups 0.42 9.00 0.05
Total 0.49 11.00
Source: Research Data
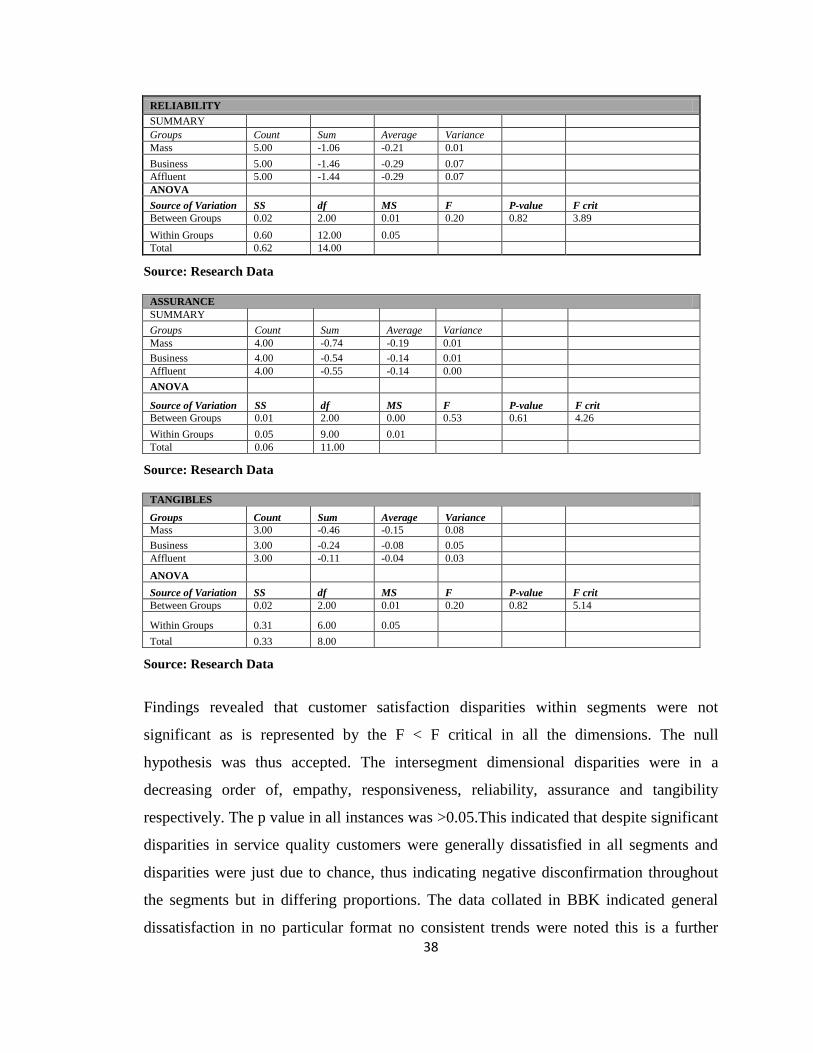
38
RELIABILITY
SUMMARY
Groups Count Sum Average Variance
Mass 5.00 -1.06 -0.21 0.01
Business 5.00 -1.46 -0.29 0.07
Affluent 5.00 -1.44 -0.29 0.07
ANOVA
Source of Variation SS df MS F P-value F crit
Between Groups 0.02 2.00 0.01 0.20 0.82 3.89
Within Groups 0.60 12.00 0.05
Total 0.62 14.00
Source: Research Data
ASSURANCE
SUMMARY
Groups Count Sum Average Variance
Mass 4.00 -0.74 -0.19 0.01
Business 4.00 -0.54 -0.14 0.01
Affluent 4.00 -0.55 -0.14 0.00
ANOVA
Source of Variation SS df MS F P-value F crit
Between Groups 0.01 2.00 0.00 0.53 0.61 4.26
Within Groups 0.05 9.00 0.01
Total 0.06 11.00
Source: Research Data
TANGIBLES
Groups Count Sum Average Variance
Mass 3.00 -0.46 -0.15 0.08
Business 3.00 -0.24 -0.08 0.05
Affluent 3.00 -0.11 -0.04 0.03
ANOVA
Source of Variation SS df MS F P-value F crit
Between Groups 0.02 2.00 0.01 0.20 0.82 5.14
Within Groups 0.31 6.00 0.05
Total 0.33 8.00
Source: Research Data
Findings revealed that customer satisfaction disparities within segments were not
significant as is represented by the F < F critical in all the dimensions. The null
hypothesis was thus accepted. The intersegment dimensional disparities were in a
decreasing order of, empathy, responsiveness, reliability, assurance and tangibility
respectively. The p value in all instances was >0.05.This indicated that despite significant
disparities in service quality customers were generally dissatisfied in all segments and
disparities were just due to chance, thus indicating negative disconfirmation throughout
the segments but in differing proportions. The data collated in BBK indicated general
dissatisfaction in no particular format no consistent trends were noted this is a further
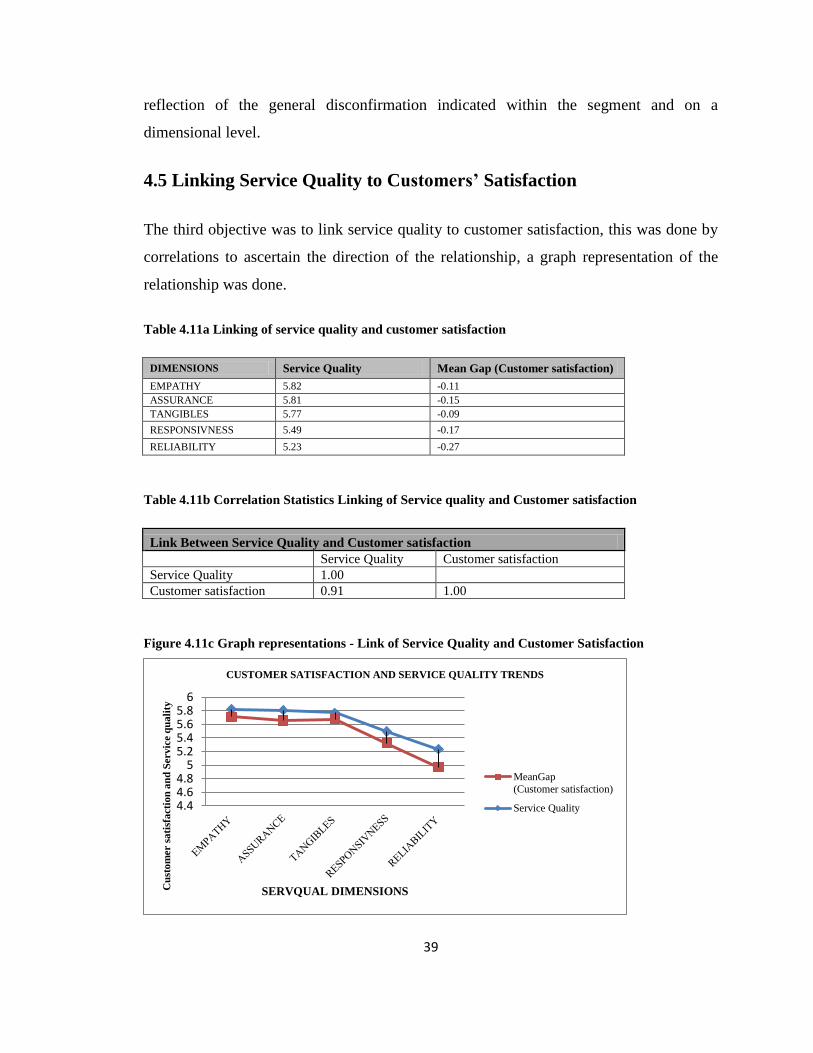
39
reflection of the general disconfirmation indicated within the segment and on a
dimensional level.
4.5 Linking Service Quality to Customers’ Satisfaction
The third objective was to link service quality to customer satisfaction, this was done by
correlations to ascertain the direction of the relationship, a graph representation of the
relationship was done.
Table 4.11a Linking of service quality and customer satisfaction
DIMENSIONS Service Quality Mean Gap (Customer satisfaction)
EMPATHY 5.82 -0.11
ASSURANCE 5.81 -0.15
TANGIBLES 5.77 -0.09
RESPONSIVNESS 5.49 -0.17
RELIABILITY 5.23 -0.27
Table 4.11b Correlation Statistics Linking of Service quality and Customer satisfaction
Link Between Service Quality and Customer satisfaction
Service Quality Customer satisfaction
Service Quality 1.00
Customer satisfaction 0.91 1.00
Figure 4.11c Graph representations - Link of Service Quality and Customer Satisfaction
4.44.64.8
55.25.45.65.8
6
Cu
sto
mer s
ati
sfa
cti
on
an
d S
ervic
e q
ua
lity
SERVQUAL DIMENSIONS
CUSTOMER SATISFACTION AND SERVICE QUALITY TRENDS
MeanGap
(Customer satisfaction)
Service Quality
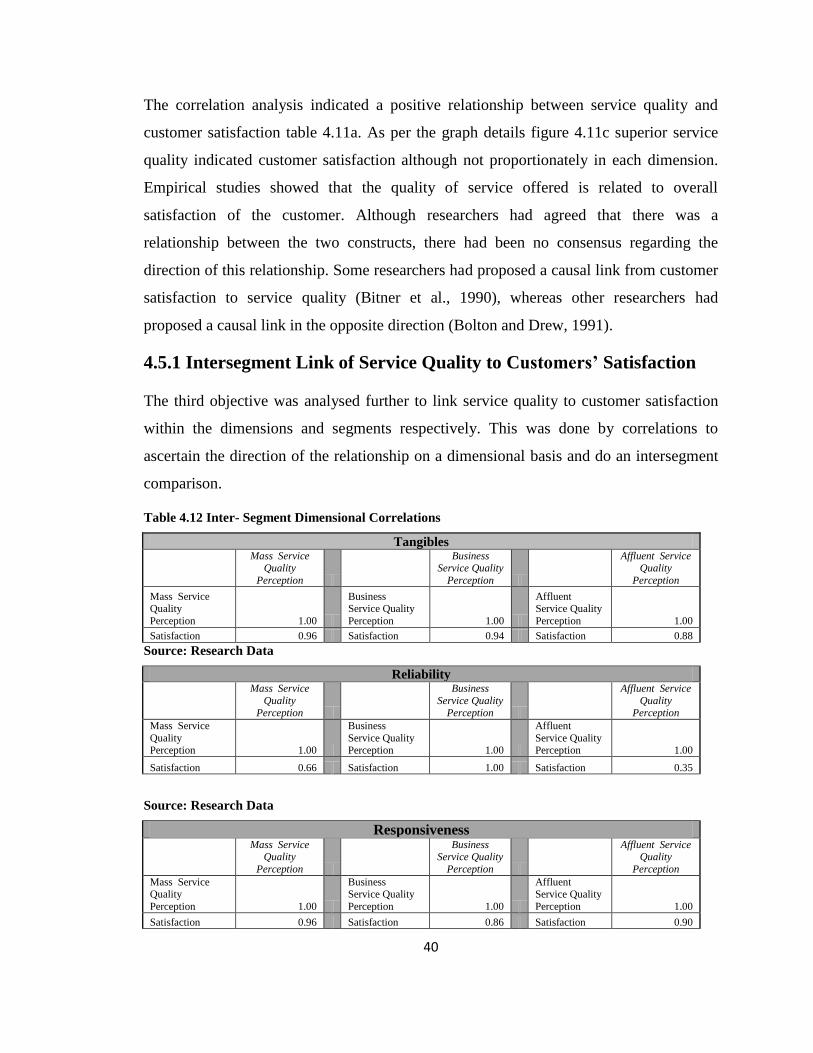
40
The correlation analysis indicated a positive relationship between service quality and
customer satisfaction table 4.11a. As per the graph details figure 4.11c superior service
quality indicated customer satisfaction although not proportionately in each dimension.
Empirical studies showed that the quality of service offered is related to overall
satisfaction of the customer. Although researchers had agreed that there was a
relationship between the two constructs, there had been no consensus regarding the
direction of this relationship. Some researchers had proposed a causal link from customer
satisfaction to service quality (Bitner et al., 1990), whereas other researchers had
proposed a causal link in the opposite direction (Bolton and Drew, 1991).
4.5.1 Intersegment Link of Service Quality to Customers’ Satisfaction
The third objective was analysed further to link service quality to customer satisfaction
within the dimensions and segments respectively. This was done by correlations to
ascertain the direction of the relationship on a dimensional basis and do an intersegment
comparison.
Table 4.12 Inter- Segment Dimensional Correlations
Tangibles
Mass Service Quality
Perception
Business Service Quality
Perception
Affluent Service Quality
Perception
Mass Service Quality
Perception 1.00
Business Service Quality
Perception 1.00
Affluent Service Quality
Perception 1.00
Satisfaction 0.96 Satisfaction 0.94 Satisfaction 0.88
Source: Research Data
Reliability
Mass Service
Quality
Perception
Business
Service Quality
Perception
Affluent Service
Quality
Perception
Mass Service
Quality Perception 1.00
Business
Service Quality Perception 1.00
Affluent
Service Quality Perception 1.00
Satisfaction 0.66 Satisfaction 1.00 Satisfaction 0.35
Source: Research Data
Responsiveness
Mass Service Quality
Perception
Business Service Quality
Perception
Affluent Service Quality
Perception
Mass Service Quality
Perception 1.00
Business Service Quality
Perception 1.00
Affluent Service Quality
Perception 1.00
Satisfaction 0.96 Satisfaction 0.86 Satisfaction 0.90
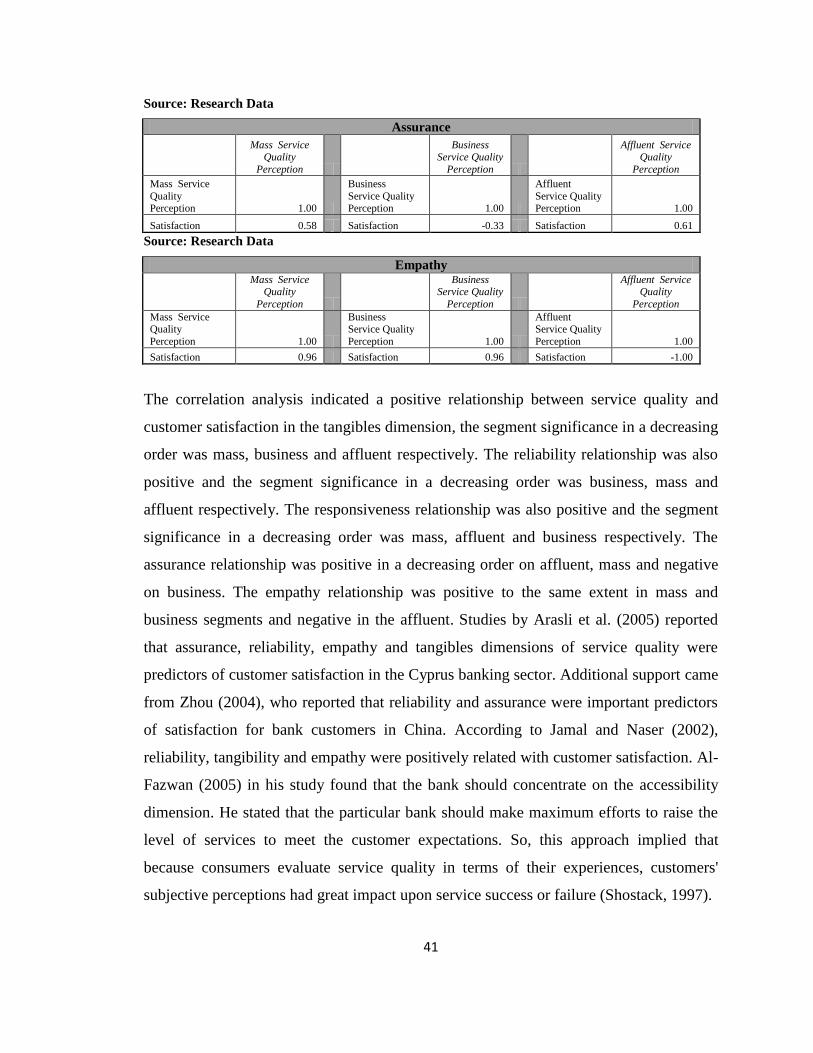
41
Source: Research Data
Assurance
Mass Service Quality
Perception
Business Service Quality
Perception
Affluent Service Quality
Perception
Mass Service
Quality Perception 1.00
Business
Service Quality Perception 1.00
Affluent
Service Quality Perception 1.00
Satisfaction 0.58 Satisfaction -0.33 Satisfaction 0.61
Source: Research Data
Empathy
Mass Service Quality
Perception
Business Service Quality
Perception
Affluent Service Quality
Perception
Mass Service Quality
Perception 1.00
Business Service Quality
Perception 1.00
Affluent Service Quality
Perception 1.00
Satisfaction 0.96 Satisfaction 0.96 Satisfaction -1.00
The correlation analysis indicated a positive relationship between service quality and
customer satisfaction in the tangibles dimension, the segment significance in a decreasing
order was mass, business and affluent respectively. The reliability relationship was also
positive and the segment significance in a decreasing order was business, mass and
affluent respectively. The responsiveness relationship was also positive and the segment
significance in a decreasing order was mass, affluent and business respectively. The
assurance relationship was positive in a decreasing order on affluent, mass and negative
on business. The empathy relationship was positive to the same extent in mass and
business segments and negative in the affluent. Studies by Arasli et al. (2005) reported
that assurance, reliability, empathy and tangibles dimensions of service quality were
predictors of customer satisfaction in the Cyprus banking sector. Additional support came
from Zhou (2004), who reported that reliability and assurance were important predictors
of satisfaction for bank customers in China. According to Jamal and Naser (2002),
reliability, tangibility and empathy were positively related with customer satisfaction. Al-
Fazwan (2005) in his study found that the bank should concentrate on the accessibility
dimension. He stated that the particular bank should make maximum efforts to raise the
level of services to meet the customer expectations. So, this approach implied that
because consumers evaluate service quality in terms of their experiences, customers'
subjective perceptions had great impact upon service success or failure (Shostack, 1997).

42
CHAPTER FIVE: SUMMARY OF FINDINGS, CONCLUSIONS AND
RECOMMENDATIONS
5.1 Introduction
The specific objectives of this study were to measure service quality, determine customer
satisfaction using SERVQUAL dimensions, do inter segment comparison, and ultimately
link perceived service quality trends with customer satisfaction in Barclays bank of
Kenya. The data collated led to the following discussions, conclusions and
recommendations on these objectives.
5.2 Summary
Findings from the first objective which was to measure service quality using the
SERVQUAL dimensions in Barclays bank of Kenya and do inter-segments comparison
revealed that service quality was more superior in the affluent segment, average in the
business segment and inferior in the mass segment. Attributes that scored highest were
customers feeling safe in their transactions, Barclays having customers best interest at
heart, banking hall amenities being of high standards and materials associated with
service i.e. computers note counters among others being visually appealing. Attributes
with lowest scores were transactions not being carried out within specified SLA’s,
service not being dependable and Barclays not performing services right first time.
On segment to segment basis the highest scores on the affluent segment indicated that the
banking layout and amenities were of very high standards, customers felt very safe in
their transactions and the banking hours were convenient to customers. Service quality in
the mass market was inferior on the attribute of company performing service right the
first time, transactions being carried out within specified SLA’s and dependability of
service. The business generally had relatively average service quality in comparison to
the other segments.
The ranking of SERVQUAL dimensions was in the following order, empathy first,
assurance second, tangibles third, responsiveness fourth and reliability last. The

43
aggregate mean scores were highest in the affluent, business and mass segments
respectively indicating superior service in the affluent segment. The standard deviations
indicated a greater disparity on the mass segment respondents, business respondents had
least disparity in their views and the affluent disparity was average. ANOVA analysis
within the segments indicated disparities in service quality levels within the segments.
On the second objective to determine customer satisfaction and comparisons within
segments, findings revealed that customers were satisfied with employees willingness to
help customers in the business segment, formal dress on employees in the mass segment,
banking layout and amenities standards in the affluent segment, Barclays bank having
customers interest at heart in the affluent, and banking layout and amenities standards in
the business segment. On the aggregate all customers were generally satisfied with
formal dress, employee’s willingness to help customers, and Barclays having customers’
best interest at heart. On SERVQUAL dimension level customers were dissatisfied with
all dimensions with an exception of empathy that indicated the expectations just met the
customer perceptions thus customers were just satisfied. ANOVA analysis indicated
insignificant disparities between customer satisfaction levels and thus indicating no
specific segment with superior customer satisfaction, necessitating improvement on
customer satisfaction.
The third objective was to link perceived service quality trends with customer
satisfaction, correlation findings revealed that service quality has a positive relationship
with customer satisfaction. A graph representation indicated that the relationship was not
proportionate on a dimensional basis. Further analysis indicated that the relationship was
not proportionate as indicated by the disparities in the correlation co-efficient on each
dimension and on a segment to segment basis.
5.3 Conclusions
The study sought to assess the service quality and customer satisfactions in Barclays bank in
Kenya and do inter segment comparison. The findings indicated that customers perceived
service quality to be relatively superior the affluent segment on a significant level. The mass
segment viewed services to be inferior to other segments. On dimension basis empathy,
44
assurance and tangibles dimensions were ranked very highly and improvement needed on
the reliability and responsiveness. Customers were satisfied with formal dress;
employees’ willingness to help customers and Barclays having customers’ best interest at
heart, improvement was needed on all the other attributes. On SERVQUAL dimension
level customers were dissatisfied with all dimensions with an exception of empathy on
this the expectations were just met. Customer satisfaction levels are positively linked to
service quality but not proportionately.
5.4 Recommendations
Service quality is generally good in Barclays bank of Kenya but there is need for
improvement as customers are not satisfied in most areas. More can be done to exceed
customers satisfaction on all the dimensions of service quality i.e. tangibility, reliability,
responsiveness, assurance and empathy. Segmentation has really improved service
quality especially in the affluent segment as per indication of superior service. The mass
segment needs to be addressed especially on the reliability dimension. The affluent
segment is very sensitive, despite service quality being high this segment needs a lot of
personalized service and expectations are relatively high. In the business segment
transactions’ being done within SLA’s is critical and should be adhered to.
5.5 Limitations of the Study
There was a delayed response and researcher had to increase the number of questionnaires
distributed to increase the response rate. Some respondents were reluctant to participate in the
research and had to be convinced that it was an academic exercise. Some respondents were
asking too many questions on the study and did not end up filling the questionnaires this was
time wasted for the researcher. The questions were too many and this made the segment
comparison tiring and rigorous.
5.6 Suggestions for further study
Segmentation was limited to three i.e. affluent mass and business respectively, the study
revealed that this is such a high level demarcation and with the availability of time and
resources the customer portfolio may be segmented further forming a new base of further
study.
45
REFERENCES
Al-Fazwan (2005) “Assessing Service Quality in a Saudi Bank”, Journal of King Saud
University,Vol 18, eng.sci (1), pp.101-115.
Anderson, E. W. and Sullivan, M. W. (1993), “The antecedents and consequences of
customer satisfaction for firms”, Marketing Science, 12(2): 125-143.
Andreassen, T.W. and Olsen, L.L. (2008). The impact of customers’ perception of
varying degrees of customer service on commitment and perceived relative
attractiveness. Managing Service Quality, Vol. 18, No. 4, and pp.309-28.
Arasli, H., Mehtap-Smadi, S. and Katircioglu, S. T. (2005) Customer service quality in
the Greek Cypriot banking industry, Managing Service Quality, 15 (1), pp. 41-56.
Asubonteng, P., McCleary, K.J. and Swan, J.E. (1996), “SERVQUAL revisited: a critical
review of service quality”, Journal of Services Marketing, Vol. 10, No. 6, pp. 62-81.
Babakus, E. and Mangold, G. (1992), “Adapting the SERVQUAL scale to hospital
services: an empirical investigation”, Health Services Research, 26(6): 767-85.
Barclays Bank Annual Report 2012.
Bei, L.T. and Shang, C. F. (2006) Building marketing strategies for state-owned
enterprises against private ones based on the perspectives of customer satisfaction and
service quality, Journal of Retailing and Consumer Services, 13 (1), pp. 1-13.
Bennett, D., and Higgins, M. (1988). Quality means more than smiles. ABA Banking
Journal, June, 46.
46
Berry, L.L., Parasuraman, A. and Zeitham, V. A. (1994), Improved service quality in
America: Lessons learned”, Academy of Management Executive, Vol. 8 No.2, pp. 32 –
52
Bick, G., Brown, A., and Abratt, R. (2004). Customer perceptions of the value delivered
by retail banks in South Africa. The International Journal of Bank Marketing, Vol. 22,
No. 4/5, pp. 300-18.
Blech, G. E. and B (Chaoprasert,C.,and Elsey,B.) (Chaoprasert,C.,and Elsey,B.,
2004)lech, M. A. (1993) Introduction to Advertising and Promotion. 2nd edn.Irwin,
Homewood.
Bowen, J.W., and Hedges, R.B. (1993). Increasing service quality in retail banking.
Journal of Retail Banking,Vol. 15, pp. 21-8
Brady, M. K. and Cronin Jr, J. J. (2001) some new thoughts on conceptualizing perceived
service quality: a hierarchical approach, Journal of Marketing, 65 (3), pp. 34-49.
Buttle, F. (1996) SERVQUAL: review, critique, research agenda, European Journal of
Marketing, 30 (1), pp. 8-32.
Carman, J.M. (1990), “Consumer perceptions of service quality: an assessment of the
SERVQUAL dimensions”, Journal of Retailing, 66 (1): 33-55.
CBK Bank Supervision Annual Report, 2009
Chaoprasert, C., and Elsey, B. (2004). Service quality improvement in Thai retail banking
and its management implications. ABAC Journal, Vol. 24, No. 1, pp. 47-66.
Cronin, J.J., and Taylor, S.A. (1992). Measuring service quality: a re-examination and
extension. Journal of Marketing, Vol. 56, No. 3, pp. 55-68
47
Cooper, D.R., and Schindler, P.S., (2003). Business research methods. (8th Ed.). Boston
Ding Hooi Ting (2004). Service quality and satisfaction perceptions: curvilinear and
interaction effect.International Journal of Bank Marketing, Vol. 22, Iss: 6, pp.407 – 420.
Grönroos, C. (1984). A Service Quality Model and Its Marketing Implications. European
Journal of Marketing. 18(4), pp. 36–44
Gronroos, C. (1990) Service Management and Marketing. Lexington Books
Hossain, M., and Sherloy, L. (2010). Customer Perception on Service Quality in Retail
Banking in Middle East:the Case of Qatar. International Journal of Islamic and Middle
Eastern Finance and Management, Vol. Volume,2, No. 4, pp. 338-350
Http://www.barclays.com/africa/kenya/index.php 4th April 2012.
Jamal, A. and Naser, K. (2002, p.146), “Customer satisfaction and retail banking: an
assessment of some of the key antecedents of customer satisfaction in retail banking”,
International Journal of Bank Marketing, Vol. 20:4, pp. 146-160.
Jain, S.K., and Gupta, G. (2004). Measuring service quality: SERVQUAL vs. SERVPERF
Scales. VIKALPA, 29 (2), 25-37.
Johnston, R. (1995) The determinants of service quality: satisfiers and dissatisfiers,
International Journal of Service Industry Management, 6 (5), pp. 53-71
Joshua A J, V Moli, P. Koshi (2005), “Expectation and perception of service quality in
old and new generation banks”, Indian Journal of Marketing, Vol.37(3), pp. 18.
Koushiki Choudhury(2007) , Journal of Asia-Pacific Business, Volume 8, Issue 4
December 2007 , pp 21 – 38.
Kotler, P. (2000). Marketing Management: Consumer Behavior pp 427-455. The
Millennium Edition. Upper saddle River: Prentice hall.
48
Kotler, P. and Armstrong, G. (2010) Principles of Marketing. 13th edn. London: Pearson
Lasser, W.M., Manolis, C., and Winsor, R.D. (2000). Service quality perspectives and
satisfaction in private banking. Journal of Services Marketing, Vol. 14, No. 3, pp. 244-71
L. L. Berry, V. A. Zeithaml and A. Parasuraman. Quality counts in services too. Business
Horizons. 1985, 31 (5): 46.
Lovelock, C. “An integrated approach to service management,” Service Marketing, 4th
edition Pearson Education (Singgpore) Pvt. Ltd., Delhi,pp15-17
M. R. Stafford. Demographic discriminators of service quality in banking. The Journal of
Services Marketing. 1996, 10 (4): 6-22.
Magori, (2011), Customers’ perceptions of the quality of services offered by Kenya
commercial bank branches in Nairobi Kenya, unpublished research report, University of
Nairobi
Oliva, T.A., Oliver, R.L., and MacMillan, I.C. (1992). A catastrophe model for
developing service satisfaction strategies. Journal of Marketing, Vol. 56, No. 3, pp. 83-95
Parasuraman, A., Zeithaml, V.A. and Berry, L.L. (1988), "SERVQUAL: a multi-item
scale for Quality, Vol. 11 Iss: 3, pp.150 – 152
Stafford, M.R. (1996). Demographic discriminators of service quality in the banking
industry. The Journal of Services Marketing, Vol. 10, No. 4, pp. 6–22
Sudesh (2007) “Service quality in banks-A study in Haryana and Chandigarh”, NICE
Journal of Business, 2(1), pp.55-65.

49
Sulieman (2011) Banking Service Quality Provided by Commercial Banks and Customer
Satisfaction ,American Journal of Scientific Research, ISSN 1450-223X Issue 27(2011),
pp. 68-83
The Kenyan Banker (2006), Going the extra mile in service.
Wisniewski, M. and Donnelly, M. (1996), “Measuring service quality in the public
sector: the potential for SERVQUAL”, Total Quality Management, Vol. 7 No. 4, pp. 357‐
65.
Zeithaml, V. A. and Bitner, M. J. (1996) Services marketing. New York: McGraw-Hill

50
APPENDIX I: QUESTIONNAIRE
INTRODUCTION
Please answer all the questions to the best of your knowledge. Your views, opinions and
evaluations are important in this research. Your individual responses will only be used to
compute percentages, proportions and average scores. Be assured that your responses will
be confidential and shall not be revealed to a third party.
SECTION A: DEMOGRAPHICS
1. Market Segment Banked?
Other, specify ………………………………………………………………
2. Gend
3. Please tick the age bracket in which you fall
– 40 years
- – 45 years
–
4. For how many years have you banked with Barclays?
- 10 years
5. Customer occupation?
Self-employed
6. Current products with the banks
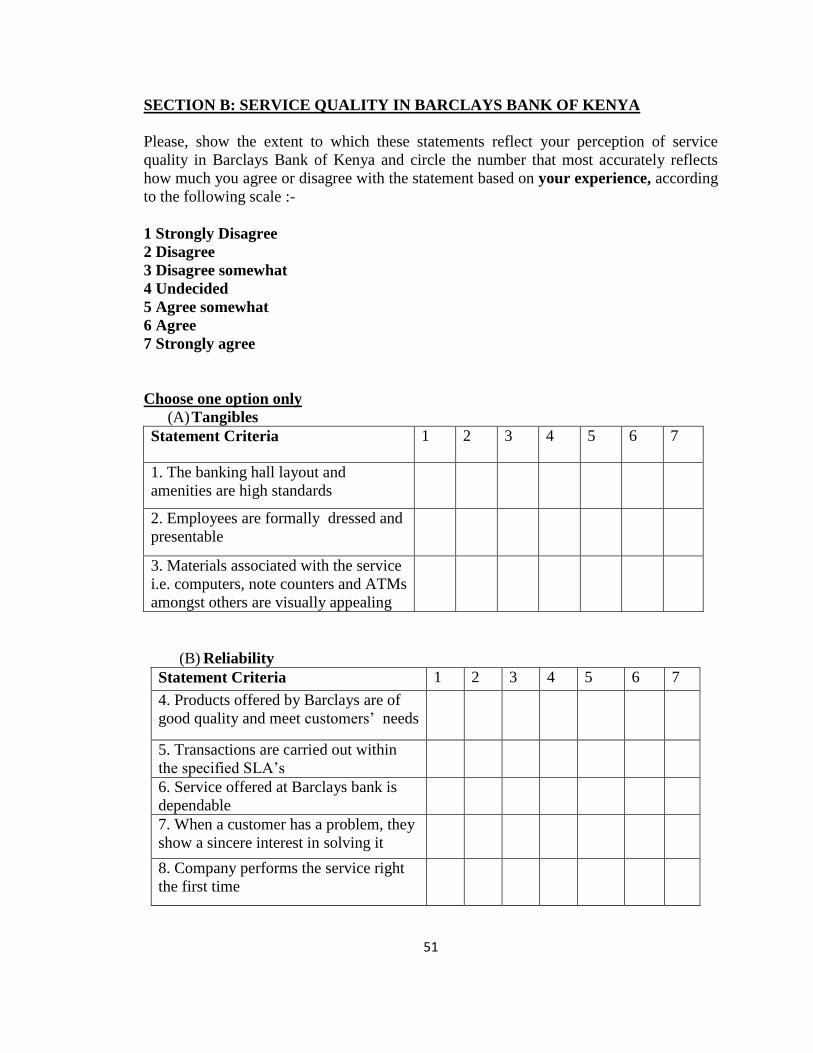
51
SECTION B: SERVICE QUALITY IN BARCLAYS BANK OF KENYA
Please, show the extent to which these statements reflect your perception of service
quality in Barclays Bank of Kenya and circle the number that most accurately reflects
how much you agree or disagree with the statement based on your experience, according
to the following scale :-
1 Strongly Disagree
2 Disagree
3 Disagree somewhat
4 Undecided
5 Agree somewhat
6 Agree
7 Strongly agree
Choose one option only
(A) Tangibles
Statement Criteria 1 2 3 4 5 6 7
1. The banking hall layout and
amenities are high standards
2. Employees are formally dressed and
presentable
3. Materials associated with the service
i.e. computers, note counters and ATMs
amongst others are visually appealing
(B) Reliability
Statement Criteria 1 2 3 4 5 6 7
4. Products offered by Barclays are of
good quality and meet customers’ needs
5. Transactions are carried out within
the specified SLA’s
6. Service offered at Barclays bank is
dependable
7. When a customer has a problem, they
show a sincere interest in solving it
8. Company performs the service right
the first time
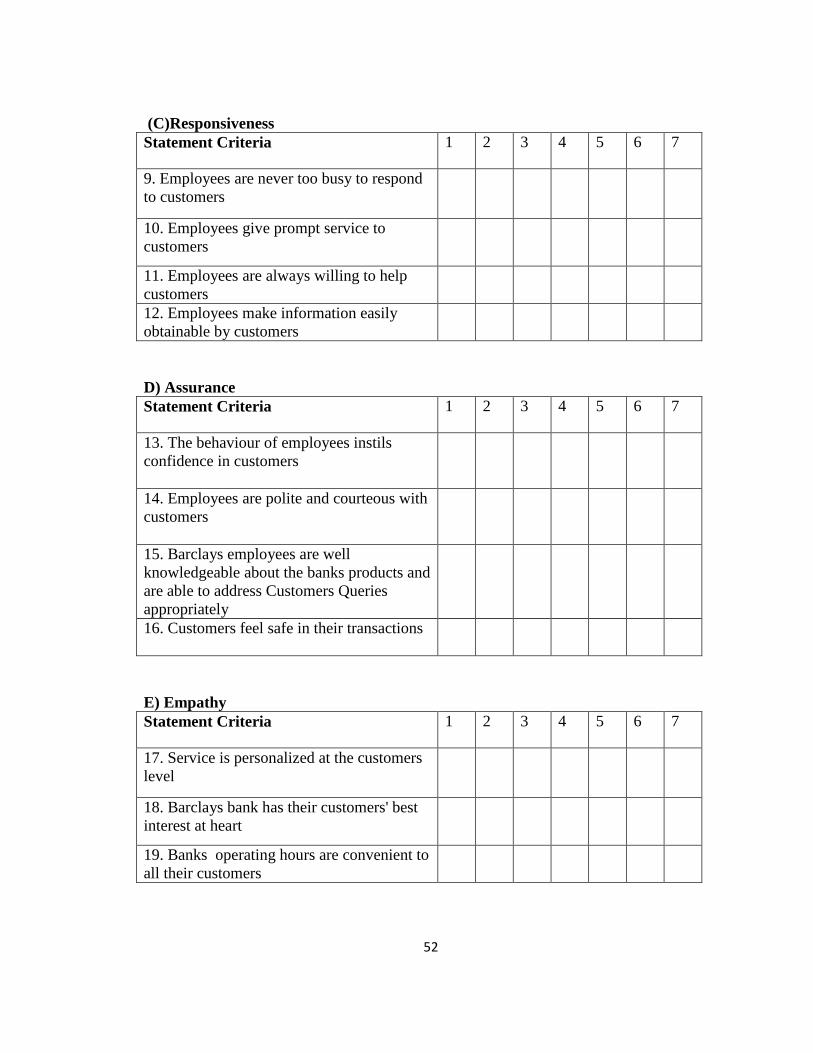
52
(C)Responsiveness
Statement Criteria 1 2 3 4 5 6 7
9. Employees are never too busy to respond
to customers
10. Employees give prompt service to
customers
11. Employees are always willing to help
customers
12. Employees make information easily
obtainable by customers
D) Assurance
Statement Criteria 1 2 3 4 5 6 7
13. The behaviour of employees instils
confidence in customers
14. Employees are polite and courteous with
customers
15. Barclays employees are well
knowledgeable about the banks products and
are able to address Customers Queries
appropriately
16. Customers feel safe in their transactions
E) Empathy
Statement Criteria 1 2 3 4 5 6 7
17. Service is personalized at the customers
level
18. Barclays bank has their customers' best
interest at heart
19. Banks operating hours are convenient to
all their customers
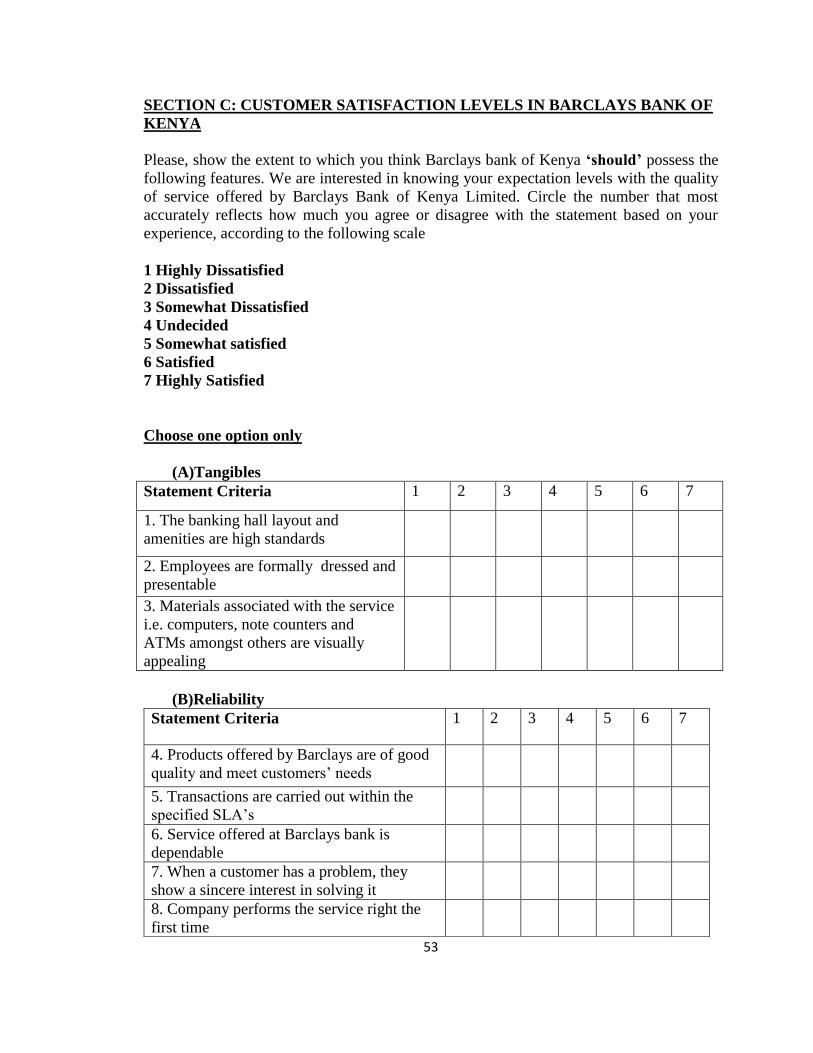
53
SECTION C: CUSTOMER SATISFACTION LEVELS IN BARCLAYS BANK OF
KENYA
Please, show the extent to which you think Barclays bank of Kenya ‘should’ possess the
following features. We are interested in knowing your expectation levels with the quality
of service offered by Barclays Bank of Kenya Limited. Circle the number that most
accurately reflects how much you agree or disagree with the statement based on your
experience, according to the following scale
1 Highly Dissatisfied
2 Dissatisfied
3 Somewhat Dissatisfied
4 Undecided
5 Somewhat satisfied
6 Satisfied
7 Highly Satisfied
Choose one option only
(A)Tangibles
Statement Criteria 1 2 3 4 5 6 7
1. The banking hall layout and
amenities are high standards
2. Employees are formally dressed and
presentable
3. Materials associated with the service
i.e. computers, note counters and
ATMs amongst others are visually
appealing
(B)Reliability
Statement Criteria 1 2 3 4 5 6 7
4. Products offered by Barclays are of good
quality and meet customers’ needs
5. Transactions are carried out within the
specified SLA’s
6. Service offered at Barclays bank is
dependable
7. When a customer has a problem, they
show a sincere interest in solving it
8. Company performs the service right the
first time
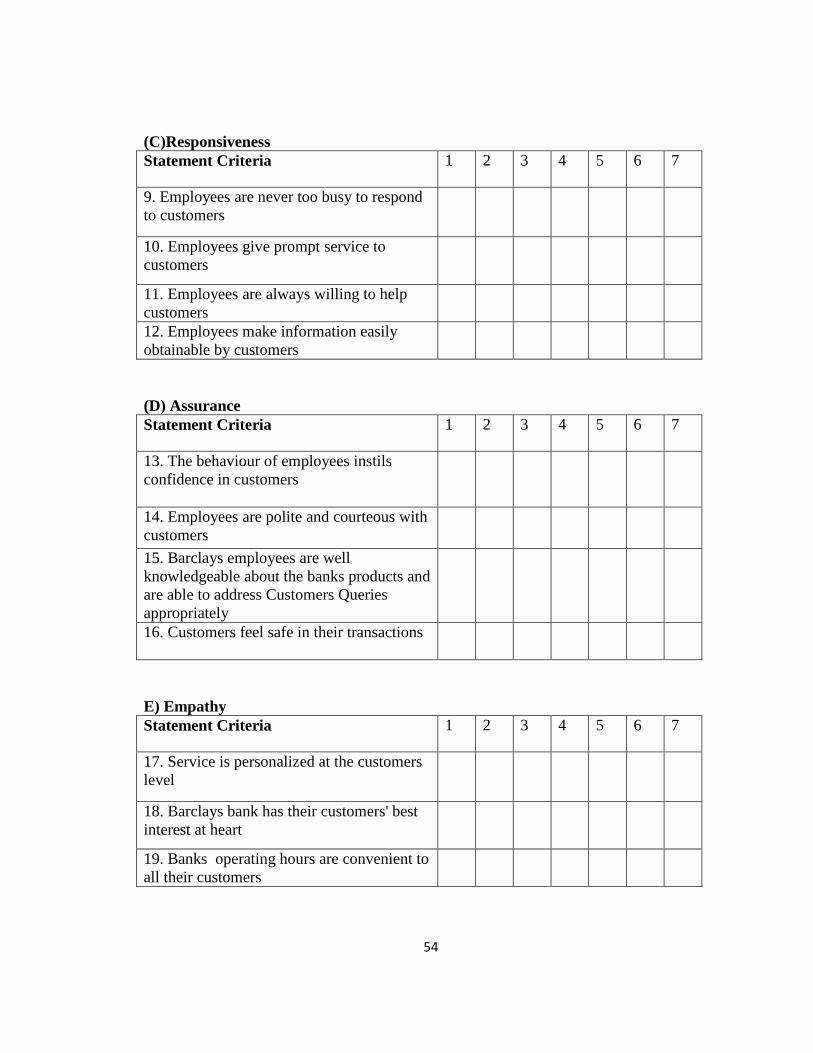
54
(C)Responsiveness
Statement Criteria 1 2 3 4 5 6 7
9. Employees are never too busy to respond
to customers
10. Employees give prompt service to
customers
11. Employees are always willing to help
customers
12. Employees make information easily
obtainable by customers
(D) Assurance
Statement Criteria 1 2 3 4 5 6 7
13. The behaviour of employees instils
confidence in customers
14. Employees are polite and courteous with
customers
15. Barclays employees are well
knowledgeable about the banks products and
are able to address Customers Queries
appropriately
16. Customers feel safe in their transactions
E) Empathy
Statement Criteria 1 2 3 4 5 6 7
17. Service is personalized at the customers
level
18. Barclays bank has their customers' best
interest at heart
19. Banks operating hours are convenient to
all their customers
![Public Transit Customer Satisfaction Dimensions Discovery ... · Customer satisfaction also reflects the performance of a transit system regarding meeting customers’ needs [4]](https://img.pdfslide.us/doc/110x75/5e8fc02a08d273473c580830/public-transit-customer-satisfaction-dimensions-discovery-customer-satisfaction.jpg)