Embed Size (px)
Citation preview

QUALITY DIMENSIONS AND CUSTOMER SATISFACTION: A CASE OF
MOBILE HANDSET MANUFACTURERS IN KENYA
BY
CYPRIAN LUKALE
D61/75611/2012
A RESEARCH PROJECT PRESENTED IN PARTIAL FULFILLMENT OF THE
REQUIREMENTS FOR THE AWARD OF THE MASTER OF BUSINESS
ADMINISTRATION (OPERATIONS MANAGEMENT), SCHOOL OF
BUSINESS, UNIVERSITY OF NAIROBI
DECEMBER 2017
ii
DECLARATION
This research project is my original work and has not been presented for award in any other University.
Signature ………………………… Date……………………
CYPRIAN LUKALE
D61/75611/2012
This research project has been submitted for presentation with my approval as University supervisor.
Signature: ………………………………… Date………………………
Mr. Mulwa Munyao
Department of Management Science
School of Business
University of Nairobi

iii
DEDICATION
This research project is dedicated to my loving parents Mr. Sammy and Mrs. Millicent Lukale for their
continuous support, encouragement and prayers during my entire course.

iv
ACKNOWLEDGEMENTS
All glory goes to the Lord Almighty for giving me strength, resources and provision during the entire
study period.
I would like to express my sincere thanks to my supervisor Mr. Mulwa Munyao, for the support,
guidance and rich learning experience gathered during my research.
I am grateful to my moderator Mrs. Zipporah Kiruthu for the support during the research work. To my
siblings, Job, Perice, Nelly and Caren, thank you for your support throughout the entire period of study.
Special thanks to my wife Doreen Gacheri Lukale, your encouragement made it possible for me to reach
this far. God bless you. To my best friend Erick Sigei thank you for constantly giving me hope during
the entire study.

v
ABSTRACT
The study focused on quality dimensions and customer satisfaction: a case of mobile handsets
manufacturers in Kenya. The specific objectives were to establish the quality dimensions demanded by
mobile phone buyers in Kenya, the quality dimensions pursued by mobile handset manufacturers and to
determine the relationship between quality dimensions and customer satisfaction. Data collected was
purely quantitative and was analyzed by descriptive statistics. The population of study was mobile
handsets manufacturers and their customers; Safaricom, Airtel, Orange Kenya, dealers and distributors
and customers who makes use of these brands-the ultimate consumer. For the manufacturers census of
15 was done in Nairobi while a sample of 115 customers who were identified through simple random
sampling participated in the study. Of the 120 respondents’ questionnaires were administered and the
feedback was a success rate of 91.66% which implies that majority of the population were interested in
the study. The study found that service quality dimensions and customer satisfaction is crucial for both
the manufacturers and their customers. The ranking of SERVEQUAL dimensions was in the following
order; Tangible first, reliability second, assurance third, responsiveness fourth, perceived quality fifth
and empathy last. Customers were fully satisfied with only 2 dimensions of the SERVEQUAL model,
tangibility and reliability of the mobile handset manufacturers while expressed dissatisfaction on
assurance, responsiveness, empathy and perceived network quality. Quality dimensions are generally
important for a firm to achieve high levels of customer satisfaction; however, there is need for
improvement as customers are not satisfied in most areas. A lot can be done to ensure customer receive
more than the perceived value on all service quality dimensions which includes empathy, assurance,
perceived quality, responsiveness, tangibles and reliability. To maintain high performance level a firm
should improve the network quality of the mobile handsets, ensure that they put in place mechanisms to
detect and address counterfeit products, ensure they manufacture phones with long lasting battery life,
increase the internal storage capacity of the phones and ensure the phone has an android operating
system which is mostly preferred by clients. Firms that will focus on those parameters of quality
dimensions stand a good chance to maintain high market share.

vi
Table of Contents
DECLARATION ................................................................................................................ ii
DEDICATION ................................................................................................................... iii
ACKNOWLEDGEMENTS ................................................................................................ iv
ABSTRACT ......................................................................................................................... v
LIST OF TABLES AND FIGURES ................................................................................... ix
ABREVIATIONS AND ACRONYMS ............................................................................... x
CHAPTER ONE: INTRODUCTION .................................................................................. 1
1.1 Background to the Study ..................................................................................................................................1
1.1.1 Quality Dimensions ........................................................................................................................................2
1.1.2 Mobile Handsets Manufacturers in Kenya ................................................................................................3
1.2 Research Problem .............................................................................................................................................5
1.3 Objectives of the study .....................................................................................................................................7
1.4 Value of the Study ............................................................................................................................................7
CHAPTER TWO: LITERATURE REVIEW ...................................................................... 8
2.1: Introduction .....................................................................................................................................................8
2.2 Foundation of the Study ...................................................................................................................................8
2.2.1 Systems of Profound Knowledge ...............................................................................................................8
2.2.2 Theory of Competitive Advantage .......................................................................................................... 10
2.3 Quality Dimensions ........................................................................................................................................ 10
2.3.1 Quality Dimensions from Consumers Perspective ................................................................................. 12
2.4 Quality Dimensions and Customer Satisfaction ............................................................................................ 13
2.5 Empirical Literature Review........................................................................................................................... 14
2.6 Summary ........................................................................................................................................................ 16

vii
2.7 Conceptual framework: ................................................................................................................................. 17
CHAPTER THREE: RESEARCH METHODOLOGY .................................................... 18
3.1 Introduction ................................................................................................................................................... 18
3.2 Research Design ............................................................................................................................................ 18
3.3 The Population .............................................................................................................................................. 18
3.4 Data Collection Method ................................................................................................................................ 18
3.5 Data Analysis ................................................................................................................................................. 19
CHAPTER 4: DATA PRESENTATION AND ANALYSIS ............................................ 20
4.1 Introduction ................................................................................................................................................... 20
4.2 Descriptive Analysis ....................................................................................................................................... 20
4.2.1 Gender of the respondents .................................................................................................................... 21
The study found the gender of respondent as in table 4.2 below....................................... 21
4.2.2 Age of the respondents .......................................................................................................................... 21
4.2.3 Educational background of the respondents ......................................................................................... 22
4.2.4. Respondents Occupation....................................................................................................................... 23
4.2.6. Respondents Type of Phone used ......................................................................................................... 24
4.2.7. Frequency in which the respondents change/import their phone. ...................................................... 24
4.2.8. The cost that respondents are willing to incur for a mobile phone ...................................................... 25
4.2.9. Type of brand offered by the manufacturer ......................................................................................... 26
4.2.10. Research and Development For Conformance ................................................................................... 26
4.3 Reliability analysis. ......................................................................................................................................... 27
4.4 Comparative statistics ................................................................................................................................... 27
4.4.1 Establishing the respondent’s perception on quality dimensions ......................................................... 28
4.4.2 Ranking of the quality dimensions ......................................................................................................... 33
4.5 Correlation Analysis ................................................................................................................................... 35

viii
4.5.1 Relationship between dependent variable (customer satisfaction) and independent variables (quality
dimensions) ..................................................................................................................................................... 35
4.6 Regression Analysis ....................................................................................................................................... 36
4.7 Results finding ............................................................................................................................................... 37
4.7.1 Establishing the quality dimensions demanded by mobile phone buyers. ............................................ 37
4.7.2 The relationship between quality dimension and customer satisfaction. ............................................. 38
5.1 Introduction ................................................................................................................................................... 39
5.2 Summary ........................................................................................................................................................ 39
5.3 Conclusions .................................................................................................................................................... 41
5.4 Recommendations ......................................................................................................................................... 41
5.5 Limitations of the Study ................................................................................................................................ 42
5.6 Suggestions for further study ........................................................................................................................ 42
REFERENCES ................................................................................................................... 43
APPENDICES .................................................................................................................... 51

ix
LIST OF TABLES AND FIGURES
Figure 1.1: Conceptual Framework ……………………………………………………………………..17
Figure 4.1: Response Rate of the Respondent ………………………………………………………..…20
Table 4.2: Gender of the Respondent …………………………………………………………………...21
Table 4.3: Age of the Respondent ………………….…………………………………………………...21
Table 4.4: The Educational Background of the respondents ……………………………………………22
Table 4.5: The Occupation of the respondent …………………………………………………………...23
Table 4.6: The income Level of the respondents…………………………………………………….…23
Table 4.7: Type of phone used/sold by respondents……………………………………………………24
Table 4.8: Frequency in which respondents change/Import Mobile phones…………………………...24
Table 4.9: The cost that respondents are willing to incur for a phone……………………………….…25
Table 4.10: Type of brand offered by manufacturer ……………………….………………………….25
Table 4.11: Survey of Non-performing products in the market by the manufacturer………………....26
Table: 4.1.2: Cronbach’s Alpha Coefficients …………………………………..…………………26 &27
Table 4.1.3: Customers Perception on Quality dimension pursued by manufacturer………………...28
Table 4.1.4: Ranking of Mobile Handset Manufacturers……………………………………………..33
Table 4.1.5: Perception of Mobile handset manufacturers……………………………….…………..34
Table 4.1.6: Correlation Matrix……………………………………..………………………………..35
Table 4.1.7: Model Summary………………………………………………..……………………….36
Table 4.1.8: Anova ……………………………………………..……………………………………36
Table 4.1.9: Coefficients …………………………………………………………………………….37

x
ABREVIATIONS AND ACRONYMS
CEO CHIEF EXECUTIVE OFFICER
ITU INTERNATIONAL TELECOMMUNICATION UNION
ISO INTERNATIONAL STANDARD ORGANIZATION
OS OPERATING SYSTEM
PDA PERSONAL DIGITAL ASSISTANT
TQM TOTAL QUALITY MANAGEMENT
US UNITED STATES
SPSS STATISTICAL PACKAGE FOR SOCIAL SCIENCE
ANOVA ANALYSIS OF VARIANCE

1
CHAPTER ONE: INTRODUCTION
1.1 Background to the Study
Quality is one of the key variables that organizations have considered important in realizing both
short and long-haul objectives and targets. Studies have shown that a relationship exists between
quality management and competitive advantage in the sense that desired results can only be achieved
with effective implementation of quality management practices. Quality management programs must
be actualized extensively to enhance competitive advantage (Douglas and Judge, 2001). Quality
gurus like, Juran, Blanton & Edward (2001) argues that Quality is how best a product or service
satisfies the customer needs, Crosby (1995) posits that Quality means the products or service meets
the requirements of the client. Garvin (1987) proposed eight basic measurements of quality that can
be used by organizations to achieve operational excellence and this includes performance, features,
reliability, conformance, durability, serviceability, aesthetics and perceived quality. He further
asserts that a product or service can be highly ranked on one of the quality dimensions and low on
another for instance a product with high performance sometimes may be expensive to service,
managers should therefore make prudent decisions on the various product quality dimensions.
Zeithmal and Berry (2004) assert that what the market expects and perceives as value may differ
thus leaving a gap, the Servequal quality model or the GAP model highlights the main requisites for
ensuring a high quality. They further posit that to achieve service quality certain parameters have to
be taken into account to avoid unsuccessful distribution and this includes understanding, access,
courtesy, reliability, competence, credibility, security, the customer, responsiveness and tangibles.
Reichheld and Teal (2001) argues that delivering high quality to clients enhances loyalty and
facilitates organizational growth which can be reflected through firm’s profitability index. They also
contend that at a point when an organization establishes quality and loyalty programme through its
client benefit strategies, it picks up a level of reliability from the client that drives and builds the
capacity to boost income. Whitney & Lind (1998) asserts that the most critical viewpoint in quality
assurance is that organizations regularly neglect to consider two fundamental arrangements of
inquiries, meanings of value from client point of view, and why are they abruptly requesting higher
quality than in the past? Innovation is one of the key operation strategies that enable organizations to

2
produce high quality products. According to Panda (2003) good relationship with clients defines the
effectiveness of an organization and this can be denoted by client’s fulfillment and reliability.
A firm that has put emphasis on quality will carry out quality assurance tests, they need to provide
product or service information and respond to clients’ queries. Quality and costs are key factors that
firms need to put in place in settling decisions concerning the market, Ewan (2007). Experts and
scholars concentrate more on bundling and repackaging old stuff as opposed to proceeding with the
development wave that renewed quality management in the 1980s. A detriment to quality has
featured where organizations no longer focus on new methodologies of achieving high value for
instance continuous improvement practices; many methodologies are out of date because the experts
had limited perspectives of total quality management, Tito (2010). Managementstudyguide (2008)
argues that quality plays a vital role in the organizations success and failure. Underrating a crucial
aspect like quality will hinder the long run survival of the firm. They further contend that
organizations that use six sigma stands to enjoy superior quality products as the process removes the
defects thereby enhancing the entire system and process hence high levels of perfection.
1.1.1 Quality Dimensions
Quality management is a critical aspect that an organization relies on in determination and
implementation of quality policy through approaches such as quality planning, quality assurance and
quality improvement, Kaoru (1990). Quality management systems assists firms in reducing the
number of defects, relationship management, client’s satisfaction, growth in market share, new
markets and opportunities and global image. He also posits that successfully implementation of
quality management system will contribute to minimal expenditures on costs of quality and errors,
high quality products and waste reduction, Gotzamani (2010). A firm has to invest in management
systems such as quality composed of standard practices which include ISO 9000, series for
management of quality which will assist in ensuring customer satisfaction and address complaints as
well as meeting the expectations of the stakeholders, Paranitharan, Ramesh,Pal and Jeyathilagar
(2004).
For a firm to achieve a satisfactory level of quality competence employees need to be well vast in
production experience and this involves educating them on quality management practices. In
addition, they posit that quality knowledge is necessary to assess quality improvement solutions

3
regularly to sustain quality performance, Agrawal and Muthulingam (2015). Rachel (2017) alludes
that quality control software gives a product best chance of success, the software should be user
friendly and avails to inspectors the information they need to detect, correct and ensure conformity
through technology. She further posits that investment in quality software gives rise to more
effective inspection, well trained employees who ensures response plans are more efficient than
never. Motwani (1995) cites that academic institutions have started to succumb to pressure for
quality management and reform. Furthermore, there is an axiom that institutions that takes time to
adopt total quality management miss the opportunity to be the market leaders and runs a risk of
becoming irrelevant to the competitive business world.
Intrinsic and extrinsic values to a large extent are relied upon by firms to measure quality. Perceived
quality is the consumers experience about the superiority and overall excellence of a product
Zeithaml (1988). He further posits that clients perceive the overall service quality by examining the
five dimensions, the service provider needs to demonstrate excellence on all dimensions of service
quality which includes responsiveness, reliability, assurance, empathy and tangibles in order to
achieve high rankings. Garvin (1984) argues that firms need to compete on the following quality
dimensions; performance, features, reliability, conformance, durability, serviceability, aesthetics and
perceived quality. Service quality is very important and industry players should enhance their service
quality to gain competitive edge, client’s satisfaction and customer loyalty. In addition, dissatisfied
clients spread their experiences to more than three other people hence damaging a firm’s reputation,
Sweeney (1997).
1.1.2 Mobile Handsets Manufacturers in Kenya
With changing trends in the business environment, the need to invent cell phones became a major
concern. The fast penetration of this low‐cost innovation has prodded an advancement agenda
addressing how cell phones can be tapped adequately for socio‐economic improvement in
developing economies according to Gartner (2016). The cell phone industry standout amongst the
most powerful commercial centers globally. However, while Apple and Samsung still manage the
business there are other key players as well, having the capacity to compete effectively and become
the market leaders, Gartner (2016). Kotler (2011) contends that the competitive preferred standpoint
is leverage over rivalry picked up by offering customer more prominent incentive than contenders
do, the mobile industry therefore is perfectly competitive, the manufacturers work tirelessly to
4
improve the quality of the products and services to meet customer specifications. Quy (2015) argues
that in spite being the pioneers of innovation in the mobile industry, Nokia could not sail through the
market because of aging staff and technology which could not match the new standards set by
players in the industry, the firm had reached the peak of its innovative work cycles and was
overtaken by unpredictable development in business. Nokia adhered to windows as it were. Nokia
fortunes fell 40%, Nokia benefits fell 95%, Nokia bit of the general business collapsed mobile
phones from 34% shockingly assessment ratings went from AAA to junk, Nokia's offer cost dropped
60%. He further contends that Sony Erickson was not able to recover the initial investment in the
U.S where it held a 1% bit of the piece of the market share.
As per the Gartner research a year back ago he did make the analysis on how the mobile handsets
performed in the first quarter of 2016 as follows, Gartner (2016). Samsung is a South Korean cell
phone major market leader. Samsung keeps on dominating the cell phone market with 76,743,500
units sold in the first quarter of 2016 which represents 23.2% of the market share and this was a
decline of 24.1% a similar quarter a year ago. As per Gartner's examination executive Anshul Gupta
(2016), "Samsung's Galaxy S7 arrangement telephones restored portfolio situated it as a solid rival in
the cell phone market, the firm performance was also exemplary in developing markets where they
have been facing cut throat competition from the local manufacturers especially in the African
continent. They have distributors across the world estimated to be 6980 as well as service centers to
deal with costs of quality such as repair, defective products and warranty costs.
While Apple figured out how to hold its second position in the worldwide cell phone market, the
organization encountered a decrease over time, with iPhone deals around 14% of the market share
with sales amounting to 44,395,000 units. The firm has 6 distribution centers, 36 service centers and
45 training centers to allow value chain fluid capability transfer worldwide and 16 research and
development centers. Oppo saw strong advancement in China, assuming control from various
players such as Samsung, Lenovo and Yulong, the firm’s PDA bargains in the Asian continent
increased by 199%, with 16,112,600 units sold in the midst of the quarter, Gartner (2016). Huawei is
seeing solid development and appeal in Africa, Europe and United States. The firm’s turnover at the
beginning of 2016 amounted to 28,861,000 units, according to Gartner (2016). The firm’s market
share during the quarter stood at 8.3%. Techno a Chinese mobile manufacturer has a market share of
below 10% worldwide as their focus was mainly towards the African market as they shut down

5
business operations in Asia. The Kenyan market has seen an immense improvement in the number of
mobile phone merchants to 22 from 15 some years back. Currently Nokia, Samsung and Techno
control 75% of the Kenyan cell phone market with brands, for example, Infinix, Innjoo and Wiko
penetrating the market with low end and middle-class phones, Jumia (2017).
The Kenyan cell phone market is extreme, focused and unforgiving global players have entered into
the Kenyan market due to its high ranking since the Kenya market have been advantageous to their
business because of the internet uptake, Chenze (2015). Start Counter Global Stats. (2016) states that
Samsung has a market share of 23.75%, Infinix 8.66%, Huawei with 6.95%, Nokia 4.43%, Techno
3.66%, Apple 0.45%, Lenovo 0.86%, Oppo 0.18%, HTC 1.03%, Vodafone 2.24% and others taking
42.6% of the Kenyan market. Start Counter Global Stats. (2017) asserts that the market share of this
companies were as follows Samsung 18.1%, Tecno 13.61%, Infinix 9.16%, Huawei 7.65%, Nokia
5.71%, and others at 45.77%.
1.2 Research Problem
When cell phones came into being a number of buyers had their taste and preferences on the real
merits of cell phones, for instance battery life and multiple Sims because of their financial status,
their buying behaviour was geared towards the basic features of the phone, however with increase in
income levels in the 21st century mobile phones were more considered as working and entertainment
gadgets, the consumer buying behaviour ended up noticeably enthuastic and initiative, Yuchan
(2015). Competitors in the industry focused more on product performance, reliability, serviceability,
durability and features which includes high resolution camera, accessories such as headsets and blue
tooth, Sim card which stores information on phonebooks that can be transferred from one cell phone
to another, Facebook, email and whatsapp features, operating system such as android which makes it
easier for users to download content, speaker phone and video recording, Selom (2016).The android
Google developer gives users confidence in making use of gadgets since Google is a trusted service
provider. Android has multitasking capabilities which allows users to manage several applications at
the same time and view many android notifications, Puri (2016). Nokia and others used the Symbian
operating system in all its phones.
The android showcase began developing and eating into their market share which saw the firm’s
revenue fell. Efforts to restore the lost glory through launching the windows phone bear no results as

6
a significant number of clients had already adopted the android system. With increased customer
awareness on product and service quality, firms have put in place quality policy and statements to
guide the organization and at some point conduct quality assurance tests. The mobile telephone
industry is dynamic hence the players are challenged to establish ways to ascertain that their
products and service meets the customer specification. Customer satisfaction is key to long term
survival in business. To perform well and gain market share service providers need to outperform
their competitors through offering superior quality products and service, (Saghier & Nathan, 2013).
According to Hansenmaek & Albinsson (2004), customer satisfaction and retention become an
important factor for an organization since they tends to give a big advantage for companies.
Nokia and others did not conduct proper test on quality because the top management and leadership
lacked accountability and leadership to align and direct company through destructive times as quoted
in the Memo ‘Burning Platform’ by new CEO Stephen Elop according to Monaghan.(2013), the
products they released to the market were ground breaking but not promising enough due to failure
to redefine the smartphone and attracting developers. Antony and Pamela (2013) assert that the price
of mobile phones should match with their quality such that there is a component of durability in the
cell phones to decrease the disposal rate; the low cost mobile phones exhibit a high disposal rate.
They further allude that access to resources is dependent on the government’s willingness to give
quality infrastructure to cell phone merchants to enable them have many branches where the old
phones can be kept to accommodate the latest brands thereby reducing the rate of environmental
degradation through disposals.
The problem that Nokia had also is that as leader in the market they fell behind in releasing new
technology in the market when the technology is already obsolete and taken by the competitors such
as Apple all these leads to slow product development and issue of quality since the phone
manufacturing industry is so dynamic. This study therefore seeks to address the quality dimensions
that drive the mobile business. It seeks to increase the body of knowledge on the subject, ‘The
relationship between quality management and competitive advantage and enlighten the existing
firms on the various quality dimensions’.

7
1.3 Objectives of the study
General Objective.
The general objective of the study was to identify the quality dimensions pursued by mobile handset
manufacturing firms to ensure customer satisfaction.
The Specific objectives of the study are;
I. To establish the quality dimensions demanded by mobile phone buyers in Kenya
II. To identify the quality dimensions pursued by mobile handsets manufacturers.
III. To establish the relationship between Quality Dimensions and Customer satisfaction.
1.4 Value of the Study
The essential inspiration driving this study was to identify the quality dimensions that mobile
handset manufacturing firms compete on to achieve operational excellence. Servequal model and
Garvin model of product quality is of great importance to firms that seeks to maximize the market
share through enhanced product and service quality. Operational Managers will craft strategies that
syncs the manufacturing and marketing departments taking into consideration quality from the
client’s perspective. This study will be relied upon to raise alert to organization on quality
management; customer focus, cooperation, fundamental initiative, and organization expert. The
management will appreciate that quality is free; the organization of Nokia, Motorola and Sony
Erickson Limited would have embraced continuous improvement approaches from a quality
perspective.
The academic world: This study tends to focus on organizations that prioritizes quality dimensions;
this learning causes academicians to gain best organization quality management practices. This
increases the body of knowledge as they are set up to be quality executives.
The government needs this information to give supportive work environment to investors in the
mobile market, positive evaluation methodologies and whether they can have a stake in these remote
firms.
The public needs this information to enable them make purchasing decisions and to appreciate to
what degree their dedication is to survival of firms, they have an oversight part.

8
CHAPTER TWO: LITERATURE REVIEW
2.1: Introduction
This chapter highlights previous studies done by scholars and researchers on dimensions or
perspectives of quality that firms compete on; this is with the intention of providing readers with
adequate knowledge and skills on quality dimensions and competitive advantage relative to their
strengths and weaknesses and how they make a significant impact to organizational fortunes. The
chapter will focus on the theoretical and empirical literature of the subject under study.
2.2 Foundation of the Study
Theories concerning competitive advantage and quality dimensions have been put across by various
scholars since the inception of quality management by quality gurus Dr Joseph Juran, Dr Edward
Deming and Dr Philip Crosby. Theories that have been associated with this study includes Systems
of profound knowledge, the theory of competitive advantage, Servequal model and Garvin Model of
product quality and are discussed below.
2.2.1 Systems of Profound Knowledge
Systems of profound knowledge which takes into account, appreciation of a system, Knowledge
about variation, Theory of knowledge, and Knowledge of psychology is crucial for organizations to
gain competitive edge. In this current age organizational competitiveness is enhanced by intangible
resources. Knowledge is one of the key resources that firms consider essential for its employees
growth (King and Zeithmal, 2003; Wu and Wang, 2006; Hwang et al., 2008; Šajeva, 2010).
Knowledge management is a step by step process that puts into perspective disciplines that facilitate
advancement of knowledge and enhance value for firms, Gupta,Iyer & Aronson (2000). If
knowledge management is put into practice then firms can experience a high turn around in their
operational and financial performance. Systems of profound knowledge theory recognizes the
processes and procedures used by organizations in executing their operations for example quality
planning ,quality control and quality improvement process, what systems the organizations use in
ensuring high quality standards, the theory further emphasizes that managers should have knowledge
about variation since occurrence of variation is a common phenomenon in the organization and this
may be between input, output ,people ,service ,product, capability of systems and Uncertainty in

9
statistical data. When competing on quality therefore it’s imperative for the firm to have a proper
knowledge of variations this can be done through quality assurance tests to ensure the actual
conforms the planned.
Reliable information gives rise to prudent decisions but this information is normally not within the
policy makers. The major task for managers is to ascertain how to make use of this knowledge to
improve organizational efficiency. The knowledge of employees, suppliers, customers and
shareholders is the most important virtue of an organization as opposed to traditional factors of
production which includes; land, labour and capital (Drucker, 1994). Firms that invest in knowledge
management have consistently enjoyed great financial performance as employees work towards
achieving the organizations goals and objectives. The focus of a firm is to ensure that their products
and services conforms with customer specifications and to achieve the managers apply research and
development to identify which quality dimensions will give the firm a competitive edge. Investing in
knowledge management is therefore a critical success factor, Fernandez and Sabherwal, (2010).
Chong (2006) asserts that if the activities of the firm requires employees with extensive knowledge,
for other employees to gain, teamwork needs to be encouraged with strong leadership skills in
empowering individuals in taking decisions’.
Anantamula and Kanungo (2010) asserts that support from senior management is key to establishing
a successfully knowledge management as it emphasize on strategic focus. Knowledge management
takes into account all employees within an organization hence people driven initiative and therefore
of essence in promoting social enablers. This theory is an eye opener to managers on continuous
improvement strategies in the sense that emphasis has been put to management to look at processes
with certainty and not fixes, managers should be sure of the approach and techniques they use in
their day to day management style. To pull off effective quality managers should have the
knowledge on psychology, how to motivate employees, how to resolve conflicts? How to respond to
increase in price? How to address the changes in consumer behavior? How to respond to
competitors? Firms that invest in knowledge management based on them being their strength stand
better chances to achieve competitive advantage.

10
2.2.2 Theory of Competitive Advantage
Chu‐HuaKuei (2003) asserts that competitiveness can only be achieved when firm focuses on quality
and environment. Zeithaml et al. (1990) argues that the most critical dimension is reliability; these
were the findings on an extensive survey over four service sectors. Firms whose services are reliable
stand a good chance to dominate the market. Reliability could involve availability of products and
services at the right time and place (time and place utility), zero defects on the product for example
no short packs or damages, providing immediate solutions and feedbacks to customers ‘queries, high
performance of the product. Due to tremendous changes in the industry product manufacturers
started designing based on certain customers’ specifications as a result of competition there was need
to respond to the voice of the customer, (House of Commons, 1995). To improve performance, it is
necessary for organizations to benchmark with other successfully retail organizations who deploy the
same staff in the same role and have excellent customer relationship management, Clutter &Wayne
(1993) The competitive advantage theory holds the view that organizations success can only be
achieved through implementation of strategies; a unique strategy reverses organizational dwindling
fortunes and gives it a sustainable and distinctive edge.
Competition revolves around the willingness and ability of a firm to offer quality products and
services. John (1998) posits that the customer service journey in any company is a continuous
process and firms continue to face competition and new challenge on a daily basis. When at least
two firms compete in a similar market, one firm has an upper hand over its competitors when it wins
diligently higher rates of benefits, Grant (2005). To accomplish any preferred standpoint in business,
a firm needs to look profoundly and deliberately into what it has, what it knows, what it does and
what it can get keeping in mind the end goal to give preferable incentive to its clients over its
competitors. For example, advantages may incorporate additional product or service characteristics,
excellent customer care; after sales service (Shirin and Puth, 2011) and improved quality.
2.3 Quality Dimensions
Service providers need to ensure high quality standards particularly in the core business segment;
this will keep them in competition and improve the level of perception on service quality and
customer satisfaction (Parasuraman et al., 1985). Network quality entails the errors experienced by
clients, the speed within which downloads and uploads can be executed and the time taken by the

11
system to respond, (Vlachos and Vrechopoulos, 2008). Zeithamal and Berry (1985) contends that to
deliver high quality service a firm should constantly focus on; reliability, responsiveness,
competence, access, courtesy, communication, credibility, security, understanding/knowing the
customer tangibles. They further posit that reliability, assurance, tangibles, empathy and
responsiveness plays a significant role in delivering the desired quality. Emmanouil & Christos
(2009) contends that security and protection issues have major effects on the service quality of
mobile phone, regardless of the advances in the technology with regards to network and devices
quality. They further alluded that steady network and user friendliness of a gadget contributes to e-
crime activities such as cyber-crime.
Jahanzeb, Fatima, & Khan (2011) asserts that assessing the quality of the service to determine
whether they conform to client’s specification is one of the key factors that firm has to consider if it
has to compete effectively and break even. They further posit that players in the mobile industry
should concentrate on other quality perspectives of responsiveness, empathy, tangible because these
dimensions affects the customers perception of service quality to a large extent and the cell phone
service providers should be aware in order to address customers concerns and innovate value added
services to withstand the competitive business environment. Surveying customers within these
dimensions is one of the approaches that businesses can use to determine their service quality. When
the customers’ expectations exceeds the perception of the received value, the service is not
satisfactory. Mobile manufacturing firms have focused in some of these dimensions to gain
competitive advantage, reliability, assurance; tangibles empathy and responsiveness have seen firms
grow their customer base to significant numbers.
According to Wang, Lee, Pipino & Strong (1998) data and information quality needs to be taken into
account if a firm is to achieve excellence. Khanna, Song, & Lee (2011) assert that Samsung adoption
of the hybrid management system which is the combination of the Japanese-style system with
Western-style has impacted positively on the firm’s performance in the global market. They further
assert that for a firm to increase its efficiency and capability delivering quality should be its primary
objective. Focus on product and service quality has been put on emphasis over the years. Wan &
Chongman (2015) argues that to improve quality of products and service and achieve greater
profitability Samsung has applied diverse concepts.

12
Garvin (1987) assert that the US consumers put pressure on firms to improve the quality of their
products. He further argues that with high quality as a competitive edge firms needs to penetrate the
market and increase the turnover. He further asserts that for a firm to compete effectively it has to
capitalize on the following; Performance, features, reliability, conformance, durability,
serviceability, aesthetics, and perceived quality.
At the point when clients are happy with a specialist organization they tend to be committed and
loyal in light of what the organization has accomplished for them. (Cater and Zabkar, 2009).
Therefore, a company that can deliver high level of overall service quality will be more likely to
have higher customer commitment.GSM Arena (2010) argues that the weight, Slimness and display
size of high and low end phones has changed over the years. The researcher further posits that the
mobile handset market in the last five years have significantly reduced the size of the same phone
with the same features. Keijzers (2008) contends that the features, performance and add on
applications in smart phones are determined by the operating systems. Oliver (2017) posits that
Nokia is back with vengeance by reviving its classic Nokia 3310 whose battery performance is the
most attractive feature since it lasts 22 hours of talk time and 31 days standby.
2.3.1 Quality Dimensions from Consumers Perspective
Past research demonstrates that firm’s turnover enhances as the number of loyal customers increases
(Jahanzeb et al., 2011). Recruiting new clients additionally can't ensure long term accomplishment
for an organization particularly when that organization can't hold its clients (Wang and Wu, 2012).
In fact, a 2 per cent increase in the customer retention rate is equal to a 10 per cent decrease in the
cost of customer acquisition in the mobile phone service industry in China (Han et al., 2012). Hence,
keeping a dedicated client is more beneficial over the long term in contrast with securing new clients
(Wang and Wu, 2012).
Limited decision making is a purchasing behaviour shown by buyers when obtaining valued
commodities that are not purchased habitually as a result they require more time to collect data
necessary before making the purchase decision, Furahiji &Wawrzyniak (2012). Customers’ exhibit
extended decision making when they purchase expensive products that are not frequently bought for
instance television and cell phones. In this case they take a while longer to gather information from

13
their family and friends. They will also use a variety of channels to gather information about the
product performance, features, reliability, flexibility, durability and serviceability to ensure the
product would serve them well Furaiji,L.&Wawrzyniak.(2012).
To build effective attachment with clients’ service quality measures which includes responsiveness
and reliability needs to be considered as possible measures of performance which a firm needs to
evaluate over time (Fullerton, 2005). Akhter and Uddin (2012) alleges that the quality of service and
affordable pricing improved the perception of customers in view of value of mobile phone service
manufacturers. Perceived value to a large extent influenced customers satisfaction level therefore
perceived value is what firms should focus on as it cuts across fair price, service quality and clients
fulfillment. Customer loyalty is built based on the period of time a customer interacts with the firm,
the longer the period of time the customer has engaged with the firm the less inclined the customers
are to break that relationship, Bügel,Buunk,&Verhoef (2010). Christopher (2005) argues that
warranty period and maintenance of a product is one of the service a customer needs, the repair
coverage ranges from 1-3 years. He further argues customer can base their need on extended
warranty period.
2.4 Quality Dimensions and Customer Satisfaction
Technical quality is what customers receive in their relations with the service provider. Further to
this technical quality is also part of the core service quality that takes into account the form in which
product and service are delivered to the customers, McDougall and Levesque (2000). Functional
quality highlights the mode of service delivery to the end user. These dimensions include a broad
range of service delivery items such as the perception of the customers towards customer care
services and the efficiency and effectiveness of service delivery, Adelman, Mara, Aaron & Cathy
2000). Peter (2004) asserts that clients awards higher marks to a service provider who ensures better
coverage, offer after sales services and focus on quality. He further argues that consumers were
disappointed with the costs incurred in cancelling services and poor network coverage.
Pezeshki,Moosavi & Grant (2009) argues that the quality of service and stability in network are the
key drivers of customer satisfaction, alongside the quality of service, organizations can make
significant increase in their revenues and outstanding performance than other contenders by
providing clients with certain competitive advantage, (Johnson and Sirikit, 2002). Tung (2010)

14
asserts that perceived value, quality, image and usability are the most vital factors to ensure
customer satisfaction with regards to mobile phone services.
Abdulrahman & Muhammad (2011) alludes that mobile companies in Saudi Arabia concentrate
more on better quality services; organizations must implement processes to improve the overall
structure of service quality. They further assert that firms can achieve high level of service quality
through intensive training programs for its employees and hiring robust personnel managers to
address critical issues like poor responsiveness and reliability. Philip (2012) suggests that customer
satisfaction is key in ensuring that organizations increase their customer base, get more revenue and
high profits. Because a satisfied client narrate their good experience about the firms products and
services thereby influencing other potential and prospective customers to buy the same brand. He
further alludes that smartphone buyers are not price sensitive but they seek quality. Further to this
the researcher posits that quality is the backborne of business organization. A firm can affirm its
existence in the market through offering quality because consumers purchase decisions is initiated
by their perception of quality, (Fornell, 1992). Sultana & Chowdhury (2017) asserts that aesthetic is
one of the quality dimensions that clients rely on when repurchasing a smartphone. They further
state that customers’ priorities are on looks, feels and sound when purchasing a smartphone because
they are young and smart.
2.5 Empirical Literature Review
Sime & Shawnee (2000) contends that the quality of the product and excellent customer relationship
management gives rise to high returns on investment. They further allude that product quality
increases return on assets while relationship management enhance the market share performance. In
their study of’ Quality-related Action Programs: Their Impact on Quality Performance and Firm
Performance’ they attributed the success of a firm to efficient customer relationship, strong
management team, cross functional quality teams and empowerment of employees which constitute
to quality management. Danny, Vincent, & Heloisa (1999) argues that the correlation analysis on
evaluations obtained from two distinct respondents from a similar organization demonstrates that for
quality to be achieved then employee relations in an organization is necessary, firms need to invest
in training of its employees in product design, supplier quality management and quality data
reporting. The study depicts that knowledge management in an organization has direct effects on

15
quality performance which translates to satisfaction of clients. To promote effective total quality
management implementation, stakeholders are advised to develop an enabling environment.
Wanyoike (2016) in a study that sought to establish the relationship between quality management
practices and firms performance asserts that quality management practices generated excellent
results in manufacturing firms in Kenya. She further alludes that the senior management of a firm
needs to formulate the vision, mission and goals that enhance quality culture and implement the core
values resulting to outstanding performance. The research established that the operating environment
has a moderating effect on the relationship between quality management practices and performance
of manufacturing firms in Kenya. The US General Accounting Office (1989), a New York business
research group, carried out a study on quality practices of conglomerates in U.S. Out of 800 surveys
149 responded, of the 149,111 (74.5%) were of the view that quality initiatives were considered
critical by firms in the U.S. Over 30% were of the opinion that total quality management had
enhanced their execution, with only 1% ascertaining decline in performance as a result of total
quality management.
Young (1992) argued that if existing employees prefer working under maximum supervision, do not
accept change management through training, lack synergy and lack cultural and demographic
homogeneity and are not accustomed to linkages between remuneration and organizational
performance then such organizations are not likely to adopt quality practices. Soko insight (2016)
carried out research which established that 85% of respondents have at least 5 apps on their phones
while 30% of respondents were of the opinion that app availability is one of the most important
features of their mobile devices, a significant number were not interested with local platforms. In
general, the respondents ranked local apps “average” in terms of content, quality and price, and for
developers, this figure should raise eyebrows as 43% of users didn’t know any locally-made apps.
Gitangu (2015) studied total quality management and competitive advantage of small and medium
enterprises in Nairobi City County; the findings confirm that viable total quality management
enhances consumer loyalty. She further posits that implementation of total quality management
enhances the customer satisfaction level. From the findings most organizations seemed to
concentrate on client’s fulfillment through efficient and effective service delivery. Kemibaro (2016)
alludes that social media, search engines, email and video are the most popular activities by
smartphone users in Kenya.

16
He further posits that social media dominates with 58%, search engine follows with 39%, emailing
at 30 % and video 25%. The research further highlights that Kenyans watch more video than
Nigerians in a ratio of 4 to 1 and therefore most smartphone users are Kenyan. This implies that
clients changed their purchasing behaviour to the new models with several exclusive features. Lewis,
Pun, & Lalla (2006) inspected TQM factors in the criteria of ISO 9001:2000 accreditation, in a
study, results gathered from 12 nations depicted that there are certain practices that play a vital role
in implementation of TQM. Those practices include providing quality information, customers’
loyalty, utilization of human resources, process control, preparing and instruction, change
management, authority, quality dimensions, communication with partners.
2.6 Summary
Servqual and Garvin model of product quality are instruments well known in evaluating the product
and service quality for organizations with Mobile handset manufacturing firms as one of the firms.
Servequal includes the dimensions considered by the firm and the customer in evaluating the service
quality in any service sector while the Garvin model assists firms and customers in evaluating the
product quality. In this study, these models have been used extensively to explain the quality
dimensions pursued by both manufacturers and customers. This will form the conceptual framework
for this study.

17
2.7 Conceptual framework:
Figure 1.1Conceptual Framework
Product and Service Quality Dimension/Perspectives
Source: Researcher (2017)
Independent Variables Dependent Variable
Performance
Features
Reliability
Serviceability
Tangibles
Assurance
Responsiveness
Durability
Perceived Value
Empathy
Customer Satisfaction
Effectiveness & efficiency of
services
Better coverage
After Sales Services
Usability
Loyalty
18
CHAPTER THREE: RESEARCH METHODOLOGY
3.1 Introduction
According to Kothari (2003) research methodology entails detailed procedures and approaches used
in conducting the study. This chapter therefore seeks to explain the research design, the target
population, sample collection techniques, the nature of data to be used, the sources of data, data
collection instruments and finally data analysis methods.
3.2 Research Design
This study was a descriptive one that aimed at evaluating the quality dimensions/perspectives that
firms use to gain competitive advantage. The research described how the quality dimensions had a
direct relationship to organizational performance. According to Manuel and Medel (2014)
descriptive research includes the depiction, recording, analysis and translation of the present nature,
composition and procedures of phenomena.
3.3 The Population
The population of study was mobile handsets manufacturers and their customers; Safaricom, Airtel,
Orange Kenya, dealers and distributors and customers who makes use of these brands-the ultimate
consumer. For the manufacturers a census of 15 was done in Nairobi while a sample of 115 ultimate
consumers and dealers were identified through simple random sampling participated in the study.
3.4 Data Collection Method
The study used both primary and secondary data. Questionnaires were designed with both open and
closed ended questions to facilitate data collection. The guide consisted of three sections. Section I
critically highlighted on the general background of the organization. Section II responds to the first
objective of the study which was to establish the quality dimensions demanded by mobile handsets
buyers. Section III sought to identify the quality dimensions pursued by mobile handsets
manufacturers. Section IV sought to establish whether quality dimensions had a direct relationship
with customer satisfaction. The secondary data was used to capture historic data that respondents’
seldoms remember. The sources of such data were any documents obtained from a reliable source.
The primary and secondary data were utilized concurrently to ensure that no information relevant to
the study was left out. Questionnaires were administered to respondents of different categories

19
among them managers and customers. The managers were tasked to give relevant case studies in
their individual capacities as managers in the day to day management of operations, the challenges
they encountered and how a product is rendered obsolete as result of poor quality standards. The
nature of the data collected was both quantitative and qualitative. The quantitative aspect focused on
variables of measurement. Aliaga and Gunderson (2006) posits that quantitative method is an
investigation into a social issue, clarify facts using numerical data analyzed using scientifically based
techniques for instance particular statistics. The questionnaires were distributed as follows
Respondents Target Population -120 Respondents
Manufacturers 15
Dealers and distributors 30
Ultimate Consumer 75
Total Population of Interest 120
3.5 Data Analysis
The completed questionnaires were thoroughly edited to ensure consistency and completeness before
processing the responses. The respondents’ data was grouped into various categories. Quantitative
data was collected and descriptive analysis was used to carry out analysis. Descriptive statistics such
as frequency, mean, standard deviation range and standard error of mean and sum was used to
analyze the data. Tables were used to summarize responses for further analysis and facilitate
comparison. Inferential statistics i.e. Correlation and ANOVA were used to analyze relationships
among variables. Analysis was aided by Statistical Package for Social Sciences (SPSS).

20
CHAPTER 4: DATA PRESENTATION AND ANALYSIS
4.1 Introduction
This chapter contains the detailed findings on the quality dimensions pursued by the mobile
manufacturers resulting to customer satisfaction. The analysis of the primary data collected and the
interpretation was done using Statistical Package for Social Science (SPSS) V17 as a statistical data
analysis tool. Both descriptive statistics and the inferential statistics were carried out. Based on the
study objectives the following findings were established.
The response rate of the respondent
Figure 4.1 Response Rate Return
Respondent’s
Category
No of questionnaires
issued
No of questionnaires
duly filled
Respondent rate
Manufacturers 15 13 86.67 %
Dealers 30 25 83.33 %
Ultimate Consumers 75 72 96 %
TOTAL 120 110 91.67 %
Source: Research Data (2017)
The questionnaires were used to collect data from 120 respondents. The respondents were
categorized as manufacturers, dealers and ultimate consumers. From the Table 4.1, the response rate
was as follows; out of the expected 15 manufacturers there was 13 response representing 86.67%,
dealers response was 25 out of the expected 30 resulting to 83.33% and on the ultimate customers
section the study received 72 out of the expected 75 representing a rate of 96%. The study was able
to get a response from 110 respondents in total out of 120 questionnaires distributed representing a
general response rate of 91.67%.
4.2 Descriptive Analysis
This is the part that presents the demographic data collected from the respondents; it included the
gender of the respondent, their age, education level, occupation, their income, type of phone
used/selling, how long and the reasons of using/selling the phone.

21
4.2.1 Gender of the respondents
The study found the gender of respondent as in table 4.2 below.
Table 4.2 Gender of the Respondent
Frequency Percent Cumulative Percent
Male 68 61.8 61.8
Female 42 38.2 100.0
Total 110 100.0
Source: Research Data (2017)
According to the frequency table 4.2 above, the study findings showed that majority of the
respondents from the data collected were male representing 61.8% of the total respondent and
female accounting to 38.2% of the total respondents.
4.2.2 Age of the respondents
The study established the age of the respondents from the data collected and the results are presented
in table 4.3.
Table 4.3 Age of Respondents
Years
Frequency Percent
Cumulative
Percent
Valid 20-30 59 53.6 59.0
30-40 25 22.7 84.0
40-50 13 11.8 97.0
Above 50 3 2.7 100.0
Total 100 90.9
Missing 77 10 9.1
Total 110 100.0
Source: Research Data (2017)
The study further sought to know the age bracket of respondent. It found out that majority of the
respondents were of the ages of 20-30 years with a percentage 53.6%, followed by a range of (30-
40) which accounted for 22.7%, (40-50) representing 11.8% and above 50 years accounted for
2.7%. Finally, there were 10 respondents who failed to indicate their age bracket corresponding to
9.1%.

22
4.2.3 Educational background of the respondents
The respondents were requested to indicate their educational background, and the results obtained
were as presented as in the table 4.4
Table 4.4 The Educational Background of the Respondents
Education
Level Frequency Percent
Cumulative
Percent
High School 13 11.8 12.1
Intermediate 20 18.2 30.8
Graduate 62 56.4 88.8
Post Graduate 8 7.3 96.3
Others 4 3.6 100.0
Total 107 97.3
Missing 77 3 2.7
Total 110 100.0
Source: Research Data (2017)
Respondents were asked about their educational background and the study found out that the
majority of the respondents were graduates with 56.4%, followed by intermediate 18.2%, high
school 11.8%, post graduate 7.3% and others 3.6%. There was missing value of 3 respondents who
failed to disclose their education representing 2.7%.

23
4.2.4. Respondents Occupation
Table 4.5 The occupation of the respondent
Occupation
Frequency Percent
Cumulative
Percent
Valid Service 9 8.2 8.3
Professional 47 42.7 51.4
Business 53 48.2 100.0
Total 109 99.1
Missing 77 1 .9
Total 110 100.0
Source: Research Data (2017)
From table 4.5 above, the occupation of most of the respondents was business with 48.2%, followed
by professional 42.7% and finally service posted 8.2%. Further, 0.9% of the total respondents did not
indicate their occupation.
4.2.5. Respondents Level of Income
Table 4.6 The Income Level of the Respondents
Income
Levels Frequency Percent
Cumulative
Percent
Less than 15,000
6
5.5
5.6
15,001 - 25,000 18 16.4 22.4
25,001- 35,000 21 19.1 42.1
35,001 & Above 62 56.4 100.0
Total 107 97.3
Missing 77 3 2.7
Total 110 100.0
Source: Research Data (2017)
From table 4.6 the study found that 56.4 % of the respondents earned high incomes of 35,001 &
above followed by 25,001 – 35,000 (19.1%), 15,001 – 25,000 (16.4%) while those earned less than
15,000 accounted to 5.5%. The missing value showed those who failed to disclose their income
range was 2.7%. The high level of income is attributed to the high percentage of the respondents
being either on professional and business occupation.

24
4.2.6. Respondents Type of Phone used
Table 4.7 Type of the phone used/sold by the Respondent
Phone
Type Frequency Percent
Cumulative
Percent
Nokia 10 10.3 10.3
Samsung 27 27.8 38.1
Apple 1 1.0 39.2
Tecno 25 25.8 64.9
Oppo 1 1.0 66.0
IPhone 5 5.2 71.1
Huawei 10 10.3 81.4
Others 16 16.5 97.9
All of the above 2 2.1 100.0
Total 97 100.0
Source: Research Data (2017)
The research findings found out that Samsung and Tecno had the majority of the users with 27.8%
and 25.8% respectively of the total ultimate consumers and dealers. They were followed by Nokia
and Huawei phone which represented 10.3% each. The Oppo and Apple reported lowest number of
users with 1% of the total ultimate consumers and dealers each.
4.2.7. Frequency in which the respondents change/import their phone.
Table 4.8 Frequency in which the respondents change/import their phones
Frequency Percent
Cumulative
Percent
Less than 1 Year
28
28.9
28.9
1-2 Years 47 48.5 77.3
2-4 years 18 18.6 95.9
Above 4 Years 4 4.1 100.0
Total 97 100.0
Source: Research Data (2017)

25
The study showed that majority of the respondents change their phones after 1-2 years of use
representing 48.5% of the total respondents, 28.9% stated that they changed their mobile in less than
1 year of use. Further, 4.1% of the respondents stay longer with their phone before acquiring new
ones.
4.2.8. The cost that respondents are willing to incur for a mobile phone
Table 4.9: The cost that respondents are willing to incur for a phone
Frequency
Percent
Cumulative
Percent
Less than 10,000
21
21.6
21.6
10,000-20,000 69 71.2 92.8
20,000-40,000 7 7.2 100.0
Total 97 100.0
Source: Research Data (2017)
Table 4.9 shows the cost willingness of the respondents towards acquiring a new mobile phone. The
study found out that 71.2% of both ultimate consumers and the dealers were willing to pay 10,000 –
20,000, for a phone this majority of the respondents are clearly attributed with the extent to which
customers tastes and preferences towards high end phones has increased due to the service quality
offered for instance exclusive features; Facebook, WhatsApp and internet. Those willing to pay less
than 10,000 accounted for 21.6% while 20,000 -40,000 reported 7.2%.

26
4.2.9. Type of brand offered by the manufacturer
Table 4.10 The type of brand offered by the manufacturer
Brand Frequency Percent
Cumulative
Percent
Nokia 2 15.4 15.4
Samsung 2 15.4 30.8
Apple 1 7.7 38.5
Tecno 3 23.1 61.5
Oppo 1 7.7 69.2
Huawei 1 7.7 76.9
Others 3 23.1 100.0
Total 13 100.0
Source: Research Data (2017)
From 110 total respondents 13 manufacturers were involved in the study and it was found out that
Tecno brand and category of others which included Infinix and HTC represented high percentage of
the total respondents 23.1% respectively. Samsung and Nokia posted the same percentage of 15.4%
and lastly Apple, Oppo and Huawei had the least 7.7%.
4.2.10. Research and Development For Conformance
Table 4.11 Survey of non-performing products in the market by the
manufacturer
Frequency Percent
Cumulative
Percent
Once a year 5 38.5 41.7
Twice a year 4 30.8 75.0
Five times a year 1 7.7 83.3
Others 2 15.4 100.0
Total 12 92.3
Missing 77 1 7.7
Total 13 100.0
Source: Research Data (2017)

27
The study sought to find out how often the mobile handset manufacturers conduct research/survey
about the non-performing products in the market. Table 4.11 indicates that majority of the
manufacturers 38.5% of the total manufacturer’s segment conduct research once a year then
followed by those conducted research twice a year 30.8%. There is need for manufacturers to
increase the frequency in which they conduct research on non-performing products annually so that
they clearly understand the changes on the needs of customers in the market.
4.3 Reliability analysis.
To test the reliability of the variables used in the questionnaire, reliability analysis was conducted.
Table 4.12 Cronbach’s Alpha Coefficient
Variables No of items Cronbach’s Alpha
coefficient
Tangibles
Reliability
4
4
0.893
0.887
Responsiveness 3 0.898
Assurance
Empathy
Perceived network quality
4
4
6
0.852
0.939
0.910
All quality dimensions 25 0.897
Source: Research Data (2017)
Reliability test for all quality dimensions used in the study was conducted. The results of Cronbach’s
alpha obtained from the SPSS output showed that the coefficient values varied from 0.852 for
assurance dimension to 0.939 for empathy dimension as illustrated in table 4.12 above. The value for
the entire Cronbach’s alpha for all quality dimensions was 0.897 which exceeded the minimum,
Parguel, Delécolle, & Valette-Florence (2016) accepted level of 0.70. Therefore, the entire quality
dimensions used in the study were reliable with high internal consistency.
4.4 Comparative statistics
The comparative statistics was carried out to explore customer perception on quality dimensions
pursued by the service provider as well as manufacturer’s perception on the quality dimensions they
pursue to enhance customer satisfaction.

28
4.4.1 Establishing the respondent’s perception on quality dimensions
This section analyzed comparative means of the data collected on scale basis. It is concerned with
the respondent’s perception concerning the quality dimensions. This section also established the
quality dimensions demanded by the mobile phone buyers in Kenya. The quality dimensions were
measured on likert scale with minimum scale of 1 and a maximum scale of 7, scale 1 being highly
dissatisfied while scale 7 highly satisfied. The mean score of below 5.50 was ranked moderately
satisfied, between 5.50 and 6.50 was ranked satisfied with the quality dimensions pursued by
manufacturers while between 6.50 and 7.00 was highly satisfied. The standard deviations was also
obtained, it indicated the variation from the mean. A standard deviation greater than 1 showed
significant variation from the mean as compared to that of less than 1 which implied no significant
variation from the mean.
Table 4.13 Customers perception on quality dimensions pursued by manufacturers
Tangibles
Valid Missing
Mean Std deviation
Branches are
located in
convenient places
97 0
6.12 1.053
Physical facilities
are visually
appealing
96 1
6.06 1.195
The service
provider has up-to
date equipment
97 0
5.97 1.194
Employees are
well dressed and
neat in
Appearance
97 0
5.95 1.202
Source: Research Data (2017)

29
Reliability
Valid Missing
Mean Std. deviation
The service
provider does
whatever it
promises
97
0
5.57
1.406
Manufacturers
solving customers
problems
97 0
5.97 1.113
Manufactures
provides services
at the time it
promises
96 1
5.54 1.337
The service
charges are
accurate
95 2
5.62 1.169
Source: Research Data (2017)
Responsiveness
Valid Missing
Mean Std. deviation
Employees gives
prompt service 97 0
5.57 1.406
Employees
always willing to
help
97
0
6.20
1.113
Employees
respond to
customer request
when busy
97 0
5.44
1.337

30
Source: Research Data (2017)
Assurance
Valid Missing
Mean Std. deviation
The employees
can be trusted 96 1
6.17 1.279
Customers feels
safe doing
business with
provider
97 0
5.79 1.322
Provider protects
customer
confidentiality
97 0
6.09 1.267
Employees are
consistently
courteous with
customer
97 0
6.22 1.301
Source: Research Data (2017)
Empathy
Valid Missing
Mean Std. deviation
The employees
provide individual
attention
97 0
5.57 1.406
The employees
know the
customer needs
96 0
5.97 1.113
Provider has
operating hours
convenient to all
97
1
5.54
1.337
The employees
have best of
interest of
customers
97 2
5.62 1.169
Source: Research Data (2017)

31
Perceived Network Quality
Valid Missing
Mean Std. deviation
Call quality of
network is good
competitive
advantages
97
0
6.29
.1.266
Provider has more
competitive prices
than its
competitors
97
0
6.26
1.387
Provider has
wider range of
products and
services
97 0
6.37 .870
Provider has
better service
quality than its
competitors
97
0
5.85
1.453
Service provider
offers better
products and
services
97
0
6.07
.893
Source: Research Data (2017)

32
Customer satisfaction
Valid Missing
Mean Std. deviation
Using the product
has been a good
experience
97 0
5.63 1.431
Products and
services are of
quality
97 0
5.44 1.291
Products and
services fully
meet customers’
needs
97
0
5.60
1.344
Source: Research Data (2017)
As shown in table 4.13, customer’s opinions were slightly above moderate. Tangible service quality
have a general mean value of 6.03, where customers were satisfied with the provider having
branches located in convenient places as well as physical facilities being visually appealing.
Reliability service quality posted a mean of 5.68 in general, which was the lowest as compared with
other quality dimension. Customers showed fairly satisfaction on the services provider towards
solving their problems. Further, they were somewhat satisfied concerning the service charges being
accurate. Responsiveness service quality had a value mean of 5.74, under this quality dimension,
customers were satisfied with the willingness of the employees to help them, but showed a slightly
average opinion concerning employee’s willingness to respond to their requests when they are busy.
Assurance service quality yielded a mean value of 6.07. The courteousness and trustworthy of the
employees and the fact that they maintained confidentiality of the customer’s information recorded
high mean showing that the customers were satisfied. Further, customers indicated a moderate
satisfaction on the safety of doing business with the provider. Empathy quality dimension yielded
value mean of 5.90. The study found out that employees had best interest of the customers at their
heart and that they were aware of the need of customer. Generally, empathy service quality received
a moderate opinion. Perceived network quality had the highest mean value 6.25 amongst the six
quality dimensions. Customers were highly satisfied by the strong and wide range network, satisfied

33
by the call quality of the network, competitive nature of prices, wider range of product and services
and that the provider offers better products and services.
In summary, customers were satisfied with the perceived network quality, assurance and tangible of
service quality, which yielded highest mean value of above 6.00. Customers were not satisfied
enough with reliability, empathy, and responsiveness of service quality which had a low value of
mean. Furthermore, customer satisfaction had a moderate mean 5.56, which means that customer
satisfaction may have strong relation with the three dimensions of service quality (reliability,
empathy and responsiveness).
4.4.2 Ranking of the quality dimensions
Table 4.14 Ranking of quality dimensions
Quality Dimensions Mean Standard
Deviation
Perceived Network
Assurance
6.25
6.07
1.119
1.292
Tangible 6.03 1.161
Empathy
Responsiveness
Reliability
Average
5.90
5.74
5.68
5.95
1.312
1.500
1.256
1.273
Source: Research Data (2017)
The summary of the descriptive statistics of the quality dimensions is given in the table 4.14 above.
The results indicated that the perceived network quality yielded the highest value of mean (6.25)
while reliability the lowest value of mean (5.68). Since the value of the mean ranges between 5.68
and 6.25, it resulted to a general mean value of 5.95 with a standard deviation of 1.273. Therefore, it
can be concluded that the customers are having slightly above average opinion on all the quality
dimensions pursued by the manufacturer.
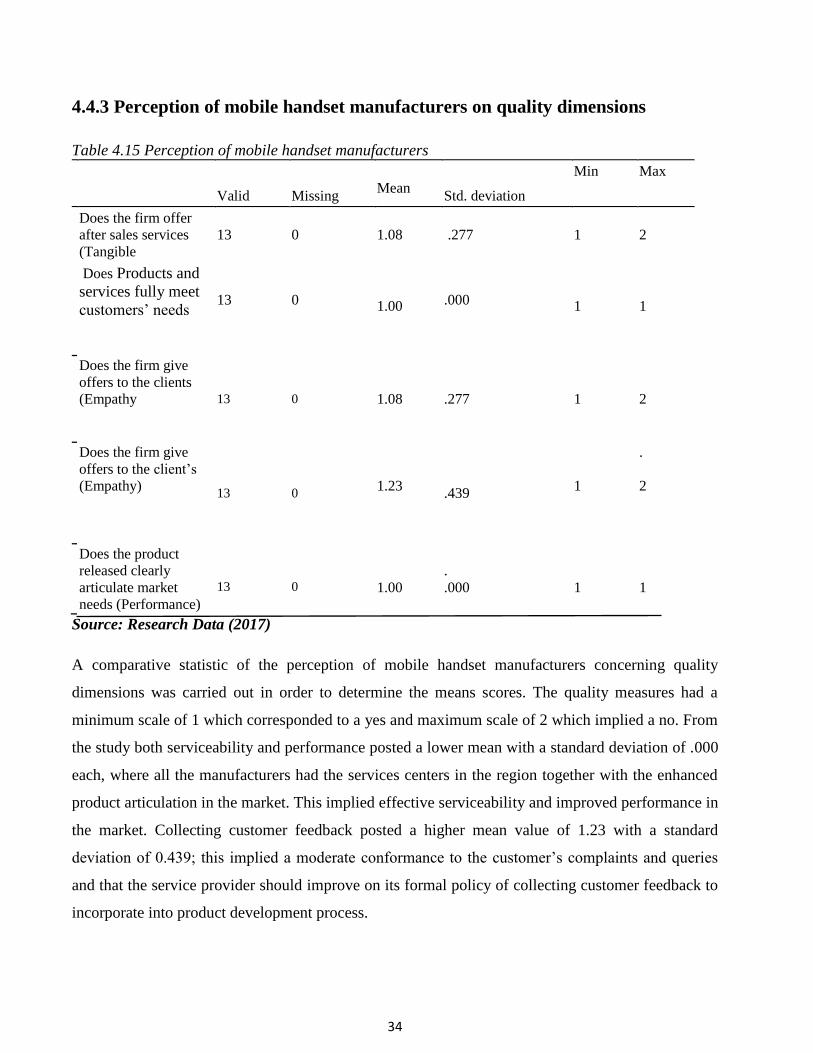
34
4.4.3 Perception of mobile handset manufacturers on quality dimensions
Table 4.15 Perception of mobile handset manufacturers
Valid Missing
Mean Std. deviation
Min Max
Does the firm offer
after sales services
(Tangible
13 0
1.08 .277
1
2
Does Products and
services fully meet
customers’ needs
13
0
1.00
.000
1
1
Does the firm give
offers to the clients
(Empathy
13 0
1.08 .277
1
2
Does the firm give
offers to the client’s
(Empathy)
13 0
1.23
.439
1
.
2
Does the product
released clearly
articulate market
needs (Performance)
13
0
1.00
.
.000
1
1
Source: Research Data (2017)
A comparative statistic of the perception of mobile handset manufacturers concerning quality
dimensions was carried out in order to determine the means scores. The quality measures had a
minimum scale of 1 which corresponded to a yes and maximum scale of 2 which implied a no. From
the study both serviceability and performance posted a lower mean with a standard deviation of .000
each, where all the manufacturers had the services centers in the region together with the enhanced
product articulation in the market. This implied effective serviceability and improved performance in
the market. Collecting customer feedback posted a higher mean value of 1.23 with a standard
deviation of 0.439; this implied a moderate conformance to the customer’s complaints and queries
and that the service provider should improve on its formal policy of collecting customer feedback to
incorporate into product development process.

35
4.5 Correlation Analysis
Pearson correlation analysis was further used to describe the relationship between the dependent
variable customer satisfaction (C.S) and the independent variables; tangible (T.QD), reliability
(R.QD), responsiveness (W.QD), assurance (A.QD), empathy (E.QD) and network quality (N.QD).
A correlation coefficient that is greater than 0.8, reveals a high and strong correlation among the
variables that would lead to multicollinearity and would not be regressed.
4.5.1 Relationship between dependent variable (customer satisfaction) and
independent variables (quality dimensions)
Table 4.16 Correlation Matrix
C.S T.QD R.QD W.QD A.QD E.QD N.QD
C.S Pearson
Correlation 1
T.QD Pearson
Correlation .476** 1
R.QD Pearson
Correlation .576** .316** 1
W.QD Pearson
Correlation .506** .129 -.022 1
A.QD Pearson
Correlation .142 .176 .088 -.077 1
E.QD Pearson
Correlation .496** .212* .147 .107 .098 1
N.QD Pearson
Correlation .127 .098 -.047 .058 .154 .054 1
**. Correlation is significant at the 0.01 level (2-tailed).
Based on the Pearson correlation analysis finding in the table 4.16, there was a positive correlation
between the dependent variable and independent variables with the highest correlation being on
reliability, responsiveness and empathy. On the other hand, there was a positive correlation among
several quality dimensions of independent variables. However, the results from the correlation
matrix above revealed Pearson (r) < 0.8; this necessitated the need for conducting regression analysis
to further understand the impact of quality dimensions on customer satisfaction.

36
4.6 Regression Analysis
Having passed the above test, linear regression analysis was conducted to determine which quality
dimensions of independent variable (network, tangible, responsiveness, reliability, assurance and
empathy) explained the variability in dependent variable (Customer Satisfaction).
Table 4.17 Model Summary
Model R R Square Adjusted R Square
Std. Error of the
Estimate
1 .807a .651 .627 .964
a. Predictors: (Constant), Network, Tangible, Responsiveness, Reliability, Assurance,
Empathy
Table 4.18 ANOVAb
Model Sum of Squares df Mean Square F Sig.
1 Regression 152.730 6 25.455 27.364 .000a
Residual 81.860 88 .930
Total 234.589 94
a. Predictors: (Constant), Network, Tangible, Responsiveness, Reliability, Assurance,
Empathy
b. Dependent Variable: Customer Satisfaction
Table 4.17 of the model summary above indicated the strength of the relationship between customer
satisfaction and the quality dimension. The overall regression model as estimated by the Adjusted R
Square implied a good fit. The model was significant with R Square = 0.651, Adjusted R Square =
0.627 and F value = 27.364 as illustrated in table 4.17 and 4.18 above. Thus, 62.70% of variability in
the customer satisfaction would be explained by the quality service dimensions (network, tangible,
responsiveness, reliability, assurance and empathy) with statistical significance.

37
Table 4.19 Coefficients
Model
Unstandardized
Coefficients
Standardize
d
Coefficient
s
t Sig.
95.0% Confidence
Interval for B
B Std. Error Beta
Lower
Bound
Upper
Bound
1 (Constant) .799 .407 1.961 .053 -.011 1.609
Tangible .353 .066 .434 5.369 .000 .223 .484
Reliability .346 .093 .339 3.711 .000 .160 .531
Responsivene
ss .042 .079 .048 .535 .594 -.114 .198
Assurance .159 .106 .151 1.491 .140 -.053 .370
Empathy .033 .124 .033 .264 .792 -.213 .278
Network .034 .086 .035 .381 .704 -.203 .138
a. Dependent Variable: Customer satisfaction
Linear regression model recorded the coefficients of independent variables (network, tangible,
responsiveness, reliability, assurance and empathy) as illustrated in the table 4.19. Based on table
4.19 two of the quality dimension proved to be significant; reliability service quality and tangible
service quality. This implied that reliability and tangible service quality had greater influence on
customer satisfaction variability contributing largely to the Adjusted R square of 62.7%. The
coefficients of (network, responsiveness, assurance and empathy) proved not significant, implying
that the service provider needs to work more on the network quality, responsiveness, assurance and
empathy to ensure customers are fully satisfied by their entire pursued quality dimensions.
4.7 Results finding
4.7.1 Establishing the quality dimensions demanded by mobile phone buyers.
The first objective of the study was to establish quality dimensions demanded by mobile phone
buyers in Kenya. To ascertain the quality dimensions, a comparative statistics was conducted and
from the table 4.14 ranking of quality dimensions as perceived by the customers and dealers,

38
perceived network quality, assurance and tangible came top with highest means. They were followed
by empathy, responsiveness and finally reliability in that order. However, upon conducting
regression analysis, as from table 4.19 model coefficients, it was ascertained that tangible and
reliability would significantly influence the variability of customer satisfaction, though
responsiveness, assurance, empathy and network quality recorded positive coefficients.
4.7.2 The relationship between quality dimension and customer satisfaction.
The third objective of the study was to establish the relationship between the quality dimensions
pursued by the mobile handset manufacturers and the customer satisfaction. To achieve this
objective, customer satisfaction was regressed against the quality dimensions (network, tangible,
responsiveness, reliability, assurance and empathy) and from the regression output coefficient results
in the table 4.19, all quality dimensions posted a positive relationship between them and the
customer satisfaction, which concurred with the correlation analysis. Two of the quality dimension
proved to be significant; reliability service quality and tangible service quality. While on the other
hand, the coefficients of (network, responsiveness, assurance and empathy) proved not significant
but had a positive relationship with the customer satisfaction Sureshchandar, Rajendran, &
Anantharaman. (2002). Therefore it is clear that, there is a statistically significant relationship
between customer satisfaction and the quality dimensions, as from the model summary table 4.17
and ANOVA table 4.18, 62.7% of the variability in customer satisfaction is significantly explained
by the quality dimensions under study.

39
CHAPTER FIVE: SUMMARY OF FINDINGS, CONCLUSIONS AND
RECOMMENDATIONS
5.1 Introduction
The specific objectives of this study were to determine the quality dimensions demanded by mobile
handsets customers, to determine the quality dimensions pursued by mobile handset manufacturers
and to establish the relationship between quality dimensions and customer satisfaction. The data
collated resulted to the following discussions, conclusions and recommendations on these objectives.
5.2 Summary
Findings from the first objective which was to establish the quality dimensions demanded by mobile
handset customers depicts that Samsung had taken a lead in the number of users of its products since
it has the highest percentage, followed by Techno, Nokia,Huawei and others. It was also established
that the maximum period of time that customers used mobile phones was between 1 to 2 years and
majority of customers were willing to purchase a phone at a cost of between Ksh10,000 to
Ksh20,000. This implies that customers perception towards mobile handsets has changed drastically
over the years, the customers no longer view mobile phones as communication gadgets for calling
and texting but rather working and entertainment gadgets due to the technological advancement and
therefore attention shifts to the quality dimensions demanded by the mobile phone buyers.
Majority of the customers were satisfied with the tangibility in the sense that the branches were
located in convenient locations, the physical facilities were visually appealing, the service providers
had up to date equipment and employees were neatly dressed. The customers further argued that the
manufacturers fulfilled what they promised especially when complains arise they were resolved in
good time for instance warranties were issued to the clients in the appropriate time, the service
centers ensured all clients are served at affordable costs and to a large extent reliability of the mobile
handset manufacturers was considered of high standards by the ultimate consumer and dealers.
However the customers held dissenting opinion on assurance ,perceived quality ,empathy and
responsiveness ,a number of clients were not satisfied with trust levels of the employees ,they did not
feel safe doing business with the firms ,they were afraid of the confidentiality of their information
and were not also happy with the customer care ,this could be attributed to the fact that today many
firms sell counterfeit goods ,they stated that getting an original phone in the market had been

40
difficult and thus the manufacturers need to work on plan to ensure that the products and services are
authentic. The customers were not satisfied with the level of empathy that the service provider offers
especially on the operating hours, most manufacturers run their businesses for close to nine hours per
day, however the customers are of the opinion that if the firms had their interest at heart then they
should extend the operating hours.
The clients were of the opinion that network quality needs to be improved by majority of
manufacturers, they stated that their phones lose network in many occasions and the manufacturer
has to take into account certain measures to eliminate such experiences , they also noted that they
pay a high price to get a mobile phone with a high quality and exclusive features, however a few
consumers were not happy with the range of products and service offered ,customers owning iPhone
complained of lack of phone accessories such as chargers and service centers. The clients expressed
dissatisfaction on the responsiveness level of the manufacturers such that they have failed to respond
to the question of durability of the mobile phones. They assert that concerns have been raised
regularly on the battery life of the phone, why smartphone battery have short lifespan and employees
have not been in a position to give prompt feedbacks however the energy saving mode has been of
help but this means that they have to close a number of applications such as What Sapp, video,
Bluetooth and Facebook. They also attribute failure in network to lack of sufficient internal storage
memory.
The ranking of SERVEQUAL dimensions was in the following order Tangible first, reliability
second, assurance third, responsiveness fourth, perceived quality fifth and empathy last. Linear
regression model recorded the coefficients of independent variables (network, tangible,
responsiveness, reliability, assurance and empathy) Of the quality dimensions, reliability and
tangible service quality had greater influence on customer satisfaction variability. The co- efficient
of network, responsiveness, assurance and empathy proved not significant and the manufacturers
need to concentrate more on them to ensure customer satisfaction.
On the second objective to establish the quality dimensions pursued by mobile handset
manufacturers findings revealed that manufacturers focused on tangibles and reliability where they
located branches in convenient locations for ease of accessibility by customers ,they had ensured that
the physical facilities are visually appealing such that the products are well displayed in shelves with
good packaging ,they have also capitalized on up to date equipment for instance the gadgets had

41
apps installed that enables customers to contact the customer care and service centers where the
device has a breakdown. The firms have also adopted a strong management team where employees
have specific dress codes; they dress according to the products offered to make it easier for
customers to identify with the products and services offered (branded shirts). It was established that
the manufacturers compete on price where some manufacturers try as much as possible to release
phones with high exclusive features at low cost for instance Infinix Limited. Collecting customer
feedback posted a higher mean value of 1.23 with a standard deviation of 0.439; this implied a
moderate conformance to the customer’s complaints and queries and that the service provider should
improve on its formal policy of collecting customer feedback to incorporate into product
development process. However, they need to focus on the responsiveness, perceived network
quality, empathy and assurance whose standard deviation was high implying that the customers were
not satisfied with those quality dimensions.
The third objective was to establish the relationship between quality dimensions and customer
satisfaction, regression findings revealed that a relationship exist between quality dimensions and
customer satisfaction such that if the manufacturers do not pursue all the quality dimensions in equal
measure variability with regards to customer satisfaction is evident. Further analysis indicated that
the relationship was not proportionate as indicated in the disparities in the correlation coefficient on
each quality dimension.
5.3 Conclusions
The study sought to assess the quality dimensions and customer satisfaction: a case of mobile
handset manufacturers in Kenya. The findings indicated that manufacturers have concentrated on
tangibles and reliability in their quest to satisfy customer wants in the mobile industry. The
customers were however not satisfied with the extent to which empathy, responsiveness, assurance
and perceived network quality were administered by the mobile handsets manufacturers. Customer
satisfaction levels are positively linked to service quality but not proportionately.
5.4 Recommendations
Quality dimensions is generally important for a firm to achieve high levels of customer satisfaction,
however there is need for improvement as customers are not satisfied in most areas. A lot can be
done to ensure customer receive more than the perceived value on all service quality dimensions for

42
instance empathy, assurance, perceived quality, responsiveness, tangibles and reliability. To
maintain high performance level a firm should improve the network quality of the mobile handsets,
ensure that they put in place mechanisms to detect and address counterfeit products, ensure they
manufacture phones with long lasting battery life, increase the internal storage capacity of the
phones and ensure the phone has an android operating system which is mostly preferred by clients.
Firms that will focus on those parameters of quality dimensions stand a good chance to maintain
high market share and win confidence of the clients.
5.5 Limitations of the Study
There was a delayed response and researcher had to increase the number of questionnaires
distributed to increase the response rate. Some respondents were reluctant to participate in the
research and had to be convinced that it was an academic exercise. Some respondents were asking
too many questions on the study and did not end up filling the questionnaires this was time wasted
for the researcher. The duration of the study was short to reach out to majority of the respondents.
5.6 Suggestions for further study
There is need for researchers to further carry out studies on the same subject of ‘Quality dimensions
and customer satisfaction: a case of mobile handset manufacturers in Kenya’, there are number of
concerns that customers raise on day to day life for instance most smartphone clients complain of
battery life in the sense that they have to charge their smartphones at least thrice a day ,durability is
one of the quality dimensions that future researchers need to focus on especially studying the
importance of battery life of a mobile phone to a consumer and how the manufacturers stands to
gain competitive edge on successfully implementation of a smartphone with long battery life.

43
REFERENCES
Abdulrahman, A.& Muhammad, A.K.(2011). Measuring the Service Quality of Mobile Phone
Companies in Saudi Arabia. Administrative Science,22(2),43-45.
Adelman, Mara B., Aaron,A.& Cathy,G.(2000).Beyond Smiling,” in Service Quality: New
Directions in Theory and Practice New York: Sage,
Agrawal, and Muthulingam,(2015). Does Organizational Forgetting Affect Vendor Quality
Performance? An Empirical Investigation” .Manufacturing & Service Operations
Management .Department of Business Administration, University of Illinois. 17(3), 350– 367
Akhter,B. &Uddin, M.B.(2012). Customer Satisfaction in Mobile Phone Services in Bangladesh: A
Survey research management and marketing journal,1, 20-36
Aliaga and Gunderson (2006). A Survey of Latest Performance, Development and Measurement
Issues of Smart Phones Design Interactive Statistics .Upper Saddle River NJ; Pearson
Prentice Hall
Anantamula,V.S.&Kanungo, S. (2010). Modeling enablers for successful KM implementation”,
Journal of Knowledge Management, 14 ( 1 ),100-113.
Antony, S.and Pamela,A.O. (2013).Cell phone disposal and strategic evaluation of electronic
waste management in Kenya, a case of mobile phone dealers in Kisumu county.
European Journal of Business and Innovation Research 1(4),1-8, Published by
European Centre for Research, Training and Development UK (www.ea-journals.org)
Bügel, M. ,Buunk, A. & Verhoef, P. (2010).A comparison of customer commitment in five sectors
using the psychological investment model”, Journal of Relationship Marketing , 9( 1), 2-29.
Cater, B. & Zabkar, V. (2009).Antecedents and consequences of commitment in marketing
research services: the client’s perspective”, Industrial Marketing Management,
38(7), 785-797.

44
Chong, S.C. (2006).KM critical success factors: a comparison of perceived importance versus
implementation in Malaysian ICT companies”, The Learning Organization,13(3),
230-256.
Chu‐HuaKuei.(2003).Competing on Quality and Environment", International Journal of Quality &
Reliability Management, 20 (8)980-990,
Clutter buck d. & Wynne B. (1993).Mentoring and coaching', in A. Mumford (ed. ) Handbook of
Management Development.Aldershot, Gower
Crosby (1995) Quality Is Free: The Art of Making Quality Certain ,M.C. Graw-Hill, 1995
Danny,C.,Vincent,G.,&Heloisa,M.(1999) An empirical analysis of effective TQM implementation in
the Hong Kong electronics manufacturing industries. Human factors & Ergonomics in
manufacturing and service industries, 9 (1),1-25.
, Massachusetts Institute of Technology, Cambridge, MA.
Douglas,T.J. & Judge,W.Q. (2001).Total quality management implementation and competitive
advantage: the role of structural control and exploration”, The Academy of Management
Journal, 44( 1),158-169.
Drucker, P. (1994),The age of social transformation, The Atlantic Monthly, 174( 5),53-80.
Emmanouil, S.,&Christos, K. (2009).A model to identify the dimensions of mobile service quality,
Georgiadis university of Macedonia Thessaloniki, Greece
Ewan, S. (2007).The regulation of the quality of service in mobile networks.University of
Witwatersrand, LINK Centre
Fernandez, I.B. & Sabherwal, R. (2010). Knowledge Management–Systems and Processes, PHI
Learning Private Limited, New Delhi.
Fornell, C. (1992). A national customer satisfaction Barometer: The Swedish Experience. Journal of
Marketing, 56 (1), 6-21.

45
Fullerton, G. (2005), “How commitment both enables and undermines marketing relationships”,
European Journal of Marketing,39( 11) 1372-1388.
Furahiji & Wawrzyniak. (2012).An empirical study of the factors influencing consumer behaviour
in the electric alliances market. Contemporary Economics, 6(3), 76-86.
Gartner (June 2016).Analysis on Worldwide Smartphone’s Sales. Gartner Press Released.
Retrieved from http://www.gartner.com/newsroom/id/3339019.
Garvin, D. (1987).Competing on the Eight Dimensions of Quality. Harvard Business Review, 87,
101-109.
Garvin, D. (1984), “What does product quality really mean?”, Sloan Management Review,
26(1),25-43.
Gitangu, I. (2015). Total quality management and competitive advantage of small and medium
enterprises in Nairobi city, unpublished MBA research paper. University of
Nairobi, school of business.
Gotzamani, K. (2010).Results of an empirical investigation on the anticipated improvement areas
of the ISO 9001:2000 standard”, Total Quality Management,21 (6),687-704.
Grant, M. (2005) Contemporary Strategic Analysis 5th edition United Kingdom; Blackwell
Publishing Limited.
GSM Arena (2010) Story of Shapes & Sizes: Mobile Phone Evolution ,GSMArena.com
Gupta, B., Iyer, L.S. & Aronson, J.E. (2000).Knowledge management: practices and
challenges”, Industrial Management & Data Systems, 100 (1),17‐21.
House of Commons (1995), The Consequences of Deregulation, Transport Committee Report,
November.
Hansemark O.C.and Albinsson M.(2004), Customer satisfaction and Retention; the experience of
individual employees, managing service quality, 14(1);40-57

46
Jahanzeb, S. ,Fatima, T. & Khan, M. (2011).An empirical analysis of customer loyalty in Pakistan’s
telecommunication industry”, Journal of Database Marketing & Customer Strategy Management ,
18( 1),5-15.
John,D.(1998).Competing through quality in transport services, Managing Service Quality: An
International Journal, 8 (2),112-118.
Johnson, William,C. & Sirikit, A. (2002).Service Quality in the Thai Telecommunication Industry:
A Tool for Achieving a Sustainable Competitive Advantage." Management Decision, 40(7),
693-701
Jumia Business Intelligence & GSMA Mobiles (2017). Report on Smartphone Penetration.
Retrieved from http://www.modernmom.co.ke/2017/04/white-paper-2017-trends-
from-kenyan.html
Juran,J., Blanton,G & Edward,F.(2001) Quality in Customer Service, McGraw-Hill Tokyo.
Kaoru,I.(1990).Introduction to Quality Control ,3A Corporation Tokyo Japan.
Kothari, C.R. (2004). Research methodology: Methods and techniques. (2nd ed.). New Delhi: New
Age international ltd.
Keijzers.(2008). Usability benchmark study of commercially available smart phones: cell phone
type platform, PDA type platform and PC type Conference Paper.
Kemibaro,M.(2016).SocialMediaWeekIndependent:https://www.kenyamoja.com/content/moses-
kemibaro-social-media-week-independent-nairobi-2016-almost-here/
Khanna, T. ,Song, J. & Lee, K. (2011).The paradox of Samsung’s rise, Harvard Business Review
, 89 (7), 142-147.
King, A.W. and Zeithaml, C.P. (2003), “Measuring organizational knowledge: A conceptual and
methodological framework”, Strategic Management Journal, 24 ( 8),763‐772
Kotler,P. (2011) .Competition protection and Philip Kotler's strategic recommendations

47
Lewis, W. G., Pun, K. F., & Lalla, T. R. M. (2006). Exploring soft versus hard factors for TQM
implementation in small and medium-sized enterprises. International Journal of
Productivity and Performance Management, 55(7), 539 - 554.
Managementstudyguide. (2008) Six Sigma and Quality Management: Comparison of Six Sigma and
Total Quality Management:ManagementStudyGuide.com
McDougall G., & Levesque T., (2000), "Customer Satisfaction with Services: putting perceived
value into the equation", Journal of Services Marketing,14 (4/5)392-410.
Monaghan, A. (2013). Nokia: the rise and fall of a mobile phone giant. The Guardian,Pg 87.
Motwani, J. (1995), Implementing TQM in education: current efforts and future research
directions”,Journal of Education for Business, 71 (2), 60-3.
Nimit C. & Monika P. (2007) .Prioritizing service quality dimensions. Managing Service Quality, 17
( 5), 493-509
Oliver, D. (2017). Simple mobile phones and feature handsets put to the test: Assessment of basic
mobile phones for usability, capability, performance, style and value for money.
Wired UK.
Panda, T.K (2003).Creating customer lifetime value through effective CRM in financial services
industry. Journal of Services Research, 2(2), 157-171.
Paranitharan K.P, Ramesh Babu T, Pal Pandi A & Jeyathilagar D(2004). An empirical validation
of integrated manufacturing business excellence model The International Journal of
Advanced Manufacturing Technology 24(9),1-25.
Parguel, B., Delécolle, T., & Valette-Florence, P. (2016). How price display influences consumer
luxury perceptions. Journal of Business Research, 69(1), 341-348.
Peter,J.H.(2004).Verizon Customers Put It At Top In Wireless Service Satisfaction Survey.
Knight Ridder!Tribune Business News, 1-5.

48
Pezeshki,V.Moosavi,A.&Grant,S.(2009).Importance-Performance Analysis of Service Attributes
and Its Impact on Decision Making In The Mobile Telecommunication Industry." Measuring
Business Excellence, 13( I), 82-92.
Philip, K. L. (2012). Marketing Management- A south Asian Perspective. Delhi, Chenni: Pearson
Puri,(2016).Capabilities of Android operating system. Retrieved from https://jagannath-
puri.droidinformer.org/
Quy, H. & Timo,V.(2015) Who Killed Nokia? Nokia Did-Aalto, INSEAD Knowledge The
Business School For The World
Rachel.S(2017).How Quality Inspection Software Can Improve Product Manufacturing: Edition of
Quality,Quality Magazine
Reichheld, Fredrick F., & W. Earl Sasser (2001), “Zero Defections: Quality Comes to Services,”
Harvard Business Review, 68,105–111.
Selom,K.(2016).The Impact Of Branding On Consumer Decision Making In The Ghanaian
Telecommunication Industry; A Case Of Expresso Central Institute Of Technology.
Shirin, A. & Puth, G. (2011), “Customer satisfaction, brand trust and variety seeking as
determinants of brand loyalty”, African Journal of Business Management,
5(30),11899- 11915
Sime, C. & Shawnee, V.(2000).Quality-related Action Programs: Their Impact on Quality
Performance and Firm Performance.
Saghier N. E. and Nathan, D. (2013). Service Quality Dimensions and Customers‟Satisfactions of
Banks in Egypt. International Business Research Conference Paper.
Soko Insight (2016).Building Mobile Apps That Impact African Consumers. Management &
Marketing Journal. 2012,10(1),20-36.

49
Stat Counter Global Stats.(2017) Market Share of Mobile Phones in Kenya
http://gs.statcounter.com/vendor-market-share/mobile/kenya
Sultana, R. &Chowdhury.(2017) International Journal of Scientific & Engineering Research,
8(2),1-10,http://www.ijser.org, Measuring the Relationship Between Product Quality
Dimensions & Repurchase Intention of Smart Phone: A Case study On Chittagong City.
Sureshchandar, G. S., Rajendran, C., & Anantharaman, R. N. (2002). The relationship between
service quality and customer satisfaction–a factor specific approach. Journal of services
marketing, 16(4), 363-379.
Sweeney, J. (1997).Retail service quality and perceived value: A comparison of two models.
Journal of Retailing and Consumer Services,4 (1), 39-48
Tito, C. (2010).Systems thinking in quality management", The TQM Journal,22 (4),352-368.
Tung,F.(2010).Exploring Customer Satisfaction, Perceived Quality and Image: An Empirical
Study in the Mobile Services Industry
U.S. General Accounting Qffice(1991).Management Practices:U.S.Companies Improve
Performance through Quality Efforts. U.S. General Accounting Qffice,
Gaithersburg, MD.
Vlachos, A. & Vrechopoulos, P. (2008).Determinants of behavioral intentions in the mobile
internet services market”, Journal of Services Marketing,22( 4) ,280-291
Wan,S.S., & Chongman,K. (2015).Samsung’s journey to excellence in quality", International
Journal of Quality and Service Sciences, 7(2/3),312-320.
Wang, C. & Wu, L. (2012).Customer loyalty and the role of relationship length”, Managing
Service Quality ,22( 1),58-74.
Wang, R.Y., Lee, Y.W., Pipino, L.L. & Strong, D.M. (1998), “Manage your information as a
product”, Sloan Management Review, 39 (4),95‐105
Wanyoike,R.(2016).Quality management practices and firm performance among manufacturing
firms In Kenya, Unpublished Ph.D research paper. Kenyatta University.

50
Whitney, C.W. &Lind, B.K. (1998) Quality assurance and quality control in longitudinal
studies.20(1):71-80. Department of Biostatistics, School of Public Health, University of
Washington, Seattle 98195, USA
Wu, J.‐H. and Wang, Y.‐M. (2006).Measuring KMS success: a re‐specification of the Delone and
McLean's model”, Information and Management,43,728‐739
Young, M. (1992). “A framework for the successful adoption of Japanese manufacturing techniques
in the United States”, Academy of Management Review, 17(4), 677-700.
Yuchan (2015) Analysis of Nokias Decline from Marketing Perspective, Open Journal of Business
and Management, 2015, 3, 446-452
Zeithaml, V.A (1988). Consumer perceptions of price, quality and value: A means-end model and
synthesis of evidence. Journal of Marketing, 52 (3), 2-22.
Zeithaml, V.A., Parasuraman, A. and Berry, L.L (2004).Service Quality (Marketing Science
Institute (MSI) Relevant knowledge Series.
Zeithaml, V.A., Parasuraman, A. and Berry, L.L. (1990), Delivering Quality Service, The Free
Press.

51
APPENDICES
APPENDIX 1: Questionnaire
Dear Sir/Madam,
Dear respondent, I’m conducting a research study on quality dimensions pursued by mobile handset
manufacturers. The questionnaire items are about the study and you are kindly requested to
participate in responding to the questions below. All information provided in this questionnaire will
be treated with the utmost level of confidentiality. The information will be utilized only for academic
purposes and will be safeguarded from unauthorized access.
Instructions
1. Tick appropriately in the box or fill in space provided.
2. Feel free to give further relevant information for research
3. The first section will be responded by manufacturers, the ultimate consumer, dealers and
corporates, the second section will be responded by the customers only, the third section will be
responded by the manufacturers only while the fourth section will be responded by the
manufacturers only.
Section I: Background Information
1. Name/Organization…………………………………………………………………
2. (a) Age:
(b) Gender
3. Occupation

52
Others Specify………………………………………………
4. Income Level (per month)
15,001 –
25,001 –
5. Educational Background
Section II: Quality Dimensions from Consumers Perspective (Customers)
6. Which mobile phone are you using/Selling? (Tick more than one if applicable)
A) Nokia
B) Samsung
C) Apple
D) Tecno
E) Oppo
F) IPhone

53
G) Huawei
H) Others
Specify
Please write the model of your phone Example: Nokia 1100, Ericsonk800i, etc.)
7. How long have you been using/selling the mobile phone?
Less
1 –
2 –
8. What are the reasons for selling/using the above mentioned model?
A) Internet
B) Just to talk on it
C) Use GPRS function
D) Receive Email & SMS
E) Down Load Files
F) Others (Specify
9. How often do you change/import your mobile phone?
Less than 1 year
1 – 2 years
2 – 4 years
Above 4 years

54
10.What phone Accessories do you have? (Tick more than One if applicable)
A) Handsfree
B) Bloothooth Head Set
C) USB Data Cable
D) Memory Card (SD Card)
E) Others (Specify ………………………………………..
11. Latest Mobile facilities which you are aware of:-
(Can tick multiple boxes of the facilities you know.)
A) Operating system i.eAndroid, Windows, Symbian
B) Internet
C) MMS
D) BLOOTOOTH
E) WHATSSAP
F) VIDEO CALL
G) OTHER FACILITIES (Specify)
12. What would you be willing to pay for a mobile phone?
20,001 to 40,000
13. Please, show the extent to which you think the Mobile Company which you are utilizing its
products and services possess the following features. We are interested in knowing your expectation
levels with the quality of service offered by Mobile Handsets Manufacturing Firms. Circle the

55
number that most accurately reflects how much you agree or disagree with the statement based on
your experience, according to the following scale 1 Highly Dissatisfied 2 Dissatisfied 3 Somewhat
Dissatisfied 4 Undecided 5 Somewhat satisfied 6 Satisfied 7 Highly Satisfied Choose one option
Tangibles 1 2 3 4 5 6 7
The customer service branches of the company
are located in convenient places
The physical facilities are visually appealing
The service provider has up-to-date equipment
The employees are well dressed and neat in
appearance
Reliability 1 2 3 4 5 6 7
When the service provider promises to do
something, it does so
The service provider shows a sincere interest in
solving customer problems
The service provider provides services at the time
it promises
The service charges are accurate
Responsiveness 1 2 3 4 5 6 7
Help line is easily accessible RS2 Employees
give prompt service
Employees are always willing to help

56
The employees respond to customer requests even
if busy
Assurance 1 2 3 4 5 6 7
The employees can be trusted
Customers feel safe doing business with the
service provider
The service provider protects the confidentiality
of customer information
The employees are consistently courteous with
customers
Empathy 1 2 3 4 5 6 7
The employees provide individual attention
The employees know the customer needs
The service provider has operating hours
convenient to all
The employee have the best interests of the
customers at heart
Network Quality 1 2 3 4 5 6 7
The service provider has a strong and wide range
network
The call quality of the specific chosen network is

57
always good Competitive Advantages
The service provider has more competitive prices
than its competitors
The service provider has a wider range of
products and services than its competitors
The service provider has better service quality
than its competitors
The service provider offers better products and
services
14. Are there any general comments you would make about what you like/dislike about mobile
phones? (This could be pricing, location of sales, reception, colour, memory, or anything else,
Quality)
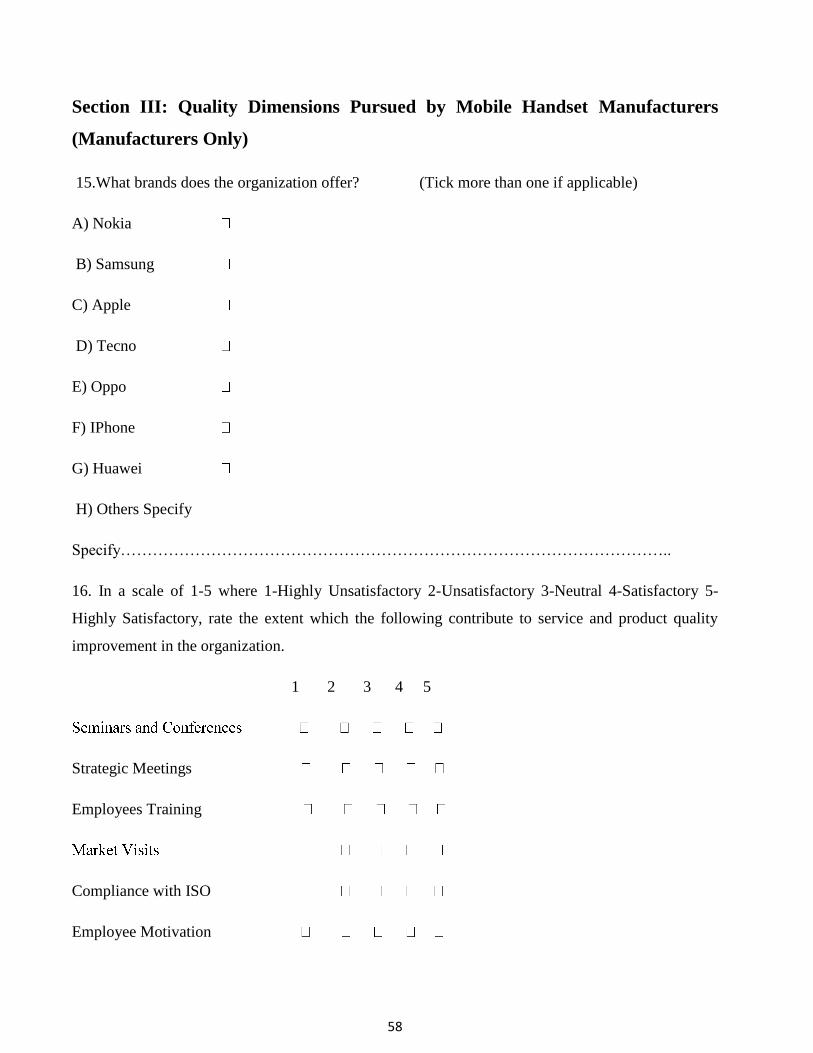
58
Section III: Quality Dimensions Pursued by Mobile Handset Manufacturers
(Manufacturers Only)
15.What brands does the organization offer? (Tick more than one if applicable)
A) Nokia
B) Samsung
C) Apple
D) Tecno
E) Oppo
F) IPhone
G) Huawei
H) Others Specify
Specify…………………………………………………………………………………………..
16. In a scale of 1-5 where 1-Highly Unsatisfactory 2-Unsatisfactory 3-Neutral 4-Satisfactory 5-
Highly Satisfactory, rate the extent which the following contribute to service and product quality
improvement in the organization.
1 2 3 4 5
Strategic Meetings
Employees Training
Compliance with ISO
Employee Motivation

59
Customer Complaints
17. How often do you carry out research /surveys about a non performing products in the market?
Five times a year’s
If other please specify
18. How do you respond to customer complaints especially on defective products that falls within
the warranty period?
19. Does the firm offer after sales services
If yes please specify which one…………………………………………………
20. How often do you release new models to the market?..........................................................................
21. Rate the extent to which the firm carries out quality trilogy which consists of quality planning,
quality control and quality improvement, In a scale of 1-5 where 1-Highly Unsatisfactory 2-
Unsatisfactory 3-Neutral 4-Satisfactory 5-Highly Satisfactory, rate the extent which the following
contribute to service and product quality improvement in the organization.
1 2 3 4 5

60
22. Are there instances where the firm has run out of stocks due to large volume of sales?
If yes state what measures were undertaken……………………………………………………
23. In a scale of 1-5 with 1- Very low extent 2-low extent 3-high extent 4-Very High extent 5-Very
Very High extent
To what extent does client’s feedbacks contribute to the firm’s decision making with regards to the
following.
1 2 3 4 5
Customer Relationship management
24.Are the Mobile Phones manufactured having the capability of software upgrade e.g android 6 to 7
or android 4.2 to android 5.
25. Does the firm outsource some of its key infrastructure used in manufacturing of products and if
so are there any limitations to this?
If yes state the limitation and how the firm resolves it on occurrence
…………………………………………………….

61
26. How long does the firm support the phone models before it becomes obsolete?
27. How ergonomically friendly is the phone especially in this era of sustainable development goals?
28. Are there any health safety measures/guidelines given to the customer on the effects of the phone
on excessive usage?
If Yes please state one …………………………………………………
29. Do you have service centres in the region?
Yes \
If yes please state how many ………………………………………………………………..
30. How do you target all the market segments without compromising on the quality standards of
the phone?
31. Does the firm give offers to the clients i.e. reducing the cost of a cell phone at a certain period of
time?

62
No
32. Does the firm encounter any challenges when venturing into new markets?
If Yes what are the response mechanisms ………………………………………………………
Section IV: To establish the relationship between quality dimension and
customer satisfaction (Manufacturers Only)
33. Are the customers satisfied with the operating hours?
Yes
If yes please state minimum number of hours allocated for customer service per day……………
34. What is the frequency of purchase for specific models per month for example Nokia 1110-
20,000 times per month……………………………………
35. Are the customers happy with the price of the products?
Yes
If yes how many repeat orders from customers does the firm get per month …………………..
36. Does the firm provide formal educational training on quality concepts to all employees?

63
37. Does the firm’s supply chain fully intergrated to ensure all customers receive variety of goods in
large quantities at the appropriate place and time?
Yes
No
If yes describe please describe the nature of supply chain ……………………………………
38. Does the products released clearly articulate the very needs of each market segment?
No
39. Does the organization have a formal policy of collecting customer feedback to incorporate into
development process?
No
40. Does the firm have service centers in major towns?
Yes
41. Does the products have exclusive features factored in the production process to ensure that the
products meet customer specifications?
Yes
No
If yes please state briefly some of these features that results to customer satisfaction ……………

64
42. Does the firm conduct performance appraisal and recognize employees who have offered
exemplary customer care services based on feedbacks from the clients?
If yes how many employees or branches are rewarded as a result of such effort yearly………
43. Are there any general comments you would make to the firm on quality dimensions and
customer satisfaction based on your experience as an employee.
Thank you for your participation.


![Public Transit Customer Satisfaction Dimensions Discovery ... · Customer satisfaction also reflects the performance of a transit system regarding meeting customers’ needs [4]](https://img.pdfslide.us/doc/110x75/5e8fc02a08d273473c580830/public-transit-customer-satisfaction-dimensions-discovery-customer-satisfaction.jpg)