Embed Size (px)
Citation preview
Service marketing mix as
input and output of higher and
technical education
A measurement model based on students’
perceived experience
Citation
Mahajan, P. and Golahit, S. (2019), "Service marketing mix as input and output of higher and
technical education: A measurement model based on students’ perceived experience", Journal of
Applied Research in Higher Education, Vol. 12 No. 2, pp. 151-
193. https://doi.org/10.1108/JARHE-01-2019-0022
Available at:
https://www.emerald.com/insight/content/doi/10.1108/JARHE-01-2019-0022/full/html
Publisher Emerald Publishing Limited
Copyright © 2019, Emerald Publishing Limited
Service marketing mix as
input and output of higher and
technical education
A measurement model based on students’
perceived experience
Prashant Mahajan
R. C. Patel Institute of Technology, Shirpur, India, and
Suresh Golahit Department of Economics, KVPS SPDM College, Shirpur, India
Abstract
Purpose – The purpose of this paper is to examine the relationships of service marketing mix (SMM) as
service input and service output in terms of students’ performance, satisfaction and referral act in context to
higher and technical education (HTE) through the application of structural equation modeling. Design/methodology/approach – A quantitative research, conducted through a self-administered survey
composed by a closed-ended structured questionnaire, was incorporated for the students who were enrolled in
the technical educational institutions situated in the Khandesh region of India. Findings – The findings of this study revealed that traditional SMM is statistically linked with the performance of
students in terms of skill and knowledge enhancement, satisfaction and referral act of students, which are
perceptible new emerging SMM; performance, pleasure and pointing out in terms of service output.
Practical implications – Integrating SMM as service input and service output are productive for HTE in
enhancing growth (quantitatively) by the inclusivity of diversified students and development (qualitatively)
by enhancing their performance for global standing, making them satisfied and motivating them for
recommending their institution to others. This integration can be utilized as a yardstick by the institutions for
staying ahead in students’ market with a distinctive competitive advantage. Social implications – Growth and development of HTE will raise a society’s quality of life and thereby
increase a country’s socio-economic status. Originality/value – The study has exhibited SMM as input and output of a service system that is useful for
the growth and development of HTE. The measurement tool presented is effective in (re)framing policies on
SMM as service input based on desired service output. Keywords Higher and technical education, Measurement model, Service marketing mix,
Service marketing, India Paper type Research paper
Introduction In India, the All India Council for Technical Education (AICTE), a statutory and apex body
for regulating and framing policies, designates Technical Education (TE) as programs of
higher education in the field of engineering, management and pharmacy education (AICTE, 1987). Higher and technical education (HTE) is vital for developing social aspects, strengthening the industrial growth, driving the economic development of the country
(Blom and Cheong, 2010; Vrat, 2009) and lifting individual quality of life (Rojewski, 2010). Although the growth of TE in India has been notable and exponential during the last decade
with setting up of new private funding technical educational institutions (TEIs) and increased intake capacity in existing TEIs, it has headed non-directionally. A strategic
marketing approach and service quality issues remain in the dialogue box of TEIs solely, which then elicited substantial redundancy in India. TE is critical to India’s ambitions of establishing its reputation as a major competitive player in the global knowledge of
economy and can be a treasure house in terms of skill enhancements that are directly linked
with the earnings of the individuals and economic growth of the country (Sarma and Sharma, 2014). Several studies revealed diminishing enrollments and closing-down of
institutions due to their lack of response to the changing students’ behavior pattern. Many authors have recognized the importance of delivering educational services that drive
students into the TE setting (Burrell and Grizzell, 2008). In a competitive market with diverse needs, a substantial literature has been transformed on marketing concepts from
other service sectors to the education sector (Bugandwa Mungu Akonkwa, 2009). Technical education in India – marketing opportunities and challenges (Goel and Vijay, 2011) sees TE as a powerful medium in manpower development catering
to the needs of the industry and society and, noteworthily, contributing to the economic growth of countries. The intention of TE is to provide managerial and technical skills for
the overall development of human being (Burton, 1969). In India, the service sector almost contributes 50 percent to the gross domestic product, which creates the significance of
service offerings. Indian Government’s new projects, Smart City development, Skill India, Digital India, Start-up India, FDI enhancement, National Investment and Manufacturing zone, creation of Industrial Corridor, are heading India toward a global manufacturing
hub and also moving to generate a huge number of jobs and entrepreneurial opportunities (Mahajan and Golahit, 2017c). These initiatives are expected to create 10–15 percent rise in
employment. The recent union budget has planned to promote new 1,000 private universities for producing trained manpower to meet services and industry requirements
along with 100 percent FDI allocation to the education sector. This is the biggest opportunity in terms of involving and developing a rural and tribal population of India, which constitutes almost 60 percent of the Indian population (Census Commissioner of
India, 2011). The most important and urgent reform in HTE is, therefore, a necessity to fulfill the needs and aspirations of the rural and tribal students and thereby making HTE
the commanding gadget for social, economic and cultural transformation necessary for achieving India’s goals.
In India, TE contributes up to 18 percent in terms of enrollments to higher education (MHRD India, 2018; UNESCO, 2015). India has the world’s third largest scientific and
technical manpower; however, its availability per million country’s population is relatively low as compared to other developed countries (Shukla, 2005). According to a recent study
made by Wheebox, a leading talent assessment company of India, 75 percent students availing TE rated the Indian TE system below three on a five-scale rating (CII and
Wheebox, 2014). As per the statistical dashboard available on the AICTE website, India has around 10 thousand institutions offering TE programs with an intake capacity of 35 lacs as on 2018; however, almost 50 percent seats of intake capacity have not been occupied and
around 65 percent of techno-graduate students did not get jobs through their institute’s campus placement drive (AICTE, New Delhi, 2018). Thus, the quantitative gap in relation to
the intake capacity and actual enrollments and the qualitative gap pertaining to the numbers of students graduating from TE study and their placements in job market are
widening year by year. One of the main reasons for diminishing enrollments is the failure to meet the expectations of stakeholders. Secondly, due to the absence of certain quality service standards in TEIs, students are lacking in the skill competency required for the job
market (Pal Pandi et al., 2018).
In case of the Khandesh region (India), which is a rural, illiterate and socially backward region of India (Census Commissioner of India, 2011), the situation is even more serious.
Prospective students counting almost two and half times more than the intake capacity (available seats) had shown their interest to join TE during the last five years by passing
an entrance examination, which is a prerequisite for TE enrollment. However, the TEIs of this region managed to attract only 40 percent seats of their intake capacity during this
period (Directorate of Technical Education, M.S., 2018). Thus, the problems pertaining to awareness, attraction, inclusivity of diversity and providing expected services
(Kamokoty et al., 2015; Lakal et al., 2018; Upadhayay and Vrat, 2017) do exist in the region. Marketing of institutions is noticed on TEIs budgetary documents only.
Absorption of techno-graduates of this region in the job market is relatively very low as compared to other parts of India. Due to unavailability of an industrial corridor and with very few scattered small-scale enterprises in the region, the techno-graduates of the region
have to travel to metro cities for their first job where they have to compete with comparatively higher talented techno-graduates of metro cities. Even if someone from this
region secures a job, he or she has to wait for almost one year on an average for his/her first job. Many professionals and educationalists have discussed the challenges of service
quality issues by suggesting theoretical and conceptual frameworks; however, they failed to focus on their practical implications and identifying proper measurement instruments (Abdullah, 2006), which are valuable in making strong estimates for growth and
development in TE setting.
As per statistical figures manifested above in context to TE scenario, two issues have been identified in terms of quantitative (growth) and qualitative (development) pertaining to
the TE scenario in the Khandesh region of India. Based on these issues, the research objectives of this study are formed as stated below.
Research objectives Primarily, this study has been aimed to examine the service offerings of the TEIs situated in the Khandesh region, India, that govern the growth and development of TE with the
following specific objectives: (1) To examine the students’ perceived experience regarding the SMM offered by their
TEIs wherein they are enrolled. (2) To evaluate the impact of SMM provided by their TEIs on their performance
enhancement, satisfaction and referral act. To trace out the relationships between SMM as input and output of service delivery. (3) To propose a measurement model: SMM as input and output of the TE system.
Research questions Research questions that are to be answered to achieve objectives are:
RQ1. How do SMM offered by TE institutions affect students’ performance, satisfaction and referral act?
RQ2. Does any interrelation between SMM exist? RQ3. Can integration of SMM as service input and output be drawn?
Service marketing mix (SMM), better known as a strategic marketing tool, is accountable for contesting and lining up service providers’ strengths to satisfy their customers’ needs. A literature review is committed to study the elements of SMM and its impact
on customers’ performance and behavioral intention. It is also intended to trace out the research gap regarding the utilization and implementation of SMM in an HTE setting.
Literature review The literature review of this research study has followed a systematic literature review
process that is conducted mainly through two steps (Manatos et al., 2017). This constituted an in-depth and wide search through online databases focusing on the keywords related to
the topic and making a descriptive and content analysis based on the statistical methods and findings utilized in the literature.
Service marketing mix (SMM) SMM is a set of controllable marketing tools that an organization uses to fulfill its marketing
objectives to target the customer market to produce the desired response (Kotler, 2000). After the evolution in metaphor of higher education as service (Bringle and Hatcher, 2000;
Maringe and Gibbs, 2008; Ng and Forbes, 2009) and students as customers (Clayson et al., 2005; Kotler, 1972), SMM has become the fundamental part of service design for higher educational programs. For a successful marketing plan, right composition of SMM at right
time is vital for targeting the desired market to fulfill the needs of students (Young, 2005)
and fetching image and reputation for service providers (Blythe, 2008). In case of marketing,
a physical product, traditionally a fundamental model comprising of 4Ps, product, price, place (distribution) and promotion, is well-known to the market as a product marketing mix
(Blythe, 2008). McCarthy (1960) was the first to present an advanced version of 4Ps in a more simplified way, in the form of 7Ps, which included people, physical evidence and processes. Though the author believed them to be useful for managerial planning and
decision making, he failed to create a significant impact in the service sector. Up to the 1980s, even though the 4Ps model gained popularity in terms of producing a strategic
solution to the marketing problem, it remained the topic of a debate pertaining to its problems and limitations (Fisk et al., 1993). It had been a topic of core discussions at AMA
conference converging to services marketing. Since then, the need for extending 4Ps has been recognized in the context of service marketing. Considering the intangibility nature of service, the importance of customer participation and service delivery, Booms and Bitner
(Booms and Bitner, 1981) in 1981 presented the 7Ps model, consisting the original 4Ps along with added Ps: process, people and physical evidence that were more appropriate for
services marketing (Blythe, 2008), particularly for education marketing (Ng and Forbes, 2009). SMM elements that have been focused upon in the literature are exhibited in Table I.
Product (program). The “product” element in service marketing is intangible in nature. In
the case of higher education context, it is referred to as a “program” offered by the service providers (institutions) to the students. Kotler and Fox (1995) expressed that the quality of
program is a major differentiating factor for the service providers of higher education in students market. In TE context, engineering, pharmacy, management, etc., are considered as
“programs” of higher education. Due to its intangible, inseparable, variable and perishable nature, it does not exist until the service providers (institutions) deliver it in the presence of
the customers (students) (Gajic, 2012). In most of the cases, in India, the program is designed
by the affiliating university, the TEIs have less to work on it; however, its execution and delivery through an enriched curriculum is important to keep the interest of the students up.
Gibbs and Knapp (2012) suggested wrapping of the program with more tangible, enhanced value-added facilities that keep students engaged. Program enrichment by valued-added
services like project-based learning, innovative teaching techniques, add-on or certification courses, information and communication technology-based learning are effective in
knowledge and skill enrichment (Parashar and Parashar, 2012). The students are awarded a certified degree (output of program), after attending and successful completion of program
curriculum. This degree positions the image of students in the job market, which adds value to their curriculum vitae. Students after their successful completion of program may behave positively by expressing word-of-mouth, which can complement the reputation of the
program (Hamid and Noor, 2013). Shay (2014) has mentioned the significance of program
curriculum in minimizing underemployed graduate condition. Agarwala (2008) viewed program importance linked to students’ characteristics, intrinsic (interest in program) and
extrinsic (benefits sought from the program) that affect their study choice. Gibbs and Knapp (2012) discussed core competencies, profitability, core and tangible offering and, notion of
branding as the attributes of a program. That is why, most private universities, deemed-to-be-universities and autonomous institutions in India have now recognized the
importance of distinctive and unique attributes of program curriculum in attracting future students and engaging existing students to remain competitive in privatization. Price. The “price” element is concerned with the cost involved in availing educational
service, usually relates to tuition fee, fee concessions, fee reimbursement, fee installments, educational loans, residential changes, food charges and day-to-day expenses. TEI’s service
price refers to the cost associated with physical facilities, educational processes as well as marketing efforts. In the higher education market, pricing is an extremely sensitive mix that
differentiates between brands, values and service offerings of the institutions in a competitive environment (Gibbs and Knapp, 2012), and also boosts managerial accountability and service performance (Maringe and Gibbs, 2008). Agarwal (2006) is of
the opinion that pricing plays a limited role in the clearing of demand and supply in higher education due to its embarrassing economy. Kotler (1999) believed that a customer may pay
more for a good skilled service. Some service markets perceive expensive service offers to have a greater value and vice versa (Helmsley-Brown and Foskett, 2001). The pricing
strategy not only affects the revenue that a TEI derives from admissions fee but also conjointly affects student perceptions of value for money and service quality (Ivy, 2008).
Several literature have focused on the importance of price element as the cost of education for the families (Ahier, 2000; Supiano, 2009). In the higher education context, most families are ready to bear a higher cost for high quality (Gajic, 2012); however in India, low family
income, farmer families and family having female child (Singh, 2009), perceive “price” as first prima facie criteria to make the decision of selection of TE program. In India, the state
governments control and fix the price (Assembly, 2015) for the programs offered by TEIs to ensure that fee charged by institutions are in accordance with the expenses made on
educational services, are concern for equity (Agarwal, 2006) and are affordable to the common society. In addition, the Indian government has taken up majority of the “price” burden in terms of reimbursement of tuition fee to the students belonging to socially and
economically backward class (Government of India, 2017). Thus, in terms of TE program, the pricing strategy in India is reliable and fit for the purpose, from
students’ point of view. Place. Place refers to providing access to the customers that is established through the
service networks (Brassington and Pettitt, 2006) and ensures physio-geographical delivery of education services at right time and right place (Hannagan, 1992; Kotler and Fox, 1995).
In TE setting, it is concerned with the location (distance) of the institution from home and
also refers to the characteristics (locality) of the area in which it is situated (Gajic, 2012). It is measured in terms of convenience, suitability and approachability of the place of service
delivery. A good locality surrounded by the transport connectivity, entertainment facilities, medical facilities, safe and secured, and cultured climate will attract prospective students.
Further, place is also linked to the accessibility and connectivity to the in-campus classrooms, laboratories, amenities and residential rooms (Maringe, 2006). Institutions situated near to the pool of future students or their schools and colleges is advantageous in
attracting them as a small distance of institution will be convenient for them (Hannagan, 1992). If the institution is not situated nearby catchment area, i.e. students market, then the
institution must settle in a good attractive location surrounded by necessary amenities and facilities, otherwise, the institution will fail to absorb enrollments. Since India is a
multilingual, multi-religious and multicultural country where, after every four miles the language changes, the place element has a prominent role in students’ decision of selecting an
institution. Accessibility to the infrastructure and facilities, safe and secured place of amenities and, residential issues are real concerns for the students, especially for females
(Singh, 2009). For students, place may be an important concern with regard to the social digital locations of institutions (Khanna et al., 2014) like social blogs, LinkedIn, Facebook,
Skype or website (Kotler et al., 2002) for addressing, interacting or sharing information with the other students or friends. Therefore, convenience, locality, safety and security and comfort are the important attributes of “place.”
Promotion. Promotion denotes communication sources to convey attributes of service
to the existing as well as potential customers (Hannagan, 1992) to create a positive
attitude on service offered (Gajic, 2012). In the case of HTE, communication is made with the influencers of the students as well as institutional stakeholders with whom the
institution interacts (Shannon, 1996). A lot of literature has revealed the importance of personal selling, media advertising, sales promotion, public relations and publicity in promoting institutions (Armstrong and Lumsden, 2000; Gibbs and Knapp, 2012; Harris,
2009; Shannon, 1996). Promoting service is a complex phenomenon, which includes highlighting tangible assets, clarifying quality service performance and publicizing the
experience of satisfied customers (Lovelock and Wright, 1999). With changing environment and technology, promotion is taking a new look as integrated marketing
communication (Shannon, 1996). Most educational institutions use public relations than advertising (Kotler and Fox, 1995) as their main promotional tool. Interactive
communication sources like educational fairs and counseling visits (personal selling) are effective in approaching potential students that allow institutions to demonstrate their service offerings and overcome their doubts by direct ace-to-face interactions. Social
media has been recently gaining popularity and has been found to be effective on the young generation (Chauhan and Pillai, 2013; Khanna et al., 2014; Rutter et al., 2016) in
building the brand reputation of institutions, co-creating system of interactive communications and developing relationships with and within the stakeholders.
People. In the HTE context, people include management people, institutional staff,
schoolteachers, parents, friends and the students themselves ( future, present and former students). Kotler and Fox (1995) and Brassington and Pettitt (2006) are of the opinion that
education services, like many other services, depend on both the people who deliver the service as well as people to whom service is delivered. In the HTE system, services as
performances and people as performers (Berry, 1995) are crucial due to their motivation and influence associated with teaching, training, interaction and support required from
prepurchase ( future students) to the post-purchase stage (alumni). As people’s emotions, performance and action vary up and down, and the level of consistency in service quality is
not certain and is fluctuating (Hannagan, 1992). Therefore, establishing and promoting
human interactions are crucial for initiating the “moment of truth” (Kotler et al., 2009) and creating a positive “word-of-mouth” (Bruce and Edgington, 2008) for creating branding for
the higher education system. Therefore, people involvement is a key factor for influencing students’ satisfaction and motivating them towards positive word-of-mouth for the
institutions (Svoboda and Harantova, 2015). Physical evidence. Physical evidence points out tangible environment that facilitates the
performance of service delivery (Palmer, 2001). Kotler et al. (2002) recommend physical
evidence such as building, infrastructure and furniture as an immediate clue for prospective students about the service provider’s identity. It also includes the availability of physical
infrastructure such as; residential buildings (hostels), equipment, computational facilities, library facility, sports, canteen and other amenities. This element is physically visible
(Mukherjee and Shivani, 2016) and along with infrastructure, it also points out physical evidence such as quality of faculty, supporting staff, alumni reputation and
institutionalranking or gradation. Delivering services without the presence of physical evidence is not possible for TEIs. Due to its tangible nature, all stakeholder response
emotionally and physiologically ultimately affects their behavior. Many institutions engage in integrated and distinctive visual look to their physical infrastructure and facilities to facilitate
reputation and reinforce the desired image through publicity brochures, advertising media (Lovelock and Wright, 1999) and social networks. Several service models recognize the unique characteristics of the physical environment which affect service quality ( Jain et al.,
2013; Teeroovengadum et al., 2016) and customers satisfaction (Kotler and Keller, 2006). Process. It relates to the whole administrative system in which the service is delivered
by the service providers and the service is acquired by the customers (Kotler et al., 2002). It includes all activities starting from enrollment, teaching-learning, extra-curricular
activities and the deployment (Kaplinsky and Morris, 2000). Educational processes like academic, non-academic as well as support activities are effective in students’ engagement, inside and outside of the classrooms which fallouts to determine institutional
performance (Harper and Quaye, 2009) and further purposefully enables engagement of diverse students (Kuh, 2009). Processes are very crucial in keeping the momentum
forward to achieve academic and non-academic goals of the students as well as the institutions. Availability, accessibility and responsiveness are thus the key terms
associated with service processes, which jointly affect the service quality and effectiveness of the institution. A service process that encourages student engagement
through community learning, student–faculty collective research, service-learning, industrial internships and, sports and cultural events are tended to participate mentally rather than engaging students physically by realizing them about their responsibility
toward activities (Kuh, 2009). These services contribute directly to the students’ retention, engagement, persistence, attrition, performance, satisfaction and trustworthiness which
directly are associated with institutional performance (Yorke and Longden, 2004). Other elements of SMM. Extended SMM elements other than 7Ps are exhibited with
literature support in Table I. There are several other Ps publicized in the literature relevant to the service industry. Enache (2011) exposed “placement” in terms of delivering knowledge to the students and making a place for the students in the labor market. Lovelock
and Wright (1999) presented eighth P “productivity” as service output for efficient and effective services to add value for customers. Maringe (2006), Ivy and Naudé (2004) and Ivy
(2008) described “prominence” as next extended SMM in the form of institutional reputation, which the authors believed the most significant in the selection of an institution.
Some studies presented extended SSM “position” as a constitute of institutional image and reputation which are critical in customers buying behavior (Barich and Kotler, 1991) as well as in students retention and loyalty (Nguyen and LeBlanc, 2001). Further, Ho and Hung
(2008) believed that creating a distinctive image in the eyes of competitors as well as customers is useful in market positioning and targeting. Reputation and image building are
not created overnights, rather it is a prolonged and continuous movement centering on students’ satisfaction, students’ loyalty and students’ placement in the job market (Lafuente-
Ruiz-de-Sabando et al., 2018). Several studies (Clemes et al., 2007; Elsharnouby, 2015; Syed Alwi and Kitchen, 2014), have empirical evidence that institutional reputation/image is a significant contributor to students’ satisfaction.
Service output elements
Performance (skills and knowledge). Kuh and Wallman (1986) identified knowledge and
intellectual development along with social and personal development of the students as the outcome of the education system. Hartman and Schmidt (1995) believed that satisfaction of
students is a multi-dimensional phenomenon affected by both; service providers’ performancein service delivery and students’ perceptions towards the outcomes of that
performance. Providing educational services that inculcate competitive knowledge and skills in students
and make them ready for global competitive market is the responsibility of all stakeholders of HTE (Burli et al., 2012). Employability as a purpose of higher education (Sin et al., 2019)
accompanies skill and knowledge enhancement in subject skills (domain skills) and transferable skills (interpersonal attributes) that makes an individual more competitive in the job market. Such a performance determiner is discovered as the major predictor in selecting
higher educational institution in India (Nyaribo et al., 2012). In today’s scenario, this service output of HTE is becoming prima facie requirement to enter the labor market (Blom and
Saeki, 2011), ahead of a degree certificate. Today, HTE institutions are intended to furnish students’ performance in terms of developing communication skills, thinking skills and
creativity skills of their students and also are attentive to measure whole service activities for the extent of its fulfillment (Venkatraman, 2007). Saravanan (2009) describes soft skills as vital and Gokuladas (2010) exposed it as the most important predictor of employability
while, Sahu et al. (2013a, b) referred it as distinctive interpersonal skills for capacity building that keeps the job market competitive. In India, there is a lot of evidence showing the
unemployment scenario for techno-graduates is due to their deprived employability skills (Blom and Saeki, 2011). Unni (2016), referring to the Indian scenario, believed that there is
no problem with demand and supply of techno-graduates as far as the quantity aspect is concerned, however, the situation is attributed due to the employability skill gap. Several employability skills are expected from techno-graduate students, the majority are related to
soft skills and interpersonal skills (Finch et al., 2013; Wickramasinghe and Perera, 2010). As per the report of Wheebox, soft and technical skills, interpersonal skills: leadership and team
building, confidence level, general knowledge and intelligence quotient, stress management and idea generation are much in demand of Indian industries, however, Gokuladas (2010)
identified them lacking in Indian techno-graduates. This kind of service output in terms of performance enhancement is important for the accumulation of national human capital (National Research Council, 2012). For this reason, measurement of service delivery linked
to students’ performance related to their skill and knowledge enhancement is vital in HTE. The need has been well recognized by Borden (1964), who proposed ten marketing mix, out
of which nine mixes have connections with 7Ps, and “fact-finding and analysis,” a tenth mix element have a marketing measurement approach (Quelch and Jocz, 2008) for evaluating
performance and controlling service input mix. Beder (2009) mentioned that skills are not generated by TE curriculum, but are reliant on of institution’s service facilities and capability and, therefore, performance measurement is important.
Satisfaction. If the institution identifies appropriate measurement tool for improving
students’ satisfaction, it can provide better services to its students, however, the main
difficulty is to find out such a mechanism (Mahajan and Golahit, 2017c). Yelkur (2000) presented a conceptual model that linked the SMM as inputs with the satisfaction of the
customers as an output of the HTE system. As rightly said by Kotler (2000) service delivery is successful when it delivers satisfaction to its customers. This state is felt by customers
after experiencing value-added performance that accomplishes their expectations (Elliott and Healy, 2001; Kotler and Clarke, 1987). Quite a lot of literatures on service quality models have highlighted importance of customers’ satisfaction (Hanaysha et al., 2011;
Sakthivel et al., 2005), arising due to the skill and knowledge enhancement as performance (Singh and Khanduja, 2010) and its measurement (Sirvanci, 2004) in HTE setting.
Loyalty and recommendations. In the service industry, most of the future business comes from the existing or experienced customers after experiencing service delivery. For that
reason, Mahajan and Golahit (2017a) perceive pointing-out, i.e. willingness to refer experienced and known services to others is important in growing the enrollments and have
stated it as an extended P in TE setting. Studies like, Santini et al. (2017) and Paswan and Ganesh (2009) have revealed the significant impact of satisfaction due to skill gained during
the study (Bruce and Edgington, 2008; Greenacre et al., 2014). This further affects students behavioral act of recommendation (de Castro and de Guzman, 2014), loyalty (Annamdevula
and Bellamkonda, 2016a, b; Hackl and Westlund, 2000; Thomas, 2011) and word-of-mouth (Alves and Raposo, 2007) for assisting future students. SMM as service input and service output
Tijjang et al. (2017) have presented SMM as input to the education system and satisfaction of students as an output of the system with mediators; students’ decision-making and
service quality provided by the institutions. The findings of the study revealed that SMM affects satisfaction with the involvement of mediators such as students’ decision-making
and service quality. Yelkur (2000) proposed a model that suggested the linkage of SMM (input) on the customer’s perceptions and feelings (output) of the service delivery. Chumaidiyah (2014) connected 7Ps to create competitive advantage through a structural
diagram. The results revealed that product, price, place, promotion, people, physical evidence and process have a different effect on competitive advantage. Cengiz and Yayla
(2007) presented the 4Ps model that the author linked to customer satisfaction and customer loyalty. Hiransomboon (2012) presented the 7Ps model that assists tourists for making their
decision of buying accommodation services. Melewar and Saunders (2000) displayed Ps with extended version to trace out its impact on the corporate visual identity of companies.
Almost all-earlier literature considered SMM elements as input to the service system to measure its impact on the service output. However, all output elements in the literature have been exposed as a separate entity of service delivery and not a part of the SMM group.
Research gap
Past literature mainly offered the conceptual framework on SMM without sufficient support
for empirical research. Martin (2009) believed that traditional Ps have limited orientation based on the assumption; “one size fits all.” The traditional 7Ps are not suitable to capture
the distinctiveness of marketing in higher education and strongly needs further research work based on its application (Ivy, 2008) as well as further requires conceptual and contextual integration (Lim et al., 2018).
Previous studies utilized SMM for examining marketing performance and branding but found to be lacking in emphasizing the role of SMM in customer satisfaction, service
performance and service recommendations. Performance in terms of the skills and knowledge earned by the students during education, satisfaction in terms of service
offerings, performance and act of recommending the institute to others shall be examined for the overall growth and development of TE service system. It is equally important to
analysis their intermediate correlation also.
Almost all existing literature on SMM have focused its significance as an input to the service industry. Traditional Ps of SMM have been considered as internal factors that are
controlled by and favorable for service providers than their customers. As the principal focus of SMM is to satisfy customer needs and wants (Kushwaha and Agrawal, 2015), there
are various SMM elements, in terms of customer-oriented behavior arising due to service delivery experience (service output), that are yet to be explored. There is a need for integrating SMM as service input and service output in terms of customers’ orientation.
Thus, the measurement of input (service provider’s orientation) and output (customer’s orientation) of the system is even important in reframing inputs provided by service
providers. Secondly, if the Ps are not presented as the output of the service system, they
cannot take customer orientation, the need of which is desperately felt by Kotler (2003). Conceptual framework and the hypothetical model
Based on objectives, research questions and the research gap identified, following are the hypotheses that are to be validated through the proposed hypothetical model (Figure 1)
based on the students’ perceived experience. Research hypotheses
Based on literature review and research objectives, following Hypotheses (H01, H02, H03) suggesting no relationships between variables of SMMare proposed. An alternative hypotheses
(H1, H2, H3) will be accepted in case null hypothesis is rejected (Creswell, 2012a, b): H01. There is no significant relationship between the students’ perceptions on SMM and
their performance in terms of skill and knowledge enhancement. H02. There is no significant relationship between the students’ perceptions on performance
in terms of skill and knowledge enhancement and their satisfaction and referral act. H03. There is no significant relationship between the students’ perceptions on SMM and their satisfaction and referral act.
Research methodology This study is marketing research pertaining to HTE issues with an objective to study
relationships in between SMM offered by the institutions and service output in terms of performance as skill and knowledge enhancement, satisfaction and referral act perceived by
the students. The study is also aimed to propose a measurement model that links traditional SMM as input with new emerging SMM as an output of the TE system that uplifts the
growth and development of TE in the region. Based on the research objectives the research method is discussed below.
Research design As suggested by Creswell (2012a, b), the decision of selecting research method is made based on a review of literature and objective of this study. This study has implemented quantitative research method due to its ability in formulating hypothesis (Kotler et al., 2016),
to perform multivariate statistical techniques on large data (Donald et al., 2010; Hossler, 1999), to test relationships in between various variables with definiteness and transparency
(Borrego et al., 2009), and being popular and successful in educational research (Han, 2014; Sheppard et al., 2010; Tight, 2015). Further, a survey method is administered for its
quantitative ability to be counted and having the advantage of allowing a large number of responses quickly (Kolb, 2008). To make availability of students from their busy academic schedule and avoiding favoritism that arises while obtaining existing students’ opinions in
their own institutional campus is a challenging task. To overcome this situation, a self-administered survey through an internet-Google-form tool has been considered. Internet
survey is speedy, low in cost and college respondents are more responsive to such surveys (Neuman, 2014). Sample size ranging from 370 to 381 is recommended for a population
ranging from 10,000 to 50,000 at 95% confidence level and 5 percent of significance level (Cohen et al., 2011; Creswell, 2012b; Oakland, 1953; Krejcie and Morgan, 1970). However, as sampling error decreases when sampling size increases, this study accepted 682 (W381)
responses that received from an online survey. For TE intake capacity of 6,260 seats for the region, the ratio of sampling size to population size comes out to be 10.9 percent.
Data collection What the customer actually receives from the service delivery as against his/her expectations from service is typically based on a customer’s judgment or evaluation of the
service (Yelkur, 2000). This is why students’ perceptions (primary customer) that are crucial factor in the delivery of educational service are taken into consideration. A structured
closed-ended questionnaire as presented in the Appendix was constructed as per the guidelines suggested by Cohen et al. (2011) and Neuman (2014). Based on literature review
on SMM elements as presented in Table I, it consists of items on the perceived experience of students applied with Likert-Scale (1–5). Respondents were the students who were enrolled
either in First, second, third or final year study belonging to TEIs located in the Khandesh region of India. A questionnaire is initiated with asking demographic and geographic characteristics of students in Part-I, while in Part-II it encompasses perceptions on program
benefits and self-motives. Role of human influences in their TE career has been questioned in Part-III. Perceived experience on the institutional characteristics in terms of cost of
education, location and distance, institution age, and image and reputation has been questioned in Part-IV. Part-V comprises institutional marketing communication activities,
and Part-VI covers questions on ratings on the physical facilities and educational processes provided by their TEIs wherein they are enrolled. This questionnaire has also measured service outcome element, skill and knowledge enhancement in Part-VII and other service
output elements, students’ satisfaction and their referral act in Part-VIII. After taking a pilot study on the few samples from a sampling frame belonging to the Khandesh region, the
questionnaire has been finalized for conducting a survey. In total 53 item scales variables together have established this questionnaire which is continuous in nature. After providing
sampling frame containing the list of TEIs (simple random sampling) to the affiliating university of this region, the university on researcher’s request provided approximately 6,600 e-mail IDs of students who were currently availing their TE study in December 2017.
After initial screening for duplicate e-mail IDs and the bounce effect due to invalid e-mail addresses, the survey got a hold of approximately 5,500 e-mail IDs. Finally, primary data
consisted of 682 responses which were directly received on researcher’s Google account at the end of February 2018, with a response rate of 12.4 percent. There were 466 male and 216
female students by gender. Based on the geographic,165 (24.2 percent) students belonged to the district native place, 285 (41.8 percent) from taluka place and 232 (34 percent) were from village place. There were 76 percent of respondents belonged to the family having an annual
income less than Rs. 3 lacs. In total, 73.8 percent of the respondents were availing engineering degree program while 17.6 and 8.5 percent students were studying in pharmacy
and management degree program, respectively. In total, 50.4 percent students were studying in the first or second year (juniors) while 40.6 percent were enrolled in the third or
final year (seniors) of their program.
Data analysis and findings To test the relationships between SMM as input and service output, structural equation
modeling (SEM) has been adopted. Since last decade, SEM has been successful for the researchers and is popular in the field of psychology, sociology, education (Green, 2016) and
economics due to its ability to measure unobserved variables (latent variables) and examining its relationship with the observed variables (indicator variables). SEM identifies a structural relationship among the latent variables with measurement errors (Bollen and Long, 1992).
Out of received 682 responses, 642 responses without any missing data are considered for running SEM. Scales items are treated with a scale reduction technique performed by SPSS,
the factor loadings of each item to the items are shown in Table II. To develop a valid and reliable scale for each construct and their relationships, exploratory factor analysis (EFA) is
performed (Guay et al., 2015). EFA is first implemented to develop item scales, followed by confirmatory
factor analysis (CFA) (Worthington and Whittaker, 2006). EFA is confirmed the covariance or correlations between a set of observed variables (indicators) and unobserved constructs
(latent variables). The SEM generally undergoes five steps: model specification, model and parameter identification, parameter estimation, model evaluation or model fit and
modifications (if required) (Teo et al., 2013). SEM, a measurement model, is executed as per the guidelines suggested by Hair et al. (2011) and Parasuraman et al. (2005). Measurement
model that is executed through SPSS AMOS is exhibited in Figure 2. The SEM model has presented a combination of path models and confirmatory factor models that incorporated both latent and observed variables (Kaplan, 2008). All scales under study are empirically
tested for reliability and validity using both EFA and CFA.
Content validity
According to Straub (1989), content validity is to ensure that the scale items are
representative and comprehensive towards formulated hypothesis. The scale items under study are collected from the intensive analysis of the literature (Table I). The scale is designed by considering
AICTE regulating norms and accreditation concerns for TEIs. Educational experts like academic and administrative deans and principals of TEIs confirmed 53 scales to be valid
after reviewing the scales. Reliability
Before conducting CFA analysis, items of the measurement scale are determined by
computation of item-to-total correlations and Cronbach’s α coefficient (Churchill, 1979). The
principal component method with Varimax rotation is utilized to include as many factors for
easy identification of constructs and to avoid multiple loadings on the constructs (Rennie, 1997). The EFA is executed by SPSS, for automatically calculating the number of factors to be extracted, with specifying suppression value under 0.33 (Ho, 2014). Item-to-total
correlations for all 53 scales were W0.33, suggesting no need for scale modifications (Nunnally and Bernstein, 1967). The internal consistency reliability, i.e., stability of
individual component across its group of similar scales (Cronbach’s α) for six extracted
components were noticed ranging from 0.826 to 0.979 which were above 0.6 and, hence, accepted (Nunnally and Bernstein, 1967). In case of third extracted Component C, where the
Cronbach’s α would have been 0.952 instead of 0.948, if the scale item, location and distance of TEI (CHT1) had been deleted from the group. However, due to its importance mentioned
in literature (content validity), this scale item has been retained. Internal consistency is also tested by the split half technique (Ho, 2014), which showed higher correlation with
Spearman-Brown coefficient for all scale items ranged between 0.811 to 0.976 and noticed above the requirement level. Table II shows the results of factor analysis and related
reliability tests. All 53 scale items exhibited a high level of potential for being factorized,
with a Kaiser-Meyer-Olkin (KMO) statistic of value 0.973 (W0.5) and significant results
pertaining to Bartlett’s test of sphericity (ρ¼0.000 o0.001 with χ2 ¼ 36,937.961,
df¼1378) that symbolizes worthy sign of adequacy for factor analysis (Cerny and Kaiser,
Henry, 1977). Floyd and Widaman (1995) recommend sample size ten times greater than the scales to be measured. In this case adequacy of sample size sounds good as the study has
undertaken a sample of 642 and 53 scales (ratio W10). The test suggested that the sampling adequacy is good with all scale constructs suitable for factor analysis.
Construct validity
Validity of data relates to the extent to which the scale items correlate positively to the
other similar scale under the same component. Validity refers specifically to convergent and discriminant validity within and between scale item sets, respectively. To affirm convergent validity, scales must load strongly and significantly in the hypothesized
direction (Green, 2016). According to Ho (2014), for the inclusivity of a scale into a component of a similar construct, factor loadings above 0.4 are recommendable. Factor
loading on the 53 item scales showed that all scales are a good construct of a similar component. There are 42 scales that have factor-loading ranging from 0.9 to 0.7, ten item
scales ranged in between 0.7 to 0.4 and 1 item scale that is cost of education (CHT2) having factor loading of 0.360 (refer Table II). Hair et al. (2011) have recommended factor loadings
0.3 and above for a sample size of 350 respondents. Here sample size N¼642 is well above the requirement. Second, due the importance of its content validity, cost of education has been retained even if it carried low factor loading. Critical ratios of all scale items obtained
by the CFA showed values above 1.96 at po0.05, which confirmed strong convergent validity (Wong and Merrilees, 2007). Second, average variance extracted (AVE) computed
for each construct obtained by EFA showed a value above 0.5 and composite reliability values were found between 0.6 to 0.9 which suggested good convergent validity (Hair
et al., 2011). To test discriminant validity, cross loadings of the 53 scales were analyzed on the six constructs (in between the components) to test factor loading above 0.4 for more than one scale across the components. However, no factor loadings above 0.4 were found
across the constructs for the same item scales. Discriminant validity was also confirmed by involving pairwise (two constructs at a time) scales to perform PCA, which showed the
extraction of two components (constructs) for every pair of constructs (Sultan and Yin Wong, 2012). This procedure demonstrated sound discriminant validity between all pairs
of constructs. Scale reduction and component extraction
Six components are extracted from 53 item scales constituted on SMM elements which accounted for 73.19 percent of variance that exhibited eigenvalue 1.415 (above 1.0). Labeling of Components A, B, C, D, E and F are based on the type of scale items it encloses and its
relevance to the reviewed literature as presented in Table I. Components A, C, D and E are illustrative of traditional SMM that is considered as service input mix, while Components B
and F are customers’ behavioral outcome (service output) of service delivery symbolize new emerging SMM.
Component A. The first latent (construct) variable, Component A, accounted for
22.12 percent of the variance and has emerged from 15 observed variables in total with
Cronbach’s α¼0.979. Wherein, six observed variables are related to the “physical evidence”
element of service mix (scale item PHF1 to PHF6) and nine are associated with the “process”
element of mix (scale items PRO1 to PRO9). Thus this Component A is identified as “Physical Evidence+Processes.”
Component B. The second latent variable is the outcome of ten observed variables
accounted for 13.99 percent of variance with Cronbach’s α¼0.974. It is concerned with the
skill and knowledge enhancement (scale items PER1–PER10) of students and is termed as
“Performance.” Component C. The third latent comprises 13.75 percent of variance with Cronbach’s
α¼0.946, and is the product of ten observed variables, out of which nine variables are
associated with “promotion” mix (MAR1 to MAR9) and one variable is linked with “place”
mix (scale item CHT1). This component is labeled as “Promotion+Place.” Component D. The fourth extracted component is derived from eight observed variables
accounting 10.44 percent of variance with Cronbach’s α¼0.911. It consists eight human
influencers (scale items INF1 to INF8) and is acknowledged as “People.” Component E. The fifth component shows 9.4 percent of variance with Cronbach’s
α¼0.906 resulting from eight observed variables. Five-item scales out of eight are
symbolizing perceptions towards TE program benefits (scale items MOT1 to MOT4) and self-motive for program (scale item INF9), and are categorized as “program.” One item scale
refers the cost of education (scale item CHT2) signifying “price” element of mix. Last two elements, image and reputation (scale item CHT3), and age of institution (scale item CHT4)
are suggesting towards the extended element of mix “prominence.” Altogether the fifth component houses eight observed variables that can be described as
“Program+Price+Prominence.” Component F. The sixth component exhibited 3.49 percent of variance with Cronbach’s
α¼0.826 is an outcome of two observed variables satisfaction (scale item SATS) and
referral act (scale item REFR). Satisfaction is named as “pleasure”, and referral act is labeled as “pointing-out.” The whole component, thus, is referred to as “Pleasure+Pointing-out.” This component is expressing new emerging Ps, Pleasure (satisfaction) and Pointing-out
(referral act).
Model specification
As per the guiding principles of Baxter et al. (2008) on implementing SEM, paths are drawn
to distinguish relationships among variables based on the conceptual hypothetical model through SPSS AMOS. One directional arrow represents the relationships ( factor loadings)
between the observed indicators and extracted latent variables. Components A, C, D and E are connected by the two-way directions of arrow reflecting relationships (correlation) between latent variables (called path coefficients), which are exogenous by nature.
Covariance exits because of hypothesized relationships (correlations) among the latent variables. On the other hand, Component B and Component F are endogenous and reliant
on Components A, C, D and E, and are connected by a one-way arrow. Variances are estimated for indicator errors associated with the observed variables and the errors associated
with the endogenous variables (dependent). Overall, there are 114 total variables in the model with 53 observed variables (measured) and 61 unobserved variables (latent). There are 59 exogenous (independent) variables and 55 endogenous (dependent) variables in the
measurement model (refer Figure 2).
Model identification and estimation
Model estimation involves the determination of the value of the unknown parameters
(pathways) and the error is associated with the estimated value. Maximum Likelihood estimation method (Green, 2016; Iacobucci, 2010) is selected and AMOS automatically displayed the estimations for all pathways presented in the model with standardized as well
as unstandardized estimates, which are presented in Table III. Referring to Table III, variances between the scale items and concerned latent constructs demonstrate strong
accountability of scale items toward its latent constructs with standardized estimates ranging from 0.90 to 0.60 suggesting a strong belonging resulting statistical significance with CR
ranging from 9.33 to 45.69 (W1.96 at p o0.001). All exogenous Components A, C, D and E
are assembled well with CR ranging from 8.12 to 12.46 (W1.96 at po0.001). Referring to Table IV, covariance path between the latent constructs shows a strong relationship with
standardized path coefficients ranging from 0.5467 to 0.8046. Highest path coefficient, i.e.,
correlation is found for Physical Evidence +Process and Program+Price+Prominence (β
¼0.8046, CR¼12.30), and the lowest correlation is observed in between Physical
Evidence+Process and People (β ¼0.5467, CR¼9.37).
Referring to Table V, latent construct, Performance, has direct impact due to Physical
Evidence+Processes (β ¼0.5388), Promotion+Place (β ¼0.0644), People (β ¼ −0.0858)
and Program+Price+Prominence (β ¼0.3768). Observed variable, Pleasure, has indirect
effect because of Physical Evidence+Processes (β ¼0.2724), Performance (β¼0.0163),
Promotion+Place (β¼0.1943), People (β ¼0.0276), Program+Price+Prominence
(β¼ −0.1833) and direct effect due to Pleasure+Pointing-out (β¼0.8272). Similarly,
observed variable, pointing-out, has indirect effect because of Physical Evidence+Processes
(β ¼0.2801), Performance (β¼0.0168), Promotion+Place (β¼0.1998), People (β¼0.0283),
Program+Price+Prominence (β¼ −0.1885) and direct effect due to Pleasure+Pointing-out
(β¼0.8572). Pleasure+Pointing-out, as a combined construct, has both direct and indirect
effect accounting due to Physical Evidence+Processes (β; total¼0.3293, indirect¼0.0106,
direct¼0.3187), Performance (β; total¼0.0197, direct¼0.0197), Promotion+Place
(β; total ¼0.2349, indirect ¼0.013, direct ¼0.2336), People (β; total ¼0.0333,
indirect¼−0.0017, direct¼0.350) and Program+Price+Prominence (β; total¼−0.2216,
indirect¼0.0074, direct¼−0.2290).
Model fit
It is necessary to examine the hypothesized model by comparing it to the measurement
model by observing the extent to which it is consistent with the data, which is called as the
goodness of fit. If the goodness of fit is adequate, it supports the plausibility of the
relations among variables (Teo et al., 2013). Various model fit indices for the measurement model obtained in this study are noticed in accordance with the fit indices specified
in Table VI. Model modification
Adjustments are made on only some error variances pointed out by AMOS under modification indices tab for connecting them to reduce discrepancy and
improved fit of the model (Schreiber et al., 2006) by keeping hypotheses undisturbed. Residual variables for which modification indices are of value 30 and above (Ho, 2014) are
connected to produce the final measurement model with improved model fit indices as shown in Figure 2.
Data interpretation and hypothesis testing Among the nine relationships developed by the SEM model pertaining to traditional SMM (input) and new emerged SMM (output) in terms of performance, pleasure and pointing-out,
six latent variables are found statistically significant (CRW 1.96 at p o 0.05) with four being positively related and two have negative influence (refer Table VII). The SEM measurement model has demonstrated that the operationalization of the
concept appears to be stable and the relationships hypothesized appeared to be measuring what this study and hypothesized model has set out to measure. The results also
demonstrated a strong predicted ability of latent construct “Performance” (output) with square multiple correlations (R2) value of 0.7514. This means that the predictors of
“Performance” explain 75.14 percent of its variance. However, second service mix output,
“Pleasure+Pointing-out,” is designated only 14 percent of its variance. As mentioned by Hair et al. (2011), R2 values of 0.75, 0.50 or 0.25 for endogenous latent variables in the
structural model can be described as substantial, moderate, or weak, respectively. Here we can conclude that latent variable, “Performance,” has a substantial predicted ability
encompassed by “Program+Price+Program” (0.3768) and “Physical Evidence+Processes” (0.5388), whereas, latent variable, “Pleasure+Pointing−out,” has a low predicted ability
constructed by “Program+Price+Prominence” (0.2290), “Promotion+Place” (0.2336) and
“Physical Evidence+Processes” (0.3187). Based on the students’ perceived experience on the SMM strategy adopted by TEIs situated in the Khandesh region of India, the hypothetical
model is tested and hypotheses validation is described below. Hypothesis (H01)
• Students’ perceived experience on “Physical Evidence+Process” offered by their
TEIs in which they are enrolled is significant with their “Performance” in regard with their skill and knowledge enhanced (CR 11.03 at po0.001), which concludes that H01
is rejected and alternative H1 is accepted for this case. This leads to a rise of 0.5388 units in their “Performance” if “Physical Evidence+ Processes” are raised by 1 unit.
Physical facilities, processes, exerted a positive impact in enhancing students’ skill and knowledge. Kuh (2009) reported various educational service activities triggering
students’ engagement are vital for their performance in regard to skills and competencies. These discoveries replicate other findings of the study conducted by Mahajan and Golahit (2017b) showing significance of physical infrastructural facilities,
academic and non-academic services on employability skills in context to TE in India. It also supports the study of Jamjoom (2012) where employability skills were found to
be distinct with academic-related facilities and extracurricular activities: • Students’ perceived experience on “Promotion+Place” associated with their TEIs is not
significant with their “Performance.” As students’ skill and knowledge enhancement do not have any relationships with “Promotion+Place,” H01 is supported and retained. Promotion and Place that are provided by TEIs are not well organized to augment the
performance of students. • “People” influence experienced by the students is significant with their “Performance”
(CR −2.25, po0.05), however, negatively associated which determines the rejection of
H01 and acceptance of H1. This further tells that when the “People” influence increases by one unit, their “Performance” will be down by 0.0858 unit.
People influence is though significant but not up to the expectations resulting low impact on improving the performance of students. These findings are different to the
statement made by Yelkur (2000), who is of opinion that people encourage students to achieve better employability skills. Under pressure situation, arising due to meeting
expectation of people could be the worrying factor that results in the low performance of students: • The perceived experience on a group of “Program+Price+Prominence” of TEIs is
significant and shows a positive relationship with the “Performance” of the students (CR 6.43, at po0.001). This fixes the rejection of H01 and confirms alternative H1 for
this case. Further, it confirms that SMM, “Program+ Price+Prominence” when goes up by 1, students’ “Performance” will go up by 0.3768. This supports beliefs of
Jagadeesh (2000) who is of the opinion that that program attributes enhance capabilities and employability skills. Hypothesis (H02)
• Students’ perceived experience on “Performance” in terms of their skill and knowledge development are not significant with their “Pleasure+Pointing−out.” H02
is retained here. To be meaningful, students belonging to this region experienced less
satisfaction than expected due to their performance, consequentially no act of referral is perceived. In this case, skill and knowledge enhancement is not a significant
indicator of satisfaction and referral act. In context to Australian higher education, Mahsood Shah and Widin (2010) stated generic
skill as an important factor for indigenous students; however, the universities are not attentive towards it that is causing dissatisfaction among them. Shah et al. (2010) reported satisfaction because of the development of generic skill in case of offshore students.
Results of this study are contradictory to Harvey (2000) and Dacre Pool and Sewell (2007) who believed employability skills are significant performer indicator of satisfaction. Hypothesis (H03)
• Students’ perceived experience on “Physical Evidence+Processes” provided by their TEIs wherein they are enrolled are significant with their perceived experience of
“Pleasure+Pointing-out” (CR 3.26 at Po0.01). Thus, when “Physical Evidence +Processes” goes up by 1 unit, “Pleasure+Pointing-out” will go up by 0.3187 unit.
This concludes that H03 is rejected and alternative H3 is accepted. Students’ feelings of satisfaction is greatly determined by physical facilities and
processes offered by their TEIs, thereby promoting referral act for their institution. These outcomes are supportive to the findings of Sakthivel et al. (2005), Neelaveni
and Manimaran (2015), Mahajan and Golahit (2017a) and Carter (2009) that revealed the impact of students satisfaction on account of campus facilities. It also supports the findings in terms of the positive relationship of service facilities with students’
satisfaction and behavioral act of recommending services as discovered by Casidy (2014), Athiyaman (1997), Subrahmanyam (2017), Annamdevula and Bellamkonda
(2016a, b) and de Castro and de Guzman, (2014): • Students’ perceived experience on “Promotion+Place” are significantly associated
with their perceived experience on their “Pleasure+Pointing−out” (CR 3.03, at
po0.01). The effect is positive, which ensures that when “Promotion+Place” increases by 1 unit, “Pleasure+Pointing−out” will increase by 0.2336 unit. Here, H03
is rejected and alternative H3 is accepted. Marketing communication sources and location of TEIs as per the perceived experience of students are significant constructs to their satisfaction and act of referral.
It followed findings of Casidy (2014) who revealed marketing communications to be a significant predictor of satisfaction and action of recommending:
• Students’ perceived experience on the surrounding influences, “People” is not significant with their “Pleasure+Pointing−out”. H03 is retained in this case.
This states that the surrounding people who are the supporting pillars for the students’ TE career do not have any impact on their satisfaction and their referral act perceived. These results are opposite to the views of Sahney et al. (2004), who stated
human influence affects students’ satisfaction: • Students’ perceived experience on “Program+Price+Prominence” are significant
with their perception of “Pleasure+Ponting-out”; however, the negative value indicates that the impact is below the expectation level (CR −2.01, at po0.05). This
indicates that if “Program+ Price+Prominence” goes up by 1 unit, their perception of
“Pleasure+Ponting−out” will go down by 0.2290 unit. H03 is rejected and alternative
H3 is accepted.
The service mix group of price, program and prominence combined shows a significant impact on satisfaction and act of referring, however, with negative inclination. The positive relationship of price (cost of education) and prominence (age
and reputation of institution) with satisfaction and referral act as noticed by regression analysis supports the earlier findings of Clemes et al. (2007) and Turkyilmaz et al.
(2018). The positive relationship of prominence, institution reputation with students’ satisfaction and adherence is in accordance with the earlier findings of Helgesen and Nesset
(2007) and Elsharnouby (2015). Price element favoring satisfaction and referral act confirms that various fee reimbursement schemes of the government have taken up most of the financial burden from students and their parents. In terms of program
element, regression analysis showed that the quality of life and strengths and talent associated with program as benefits are negatively posed with satisfaction and referral
act. This concludes that their self-efficacy referring to the program utilities and self-capabilities are not up to the expectation and are below the perceived value ( Jones
et al., 2010; Matusovich et al., 2010). The findings of this study in a different cultural and socio-economic context have ecologically acknowledged earlier findings and nevertheless it has also provided new
findings that are unique and exclusive in the HTE framework. H01–H03 are tested and research objectives 1 and 2 are acknowledged here.
Visionary suggestions and practical implications Based on the perceived experience of students studying in TEIs situated in the Khandesh
region of India, overall, physical evidence and process are noticed to be prime significant indicators (input) for performance, satisfaction and referral act of students. However, people element, which is not significant in this case on the satisfaction and referral act of students
and is also negatively positioned with the performance of the students. Therefore, “people” element should be reviewed by TEIs of this region for reframing the policies on human
relationships that promote motivation, training, interactions and participations. Parents and institution’s staff meetings are necessary for informing families about their children’s
academic performance and achievements periodically. Institutional staff as a students’
guardian (mentor) for taking care of students will be encouraged to feel them protected and affiliated. Students and staff interface should be regularly held with industry, and alumni on
campus or at industry places or through video conferencing will be effective for undergoing professional learning experience for students. It will help to enhance their performance,
quality of the institution (Abdul Rahman and Unnikrishnan, 2015) and word-of-mouth for their institution (Svoboda and Harantova, 2015). Involvement of all human influencers
through direct or indirect interaction will keep students’ moral and interest high. Students influencers are powerful in contributing overall satisfaction (Oldfield and Baron, 2000); therefore, people’s involvement and interaction is must in delivering and performing service.
For these reasons, TEIs of this region should focus on relationship marketing (Gronroos, 1994; Maringe and Gibbs, 2008) that comprehend students, faculty, school-teachers, alumni
and industry people as “partners” of the co-creating system, in which long-lasting relationships can be developed. With this approach students will be co-producers of the TE
system by accepting their responsibility for participating and performing at their own with the support from the TEIs and other stakeholders of the system (Elsharnouby, 2015). TEIs of this region should develop their social networking sites like Facebook, LinkedIn, Twitter
and WhatsApp groups that are advantageous in making interaction and building strong bonding among all stakeholders that automatically facilitate the co-creating system not only
in the TE system but also in the society as a whole. Such a system is helpful in transforming students’ willingness into acceptance, their engagement into participation, their skills into
values, institutional identity into a brand and their professionalism into socialism. Another SMM element, program attributes that revealed to have a negative command on
satisfaction and referral act, is ought to be reframed for enhancing students’ satisfaction and referral act. Program attributes as perceived by the students in terms of job prospectus
and entrepreneurship should be imparted as expected by them. Separate placement cell and entrepreneurial cell are vital to fulfill students’ expectations regarding program benefits.
Students should be offered course enrichment by providing add-on or certification courses such as Massive Open Online Courses. Besides program curriculum, TEIs should provide mandatory soft as well as technical skill training to their students as required by industry to
enrich their language proficiency, knowledge and skills and to make them employable and competitive in job market. This kind of certification courses and training accomplished
during the program curriculum will add value to their curriculum vitae and will raise their market standing. Start-up and project laboratories, research centers, industry and alumni
interface and project-based learning that are associated with idea generations are effective in developing entrepreneurship skills and establishments of small starts-up. This will create a development of small-scale enterprises and the opportunity of employment in the region
that will assist in raising the quality of life of individuals and socio-economic status of the region. Service delivery related to program enrichment contributes to upsurge students’ self
efficacy and motives that create a good campus life experience for them. Most importantly, this makes the program’s value more justifiable for what students have accepted it and once
the expectations are met, satisfaction will be naturally established.
SMM elements such as promotion and place provided by the TEIs are not significant on students’ performance and must be examined again to get the expected performance of their students. This suggests that activities and achievements of students in terms of skill and
knowledge enhancement should be promoted through TEIs marketing communication sources. Promoting and publicizing students’ performance-based achievements on social
media and newspapers are effective promotional tools in appreciating their efforts and achievements and in boosting their morale. Performance-based achievements should be
rewarded at the institutional level in terms of cash benefits or compensations that will also create motivation for others. Second, as place element is associated with location and locality of physical facilities and amenities, equipment, playground, laboratories, library sources,
hostels, safety and security services, and health and recreational services should be more accessible and convenient so that assist to develop the performance of students. Even digital
locations, such as social networking sites, as discussed earlier should be easily accessible for the students for their interactions with other stakeholders that may aggrandize their
performance. Tijjang et al. (2017) revealed that students expect continuous improvement in SMM provided
by the institutions and it is not significant on students’ satisfaction due to non-progressive development over the service period. Therefore TEIs of these regions are
suggested to evaluate SMM periodically and reframe their policies to achieve a desired performance, satisfaction, recommendations and anticipated results. Objective 3 related to
proposing visionary suggestions to implement the measurement model in terms of integrating SMM as input and output of the TE system is achieved here.
Students’ perceived experience on SMM elements performed through the SEM technique has pulled out the best possible relationship between the service inputs and output. It also has
brought out notable emerging marketing Ps, Prominence, Performance, Pleasure and Pointing-out. Incorporating 11 Ps in TE settings ensures value-based outcome;
“performance” being valuable to students in terms of employability skill development, “satisfaction” being advantageous to institutional brand development by spreading word-of-mouth, and “referral act” being effective for collective growth in terms of captivating future
enrollments. In context to TE setting, these outcomes and its measurement are productive in making TE not only to “grow” quantitatively but also to “develop” it quantitatively. By
adopting methodology and empathizing the outcomes mentioned herein, the TEIs of this region can stay ahead in the realm of growing competition along with being an attraction for
future students and being a holistic service provider for existing students. Integration of SMM as inputs and output of the TE system pragmatically are valuable in making awareness, attracting, engaging, retaining and making students’ employable and, thus, signals strong
estimates for growth and development in TE setting. This can be used as a self-assessment and diagnostic tool to measure students’ performance, to identify satisfaction level and to
predict the act of referring ( future enrollments) in relation to institutional service offerings. Students market in the Khandesh region is huge and can be seen as an emerging market and
a great opportunity to develop the quality of life of the region. If TE is a treasure house for socio-economic development of rural population, integration of SMM elements is the vital
key for it. Besides strengthening the growth and development of TE, this measurement model is expected to contribute to the socio-economic development of the country by appealing
future technocrats and creating capable and satisfied technocrats with sets of required skills that compete to face the emerging global challenges.
Discussions and conclusion Almost all previous studies have considered SMM as an input to the service system; however, they failed to link them as an output of the service system. SMM as a strategic
marketing tool has advanced from the theoretical to practical prospective (Kotler, 1976; Kotler andMcDougall, 1984); however it has been more intended toward service providers
than their customers (Kotler, 2003). No doubt, the traditional marketing mix has proved its usefulness in promoting marketing concept by providing a practical framework to the
marketing decision making pertaining to the education field for many years (Bennett, 1995).
Contradictory, several academicians had objections to the values and future of SMM in terms of its inadequacy and consistency to address specific situations in the marketing of services
with technology and time changes (Constantinides, 2006). Gronroos (1989) mentioned that the number of elements representing SMM is too limited for achieving mega marketing, and
accessing new market conditions and situations. Grove et al. (2000) recognized the importance of the performance of service from customers’ point of view and strongly
recommended its addition to SMM list. Graduate employability (students’ performance in terms of skill and knowledge enhancement) is agreed to be the key influencer of economic growth in the global knowledge economy (Bridgstock, 2009), which strongly suggests the
addition of “performance” in SMM list.
In regard to the marketing of services, Beckwith (2001) was of the opinion that in a changing world, service delivery should be focused on customer satisfaction. For marketing
to be a significant contributor to value-adding and continuous movement (Porter, 1985), SMM elements must be assessed through both traditional and emerging marketing domains (Constantinides, 2006). Marketing efforts in today’s complex marketplace will succeed only
if they are monitored to evaluate the performance of service and satisfaction of customers, and if it brings future business opportunities. As the students’ investment in terms of cost,
efforts and time is substantial in availing their TE study, their satisfaction resulting from self-development and performance during their academic is important; moreover, such a
behavioral measurement (Sander et al., 2014) is most vital in the repositioning of SMM elements. Kotler et al. (2016) pointed out teaching services being intangible among all service industries and SMM elements pertaining to it should be attentive to its depth of
intangibility. As SMM conjointly effects on customers engagement, satisfaction and relationships, it should not be limited to the numbers (Kotler and Armstrong, 2017). In TE
scenario, most of the future enrollment spring up due to existing or experienced students or their influencers, “Pointing-out,” i.e. recommending services to others has a dominant role in
attracting future enrollments. Rafiq and Ahmed (1995) are of the opinion that extended marketing mix has been successfully accepted due to its ability of detailing, broadness, integration and comprehensiveness of marketing concepts. As extended SMM exhibited in
this study carries that sense and nature approaching customer orientation, it deserves a great scope for future of the TE system in terms of the growth and development of existing
TEIs as well as newly established institutions.
This study has evidenced a desperate need of extending SMM and integrating them as input and output of the TE system. Subsequently, the findings have successfully traced
their relationships based on the hypothetical model. In addition to traditional SMM, it has discovered new emerged in terms of “Prominence” as another service input, and
“Performance,” “Pleasure” and “Pointing-out” as service output. All three SMM elements appertain to service output are also vital as a measurement model for service delivery. It can
be concluded that, overall, 11 SMM are examined for their relationships and their correlation in terms of input and output to the TE system showing strong reflections. Such integration
of SMM is perhaps the best possible approach that ensures the growth and development of TE that offers strong add-ons to the special characteristics of a dynamic TE environment. The study has provided some and emerging new insights for service providers (TEIs) who
intend to improve students as well as institutional performance and for researchers in designing new studies.
Limitations and future research directions The investigation of this study is dependent on students’ perceptions (primary customers). Future research may be worthwhile to develop measuring instruments from the point of
other stakeholders of the HTE system. Almost all earlier studies on SMM are oriented to the initial phase, i.e., service selection phase of future students for their inclusivity into the TE
environment. Though this study has focused general look on SMM elements, future research involving more investigation on the constructs and scales of SMM that focuses and
covers all three students’ life cycle, i.e., future-students, current-students and alumni is anticipated. Similarly, this study is linked with TE programs of higher education. Future studies on non-technical programs of higher education like medical and law are appreciated.
Finally, the sampling frame involved in this study is confined to the Khandesh region of India, a rural and tribal part of India. Although the findings cannot be generalized, the
measurement model exhibited in this study in terms of integrating SMM elements as service input and service output of the TE system can be applied to the other regions of India or
even taking it for global consideration. Such a study would facilitate to examine the performance of SMM elements as input and output to the education system in different regions and countries.

Table 1: SMM elements in context to HTE
SN SMM elements Literature support
1 Program
Quality of life Agarwala (2008), Kinzie et al. (2004), Leslie and Brinkman (1988) Job prospectus Agarwala (2008), Lichtenstein et al. (2009) Talent and strength Woolnough (1994), Lent et al. (2003) Entrepreneurship Capstick et al. (2007)
2 Price Cost of education Khanna et al. (2014), Ravindran and Kalpana (2012), Sojkin et al. (2012)
3 Place Location, distance and locality Khanna et al. (2014), Maringe (2006), Paulsen (1990)
4 Promotion Media advertisement Khanna et al. (2014), Paulsen (1990) Banners and hoardings Kamath and Sheena (2015) Website Dawes and Brown (2002) Social media Chauhan and Pillai (2013), Rani (2014), Vyas and Sharma (2013) Counselling visits Dawes and Brown (2002), McGrath (2002) Educational fairs McGrath (2002) Leaflet and brochure Wilson et al. (2006), Dawes and Brown (2002) Sponsorships O’Mahony and Garavan (2012) Publication/Publicity Cavas et al. (2011)
5 People Parents Chapman (1981), Wang and Degol (2013) Siblings Cerinsek et al. (2013) Relatives Gajic (2012), Wadhwa (2016) Friends Tripney, et al. (2010), Gajic (2012), Wadhwa (2016) Current-students Hayes (2014), Borrego et al. (2018) Alumni Abdullah and Saeid (2016), Hayes (2014) Schoolteachers Maringe (2006) Institute staff Wajeeh and Micceri (1997), Maringe (2006) Yourself James et al. (1999), Ng et al. (2008), Briggs (2006)
6 Physical evidence Infrastructure and technology Mazzarol and Soutar (2002), Sayeda et al. (2010), Sakthivel and Raju (2006) Amenities and recreational Sahu et al. (2013a, b), Deshmukh (2006) Library and computational Jain et al. (2013), Gupta (2011), Deshmukh (2006), Sayeda et al. (2010) Recognition and gradation Prasad and Bhar (2010), Sports and cultural Sahu et al. (2008), Deshmukh (2006), Das and Mukherjee (2017) Campus life Sakthivel (2007), Paswan and Ganesh (2009), Elliott and Healy (2001)
7 Process Faculty and teaching-learning Bhatia and Bhatia (2008), Narang (2012), Sohani and Sohani (2012) Campus placements Gambhir et al. (2016), Khanna et al. (2014) Industry interactions Pal Pandi et al. (2013), Bhatia and Bhatia (2008) Co-and extra-curricular activities Jain et al. (2013), Sayeda et al. (2010) Safety and security services Gambhir et al.(2016), Elliott and Healy (2001) Alumni interaction Sayeda et al. (2010), Sahu et al. (2013a, b) Skills development programs Mitra Debnath and Shankar (2012), Deshmukh (2006), Viswanadhan (2009) Research activities Reddy et al. (2016), Sharma and Sharma (2015), Subbarao (2013) Finance and scholarship Hossler and Gallagher (1987), Deshmukh (2006), Paswan and
Ganesh (2009) 8 Prominence
Institutional image and reputation
Ravindran and Kalpana (2012), Singh (2013) Mourad (2011), Khanna et al. (2014)
Age of institution Pushkar et al. (2013), Sakthivel (2007) 9 Position Mahajan and Golahit (2017c)
10 Placement Enache (2011) 11 Productivity Lovelock and Wright (1999)
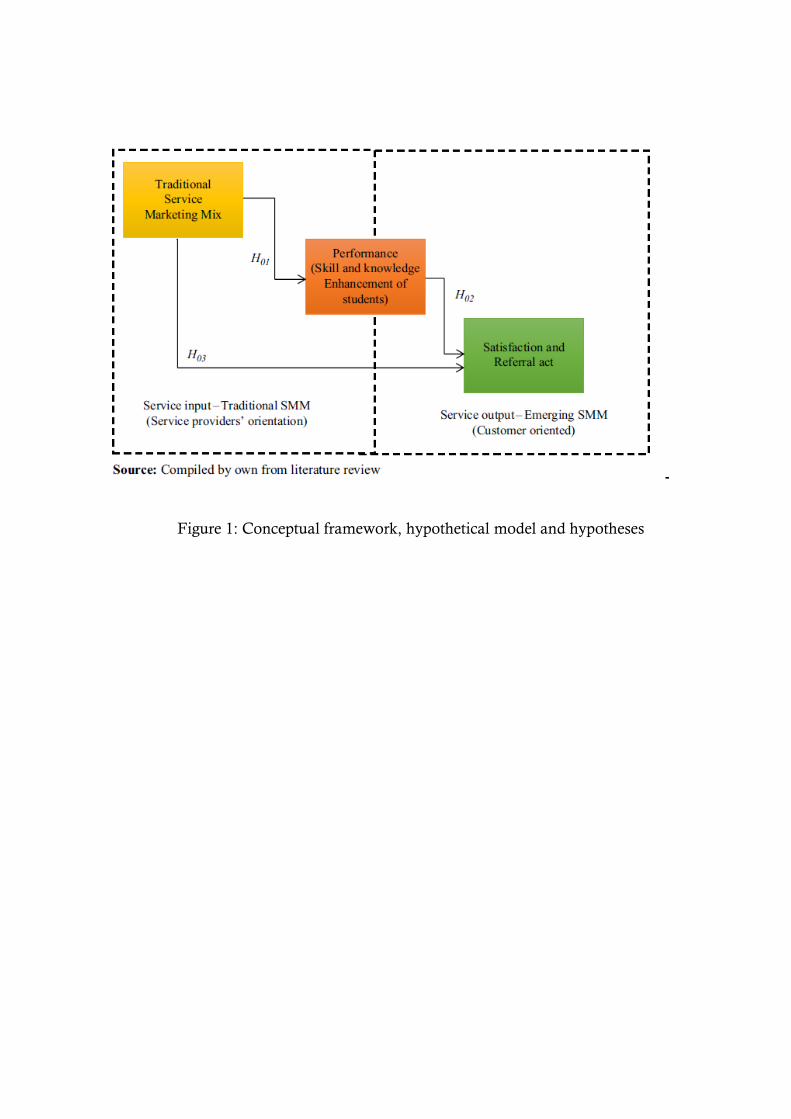
Figure 1: Conceptual framework, hypothetical model and hypotheses
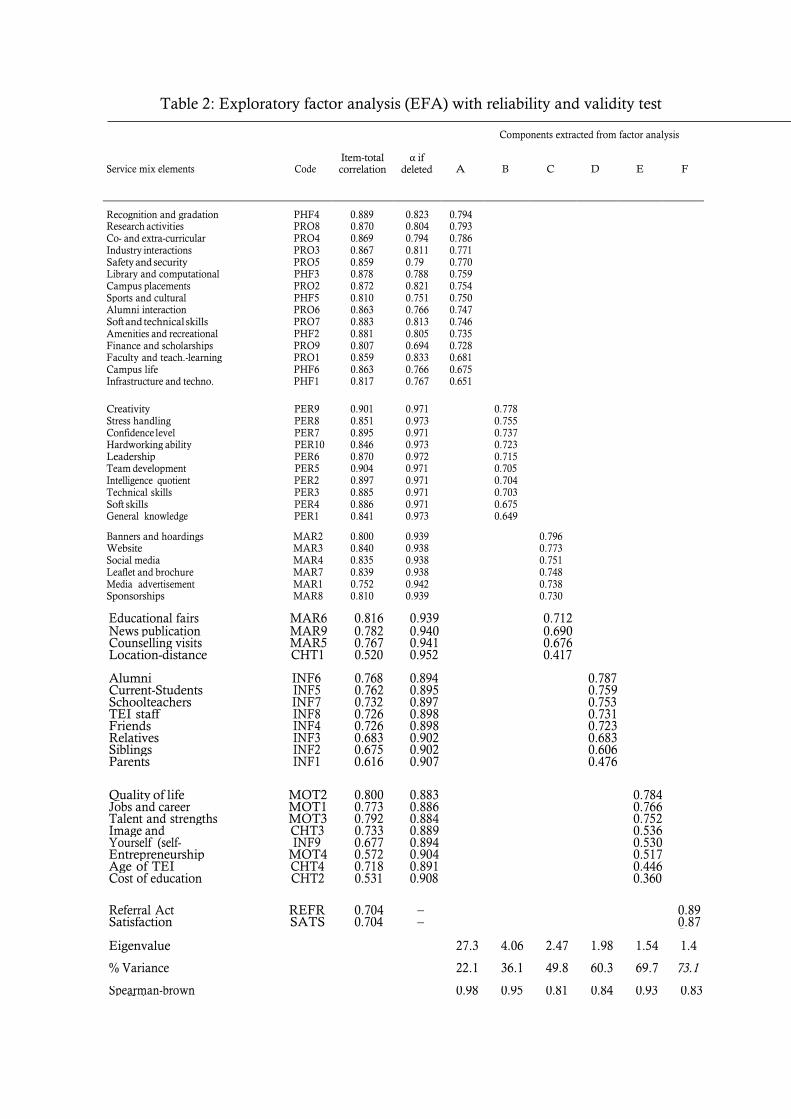
Table 2: Exploratory factor analysis (EFA) with reliability and validity test
Components extracted from factor analysis
Service mix elements Code Item-total correlation
α if deleted A B C D E F
Recognition and gradation PHF4 0.889 0.823 0.794
Research activities PRO8 0.870 0.804 0.793 Co- and extra-curricular PRO4 0.869 0.794 0.786 Industry interactions PRO3 0.867 0.811 0.771 Safety and security PRO5 0.859 0.79 0.770 Library and computational PHF3 0.878 0.788 0.759 Campus placements PRO2 0.872 0.821 0.754 Sports and cultural PHF5 0.810 0.751 0.750 Alumni interaction PRO6 0.863 0.766 0.747 Soft and technical skills PRO7 0.883 0.813 0.746 Amenities and recreational PHF2 0.881 0.805 0.735 Finance and scholarships PRO9 0.807 0.694 0.728 Faculty and teach.-learning PRO1 0.859 0.833 0.681 Campus life PHF6 0.863 0.766 0.675 Infrastructure and techno. PHF1 0.817 0.767 0.651
Creativity PER9 0.901 0.971 0.778 Stress handling PER8 0.851 0.973 0.755 Confidence level PER7 0.895 0.971 0.737 Hardworking ability PER10 0.846 0.973 0.723 Leadership PER6 0.870 0.972 0.715 Team development PER5 0.904 0.971 0.705 Intelligence quotient PER2 0.897 0.971 0.704 Technical skills PER3 0.885 0.971 0.703 Soft skills PER4 0.886 0.971 0.675 General knowledge PER1 0.841 0.973 0.649
Banners and hoardings MAR2 0.800 0.939 0.796 Website MAR3 0.840 0.938 0.773 Social media MAR4 0.835 0.938 0.751 Leaflet and brochure MAR7 0.839 0.938 0.748 Media advertisement MAR1 0.752 0.942 0.738 Sponsorships MAR8 0.810 0.939 0.730
Educational fairs MAR6 0.816 0.939 0.712 News publication MAR9 0.782 0.940 0.690 Counselling visits MAR5 0.767 0.941 0.676 Location-distance CHT1 0.520 0.952 0.417
Alumni INF6 0.768 0.894 0.787 Current-Students INF5 0.762 0.895 0.759 Schoolteachers INF7 0.732 0.897 0.753 TEI staff INF8 0.726 0.898 0.731 Friends INF4 0.726 0.898 0.723 Relatives INF3 0.683 0.902 0.683 Siblings INF2 0.675 0.902 0.606 Parents INF1 0.616 0.907 0.476
Quality of life MOT2 0.800 0.883 0.784 Jobs and career MOT1 0.773 0.886 0.766 Talent and strengths MOT3 0.792 0.884 0.752 Image and reputation
CHT3 0.733 0.889 0.536 Yourself (self-motives)
INF9 0.677 0.894 0.530 Entrepreneurship MOT4 0.572 0.904 0.517 Age of TEI CHT4 0.718 0.891 0.446 Cost of education CHT2 0.531 0.908 0.360
Referral Act REFR 0.704 – 0.890 Satisfaction SATS 0.704 – 0.875
Eigenvalue 27.3 4.06 2.47 1.98 1.54 1.4
1
% Variance (Cumulative)
22.1 36.1 49.8 60.3 69.7 73.19
Spearman-brown coefficient 0.98 0.95 0.81 0.84 0.93 0.83
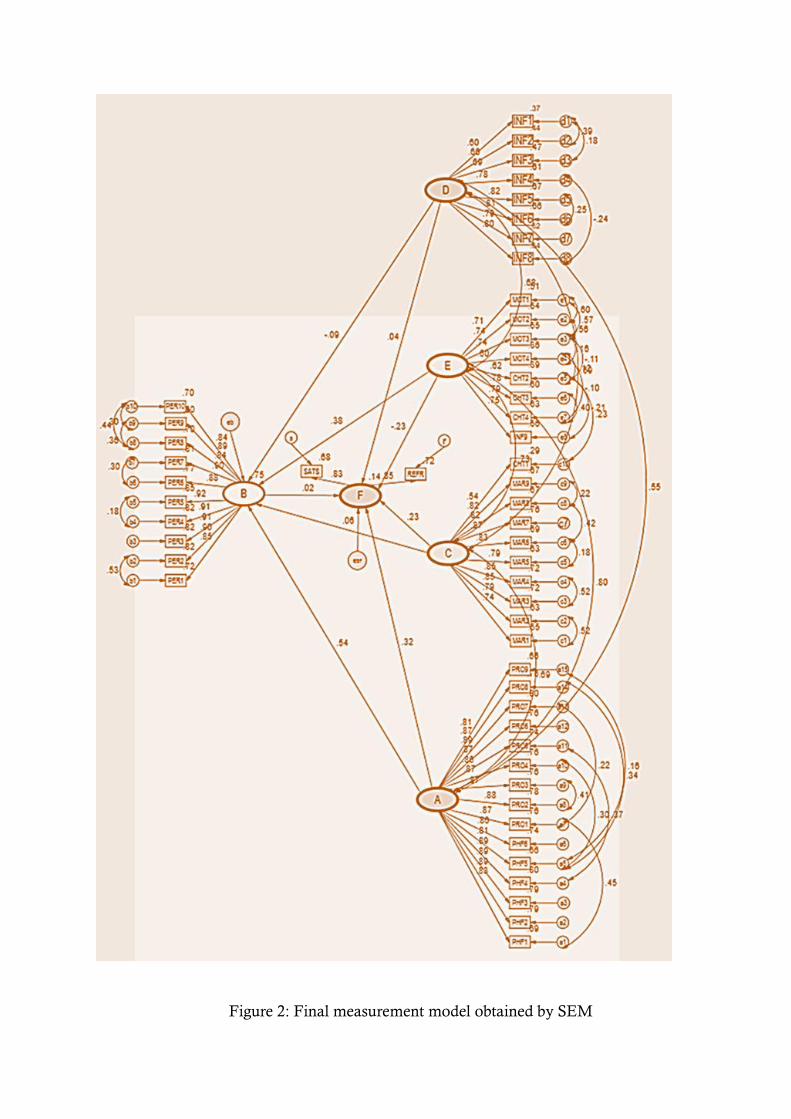
Figure 2: Final measurement model obtained by SEM
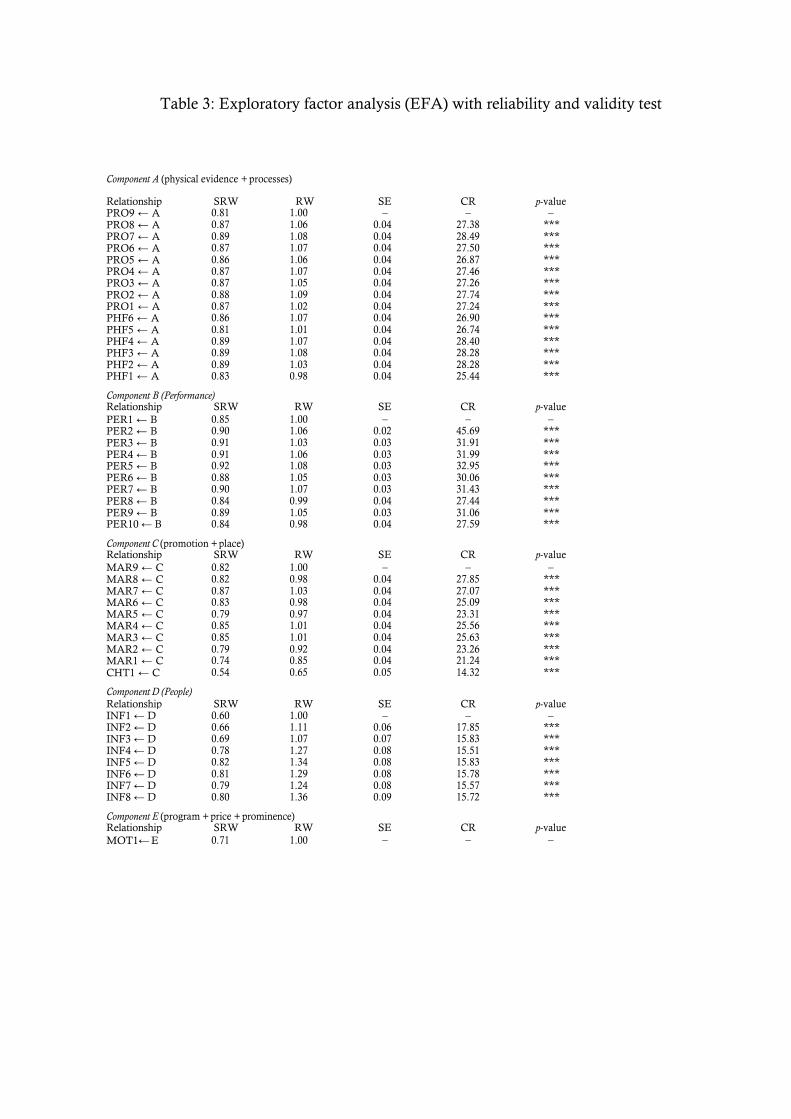
Table 3: Exploratory factor analysis (EFA) with reliability and validity test
Component A (physical evidence + processes)
Relationship PRO9 ← A
SRW 0.81
RW 1.00
SE –
CR –
p-value –
PRO8 ← A 0.87 1.06 0.04 27.38 *** PRO7 ← A 0.89 1.08 0.04 28.49 *** PRO6 ← A 0.87 1.07 0.04 27.50 *** PRO5 ← A 0.86 1.06 0.04 26.87 *** PRO4 ← A 0.87 1.07 0.04 27.46 *** PRO3 ← A 0.87 1.05 0.04 27.26 *** PRO2 ← A 0.88 1.09 0.04 27.74 *** PRO1 ← A 0.87 1.02 0.04 27.24 *** PHF6 ← A 0.86 1.07 0.04 26.90 *** PHF5 ← A 0.81 1.01 0.04 26.74 *** PHF4 ← A 0.89 1.07 0.04 28.40 *** PHF3 ← A 0.89 1.08 0.04 28.28 *** PHF2 ← A 0.89 1.03 0.04 28.28 *** PHF1 ← A 0.83 0.98 0.04 25.44 ***
Component B (Performance) Relationship SRW RW SE CR p-value
PER1 ← B 0.85 1.00 – – – PER2 ← B 0.90 1.06 0.02 45.69 *** PER3 ← B 0.91 1.03 0.03 31.91 *** PER4 ← B 0.91 1.06 0.03 31.99 *** PER5 ← B 0.92 1.08 0.03 32.95 *** PER6 ← B 0.88 1.05 0.03 30.06 *** PER7 ← B 0.90 1.07 0.03 31.43 *** PER8 ← B 0.84 0.99 0.04 27.44 *** PER9 ← B 0.89 1.05 0.03 31.06 *** PER10 ← B 0.84 0.98 0.04 27.59 ***
Component C (promotion + place) Relationship SRW RW SE CR p-value
MAR9 ← C 0.82 1.00 – – – MAR8 ← C 0.82 0.98 0.04 27.85 *** MAR7 ← C 0.87 1.03 0.04 27.07 *** MAR6 ← C 0.83 0.98 0.04 25.09 *** MAR5 ← C 0.79 0.97 0.04 23.31 *** MAR4 ← C 0.85 1.01 0.04 25.56 *** MAR3 ← C 0.85 1.01 0.04 25.63 *** MAR2 ← C 0.79 0.92 0.04 23.26 *** MAR1 ← C 0.74 0.85 0.04 21.24 *** CHT1 ← C 0.54 0.65 0.05 14.32 ***
Component D (People)
Relationship SRW RW SE CR p-value INF1 ← D 0.60 1.00 – – – INF2 ← D 0.66 1.11 0.06 17.85 *** INF3 ← D 0.69 1.07 0.07 15.83 *** INF4 ← D 0.78 1.27 0.08 15.51 *** INF5 ← D 0.82 1.34 0.08 15.83 *** INF6 ← D 0.81 1.29 0.08 15.78 *** INF7 ← D 0.79 1.24 0.08 15.57 *** INF8 ← D 0.80 1.36 0.09 15.72 ***
Component E (program + price + prominence) Relationship SRW RW SE CR p-value
MOT1← E 0.71 1.00 – – –
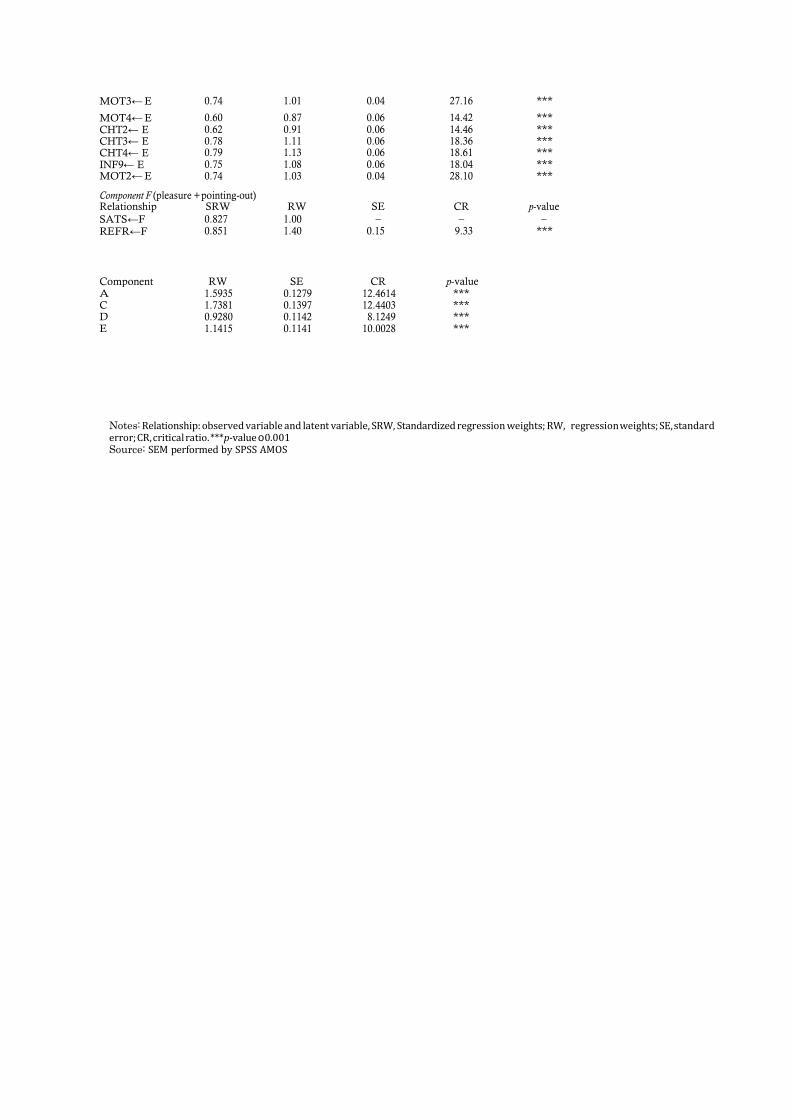
Notes: Relationship: observed variable and latent variable, SRW, Standardized regression weights; RW, regression weights; SE, standard error; CR, critical ratio. ***p-value o 0.001 Source: SEM performed by SPSS AMOS
MOT3← E 0.74 1.01 0.04 27.16 ***
MOT4← E 0.60 0.87 0.06 14.42 *** CHT2← E 0.62 0.91 0.06 14.46 *** CHT3← E 0.78 1.11 0.06 18.36 *** CHT4← E 0.79 1.13 0.06 18.61 *** INF9← E 0.75 1.08 0.06 18.04 *** MOT2← E 0.74 1.03 0.04 28.10 ***
Component F (pleasure + pointing-out) Relationship SRW RW SE CR p-value
SATS←F 0.827 1.00 – – –
REFR←F 0.851 1.40 0.15 9.33 ***
Component RW SE CR p-value
A 1.5935 0.1279 12.4614 *** C 1.7381 0.1397 12.4403 *** D 0.9280 0.1142 8.1249 *** E 1.1415 0.1141 10.0028 ***
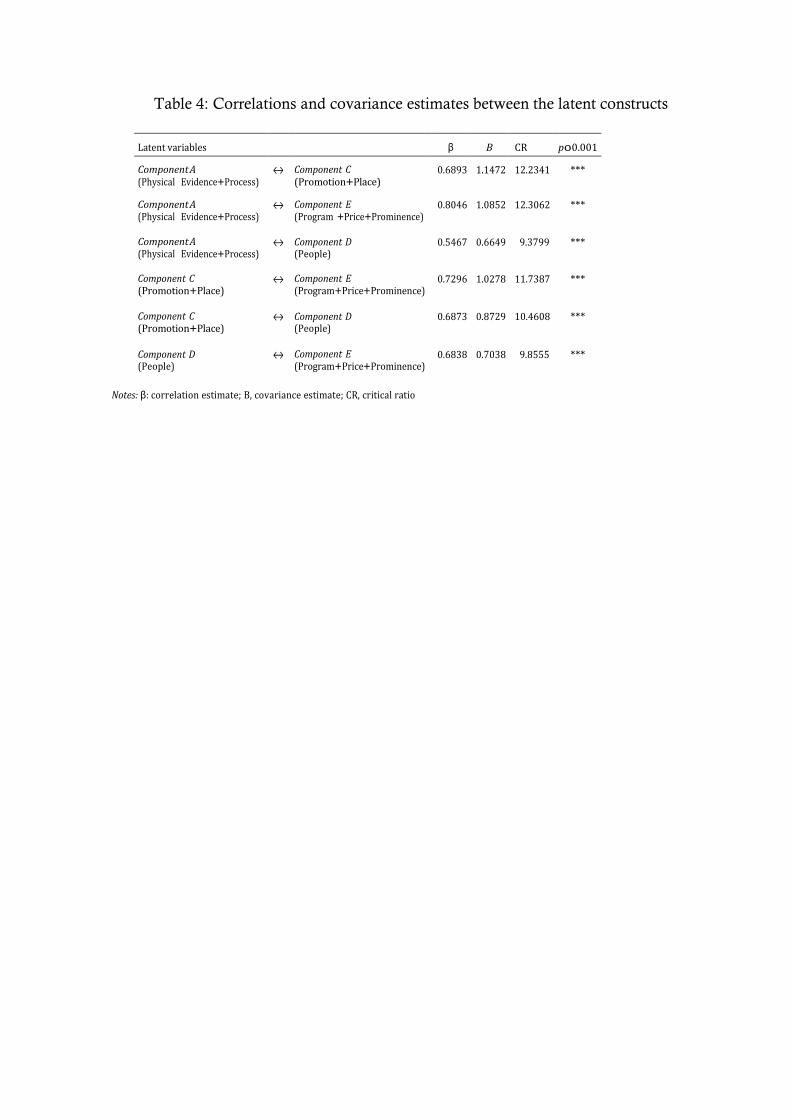
Table 4: Correlations and covariance estimates between the latent constructs
Latent variables β B CR p o 0.001
Component A (Physical Evidence+Process)
↔ Component C (Promotion+Place)
0.6893 1.1472 12.2341 ***
Component A (Physical Evidence+Process)
↔ Component E (Program +Price+Prominence)
0.8046 1.0852 12.3062 ***
Component A (Physical Evidence+Process)
↔ Component D (People)
0.5467 0.6649 9.3799 ***
Component C (Promotion+Place)
↔ Component E (Program+Price+Prominence)
0.7296 1.0278 11.7387 ***
Component C (Promotion+Place)
↔ Component D (People)
0.6873 0.8729 10.4608 ***
Component D (People)
↔ Component E (Program+Price+Prominence)
0.6838 0.7038 9.8555 ***
Notes: β: correlation estimate; B, covariance estimate; CR, critical ratio
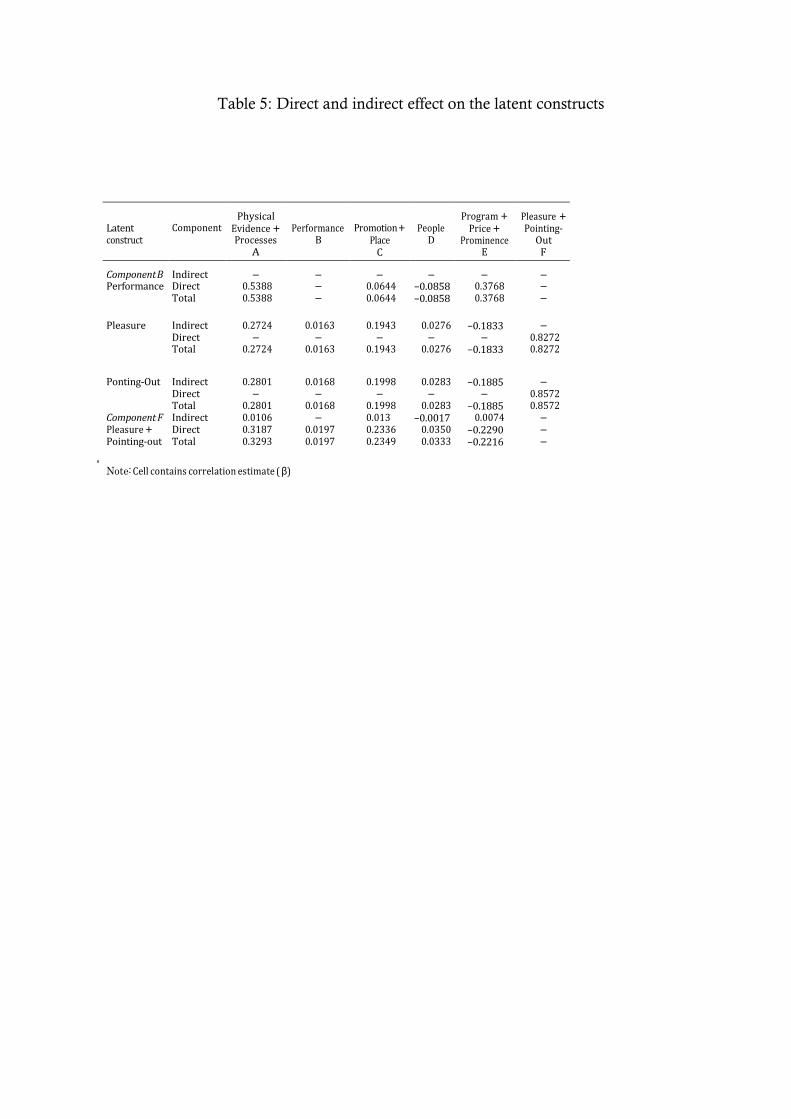
Table 5: Direct and indirect effect on the latent constructs
Latent construct
Component Physical
Evidence + Processes
A
Performance B
Promotion + Place
C
People D
Program + Price +
Prominence E
Pleasure + Pointing-
Out F
Component B Indirect – – – – – – Performance Direct 0.5388 – 0.0644 −0.0858 0.3768 – Total 0.5388 – 0.0644 −0.0858 0.3768 –
Pleasure Indirect 0.2724 0.0163 0.1943 0.0276 −0.1833 – Direct – – – – – 0.8272 Total 0.2724 0.0163 0.1943 0.0276 −0.1833 0.8272
Ponting-Out Indirect 0.2801 0.0168 0.1998 0.0283 −0.1885 – Direct – – – – – 0.8572 Total 0.2801 0.0168 0.1998 0.0283 −0.1885 0.8572 Component F Indirect 0.0106 – 0.013 −0.0017 0.0074 – Pleasure + Direct 0.3187 0.0197 0.2336 0.0350 −0.2290 – Pointing-out Total 0.3293 0.0197 0.2349 0.0333 −0.2216 –
Note: Cell contains correlation estimate (β)
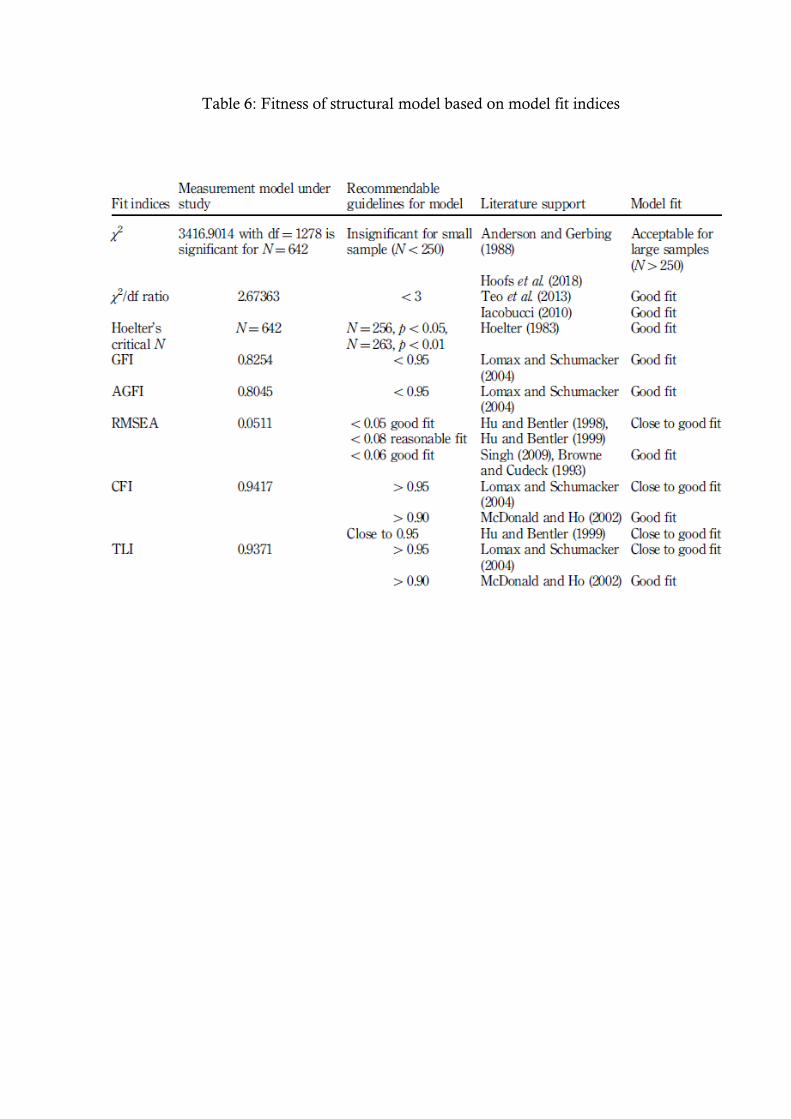
Table 6: Fitness of structural model based on model fit indices
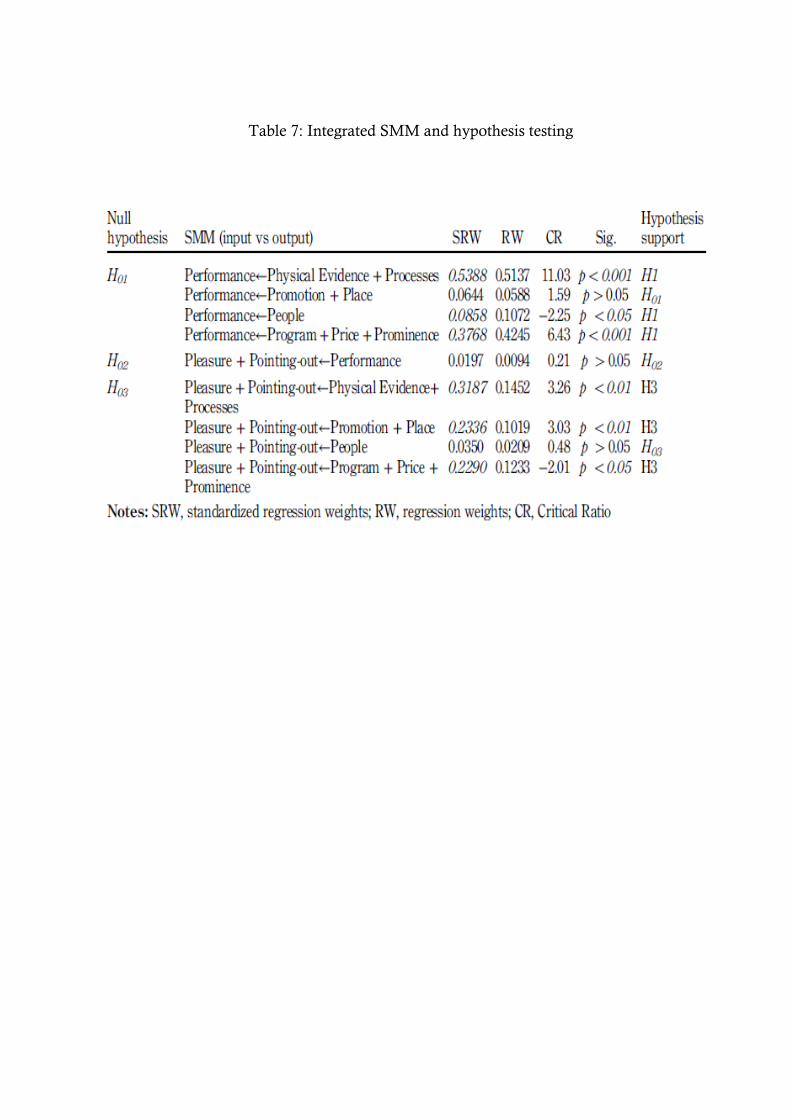
Table 7: Integrated SMM and hypothesis testing
References
Abdul Rahman, M. and Unnikrishnan, R. (2015), “Scope and challenges of technical education”, Higher
Education for the Future, Vol. 2 No. 2, pp. 194-207, available at: https://doi.org/10.1177/
2347798915584117
Abdullah, A.M. and Saeid, M. (2016), “Factors affecting students’ choice for MBA program in Kuwait
Universities”, International Journal of Business and Management, Vol. 11 No. 3, pp. 119-128.
Abdullah, F. (2006), “Measuring service quality in higher education: HEdPERF versus SERVPERF”,
Marketing Intelligence & Planning, Vol. 24 No. 1, pp. 31-47.
Agarwal, P. (2006), “Higher education in India: the need for change (No. 180)”, working paper.
Agarwala, T. (2008), “Factors influencing career choice of management students in India”, Career
Development International, Vol. 13 No. 4, pp. 362-376, available at: https://doi.org/10.1108/
13620430810880844
Ahier, J. (2000), “Financing higher education by loans and fees: theorizing and researching the private
effects of a public policy”, Journal of Education Policy, Vol. 15 No. 6, pp. 683-700.
AICTE (1987), The All India Council for Technical Education: Act 1987. AICTE, New Delhi, available at:
http://www.aicte-india.org/downloads/aicteact.pdf
AICTE, New Delhi (2018), “AICTE dashboard”, All India Council for Technical Education, New Delhi,
available at: www.aicte-india.org/dashboard/pages/graphs.php (accessed December 7, 2018).
Alves, H. and Raposo, M. (2007), “Conceptual model of student satisfaction in higher education”, Total
Quality Management and Business Excellence, Vol. 18 No. 5, pp. 571-588, available at:
https://doi.org/10.1080/14783360601074315
Anderson, J.C. and Gerbing, D.W. (1988), “Structural equation modeling in practice: a review and
recommended two-step approach”, Psychological Bulletin, Vol. 103 No. 3, p. 411.
Annamdevula, S. and Bellamkonda, R.S. (2016a), “Effect of student perceived service quality on
student satisfaction, loyalty and motivation in Indian universities: development of HiEduQual”,
Journal of Modelling in Management, Vol. 11 No. 2, pp. 488-517.
Annamdevula, S. and Bellamkonda, R.S. (2016b), “The effects of service quality on student loyalty: the
mediating role of student satisfaction”, Journal of Modelling in Management, Vol. 11 No. 2,
pp. 446-462, available at: https://doi.org/10.1108/JM2-04-2014-0031
Armstrong, J.J. and Lumsden, D.B. (2000), “Impact of universities’ promotional materials on college
choice”, Journal of Marketing for Higher Education, Vol. 9 No. 2, pp. 83-91,
available at: https://doi.org/10.1300/J050v09n02
Ary, D., Jacobs, L.C., Sorensen, C.K. and Walker., D.A. (2010), Introduction to Research in Education,
8th ed., Cengage Learning, Wadsworth.
Assembly, M.L. (2015), “The Maharashtra Unaided Private Professional Educational Institutions
(Regulation of Admissions and Fees).
Athiyaman, A. (1997), “Linking student satisfaction and service quality perceptions: the case of
university education”, European Journal of Marketing, Vol. 31 No. 7, pp. 528-540,
available at: https://doi.org/10.1108/03090569710176655
Barich, H. and Kotler, P. (1991), “A framework for marketing image management”, MIT Sloan
Management Review, Vol. 32 No. 2, pp. 94-104.
Baxter, R., Hastings, N., Law, A. and Glass, E.J. (2008), A Beginer’s Guide to Structural Equation
Modelling. Animal Genetics, Vol. 39, Lawrence Erlbaum Associates Publishers, NJ and London.
Beckwith, H. (2001),The InvisibleTouch:The Four Keys toModernMarketing, Texere Publishing, Hachette.
Beder, S. (2009), “Towards a more representative engineering education”, Engineering Education, Vol. 5
No. 2, pp. 1-14.
Bennett, P.D. (1995), AMA Dictionary of Marketing Terms, NTC Publishing Group, Lincolnwood, IL.
Berry, L.L. (1995), On Great Service: A Framework for Action, Simon and Schuster, New York, NY.
Bhatia, C.M. and Bhatia, S. (2008), “An integrated approach for restructuring higher technical
education”, Global Journal of Flexible Systems Management, Vol. 9 Nos 2–3, pp. 61-70.
Blom, A. and Cheong, J. (2010), in Blom, A. and Cheong, J. (Eds), Governance of Technical Education in
India: Key Issues, Principles, and Case Studies, The World Bank, Washington, DC, p. 85,
available at: https://books.google.com/books?hl=en&lr=&id=Vc8QCaV_V9sC&pgis=1
Blom, A. and Saeki, H. (2011), Employability and Skill Set of Newly Graduated Engineers in India, The
World Bank, Washington, DC.
Blythe, J. (2008), Essentials of Marketing, Pearson Education, Harlow.
Bollen, K.A. and Long, J.S. (1992), “Tests for structural equation models: introduction”, Sociological
Methods & Research, Vol. 21 No. 2, pp. 123-131, available at: https://doi.org/10.1177/
0049124192021002001
Booms, B.H. and Bitner, M.J. (1981), “Marketing strategies and organisation structures for service
firms”, in Donnelly, J. and George, W.R. (Eds), Marketing of Services, American Marketing
Association, Chicago.
Borden, N.H. (1964), “The concept of the marketing mix”, Journal of Advertising Research, Vol. 4 No. 2,
pp. 2-7.
Borrego, M., Douglas, E. and Amelink, C. (2009), “Quantitative, qualitative, and mixed research
methods in engineering education”, Journal of Engineering Education, Vol. 98 No. 1, pp. 55-66,
available at: https://doi.org/10.1002/j.2168-9830.2009.tb01005.x
Borrego, M., Knight, D.B., Gibbs, K. and Crede, E. (2018), “Pursuing graduate study: factors underlying
undergraduate engineering students’ decisions”, Journal of Engineering Education, Vol. 107
No. 1, pp. 140-163, available at: https://doi.org/10.1002/jee.20185
Brassington, F. and Pettitt, S. (2006), Principles of Marketing, Prentice Hall, Harlow.
Bridgstock, R. (2009), “The graduate attributes we’ve overlooked: enhancing graduate employability
through career management skills”, Higher Education Research and Development, Vol. 28 No. 1,
pp. 31-44, available at: https://doi.org/10.1080/07294360802444347
Briggs, S. (2006), “An exploratory study of the factors influencing undergraduate student choice: the
case of higher education in Scotland”, Studies in Higher Education, Vol. 31 No. 6, pp. 705-722,
available at: https://doi.org/10.1080/03075070601004333
Bringle, R.G. and Hatcher, J.A. (2000), “Institutionalization of service learning in higher education”, The
Journal of Higher Education, Vol. 71 No. 3, pp. 273-290.
Browne, M.W. and Cudeck, R. (1993), “Alternative ways of assessing model fit”, Sage Focus Editions,
Vol. 154, p. 136.
Bruce, G. and Edgington, R. (2008), “Factors influencing word-of-mouth recommendations by MBA
students: an examination of school quality, educational outcomes, and value of the MBA”,
Journal of Marketing for Higher Education, Vol. 16 No. 1, pp. 79-101, available at:
https://doi.org/10.1080/08841240802100303
Bugandwa Mungu Akonkwa, D. (2009), “Is market orientation a relevant strategy for higher education
institutions?”, International Journal of Quality and Service Sciences, Vol. 1 No. 3, pp. 311-333,
available at: https://doi.org/10.1108/17566690911004230
Burli, S., Bagodi, V. and Kotturshettar, B. (2012), “TQM dimensions and their interrelationships in ISO
certified engineering institutes of India”, Benchmarking: An International Journal, Vol. 19 No. 2,
pp. 177-192, available at: https://doi.org/10.1108/14635771211224527
Burrell, D. and Grizzell, B. (2008), “Competitive marketing & planning strategy in higher education”,
Academic Leadership: The Online Journal, Vol. 6 No. 1, available at: www.researchgate.net/
profile/Megan_Mccall-Schroeder/publication/235687285_Reconsidering_Grade_Inflation_in_
Higher_Education/links/54ecbeaf0cf28f3e6534bd5c.pdf
Burton, L. (1969), “Education and development”, British Journal of Educational Studies, Vol. 48 No. 1,
pp. 1-9, available at: https://doi.org/10.1007/sl0649-006-9057-x
Capstick, S., Green, J.A. and Beresford, R. (2007), “Choosing a course of study and career in pharmacy –
student attitudes and intentions across three years at a New Zealand school of pharmacy”,
Pharmacy Education, Vol. 7 No. 4, pp. 359-373, available at: https://doi.org/10.1080/
15602210701673811
Carter, R.E. (2009), “The impact of perceived service quality on MBA student satisfaction and
recommendations: do expectations matter?”, Services Marketing Quarterly, Vol. 30 No. 3,
pp. 234-248, available at: https://doi.org/10.1080/15332960902993494
Casidy, R. (2014), “Linking brand orientation with service quality, satisfaction, and positive Word-of-
Mouth: evidence from the higher education sector”, Journal of Nonprofit and Public Sector
Marketing, Vol. 26 No. 2, pp. 142-161, available at: https://doi.org/10.1080/10495142.2014.901004
Cavas, B., Cakiroglu, J., Cavas, P. and Ertepinar, H. (2011), “Turkish students career choices in
engineering: experiences from Turkey”, Science Education International, Vol. 22 No. 4, pp. 274-281.
Cengiz, E. and Yayla, H.E. (2007), “The effect of marketing mix on positive word of mouth
communication: evidence from accounting offices in Turkey”, Innovative Marketing, Vol. 3 No. 4,
pp. 73-86.
Census Commissioner of India (2011), “Census of India (2011)”, available at: http://censusindia.gov.in/
(accessed December 7, 2018).
Cerinsek, G., Hribar, T., Glodez, N. and Dolinsek, S. (2013), “Which are my future career priorities and
what influenced my choice of studying science, technology, engineering or mathematics? Some
insights on educational choice-case of Slovenia”, International Journal of Science Education,
Vol. 35 No. 17, pp. 2999-3025, available at: https://doi.org/10.1080/09500693.2012.681813
Cerny, B.A. and Kaiser, Henry, F. (1977), “A study of a measure of sampling adequacy for factoranalytic
correlation matrices”, Multivariate Behavioral Research, Vol. 12 No. 1, pp. 43-47,
available at: https://doi.org/10.1207/s15327906mbr1201
Chapman, D. (1981), “A model of student college choice”, The Journal of Higher Education, Vol. 52 No. 5,
pp. 490-505, available at: https://doi.org/10.2307/1981837
Chauhan, K. and Pillai, A. (2013), “Role of content strategy in social media brand communities: a case of
higher education institutes in India”, Journal of Product & Brand Management, Vol. 22 No. 1,
pp. 40-51, available at: https://doi.org/10.1108/10610421311298687
Chumaidiyah, E. (2014), “The marketing mix strategy in influence to the competitive advantage”,
Proceedings of the 2014 International Conference on Industrial Engineering and Operations
Management, Vol. 7 No. 9, pp. 818-826.
CII and Wheebox (2014), “India skills report 2017”, available at: https://wheebox.com/wheebox/
resources/IndiaSkillsReport.pdf
Clayson, D.E. and Haley, D.A. (2005), “Marketing models in education: students as customers, products,
or partners”, Marketing Education Review, Vol. 15 No. 1, pp. 1-10.
Clemes, M.D., Gan, C. and Kao, T.H. (2007), “University student satisfaction: an empirical analysis”,
Journal of Marketing for Higher Education, Vol. 17 No. 2, pp. 292-325, available at: https://
doi.org/10.1080/08841240801912831
Cohen, L., Manion, L. and Morrison, K. (2011), “Planning educational research”, Research Methods in
Education, Routledge, New York, NY, available at: https://doi.org/10.1111/j.1467-8527.2007.00
388_4.x
Constantinides, E. (2006), “The marketing mix revisited: towards the 21st century marketing”, Journal
of Marketing Management, Vol. 22 Nos 3–4, pp. 407-438, available at: https://doi.org/
10.1362/026725706776861190
Creswell, J.W. (2012a), Collecting Qualitative Data. Educational Research: Planning, Conducting, and
Evaluating Quantitative and Qualitative Research, 4th ed., Pearson, Boston, pp. 204-35.
Creswell, J.W. (2012b), “The process of conducting research using quantitative and qualitative
approaches”, in Creswell, J.W. (Ed.), Educational Research., 4th ed., Pearson, Boston, pp. 15-70.
Churchill, G.A. Jr (1979), “A paradigm for developing better measures of marketing constructs”, Journal
of Marketing Research, Vol. 16 No. 1, pp. 64-73.
Dacre Pool, L. and Sewell, P. (2007), “The key to employability: developing a practical model of
graduate employability”, Education + Training, Vol. 49 No. 4, pp. 277-289, available at: https://
doi.org/10.1108/00400910710754435
Das, P. and Mukherjee, S. (2017), “Improvement in higher education quality of the North-East
University of India”, Total Quality Management and Business Excellence, Vol. 28 Nos 7–8,
pp. 765-781, available at: https://doi.org/10.1080/14783363.2015.1123614
Dawes, P.L. and Brown, J. (2002), “Determinants of awareness, consideration, and choice set size in
university choice”, Journal of Marketing for Higher Education, Vol. 12 No. 1, pp. 49-75,
available at: https://doi.org/10.1300/J050v12n01
de Castro, B.V. and de Guzman, A.B. (2014), “A structural equation model of the factors affecting
Filipino university students’ shadow education satisfaction and behavioural intentions”, Asia
Pacific Journal of Education, Vol. 34 No. 4, pp. 417-435, available at: https://doi.org/
10.1080/02188791.2014.960797
Deshmukh, S.G. (2006), “Some perspectives on total quality management (TQM) in technical institutes”,
Journal of Engineering Education Transformations, Vol. 19 Nos 3-4, pp. 44-59.
Directorate of Technical Education, M.S. (2018), “DTE Maharashtra State (India)”, available at: www.
dtemaharashtra.gov.in/index.html (accessed January 16, 2019).
Elliott, K.M. and Healy, M.A. (2001), “Key factors influencing student satisfaction related to recruitment
and retention”, Journal of Marketing for Higher Education, Vol. 10 No. 4, pp. 1-11.
Elsharnouby, T.H. (2015), “Student co-creation behavior in higher education: the role of satisfaction
with the university experience”, Journal of Marketing for Higher Education, Vol. 25 No. 2,
pp. 238-262, available at: https://doi.org/10.1080/08841241.2015.1059919
Enache, I.-C. (2011), “Marketing higher education using the 7 Ps Framework”, Bulletin of the
Transilvania University of Brasov. Series V: Economic Sciences, Vol. 4 No. 1, pp. 23-30,
available at: http://search.ebscohost.com/login.aspx?direct=true&db=bth&AN=66180380&
lang=fr&site=ehost-live
Finch, D.J., Hamilton, L.K., Baldwin, R. and Zehner, M. (2013), “An exploratory study of factors
affecting undergraduate employability”, Education + Training, Vol. 55 No. 7, pp. 681-704,
available at: https://doi.org/10.1108/ET-07-2012-0077
Fisk, R.P., Brown, S.W. and Bitner, M.J. (1993), “Tracking the evolution of the services marketing
literature”, Journal of Retailing, Vol. 69 No. 1, pp. 61-103.
Floyd, F. and Widaman, F. (1995), “Factor analysis in the development and refinement of clinical
assessment instruments”, Psychological Assessment, Vol. 7 No. 3, pp. 286-299,
available at: https://doi.org/10.1037/1040-3590.7.3.286
Gajic, J. (2012), “Importance of marketing mix in higher education institutions”, Singidunum Journal of
Applied Sciences, Vol. 9 No. 1, pp. 29-41, available at: https://doi.org/10.5937/sjas1201029G
Gambhir, V., Wadhwa, N.C. and Grover, S. (2016), “Quality concerns in technical education in India a
quantifiable quality enabled model”, Quality Assurance in Education, Vol. 24 No. 1, pp. 2-25,
available at: https://doi.org/10.1108/QAE-07-2011-0040
Gibbs, P. and Knapp, M. (2012), Marketing Higher and Further Education: An Educator’s Guide to
Promoting Courses, Departments and Institutions, Routledge, London.
Goel, V.P. and Vijay, P. (2011), Technical and Vocational Education and Training (TVET) System in
India for Sustainable Development, UNEVOC, Bonn.
Gokuladas, V.K. (2010), “Technical and non-technical education and the employability of engineering
graduates: an Indian case study”, International Journal of Training and Development, Vol. 14
No. 2, pp. 130-143, available at: https://doi.org/10.1111/j.1468-2419.2010.00346.x
Government of India (2017), “Direct benefit transfer”, available at: https://dbtbharat.gov.in/dbtcell/
statelist (accessed January 15, 2019).
Green, T. (2016), “A methodological review of structural equation modelling in higher education
research”, Studies in Higher Education, Vol. 41 No. 12, pp. 2125-2155, available at:
https://doi.org/10.1080/03075079.2015.1021670
Greenacre, L., Freeman, L., Cong, K. and Chapman, T. (2014), “Understanding and predicting student
Word of Mouth”, International Journal of Educational Research, Vol. 64, pp. 40-48.
Gronroos, C. (1989), “Defining marketing: a market-oriented approach”, European Journal of Marketing,
Vol. 23 No. 1, pp. 52-60, available at: https://doi.org/10.1108/EUM0000000000541
Gronroos, C. (1994), “From marketing mix to relationship marketing: towards a paradigm shift in
marketing”, Asia-Australia Marketing Journal, Vol. 2 No. 1, pp. 9-29, available at:
https://doi.org/10.1016/S1320-1646(94)70275-6
Grove, S.J., Fisk, R.P. and John, J. (2000), “Services as theater. Guidelines and implications”, Handbook
of Services Marketing and Management, Sage Publications, Thousand Oaks, pp. 21-35.
Guay, F., Morin, A.J.S., Litalien, D., Valois, P. and Vallerand, R.J. (2015), “Application of exploratory
structural equation modeling to evaluate the academic motivation scale”, Journal of
Experimental Education, Vol. 83 No. 1, pp. 51-82, available at: https://doi.org/
10.1080/00220973.2013.876231
Gupta, A. (2011), “Innovations in higher technical education in India: a status report”, MIER Journal of
Educational Studies, Trends & Practices, Vol. 1 No. 1, pp. 1-11.
Hackl, P. and Westlund, A.H. (2000), “On structural equation modelling for customer satisfaction
measurement”, Total Quality Management, Vol. 11 Nos 4-6, pp. 820-825, available at: https://
doi.org/10.1080/09544120050008264
Hair, J.F., Ringle, C.M. and Sarstedt, M. (2011), “PLS-SEM: indeed a silver bullet”, The Journal of
Marketing Theory and Practice, Vol. 19 No. 2, pp. 139-152, available at: https://
doi.org/10.2753/MTP1069-6679190202
Hamid, A. and Noor, M. (2013), “How the value of higher education is perceived by students and alumni:
the case of the Masters of Business Administration (MBA)”, PhD thesis, University of Leeds.
Han, P. (2014), “A literature review on college choice and marketing strategies for recruitment”, Family
and Consumer Sciences Research Journal, Vol. 43 No. 2, pp. 120-130, available at: https://
doi.org/10.1111/fcsr.12091
Hanaysha, J.R., Abdullah, H.H. and Warokka, A. (2011), “Service quality and students’ satisfaction at
higher learning institutions: The competing dimensions of Malaysian universities’
competitiveness”, The Journal of Southeast Asian Research, Vol. 2011, pp. 1-10.
Hannagan, T. (1992), Marketing for the Non-profit Sector, Vol. 1, Macmillan Press Ltd, London.
Harper, S. and Quaye, S. (2009), Student Engagement in Higher Education: Theoretical Perspectives and
Practical Approaches for Diverse Populations, Routledge, New York, NY.
Harris, M.S. (2009), “Message in a bottle: university advertising during bowl games”, Innovative Higher
Education, Vol. 33 No. 5, pp. 285-296.
Hartman, D.E. and Schmidt, S.L. (1995), “Understanding student/alumni satisfaction from a consumer’s
perspective: the effects of institutional performance and program outcomes”, Research in Higher
Education, Vol. 36 No. 2, pp. 197-217, available at: https://doi.org/10.18293/SEKE2017-085
Harvey, L. (2000), “An employability performance indicator”, Perspectives: Policy and Practice in Higher
Education, Vol. 4 No. 4, pp. 105-109, available at: https://doi.org/10.1080/13603100050145173
Hayes, J.J. (2014), “Increasing enrollment: evaluating college-choice factors at a Midwest Christian
University”, Ed.D. dissertations, p. 70, available at: http://digitalcommons.olivet.edu/edd_diss
(accessed January 7, 2019).
Helgesen, Ø. and Nesset, E. (2007), “What accounts for students’ loyalty? Some field study evidence”,
International Journal of Educational Management, Vol. 21 No. 2, pp. 126-143,
available at: https://doi.org/10.1108/09513540710729926
Helmsley-Brown, J. and Foskett, N.H. (2001), Choosing Futures: Young People’s Decision-making in
Education, Training and Careers Markets, RoutledgeFalmer, London.
Hiransomboon, K. (2012), “Marketing mix affecting accommodation service buying decisions of
backpacker tourist traveling at Inner Rattanakosin Island in Bangkok, Thailand”, Procedia
Economics and Finance, Vol. 3, pp. 276-283.
Ho, H. and Hung, C. (2008), “Marketing mix formulation for higher education: an integrated analysis
employing analytical hierarchy process, cluster analysis and correspondence analysis”,
International Journal of Educational Management, Vol. 22 No. 4, pp. 328-340,
available at: https://doi.org/10.1108/09513540810875662
Ho, R. (2014), Multivariate Data Analysis with IBM SPSS, CRC Press, Taylor & Francis Group,
New York, NY.
Hoelter, J.W. (1983), “The analysis of covariance structures: goodness-of-fit indices”, Sociological
Methods & Research, Vol. 11 No. 3, pp. 325-344, available at: https://doi.org/10.1177/
0049124183011003003
Hoofs, H., van de Schoot, R., Jansen, N.W.H. and Kant, I. (2018), “Evaluating model fit in Bayesian
confirmatory factor analysis with large samples: simulation study introducing the BRMSEA”,
Educational and Psychological Measurement, Vol. 78 No. 4, pp. 537-568, available at:
https://doi.org/10.1177/0013164417709314
Hossler, D. (1999), “Effective admissions recruitment”, New Directions for Higher Education, Vol. 108,
pp. 15-30.
Hossler, D. and Gallagher, K.S. (1987), “Studying student college choice: a three-phase model and the
implications for policymakers”, College and University, Vol. 62 No. 3, pp. 207-21.
Hu, L.-T. and P.M. Bentler (1998), “Fit indices in covariance structure modeling: sensitivity to
underparameterized model misspecification”, Psychological Methods, Vol. 3 No. 4, pp. 424-453.
Hu, L.T. and Bentler, P.M. (1999), “Cutoff criteria for fit indexes in covariance structure analysis:
conventional criteria versus new alternatives”, Structural Equation Modeling, Vol. 6 No. 1,
pp. 1-55, available at: https://doi.org/10.1080/10705519909540118
Iacobucci, D. (2010), “Structural equations modeling: fit Indices, sample size, and advanced topics”,
Journal of Consumer Psychology, Vol. 20 No. 1, pp. 90-98, available at: https://doi.org/
10.1016/j.jcps.2009.09.003
Ivy, J. (2008), “A new higher education marketing mix: the 7Ps for MBA marketing”, International
Journal of Educational Management, Vol. 22 No. 4, pp. 288-299, available at: https://doi.org/
10.1108/09513540810875635
Ivy, J. and Naudé, P. (2004), “Succeeding in the MBA marketplace: identifying the underlying factors”,
Journal of Higher Education Policy and Management, Vol. 26 No. 3, pp. 401-417,
available at: https://doi.org/10.1080/1360080042000290249
Jagadeesh, R. (2000), “Assuring quality in management education: the Indian context”, Quality
Assurance in Education, Vol. 8 No. 3, pp. 110-119, available at: https://doi.org/
10.1108/09684880010372707
Jain, R., Sahney, S. and Sinha, G. (2013), “Developing a scale to measure students’ perception of service
quality in the Indian context”, The TQM Journal, Vol. 25 No. 3, pp. 276-294,
available at: https://doi.org/10.1108/17542731311307456
James, R., Baldwin, G. and McInnis, C. (1999), Which University?: The Factors Influencing the Choices of
Prospective Undergraduates, Vol. 99 No. 3, Department of Education, Training and Youth
Affairs, Canberra.
Jamjoom, Y. (2012), “Understanding private higher education in saudi arabia-emergence, development
and perceptions”, PhD diss., Institute of Education (University of London).
Jones, B.D., Paretti, M.C., Hein, S.F. and Knott, T.W. (2010), “An analysis of motivation constructs with
first-year engineering students: relationships among expectancies, values, achievement, and
career plans”, Journal of Engineering Education, Vol. 99 No. 4, pp. 319-336,
available at: https://doi.org/10.1002/j.2168-9830.2010.tb01066.x
Kamath, U. and Sheena (2015), “Implication of branding initiatives in engineering colleges -an empirical
study”, IOSR Journal of Business and Management, Vol. 17 No. 11, pp. 4-11,
available at: https://doi.org/10.9790/487X-171110411
Kamokoty, J., Sohani, N. and Sohani, N. (2015), “Determinants of service quality in education: service
provider’ s perspective and academician’s perspective”, International Journal of Services and
Operations Management, Vol. 20 No. 2, pp. 141-164.
Kaplan, D. (2008), Structural Equation Modeling: Foundations and Extensions, Vol. 10, Sage Publications.
Kaplinsky, R. and Morris, M. (2000), A Handbook for Value Chain Research, Vol. 113, University of
Sussex, Institute of Development Studies.
Khanna, M., Jacob, I. and Yadav, N. (2014), “Identifying and analyzing touchpoints for building a
higher education brand”, Journal of Marketing for Higher Education, Vol. 24 No. 1, pp. 122-143,
available at: https://doi.org/10.1080/08841241.2014.920460
Kinzie, J., Palmer, M., Hayek, J., Hossler, D., Jacob, S.A. and Cummings, H. (2004), “Fifty years of college
choice: acknowledgments”, Lumina Foundation for Education: New Agenda Series, Vol. 5 No. 3,
pp. 1-66, available at: https://folio.iupui.edu/bitstream/handle/10244/263/Hossler.pdf?
sequence=1%5Cnhttps://folio.iupui.edu/handle/10244/263
Kolb, B. (2008), Marketing Research for Non-profit, Community and Creative Organizations, Routledge.
Kotler, P. (1972), “Concept of marketing”, Journal of Marketing, Vol. 36 No. 2, pp. 46-54,
available at: https://doi.org/10.1007/978-3-642-04508-0_5
Kotler, P. (1976), “Applying marketing theory to college admissions”, A Role for Marketing in College
Admissions, pp. 54-72.
Kotler, P. (1999), How to Create, Win and Dominate Markets, A Division of Simon & Schuster,
New York, NY
Kotler, P. (2000), Marketing Management, Millennium edition, Vol. 23 No. 6, pp. 188-193, available at:
https://doi.org/10.1016/0024-6301(90)90145-T
Kotler, P. (2003), Marketing Management, 11th ed., Prentice-Hall Publishers-Pearson, Upper Saddle
River, NJ, p. 472.
Kotler, P. and Armstrong, G. (2017), “Principles of marketing”, available at: https://doi.org/10.2307/1250103
Kotler, P. and Clarke, R.N. (1987), Consumer analysis. Marketing for Health Care Organizations,
England Cliffs, Prentice-Hall, NJ, pp. 256-288.
Kotler, P. and Fox, K.F.A. (1995), “Strategic marketing for educational institutions”, available at: www.
scholars.northwestern.edu/en/publications/strategic-marketing-for-educational-institutions
Kotler, P. and Keller, K.L. (2006), Marketing Management, Pearson Prentice Hall, NJ.
Kotler, P. and McDougall, G.H. (1984), Marketing Essentials, Vol. 556, Prentice-Hall, Englewood Cliffs, NJ.
Kotler, P., Hayes, T. and Bloom, P.N. (2002), Marketing Professional Services, 2nd ed., Prentice Hall.
Kotler, P., Armstrong, G., Saunders, J. and Wong, V. (2016), Principles of Marketing, 4th ed., Prentice
Hall Europe, Harlow.
Kotler, P., Keller, K.L., Brady, M., Goodman, M. and Hansen, T. (2009), Marketing Management,
Pearson Education Limited, Harlow.
Krejcie, R. and Morgan, D. (1970), “Determining sample sizes for research activities”, Educational and
Psychological Measurement, Vol. 30 No. 3, pp. 607-610, available at: https://doi.org/https://
doi.org/10.1177%2F001316447003000308
Kuh, G.D. (2009), “What student affairs professionals need to know about student engagement”,
Journal of College Student Development, Vol. 50 No. 6, pp. 683-706, available at: https://
doi.org/10.1353/csd.0.0099
Kuh, G.D. and Wallman, G.H. (1986), “Outcomes-oriented marketing”, New Directions for Higher
Education, Vol. 53, pp. 63-72.
Kushwaha, G.S. and Agrawal, S.R. (2015), “An Indian customer surrounding 7P ׳ s of service
marketing”, Journal of Retailing and Consumer Services, Vol. 22, pp. 85-95.
Lafuente-Ruiz-de-Sabando, A., Zorrilla, P. and Forcada, J. (2018), “A review of higher education image
and reputation literature: Knowledge gaps and a research agenda”, European Research on
Management and Business Economics, Vol. 24 No. 1, pp. 8-16.
Lakal, N., Joshi, K. and Jain, K. (2018), “Development of engineering education service quality model
from faculty perspective”, Total Quality Management & Business Excellence, pp. 1-12.
Lent, R.W., Brown, S.D., Schmidt, J., Brenner, B., Lyons, H. and Treistman, D. (2003), “Relation of
contextual supports and barriers to choice behavior in engineering majors: Test of alternative
social cognitive models”, Journal of Counseling Psychology, Vol. 50 No. 4, pp. 458-465,
available at: https://doi.org/10.1037/0022-0167.50.4.458
Leslie, L.L. and Brinkman, P.T. (1988), The Economic Value of Higher Education. American Council on
Education/Macmillan Series on Higher Education, Macmillan Publishing, New York, NY.
Lichtenstein, G., Loshbaugh, H., Claar, B., Chen, H., Jackson, K. and Sheppard, S. (2009), “An
engineering degree does not (necessarily) an engineer make: career decision making among
undergraduate engineering majors”, Journal of Engineering of Engineering Education, Vol. 98
No. 3, pp. 227-234, available at: https://doi.org/10.1002/j.2168-9830.2009.tb01021.x
Lim, M.W., Jee, T.W. and De Run, E.C. (2018), “Strategic brand management for higher education
institutions with graduate degree programs: empirical insights from the higher education
marketing mix”, Journal of Strategic Marketing, Routledge, July, pp. 1-21, available at:
https://doi.org/10.1080/0965254X.2018.1496131
Lomax, R.G. and Schumacker, R.E. (2004), A Beginner’s Guide to Structural Equation Modeling,
Psychology Press.
Lovelock, C.H. and Wright, L. (1999), Principles of Service Marketing and Management (International ed),
Prentice Hall, Upper Saddle River, NJ.
McCarthy, E.J. (1960), “Basic marketing: a managerial approach”, McCarthyBasic Marketing:
A Managerial Approach, Richard D. Irwin, Homewood, IL.
McDonald, R.P. and Ho, M.H.R. (2002), “Principles and practice in reporting structural equation
analyses”, Psychological Methods, Vol. 7 No. 1, pp. 64-82, available at: https://
doi.org/10.1037/1082-989X.7.1.64
McGrath, J.M. (2002), “Attitudes about marketing in higher education: an exploratory study”, Journal of
Marketing for Higher Education, Vol. 12 No. 1, pp. 1-14.
Mahajan, P. and Golahit, S. (2017a), “Only education is not enough: a necessary of all-inclusive services
for technical education”, International Journal of Advanced Research, Vol. 5 No. 1, pp. 2320-5407,
available at: https://doi.org/10.21474/IJAR01/2878
Mahajan, P.T. and Golahit, S.B. (2017b), “Are the services delivered employable? A scenario of
technical education in rural India”, International Journal of Management, Vol. 8 No. 81,
pp. 40-49, available at: http://www.iaeme.com/IJM/index.asp
Mahajan, P.T. and Golahit, S.B. (2017c), “Incorporating 11 p’s of service marketing mix and its impact on
the development of technical education”, Journal of Entrepreneurship Education, Vol. 20 No. 2.
Manatos, M.J., Sarrico, C.S. and Rosa, M.J. (2017), “The integration of quality management in higher
education institutions: a systematic literature review”, Total Quality Management & Business
Excellence, Vol. 28 Nos 1–2, pp. 159-175, available at: https://doi.org/10.1080/14783363.2015.1050180
Maringe, F. (2006), “University and course choice: implications for positioning, recruitment and
marketing”, International Journal of Educational Management, Vol. 20 No. 6, pp. 466-479,
available at: https://doi.org/10.1108/09513540610683711
Maringe, F. andGibbs, P. (2008), Marketing Higher Education: Theory and Practice,McGraw-Hill Education.
Martin, D.M. (2009), “The entrepreneurial marketing mix”, Qualitative Market Research, Vol. 12 No. 4,
pp. 391-403, available at: https://doi.org/10.1108/13522750910993310
Matusovich, H.M., Streveler, R.A. and Miller, R.L. (2010), “Why do students choose engineering? A
qualitative, longitudinal investigation of students’ motivational values”, Journal of Engineering
Education, Vol. 99 No. 4, pp. 289-303, available at: https://doi.org/10.1002/
j.2168-9830.2010.tb01064.x
Mazzarol, T. and Soutar, G.N. (2002), “‘Push-pull’ factors influencing international student destination
choice”, International Journal of Educational Management, Vol. 16 No. 2, pp. 82-90,
available at: https://doi.org/10.1108/09513540210418403
Melewar, T.C. and Saunders, J. (2000), “Global corporate visual identity systems: using an extended
marketing mix”, European Journal of Marketing, Vol. 34 Nos 5/6, pp. 538-550,
available at: https://doi.org/10.1108/03090560010321910
MHRD India (2018), “All India survey on higher education (2017–18)”, available at: http://aishe.nic.in/
aishe/viewDocument.action?documentId=245 (accessed October 24, 2018).
Mitra Debnath, R. and Shankar, R. (2012), “Improving service quality in technical education: use of
interpretive structural modeling”, Quality Assurance in Education, Vol. 20 No. 4, pp. 387-407,
available at: https://doi.org/10.1108/09684881211264019
Mourad, M. (2011), “Role of brand related factors in influencing students’ choice in Higher Education
(HE) market”, International Journal of Management in Education, Vol. 5 Nos 2/3, p. 258,
available at: https://doi.org/10.1504/IJMIE.2011.039488
Mukherjee, S. and Shivani, S. (2016), “Marketing mix influence on service brand equity and its
dimensions”, Vision, Vol. 20 No. 1, pp. 9-23, available at: https://doi.org/10.1177/
0972262916628936
Narang, R. (2012), “How do management students perceive the quality of education in public
institutions?”, Quality Assurance in Education, Vol. 20 No. 4, pp. 357-371, available at:
https://doi.org/10.1108/09684881211263993
National Research Council (2012), Improving Measurement of Productivity in Higher Education, The
National Academies Press, Washington, DC.
Neelaveni, C. and Manimaran, S. (2015), “A study on students satısfactıon based on qualıty standards
of accedıtatıon ın hıgher educatıon”, Educational Research and Reviews, Vol. 10 No. 3,
pp. 282-289, available at: https://doi.org/10.5897/ERR2014.2045
Neuman, W.L. (2014), Social Research Methods: Qualitative and Quantitative Approaches, Pearson
Education, Harlow.
Ng, E.S.W., Burke, R.J. and Fiksenbaum, L. (2008), “Career choice in management: findings from US
MBA students”, Career Development International, Vol. 13 No. 4, pp. 346-361,
available at: https://doi.org/10.1108/13620430810880835
Ng, I.C.L. and Forbes, J. (2009), “Education as service: the understanding of university experience
through the service logic”, Journal of Marketing for Higher Education, Vol. 19 No. 1, pp. 38-64,
available at: https://doi.org/10.1080/08841240902904703
Nguyen, N. and LeBlanc, G. (2001), “Image and reputation of higher education institutions in students’
retention decisions”, International Journal of Educational Management, Vol. 15 No. 6,
pp. 303-311, available at: https://doi.org/10.1108/EUM0000000005909
Nunnally, J.C. and Bernstein, I.H. (1967), Psychometric Theory, Vol. 226, McGraw-Hill, New York, NY.
Nyaribo, M., Prakash, A. and Edward, O. (2012), “Motivators of choosing a management course: a
comparative study of Kenya and India”, International Journal of Management Education, Vol. 10
No. 3, pp. 201-214, available at: https://doi.org/10.1016/j.ijme.2012.08.001
Oakland, G. (1953), “Determining sample size”, The Canadian Entomologist, Vol. 85 No. 3, pp. 108-113,
doi: 10.4039/Ent85108-3.
O’Mahony, K. and Garavan, T.N. (2012), “Implementing a quality management framework in a higher
education organisation”, Quality Assurance in Education, Vol. 20 No. 2, pp. 184-200,
available at: https://doi.org/10.1108/09684881211219767
Oldfield, B.M. and Baron, S. (2000), “Student perceptions of service quality in a UK university business
and management faculty”, Quality Assurance in education, Vol. 8 No. 2, pp. 85-95.
Pal Pandi, A., Jeyathilagar, D. and Kubendran, V. (2013), “A study of integrated total quality
management practice in engineering educational institutions”, International Journal of
Management Science and Engineering Management, Vol. 8 No. 2, pp. 117-125.
Pal Pandi, A., Paranitharan, K.P. and Jeyathilagar, D. (2018), “Implementation of IEQMS model in
engineering educational institutions–a structural equation modelling approach”, Total Quality
Management & Business Excellence, Vol. 29 No. 1-2, pp. 29-57.
Palmer, A. (2001), Principles of Services Marketing, McGraw-Hill.
Parashar, A.K. and Parashar, R. (2012), “Innovations and curriculum development for engineering
education and research in India”, Procedia-Social and Behavioral Sciences, Vol. 56,
pp. 685-690.
Parasuraman, A., Zeithaml, V.A. and Malhotra, A. (2005), “E-S-QUAL a multiple-item scale for
assessing electronic service quality”, Journal of Service Research, Vol. 7 No. 3, pp. 213-233,
available at: https://doi.org/10.1177/1094670504271156
Paswan, A.K. and Ganesh, G. (2009), “Higher education institutions: satisfaction and loyalty among
international students”, Journal of Marketing for Higher Education, Vol. 19 No. 1, pp. 65-84,
available at: https://doi.org/10.1080/08841240902904869
Paulsen, M.B. (1990), “College Choice: Understanding Student Enrollment Behavior”, ASHE-ERIC
Higher Education Report No. 6. ASHE-ERIC Higher Education Reports, The George
Washington University, Washington, DC.
Porter, M.E. (1985), Competitive Advantage: Creating and Sustaining Superior Performance, Free Press,
New York, NY.
Prasad, G. and Bhar, C. (2010), “Accreditation system for technical education programmes in India: a
critical review”, European Journal of Engineering Education, Vol. 35 No. 2, pp. 187-213,
available at: https://doi.org/10.1080/03043790903497294
Pushkar, D., Kumar, S.S. and Surenthiran, N. (2013), “Factors affecting choice of engineering colleges in
Odisha, India”, Research Journal of Management Sciences, Vol. 2 No. 4, pp. 14-20,
available at: http://www.isca.in/IJMS/Archive/v2/i4/3.ISCA-RJMS-2013-023.pdf
Quelch, J.A. and Jocz, K.E. (2008), “Milestones in marketing”, Business History Review, Vol. 82 No. 4,
pp. 827-838, available at: https://doi.org/10.1017/S0007680500063236
Rafiq, M. and Ahmed, P.K. (1995), “Using the 7Ps as a generic marketing mix: an exploratory survey of
UK and European marketing academics”, Marketing Intelligence & Planning, Vol. 13 No. 9,
pp. 4-15, available at: https://doi.org/10.1108/02634509510097793
Rani, M. (2014), “Applying to B-schools: information sources and choice factors”, Prabandhan: Indian
Journal of Management, Vol. 7 No. 6, pp. 46-57, available at: www.indianjournalofmanagement.
com/archives.html%5Cnhttp://search.ebscohost.com/login.aspx?direct=true&db=ecn&AN=
1455311&site=ehost-live
Ravindran, S.D. and Kalpana, M. (2012), “Student's expectation, perception and satisfaction towards
the management educational institutions”, Procedia Economics and Finance, Vol. 2, pp. 401-410.
Reddy, K.S., Xie, E. and Tang, Q. (2016), “Higher education, high-impact research, and world university
rankings: a case of India and comparison with China”, Pacific Science Review B: Humanities and
Social Sciences, Vol. 2 No. 1, pp. 1-21, available at: https://doi.org/10.1016/j.psrb.2016.09.004
Rennie, K.M. (1997), “Exploratory and confirmatory rotation strategies in exploratory factor analysis”,
Annual Meeting of the Southwest Educational Research Association, Austin, TX, January 23–25,
pp. 1-28, available at: http://files.eric.ed.gov/fulltext/ED406446.pdf
Rojewski, J.W. (2010), “Preparing the workforce of tomorrow: a conceptual framework for career and
technical education”, Journal of Vocational Education Research, Vol. 27 No. 1, pp. 7-35,
available at: https://doi.org/10.5328/JVER27.1.7
Rutter, R., Roper, S. and Lettice, F. (2016), “Social media interaction, the university brand and
recruitment performance”, Journal of Business Research, Vol. 69 No. 8, pp. 3096-3104.
Sahney, S., Banwet, D.K. and Karunes, S. (2004), “Conceptualizing total quality management in higher
education”, The TQM Magazine, Vol. 16 No. 2, pp. 145-159, available at: https://doi.org/
10.1108/09544780410523044
Sahu, A., Shrivastava, R. and Shrivastava, R. (2008), “Key factors affecting the effectiveness of
technical education–an Indian perspective”, Proceedings of the World Congress on Engineering,
II, pp. 2-6, available at: ftp://121.244.82.26/BENarkhede/Bhandarkar/bmblitpapers/A1.pdf
Sahu, A.R., Shrivastava, R.R. and Shrivastava, R.L. (2013a), “Critical success factors for sustainable
improvement in technical education excellence”, The TQM Journal, Vol. 25 No. 1, pp. 62-74,
available at: https://doi.org/10.1108/17542731311286432
Sahu, A.R., Shrivastava, R.R. and Shrivastava, R.L. (2013b), “Development and validation of an
instrument for measuring critical success factors (CSFs) of technical education – a TQM
approach”, International Journal of Productivity and Quality Management, Vol. 11 No. 1, p. 29,
available at: https://doi.org/10.1504/IJPQM.2013.050567
Sakthivel, P.B. (2007), “Top management commitment and overall engineering education excellence”, The
TQM Magazine, Vol. 19 No. 3, pp. 259-273, available at: https://doi.org/10.1108/09544780710745676
Sakthivel, P.B. and Raju, R. (2006), “Conceptualizing total quality management in engineering
education and developing a TQM educational excellence model”, Total Quality Management
and Business Excellence, Vol. 17 No. 7, pp. 913-934, available at: https://doi.org/
10.1080/14783360600595476
Sakthivel, P.B., Rajendran, G. and Raju, R. (2005), “TQM implementation and students’ satisfaction of
academic performance”, The TQM Magazine, Vol. 17 No. 6, pp. 573-589, available at: https://
doi.org/10.1108/09544780510627660
Sander, P., Putwain, D. and de la Fuente, J. (2014), “Using structural equation modelling to understand
predictors of undergraduate students’ academic performance”, Theory and Method in Higher
Education Research, Emerald Group Publishing Limited, pp. 219-241.
Santini, F., de, O., Ladeira, W.J., Sampaio, C.H. and da Silva Costa, G. (2017), “Student satisfaction in
higher education: a meta-analytic study”, Journal of Marketing for Higher Education, Vol. 27
No. 1, pp. 1-18, available at: https://doi.org/10.1080/08841241.2017.1311980
Saravanan, V. (2009), “Sustainable employability skills for engineering professionals”, Sustainable
Employability Skills for Engineering Professionals, Vol. 5 No. 11, pp. 1-9.
Sarma, A. and Sharma, S.P. (2014), “Impact of social sector expenditure on human resource
development”, A Look into the Education and Health Sector of Assam, Vol. 3 No. 12, pp. 18-26.
Sayeda, B., Rajendran, C. and Sai Lokachari, P. (2010), “An empirical study of total quality
management in engineering educational institutions of India”, Benchmarking: An International
Journal, Vol. 17 No. 5, pp. 728-767, available at: https://doi.org/10.1108/14635771011076461
Schreiber, J.B., Nora, A., Stage, F.K., Barlow, E.A. and King, J. (2006), “Reporting modeling analysis and
confirmatory results: equation factor review”, The Journal of Educational Research, Vol. 99 No. 6,
pp. 323-337.
Shah, M. and Widin, J. (2010), “Indigenous students’ voices: monitoring indigenous student satisfaction
and retention in a large Australian University”, Journal of Institutional Research, Vol. 15 No. 1,
pp. 28-41.
Shah, M., Roth, K. and Nair, C.S. (2010), “Improving the quality of offshore student experience: findings
of a decade in three Australian universities”, Proceedings of the Australian International
Education Conference, Sydney, October 12–15, (February 2015), 9 pages, available at: www.aiec.
idp.com/PDF/2010_Roth_Thu_1430_BGallA_Paper.pdf
Shannon, R.J. (1996), “The new promotions mix: a proposed paradigm, process, and application”,
Journal of Marketing Theory and Practice, Vol. 4 No. 1, pp. 56-68, available at: https://
doi.org/10.1080/10696679.1996.11501717
Sharma, S. and Sharma, P. (2015), “Indian higher education system: challenges and suggestions”,
Electronic Journal for Inclusive Education, Vol. 3 No. 4, pp. 1-4.
Shay, S. (2014), “Curriculum in higher education: beyond false choices”, Thinking about Higher
Education, Springer, Cham, pp. 139-155.
Sheppard, S., Gilmartin, S., Chen, H.L., Lichtenstein, G., Eris, Ö. and Lande, M. (2010), Exploring the
Engineering Student Experience: Findings from the Academic Pathways of People Learning
Engineering Survey (APPLES) (TR-10-01), Center for the Advancement for Engineering
Education, Seattle, WA.
Shukla, R. (2005), India Science Report: Science Education, Human Resources and Public Attitude
towards Science and Technology, No. 22137, East Asian Bureau of Economic Research.
Sin, C., Tavares, O. and Amaral, A. (2019), “Accepting employability as a purpose of higher
education? Academics’ perceptions and practices”, Studies in Higher Education, Vol. 44 No. 6,
pp. 920-931.
Singh, R. (2009), “Does my structural model represent the real phenomenon?: a review of the
appropriate use of Structural Equation Modelling (SEM) model fit indices”, The Marketing
Review, Vol. 9 No. 3, pp. 199-212, available at: https://doi.org/10.1362/146934709X467767
Singh, P. (2013), “Concept of branding extended to higher education: issues and challenges”, Indian
Journal of Management Science, Vol. III No. 2, pp. 100-104, available at: www.scholarshub.net/
ijms/vol3/issue2/Paper_12.pdf
Singh, R. and Khanduja, D. (2010), “Customer requirements grouping – a prerequisite for successful
implementation of TQM in Technical Education”, International Journal of Management in
Education, Vol. 4 No. 2, pp. 201-215, available at: https://doi.org/10.1504/IJMIE.2010.030876
Sirvanci, M.B. (2004), “Critical issues for TQM implementation in higher education”, The TQM
Magazine, Vol. 16 No. 6, pp. 382-386, available at: https://doi.org/10.1108/09544780410563293
Sohani, N. and Sohani, N. (2012), “Developing interpretive structural model for quality framework in
higher education: Indian Context”, Journal of Engineering, Science & Management Education,
Vol. 5 No. II, pp. 495-501.
Sojkin, B., Bartkowiak, P. and Skuza, A. (2012), “Determinants of higher education choices and student
satisfaction: the case of Poland”, Higher Education, Vol. 63 No. 5, pp. 565-581,
available at: https://doi.org/10.1007/s10734-011-9459-2
Straub, D.W. (1989), “Validating instruments in MIS research”, MIS Quarterly, Vol. 13 No. 2,
pp. 147-169.
Subbarao, E.C. (2013), “India’s higher engineering education: opportunities and tough choices”, Current
Science, Vol. 104 No. 1, pp. 55-66.
Subrahmanyam, A. (2017), “Relationship between service quality, satisfaction, motivation and loyalty:
A multi-dimensional perspective”, Quality Assurance in Education, Vol. 25 No. 2, pp. 171-188.
Sultan, P. and Yin Wong, H. (2012), “Service quality in a higher education context: an integrated
model”, Asia Pacific Journal of Marketing and Logistics, Vol. 24 No. 5, pp. 755-784,
available at: https://doi.org/10.1108/13555851211278196
Supiano, B. (2009), “The psychology of college pricing”, Chronicle of Higher Education, Vol. 55 No. 33.
Svoboda, P. and Harantova, M. (2015), “Strategic marketing in higher education from Alumni”, 18th
International Academic Conference, London, pp. 669-679, available at: https://doi.org/
10.20472/IAC.2015.018.120
Syed Alwi, S.F. and Kitchen, P.J. (2014), “Projecting corporate brand image and behavioral response in
business schools: cognitive or affective brand attributes?”, Journal of Business Research, Vol. 67
No. 11, pp. 2324-2336, available at: https://doi.org/10.1016/j.jbusres.2014.06.020
Teeroovengadum, V., Kamalanabhan, T.J. and Seebaluck, A.K. (2016), “Measuring service quality in
higher education”, Quality Assurance in Education, Vol. 24 No. 2, pp. 244-258,
available at: https://doi.org/10.1108/QAE-06-2014-0028
Teo, T., Tsai, L.T. and Yang, C.-C. (2013), “Applying structural equation modeling (SEM) in educational
research: an introduction”, Application of Structural Equation Modeling in Educational Research
and Practice, Brill Sense, pp. 1-21, available at: https://doi.org/10.1007/978-94-6209-332-4_1
Thomas, S. (2011), “What drives student loyalty in universities: an empirical model from India”,
International Business Research, Vol. 4 No. 2, pp. 183-192 available at: https://doi.org/
10.5539/ibr.v4n2p183
Tight, Malcolm (2015), Researching Higher Education, Routledge, London, available at: https://doi.org/
10.4324/9781315675404
Tijjang, B., Kamase, J., Labbase, I. and Plyriadi, A. (2017), “The relevance of marketing mix and service
quality on students’ decision-making factors regarding higher education and satisfaction”, IRAInternational
Journal of Management & Social Sciences, Vol. 8 No. 1, pp. 81-90,
available at: https://doi.org/10.21013/jmss.v8.n1.p9
Tripney, J., Newman, M., Bangpan, M., Niza, C., Mackintosh, M. and Sinclair, J. (2010), “Factors
influencing young people (aged 14-19) in Education about STEM subject choices: a systematic
review of the UK literature.
Turkyilmaz, A., Temizer, L. and Oztekin, A. (2018), “A causal analytic approach to student satisfaction
index modeling”, Annals of Operations Research, Vol. 263 Nos 1–2, pp. 565-585,
available at: https://doi.org/10.1007/s10479-016-2245-x
UNESCO (2015), “UNESCO science report”, UNESCO, Paris.
Unni, J. (2016), “Skill gaps and employability: higher education in India”, Journal of Development Policy
and Practice, Vol. 1 No. 1, pp. 18-34, available at: https://doi.org/10.1177/2455133315612310
Upadhayay, L. and Vrat, P. (2017), “Quality issues affecting organisational performance : a review of
Indian technical education”, International Journal of Indian Culture and Business Management,
Vol. 14 No. 1, pp. 1-22.
Venkatraman, S. (2007), “A framework for implementing TQM in higher education programs”, Quality
Assurance in Education, Vol. 15 No. 1, pp. 92-112, available at: https://doi.org/
10.1108/09684880710723052
Viswanadhan, K.G. (2009), “Performance under varied management styles – a comparative assessment
of engineering education programmes in India”, International Business Research, Vol. 2 No. 1,
pp. 117-127.
Vrat, P. (2009), “Role of technical education in emerging Indian society: opportunities and challenges”,
RITES Journal, Vol. 11 No. 2, pp. 9-1.
Vyas, C. and Sharma, R. (2013), “Online and offline marketing strategies by Indian colleges and
universities: a comparative analysis of students’ perception”, Jindal Journal of Business
Research, Vol. 2 No. 2, pp. 116-126, available at: https://doi.org/10.1177/2278682115608459
Wadhwa, R. (2016), “Students on move: understanding decision-making process and destination choice
of Indian students”, Higher Education for the Future, Vol. 3 No. 1, pp. 54-75,
available at: https://doi.org/10.1177/2347631115610221
Wajeeh, E. and Micceri, T. (1997), Factors Influencing Students’ College Choice at Traditional and
Metropolitan Universities, Office of Institutional Research and Planning, USF, Tampa, FL.
Wang, M. Te andDegol, J. (2013), “Motivational pathways to STEM career choices: using expectancy-value
perspective to understand individual and gender differences in STEM fields”, Developmental Review,
Vol. 33 No. 4, pp. 304-340, available at: https://doi.org/10.1016/j.dr.2013.08.001
Wickramasinghe, V. and Perera, L. (2010), “Graduates’, university lecturers’ and employers’
perceptions towards employability skills”, Education and Training, Vol. 52 No. 3, pp. 226-244,
available at: https://doi.org/10.1108/00400911011037355
Wilson, K., Jesson, J., Langley, C., Hatfield, K. and Clarke, L. (2006), Pharmacy Undergraduate Students:
Career Choices and Expectations Across a Four-year Degree Programme, Royal Pharmaceutical
Society of Great Britain, London, pp. 74-93.
Wong, H.Y. and Merrilees, B. (2007), “Multiple roles for branding in international marketing”,
International Marketing Review, Vol. 24 No. 4, pp. 384-408, available at: https://doi.org/
10.1108/02651330710760982
Woolnough, B.E. (1994), “Factors affecting students’ choice of science and engineering”, International
Journal of Science Education, Vol. 16 No. 6, pp. 659-679, available at: https://doi.org/
10.1080/0950069940160605
Worthington, R.L. and Whittaker, T.A. (2006), “Scale development research: a content analysis and
recommendations for best practices”, The Counseling Psychologist, Vol. 34 No. 6, pp. 806-838,
available at: https://doi.org/10.1177/0011000006288127
Yelkur, R. (2000), “Customer satisfaction and the services marketing mix”, Journal of Professional
Services Marketing, Vol. 21 No. 1, pp. 105-115, available at: https://doi.org/10.1300/J090v21n01
Yorke, M. and Longden, B. (2004), Retention and Student Success in Higher Education,
McGraw-Hill Education.
Young, L. (2005), Marketing the Professional Services Firm, John Wiley & Sons Ltd.