Embed Size (px)
Citation preview
2017-18Queensland Budget
Queensland Health
SERVICE DELIVERY STATEMENTS
2017-18 Queensland Budget Papers1. Budget Speech
2. Budget Strategy and Outlook
3. Capital Statement
4. Budget Measures
5. Service Delivery Statements
Appropriation Bills
Budget Highlights
The Budget Papers are available online at budget.qld.gov.au
© Crown copyright All rights reservedQueensland Government 2017
Excerpts from this publication may be reproduced, with appropriate acknowledgement, as permitted under the Copyright Act.
Service Delivery StatementsISSN 1445-4890 (Print)ISSN 1445-4904 (Online) Queensland Budget 2017-18 Service Delivery Statements
Health Portfolio
Summary of portfolio
Page Health Portfolio
5 Health Consolidated
26 Department of Health - controlled
Department of Health - administered
53 Queensland Ambulance Service
62 Cairns and Hinterland Hospital and Health Service
74 Central Queensland Hospital and Health Service
85 Central West Hospital and Health Service
94 Children's Health Queensland Hospital and Health Service
105 Darling Downs Hospital and Health Service
115 Gold Coast Hospital and Health Service
125 Mackay Hospital and Health Service
136 Metro North Hospital and Health Service
147 Metro South Hospital and Health Service
157 North West Hospital and Health Service
167 South West Hospital and Health Service
176 Sunshine Coast Hospital and Health Service
189 Torres and Cape Hospital and Health Service
200 Townsville Hospital and Health Service
211 West Moreton Hospital and Health Service
222 Wide Bay Hospital and Health Service
232 The Council of the Queensland Institute of Medical Research
240 Queensland Mental Health Commission
247 Office of the Health Ombudsman
Portfolio overview
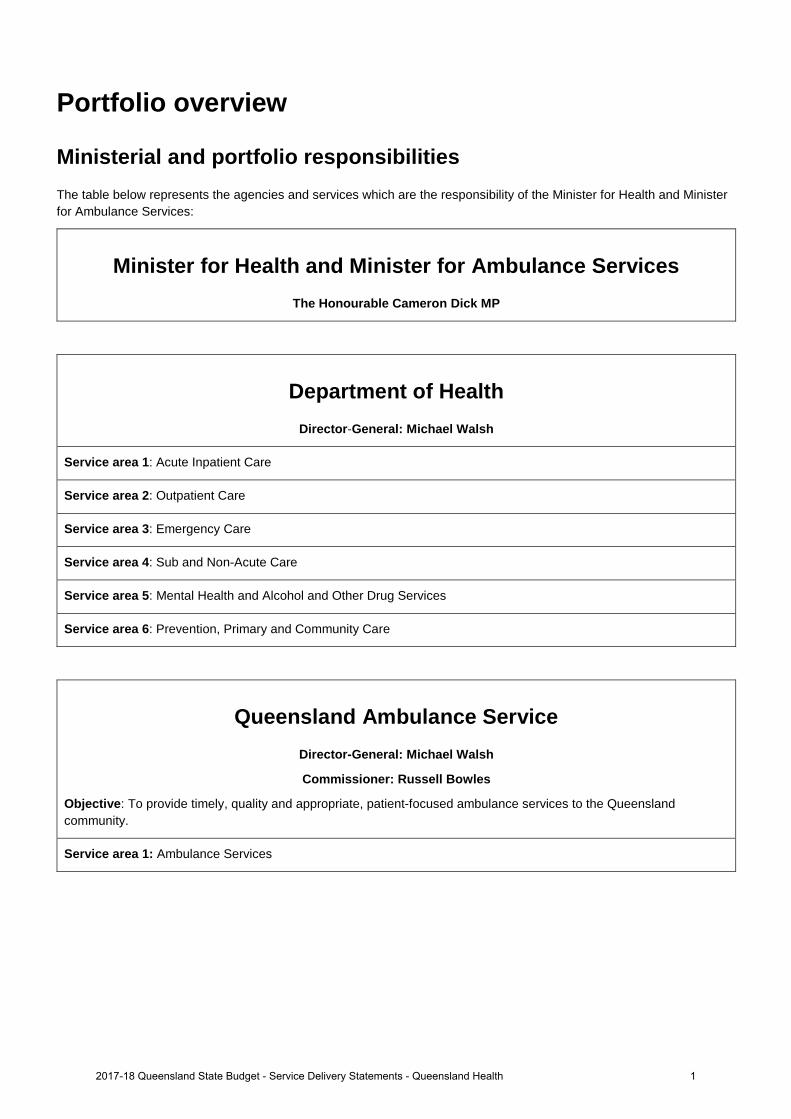
Ministerial and portfolio responsibilities The table below represents the agencies and services which are the responsibility of the Minister for Health and Minister for Ambulance Services:
Minister for Health and Minister for Ambulance Services The Honourable Cameron Dick MP
Department of Health Director-General: Michael Walsh
Service area 1: Acute Inpatient Care
Service area 2: Outpatient Care
Service area 3: Emergency Care
Service area 4: Sub and Non-Acute Care
Service area 5: Mental Health and Alcohol and Other Drug Services
Service area 6: Prevention, Primary and Community Care
Queensland Ambulance Service Director-General: Michael Walsh
Commissioner: Russell Bowles
Objective: To provide timely, quality and appropriate, patient-focused ambulance services to the Queensland community.
Service area 1: Ambulance Services
12017-18 Queensland State Budget - Service Delivery Statements - Queensland Health
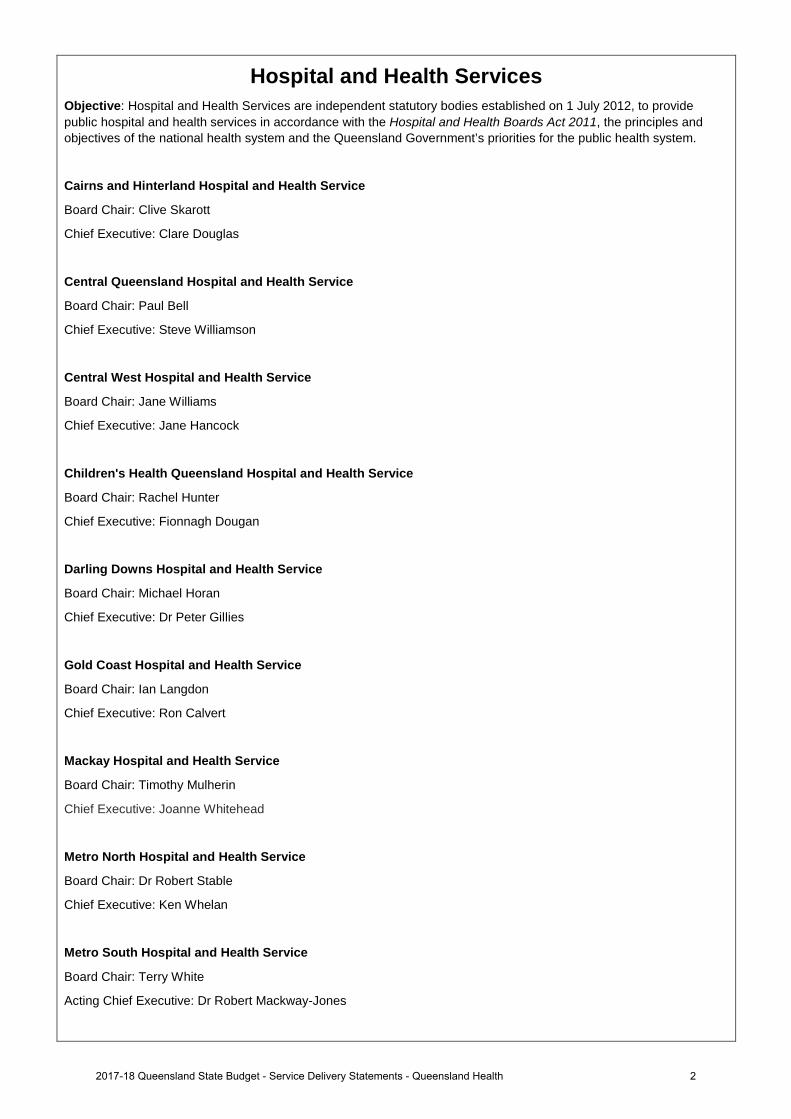
Hospital and Health Services Objective: Hospital and Health Services are independent statutory bodies established on 1 July 2012, to provide public hospital and health services in accordance with the Hospital and Health Boards Act 2011, the principles and objectives of the national health system and the Queensland Government’s priorities for the public health system.
Cairns and Hinterland Hospital and Health Service
Board Chair: Clive Skarott
Chief Executive: Clare Douglas
Central Queensland Hospital and Health Service
Board Chair: Paul Bell
Chief Executive: Steve Williamson
Central West Hospital and Health Service
Board Chair: Jane Williams
Chief Executive: Jane Hancock
Children's Health Queensland Hospital and Health Service
Board Chair: Rachel Hunter
Chief Executive: Fionnagh Dougan
Darling Downs Hospital and Health Service
Board Chair: Michael Horan
Chief Executive: Dr Peter Gillies
Gold Coast Hospital and Health Service
Board Chair: Ian Langdon
Chief Executive: Ron Calvert
Mackay Hospital and Health Service
Board Chair: Timothy Mulherin
Chief Executive: Joanne Whitehead
Metro North Hospital and Health Service
Board Chair: Dr Robert Stable
Chief Executive: Ken Whelan
Metro South Hospital and Health Service
Board Chair: Terry White
Acting Chief Executive: Dr Robert Mackway-Jones
22017-18 Queensland State Budget - Service Delivery Statements - Queensland Health
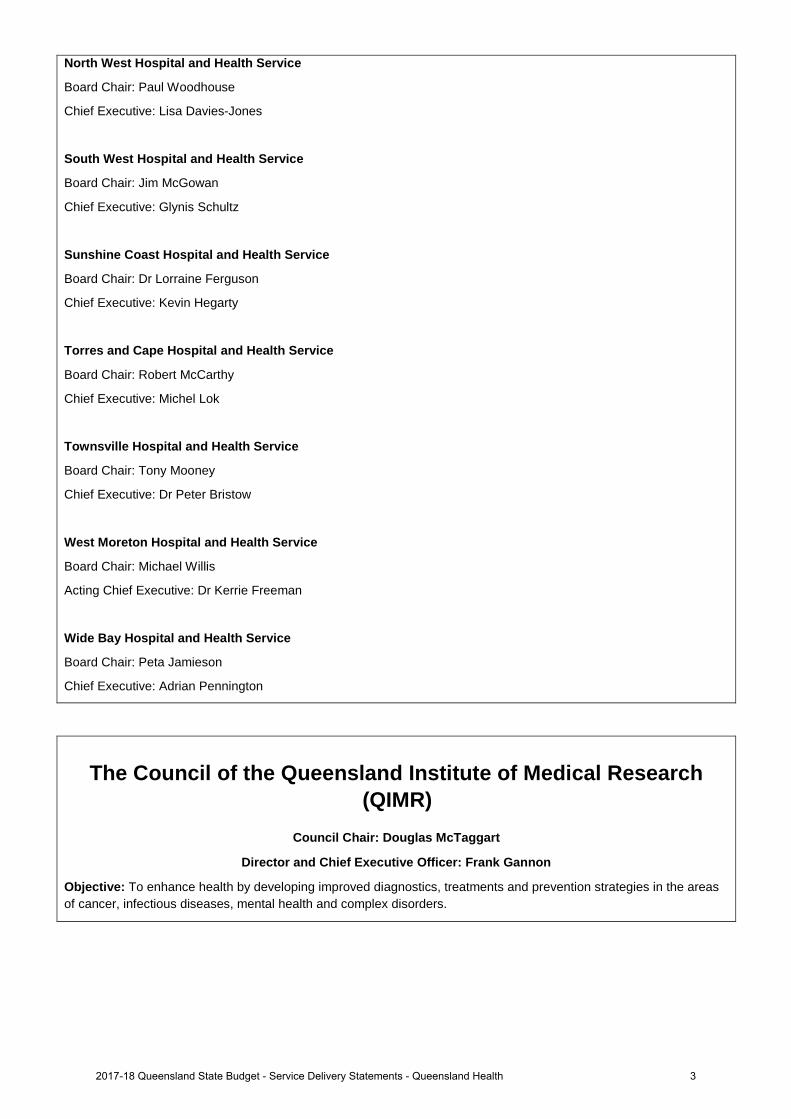
North West Hospital and Health Service
Board Chair: Paul Woodhouse
Chief Executive: Lisa Davies-Jones
South West Hospital and Health Service
Board Chair: Jim McGowan
Chief Executive: Glynis Schultz
Sunshine Coast Hospital and Health Service
Board Chair: Dr Lorraine Ferguson
Chief Executive: Kevin Hegarty
Torres and Cape Hospital and Health Service
Board Chair: Robert McCarthy
Chief Executive: Michel Lok
Townsville Hospital and Health Service
Board Chair: Tony Mooney
Chief Executive: Dr Peter Bristow
West Moreton Hospital and Health Service
Board Chair: Michael Willis
Acting Chief Executive: Dr Kerrie Freeman
Wide Bay Hospital and Health Service
Board Chair: Peta Jamieson
Chief Executive: Adrian Pennington
The Council of the Queensland Institute of Medical Research (QIMR)
Council Chair: Douglas McTaggart
Director and Chief Executive Officer: Frank Gannon
Objective: To enhance health by developing improved diagnostics, treatments and prevention strategies in the areas of cancer, infectious diseases, mental health and complex disorders.
32017-18 Queensland State Budget - Service Delivery Statements - Queensland Health
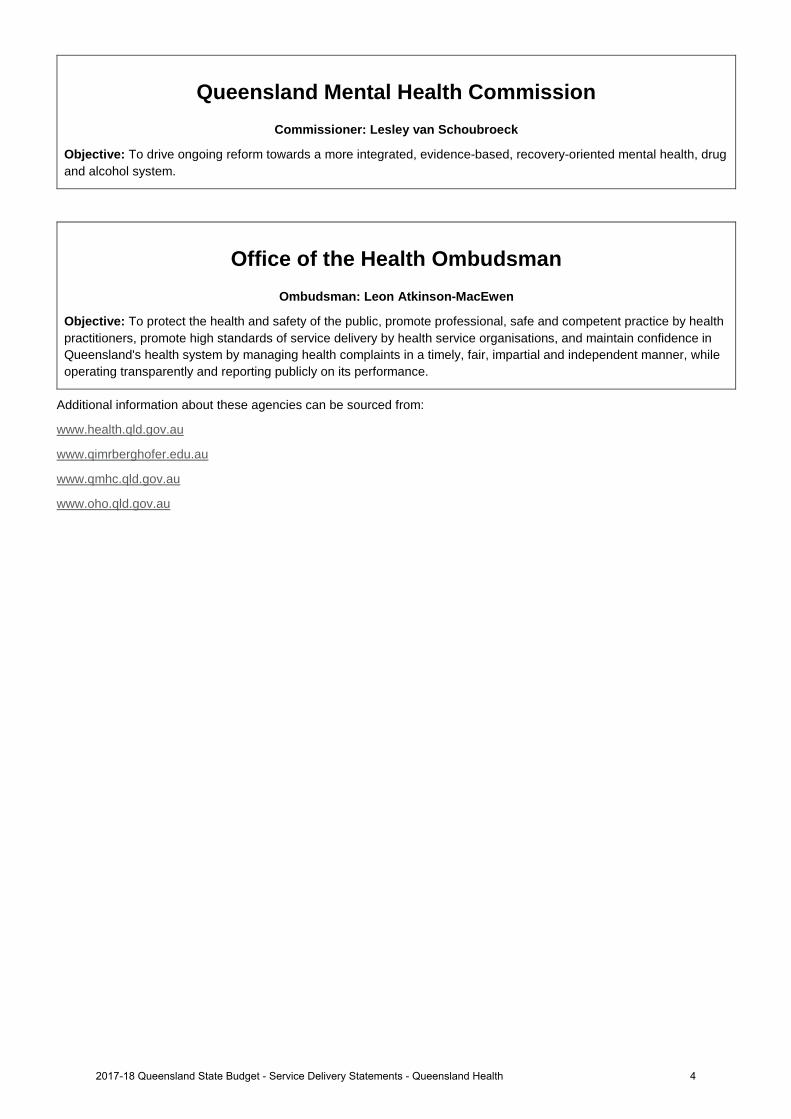
Queensland Mental Health Commission Commissioner: Lesley van Schoubroeck
Objective: To drive ongoing reform towards a more integrated, evidence-based, recovery-oriented mental health, drug and alcohol system.
Office of the Health Ombudsman Ombudsman: Leon Atkinson-MacEwen
Objective: To protect the health and safety of the public, promote professional, safe and competent practice by health practitioners, promote high standards of service delivery by health service organisations, and maintain confidence in Queensland's health system by managing health complaints in a timely, fair, impartial and independent manner, while operating transparently and reporting publicly on its performance.
Additional information about these agencies can be sourced from:
www.health.qld.gov.au
www.qimrberghofer.edu.au
www.qmhc.qld.gov.au
www.oho.qld.gov.au
42017-18 Queensland State Budget - Service Delivery Statements - Queensland Health
Queensland Health overview Public healthcare in Queensland is collectively known as Queensland Health. It consists of the Department of Health, the Queensland Ambulance Service (QAS) and 16 independent Hospital and Health Services (HHSs) situated across the state. The Queensland Mental Health Commission, the Office of the Health Ombudsman and the Council of the Queensland Institute of Medical Research comprise the remainder of the Health Portfolio.
This budget recognises that we are rising to the challenges of healthcare in Queensland and making progress on our vision to make Queenslanders among the healthiest people in the world by 2026.
Meeting the challenges
Queensland Health is performing well and we are continuing to position ourselves to meet the needs of growing demand and the increasing prevalence of chronic disease. Queensland Health’s strong performance over the last two financial years can be attributed to a clear strategic direction and investment in the right services for the right people in the right place.
Each year, about one in five Queenslanders is admitted to a Queensland public hospital; approximately 1.8 million Queenslanders are treated at our public emergency departments; our clinicians provide approximately 3.4 million outpatient appointments and 141,000 elective surgeries; our nursing staff provide triage support and advice to approximately 335,000 calls to 13 HEALTH; 45,000 babies are delivered at our public maternity services; and the QAS responds to approximately 1 million incidents.
During 2016-17 over $13 billion was allocated to Hospital and Health Services and other providers to deliver high quality public hospital and other health services. These services are not only critical to improving quality of life but enable a more productive workforce and community.
In service delivery terms, strong results have been achieved during 2016-17 with 76.2 per cent of people presenting to emergency departments being seen within four hours and 97.9 per cent of elective surgery patients receiving their treatment within clinically recommended times. In addition, the number of patients waiting longer than the recommended time has dropped from 104,114 as at 28 February 2015 to 50,033 as at 30 April 2017.
The percentage of elective surgery patients treated within clinically recommended time meets or exceeds expectations across all categories.
Overall, emergency department patients seen within recommended times has improved with the greatest improvement occurring in categories 4 and 5.
New performance indicators
A number of new performance measures and targets have been introduced in 2017-18, including the number of elective surgery patients and the percentage of specialist outpatients seen within clinically recommended times.
To drive growth in the use of Telehealth enabled outpatient services for patients in regional, rural and remote areas, we have set ourselves a target of 78,403 for 2017-18. This is an increase of almost 12,000 Telehealth service events on the 2016-17 estimated actual.
Preparing and responding to chronic disease
Like healthcare systems everywhere, Queensland Health is facing significant challenges to effectively and efficiently respond to the changing health needs of the population it serves. In general, the Queensland population is growing and ageing and residents are living longer with more chronic disease. Consumer expectations related to health outcomes and treatment options are on the rise, and the introduction of new treatments and technologies is driving up costs as well as improving health outcomes. As well as existing preventive health programs, such as innovative behaviour change marketing campaigns, new measures are being implemented to ease this burden.
Queensland Health is delivering on the Government’s commitment to tackle growing rates of type 2 diabetes by addressing risk factors for people across Queensland. The My health for life program will offer participants six sessions of coaching and support over six months. The first session is a one-on-one personalised appointment and the remaining sessions will be delivered in either small local groups or structured phone coaching. The program has begun enrolling residents on the Fraser Coast in either group or telephone education as part of the program. It is expected that over four years to 2019-20, 10,000 Queenslanders will benefit from this program.
Queensland Health is delivering on the Government’s commitment to tackle unhealthy habits through the establishment of the Healthy Futures Commission Queensland. The Commission will focus on reducing obesity and chronic disease rates in Queensland, with a particular focus on children, young people and families.
52017-18 Queensland State Budget - Service Delivery Statements - Queensland Health
Funding of $20 million will be provided over three years to provide grants and partner with local business, community organisations, academic institutions and government agencies to encourage and support regular physical activity and healthy eating. The Commission will also comprise a six-member board, a Chief Executive Officer and up to 15 staff, who will address two key outcomes from Queensland Health’s Vision, My health, Queensland's future: Advancing health 2026 (Advancing Health 2026) to:
• reduce childhood obesity by 10 per cent• increase levels of physical activity for health benefit by 20 per cent.
Building confidence through performance and innovation
Through strong performance, improved patient outcomes and targeted and planned investment in both our staff and services, Queensland Health is committed to further lifting public confidence in the public health system.
Over the last two years, the clinical workforce was boosted by an additional 3,300 nursing and midwifery graduates, supported by 16 nurse educators across the state. In addition, 121 nurse navigators commenced across the state based on identified areas of priority need taking into account factors such as population and the level of chronic illness.
These additional staff have contributed to the achievement of strong compliance with nurse to patient ratios covering adult acute medical and acute surgical wards in 27 hospitals across 12 HHSs. Ratios are also being applied to adult acute mental health wards in two hospitals.
Public confidence is also increased when investment decisions are informed by research and based on best practice. To deliver on the Government’s commitment to rebuild and expand mental healthcare services for young people, Queensland Health has undertaken just over 12 months of planning in close collaboration with clinical leaders, built form experts, families of former patients of the Barrett Adolescent Centre and the Department of Education and Training. This consultation and planning has helped shape the Government’s response to rebuild and expand mental healthcare services for young people. Delivery of this election commitment has also been informed by the Government’s response to the Commission of Inquiry into the closure of the Barrett Adolescent Centre.
The Specialist Outpatient Strategy has also invested in new and more contemporary models of care across a range of services and increased access to ensure patients receive care at the right time, in the right place. Examples of these models include the General Practitioners with special interest program led by the Gold Coast HHS; Dietitian First Gastroenterology Clinic – Extended Service delivered by Metro South HHS; improved discharge communication to General Practitioners led by Children’s Health Queensland HHS and the Musculoskeletal Physiotherapy Screening Clinic delivered by Sunshine Coast HHS.
Staff Resilience
Queensland Health will also implement initiatives to support the mental health of practitioners across the medical workforce, from junior doctors to senior consultants.
Queensland Health will invest $2 million for a suite of mental health initiatives for health professionals in Queensland, enabling the continuation of a ‘Resilience on the Run – Rapid Resilience’ initiative piloted in 2015 by the Australian Medical Association (AMA) Queensland.
The program has since been delivered to over 350 interns at Princess Alexandra, Logan, Redland, Ipswich Hospitals, and again at Rockhampton Hospital. This year’s budget allocation and partnership will enable delivery of the program at all 21 Queensland hospitals with interns.
The budget allocation supports the ‘Promoting Wellbeing’ direction of Advancing Health 2026.
Providing first class facilities for our world class clinicians
In 2016-17, Queensland Health achieved a major milestone with the opening of the Sunshine Coast University Hospital and the Sunshine Coast Health Institute. This contemporary facility has around 450 overnight beds growing to 738 beds by 2021, and offers a range of secondary and tertiary health services for the local community, including neurosurgery and cardiac surgery.
62017-18 Queensland State Budget - Service Delivery Statements - Queensland Health
We are future proofing health services in our regional, rural and remote communities to ensure these residents have access to contemporary infrastructure. This Budget provides:
• $10 million in 2017-18 to expand Maryborough Hospital emergency department and refurbish the specialistoutpatients department.
• $128.4 million over four years for projects to redevelop or replace Kingaroy, Blackall and Sarina Hospitals, fit-outs ofTownsville Hospital’s breast-screen clinic and clinical services, and the replacement of the Mer (Murray Island)primary healthcare centre clinical building, and staff accommodation at various locations across Queensland toprovide safe, secure housing in rural areas.
The Budget is also responding to increasing health demand in high growth population areas such as Logan, Caboolture and Ipswich. Health demand in these areas is also impacted by high levels of chronic disease and an ageing population. This budget provides an initial investment of $112.2 million over four years for detailed planning and preparatory works for redevelopments at Logan, Caboolture and Ipswich hospitals to increase capacity to deal with growth. This budget also provides $19.6 million for an expansion of the Caboolture Hospital Emergency Department.
Delivering mental health services
In response to the growing prevalence of mental health in our communities, this Budget provides additional capital funding of $138.2 million over four years to establish a new Adolescent Extended Treatment Facility on the Prince Charles Hospital site, two new adolescent Step Up Step Down units in Brisbane and refurbishment of two adolescent day program spaces at Logan and the Gold Coast, and a new holistic mental health unit at the Cairns Hospital. This is in addition to a range of initiatives being delivered through the Connecting care to recovery 2016-21 five year mental health plan that provide comprehensive, high quality and safe recovery-oriented mental health, alcohol and other drug services. These services contribute to improving the health and well-being of Queenslanders and minimise the impact of substance misuse in Queensland communities.
Operating Budget
In 2017-18, Queensland Health's operating budget will be $16.554 billion, which is an increase of $1.280 billion (8.4 per cent) from the published 2016-17 operating budget of $15.274 billion.
Based on current projections, growth in health demand over the medium term is projected to continue. The challenge is therefore to maintain moderate growth in health expenditure while sustaining a high quality health system across a geographically dispersed landscape.
The Commonwealth funding environment is placing serious pressure on service delivery. Growth in public hospital funding from 2017-18 is subject to a 6.5 per cent per annum cap at the national level. Funding under other streams is also constrained, with National Partnership Agreement payments projected to be just $33.6 million in 2020-21 compared to an average of $334 million between 2009-10 and 2014-15.
Hospital and Health Services
In 2017-18, a total of $13.979 billion (84 per cent of the total operating budget) will be allocated through service agreements to provide public healthcare services from HHSs and other organisations. This represents an increase of 11 per cent compared to the published 2016-17 Budget. Investment will be focussed on maintaining recent achievements in relation to outpatient and elective surgery targets in the face of strong increases in service demand.
In addition, the budget also provides for a range of new and continuing initiatives shaped around the key directions of Advancing Health 2026 of promoting wellbeing; delivering healthcare; connecting healthcare and pursuing innovation.
Promoting Wellbeing
• Investing $2 million over two years to develop educational programs aimed at providing interns and other healthprofessionals with the resilience and coping skills needed to survive and thrive in the field of medicine.
• Piloting a Community Health Action Plan (CHAP) in Logan in partnership with key stakeholders in the localcommunity to address some of the key health challenges for specific population groups in Logan. Key initiativesunder the CHAP Logan include targeted strategies to tackle obesity, improve access to antenatal services through aCommunity-based Midwifery Group Practice, and improve immunisation uptake for children up to five years of age.
• $5.3 million will be provided to extend the School Immunisation Program to include the Meningococcal ACWYvaccine for year 10 students. Extension of this program aims to reduce the risk of meningococcal disease caused bystrains A, C, W and Y in this age group, and to reduce the spread of meningococcal disease caused by these strains.
• Investing a further $1.5 million to extend the current Neurodevelopment Exposure Disorder (FASD) Clinic at the GoldCoast to provide a statewide service aimed at providing support, knowledge and training for clinicians, children andtheir families.
72017-18 Queensland State Budget - Service Delivery Statements - Queensland Health
• Significant and concerted pressure will continue to be applied to improve Indigenous health outcomes across the state. Under its Making Tracks Investment Strategy 2015-18, in 2017-18 the Government will invest more than$88 million in Indigenous-specific health initiatives. This includes additional funding of $3.2 million for:− continuation of the highly successful Brisbane Broncos Deadly Choices Partnership to promote the adoption of
healthy lifestyles and regular health checks − the establishment of a new primary health care clinic run by the Aboriginal and Torres Strait Islander Community
Health Service-Brisbane at Loganlea − establishment of Indigenous mental health hospital liaison services at six public hospitals − expansion of the provision of Indigenous-specific forensic mental health services at male and female correctional
facilities. • Up to $600,000 will be provided in 2017-18 support the implementation of changes to the Private Health Facilities
Regulation which will require certain cosmetic surgical procedures to be carried out on licenced premises through an advertisement campaign and upgrading existing technology.
• Delivering services and infrastructure to implement the $350 million Connecting care to recovery 2016-2021 five-yearmental health and alcohol and other drugs plan. Future priorities and enhancements under the plan are focused ondeveloping the range of service models across the care continuum, in particular, for community treatment,community support and community bed-based services including:− employment of independent patient rights advisers− establishment of a parent and infant unit and older persons bed unit at the Gold Coast University Hospital− provision of various mental health services including Assertive Mobile Youth Outreach Services and Child and
Youth Forensic Mental Health across the state. • Implementation of a range of initiatives, totalling just over $8 million in 2017-18, identified under the Queensland
Sexual Health Strategy and the North Queensland Aboriginal and Torres Strait Islander Sexually Transmissible Infections Action Plan 2016-2021, to help improve the sexual and reproductive health of all Queenslanders by addressing issues including health promotion, prevention, clinical service provision and community education.
• Continuation of the Suicide Prevention in Health Services Initiative which has supported the establishment of aSuicide Prevention Health Taskforce to support clinicians and staff in recognising, responding to and providing care to people at risk of suicide.
Delivering Healthcare
• During 2017-18, $126.5 million will support the continuation of initiatives across the state to reduce specialistoutpatient long waits and conversion to elective surgery. This includes an allocation of $16.5 million to focus onpatients waiting to see an Ear, Nose and Throat specialist.
• An additional $37 million will be invested in 2017-18 to deliver an additional 12,000 gastrointestinal endoscopies tomeet the growth in demand associated with the National Bowel Cancer Screening Program and ensure timely accessacross the state. Endoscopy services play an important role in the diagnosis and treatment of many conditions anddiseases.
• A further $6 million will be allocated in 2017-18 to continue to tackle the Ice epidemic in Queensland. This funding willcontinue to support the Drug and Alcohol Brief Intervention Teams in the Emergency Departments of Logan,Rockhampton, Townsville, Gold Coast University and Robina Hospitals, as well as a range of service responses intarget areas including Cooktown, Gold Coast, Charleville and Cunnamulla and statewide workforce development.
• $15 million will be allocated in 2017-18 to deliver the Winter Bed Management Strategy which aims to drive improvedemergency access performance across the state during the winter periods.
• $1.3 million will be allocated in 2017-18 to support the development and implementation of measurable andsustainable improvements in sector wide provision of care at the end of life, including professional and consumereducational materials, and standardised models for advance care planning.
• During 2017-18, the QAS will recruit an additional 75 ambulance operatives. This is in addition to the 110 recruited in2016-17 to provide enhanced roster coverage to manage increasing demand for ambulance services.
82017-18 Queensland State Budget - Service Delivery Statements - Queensland Health
• During 2017-18, the Department of Health is aiming to improve public maternity services through the establishment of three statewide action groups which will examine key factors impacting the successful delivery outcomes for mothers and babies. An audit of the midwifery workforce Business Planning Framework of all public midwifery services is also being undertaken to ensure that midwifery workloads are sustainable and safe for staff and patients and meet existing industrial obligations.
Connecting Healthcare
• During 2016-17, funding totalling $35 million was provided to incentivise ideas and initiatives to deliver better integration of care, address fragmentation in services and provide high-value health care, with initiatives currently being rolled out by the 16 HHSs in partnership with six local Primary Healthcare Networks and community partners. The initiatives focus on chronic diseases such as liver disease, diabetes and chronic obstructive pulmonary disease; vulnerable populations such as children with behavioural and development conditions, the frail and elderly and Aboriginal and Torres Strait Islander peoples; unnecessary hospitalisations and management of complex conditions.
• During 2017-18, as part of the Government's commitment to re-establish a Drug Court, Queensland Health will work with the Department of Justice and Attorney-General through the investment of $700,000 to establish the treatment team component of the new court.
• $1.5 million is also being provided for targeted health related services to support the transition of 17 year olds from Queensland’s adult justice system to the youth system.
Pursuing innovation
• Investment of $10 million over four years for the Queensland Health and Medical Research Funding Program, which will focus on supporting innovative, collaborative research that has a strong translatable potential to frontline healthcare and Queensland Health’s international engagement. The Department of Health will work with the Queensland research community to ensure new programs are designed to maximise the benefit to health outcomes and so that they complement the broader Advance Queensland agenda to grow Queensland’s knowledge industries.
• In April 2017, nine projects were awarded $4.8 million in funding under the first round of the $25 million Queensland Genomics Health Alliance initiative. Five of the projects are focussed on building the infrastructure needed to integrate clinical genomics into our healthcare system. The other four projects are clinical demonstration projects, which will help to build the evidence base for clinical genomics in the fields of melanoma, infectious diseases, maturity onset diabetes of the young and lung cancer. It is expected the next funding round will be progressed in 2017-18.
• Queensland Health has recently implemented an online booking system to improve access and encourage increased participation in breast screening. In the first six months of operation, over 20,000 women have used the system to book their breast screen appointment. Of these, 18 per cent are new participants in the BreastScreen Queensland program.
eHealth and Built Infrastructure
In 2016-17, Queensland Health achieved a major milestone with the opening of the Sunshine Coast University Hospital and the Sunshine Coast Health Institute.
Other significant achievements for 2016-17 include the completion of major works at Mackay Base and Mt Isa Hospitals; commencement of the Wynnum Integrated Healthcare Centre (Gundu Pa), Dimbulah Primary Healthcare Clinic and Roma Hospital; the completion of three ambulance stations at Rainbow Beach, Yandina and Collinsville as well as the QAS Emergency and Fleet Management Precinct (including Geebung ambulance station); and the signing of the contracts for the $1.1 billion ten-year development of the Herston Quarter.
Queensland Health also continued to progress the Digital Hospital project which will deliver an integrated electronic medical record with full digital capability expected in 24 hospitals across all HHSs, covering around 80 per cent of the acute in-patient activity by 30 June 2020. The project improves patient care through the development of a statewide authoritative single source of patient records.
In addition to Princess Alexandra Hospital, planning for infrastructure foundations will enable Digital Hospital implementation at further sites.
Significant progress has also been made to address legacy information technology systems including the Financial System Renewal Project and the Laboratory Information System Project.
In 2017-18, Queensland Health’s total capital investment program of $916.1 million will progress a range of health infrastructure priorities including: hospitals and supporting infrastructure; health technology research and scientific services; mental health services; and information technologies.
As highlighted earlier, the Government has further demonstrated its commitment to rural and remote health through the allocation of an additional $138.4 million over four years to deliver essential upgrades to health facilities and supporting
92017-18 Queensland State Budget - Service Delivery Statements - Queensland Health
infrastructure in rural and regional areas across the state. The funding will facilitate major redevelopments at Kingaroy Hospital, Blackall Hospital and Sarina Hospital, the redevelopment of the clinical services building and the relocation of the breast screen clinic at Townsville Hospital, the refurbishment of the emergency department and specialist outpatient facilities at Maryborough Hospital, and the replacement of the primary health care centre on Mer (Murray) Island. The program will also support upgrades to staff accommodation at various locations across Queensland to provide safe, secure housing in rural areas.
The Budget also includes $131.8 million over four years as an initial investment to enhance public hospital capacity and services in south-east Queensland, including $19.6 million to expand the emergency department at Caboolture Hospital and $112.2 million (including $9 million reallocated by Queensland Health) for detailed planning and preparatory works for proposed redevelopments at Logan, Caboolture and Ipswich hospitals. A further $3 million has also been internally reallocated for detailed planning to consider future requirements for the Toowoomba Hospital.
The budget also provides a total of $138.2 million over four years to improve mental health services by establishing a new Adolescent Extended Treatment Facility at The Prince Charles Hospital and two new adolescent Step Up Step Down units in Brisbane, and to refurbish two adolescent Day Program spaces at Logan and the Gold Coast and a new mental health unit at Cairns Hospital.
In addition to these new projects, a range of health infrastructure priorities will continue to be progressed in 2017-18, including:
• Roma Hospital Redevelopment main construction works • a new health precinct for the southern corridor of Cairns • Thursday Island Hospital redevelopment • Gladstone Hospital Emergency Department upgrade • Hervey Bay Emergency Department upgrade • Atherton Hospital redevelopment • repurposing of the Nambour General Hospital • Rockhampton Hospital Carpark main construction works • new Palm Island Primary Health Care Centre • the refurbishment of five Remote Primary Health Care Centres – Coconut Island, Stephen Island, Dauan Island, St.
Pauls Island and Yorke Island • planning and delivering new and replacement ambulance stations at Birtinya, Bundaberg, Kenilworth, Thursday
Island, Coral Gardens, Wynnum, Rockhampton, Hervey Bay, Drayton, Cairns and Kirwan.
102017-18 Queensland State Budget - Service Delivery Statements - Queensland Health
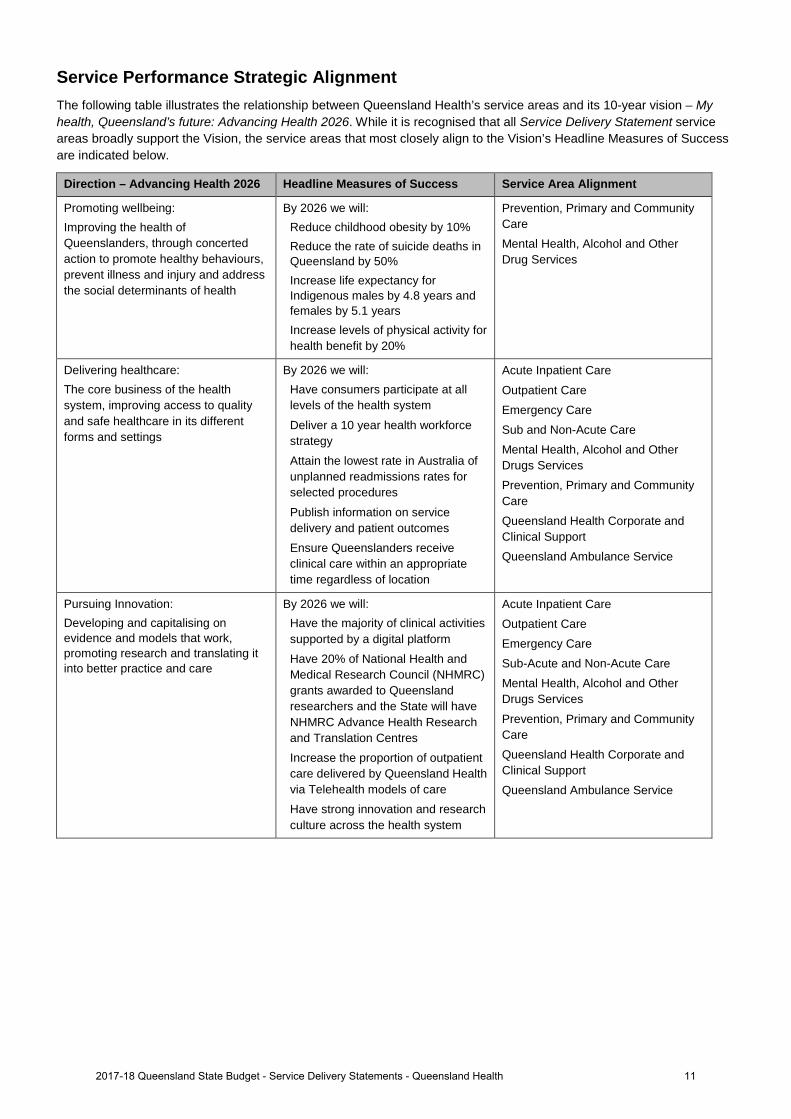
Service Performance Strategic Alignment The following table illustrates the relationship between Queensland Health’s service areas and its 10-year vision – My health, Queensland’s future: Advancing Health 2026. While it is recognised that all Service Delivery Statement service areas broadly support the Vision, the service areas that most closely align to the Vision’s Headline Measures of Success are indicated below.
Direction – Advancing Health 2026 Headline Measures of Success Service Area Alignment
Promoting wellbeing: Improving the health of Queenslanders, through concerted action to promote healthy behaviours, prevent illness and injury and address the social determinants of health
By 2026 we will: Reduce childhood obesity by 10% Reduce the rate of suicide deaths in Queensland by 50% Increase life expectancy for Indigenous males by 4.8 years and females by 5.1 years Increase levels of physical activity for health benefit by 20%
Prevention, Primary and Community Care Mental Health, Alcohol and Other Drug Services
Delivering healthcare: The core business of the health system, improving access to quality and safe healthcare in its different forms and settings
By 2026 we will: Have consumers participate at all levels of the health system
Deliver a 10 year health workforce strategy Attain the lowest rate in Australia of unplanned readmissions rates for selected procedures
Publish information on service delivery and patient outcomes Ensure Queenslanders receive clinical care within an appropriate time regardless of location
Acute Inpatient Care
Outpatient Care Emergency Care Sub and Non-Acute Care Mental Health, Alcohol and Other Drugs Services Prevention, Primary and Community Care Queensland Health Corporate and Clinical Support Queensland Ambulance Service
Pursuing Innovation: Developing and capitalising on evidence and models that work, promoting research and translating it into better practice and care
By 2026 we will: Have the majority of clinical activities supported by a digital platform Have 20% of National Health and Medical Research Council (NHMRC) grants awarded to Queensland researchers and the State will have NHMRC Advance Health Research and Translation Centres Increase the proportion of outpatient care delivered by Queensland Health via Telehealth models of care Have strong innovation and research culture across the health system
Acute Inpatient Care Outpatient Care Emergency Care Sub-Acute and Non-Acute Care Mental Health, Alcohol and Other Drugs Services
Prevention, Primary and Community Care Queensland Health Corporate and Clinical Support Queensland Ambulance Service
112017-18 Queensland State Budget - Service Delivery Statements - Queensland Health
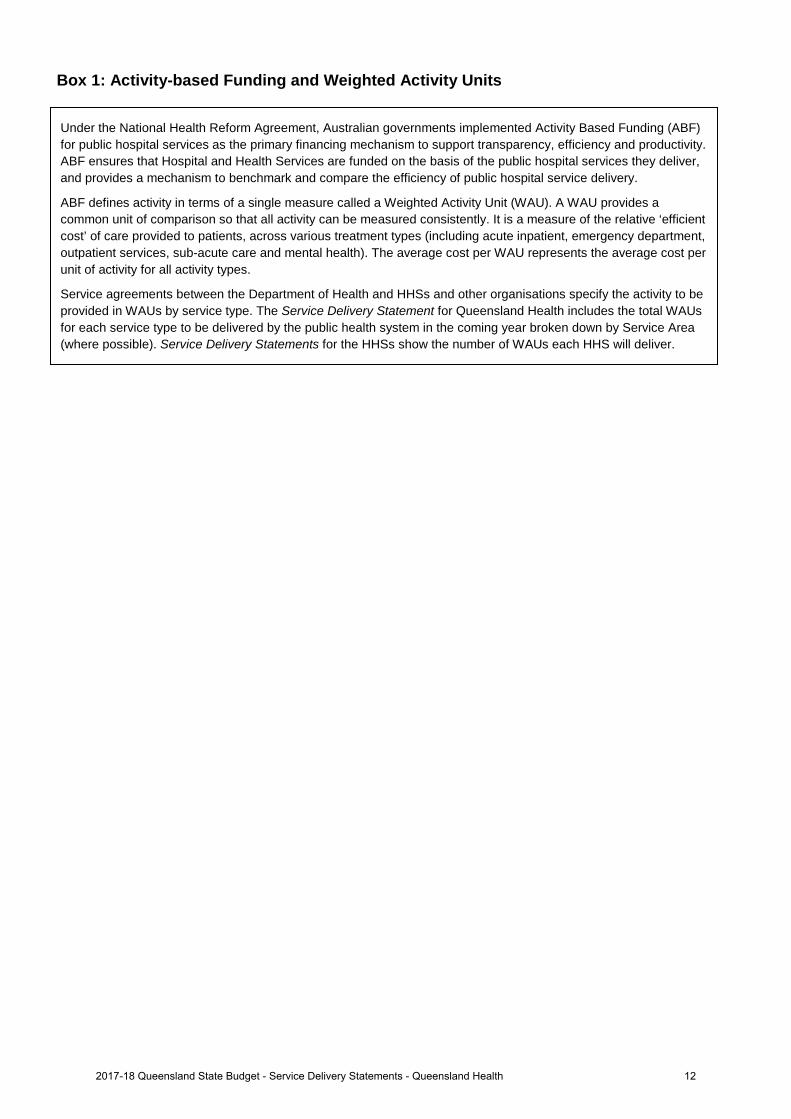
Box 1: Activity-based Funding and Weighted Activity Units
Under the National Health Reform Agreement, Australian governments implemented Activity Based Funding (ABF) for public hospital services as the primary financing mechanism to support transparency, efficiency and productivity. ABF ensures that Hospital and Health Services are funded on the basis of the public hospital services they deliver, and provides a mechanism to benchmark and compare the efficiency of public hospital service delivery.
ABF defines activity in terms of a single measure called a Weighted Activity Unit (WAU). A WAU provides a common unit of comparison so that all activity can be measured consistently. It is a measure of the relative ‘efficient cost’ of care provided to patients, across various treatment types (including acute inpatient, emergency department, outpatient services, sub-acute care and mental health). The average cost per WAU represents the average cost per unit of activity for all activity types.
Service agreements between the Department of Health and HHSs and other organisations specify the activity to be provided in WAUs by service type. The Service Delivery Statement for Queensland Health includes the total WAUs for each service type to be delivered by the public health system in the coming year broken down by Service Area (where possible). Service Delivery Statements for the HHSs show the number of WAUs each HHS will deliver.
122017-18 Queensland State Budget - Service Delivery Statements - Queensland Health
Service performance
Performance statement
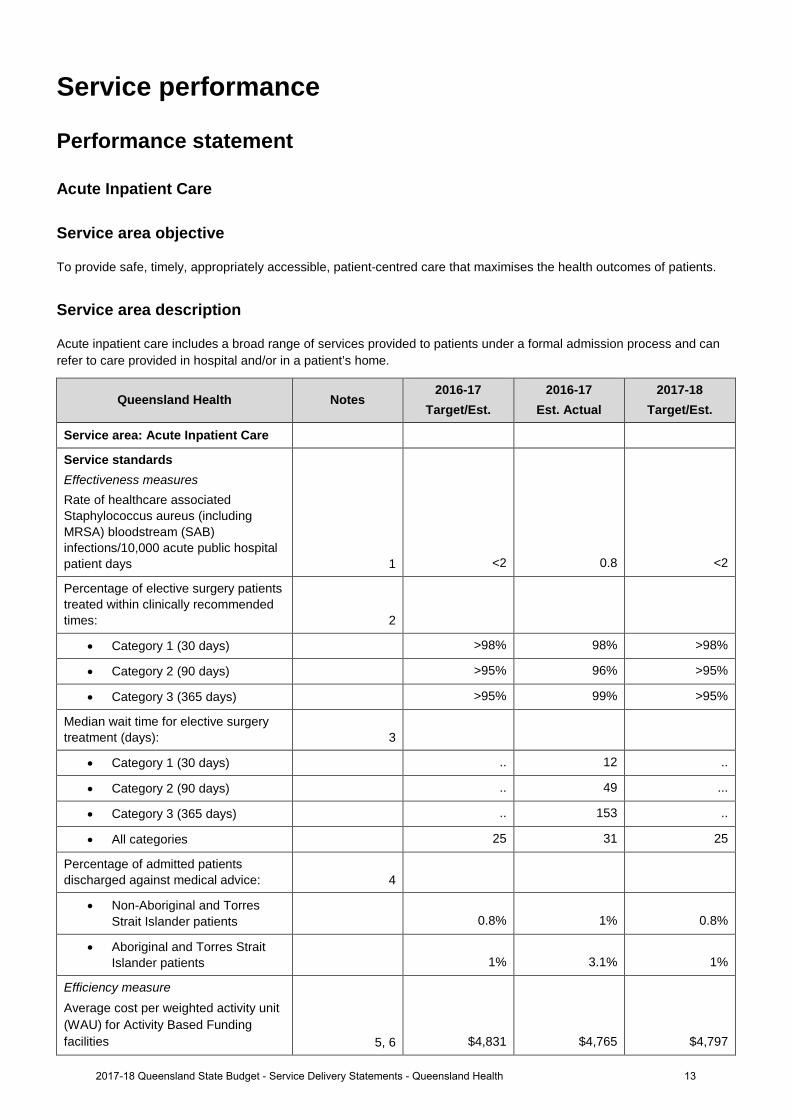
Acute Inpatient Care
Service area objective To provide safe, timely, appropriately accessible, patient-centred care that maximises the health outcomes of patients.
Service area description
Acute inpatient care includes a broad range of services provided to patients under a formal admission process and can refer to care provided in hospital and/or in a patient’s home.
Queensland Health Notes 2016-17
Target/Est. 2016-17
Est. Actual 2017-18
Target/Est.
Service area: Acute Inpatient Care
Service standards Effectiveness measures Rate of healthcare associated Staphylococcus aureus (including MRSA) bloodstream (SAB) infections/10,000 acute public hospital patient days 1 <2 0.8 <2
Percentage of elective surgery patients treated within clinically recommended times: 2
• Category 1 (30 days) >98% 98% >98%
• Category 2 (90 days) >95% 96% >95%
• Category 3 (365 days) >95% 99% >95%
Median wait time for elective surgery treatment (days): 3
• Category 1 (30 days) .. 12 ..
• Category 2 (90 days) .. 49 ...
• Category 3 (365 days) .. 153 ..
• All categories 25 31 25
Percentage of admitted patients discharged against medical advice: 4
• Non-Aboriginal and Torres Strait Islander patients 0.8% 1% 0.8%
• Aboriginal and Torres Strait Islander patients 1% 3.1% 1%
Efficiency measure Average cost per weighted activity unit (WAU) for Activity Based Funding facilities 5, 6 $4,831 $4,765 $4,797
132017-18 Queensland State Budget - Service Delivery Statements - Queensland Health
Queensland Health Notes 2016-17
Target/Est. 2016-17
Est. Actual 2017-18
Target/Est.
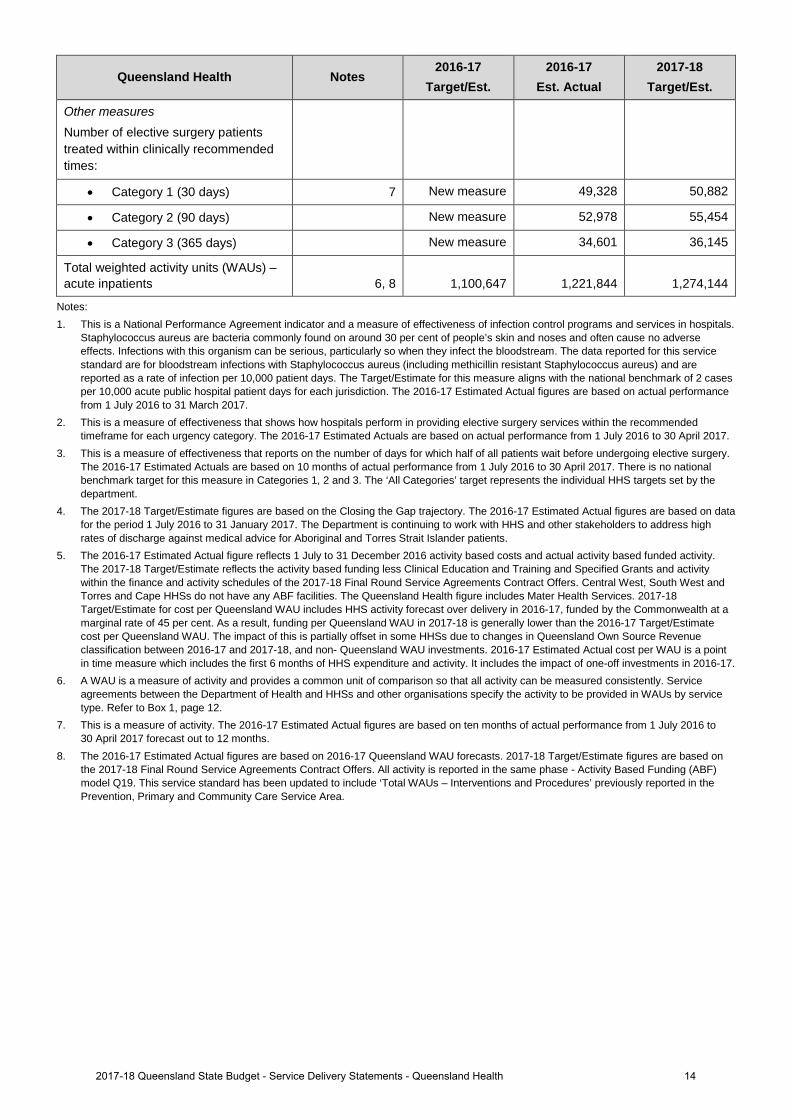
Other measures Number of elective surgery patients treated within clinically recommended times:
• Category 1 (30 days) 7 New measure 49,328 50,882
• Category 2 (90 days) New measure 52,978 55,454
• Category 3 (365 days) New measure 34,601 36,145
Total weighted activity units (WAUs) – acute inpatients 6, 8 1,100,647 1,221,844 1,274,144
Notes: 1. This is a National Performance Agreement indicator and a measure of effectiveness of infection control programs and services in hospitals.
Staphylococcus aureus are bacteria commonly found on around 30 per cent of people’s skin and noses and often cause no adverse effects. Infections with this organism can be serious, particularly so when they infect the bloodstream. The data reported for this service standard are for bloodstream infections with Staphylococcus aureus (including methicillin resistant Staphylococcus aureus) and are reported as a rate of infection per 10,000 patient days. The Target/Estimate for this measure aligns with the national benchmark of 2 cases per 10,000 acute public hospital patient days for each jurisdiction. The 2016-17 Estimated Actual figures are based on actual performance from 1 July 2016 to 31 March 2017.
2. This is a measure of effectiveness that shows how hospitals perform in providing elective surgery services within the recommended timeframe for each urgency category. The 2016-17 Estimated Actuals are based on actual performance from 1 July 2016 to 30 April 2017.
3. This is a measure of effectiveness that reports on the number of days for which half of all patients wait before undergoing elective surgery. The 2016-17 Estimated Actuals are based on 10 months of actual performance from 1 July 2016 to 30 April 2017. There is no national benchmark target for this measure in Categories 1, 2 and 3. The ‘All Categories’ target represents the individual HHS targets set by the department.
4. The 2017-18 Target/Estimate figures are based on the Closing the Gap trajectory. The 2016-17 Estimated Actual figures are based on data for the period 1 July 2016 to 31 January 2017. The Department is continuing to work with HHS and other stakeholders to address high rates of discharge against medical advice for Aboriginal and Torres Strait Islander patients.
5. The 2016-17 Estimated Actual figure reflects 1 July to 31 December 2016 activity based costs and actual activity based funded activity. The 2017-18 Target/Estimate reflects the activity based funding less Clinical Education and Training and Specified Grants and activity within the finance and activity schedules of the 2017-18 Final Round Service Agreements Contract Offers. Central West, South West and Torres and Cape HHSs do not have any ABF facilities. The Queensland Health figure includes Mater Health Services. 2017-18 Target/Estimate for cost per Queensland WAU includes HHS activity forecast over delivery in 2016-17, funded by the Commonwealth at a marginal rate of 45 per cent. As a result, funding per Queensland WAU in 2017-18 is generally lower than the 2016-17 Target/Estimate cost per Queensland WAU. The impact of this is partially offset in some HHSs due to changes in Queensland Own Source Revenue classification between 2016-17 and 2017-18, and non- Queensland WAU investments. 2016-17 Estimated Actual cost per WAU is a point in time measure which includes the first 6 months of HHS expenditure and activity. It includes the impact of one-off investments in 2016-17.
6. A WAU is a measure of activity and provides a common unit of comparison so that all activity can be measured consistently. Service agreements between the Department of Health and HHSs and other organisations specify the activity to be provided in WAUs by service type. Refer to Box 1, page 12.
7. This is a measure of activity. The 2016-17 Estimated Actual figures are based on ten months of actual performance from 1 July 2016 to 30 April 2017 forecast out to 12 months.
8. The 2016-17 Estimated Actual figures are based on 2016-17 Queensland WAU forecasts. 2017-18 Target/Estimate figures are based on the 2017-18 Final Round Service Agreements Contract Offers. All activity is reported in the same phase - Activity Based Funding (ABF) model Q19. This service standard has been updated to include ‘Total WAUs – Interventions and Procedures’ previously reported in the Prevention, Primary and Community Care Service Area.
142017-18 Queensland State Budget - Service Delivery Statements - Queensland Health
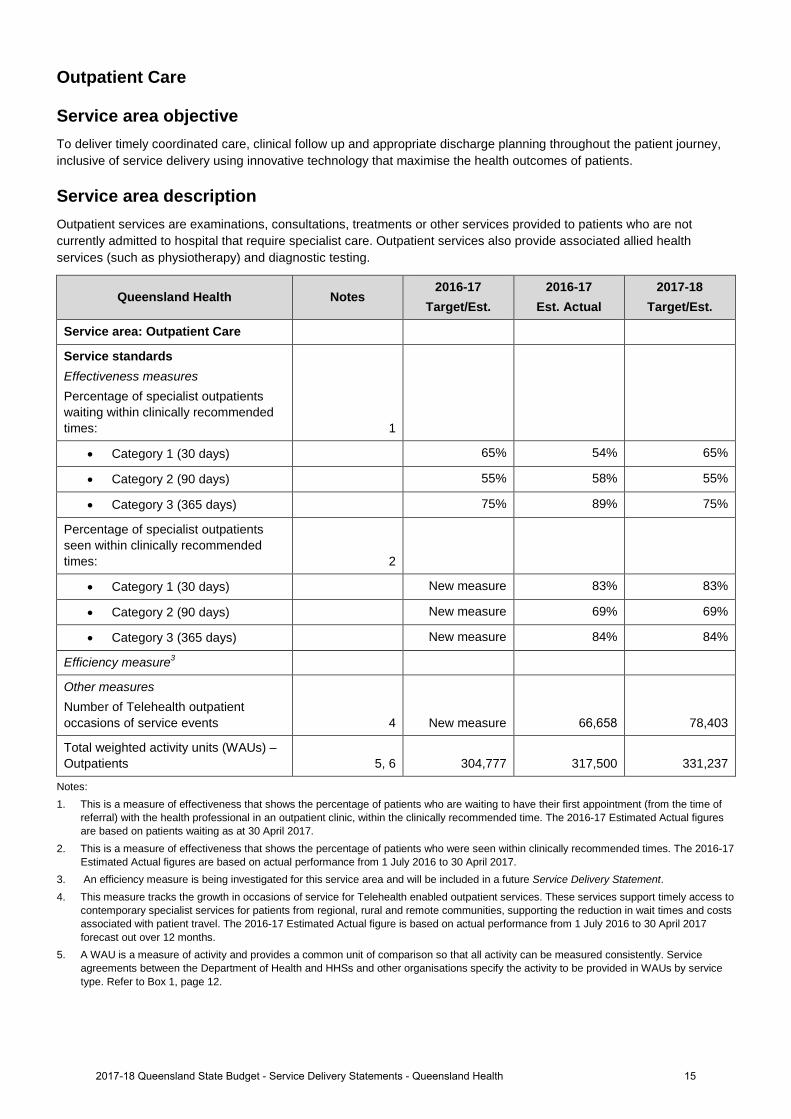
Outpatient Care
Service area objective To deliver timely coordinated care, clinical follow up and appropriate discharge planning throughout the patient journey, inclusive of service delivery using innovative technology that maximise the health outcomes of patients.
Service area description Outpatient services are examinations, consultations, treatments or other services provided to patients who are not currently admitted to hospital that require specialist care. Outpatient services also provide associated allied health services (such as physiotherapy) and diagnostic testing.
Queensland Health Notes 2016-17
Target/Est. 2016-17
Est. Actual 2017-18
Target/Est.
Service area: Outpatient Care
Service standards Effectiveness measures Percentage of specialist outpatients waiting within clinically recommended times: 1
• Category 1 (30 days) 65% 54% 65%
• Category 2 (90 days) 55% 58% 55%
• Category 3 (365 days) 75% 89% 75%
Percentage of specialist outpatients seen within clinically recommended times: 2
• Category 1 (30 days) New measure 83% 83%
• Category 2 (90 days) New measure 69% 69%
• Category 3 (365 days) New measure 84% 84%
Efficiency measure3
Other measures Number of Telehealth outpatient occasions of service events 4 New measure 66,658 78,403
Total weighted activity units (WAUs) – Outpatients 5, 6 304,777 317,500 331,237
Notes: 1. This is a measure of effectiveness that shows the percentage of patients who are waiting to have their first appointment (from the time of
referral) with the health professional in an outpatient clinic, within the clinically recommended time. The 2016-17 Estimated Actual figures are based on patients waiting as at 30 April 2017.
2. This is a measure of effectiveness that shows the percentage of patients who were seen within clinically recommended times. The 2016-17Estimated Actual figures are based on actual performance from 1 July 2016 to 30 April 2017.
3. An efficiency measure is being investigated for this service area and will be included in a future Service Delivery Statement.4. This measure tracks the growth in occasions of service for Telehealth enabled outpatient services. These services support timely access to
contemporary specialist services for patients from regional, rural and remote communities, supporting the reduction in wait times and costsassociated with patient travel. The 2016-17 Estimated Actual figure is based on actual performance from 1 July 2016 to 30 April 2017forecast out over 12 months.
5. A WAU is a measure of activity and provides a common unit of comparison so that all activity can be measured consistently. Serviceagreements between the Department of Health and HHSs and other organisations specify the activity to be provided in WAUs by servicetype. Refer to Box 1, page 12.
152017-18 Queensland State Budget - Service Delivery Statements - Queensland Health
6. The 2016-17 Estimated Actual figures are based on 2016-17 Queensland WAU forecasts as provided by HHSs. 2017-18 Target/Estimate figures are based on the 2017-18 Final Round Service Agreements Contract Offers. All activity is reported in the same phase - Activity Based Funding (ABF) model Q19. This service standard has been updated to include ‘Total WAUs – Interventions and Procedures’ previously reported in the Prevention, Primary and Community Care Service Area.
162017-18 Queensland State Budget - Service Delivery Statements - Queensland Health
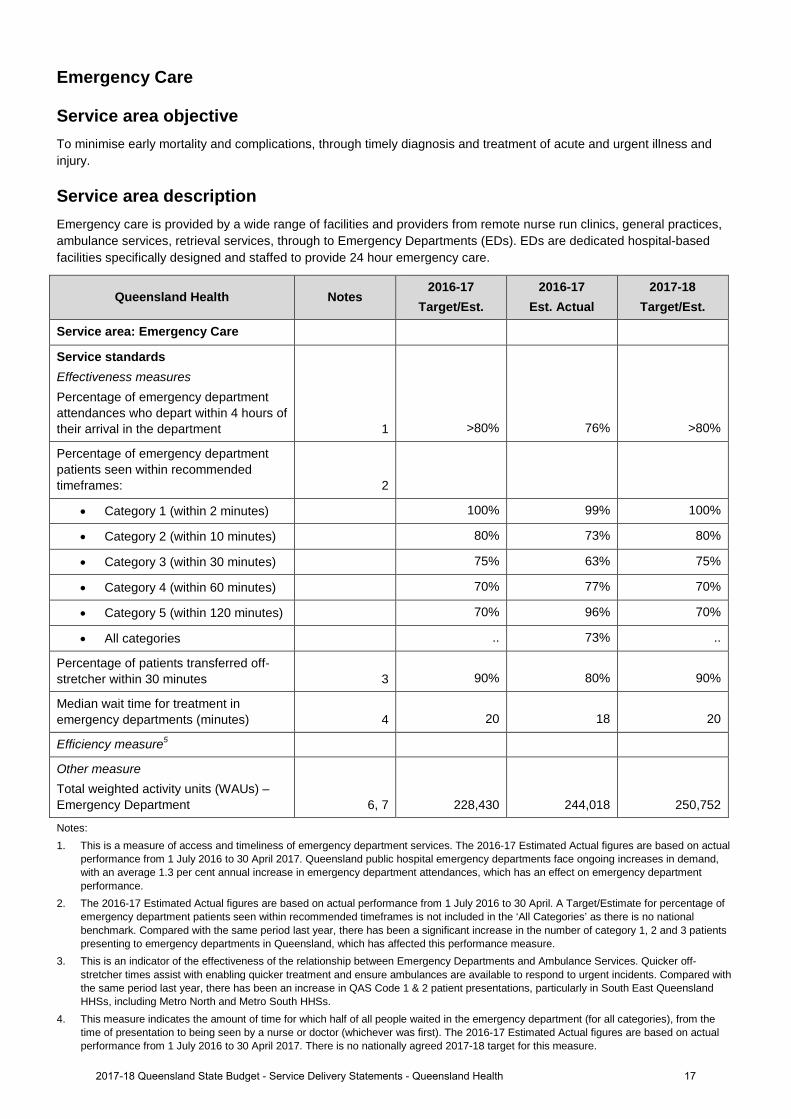
Emergency Care
Service area objective To minimise early mortality and complications, through timely diagnosis and treatment of acute and urgent illness and injury.
Service area description Emergency care is provided by a wide range of facilities and providers from remote nurse run clinics, general practices, ambulance services, retrieval services, through to Emergency Departments (EDs). EDs are dedicated hospital-based facilities specifically designed and staffed to provide 24 hour emergency care.
Queensland Health Notes 2016-17
Target/Est. 2016-17
Est. Actual 2017-18
Target/Est.
Service area: Emergency Care
Service standards Effectiveness measures Percentage of emergency department attendances who depart within 4 hours of their arrival in the department 1 >80% 76% >80%
Percentage of emergency department patients seen within recommended timeframes: 2
• Category 1 (within 2 minutes) 100% 99% 100%
• Category 2 (within 10 minutes) 80% 73% 80%
• Category 3 (within 30 minutes) 75% 63% 75%
• Category 4 (within 60 minutes) 70% 77% 70%
• Category 5 (within 120 minutes) 70% 96% 70%
• All categories .. 73% ..
Percentage of patients transferred off-stretcher within 30 minutes 3 90% 80% 90%
Median wait time for treatment in emergency departments (minutes) 4 20 18 20
Efficiency measure5
Other measure Total weighted activity units (WAUs) – Emergency Department 6, 7 228,430 244,018 250,752
Notes: 1. This is a measure of access and timeliness of emergency department services. The 2016-17 Estimated Actual figures are based on actual
performance from 1 July 2016 to 30 April 2017. Queensland public hospital emergency departments face ongoing increases in demand, with an average 1.3 per cent annual increase in emergency department attendances, which has an effect on emergency department performance.
2. The 2016-17 Estimated Actual figures are based on actual performance from 1 July 2016 to 30 April. A Target/Estimate for percentage of emergency department patients seen within recommended timeframes is not included in the ‘All Categories’ as there is no national benchmark. Compared with the same period last year, there has been a significant increase in the number of category 1, 2 and 3 patients presenting to emergency departments in Queensland, which has affected this performance measure.
3. This is an indicator of the effectiveness of the relationship between Emergency Departments and Ambulance Services. Quicker off-stretcher times assist with enabling quicker treatment and ensure ambulances are available to respond to urgent incidents. Compared with the same period last year, there has been an increase in QAS Code 1 & 2 patient presentations, particularly in South East Queensland HHSs, including Metro North and Metro South HHSs.
4. This measure indicates the amount of time for which half of all people waited in the emergency department (for all categories), from the time of presentation to being seen by a nurse or doctor (whichever was first). The 2016-17 Estimated Actual figures are based on actual performance from 1 July 2016 to 30 April 2017. There is no nationally agreed 2017-18 target for this measure.
172017-18 Queensland State Budget - Service Delivery Statements - Queensland Health
5. An efficiency measure is being investigated for this service area and will be included in a future Service Delivery Statement. 6. The 2016-17 Estimated Actual figures are based on 2016-17 Queensland WAU forecasts. 2017-18 Target/Estimate figures are based on
the 2017-18 Final Round Service Agreements Contract Offers. All activity is reported in the same phase - Activity Based Funding (ABF) model Q19.
7. A WAU is a measure of activity and provides a common unit of comparison so that all activity can be measured consistently. Service agreements between the Department of Health and HHSs and other organisations specify the activity to be provided in WAUs by service type. Refer to Box 1, page 12.
182017-18 Queensland State Budget - Service Delivery Statements - Queensland Health
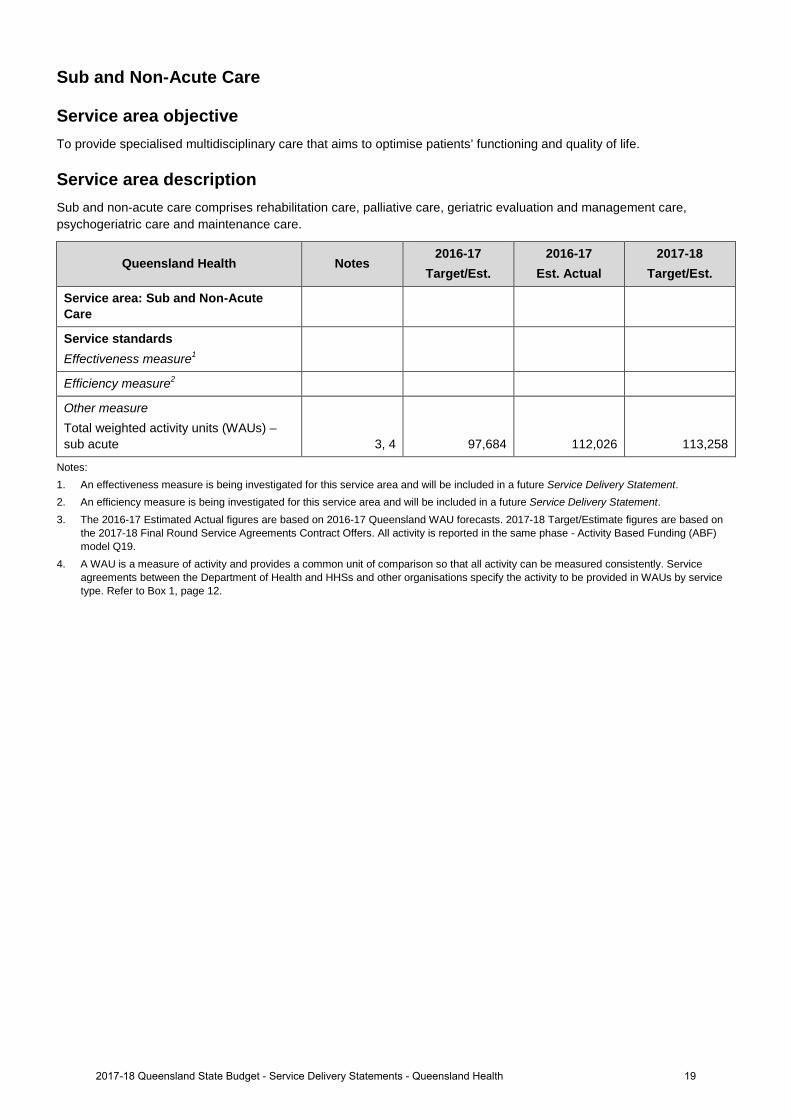
Sub and Non-Acute Care
Service area objective To provide specialised multidisciplinary care that aims to optimise patients’ functioning and quality of life.
Service area description Sub and non-acute care comprises rehabilitation care, palliative care, geriatric evaluation and management care, psychogeriatric care and maintenance care.
Queensland Health Notes 2016-17
Target/Est. 2016-17
Est. Actual 2017-18
Target/Est.
Service area: Sub and Non-Acute Care
Service standards Effectiveness measure1
Efficiency measure2
Other measure Total weighted activity units (WAUs) – sub acute 3, 4 97,684 112,026 113,258
Notes: 1. An effectiveness measure is being investigated for this service area and will be included in a future Service Delivery Statement. 2. An efficiency measure is being investigated for this service area and will be included in a future Service Delivery Statement. 3. The 2016-17 Estimated Actual figures are based on 2016-17 Queensland WAU forecasts. 2017-18 Target/Estimate figures are based on
the 2017-18 Final Round Service Agreements Contract Offers. All activity is reported in the same phase - Activity Based Funding (ABF) model Q19.
4. A WAU is a measure of activity and provides a common unit of comparison so that all activity can be measured consistently. Service agreements between the Department of Health and HHSs and other organisations specify the activity to be provided in WAUs by service type. Refer to Box 1, page 12.
192017-18 Queensland State Budget - Service Delivery Statements - Queensland Health
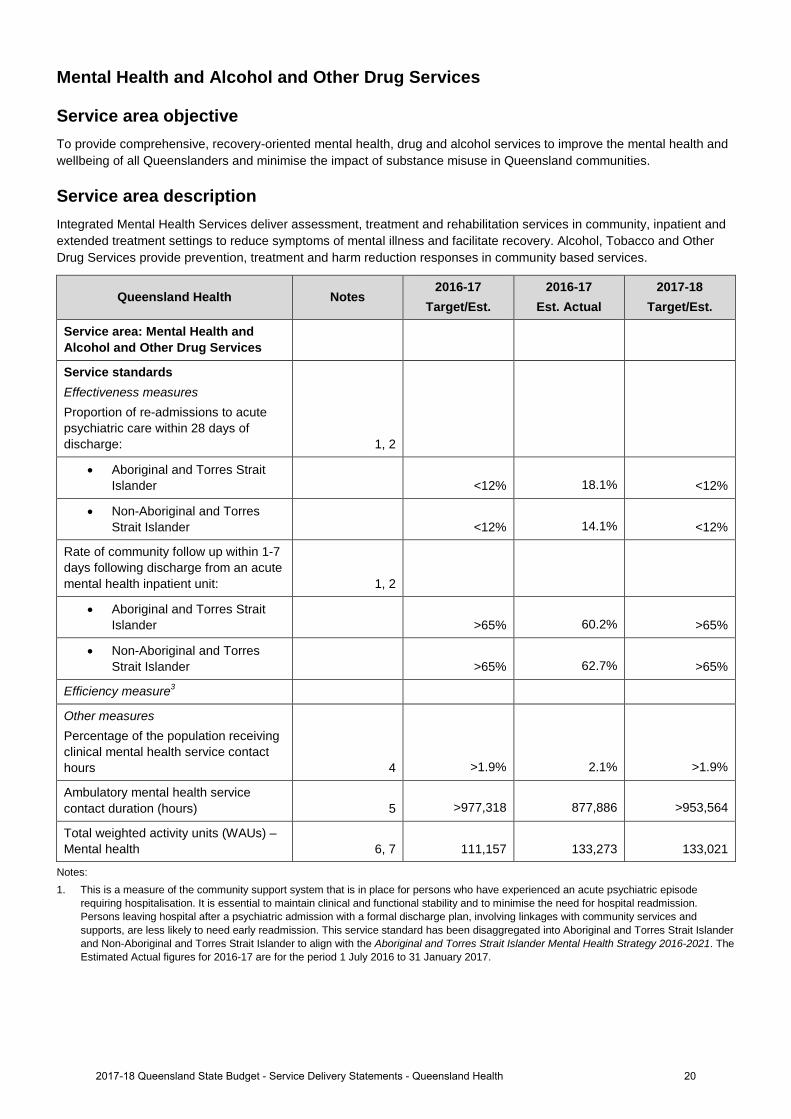
Mental Health and Alcohol and Other Drug Services
Service area objective To provide comprehensive, recovery-oriented mental health, drug and alcohol services to improve the mental health and wellbeing of all Queenslanders and minimise the impact of substance misuse in Queensland communities.
Service area description Integrated Mental Health Services deliver assessment, treatment and rehabilitation services in community, inpatient and extended treatment settings to reduce symptoms of mental illness and facilitate recovery. Alcohol, Tobacco and Other Drug Services provide prevention, treatment and harm reduction responses in community based services.
Queensland Health Notes 2016-17
Target/Est. 2016-17
Est. Actual 2017-18
Target/Est.
Service area: Mental Health and Alcohol and Other Drug Services
Service standards Effectiveness measures Proportion of re-admissions to acute psychiatric care within 28 days of discharge: 1, 2
• Aboriginal and Torres Strait Islander <12% 18.1% <12%
• Non-Aboriginal and Torres Strait Islander <12% 14.1% <12%
Rate of community follow up within 1-7 days following discharge from an acute mental health inpatient unit: 1, 2
• Aboriginal and Torres Strait Islander >65% 60.2% >65%
• Non-Aboriginal and Torres Strait Islander >65% 62.7% >65%
Efficiency measure3
Other measures Percentage of the population receiving clinical mental health service contact hours 4 >1.9% 2.1% >1.9%
Ambulatory mental health service contact duration (hours) 5 >977,318 877,886 >953,564
Total weighted activity units (WAUs) – Mental health 6, 7 111,157 133,273 133,021
Notes: 1. This is a measure of the community support system that is in place for persons who have experienced an acute psychiatric episode
requiring hospitalisation. It is essential to maintain clinical and functional stability and to minimise the need for hospital readmission. Persons leaving hospital after a psychiatric admission with a formal discharge plan, involving linkages with community services and supports, are less likely to need early readmission. This service standard has been disaggregated into Aboriginal and Torres Strait Islander and Non-Aboriginal and Torres Strait Islander to align with the Aboriginal and Torres Strait Islander Mental Health Strategy 2016-2021. The Estimated Actual figures for 2016-17 are for the period 1 July 2016 to 31 January 2017.
202017-18 Queensland State Budget - Service Delivery Statements - Queensland Health
2. Queensland has made significant progress in improving the rate of community follow up over the past five years. Increased pressure on community and inpatient mental health services has seen increases in readmission rates and is impacting the rate of community follow up. Previous analysis has shown similar rates of follow up for both Indigenous and non-Indigenous Queenslander’s are evident, but trends are impacted on by smaller number of separations for Indigenous Queenslanders.
3. An efficiency measure is being investigated for this service area and will be included in a future Service Delivery Statement. 4. This measure provides a mechanism for monitoring population treatment rates and assessing these against what is known about
distribution of mental disorder in the community. It is the proportion of the Queensland population accessing a public mental health service over the estimated Queensland population for 2017. The Estimated Actuals for 2016-17 are for the period 1 July 2016 to 31 March 2017.
5. This measure counts the number of in-scope service contact hours attributable to each HHS, based on the national definition and calculation of service contacts and duration. The Estimated Actuals for 2016-17 are for the period 1 July 2016 to 31 March 2017. It is important to note that not all activity of ambulatory clinicians is in-scope for this measure, with most review and some service coordination activities excluded. In addition, improvements in data quality have contributed to the result, with the data more accurately reflecting way in which services are delivered. The Target/Estimate for this measure is determined using a standard formula based upon available clinical staffing, HHS rurality, and historical performance. The target for this measure is calculated by the Department of Health to ensure consistency across the state.
6. A WAU is a measure of activity and provides a common unit of comparison so that all activity can be measured consistently. Service agreements between the Department of Health and HHSs and other organisations specify the activity to be provided in WAUs by service type. Refer to Box 1, page 12.
7. The 2016-17 Estimated Actual figures are based on 2016-17 Queensland WAU forecasts. 2017-18 Target/Estimate figures are based on the 2017-18 Final Round Service Agreements Contract Offers. All activity is reported in the same phase - Activity Based Funding (ABF) model Q19. 2016-17 mental health Estimated Actuals are higher than the 2017-18 Target/Estimate due to the discharge of long stay patients from Non-ABF mental health facilities. This Queensland WAU, whilst funded, has not been built into the 2017-18 Service Agreements as the pattern of patient discharges from these facilities varies considerably from year to year.
212017-18 Queensland State Budget - Service Delivery Statements - Queensland Health
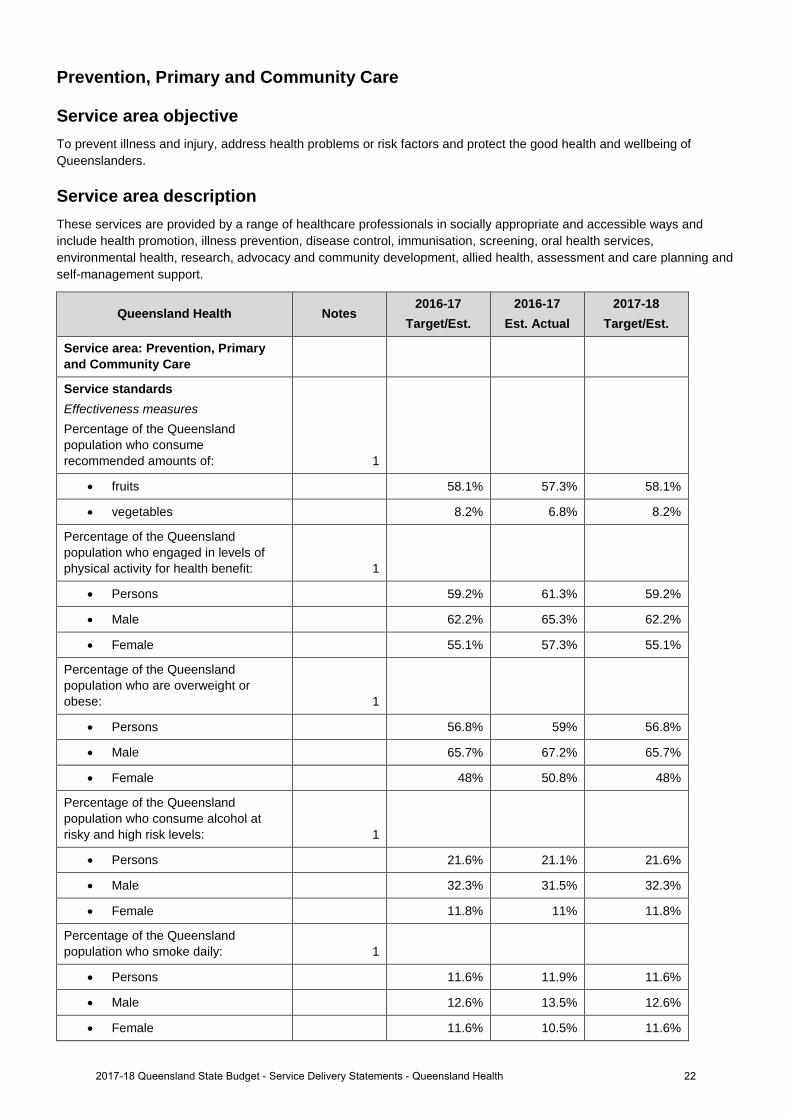
Prevention, Primary and Community Care
Service area objective To prevent illness and injury, address health problems or risk factors and protect the good health and wellbeing of Queenslanders.
Service area description These services are provided by a range of healthcare professionals in socially appropriate and accessible ways and include health promotion, illness prevention, disease control, immunisation, screening, oral health services, environmental health, research, advocacy and community development, allied health, assessment and care planning and self-management support.
Queensland Health Notes 2016-17
Target/Est. 2016-17
Est. Actual 2017-18
Target/Est.
Service area: Prevention, Primary and Community Care
Service standards Effectiveness measures Percentage of the Queensland population who consume recommended amounts of: 1
• fruits 58.1% 57.3% 58.1%
• vegetables 8.2% 6.8% 8.2%
Percentage of the Queensland population who engaged in levels of physical activity for health benefit: 1
• Persons 59.2% 61.3% 59.2%
• Male 62.2% 65.3% 62.2%
• Female 55.1% 57.3% 55.1%
Percentage of the Queensland population who are overweight or obese: 1
• Persons 56.8% 59% 56.8%
• Male 65.7% 67.2% 65.7%
• Female 48% 50.8% 48%
Percentage of the Queensland population who consume alcohol at risky and high risk levels: 1
• Persons 21.6% 21.1% 21.6%
• Male 32.3% 31.5% 32.3%
• Female 11.8% 11% 11.8%
Percentage of the Queensland population who smoke daily: 1
• Persons 11.6% 11.9% 11.6%
• Male 12.6% 13.5% 12.6%
• Female 11.6% 10.5% 11.6%
222017-18 Queensland State Budget - Service Delivery Statements - Queensland Health
Queensland Health Notes 2016-17
Target/Est. 2016-17
Est. Actual 2017-18
Target/Est.
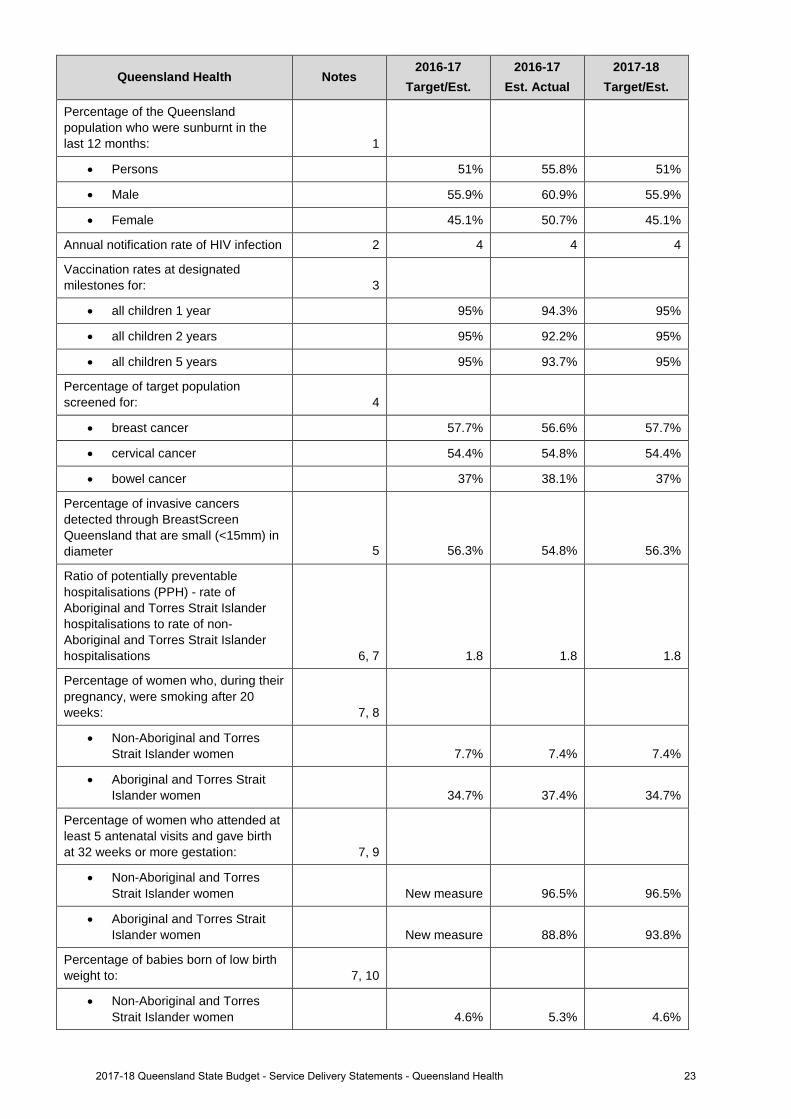
Percentage of the Queensland population who were sunburnt in the last 12 months: 1
• Persons 51% 55.8% 51%
• Male 55.9% 60.9% 55.9%
• Female 45.1% 50.7% 45.1%
Annual notification rate of HIV infection 2 4 4 4
Vaccination rates at designated milestones for: 3
• all children 1 year 95% 94.3% 95%
• all children 2 years 95% 92.2% 95%
• all children 5 years 95% 93.7% 95%
Percentage of target population screened for: 4
• breast cancer 57.7% 56.6% 57.7%
• cervical cancer 54.4% 54.8% 54.4%
• bowel cancer 37% 38.1% 37%
Percentage of invasive cancers detected through BreastScreen Queensland that are small (<15mm) in diameter 5 56.3% 54.8% 56.3%
Ratio of potentially preventable hospitalisations (PPH) - rate of Aboriginal and Torres Strait Islander hospitalisations to rate of non-Aboriginal and Torres Strait Islander hospitalisations 6, 7 1.8 1.8 1.8
Percentage of women who, during their pregnancy, were smoking after 20 weeks: 7, 8
• Non-Aboriginal and Torres Strait Islander women 7.7% 7.4% 7.4%
• Aboriginal and Torres Strait Islander women 34.7% 37.4% 34.7%
Percentage of women who attended at least 5 antenatal visits and gave birth at 32 weeks or more gestation: 7, 9
• Non-Aboriginal and Torres Strait Islander women New measure 96.5% 96.5%
• Aboriginal and Torres Strait Islander women New measure 88.8% 93.8%
Percentage of babies born of low birth weight to: 7, 10
• Non-Aboriginal and Torres Strait Islander women 4.6% 5.3% 4.6%
232017-18 Queensland State Budget - Service Delivery Statements - Queensland Health
Queensland Health Notes 2016-17
Target/Est. 2016-17
Est. Actual 2017-18
Target/Est.
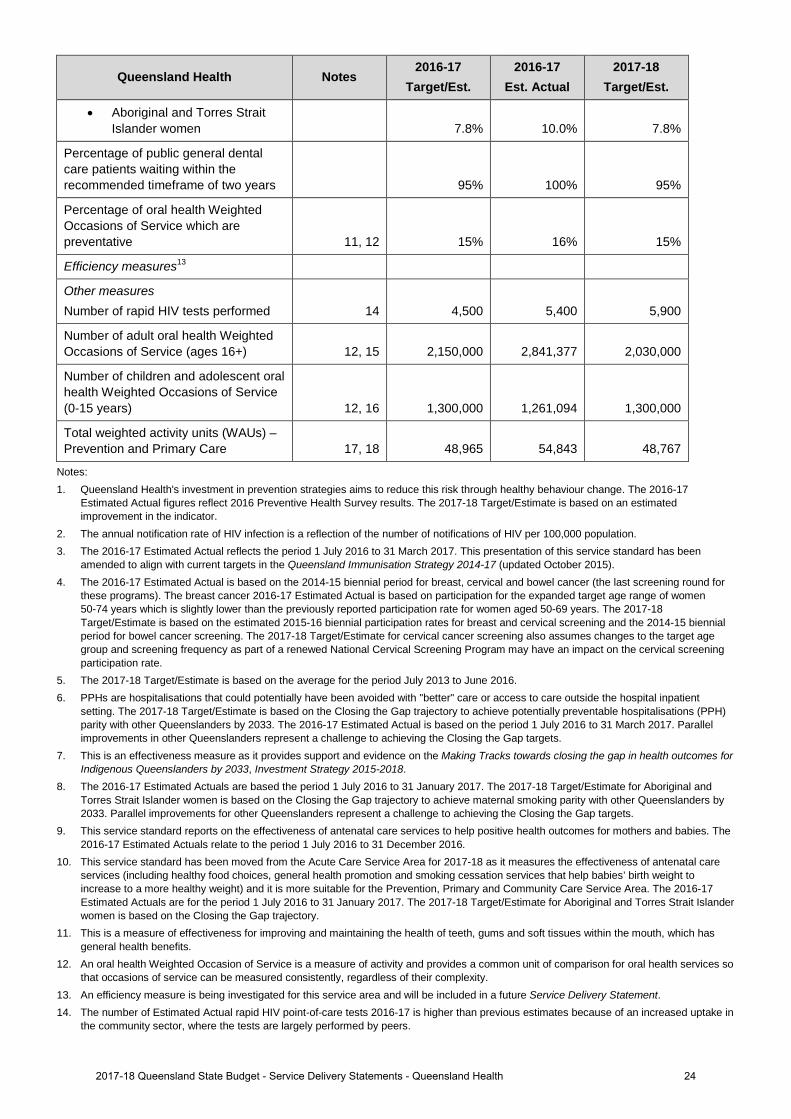
• Aboriginal and Torres Strait Islander women 7.8% 10.0% 7.8%
Percentage of public general dental care patients waiting within the recommended timeframe of two years 95% 100% 95%
Percentage of oral health Weighted Occasions of Service which are preventative 11, 12 15% 16% 15%
Efficiency measures13
Other measures Number of rapid HIV tests performed 14 4,500 5,400 5,900
Number of adult oral health Weighted Occasions of Service (ages 16+) 12, 15 2,150,000 2,841,377 2,030,000
Number of children and adolescent oral health Weighted Occasions of Service (0-15 years) 12, 16 1,300,000 1,261,094 1,300,000
Total weighted activity units (WAUs) – Prevention and Primary Care 17, 18 48,965 54,843 48,767
Notes: 1. Queensland Health's investment in prevention strategies aims to reduce this risk through healthy behaviour change. The 2016-17
Estimated Actual figures reflect 2016 Preventive Health Survey results. The 2017-18 Target/Estimate is based on an estimated improvement in the indicator.
2. The annual notification rate of HIV infection is a reflection of the number of notifications of HIV per 100,000 population. 3. The 2016-17 Estimated Actual reflects the period 1 July 2016 to 31 March 2017. This presentation of this service standard has been
amended to align with current targets in the Queensland Immunisation Strategy 2014-17 (updated October 2015). 4. The 2016-17 Estimated Actual is based on the 2014-15 biennial period for breast, cervical and bowel cancer (the last screening round for
these programs). The breast cancer 2016-17 Estimated Actual is based on participation for the expanded target age range of women 50-74 years which is slightly lower than the previously reported participation rate for women aged 50-69 years. The 2017-18 Target/Estimate is based on the estimated 2015-16 biennial participation rates for breast and cervical screening and the 2014-15 biennial period for bowel cancer screening. The 2017-18 Target/Estimate for cervical cancer screening also assumes changes to the target age group and screening frequency as part of a renewed National Cervical Screening Program may have an impact on the cervical screening participation rate.
5. The 2017-18 Target/Estimate is based on the average for the period July 2013 to June 2016. 6. PPHs are hospitalisations that could potentially have been avoided with "better" care or access to care outside the hospital inpatient
setting. The 2017-18 Target/Estimate is based on the Closing the Gap trajectory to achieve potentially preventable hospitalisations (PPH) parity with other Queenslanders by 2033. The 2016-17 Estimated Actual is based on the period 1 July 2016 to 31 March 2017. Parallel improvements in other Queenslanders represent a challenge to achieving the Closing the Gap targets.
7. This is an effectiveness measure as it provides support and evidence on the Making Tracks towards closing the gap in health outcomes for Indigenous Queenslanders by 2033, Investment Strategy 2015-2018.
8. The 2016-17 Estimated Actuals are based the period 1 July 2016 to 31 January 2017. The 2017-18 Target/Estimate for Aboriginal and Torres Strait Islander women is based on the Closing the Gap trajectory to achieve maternal smoking parity with other Queenslanders by 2033. Parallel improvements for other Queenslanders represent a challenge to achieving the Closing the Gap targets.
9. This service standard reports on the effectiveness of antenatal care services to help positive health outcomes for mothers and babies. The 2016-17 Estimated Actuals relate to the period 1 July 2016 to 31 December 2016.
10. This service standard has been moved from the Acute Care Service Area for 2017-18 as it measures the effectiveness of antenatal care services (including healthy food choices, general health promotion and smoking cessation services that help babies’ birth weight to increase to a more healthy weight) and it is more suitable for the Prevention, Primary and Community Care Service Area. The 2016-17 Estimated Actuals are for the period 1 July 2016 to 31 January 2017. The 2017-18 Target/Estimate for Aboriginal and Torres Strait Islander women is based on the Closing the Gap trajectory.
11. This is a measure of effectiveness for improving and maintaining the health of teeth, gums and soft tissues within the mouth, which has general health benefits.
12. An oral health Weighted Occasion of Service is a measure of activity and provides a common unit of comparison for oral health services so that occasions of service can be measured consistently, regardless of their complexity.
13. An efficiency measure is being investigated for this service area and will be included in a future Service Delivery Statement. 14. The number of Estimated Actual rapid HIV point-of-care tests 2016-17 is higher than previous estimates because of an increased uptake in
the community sector, where the tests are largely performed by peers.
242017-18 Queensland State Budget - Service Delivery Statements - Queensland Health
15. The 2016-17 Estimated Actual is over target due to additional investments in 2016-17 anticipated under the new National Partnership Agreement (NPA) funding together with Metro North-University of Queensland Oral Health Centre (UQ OHC) and Medicare payments claimed directly by HHSs under the Child Dental Benefits Schedule (CDBS). The 2017-18 Target/Estimate includes State base funding and Metro North UQ OHC, but excludes investments associated with the new NPA (which is not yet signed) and any funding claimed under CDBS.
16. The 2016-17 Estimated Actual is below target in part due to the Medicare CDBS which has reduced demand for child and adolescent oral health services by allowing eligible children to receive free basic dental treatment at private dentists.
17. A WAU is a measure of activity and provides a common unit of comparison so that all activity can be measured consistently. Service agreements between the Department of Health and HHSs and other organisations specify the activity to be provided in WAUs by service type. Refer to Box 1, page 12.
18. The 2016-17 Estimated Actual figures are based on 2016-17 Queensland WAU forecasts. 2017-18 Target/Estimate figures are based on the 2017-18 Final Round Service Agreements Contract Offers. All activity is reported in the same phase - Activity Based Funding (ABF) model Q19. ‘Total WAUs – Interventions and procedures’ is no longer reported in this Service Area. These WAUs have been reallocated to Acute Inpatient Care and Outpatient Care Services Areas. ‘Total WAUs - Prevention and Primary Care’ is comprised of BreastScreen and Dental WAUs. ‘Total WAUS - Prevention and Primary Care’ is a new measure for the Service Delivery Statement, however, it has been included in the HHS Service Agreements since 2016-17. Purchased Queensland WAUs in 2017-18 are lower than 2016-17 Estimated Actuals due to one off investments in Oral Health in 2016-17 and NPA funding not yet allocated.
252017-18 Queensland State Budget - Service Delivery Statements - Queensland Health
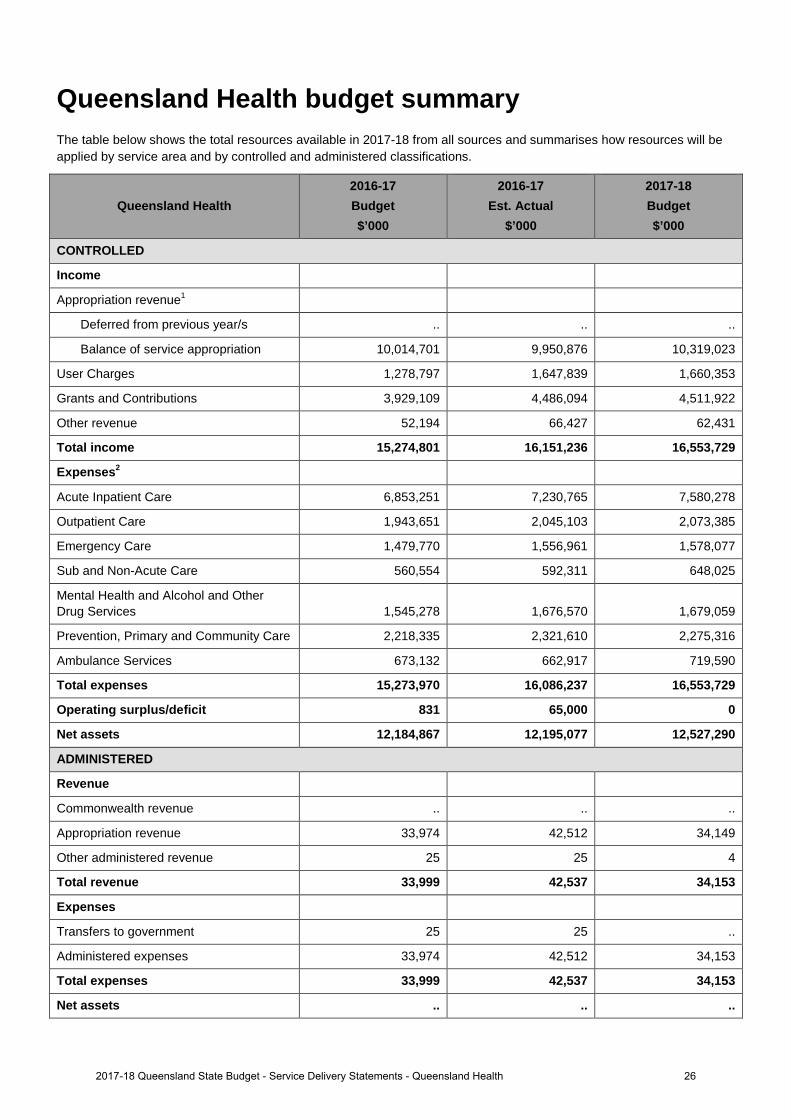
Queensland Health budget summary The table below shows the total resources available in 2017-18 from all sources and summarises how resources will be applied by service area and by controlled and administered classifications.
Queensland Health 2016-17 Budget $’000
2016-17 Est. Actual
$’000
2017-18 Budget $’000
CONTROLLED
Income
Appropriation revenue1
Deferred from previous year/s .. .. ..
Balance of service appropriation 10,014,701 9,950,876 10,319,023
User Charges 1,278,797 1,647,839 1,660,353
Grants and Contributions 3,929,109 4,486,094 4,511,922
Other revenue 52,194 66,427 62,431
Total income 15,274,801 16,151,236 16,553,729
Expenses2
Acute Inpatient Care 6,853,251 7,230,765 7,580,278
Outpatient Care 1,943,651 2,045,103 2,073,385
Emergency Care 1,479,770 1,556,961 1,578,077
Sub and Non-Acute Care 560,554 592,311 648,025
Mental Health and Alcohol and Other Drug Services 1,545,278 1,676,570 1,679,059
Prevention, Primary and Community Care 2,218,335 2,321,610 2,275,316
Ambulance Services 673,132 662,917 719,590
Total expenses 15,273,970 16,086,237 16,553,729
Operating surplus/deficit 831 65,000 0
Net assets 12,184,867 12,195,077 12,527,290
ADMINISTERED
Revenue
Commonwealth revenue .. .. ..
Appropriation revenue 33,974 42,512 34,149
Other administered revenue 25 25 4
Total revenue 33,999 42,537 34,153
Expenses
Transfers to government 25 25 ..
Administered expenses 33,974 42,512 34,153
Total expenses 33,999 42,537 34,153
Net assets .. .. ..
262017-18 Queensland State Budget - Service Delivery Statements - Queensland Health
Notes: 1. Includes State and Commonwealth funding. 2. The 2016-17 Budget expenses categories have been restated to account for a change in treatment of the Ambulance Services line.
Previously the revenue and costs for internal transactions between the Department of Health and Queensland Ambulance Service were eliminated upon consolidation. These have now been restated to reflect the cost prior to consolidation. Total expenditure remains unchanged.
272017-18 Queensland State Budget - Service Delivery Statements - Queensland Health
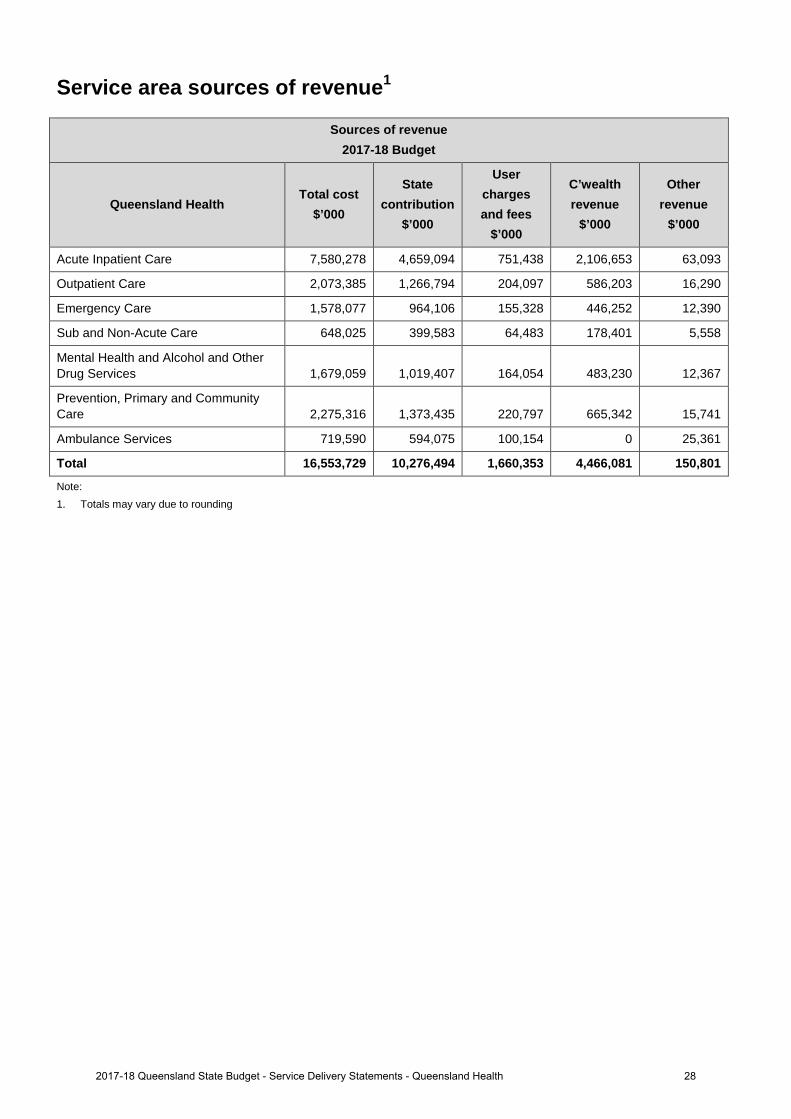
Service area sources of revenue1
Sources of revenue 2017-18 Budget
Queensland Health Total cost
$’000
State contribution
$’000
User charges and fees
$’000
C’wealth revenue
$’000
Other revenue
$’000
Acute Inpatient Care 7,580,278 4,659,094 751,438 2,106,653 63,093
Outpatient Care 2,073,385 1,266,794 204,097 586,203 16,290
Emergency Care 1,578,077 964,106 155,328 446,252 12,390
Sub and Non-Acute Care 648,025 399,583 64,483 178,401 5,558
Mental Health and Alcohol and Other Drug Services 1,679,059 1,019,407 164,054 483,230 12,367
Prevention, Primary and Community Care 2,275,316 1,373,435 220,797 665,342 15,741
Ambulance Services 719,590 594,075 100,154 0 25,361
Total 16,553,729 10,276,494 1,660,353 4,466,081 150,801
Note: 1. Totals may vary due to rounding
282017-18 Queensland State Budget - Service Delivery Statements - Queensland Health
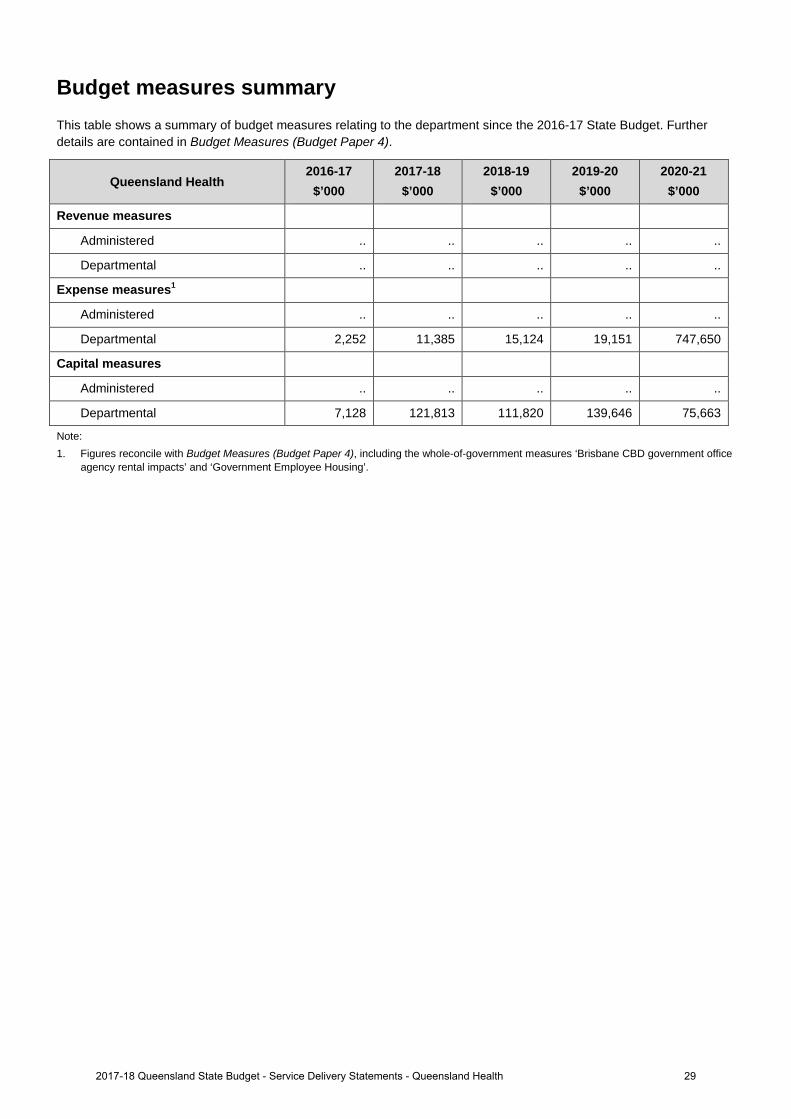
Budget measures summary This table shows a summary of budget measures relating to the department since the 2016-17 State Budget. Further details are contained in Budget Measures (Budget Paper 4).
Queensland Health 2016-17
$’000 2017-18
$’000 2018-19
$’000 2019-20
$’000 2020-21
$’000
Revenue measures
Administered .. .. .. .. ..
Departmental .. .. .. .. ..
Expense measures1
Administered .. .. .. .. ..
Departmental 2,252 11,385 15,124 19,151 747,650
Capital measures
Administered .. .. .. .. ..
Departmental 7,128 121,813 111,820 139,646 75,663
Note: 1. Figures reconcile with Budget Measures (Budget Paper 4), including the whole-of-government measures ‘Brisbane CBD government office
agency rental impacts’ and ‘Government Employee Housing’.
292017-18 Queensland State Budget - Service Delivery Statements - Queensland Health
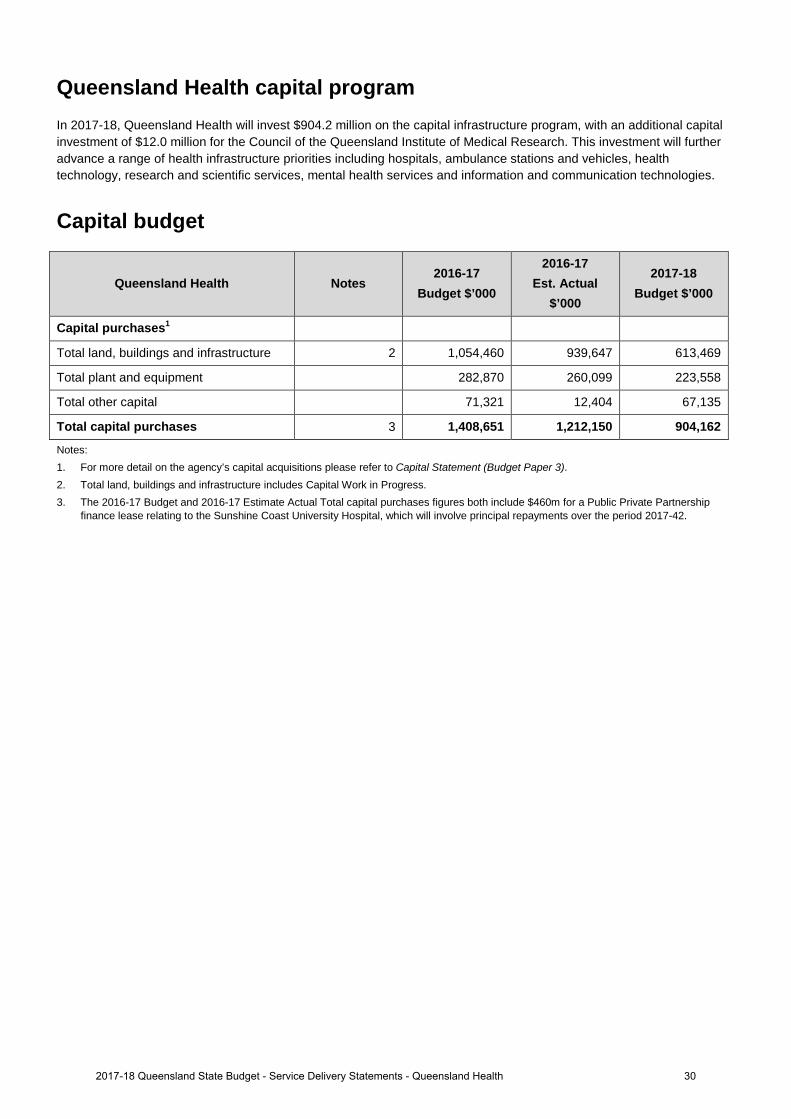
Queensland Health capital program In 2017-18, Queensland Health will invest $904.2 million on the capital infrastructure program, with an additional capital investment of $12.0 million for the Council of the Queensland Institute of Medical Research. This investment will further advance a range of health infrastructure priorities including hospitals, ambulance stations and vehicles, health technology, research and scientific services, mental health services and information and communication technologies.
Capital budget
Queensland Health Notes 2016-17
Budget $’000
2016-17 Est. Actual
$’000
2017-18 Budget $’000
Capital purchases1
Total land, buildings and infrastructure 2 1,054,460 939,647 613,469
Total plant and equipment 282,870 260,099 223,558
Total other capital 71,321 12,404 67,135
Total capital purchases 3 1,408,651 1,212,150 904,162
Notes: 1. For more detail on the agency’s capital acquisitions please refer to Capital Statement (Budget Paper 3). 2. Total land, buildings and infrastructure includes Capital Work in Progress. 3. The 2016-17 Budget and 2016-17 Estimate Actual Total capital purchases figures both include $460m for a Public Private Partnership
finance lease relating to the Sunshine Coast University Hospital, which will involve principal repayments over the period 2017-42.
302017-18 Queensland State Budget - Service Delivery Statements - Queensland Health
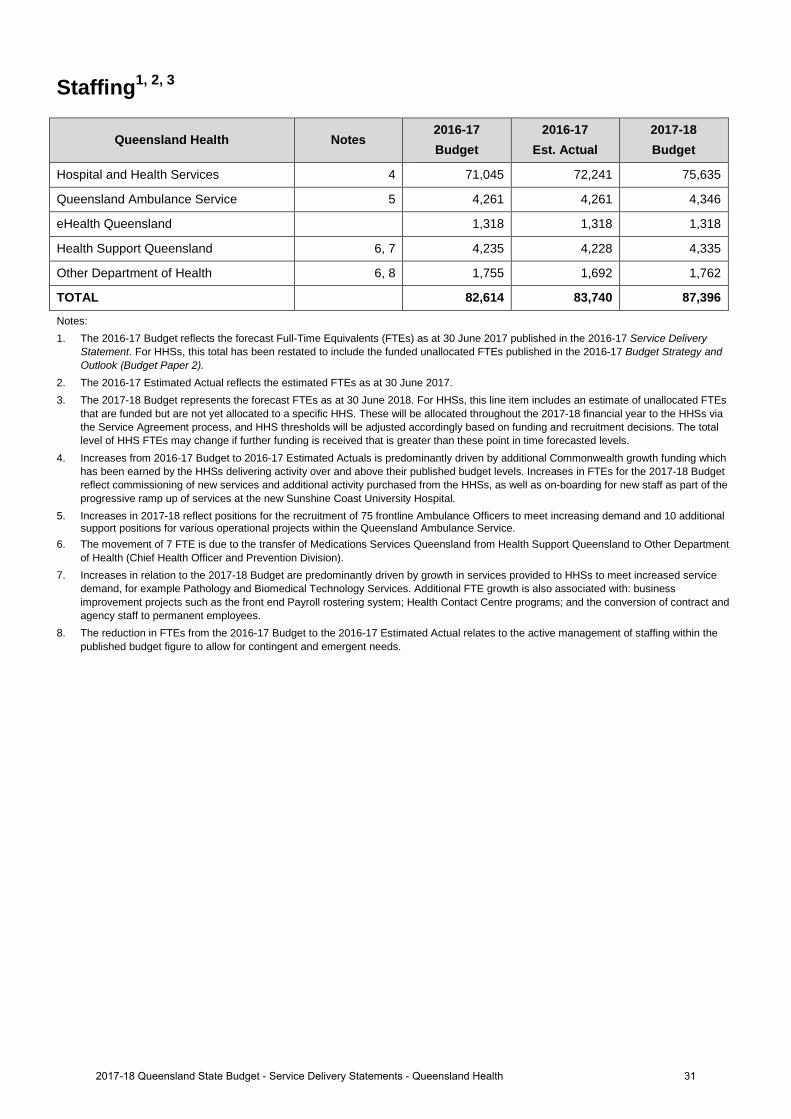
Staffing1, 2, 3
Queensland Health Notes 2016-17 Budget
2016-17 Est. Actual
2017-18 Budget
Hospital and Health Services 4 71,045 72,241 75,635
Queensland Ambulance Service 5 4,261 4,261 4,346
eHealth Queensland 1,318 1,318 1,318
Health Support Queensland 6, 7 4,235 4,228 4,335
Other Department of Health 6, 8 1,755 1,692 1,762
TOTAL 82,614 83,740 87,396
Notes: 1. The 2016-17 Budget reflects the forecast Full-Time Equivalents (FTEs) as at 30 June 2017 published in the 2016-17 Service Delivery
Statement. For HHSs, this total has been restated to include the funded unallocated FTEs published in the 2016-17 Budget Strategy and Outlook (Budget Paper 2).
2. The 2016-17 Estimated Actual reflects the estimated FTEs as at 30 June 2017.3. The 2017-18 Budget represents the forecast FTEs as at 30 June 2018. For HHSs, this line item includes an estimate of unallocated FTEs
that are funded but are not yet allocated to a specific HHS. These will be allocated throughout the 2017-18 financial year to the HHSs viathe Service Agreement process, and HHS thresholds will be adjusted accordingly based on funding and recruitment decisions. The totallevel of HHS FTEs may change if further funding is received that is greater than these point in time forecasted levels.
4. Increases from 2016-17 Budget to 2016-17 Estimated Actuals is predominantly driven by additional Commonwealth growth funding whichhas been earned by the HHSs delivering activity over and above their published budget levels. Increases in FTEs for the 2017-18 Budgetreflect commissioning of new services and additional activity purchased from the HHSs, as well as on-boarding for new staff as part of theprogressive ramp up of services at the new Sunshine Coast University Hospital.
5. Increases in 2017-18 reflect positions for the recruitment of 75 frontline Ambulance Officers to meet increasing demand and 10 additionalsupport positions for various operational projects within the Queensland Ambulance Service.
6. The movement of 7 FTE is due to the transfer of Medications Services Queensland from Health Support Queensland to Other Departmentof Health (Chief Health Officer and Prevention Division).
7. Increases in relation to the 2017-18 Budget are predominantly driven by growth in services provided to HHSs to meet increased servicedemand, for example Pathology and Biomedical Technology Services. Additional FTE growth is also associated with: businessimprovement projects such as the front end Payroll rostering system; Health Contact Centre programs; and the conversion of contract andagency staff to permanent employees.
8. The reduction in FTEs from the 2016-17 Budget to the 2016-17 Estimated Actual relates to the active management of staffing within thepublished budget figure to allow for contingent and emergent needs.
312017-18 Queensland State Budget - Service Delivery Statements - Queensland Health
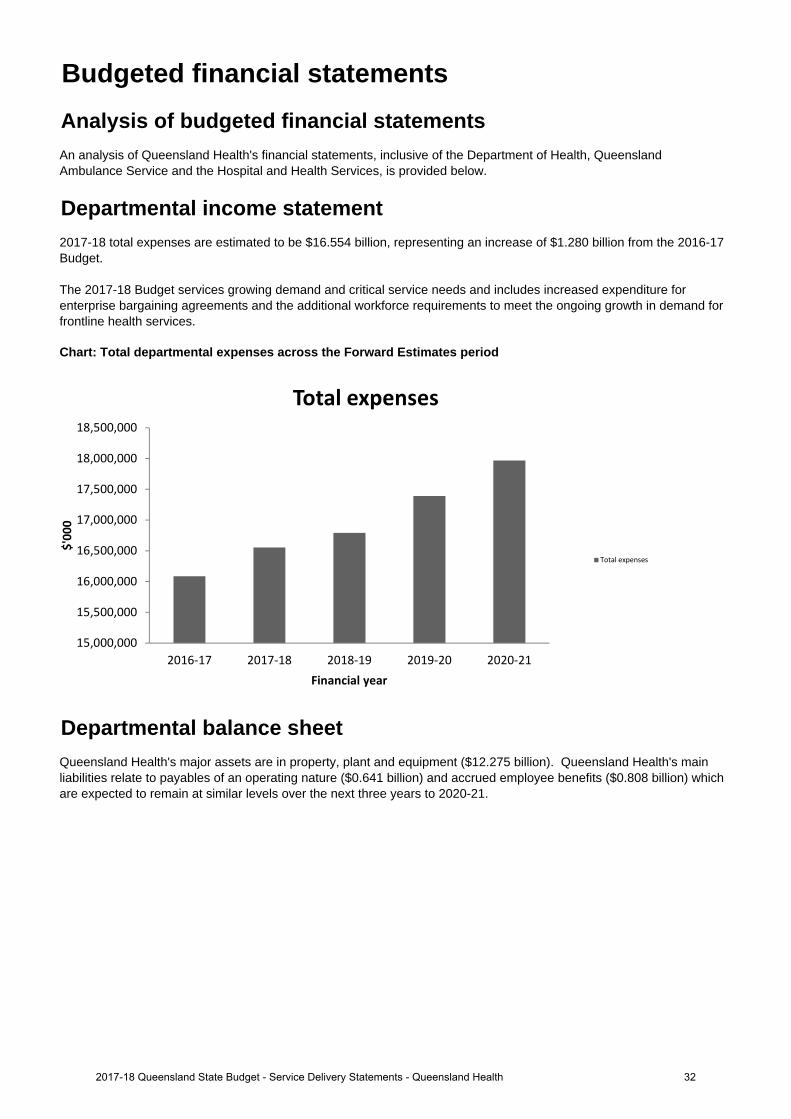
Chart: Total departmental expenses across the Forward Estimates period
Queensland Health's major assets are in property, plant and equipment ($12.275 billion). Queensland Health's main liabilities relate to payables of an operating nature ($0.641 billion) and accrued employee benefits ($0.808 billion) which are expected to remain at similar levels over the next three years to 2020-21.
Budgeted financial statementsAnalysis of budgeted financial statementsAn analysis of Queensland Health's financial statements, inclusive of the Department of Health, Queensland Ambulance Service and the Hospital and Health Services, is provided below.
Departmental income statement2017-18 total expenses are estimated to be $16.554 billion, representing an increase of $1.280 billion from the 2016-17 Budget.
The 2017-18 Budget services growing demand and critical service needs and includes increased expenditure for enterprise bargaining agreements and the additional workforce requirements to meet the ongoing growth in demand for frontline health services.
Departmental balance sheet
15,000,000
15,500,000
16,000,000
16,500,000
17,000,000
17,500,000
18,000,000
18,500,000
2016‐17 2017‐18 2018‐19 2019‐20 2020‐21
$'000
Financial year
Total expenses
Total expenses
322017-18 Queensland State Budget - Service Delivery Statements - Queensland Health
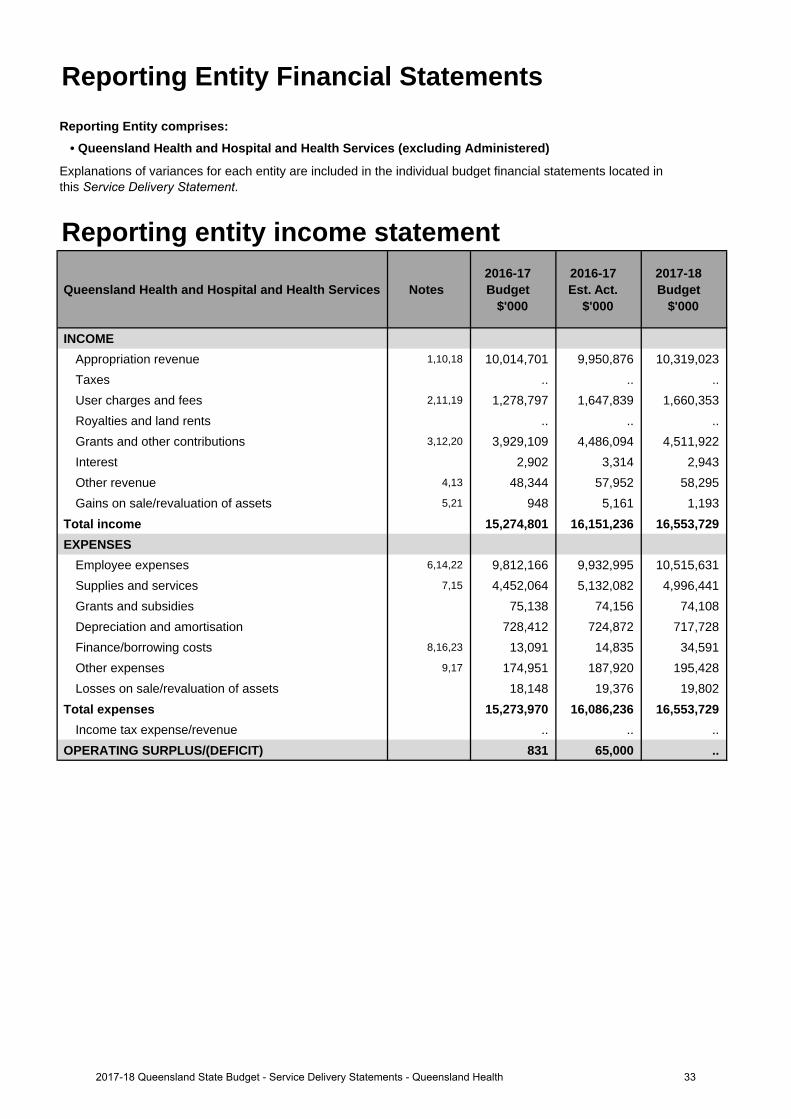
Reporting Entity Financial StatementsReporting Entity comprises:
• Queensland Health and Hospital and Health Services (excluding Administered)
Reporting entity income statement
Queensland Health and Hospital and Health Services Notes 2016-17 Budget
$'000
2016-17 Est. Act.
$'000
2017-18 Budget
$'000
INCOMEAppropriation revenue 1,10,18 10,014,701 9,950,876 10,319,023 Taxes .. .. ..User charges and fees 2,11,19 1,278,797 1,647,839 1,660,353 Royalties and land rents .. .. .. Grants and other contributions 3,12,20 3,929,109 4,486,094 4,511,922 Interest 2,902 3,314 2,943Other revenue 4,13 48,344 57,952 58,295 Gains on sale/revaluation of assets 5,21 948 5,161 1,193
Total income 15,274,801 16,151,236 16,553,729 EXPENSES
Employee expenses 6,14,22 9,812,166 9,932,995 10,515,631 Supplies and services 7,15 4,452,064 5,132,082 4,996,441 Grants and subsidies 75,138 74,156 74,108 Depreciation and amortisation 728,412 724,872 717,728 Finance/borrowing costs 8,16,23 13,091 14,835 34,591 Other expenses 9,17 174,951 187,920 195,428 Losses on sale/revaluation of assets 18,148 19,376 19,802
Total expenses 15,273,970 16,086,236 16,553,729 Income tax expense/revenue .. .. ..
OPERATING SURPLUS/(DEFICIT) 831 65,000 ..
Explanations of variances for each entity are included in the individual budget financial statements located in this Service Delivery Statement.
332017-18 Queensland State Budget - Service Delivery Statements - Queensland Health
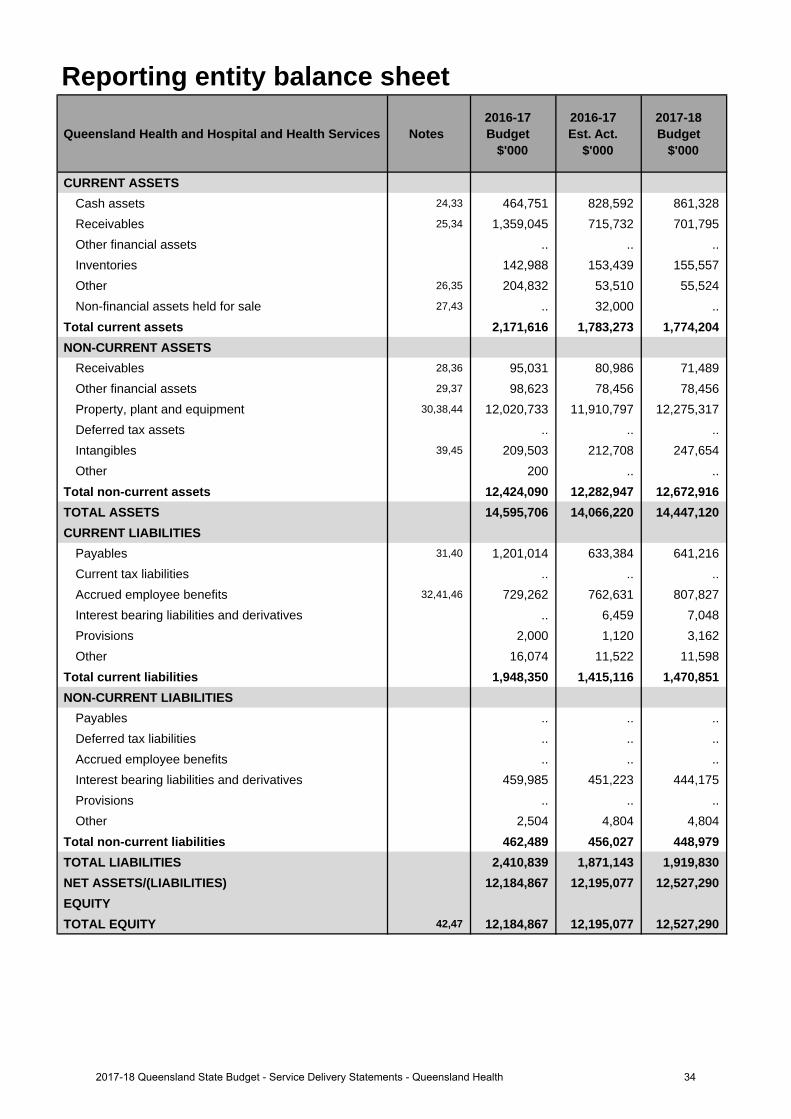
Reporting entity balance sheet
Queensland Health and Hospital and Health Services Notes 2016-17 Budget
$'000
2016-17 Est. Act.
$'000
2017-18 Budget
$'000
CURRENT ASSETSCash assets 24,33 464,751 828,592 861,328 Receivables 25,34 1,359,045 715,732 701,795 Other financial assets .. .. .. Inventories 142,988 153,439 155,557 Other 26,35 204,832 53,510 55,524 Non-financial assets held for sale 27,43 .. 32,000 ..
Total current assets 2,171,616 1,783,273 1,774,204 NON-CURRENT ASSETS
Receivables 28,36 95,031 80,986 71,489 Other financial assets 29,37 98,623 78,456 78,456 Property, plant and equipment 30,38,44 12,020,733 11,910,797 12,275,317 Deferred tax assets .. .. .. Intangibles 39,45 209,503 212,708 247,654 Other 200 .. ..
Total non-current assets 12,424,090 12,282,947 12,672,916 TOTAL ASSETS 14,595,706 14,066,220 14,447,120 CURRENT LIABILITIES
Payables 31,40 1,201,014 633,384 641,216 Current tax liabilities .. .. .. Accrued employee benefits 32,41,46 729,262 762,631 807,827 Interest bearing liabilities and derivatives .. 6,459 7,048 Provisions 2,000 1,120 3,162 Other 16,074 11,522 11,598
Total current liabilities 1,948,350 1,415,116 1,470,851 NON-CURRENT LIABILITIES
Payables .. .. .. Deferred tax liabilities .. .. .. Accrued employee benefits .. .. .. Interest bearing liabilities and derivatives 459,985 451,223 444,175 Provisions .. .. .. Other 2,504 4,804 4,804
Total non-current liabilities 462,489 456,027 448,979 TOTAL LIABILITIES 2,410,839 1,871,143 1,919,830 NET ASSETS/(LIABILITIES) 12,184,867 12,195,077 12,527,290 EQUITYTOTAL EQUITY 42,47 12,184,867 12,195,077 12,527,290
342017-18 Queensland State Budget - Service Delivery Statements - Queensland Health
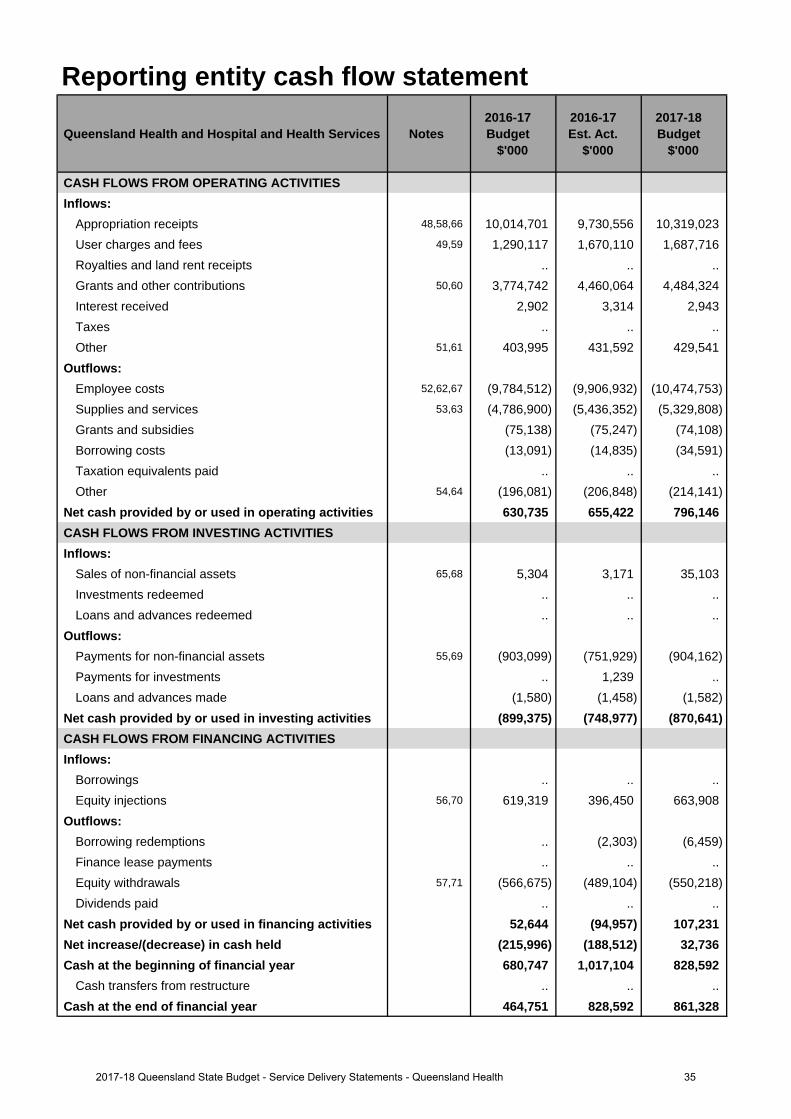
Reporting entity cash flow statement
Queensland Health and Hospital and Health Services Notes 2016-17 Budget
$'000
2016-17 Est. Act.
$'000
2017-18 Budget
$'000
CASH FLOWS FROM OPERATING ACTIVITIESInflows:
Appropriation receipts 48,58,66 10,014,701 9,730,556 10,319,023 User charges and fees 49,59 1,290,117 1,670,110 1,687,716 Royalties and land rent receipts .. .. .. Grants and other contributions 50,60 3,774,742 4,460,064 4,484,324 Interest received 2,902 3,314 2,943 Taxes .. .. .. Other 51,61 403,995 431,592 429,541
Outflows:Employee costs 52,62,67 (9,784,512) (9,906,932) (10,474,753)Supplies and services 53,63 (4,786,900) (5,436,352) (5,329,808)Grants and subsidies (75,138) (75,247) (74,108)Borrowing costs (13,091) (14,835) (34,591)Taxation equivalents paid .. .. .. Other 54,64 (196,081) (206,848) (214,141)
Net cash provided by or used in operating activities 630,735 655,422 796,146 CASH FLOWS FROM INVESTING ACTIVITIESInflows:
Sales of non-financial assets 65,68 5,304 3,171 35,103 Investments redeemed .. .. .. Loans and advances redeemed .. .. ..
Outflows:Payments for non-financial assets 55,69 (903,099) (751,929) (904,162)Payments for investments .. 1,239 .. Loans and advances made (1,580) (1,458) (1,582)
Net cash provided by or used in investing activities (899,375) (748,977) (870,641)CASH FLOWS FROM FINANCING ACTIVITIESInflows:
Borrowings .. .. .. Equity injections 56,70 619,319 396,450 663,908
Outflows:Borrowing redemptions .. (2,303) (6,459)Finance lease payments .. .. .. Equity withdrawals 57,71 (566,675) (489,104) (550,218)Dividends paid .. .. ..
Net cash provided by or used in financing activities 52,644 (94,957) 107,231 Net increase/(decrease) in cash held (215,996) (188,512) 32,736 Cash at the beginning of financial year 680,747 1,017,104 828,592
Cash transfers from restructure .. .. .. Cash at the end of financial year 464,751 828,592 861,328
352017-18 Queensland State Budget - Service Delivery Statements - Queensland Health
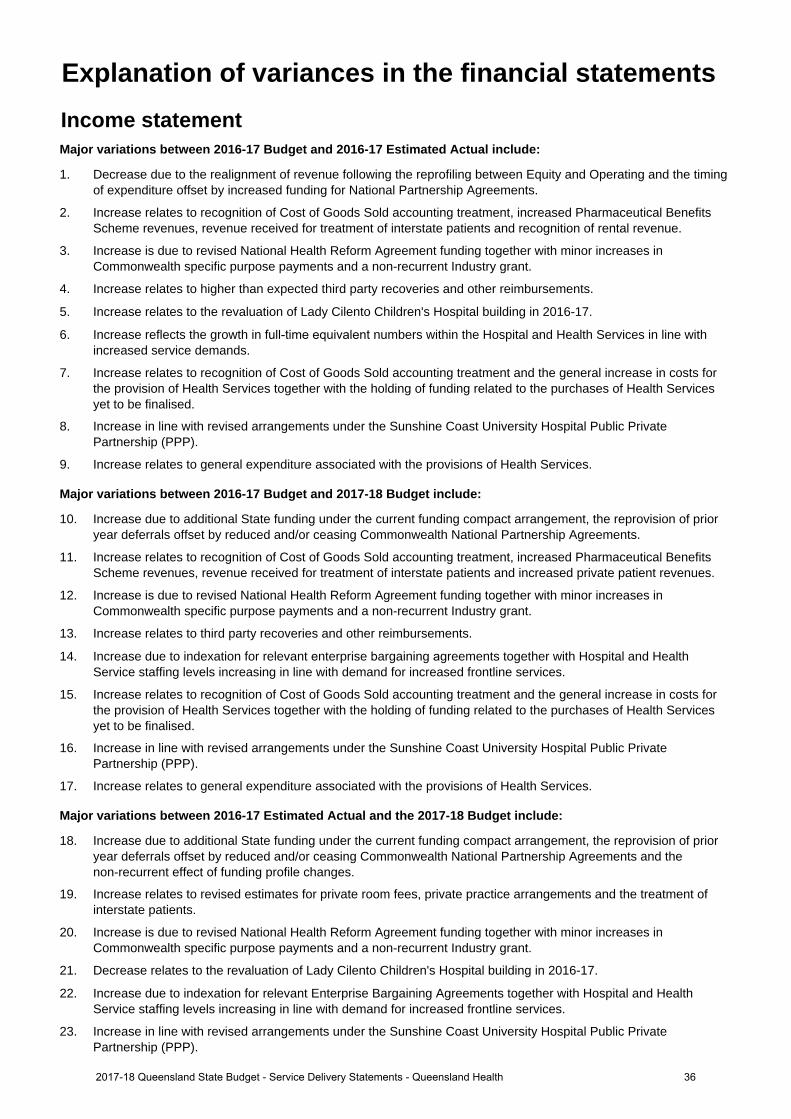
Income statementMajor variations between 2016-17 Budget and 2016-17 Estimated Actual include:
1. Decrease due to the realignment of revenue following the reprofiling between Equity and Operating and the timingof expenditure offset by increased funding for National Partnership Agreements.
2. Increase relates to recognition of Cost of Goods Sold accounting treatment, increased Pharmaceutical BenefitsScheme revenues, revenue received for treatment of interstate patients and recognition of rental revenue.
3. Increase is due to revised National Health Reform Agreement funding together with minor increases inCommonwealth specific purpose payments and a non-recurrent Industry grant.
4. Increase relates to higher than expected third party recoveries and other reimbursements.
5. Increase relates to the revaluation of Lady Cilento Children's Hospital building in 2016-17.
6. Increase reflects the growth in full-time equivalent numbers within the Hospital and Health Services in line with increased service demands.
7. Increase relates to recognition of Cost of Goods Sold accounting treatment and the general increase in costs forthe provision of Health Services together with the holding of funding related to the purchases of Health Servicesyet to be finalised.
8. Increase in line with revised arrangements under the Sunshine Coast University Hospital Public PrivatePartnership (PPP).
9. Increase relates to general expenditure associated with the provisions of Health Services.
Major variations between 2016-17 Budget and 2017-18 Budget include:
10. Increase due to additional State funding under the current funding compact arrangement, the reprovision of prioryear deferrals offset by reduced and/or ceasing Commonwealth National Partnership Agreements.
11. Increase relates to recognition of Cost of Goods Sold accounting treatment, increased Pharmaceutical BenefitsScheme revenues, revenue received for treatment of interstate patients and increased private patient revenues.
12. Increase is due to revised National Health Reform Agreement funding together with minor increases inCommonwealth specific purpose payments and a non-recurrent Industry grant.
13. Increase relates to third party recoveries and other reimbursements.
14. Increase due to indexation for relevant enterprise bargaining agreements together with Hospital and Health Service staffing levels increasing in line with demand for increased frontline services.
15. Increase relates to recognition of Cost of Goods Sold accounting treatment and the general increase in costs forthe provision of Health Services together with the holding of funding related to the purchases of Health Servicesyet to be finalised.
16. Increase in line with revised arrangements under the Sunshine Coast University Hospital Public PrivatePartnership (PPP).
17. Increase relates to general expenditure associated with the provisions of Health Services.
Major variations between 2016-17 Estimated Actual and the 2017-18 Budget include:
18. Increase due to additional State funding under the current funding compact arrangement, the reprovision of prior year deferrals offset by reduced and/or ceasing Commonwealth National Partnership Agreements and the non-recurrent effect of funding profile changes.
19. Increase relates to revised estimates for private room fees, private practice arrangements and the treatment ofinterstate patients.
20. Increase is due to revised National Health Reform Agreement funding together with minor increases inCommonwealth specific purpose payments and a non-recurrent Industry grant.
21. Decrease relates to the revaluation of Lady Cilento Children's Hospital building in 2016-17.
22. Increase due to indexation for relevant Enterprise Bargaining Agreements together with Hospital and HealthService staffing levels increasing in line with demand for increased frontline services.
23. Increase in line with revised arrangements under the Sunshine Coast University Hospital Public PrivatePartnership (PPP).
Explanation of variances in the financial statements
362017-18 Queensland State Budget - Service Delivery Statements - Queensland Health
Balance sheetMajor variations between 2016-17 Budget and 2016-17 Estimated Actual include:
24. Increase in cash relates to a reduction in outstanding debtors at year end and the Queensland GovernmentInsurance Fund (QGIF) invoice now being paid in July.
25. Decrease in receivables due to a reduction in the forecast Commonwealth receivable, a reduction in anticipatedoutstanding debtors at year end and the recognition of an elimination entry for receivables between theDepartment of Health and the Hospital and Health Services not included in the 2016-17 published budget papers.
26. Decrease due to a change in process with QGIF invoice now being paid in July.
27. Increase in non-financial assets held for sale due to the land at the former Southport Hospital site held at fairvalue.
28. Decrease in non-current receivables due to a reduction in the forecast outstanding debtors at year end.
29. Decrease in other financial assets due to the reclassification to QTC cash assets.
30. Decrease in Property, plant and equipment due to the reprofile of funding from Equity to Operating and recashflowof projects in the capital program.
31. Decrease in payables due to the recognition of an elimination entry for payables between the Department ofHealth and Hospital and Health Services not included in the 2016-17 published budget papers.
32. Increase in accrued employee benefits is due to the growth in the annual leave levy payable being higher thanoriginally forecast in the 2016-17 budget papers.
Major variations between 2016-17 Budget and 2017-18 Budget include:
33. Increase in cash relates to a reduction in outstanding debtors at year end and the QGIF invoice now being paid in July.
34. Decrease in receivables due to a reduction in the forecast Commonwealth receivable, a reduction in anticipatedoutstanding debtors at year end and the recognition of an elimination entry for receivables between theDepartment of Health and the Hospital and Health Services not included in the 2016-17 published budget papers.
35. Decrease due to a change in process with QGIF invoice now being paid in July.
36. Decrease in non-current receivables due to a reduction in the forecast outstanding debtors at year end.
37. Decrease in other financial assets due to the reclassification to QTC cash assets.
38. Increase relates to investment in the Health Capital Program.
39. Increase in intangibles due to the capitalisation of costs related to software programs.
40. Decrease in payables due to the recognition of an elimination entry for payables between the Department ofHealth and Hospital and Health Services not included in the 2016-17 published budget papers.
41. Increase in accrued employee benefits is due to underestimated growth in the annual leave levy payable in the2016-17 Budget papers, an additional payroll accrual day in 2017-18 and an increase in employee expensesrelating to Enterprise Bargaining Agreement No. 9.
42. Increase in total equity due to indexation of Non-Current Assets and investment in the Health Capital Program.
Major variations between 2016-17 Estimated Actual and the 2017-18 Budget include:
43. Decrease in non-financial assets held for sale due to sale of land at the former Southport Hospital site, previouslyheld at fair value.
44. Increase relates to investment in the Health Capital Program.
45. Increase in intangibles due to the capitalisation of costs related to software programs.
46. Increase in accrued employee benefits is due to an additional payroll accrual day in 2017-18 and an increase inemployee expenses due to Enterprise Bargaining Agreement No. 9.
47. Increase in total equity predominately due to indexation of Non-Current Assets.
372017-18 Queensland State Budget - Service Delivery Statements - Queensland Health
Cash flow statementMajor variations between 2016-17 Budget and 2016-17 Estimated Actual include:
48. Decrease due to the realignment of revenue reprofiling between Equity and Operating funding and the timing ofexpenditure offset by increased funding for National Partnership Agreements and movement in payables.
49. Increase relates to recognition of Cost of Goods Sold accounting treatment, increased Pharmaceutical BenefitsScheme revenues, revenue received for treatment of interstate patients and recognition of rental revenue.
50. Increase is due to revised National Health Reform Agreement funding together with minor increases inCommonwealth specific purpose payments and a non-recurrent Industry grant.
51. Increase relates to higher than expected third party recoveries and other reimbursements.
52. Increase reflects the expenditure associated with growth in full-time equivalent numbers within the Hospital and Health Services in line with increased service demands.
53. Increase due to the general increase in costs for the provision of Health Services together with the holding offunding related to the purchases of Health Services yet to be finalised.
54. Increase relates to general expenditure associated with the provisions of Health Services.
55. Decrease in Payments for non-financial assets due to the recashflow of projects in the capital program from2016-17 to 2017-18 in line with anticipated capital expenditure.
56. Decrease in Equity injections relates to the recashflow of projects in the Capital Acquisition Plan from 2016-17 to2017-18 in line with anticipated capital expenditure.
57. Decrease relates to Equity withdrawal arrangements at End of Year between the Department and QueenslandTreasury.
Major variations between 2016-17 Budget and 2017-18 Budget include:
58. Increase due to additional State funding under the current funding compact arrangement, the reprovision of prioryear deferrals offset by reduced and/or ceasing Commonwealth National Partnership Agreements.
59. Increase relates to recognition of Cost of Goods Sold accounting treatment, increased Pharmaceutical BenefitsScheme revenues, revenue received for treatment of interstate patients and increased private patient revenues.
60. Increase is due to revised National Health Reform Agreement funding together with minor increases inCommonwealth specific purpose payments and a non-recurrent Industry grant.
61. Increase relates to higher than expected third party recoveries and other reimbursements.
62. Increase due to indexation for relevant Enterprise Bargaining Agreements together with Hospital and HealthService staffing levels increasing in line with demand for increased frontline services.
63. Increase due to the general increase in costs for the provision of Health Services together with the holding ofcontingent funding related to the purchases of Health Services yet to be finalised.
64. Increase relates to general expenditure associated with the provisions of Health Services.
65. Increase due to sale of land of the former Southport Hospital site previously held at fair value.
Major variations between 2016-17 Estimated Actual and the 2017-18 Budget include:
66. Increase due to additional State funding under the current funding compact arrangement, the reprovision of prioryear deferrals offset by reduced or ceasing Commonwealth National Partnership Agreements and the non-recurrent effect of funding profile changes.
67. Increase due to indexation for relevant Enterprise Bargaining Agreements together with Hospital and HealthService staffing levels increasing in line with demand for increased frontline services.
68. Increase due to sale of land of the former Southport Hospital site previously held at fair value.
69. Increase in payments for non-financial assets due to the recashflow of projects in the capital program from2016-17 to 2017-18 in line with anticipated capital expenditure.
70. Increase in equity injections relates to recashflow of projects in the Capital Acquisition Plan from 2016-17 to2017-18 in line with anticipated capital expenditure.
71. Increase relates to Equity withdrawal arrangements at End of Year between the Department and QueenslandTreasury.
382017-18 Queensland State Budget - Service Delivery Statements - Queensland Health
Department of Health overview The Department of Health - under the Hospital and Health Boards Act 2011 - is responsible for overall leadership and management of the Queensland public health system.
The department’s vision is healthier Queenslanders, and it works in close collaboration with the State’s 16 Hospital and Health Services (HHSs) and Queensland Ambulance Service to ensure that safe and responsive public health services are delivered in each region.
To achieve this, the department's strategic objectives, as identified in the Department of Health Strategic Plan 2016-2020 (2017 Update) are:
• supporting Queenslanders to be healthier: promoting and protecting the health of Queenslanders • enabling safe, quality services: delivering and enabling safe, clinically effective, high quality health services • improving health outcomes through better access to services for Queenslanders • responsive, dynamic and accountable management of the department, and of funding and service performance • harnessing the skill and knowledge of our partners through collaborative engagement • driving service improvement and innovation through a collaborative policy cycle and • fostering a culture that is vibrant, innovative and collaborative.
By implementing these strategic objectives, the department also contributes to the Queensland Government’s objectives of delivering quality frontline services; building safe, caring and connected communities; and creating jobs and a diverse economy.
The department achieves these objectives by:
• providing strategic leadership and direction through the development of policies, legislation and regulations for the health of Queenslanders
• developing statewide plans and strategies for health services, workforce and major capital investments that provide oversight and linkages across the entire state’s healthcare system and eliminate duplication of effort and associated waste
• managing major capital works for public sector health service facilities • purchasing, supporting and monitoring the quality of health service delivery through ensuring agreed targets and
outcomes of funded organisations are clearly established through service agreements, in order to achieve the most effective and efficient delivery of healthcare within the allocated resources
• delivering specialised health services, providing ambulance, health information and communication technology and statewide health support services
• advancing healthcare for our consumers, clinicians and the community through digital health technologies and digital innovation.
The department has been successful in driving strong service delivery performance across Queensland Health in the face of increasing demand. The department continues to lead a range of major innovative health reforms, such as the Digital Hospital rollout, targeted initiatives to reduce outpatient waitlists, and Australia’s first medicinal cannabis guidelines to provide safe, controlled access to medicinal cannabis under the nation’s most progressive medicinal cannabis laws.
Responsible financial management has delivered a budget surplus in 2016-17, and the department maintains an ongoing focus on capital delivery, with a range of significant projects underway and planned for 2017-18.
However, over the longer term, a range of service delivery and fiscal challenges are emerging. These include significant demand pressures from a growing and ageing population, uncertainty regarding future levels of Commonwealth funding and cost shifting to the state, and challenges to ensure infrastructure capacity keeps pace with demand growth. To respond to these challenges, the department’s long term system planning aims to:
• transform the way the health system operates through implementing key policy priorities including: − My Health, Queensland’s Future: Advancing Health 2026 (Advancing health 2026) strategy which articulates a
10-year vision and provides a shared sense of purpose and strategic direction to support improved health outcomes for all Queenslanders
392017-18 Queensland State Budget - Service Delivery Statements - Department of Health
− Specialist Outpatients Strategy – developed to tackle specialist outpatient waiting lists and improve access to specialist services by 2020
− Connecting Care to Recovery 2016-2021 – to deliver services and infrastructure to implement the Connecting Care to Recovery five-year mental health and alcohol and other drugs plan
− Health and Wellbeing Strategic Framework 2016-2026 – to provide a prevention focussed pathway for the improved health of all Queenslanders, focusing on the key modifiable behaviours of unhealthy eating, physical inactivity, tobacco smoking, and unsafe sun exposure
− Queensland Sexual Health Strategy 2016-2021 – to help improve the sexual and reproductive health of Queenslanders through health promotion, prevention, clinical service provision and community education
− proposed amendments to legislation, including the Public Health Act 2005, which will strengthen the statutory infection control framework for health care facilities.
• optimise service delivery and operational efficiency across the health system through: − purchasing health services from HHSs, not-for-profit, community and other non-government organisations
through a range of funding mechanisms including partnerships, service agreements and grant funding − establishing a set of purchasing priorities to direct investment that address issues of significant demand pressure
or provide potential for efficiency gains − pursuing more innovative models of care, such as community-based services as an alternative to hospital
services where clinically appropriate − employing capacity management strategies to better manage demand surges and to more effectively reduce off-
load times for Queensland Ambulance Service, thereby improving emergency access − advancing a range of transformative reforms with a focus on improving operational efficiency and high value care − using digital health to transform the way healthcare is provided to patients by moving from paper-based clinical
workflows to digital processes − establishing a vehicle for HHSs to solve complex clinical design problems using proven methods of improvement − utilising value-based healthcare to pursue reforms to maximise health outcomes from available resources − using integrated care to help patients get the right care, in the right setting, in a timely and flexible manner − strategies to build the evidence and relationship base to facilitate more efficient health workforce planning − continuing the development of point of care testing services to ensure timely patient access to pathology testing
in regional and rural Queensland − investing in new pathology laboratory technologies in the rapidly expanding area of genomic testing − delivering a modern Laboratory Information System to improve Pathology and Forensic and Scientific Services’
efficiency and integrate with the digital health platform across the state − developing forward procurement plans to improve the delivery of benefits to HHSs over a five year period from
2016-17 to 2020-21 − delivering an Integrated Workforce Management solution to enhance workforce management capability and
provide better pay outcomes to HHSs and the Department of Health. • sustain investment in infrastructure to support growth and future demand through:
− assessment and prioritisation of service reform and resource requirements − targeted investment in detailed planning for high growth areas.
402017-18 Queensland State Budget - Service Delivery Statements - Department of Health
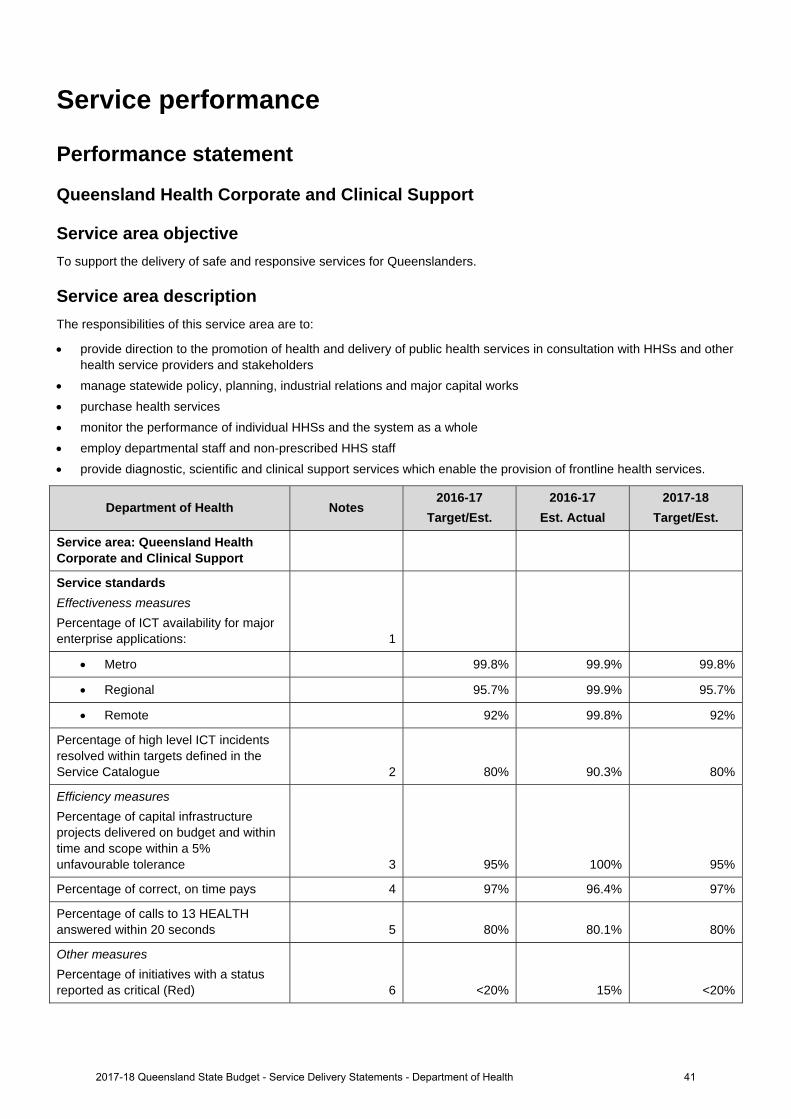
Service performance
Performance statement
Queensland Health Corporate and Clinical Support
Service area objective To support the delivery of safe and responsive services for Queenslanders.
Service area description The responsibilities of this service area are to:
provide direction to the promotion of health and delivery of public health services in consultation with HHSs and other health service providers and stakeholders
manage statewide policy, planning, industrial relations and major capital works purchase health services monitor the performance of individual HHSs and the system as a whole employ departmental staff and non-prescribed HHS staff provide diagnostic, scientific and clinical support services which enable the provision of frontline health services.
Department of Health Notes 2016-17
Target/Est. 2016-17
Est. Actual 2017-18
Target/Est.
Service area: Queensland Health Corporate and Clinical Support
Service standards Effectiveness measures
Percentage of ICT availability for major enterprise applications: 1
Metro 99.8% 99.9% 99.8%
Regional 95.7% 99.9% 95.7%
Remote 92% 99.8% 92%
Percentage of high level ICT incidents resolved within targets defined in the Service Catalogue 2 80% 90.3% 80%
Efficiency measures
Percentage of capital infrastructure projects delivered on budget and within time and scope within a 5% unfavourable tolerance 3 95% 100% 95%
Percentage of correct, on time pays 4 97% 96.4% 97%
Percentage of calls to 13 HEALTH answered within 20 seconds 5 80% 80.1% 80%
Other measures
Percentage of initiatives with a status reported as critical (Red) 6 <20% 15% <20%
2017-18 Queensland State Budget - Service Delivery Statements - Department of Health 41
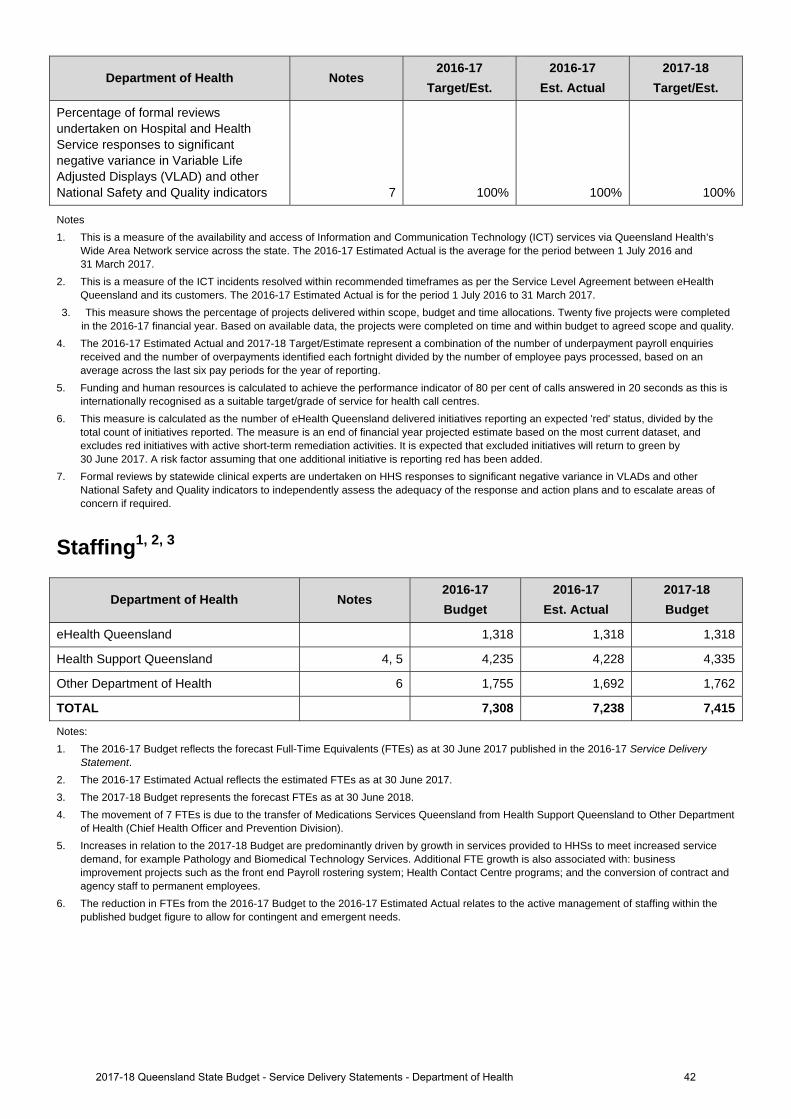
Department of Health Notes 2016-17
Target/Est. 2016-17
Est. Actual 2017-18
Target/Est.
Percentage of formal reviews undertaken on Hospital and Health Service responses to significant negative variance in Variable Life Adjusted Displays (VLAD) and other National Safety and Quality indicators 7 100% 100% 100%
Notes 1. This is a measure of the availability and access of Information and Communication Technology (ICT) services via Queensland Health’s
Wide Area Network service across the state. The 2016-17 Estimated Actual is the average for the period between 1 July 2016 and 31 March 2017.
2. This is a measure of the ICT incidents resolved within recommended timeframes as per the Service Level Agreement between eHealth Queensland and its customers. The 2016-17 Estimated Actual is for the period 1 July 2016 to 31 March 2017.
3. This measure shows the percentage of projects delivered within scope, budget and time allocations. Twenty five projects were completed in the 2016-17 financial year. Based on available data, the projects were completed on time and within budget to agreed scope and quality.
4. The 2016-17 Estimated Actual and 2017-18 Target/Estimate represent a combination of the number of underpayment payroll enquiries received and the number of overpayments identified each fortnight divided by the number of employee pays processed, based on an average across the last six pay periods for the year of reporting.
5. Funding and human resources is calculated to achieve the performance indicator of 80 per cent of calls answered in 20 seconds as this is internationally recognised as a suitable target/grade of service for health call centres.
6. This measure is calculated as the number of eHealth Queensland delivered initiatives reporting an expected 'red' status, divided by the total count of initiatives reported. The measure is an end of financial year projected estimate based on the most current dataset, and excludes red initiatives with active short-term remediation activities. It is expected that excluded initiatives will return to green by 30 June 2017. A risk factor assuming that one additional initiative is reporting red has been added.
7. Formal reviews by statewide clinical experts are undertaken on HHS responses to significant negative variance in VLADs and other National Safety and Quality indicators to independently assess the adequacy of the response and action plans and to escalate areas of concern if required.
Staffing1, 2, 3
Department of Health Notes 2016-17 Budget
2016-17 Est. Actual
2017-18 Budget
eHealth Queensland 1,318 1,318 1,318
Health Support Queensland 4, 5 4,235 4,228 4,335
Other Department of Health 6 1,755 1,692 1,762
TOTAL 7,308 7,238 7,415
Notes: 1. The 2016-17 Budget reflects the forecast Full-Time Equivalents (FTEs) as at 30 June 2017 published in the 2016-17 Service Delivery
Statement. 2. The 2016-17 Estimated Actual reflects the estimated FTEs as at 30 June 2017. 3. The 2017-18 Budget represents the forecast FTEs as at 30 June 2018. 4. The movement of 7 FTEs is due to the transfer of Medications Services Queensland from Health Support Queensland to Other Department
of Health (Chief Health Officer and Prevention Division). 5. Increases in relation to the 2017-18 Budget are predominantly driven by growth in services provided to HHSs to meet increased service
demand, for example Pathology and Biomedical Technology Services. Additional FTE growth is also associated with: business improvement projects such as the front end Payroll rostering system; Health Contact Centre programs; and the conversion of contract and agency staff to permanent employees.
6. The reduction in FTEs from the 2016-17 Budget to the 2016-17 Estimated Actual relates to the active management of staffing within the published budget figure to allow for contingent and emergent needs.
2017-18 Queensland State Budget - Service Delivery Statements - Department of Health 42
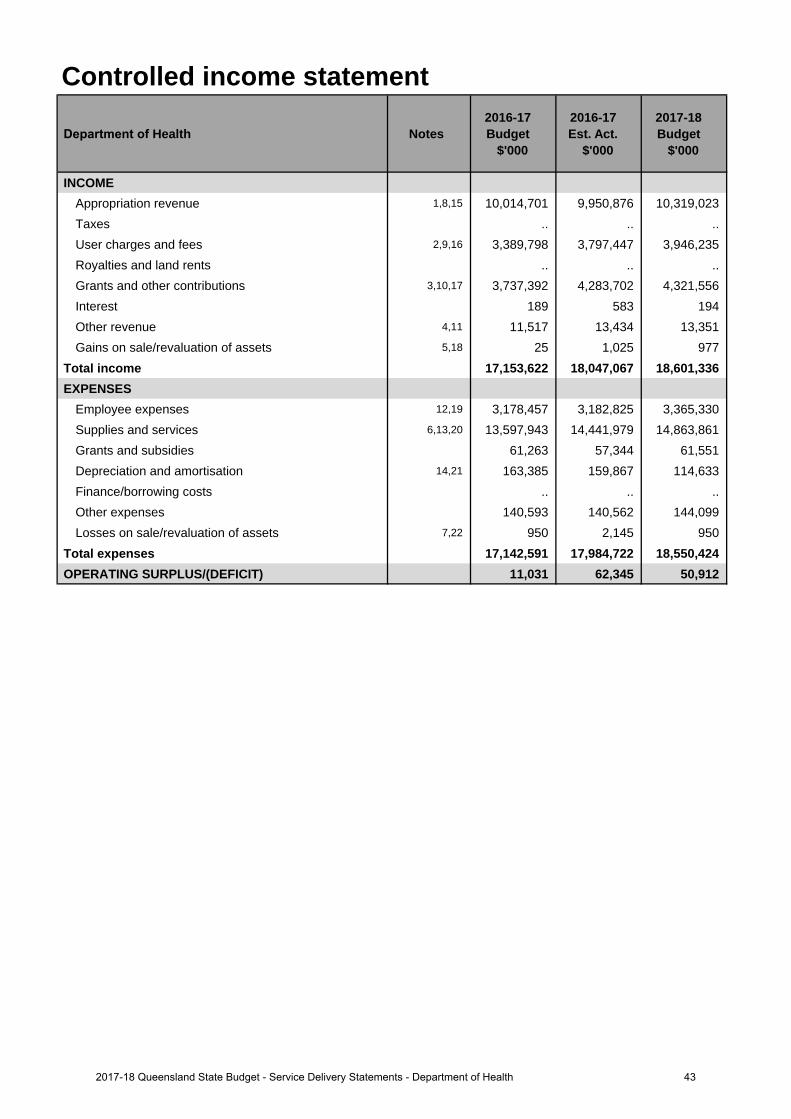
Controlled income statement
Department of Health Notes 2016-17 Budget
$'000
2016-17 Est. Act.
$'000
2017-18 Budget
$'000
INCOMEAppropriation revenue 1,8,15 10,014,701 9,950,876 10,319,023 Taxes .. .. ..User charges and fees 2,9,16 3,389,798 3,797,447 3,946,235 Royalties and land rents .. .. .. Grants and other contributions 3,10,17 3,737,392 4,283,702 4,321,556 Interest 189 583 194Other revenue 4,11 11,517 13,434 13,351 Gains on sale/revaluation of assets 5,18 25 1,025 977
Total income 17,153,622 18,047,067 18,601,336 EXPENSES
Employee expenses 12,19 3,178,457 3,182,825 3,365,330 Supplies and services 6,13,20 13,597,943 14,441,979 14,863,861 Grants and subsidies 61,263 57,344 61,551 Depreciation and amortisation 14,21 163,385 159,867 114,633 Finance/borrowing costs .. .. ..Other expenses 140,593 140,562 144,099 Losses on sale/revaluation of assets 7,22 950 2,145 950
Total expenses 17,142,591 17,984,722 18,550,424 OPERATING SURPLUS/(DEFICIT) 11,031 62,345 50,912
432017-18 Queensland State Budget - Service Delivery Statements - Department of Health
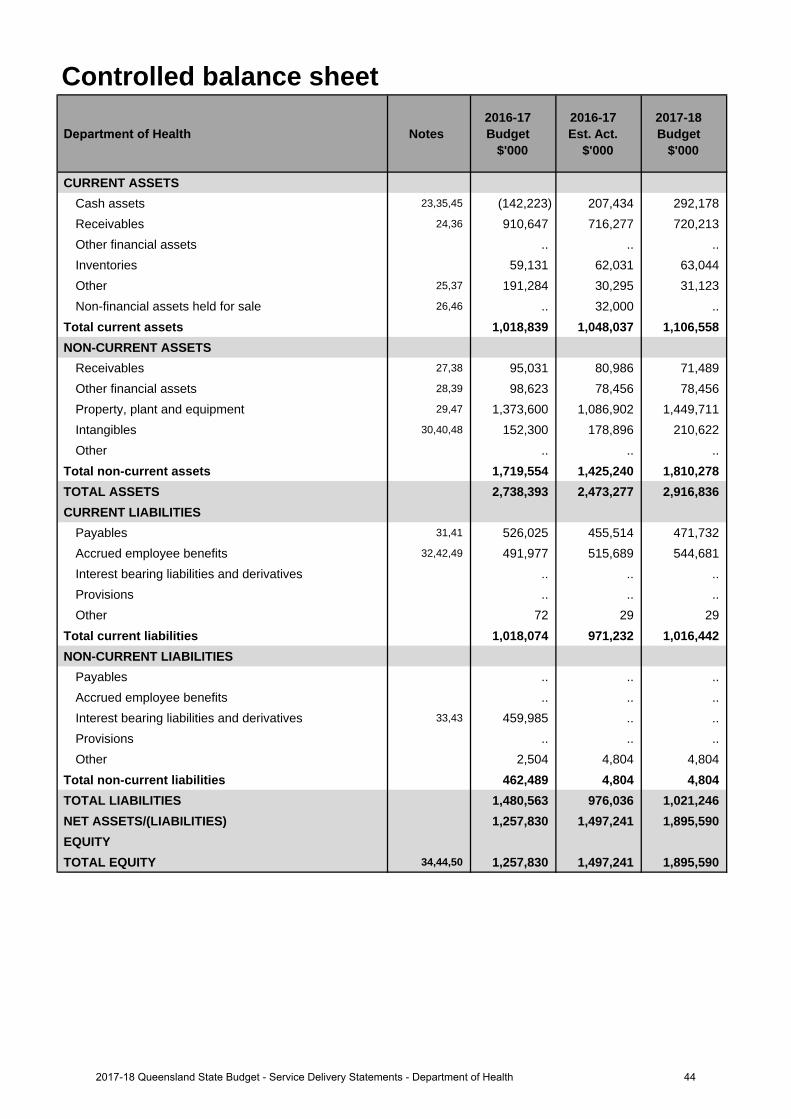
Controlled balance sheet
Department of Health Notes 2016-17 Budget
$'000
2016-17 Est. Act.
$'000
2017-18 Budget
$'000
CURRENT ASSETSCash assets 23,35,45 (142,223) 207,434 292,178 Receivables 24,36 910,647 716,277 720,213 Other financial assets .. .. .. Inventories 59,131 62,031 63,044 Other 25,37 191,284 30,295 31,123 Non-financial assets held for sale 26,46 .. 32,000 ..
Total current assets 1,018,839 1,048,037 1,106,558 NON-CURRENT ASSETS
Receivables 27,38 95,031 80,986 71,489 Other financial assets 28,39 98,623 78,456 78,456 Property, plant and equipment 29,47 1,373,600 1,086,902 1,449,711 Intangibles 30,40,48 152,300 178,896 210,622 Other .. .. ..
Total non-current assets 1,719,554 1,425,240 1,810,278 TOTAL ASSETS 2,738,393 2,473,277 2,916,836 CURRENT LIABILITIES
Payables 31,41 526,025 455,514 471,732 Accrued employee benefits 32,42,49 491,977 515,689 544,681 Interest bearing liabilities and derivatives .. .. .. Provisions .. .. ..Other 72 29 29
Total current liabilities 1,018,074 971,232 1,016,442 NON-CURRENT LIABILITIES
Payables .. .. ..Accrued employee benefits .. .. .. Interest bearing liabilities and derivatives 33,43 459,985 .. ..Provisions .. .. ..Other 2,504 4,804 4,804
Total non-current liabilities 462,489 4,804 4,804 TOTAL LIABILITIES 1,480,563 976,036 1,021,246 NET ASSETS/(LIABILITIES) 1,257,830 1,497,241 1,895,590 EQUITYTOTAL EQUITY 34,44,50 1,257,830 1,497,241 1,895,590
442017-18 Queensland State Budget - Service Delivery Statements - Department of Health
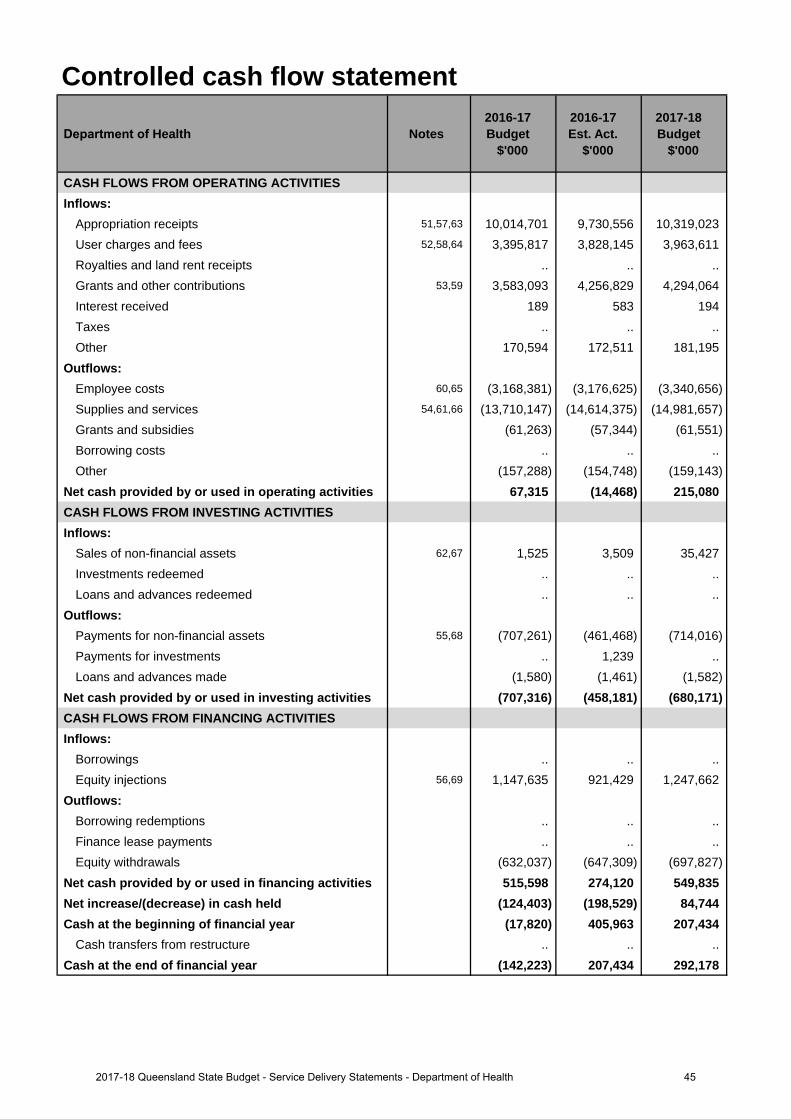
Controlled cash flow statement
Department of Health Notes 2016-17 Budget
$'000
2016-17 Est. Act.
$'000
2017-18 Budget
$'000
CASH FLOWS FROM OPERATING ACTIVITIESInflows:
Appropriation receipts 51,57,63 10,014,701 9,730,556 10,319,023 User charges and fees 52,58,64 3,395,817 3,828,145 3,963,611 Royalties and land rent receipts .. .. .. Grants and other contributions 53,59 3,583,093 4,256,829 4,294,064 Interest received 189 583 194Taxes .. .. ..Other 170,594 172,511 181,195
Outflows:Employee costs 60,65 (3,168,381) (3,176,625) (3,340,656)Supplies and services 54,61,66 (13,710,147) (14,614,375) (14,981,657)Grants and subsidies (61,263) (57,344) (61,551)Borrowing costs .. .. ..Other (157,288) (154,748) (159,143)
Net cash provided by or used in operating activities 67,315 (14,468) 215,080 CASH FLOWS FROM INVESTING ACTIVITIESInflows:
Sales of non-financial assets 62,67 1,525 3,509 35,427Investments redeemed .. .. ..Loans and advances redeemed .. .. ..
Outflows:Payments for non-financial assets 55,68 (707,261) (461,468) (714,016)Payments for investments .. 1,239 .. Loans and advances made (1,580) (1,461) (1,582)
Net cash provided by or used in investing activities (707,316) (458,181) (680,171)CASH FLOWS FROM FINANCING ACTIVITIESInflows:
Borrowings .. .. ..Equity injections 56,69 1,147,635 921,429 1,247,662
Outflows:Borrowing redemptions .. .. ..Finance lease payments .. .. .. Equity withdrawals (632,037) (647,309) (697,827)
Net cash provided by or used in financing activities 515,598 274,120 549,835 Net increase/(decrease) in cash held (124,403) (198,529) 84,744 Cash at the beginning of financial year (17,820) 405,963 207,434
Cash transfers from restructure .. .. .. Cash at the end of financial year (142,223) 207,434 292,178
452017-18 Queensland State Budget - Service Delivery Statements - Department of Health
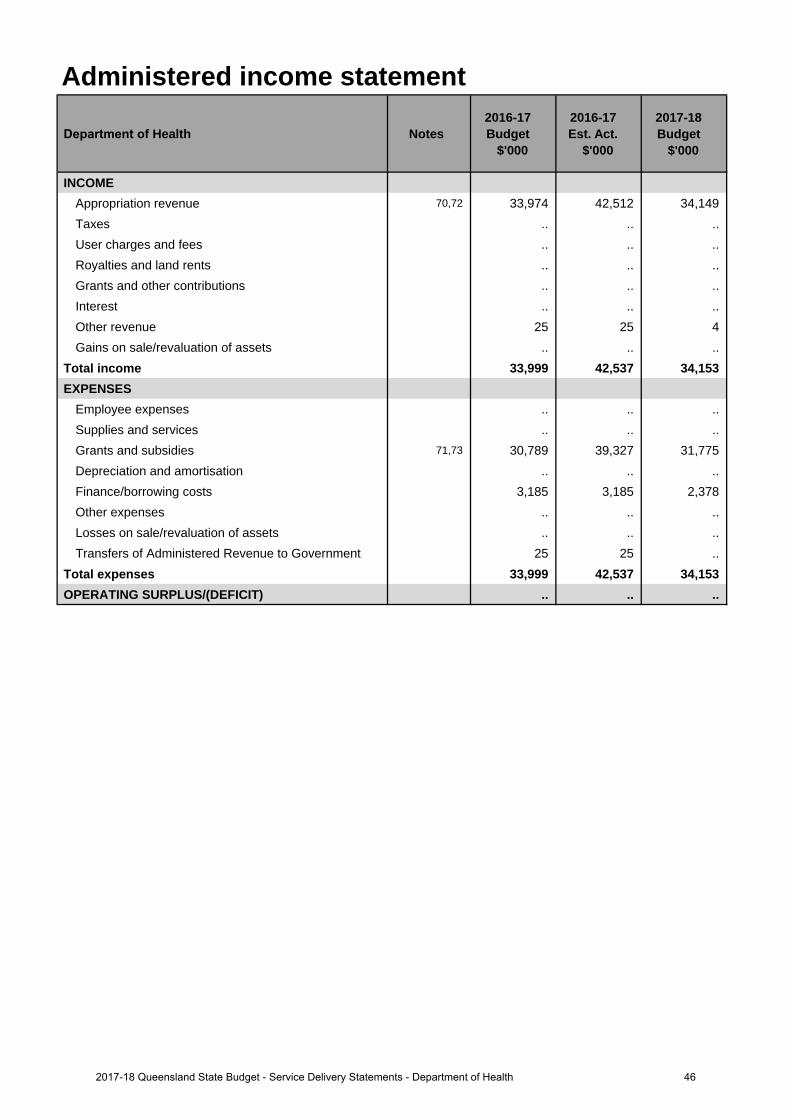
Administered income statement
Department of Health Notes 2016-17 Budget
$'000
2016-17 Est. Act.
$'000
2017-18 Budget
$'000
INCOMEAppropriation revenue 70,72 33,974 42,512 34,149 Taxes .. .. ..User charges and fees .. .. .. Royalties and land rents .. .. .. Grants and other contributions .. .. .. Interest .. .. ..Other revenue 25 25 4 Gains on sale/revaluation of assets .. .. ..
Total income 33,999 42,537 34,153 EXPENSES
Employee expenses .. .. ..Supplies and services .. .. .. Grants and subsidies 71,73 30,789 39,327 31,775 Depreciation and amortisation .. .. .. Finance/borrowing costs 3,185 3,185 2,378Other expenses .. .. ..Losses on sale/revaluation of assets .. .. .. Transfers of Administered Revenue to Government 25 25 ..
Total expenses 33,999 42,537 34,153 OPERATING SURPLUS/(DEFICIT) .. .. ..
462017-18 Queensland State Budget - Service Delivery Statements - Department of Health
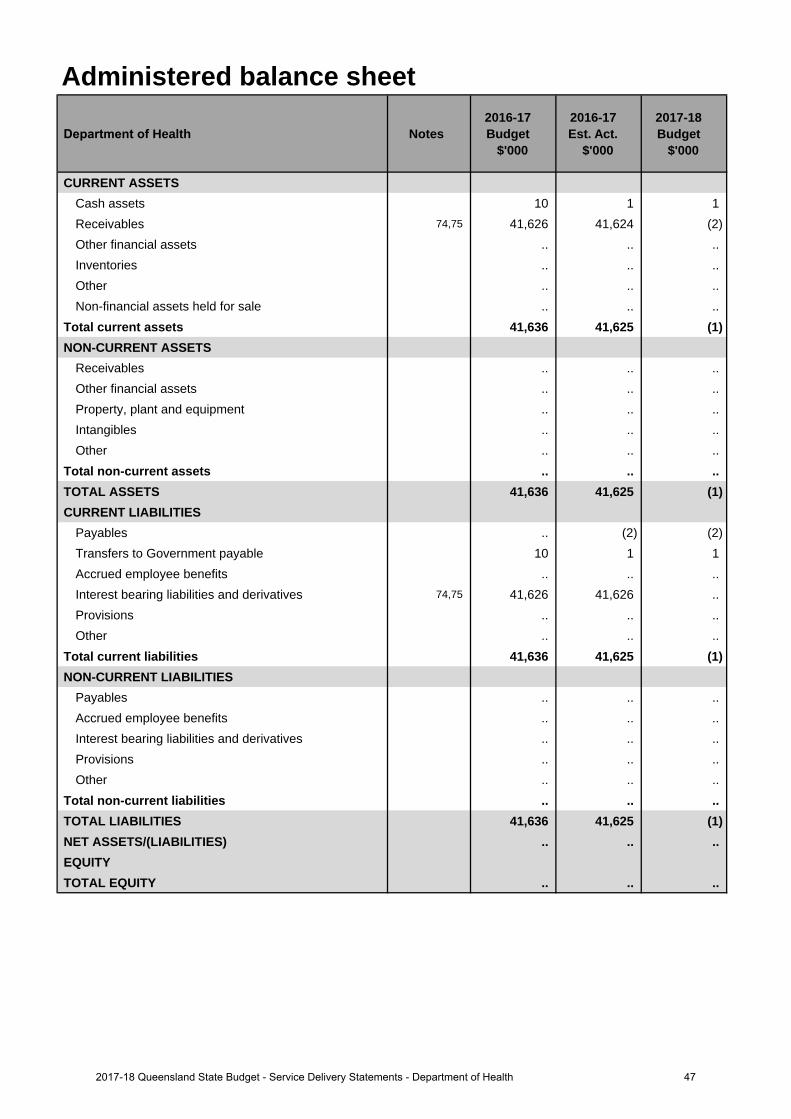
Administered balance sheet
Department of Health Notes 2016-17 Budget
$'000
2016-17 Est. Act.
$'000
2017-18 Budget
$'000
CURRENT ASSETSCash assets 10 1 1 Receivables 74,75 41,626 41,624 (2)Other financial assets .. .. .. Inventories .. .. ..Other .. .. ..Non-financial assets held for sale .. .. ..
Total current assets 41,636 41,625 (1)NON-CURRENT ASSETS
Receivables .. .. ..Other financial assets .. .. .. Property, plant and equipment .. .. .. Intangibles .. .. ..Other .. .. ..
Total non-current assets .. .. .. TOTAL ASSETS 41,636 41,625 (1)CURRENT LIABILITIES
Payables .. (2) (2)Transfers to Government payable 10 1 1 Accrued employee benefits .. .. .. Interest bearing liabilities and derivatives 74,75 41,626 41,626 .. Provisions .. .. ..Other .. .. ..
Total current liabilities 41,636 41,625 (1)NON-CURRENT LIABILITIES
Payables .. .. ..Accrued employee benefits .. .. .. Interest bearing liabilities and derivatives .. .. .. Provisions .. .. ..Other .. .. ..
Total non-current liabilities .. .. .. TOTAL LIABILITIES 41,636 41,625 (1)NET ASSETS/(LIABILITIES) .. .. ..EQUITYTOTAL EQUITY .. .. ..
472017-18 Queensland State Budget - Service Delivery Statements - Department of Health
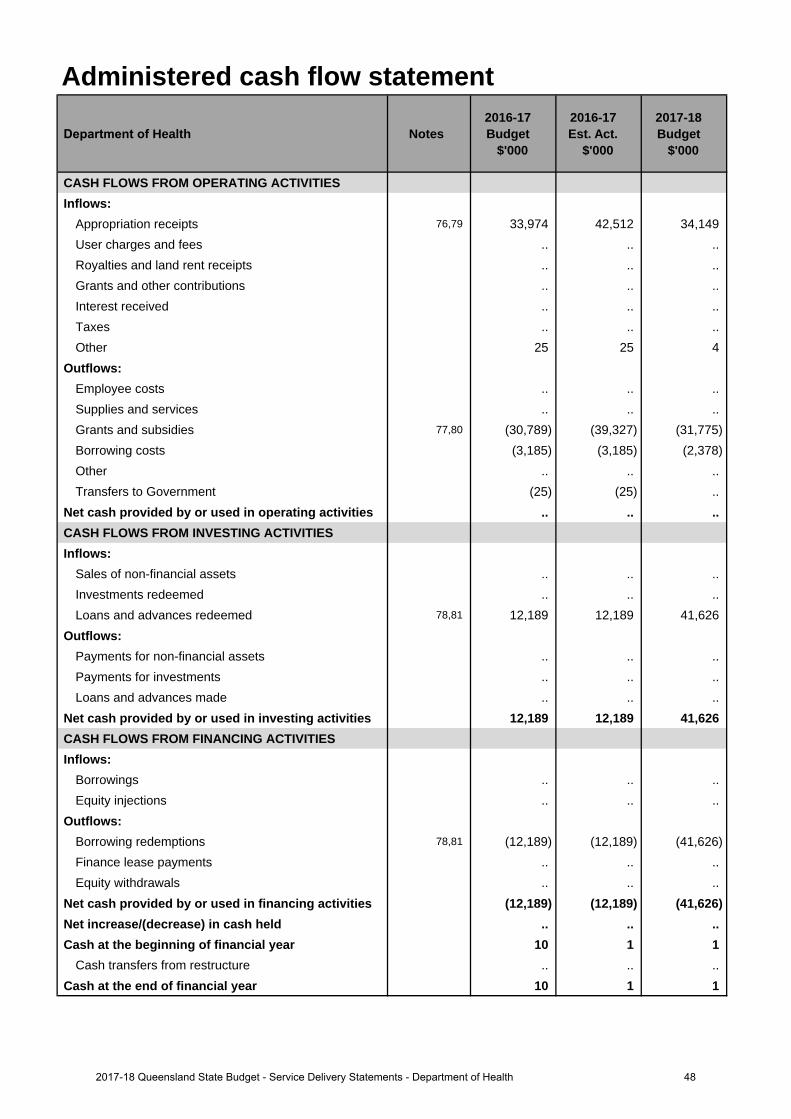
Administered cash flow statement
Department of Health Notes 2016-17 Budget
$'000
2016-17 Est. Act.
$'000
2017-18 Budget
$'000
CASH FLOWS FROM OPERATING ACTIVITIESInflows:
Appropriation receipts 76,79 33,974 42,512 34,149 User charges and fees .. .. .. Royalties and land rent receipts .. .. .. Grants and other contributions .. .. .. Interest received .. .. ..Taxes .. .. ..Other 25 25 4
Outflows:Employee costs .. .. ..Supplies and services .. .. .. Grants and subsidies 77,80 (30,789) (39,327) (31,775)Borrowing costs (3,185) (3,185) (2,378)Other .. .. ..Transfers to Government (25) (25) ..
Net cash provided by or used in operating activities .. .. .. CASH FLOWS FROM INVESTING ACTIVITIESInflows:
Sales of non-financial assets .. .. .. Investments redeemed .. .. ..Loans and advances redeemed 78,81 12,189 12,189 41,626
Outflows:Payments for non-financial assets .. .. .. Payments for investments .. .. .. Loans and advances made .. .. ..
Net cash provided by or used in investing activities 12,189 12,189 41,626 CASH FLOWS FROM FINANCING ACTIVITIESInflows:
Borrowings .. .. ..Equity injections .. .. ..
Outflows:Borrowing redemptions 78,81 (12,189) (12,189) (41,626)Finance lease payments .. .. .. Equity withdrawals .. .. ..
Net cash provided by or used in financing activities (12,189) (12,189) (41,626)Net increase/(decrease) in cash held .. .. .. Cash at the beginning of financial year 10 1 1
Cash transfers from restructure .. .. .. Cash at the end of financial year 10 1 1
482017-18 Queensland State Budget - Service Delivery Statements - Department of Health
Income statementMajor variations between 2016-17 Budget and 2016-17 Estimated Actual include:
1. Decrease due to the realignment of revenue following the reprofiling between Equity and Operating and the timing of expenditure due to deferrals offset by increased funding for National Partnership Agreements.
2. Increase is due to the recognition of Cost of Goods Sold between the Department and Hospital and Health Services, increased revenue as the result of Fee for Service arrangements and Contract labour arrangements with the Hospital and Health Services and revised estimates for compensable accounts.
3. Increase due to revised National Health Reform Agreement estimates together with increased funding for non-National Partnership Agreement programs from the Commonwealth.
4. Increase is due to higher than anticipated recoveries and reimbursements.
5. Increase is associated with the recognition of gain on sale of decommissioned Queensland Ambulance Service vehicles and equipment.
6. Increase is due to the recognition of Cost of Goods Sold between the Department and Hospital and Health Services and the inclusion of expenses associated with deferred and new funding for frontline Health services and associated operating costs.
7. Increase is due to unrecoverable patient transport revenue.
Major variations between 2016-17 Budget and 2017-18 Budget include:
8. Increase due to additional State funding under the current funding compact arrangement, the reprovision of prior year deferrals offset by reduced and/or ceasing Commonwealth National Partnership Agreements.
9. Increase is due to the recognition of Cost of Goods Sold between the Department and Hospital and Health Services, increased revenue as the result of Fee for Service arrangements and Contract labour arrangements with the Hospital and Health Services and revised estimates for compensable accounts.
10. Increase due to revised National Health Reform Agreement estimates together with increased funding for non-National Partnership Agreement programs from the Commonwealth.
11. Increase is due to higher than anticipated recoveries and reimbursements.
12. Increase relates to indexation from Enterprise Bargaining Arrangements and increased costs associated with FTE growth in frontline services for non-prescribed Hospital and Health Services.
13. Increase is due to the recognition of Cost of Goods Sold between the Department and Hospital and Health Services and the inclusion of expenses associated with deferred and new funding for frontline Health services and associated operating costs.
14. Decrease reflects assets transferred to the Hospital and Health Services following completion of Capital projects with the expense now reported within Hospital and Health services.
Major variations between 2016-17 Estimated Actual and the 2017-18 Budget include:
15. Increase due to additional State funding under the current funding compact arrangement, the reprovision of prior year deferrals offset by reduced and/or ceasing Commonwealth National Partnership Agreements and the non-recurrent effect of funding profile changes.
16. Increase is due to updated Fee for Service and Contract labour estimates with the Hospital and Health Services.
17. Increase due to revised National Health Reform Agreement estimates offset by funding for non-National Partnership Agreement programs from the Commonwealth which have either decreased or are yet to be confirmed.
18. Decrease is associated with the gain on sale in 2016-17 for the sale of decommissioned Queensland Ambulance Service vehicles and equipment.
19. Increase relates to indexation from Enterprise Bargaining Arrangements and increased costs associated with FTE growth in frontline services for non-prescribed Hospital and Health Services.
20. Increase is due to the recognition of Cost of Goods Sold between the Department and Hospital and Health Services and the inclusion of expenses associated with deferred and new funding for frontline Health services and associated operating costs.
Explanation of variances in the financial statements
492017-18 Queensland State Budget - Service Delivery Statements - Department of Health
21. Decrease reflects assets transferred to the Hospital and Health Services following completion of Capital projectswith the expense now reported within Hospital and Health services.
22. Decrease is associated with the revised provision for unrecoverable QAS transport fees from interstate andoverseas patients.
Balance sheetMajor variations between 2016-17 Budget and 2016-17 Estimated Actual include:
23. Increase in cash relates to a reduction in outstanding debtors at year end and the Queensland Government Insurance Fund (QGIF) invoice now being paid in July. The Department of Health is intending to provide the Cairns and Hinterland HHS with additional cash via Equity of $40 million in 2016-17 and $30 million in 2017-18 to ensure liquidity.
24. Decrease in receivables due to a reduction in the forecast Commonwealth receivable as well as a reduction inanticipated outstanding debtors at year end.
25. Decrease in Other current assets due to a change in the process with the Queensland Government InsuranceFund (QGIF) invoice now being paid in July.
26. Increase in non-financial assets held for sale due to the land at the former Southport Hospital site held at fairvalue.
27. Decrease in non-current receivables due to a reduction in the forecast outstanding debtors at year end.
28. Decrease in other financial assets due to the reclassification to QTC cash assets.
29. Decrease is due to the reprofile of funding from Equity to Operating and recashflow of projects in the capitalprogram.
30. The 2015-16 actual amortisation expenses were less than forecast, as a result the 2016-17 opening balance ofintangibles was higher than expected.
31. Decrease in Payables - Current Liabilities due to the expected reduction in the amount payable to HHSs at theend of financial year.
32. Increase in accrued employee benefits is due to the growth in the annual levy payable being higher than originallyforecast in the 2016-17 budget papers.
33. Decrease in interest bearing liabilities and derivatives due to transfer of liability to Sunshine Coast HHS.
34. Increase due to the transfer of Lease Liability to Sunshine Coast HHS being reflected against Equity. Offset by thereprofile of funding from Equity to Operating and the recashflow of projects in the capital program.
Major variations between 2016-17 Budget and 2017-18 Budget include:
35. Increase in cash relates to a reduction in outstanding debtors at year end and the Queensland Government Insurance Fund (QGIF) invoice now being paid in July. The Department of Health is intending to provide the Cairns and Hinterland HHS with additional cash via Equity of $40 million in 2016-17 and $30 million in 2017-18 to ensure liquidity.
36. Decrease in receivables due to a reduction in the forecast Commonwealth receivable as well as a reduction inanticipated outstanding debtors at year end.
37. Change in the process with the Queensland Government Insurance Fund (QGIF) invoice now being paid in July.
38. Decrease in non-current receivables due to a reduction in the forecast outstanding debtors at year end.
39. Decrease in other financial assets due to the reclassification to QTC cash assets.
40. Increase in intangibles due to the capitalisation of expenditure related to software programs.
41. Decrease in Payables - Current Liabilities due to the expected reduction in the amount payable to HHSs at theend of financial year.
42. Increase in accrued employee benefits is due to additional payroll accrual day in 2017-18, increase in employeeexpenses relating to Enterprise Bargaining Agreement No 9 and annual levy payable being higher than originallyforecast in the 2016-17 budget papers.
43. Decrease in interest bearing liabilities and derivatives due to transfer of liability to Sunshine Coast HHS.
44. Increase in equity due to transfer of lease liability to Sunshine Coast HHS Financial Statements.
502017-18 Queensland State Budget - Service Delivery Statements - Department of Health
Major variations between 2016-17 Estimated Actual and the 2017-18 Budget include:
45. Increase in cash held to cover additional day of payroll accrual and Enterprise Bargaining rate increase. TheDepartment of Health is intending to provide the Cairns and Hinterland HHS with additional cash via Equity of$40M in 2016-17 and $30M in 2017-18 to ensure liquidity.
46. Decrease in non-financial assets held for sale due to sale of land at the former Southport Hospital site, previouslyheld at fair value.
47. Increase relates to capital expenditure on projects not yet commissioned and transferred to the Hospital andHealth Services.
48. Increase in intangibles due to the capitalisation of expenditure related to software programs.
49. Increase in accrued employee benefits is due to additional payroll accrual day in 2017-18 and an increase inemployee expenses relating to Enterprise Bargaining Agreement No 9.
50. Increase relates to capital expenditure funded via equity not yet transferred to Hospital and Health Services.
Cash flow statementMajor variations between 2016-17 Budget and 2016-17 Estimated Actual include:
51. Decrease due to funding swaps and deferrals together with changes from prior year payables.
52. Increase is due to the recognition of Cost of Goods Sold between the Department and Hospital and HealthServices, increased revenue as the result of Fee for Service arrangements and Contract labour arrangementswith the Hospital and Health Services and revised estimates for compensable accounts.
53. Increase due to revised National Health Reform Agreement estimates together with increased funding for non-National Partnership Agreement programs from the Commonwealth.
54. Increase due to the inclusion of expenses associated with deferred and new funding for frontline Health servicesand associated operating costs.
55. Decrease in Payments for non-financial assets due to recashflow of projects in the capital program from 2016-17to 2017-18 in line with anticipated capital expenditure.
56. Decrease relates to Equity withdrawal arrangements at End of Year between the Department and QueenslandTreasury.
Major variations between 2016-17 Budget and 2017-18 Budget include:
57. Increase due to additional State funding under the current funding compact arrangement, the reprovision of prioryear deferrals offset by reduced and/or ceasing Commonwealth National Partnership Agreements.
58. Increase is due to the recognition of Cost of Goods Sold between the Department and Hospital and HealthServices, increased revenue as the result of Fee for Service arrangements and Contract labour arrangementswith the Hospital and Health Services and revised estimates for compensable accounts.
59. Increase due to revised National Health Reform Agreement estimates together with increased funding for non-National Partnership Agreement programs from the Commonwealth.
60. Increase relates to indexation from Enterprise Bargaining Arrangements and increased costs associated with FTEgrowth in frontline services for non-prescribed Hospital and Health Services.
61. Increase due to the inclusion of expenses associated with deferred and new funding for frontline Health servicesand associated operating costs.
62. Increase in Sales of non-financial assets due to expected sale of the former Southport Hospital site previouslyheld at fair value.
Major variations between 2016-17 Estimated Actual and the 2017-18 Budget include:
63. Increase due to additional State funding under the current funding compact arrangement, the reprovision of prioryear deferrals offset by reduced and or ceasing Commonwealth National Partnership Agreements and the non-recurrent effect of funding profile changes.
64. Increase is due to updated Fee for Service and Contract labour estimates with the Hospital and Health Services.
65. Increase relates to indexation from Enterprise Bargaining Arrangements and increased costs associated with FTEgrowth in frontline services for non-prescribed Hospital and Health Services.
66. Increase due to the inclusion of expenses associated with deferred and new funding for frontline Health servicesand associated operating costs.
512017-18 Queensland State Budget - Service Delivery Statements - Department of Health
67. Increase in Sales of non-financial assets due to expected sale of Southport Hospital site previously held at fair value.
68. Increase in Payments for non-financial assets due to recashflow of projects in the capital program from 2016-17 to 2017-18 in line with anticipated capital expenditure.
69. Increase relates to Equity withdrawal arrangements at End of Year between the Department and Queensland Treasury.
Administered income statementMajor variations between 2016-17 Budget and 2016-17 Estimated Actual include:
70. Increase due to additional non-recurrent funding sourced through Queensland Health for the Office of the Health Ombudsman.
71. Increase in payments to the Office of the Health Ombudsman for operational activities.
Major variations between 2016-17 Estimated Actual and the 2017-18 Budget include:
72. Decrease due to the non-recurrent effect of funding provided for the Office of the Health Ombudsman in 2016-17.
73. Decrease due to the non-recurrent effect of funding provided for the Office of the Health Ombudsman in 2016-17.
Administered balance sheetMajor variations between 2016-17 Budget and 2017-18 Budget include:
74. Decrease due to the scheduled payout of the Mater Loan.
Major variations between 2016-17 Estimated Actual and the 2017-18 Budget include:
75. Decrease due to the scheduled payout of the Mater Loan.
Administered cash flow statementMajor variations between 2016-17 Budget and 2016-17 Estimated Actual include:
76. Increase due to additional non-recurrent funding sourced through Queensland Health for the Office of the Health Ombudsman.
77. Increase in payments to the Office of the Health Ombudsman for operational activities.
Major variations between 2016-17 Budget and 2017-18 Budget include:
78. Increase due to the scheduled payout of the Mater Loan.
Major variations between 2016-17 Estimated Actual and the 2017-18 Budget include:
79. Decrease due to the non-recurrent effect of funding provided for the Office of the Health Ombudsman in 2016-17.
80. Decrease due to the non-recurrent effect of funding provided for the Office of the Health Ombudsman in 2016-17.
81. Increase due to the scheduled payout of the Mater Loan.
522017-18 Queensland State Budget - Service Delivery Statements - Department of Health
Queensland Ambulance Service
Overview The Queensland Ambulance Service (QAS) is an integral part of the primary health care sector in Queensland. QAS’s mission is to deliver timely, quality and appropriate, patient-focused ambulance services to the Queensland community. Established by the Ambulance Service Act 1991, the QAS operates as a statewide service within Queensland Health, and is accountable for the delivery of pre-hospital ambulance response services, emergency and non-emergency pre-hospital patient care and transport services, inter-facility ambulance transport, casualty room services, and planning and coordination of multi-casualty incidents and disasters.
The QAS delivers ambulance services through 15 Local Ambulance Service Networks (LASNs) which are aligned to the State’s Hospital and Health Services. A 16th statewide LASN comprises the Operations Centres (OpCens). There are eight QAS OpCens throughout Queensland responsible for emergency call taking, operational deployment and dispatch, and coordination of non-urgent patient transport services.
The QAS is committed to enhancing patient and staff safety, delivering quality ambulance services in a timely manner and retaining a well-trained, well-equipped workforce. This approach meets the Government’s objectives and priorities including delivering quality frontline services, strengthening the public health system and providing responsive and integrated government services.
Service summary The QAS delivers services from 290 response locations across Queensland. In 2016-17, the QAS had an approved staff establishment of 4,261 full-time equivalents. In 2016-17, the QAS:
• recruited 110 additional ambulance officers to provide enhanced roster coverage• commissioned 170 new and replacement ambulance vehicles• continued the rollout of the new power assisted stretchers. These stretchers provide an enhanced platform for
paramedics and greatly assist in improving patient and officer safety• delivered the QAS Emergency and Fleet Management Precinct, including the Geebung ambulance station,
enhancing emergency and disaster response capability• delivered new and replacement ambulance stations at Rainbow Beach, Yandina and Collinsville• completed refresher training for ambulance officers in situational awareness (SAFE2) to reduce the potential impact
of occupational violence of paramedics.
The QAS will have an operating expense budget of $719.6 million for 2017-18 which is an increase of $46.6 million (6.9 per cent) from the published 2016-17 operating expense budget of $673.1 million. The QAS will have a capital budget of $54.6 million in 2017-18.
Key deliverables for the QAS through 2017-18 include:
• recruitment of 75 additional ambulance operatives to provide enhanced roster coverage to manage increasingdemand for ambulance services
• commissioning 150 new and replacement ambulance vehicles and continuing the rollout of the new power assistedstretchers. These stretchers provide an enhanced work platform for paramedics and greatly assist in improvingpatient and officer safety
• $16.9 million investment in planning or delivering new and replacement ambulance stations at Birtinya, Bundaberg,Kenilworth, Thursday Island, Coral Gardens, Wynnum, Rockhampton, Hervey Bay, Drayton, Cairns and Kirwan
• continued procurement of Dynamic Deployment software as a new solution to enhance resourcing and scheduling offrontline operations.
532017-18 Queensland State Budget - Service Delivery Statements - Queensland Ambulance Service
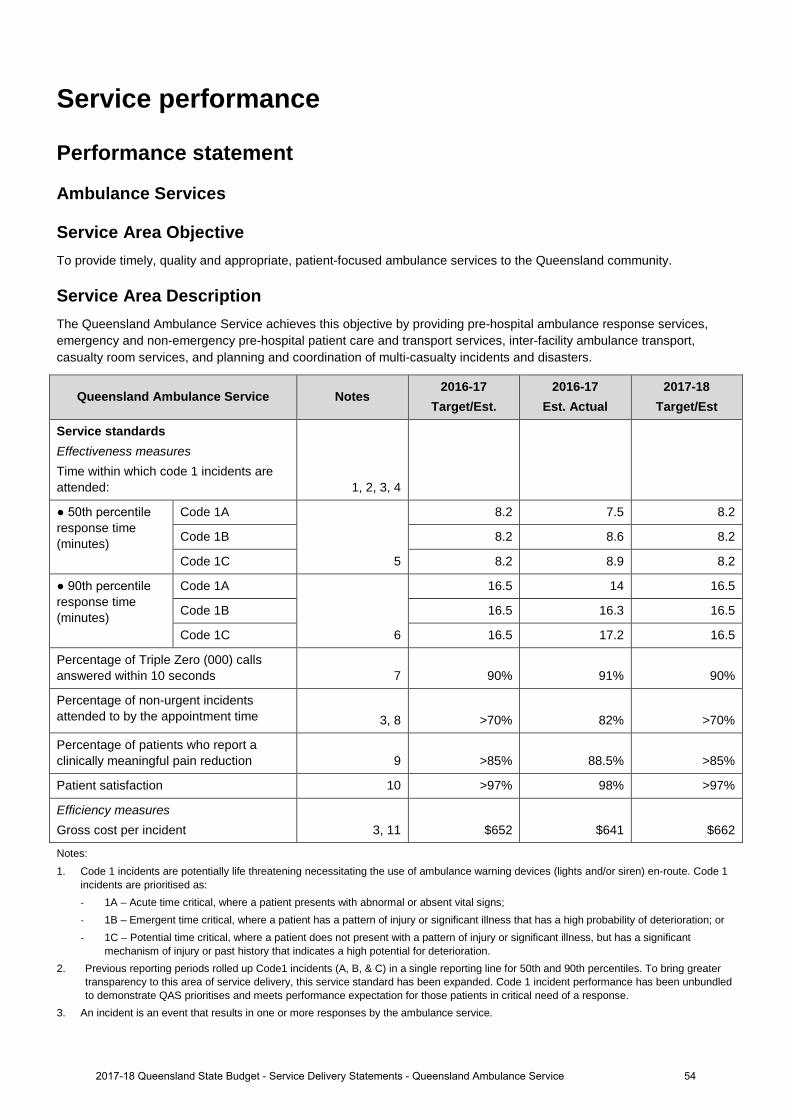
Service performance
Performance statement
Ambulance Services
Service Area Objective To provide timely, quality and appropriate, patient-focused ambulance services to the Queensland community.
Service Area Description The Queensland Ambulance Service achieves this objective by providing pre-hospital ambulance response services, emergency and non-emergency pre-hospital patient care and transport services, inter-facility ambulance transport, casualty room services, and planning and coordination of multi-casualty incidents and disasters.
Queensland Ambulance Service Notes 2016-17
Target/Est. 2016-17
Est. Actual 2017-18
Target/Est
Service standards Effectiveness measures Time within which code 1 incidents are attended: 1, 2, 3, 4
● 50th percentile response time (minutes)
Code 1A
5
8.2 7.5 8.2
Code 1B 8.2 8.6 8.2
Code 1C 8.2 8.9 8.2
● 90th percentile response time (minutes)
Code 1A
6
16.5 14 16.5
Code 1B 16.5 16.3 16.5
Code 1C 16.5 17.2 16.5
Percentage of Triple Zero (000) calls answered within 10 seconds 7 90% 91% 90%
Percentage of non-urgent incidents attended to by the appointment time 3, 8 >70% 82% >70%
Percentage of patients who report a clinically meaningful pain reduction 9 >85% 88.5% >85%
Patient satisfaction 10 >97% 98% >97%
Efficiency measures Gross cost per incident 3, 11 $652 $641 $662
Notes:
1. Code 1 incidents are potentially life threatening necessitating the use of ambulance warning devices (lights and/or siren) en-route. Code 1 incidents are prioritised as: - 1A – Acute time critical, where a patient presents with abnormal or absent vital signs; - 1B – Emergent time critical, where a patient has a pattern of injury or significant illness that has a high probability of deterioration; or - 1C – Potential time critical, where a patient does not present with a pattern of injury or significant illness, but has a significant
mechanism of injury or past history that indicates a high potential for deterioration. 2. Previous reporting periods rolled up Code1 incidents (A, B, & C) in a single reporting line for 50th and 90th percentiles. To bring greater
transparency to this area of service delivery, this service standard has been expanded. Code 1 incident performance has been unbundled to demonstrate QAS prioritises and meets performance expectation for those patients in critical need of a response.
3. An incident is an event that results in one or more responses by the ambulance service.
542017-18 Queensland State Budget - Service Delivery Statements - Queensland Ambulance Service
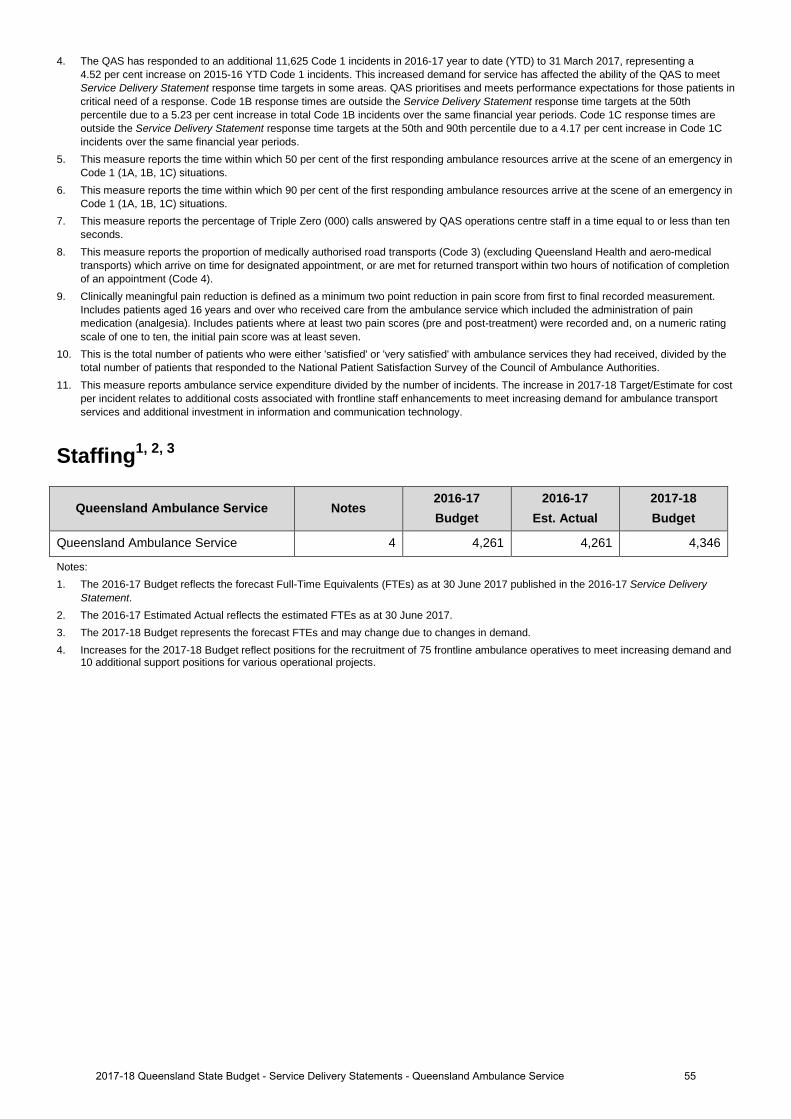
4. The QAS has responded to an additional 11,625 Code 1 incidents in 2016-17 year to date (YTD) to 31 March 2017, representing a 4.52 per cent increase on 2015-16 YTD Code 1 incidents. This increased demand for service has affected the ability of the QAS to meet Service Delivery Statement response time targets in some areas. QAS prioritises and meets performance expectations for those patients in critical need of a response. Code 1B response times are outside the Service Delivery Statement response time targets at the 50th percentile due to a 5.23 per cent increase in total Code 1B incidents over the same financial year periods. Code 1C response times are outside the Service Delivery Statement response time targets at the 50th and 90th percentile due to a 4.17 per cent increase in Code 1C incidents over the same financial year periods.
5. This measure reports the time within which 50 per cent of the first responding ambulance resources arrive at the scene of an emergency in Code 1 (1A, 1B, 1C) situations.
6. This measure reports the time within which 90 per cent of the first responding ambulance resources arrive at the scene of an emergency in Code 1 (1A, 1B, 1C) situations.
7. This measure reports the percentage of Triple Zero (000) calls answered by QAS operations centre staff in a time equal to or less than ten seconds.
8. This measure reports the proportion of medically authorised road transports (Code 3) (excluding Queensland Health and aero-medical transports) which arrive on time for designated appointment, or are met for returned transport within two hours of notification of completion of an appointment (Code 4).
9. Clinically meaningful pain reduction is defined as a minimum two point reduction in pain score from first to final recorded measurement. Includes patients aged 16 years and over who received care from the ambulance service which included the administration of pain medication (analgesia). Includes patients where at least two pain scores (pre and post-treatment) were recorded and, on a numeric rating scale of one to ten, the initial pain score was at least seven.
10. This is the total number of patients who were either 'satisfied' or 'very satisfied' with ambulance services they had received, divided by the total number of patients that responded to the National Patient Satisfaction Survey of the Council of Ambulance Authorities.
11. This measure reports ambulance service expenditure divided by the number of incidents. The increase in 2017-18 Target/Estimate for cost per incident relates to additional costs associated with frontline staff enhancements to meet increasing demand for ambulance transport services and additional investment in information and communication technology.
Staffing1, 2, 3
Queensland Ambulance Service Notes 2016-17 Budget
2016-17 Est. Actual
2017-18 Budget
Queensland Ambulance Service 4 4,261 4,261 4,346
Notes: 1. The 2016-17 Budget reflects the forecast Full-Time Equivalents (FTEs) as at 30 June 2017 published in the 2016-17 Service Delivery
Statement. 2. The 2016-17 Estimated Actual reflects the estimated FTEs as at 30 June 2017. 3. The 2017-18 Budget represents the forecast FTEs and may change due to changes in demand. 4. Increases for the 2017-18 Budget reflect positions for the recruitment of 75 frontline ambulance operatives to meet increasing demand and
10 additional support positions for various operational projects.
552017-18 Queensland State Budget - Service Delivery Statements - Queensland Ambulance Service
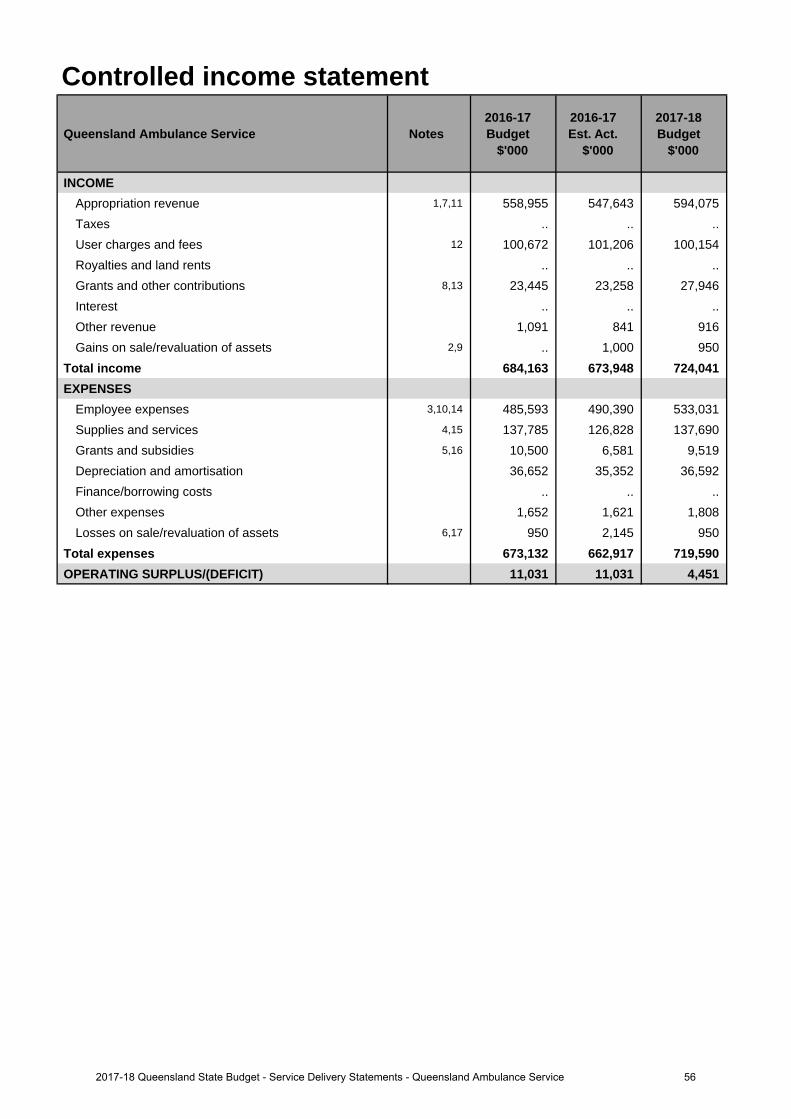
Controlled income statement
Queensland Ambulance Service Notes 2016-17 Budget
$'000
2016-17 Est. Act.
$'000
2017-18 Budget
$'000
INCOMEAppropriation revenue 1,7,11 558,955 547,643 594,075 Taxes .. .. .. User charges and fees 12 100,672 101,206 100,154 Royalties and land rents .. .. .. Grants and other contributions 8,13 23,445 23,258 27,946 Interest .. .. .. Other revenue 1,091 841 916 Gains on sale/revaluation of assets 2,9 .. 1,000 950
Total income 684,163 673,948 724,041 EXPENSES
Employee expenses 3,10,14 485,593 490,390 533,031 Supplies and services 4,15 137,785 126,828 137,690 Grants and subsidies 5,16 10,500 6,581 9,519 Depreciation and amortisation 36,652 35,352 36,592 Finance/borrowing costs .. .. .. Other expenses 1,652 1,621 1,808 Losses on sale/revaluation of assets 6,17 950 2,145 950
Total expenses 673,132 662,917 719,590 OPERATING SURPLUS/(DEFICIT) 11,031 11,031 4,451
562017-18 Queensland State Budget - Service Delivery Statements - Queensland Ambulance Service
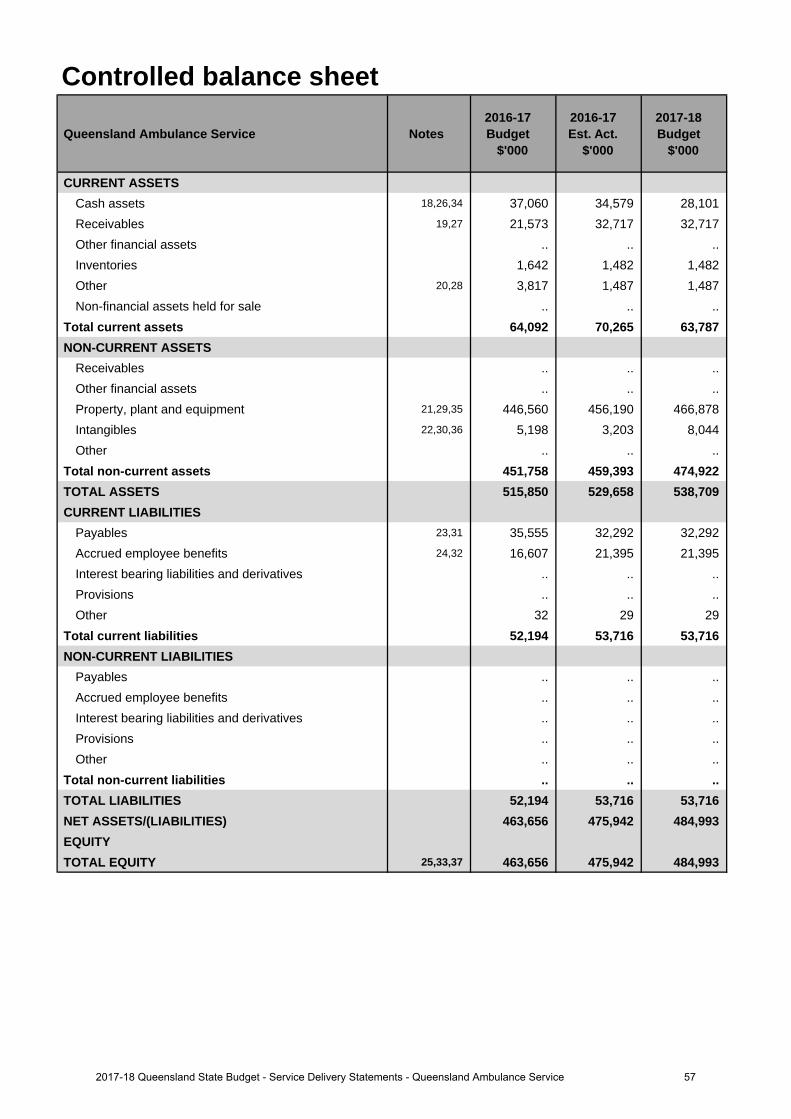
Controlled balance sheet
Queensland Ambulance Service Notes 2016-17 Budget
$'000
2016-17 Est. Act.
$'000
2017-18 Budget
$'000
CURRENT ASSETSCash assets 18,26,34 37,060 34,579 28,101 Receivables 19,27 21,573 32,717 32,717 Other financial assets .. .. .. Inventories 1,642 1,482 1,482 Other 20,28 3,817 1,487 1,487 Non-financial assets held for sale .. .. ..
Total current assets 64,092 70,265 63,787 NON-CURRENT ASSETS
Receivables .. .. .. Other financial assets .. .. .. Property, plant and equipment 21,29,35 446,560 456,190 466,878 Intangibles 22,30,36 5,198 3,203 8,044 Other .. .. ..
Total non-current assets 451,758 459,393 474,922 TOTAL ASSETS 515,850 529,658 538,709 CURRENT LIABILITIES
Payables 23,31 35,555 32,292 32,292 Accrued employee benefits 24,32 16,607 21,395 21,395 Interest bearing liabilities and derivatives .. .. .. Provisions .. .. .. Other 32 29 29
Total current liabilities 52,194 53,716 53,716 NON-CURRENT LIABILITIES
Payables .. .. .. Accrued employee benefits .. .. .. Interest bearing liabilities and derivatives .. .. .. Provisions .. .. .. Other .. .. ..
Total non-current liabilities .. .. .. TOTAL LIABILITIES 52,194 53,716 53,716 NET ASSETS/(LIABILITIES) 463,656 475,942 484,993 EQUITYTOTAL EQUITY 25,33,37 463,656 475,942 484,993
572017-18 Queensland State Budget - Service Delivery Statements - Queensland Ambulance Service
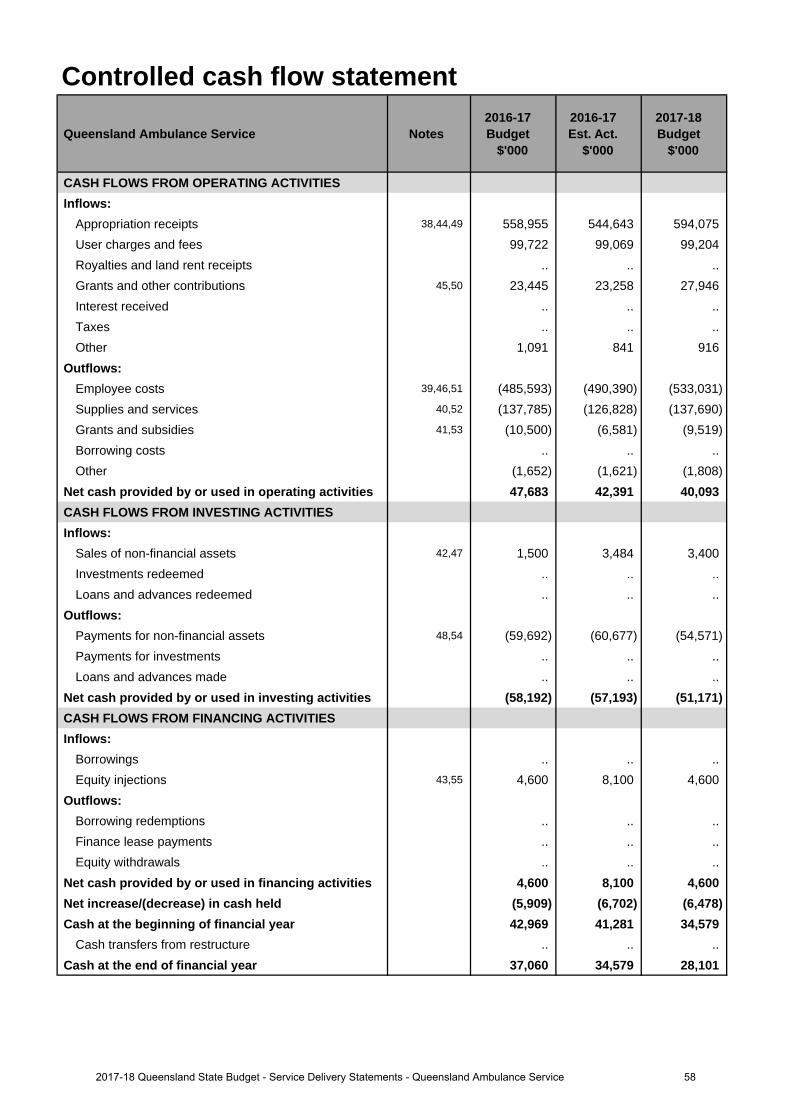
Controlled cash flow statement
Queensland Ambulance Service Notes 2016-17 Budget
$'000
2016-17 Est. Act.
$'000
2017-18 Budget
$'000
CASH FLOWS FROM OPERATING ACTIVITIESInflows:
Appropriation receipts 38,44,49 558,955 544,643 594,075 User charges and fees 99,722 99,069 99,204 Royalties and land rent receipts .. .. .. Grants and other contributions 45,50 23,445 23,258 27,946 Interest received .. .. .. Taxes .. .. .. Other 1,091 841 916
Outflows:Employee costs 39,46,51 (485,593) (490,390) (533,031)Supplies and services 40,52 (137,785) (126,828) (137,690)Grants and subsidies 41,53 (10,500) (6,581) (9,519)Borrowing costs .. .. .. Other (1,652) (1,621) (1,808)
Net cash provided by or used in operating activities 47,683 42,391 40,093 CASH FLOWS FROM INVESTING ACTIVITIESInflows:
Sales of non-financial assets 42,47 1,500 3,484 3,400 Investments redeemed .. .. .. Loans and advances redeemed .. .. ..
Outflows:Payments for non-financial assets 48,54 (59,692) (60,677) (54,571)Payments for investments .. .. .. Loans and advances made .. .. ..
Net cash provided by or used in investing activities (58,192) (57,193) (51,171)CASH FLOWS FROM FINANCING ACTIVITIESInflows:
Borrowings .. .. .. Equity injections 43,55 4,600 8,100 4,600
Outflows:Borrowing redemptions .. .. .. Finance lease payments .. .. .. Equity withdrawals .. .. ..
Net cash provided by or used in financing activities 4,600 8,100 4,600 Net increase/(decrease) in cash held (5,909) (6,702) (6,478)Cash at the beginning of financial year 42,969 41,281 34,579
Cash transfers from restructure .. .. .. Cash at the end of financial year 37,060 34,579 28,101
582017-18 Queensland State Budget - Service Delivery Statements - Queensland Ambulance Service
Income statementMajor variations between 2016-17 Budget and 2016-17 Estimated Actual include:
1. Decrease in appropriation is due to the deferral of funds to 2017-18 associated with various Information,Communication and Technologies (ICT) projects to align with changes in ICT investment.
2. Increase is due to the recording of gains on sale of decommissioned ambulance vehicles and equipment.
3. Increase in employee expenses predominantly relates to costs associated with employing additional ambulanceofficers to meet rising demand for ambulance transport services, additional expenditure incurred due to extremeweather events in the last quarter of the financial year, recruitment costs for front line ambulance officers,paramedic safety training, staff uniforms and protective equipment, and Enterprise Bargaining escalation.
4. Decrease in supplies and services relates mostly to reduced fuel and fleet servicing costs, contractor andprofessional services, and reduced shared service provider expense.
5. The decrease in grants and subsidies is due to the reprioritisation of the QAS ICT program delivered by Public Safety Business Agency (PSBA) on behalf of QAS. As part of the machinery-of-government change in 2013 where the QAS became part of Queensland Health, communications assets were transferred to PSBA to be maintained by PSBA to enable efficiencies and consistency across the network. QAS pays an operating and capital grant for their on-going communications capital program.
6. Increase is due to unrecoverable patient transport revenue.
Major variations between 2016-17 Budget and 2017-18 Budget include:
7. Increase in appropriation revenue is due to additional funding for 75 ambulance officers and the deferral of fundsfrom 2016-17 associated with various ICT projects carried over from 2016-17.
8. Increase in grants and contributions is principally due to additional funds received from the Department ofTourism, Major Events, Small Business and the Commonwealth Games to assist with the QAS preparation anddelivery of the 2018 Commonwealth Games.
9. Increase is due to the recording of gains on sale of decommissioned ambulance vehicles and equipment.
10. Increase in employee expenses is principally due to additional funding received for the anticipated growth in QASactivities. These funds are primarily for additional operational staff costs to meet the expected increase in demandfor ambulance transport services and pre-hospital care.
Major variations between 2016-17 Estimated Actual and the 2017-18 Budget include:
11. Increase in appropriation revenue is due to additional funding for 75 ambulance officers for anticipated growth inQAS activities and the deferral of funds from 2016-17 associated with various ICT projects carried over from2016-17.
12. The decrease in user charges is largely due to reduced receipts from interstate patient transports, educationaltraining due to increased competition and a decline from the mining sector.
13. Increase in grants and contributions is chiefly due to additional funds received from the Department of Tourism,Major Events, Small Business and the Commonwealth Games to assist with the QAS preparation and delivery ofthe 2018 Commonwealth Games.
14. Increase in employee expenses is principally due to additional funding received for the anticipated growth in QASactivities. These funds are primarily for additional operational staff costs to meet the expected increase in demandfor ambulance transport services and pre-hospital care.
15. Increase in supplies and services relates mostly to non-labour costs associated with additional ambulanceofficers, leasing costs for defibrillators and maintenance costs for new powered stretchers and loaders and anallocation for other non-labour expense increases.
16. Increase in grants and subsidies is mainly due to the ICT program delivered by PSBA, which includes digitalinfrastructure, state-wide communication centre modernisation, and existing communication network upgrades.
17. Decrease is primarily due to the revised provision for unrecoverable transport fees from interstate and overseaspatients.
Explanation of variances in the financial statements
592017-18 Queensland State Budget - Service Delivery Statements - Queensland Ambulance Service
Balance sheetMajor variations between 2016-17 Budget and 2016-17 Estimated Actual include:
18. Decrease in cash assets is principally due to the decrease in payables.
19. Increase in receivables is primarily due to patient transport charges associated with Queensland Health Authorised Transports (QHAT), and the Commonwealth Department of Veteran Affairs. These amounts will be fully recovered in 2017-18.
20. Decrease in other assets is due to a reduction in prepayments.
21. Increase in Property Plant and Equipment is due to capital acquisitions and an upward movement in asset re-valuations.
22. Decrease in intangibles is due to unspent capital expenditure in 2016-17 for internally generated computer software.
23. Decrease in payables is due to reduced accrued expenses associated with ICT services delivered by PSBA.
24. Increase in accrued employee benefits is due to prior end-of-year balance flow through effect in relation to balance date accruals.
25. Increase in equity is due to additional investment in Property, Plant and Equipment and a one off equity injection received in 2016-17.
Major variations between 2016-17 Budget and 2017-18 Budget include:
26. Decrease in cash assets is due to decrease in payables and increase in receivables.
27. Increase in receivables is primarily due to patient transport charges associated with QHAT, and the Commonwealth Department of Veteran Affairs. These amounts will be fully recovered in 2017-18.
28. Decrease in other assets is due to a reduction in prepayments.
29. Increase in Property, Plant and Equipment is due to the capital expenditure planned for 2017-18.
30. Increase in intangibles is due to the capital expenditure planned for 2017-18 for internally generated computer software.
31. Decrease in payables is due to reduced accrued expenses associated with ICT services delivered by PSBA.
32. Increase in accrued employee benefits is due to prior end-of-year balance flow through effect in relation to balance date accruals.
33. Increase in equity relates to additional investment in Property, Plant and Equipment and a one off equity injection received in 2016-17.
Major variations between 2016-17 Estimated Actual and the 2017-18 Budget include:
34. Decrease in cash assets is principally due to the planned capital expenditure for 2017-18.
35. Increase in Property, Plant and Equipment is due to the capital expenditure planned for 2017-18.
36. Increase in intangibles is due to the capital expenditure planned for 2017-18 for internally generated computer software.
37. Increase in equity relates to additional investment in Property, Plant and Equipment and a one off equity injection received in 2016-17.
Cash flow statementMajor variations between 2016-17 Budget and 2016-17 Estimated Actual include:
38. Decrease in appropriation is due to the deferral of funds to 2017-18 associated with various ICT projects to align with changes in ICT investment.
39. Increase in employee expenses predominantly relates to costs associated with employing additional ambulance officers to meet rising demand for ambulance transport services, additional expenditure incurred due to extreme weather events in the last quarter of the financial year, recruitment costs for front line ambulance officers, paramedic safety training, staff uniforms and protective equipment, and Enterprise Bargaining escalation.
40. Decrease in supplies and services relates mostly to reduced fuel and fleet servicing costs, contractor and professional services, and reduced shared service provider expense.
602017-18 Queensland State Budget - Service Delivery Statements - Queensland Ambulance Service
41. The decrease in grants and subsidies is due to the reprioritisation of the QAS ICT program delivered by PSBA on behalf of QAS. As part of the machinery-of-government change in 2013 to Queensland Health, communications assets were transferred to PSBA to be maintained by PSBA to enable efficiencies and consistency across the network. QAS pays an operating and capital grant for their on-going communications capital program.
42. Increase is due to the recording of cash from proceeds of sales of decommissioned ambulance vehicles andequipment.
43. Increase relates to equity injection from the consolidated fund for capital infrastructure investment in 2016-17.
Major variations between 2016-17 Budget and 2017-18 Budget include:
44. Increase in appropriation revenue is due to additional funding for 75 ambulance officers and the deferral of fundsfrom 2016-17 associated with various ICT projects carried over from 2016-17.
45. Increase in grants and contributions is principally due to additional funds received from the Department ofTourism, Major Events, Small Business and the Commonwealth Games to assist with the QAS preparation anddelivery of the 2018 Commonwealth Games.
46. Increase in employee expenses is principally due to additional funding received for the anticipated growth in QASactivities. These funds are primarily for additional operational staff costs to meet the expected increase in demandfor ambulance transport services and pre-hospital care.
47. Increase is due to the recording of cash from proceeds of sales of decommissioned ambulance vehicles andequipment.
48. Decrease relates to payments for Property, Plant and Equipment as part of the QAS capital expenditure plan for2017-18.
Major variations between 2016-17 Estimated Actual and the 2017-18 Budget include:
49. Increase in appropriation revenue is due to additional funding for 75 ambulance operatives for anticipated growthin QAS activities and the deferral of funds from 2016-17 associated with various ICT projects carried over from2016-17.
50. Increase in grants and contributions is chiefly due to additional funds received from the Department of Tourism,Major Events, Small Business and the Commonwealth Games to assist with the QAS preparation for the 2018Commonwealth Games.
51. Increase in employee expenses is principally due to additional funding received for the anticipated growth in QASactivities. These funds are primarily for additional operational staff costs to meet the expected increase in demandfor ambulance transport services and pre-hospital care.
52. Increase in supplies and services relates mostly to non-labour costs associated with additional ambulanceofficers, leasing costs for defibrillators and maintenance costs for new powered stretchers and loaders and anallocation for other non-labour expense increases.
53. Increase in grants and subsidies is mainly due to the ICT program delivered by PSBA, which includes digitalinfrastructure, state-wide communication centre modernisation, and existing communication network upgrades.
54. Decrease relates to payments for Property, Plant and Equipment and intangibles as part of the QAS capitalexpenditure plan for 2017-18.
55. Decrease relates to one off equity injection from the consolidated fund for capital infrastructure investment in2016-17.
612017-18 Queensland State Budget - Service Delivery Statements - Queensland Ambulance Service
Cairns and Hinterland Hospital and Health Service
Overview The Cairns and Hinterland Hospital and Health Service (HHS) is an independent statutory body overseen by a local Hospital and Health Board. The Cairns and Hinterland HHS is responsible for the delivery of public hospital and health services in the geographical area stretching from Jumbun in the south to Cow Bay in the north and Croydon in the west. This area is approximately 141,000 square kilometres in size and supports an estimated 285,000 people. By 2026, it is estimated that an additional 67,000 people will reside within the catchment area with close to one in five residents being over 65 years of age.
The Cairns and Hinterland HHS is responsible for the direct management of the facilities within the HHS’s geographical boundaries including:
• Atherton Hospital • Forsayth Primary Health Centre • Malanda Primary Health Centre
• Babinda Multi-Purpose HealthCentre
• Georgetown Primary HealthCentre
• Mareeba Hospital
• Cairns Hospital • Gordonvale Hospital • Millaa Millaa Primary HealthCentre
• Chillagoe Primary Health Centre • Gurriny Yealamucka HealthService (Yarrabah)
• Mossman Multi-Purpose HealthService
• Cow Bay Primary Health Centre • Herberton Hospital • Mount Garnet Primary HealthCentre
• Croydon Primary Health Centre • Innisfail Hospital • Ravenshoe Primary Health CareCentre
• Dimbulah Primary HealthCentre
• Lotus Glen Health Service • Tully Hospital
The Cairns and Hinterland HHS is committed to achieving its vision of providing world-class health services to improve the social, emotional and physical well-being of people in Cairns and Hinterland and the North East Australian region.
In working towards better health for Queenslanders, the strategic plan of the Cairns and Hinterland HHS aligns with the Queensland Government’s objectives for the community to deliver quality frontline services through strengthening the public health system and to restore integrity and accountability. This will be achieved through the following strategic objectives:
• striving to continually improve patient care, safety and outcomes• providing health care services that are patient focused and culturally appropriate• actively engaging stakeholders and considering their input in the delivery of healthcare services• deploying the right people, to the right service, in the right place at the right time, and creating and maintaining a
positive and productive workplace culture that will enable our workforce to be fully engaged, educated and supported• ensuring fiscally responsible decision making while providing stable and sustainable health services• establishing engaged, consistent and timely decision making processes at all levels of the organisation and at the
closest point to service delivery and• building, developing and implementing technology and systems that support integrated health care delivery and
enhance organisational performance.
622017-18 Queensland State Budget - Service Delivery Statements - Cairns and Hinterland Hospital and Health Service
Service summary The Cairns and Hinterland HHS has an operating budget of $906.8 million for 2017-18 which is an increase of $128.9 million (16.6 per cent) from the published 2016-17 operating budget of $777.9 million.
The Cairns and Hinterland HHS provides a comprehensive range of community and primary health services, including aged care assessment; Aboriginal and Torres Strait Islander health programs; child and maternal health services; alcohol, tobacco and other drug services; home care services; community health nursing; sexual health service; allied health services; oral health; offender and refugee health services; and health promotion programs. Cairns Hospital is a major regional hospital which hosts a number of outreach services to neighbouring HHSs as well as a major referral accepting site for rural and remote patients both within and outside the HHS geographical footprint.
In October 2016, the Cairns and Hinterland HHS released its comprehensive seven point plan “Embracing a Healthier Future”. The plan is based on the following elements which are integral for the delivery of sustainable health services into the future:
• Quality and Safety• Governance Continuity• Financial Stability• Workforce Development• Digital Systems• Clinical Services Planning and Performance• Engagement and Communication.
During 2017-18, the Cairns and Hinterland HHS will commence a range of activities under this plan including embedding the new digital capability to improve health services for the community, including the co-design phase of the Regional eHealth Project and implementing ‘Health Pathways’ along with other strategies aimed at improving access to outpatient services. The HHS has also developed plans to improve service delivery for Mental Health service and Breastscreen services.
The Innisfail Hospital became the first hospital in the HHS to implement a nurse navigator in February 2016. This has had a positive patient impact with decreased length of stay in hospitals, greater linkage to support services and fewer readmissions.
The HHS will continue to contribute to a number of high priority initiatives including participation in the Pre-Exposure Prophylaxis trial (to reduce the risk of acquiring HIV in people who may be at a high risk of exposure to the virus) and sexually transmissible infections (STI) programs to support the sexual health of our patient population and communities.
During 2017-18, a number of capital projects will be progressed including Atherton Hospital, Dimbulah Primary Healthcare Clinic, The Cairns South Health Precinct and Cairns YPARC (Youth Prevention and Recovery Centre).
632017-18 Queensland State Budget - Service Delivery Statements - Cairns and Hinterland Hospital and Health Service
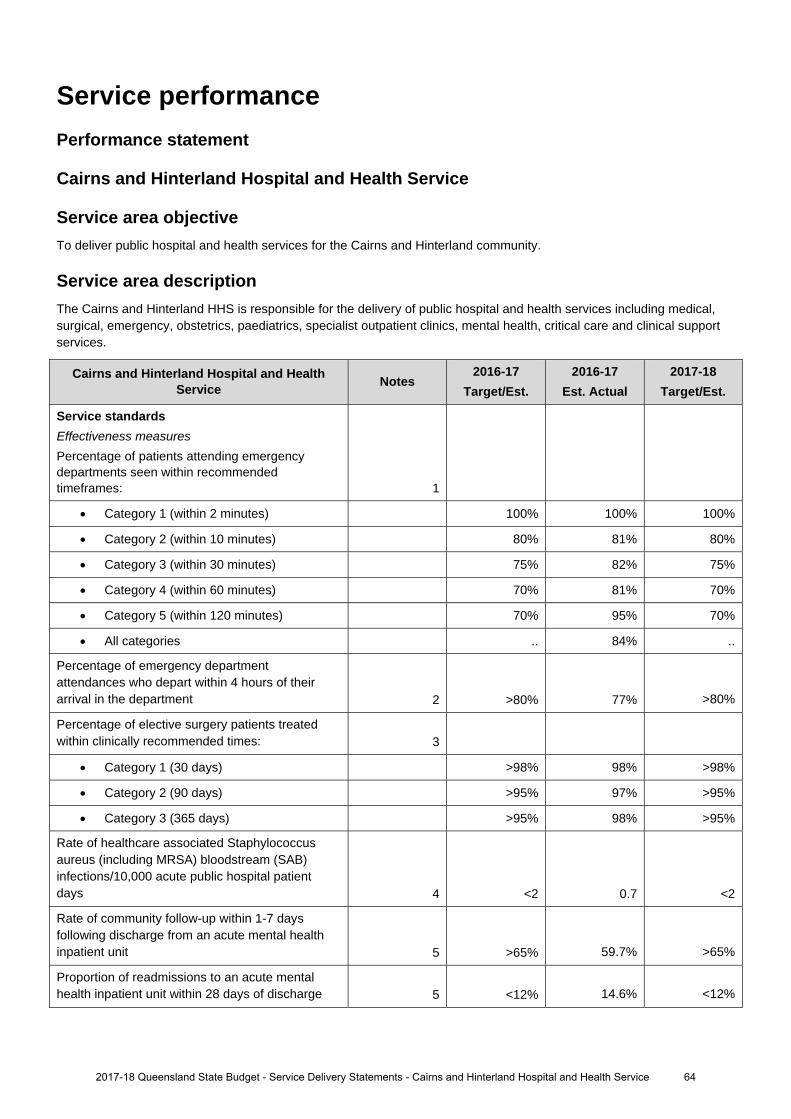
Service performance Performance statement
Cairns and Hinterland Hospital and Health Service
Service area objective To deliver public hospital and health services for the Cairns and Hinterland community.
Service area description The Cairns and Hinterland HHS is responsible for the delivery of public hospital and health services including medical, surgical, emergency, obstetrics, paediatrics, specialist outpatient clinics, mental health, critical care and clinical support services.
Cairns and Hinterland Hospital and Health Service Notes
2016-17 Target/Est.
2016-17 Est. Actual
2017-18 Target/Est.
Service standards
Effectiveness measures
Percentage of patients attending emergency departments seen within recommended timeframes: 1
Category 1 (within 2 minutes) 100% 100% 100%
Category 2 (within 10 minutes) 80% 81% 80%
Category 3 (within 30 minutes) 75% 82% 75%
Category 4 (within 60 minutes) 70% 81% 70%
Category 5 (within 120 minutes) 70% 95% 70%
All categories .. 84% ..
Percentage of emergency department attendances who depart within 4 hours of their arrival in the department 2 >80% 77% >80%
Percentage of elective surgery patients treated within clinically recommended times: 3
Category 1 (30 days) >98% 98% >98%
Category 2 (90 days) >95% 97% >95%
Category 3 (365 days) >95% 98% >95%
Rate of healthcare associated Staphylococcus aureus (including MRSA) bloodstream (SAB) infections/10,000 acute public hospital patient days 4 <2 0.7 <2
Rate of community follow-up within 1-7 days following discharge from an acute mental health inpatient unit 5 >65% 59.7% >65%
Proportion of readmissions to an acute mental health inpatient unit within 28 days of discharge 5 <12% 14.6% <12%
2017-18 Queensland State Budget - Service Delivery Statements - Cairns and Hinterland Hospital and Health Service 64
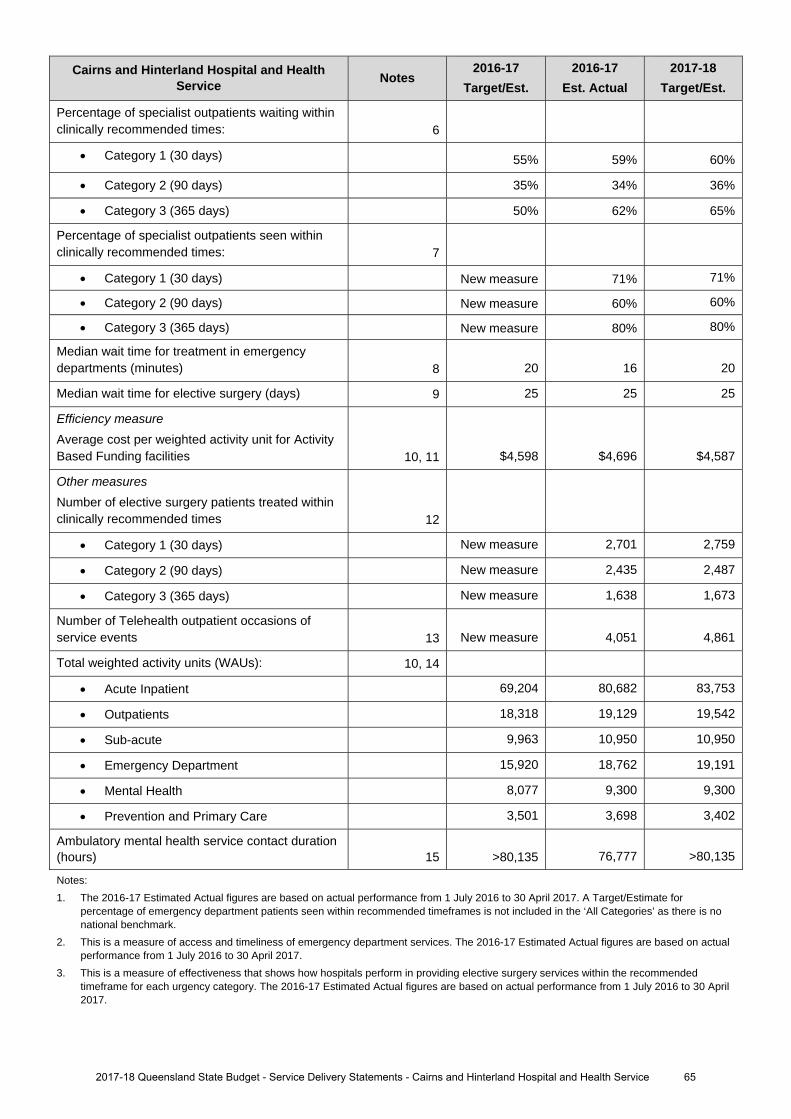
Cairns and Hinterland Hospital and Health Service Notes
2016-17 Target/Est.
2016-17 Est. Actual
2017-18 Target/Est.
Percentage of specialist outpatients waiting within clinically recommended times: 6
Category 1 (30 days) 55% 59% 60%
Category 2 (90 days) 35% 34% 36%
Category 3 (365 days) 50% 62% 65%
Percentage of specialist outpatients seen within clinically recommended times: 7
Category 1 (30 days) New measure 71% 71%
Category 2 (90 days) New measure 60% 60%
Category 3 (365 days) New measure 80% 80%
Median wait time for treatment in emergency departments (minutes) 8 20 16 20
Median wait time for elective surgery (days) 9 25 25 25
Efficiency measure Average cost per weighted activity unit for Activity Based Funding facilities 10, 11 $4,598 $4,696 $4,587
Other measures Number of elective surgery patients treated within clinically recommended times 12
Category 1 (30 days) New measure 2,701 2,759
Category 2 (90 days) New measure 2,435 2,487
Category 3 (365 days) New measure 1,638 1,673
Number of Telehealth outpatient occasions of service events 13 New measure 4,051 4,861
Total weighted activity units (WAUs): 10, 14
Acute Inpatient 69,204 80,682 83,753
Outpatients 18,318 19,129 19,542
Sub-acute 9,963 10,950 10,950
Emergency Department 15,920 18,762 19,191
Mental Health 8,077 9,300 9,300
Prevention and Primary Care 3,501 3,698 3,402
Ambulatory mental health service contact duration (hours) 15 >80,135 76,777 >80,135
Notes: 1. The 2016-17 Estimated Actual figures are based on actual performance from 1 July 2016 to 30 April 2017. A Target/Estimate for
percentage of emergency department patients seen within recommended timeframes is not included in the ‘All Categories’ as there is no national benchmark.
2. This is a measure of access and timeliness of emergency department services. The 2016-17 Estimated Actual figures are based on actual performance from 1 July 2016 to 30 April 2017.
3. This is a measure of effectiveness that shows how hospitals perform in providing elective surgery services within the recommended timeframe for each urgency category. The 2016-17 Estimated Actual figures are based on actual performance from 1 July 2016 to 30 April 2017.
2017-18 Queensland State Budget - Service Delivery Statements - Cairns and Hinterland Hospital and Health Service 65
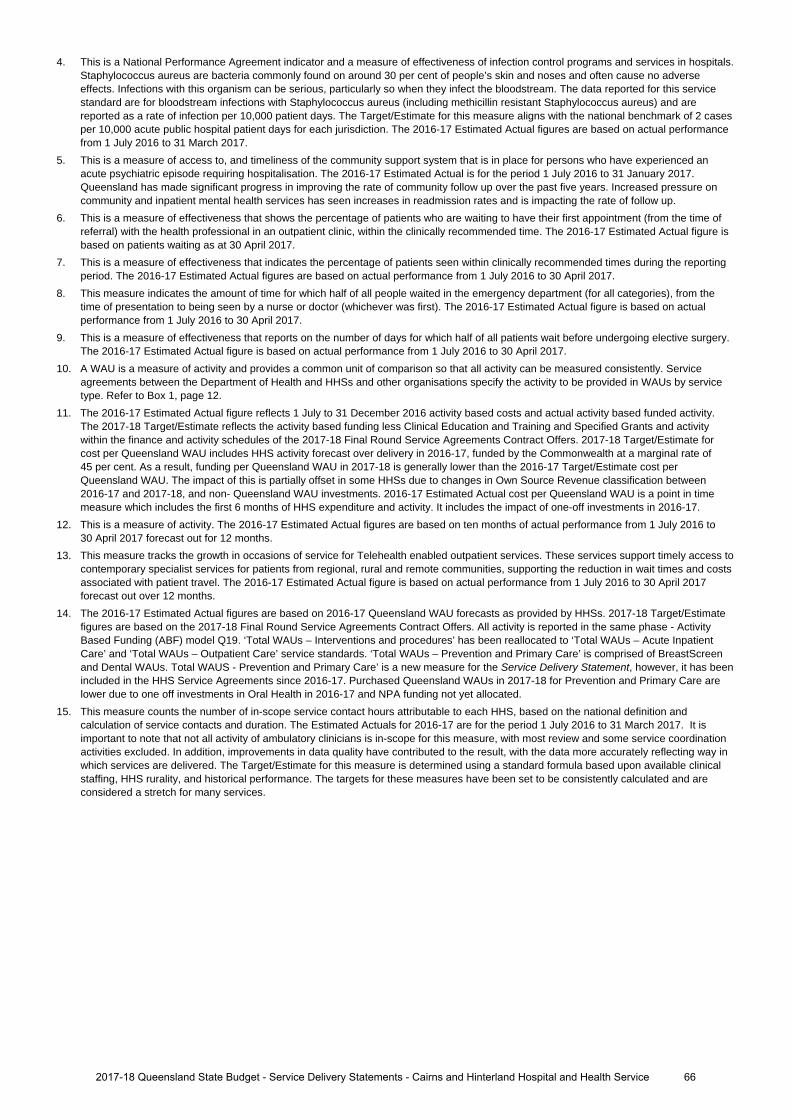
4. This is a National Performance Agreement indicator and a measure of effectiveness of infection control programs and services in hospitals. Staphylococcus aureus are bacteria commonly found on around 30 per cent of people’s skin and noses and often cause no adverse effects. Infections with this organism can be serious, particularly so when they infect the bloodstream. The data reported for this service standard are for bloodstream infections with Staphylococcus aureus (including methicillin resistant Staphylococcus aureus) and are reported as a rate of infection per 10,000 patient days. The Target/Estimate for this measure aligns with the national benchmark of 2 cases per 10,000 acute public hospital patient days for each jurisdiction. The 2016-17 Estimated Actual figures are based on actual performance from 1 July 2016 to 31 March 2017.
5. This is a measure of access to, and timeliness of the community support system that is in place for persons who have experienced an acute psychiatric episode requiring hospitalisation. The 2016-17 Estimated Actual is for the period 1 July 2016 to 31 January 2017. Queensland has made significant progress in improving the rate of community follow up over the past five years. Increased pressure on community and inpatient mental health services has seen increases in readmission rates and is impacting the rate of follow up.
6. This is a measure of effectiveness that shows the percentage of patients who are waiting to have their first appointment (from the time of referral) with the health professional in an outpatient clinic, within the clinically recommended time. The 2016-17 Estimated Actual figure is based on patients waiting as at 30 April 2017.
7. This is a measure of effectiveness that indicates the percentage of patients seen within clinically recommended times during the reporting period. The 2016-17 Estimated Actual figures are based on actual performance from 1 July 2016 to 30 April 2017.
8. This measure indicates the amount of time for which half of all people waited in the emergency department (for all categories), from the time of presentation to being seen by a nurse or doctor (whichever was first). The 2016-17 Estimated Actual figure is based on actual performance from 1 July 2016 to 30 April 2017.
9. This is a measure of effectiveness that reports on the number of days for which half of all patients wait before undergoing elective surgery. The 2016-17 Estimated Actual figure is based on actual performance from 1 July 2016 to 30 April 2017.
10. A WAU is a measure of activity and provides a common unit of comparison so that all activity can be measured consistently. Service agreements between the Department of Health and HHSs and other organisations specify the activity to be provided in WAUs by service type. Refer to Box 1, page 12.
11. The 2016-17 Estimated Actual figure reflects 1 July to 31 December 2016 activity based costs and actual activity based funded activity. The 2017-18 Target/Estimate reflects the activity based funding less Clinical Education and Training and Specified Grants and activity within the finance and activity schedules of the 2017-18 Final Round Service Agreements Contract Offers. 2017-18 Target/Estimate for cost per Queensland WAU includes HHS activity forecast over delivery in 2016-17, funded by the Commonwealth at a marginal rate of 45 per cent. As a result, funding per Queensland WAU in 2017-18 is generally lower than the 2016-17 Target/Estimate cost per Queensland WAU. The impact of this is partially offset in some HHSs due to changes in Own Source Revenue classification between 2016-17 and 2017-18, and non- Queensland WAU investments. 2016-17 Estimated Actual cost per Queensland WAU is a point in time measure which includes the first 6 months of HHS expenditure and activity. It includes the impact of one-off investments in 2016-17.
12. This is a measure of activity. The 2016-17 Estimated Actual figures are based on ten months of actual performance from 1 July 2016 to 30 April 2017 forecast out for 12 months.
13. This measure tracks the growth in occasions of service for Telehealth enabled outpatient services. These services support timely access to contemporary specialist services for patients from regional, rural and remote communities, supporting the reduction in wait times and costs associated with patient travel. The 2016-17 Estimated Actual figure is based on actual performance from 1 July 2016 to 30 April 2017 forecast out over 12 months.
14. The 2016-17 Estimated Actual figures are based on 2016-17 Queensland WAU forecasts as provided by HHSs. 2017-18 Target/Estimate figures are based on the 2017-18 Final Round Service Agreements Contract Offers. All activity is reported in the same phase - Activity Based Funding (ABF) model Q19. ‘Total WAUs – Interventions and procedures’ has been reallocated to ‘Total WAUs – Acute Inpatient Care’ and ‘Total WAUs – Outpatient Care’ service standards. ‘Total WAUs – Prevention and Primary Care’ is comprised of BreastScreen and Dental WAUs. Total WAUS - Prevention and Primary Care’ is a new measure for the Service Delivery Statement, however, it has been included in the HHS Service Agreements since 2016-17. Purchased Queensland WAUs in 2017-18 for Prevention and Primary Care are lower due to one off investments in Oral Health in 2016-17 and NPA funding not yet allocated.
15. This measure counts the number of in-scope service contact hours attributable to each HHS, based on the national definition and calculation of service contacts and duration. The Estimated Actuals for 2016-17 are for the period 1 July 2016 to 31 March 2017. It is important to note that not all activity of ambulatory clinicians is in-scope for this measure, with most review and some service coordination activities excluded. In addition, improvements in data quality have contributed to the result, with the data more accurately reflecting way in which services are delivered. The Target/Estimate for this measure is determined using a standard formula based upon available clinical staffing, HHS rurality, and historical performance. The targets for these measures have been set to be consistently calculated and are considered a stretch for many services.
2017-18 Queensland State Budget - Service Delivery Statements - Cairns and Hinterland Hospital and Health Service 66
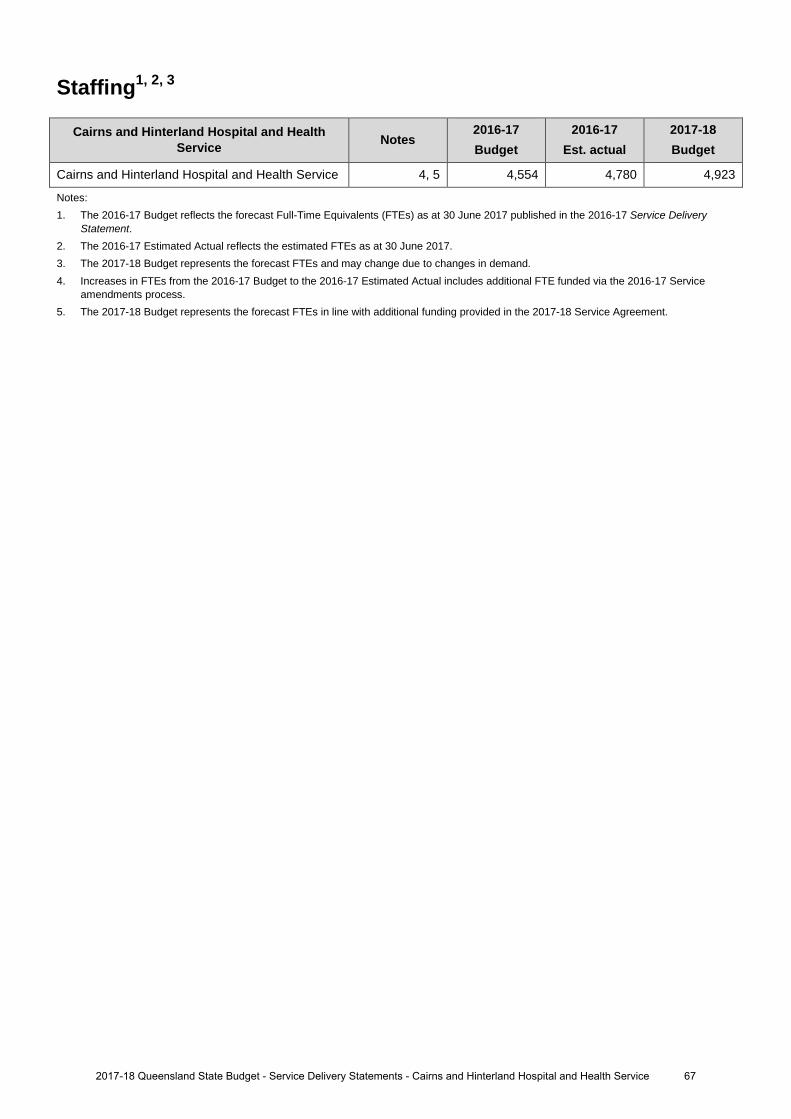
Staffing1, 2, 3
Cairns and Hinterland Hospital and Health Service Notes
2016-17 Budget
2016-17 Est. actual
2017-18 Budget
Cairns and Hinterland Hospital and Health Service 4, 5 4,554 4,780 4,923
Notes: 1. The 2016-17 Budget reflects the forecast Full-Time Equivalents (FTEs) as at 30 June 2017 published in the 2016-17 Service Delivery
Statement. 2. The 2016-17 Estimated Actual reflects the estimated FTEs as at 30 June 2017. 3. The 2017-18 Budget represents the forecast FTEs and may change due to changes in demand. 4. Increases in FTEs from the 2016-17 Budget to the 2016-17 Estimated Actual includes additional FTE funded via the 2016-17 Service
amendments process. 5. The 2017-18 Budget represents the forecast FTEs in line with additional funding provided in the 2017-18 Service Agreement.
672017-18 Queensland State Budget - Service Delivery Statements - Cairns and Hinterland Hospital and Health Service
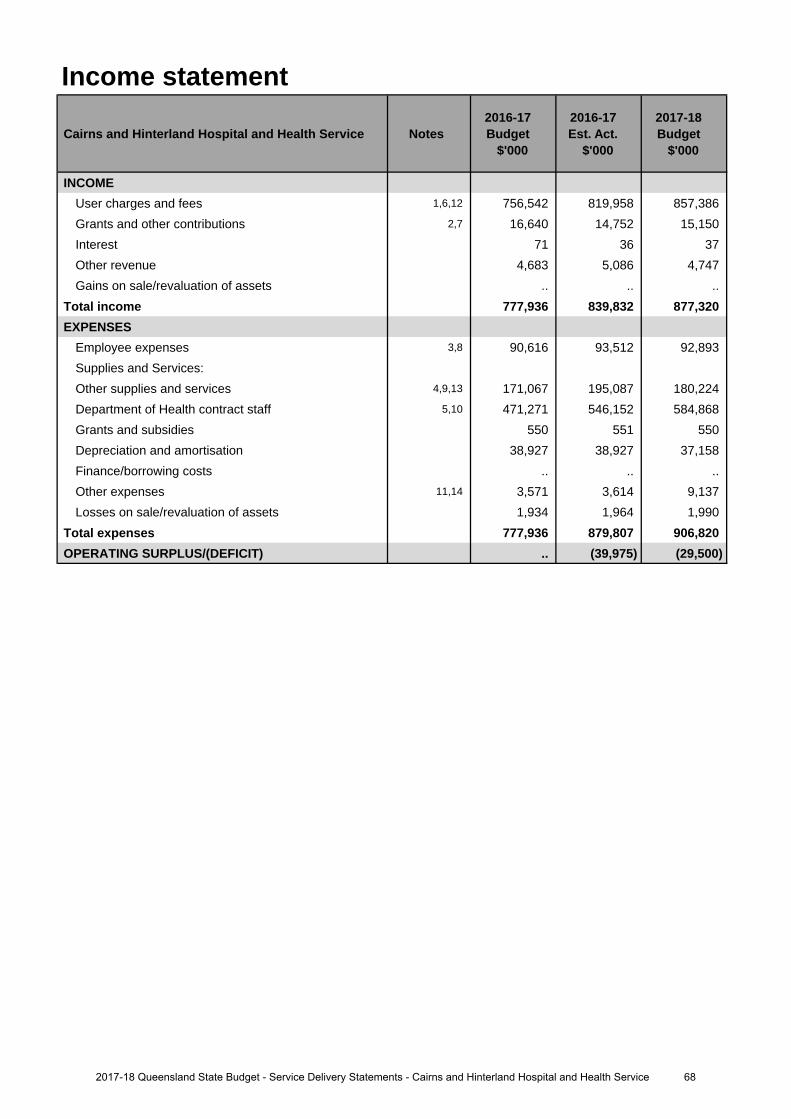
Income statement
Cairns and Hinterland Hospital and Health Service Notes 2016-17 Budget
$'000
2016-17 Est. Act.
$'000
2017-18 Budget
$'000
INCOMEUser charges and fees 1,6,12 756,542 819,958 857,386 Grants and other contributions 2,7 16,640 14,752 15,150 Interest 71 36 37 Other revenue 4,683 5,086 4,747 Gains on sale/revaluation of assets .. .. ..
Total income 777,936 839,832 877,320 EXPENSES
Employee expenses 3,8 90,616 93,512 92,893 Supplies and Services:Other supplies and services 4,9,13 171,067 195,087 180,224 Department of Health contract staff 5,10 471,271 546,152 584,868 Grants and subsidies 550 551 550 Depreciation and amortisation 38,927 38,927 37,158 Finance/borrowing costs .. .. .. Other expenses 11,14 3,571 3,614 9,137 Losses on sale/revaluation of assets 1,934 1,964 1,990
Total expenses 777,936 879,807 906,820 OPERATING SURPLUS/(DEFICIT) .. (39,975) (29,500)
682017-18 Queensland State Budget - Service Delivery Statements - Cairns and Hinterland Hospital and Health Service
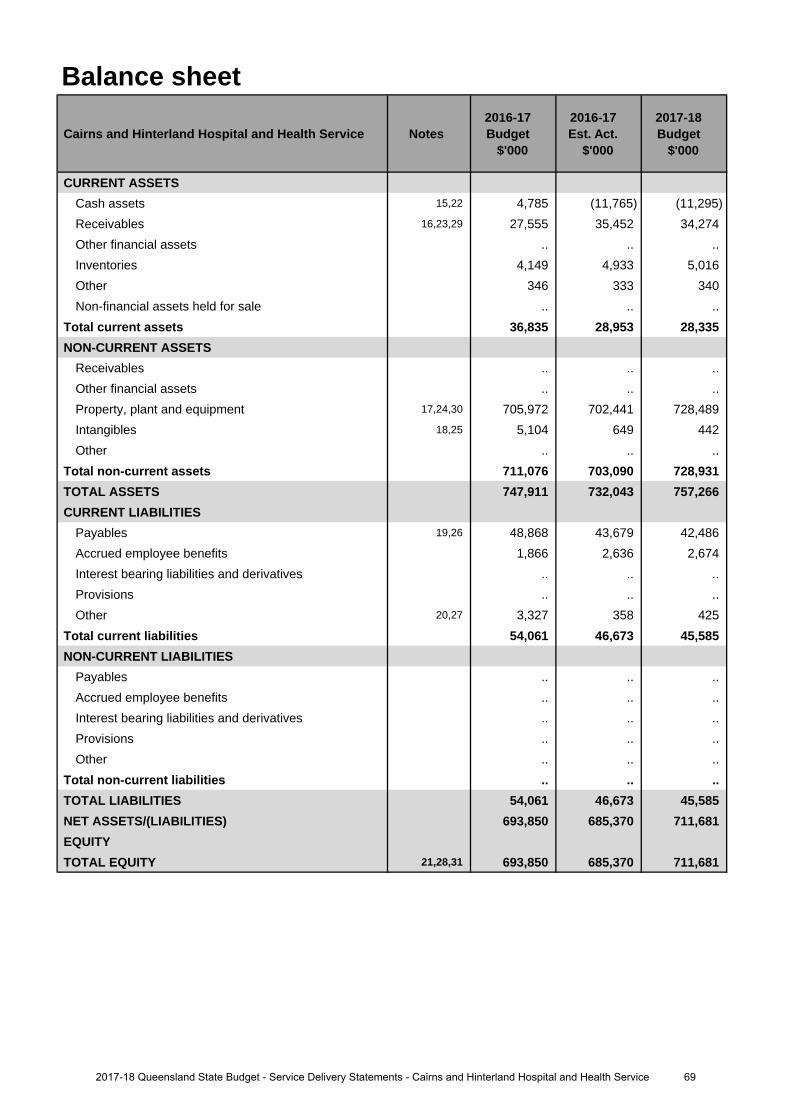
Balance sheet
Cairns and Hinterland Hospital and Health Service Notes 2016-17 Budget
$'000
2016-17 Est. Act.
$'000
2017-18 Budget
$'000
CURRENT ASSETSCash assets 15,22 4,785 (11,765) (11,295)Receivables 16,23,29 27,555 35,452 34,274 Other financial assets .. .. .. Inventories 4,149 4,933 5,016 Other 346 333 340 Non-financial assets held for sale .. .. ..
Total current assets 36,835 28,953 28,335 NON-CURRENT ASSETS
Receivables .. .. .. Other financial assets .. .. .. Property, plant and equipment 17,24,30 705,972 702,441 728,489 Intangibles 18,25 5,104 649 442 Other .. .. ..
Total non-current assets 711,076 703,090 728,931 TOTAL ASSETS 747,911 732,043 757,266 CURRENT LIABILITIES
Payables 19,26 48,868 43,679 42,486 Accrued employee benefits 1,866 2,636 2,674 Interest bearing liabilities and derivatives .. .. .. Provisions .. .. .. Other 20,27 3,327 358 425
Total current liabilities 54,061 46,673 45,585 NON-CURRENT LIABILITIES
Payables .. .. .. Accrued employee benefits .. .. .. Interest bearing liabilities and derivatives .. .. .. Provisions .. .. .. Other .. .. ..
Total non-current liabilities .. .. .. TOTAL LIABILITIES 54,061 46,673 45,585 NET ASSETS/(LIABILITIES) 693,850 685,370 711,681 EQUITYTOTAL EQUITY 21,28,31 693,850 685,370 711,681
692017-18 Queensland State Budget - Service Delivery Statements - Cairns and Hinterland Hospital and Health Service

Cash flow statement
Cairns and Hinterland Hospital and Health Service Notes 2016-17 Budget
$'000
2016-17 Est. Act.
$'000
2017-18 Budget
$'000
CASH FLOWS FROM OPERATING ACTIVITIESInflows:
User charges and fees 32,38,45 754,255 817,657 856,764 Grants and other contributions 33,39 16,640 14,722 15,105 Interest received 71 36 37Other 20,453 20,856 20,517
Outflows:Employee costs 34,40 (90,580) (93,476) (92,855)Supplies and services 35,41,46 (657,791) (756,698) (782,253)Grants and subsidies (550) (551) (550)Borrowing costs .. .. ..Other 42,47 (3,571) (3,614) (9,137)
Net cash provided by or used in operating activities 38,927 (1,068) 7,628 CASH FLOWS FROM INVESTING ACTIVITIESInflows:
Sales of non-financial assets .. (10) .. Investments redeemed .. .. ..Loans and advances redeemed .. .. ..
Outflows:Payments for non-financial assets 36,43 (5,485) (10,280) (9,866)Payments for investments .. .. .. Loans and advances made .. .. ..
Net cash provided by or used in investing activities (5,485) (10,290) (9,866)CASH FLOWS FROM FINANCING ACTIVITIESInflows:
Borrowings .. .. ..Equity injections 37,44 5,485 44,221 39,866
Outflows:Borrowing redemptions .. .. ..Finance lease payments .. .. .. Equity withdrawals (38,927) (38,927) (37,158)
Net cash provided by or used in financing activities (33,442) 5,294 2,708 Net increase/(decrease) in cash held .. (6,064) 470 Cash at the beginning of financial year 4,785 (5,701) (11,765)
Cash transfers from restructure .. .. .. Cash at the end of financial year 4,785 (11,765) (11,295)
702017-18 Queensland State Budget - Service Delivery Statements - Cairns and Hinterland Hospital and Health Service
Income statementMajor variations between 2016-17 Budget and 2016-17 Estimated Actual include:
1. The increase relates to additional funding provided through amendments to the Service Agreement betweenCairns and Hinterland Hospital and Health Service (HHS) and the Department of Health. Additional fundingis provided for increases in service activity, enterprise bargaining, block funded services, teaching, trainingand research funding and own source revenue.
2. Decrease relates to the reduction in funding provided for Specialist Outreach Services (Checkup Outreach) andHome and Community Care (HACC/CHP).
3. Increase relates to the increased number of Senior Medical Officers employed by the Cairns andHinterland HHS, along with Enterprise Bargaining adjustments.
4. The increase relates to additional expenditure associated with the increase in service activity provided throughamendments to the Service Agreement between Cairns and Hinterland HHS and the Department of Health.
5. Increase in Department of Health contract staff expense due to increase in frontline services full-time equivalents (FTE) to meet service demand.
Major variations between 2016-17 Budget and 2017-18 Budget include:
6. The increase relates to additional funding provided through the Service Agreement between Cairns andHinterland HHS and the Department of Health. Additional funding is provided for increases in service activity,enterprise bargaining, block funded services, teaching, training and research funding and own source revenue.
7. Decrease relates to the reduction in funding provided for Checkup Outreach and HACC/CHP.
8. Increase to account for the additional Senior Medical Officer FTEs, along with Enterprise Bargaining adjustments.
9. Increase in budget to account for additional expenditure associated with the increase in service activity providedthrough the Service Agreement between Cairns and Hinterland HHS and Department of Health.
10. Increase in Department of Health contract staff expense due to increase in frontline services FTEs to meetservice demand and Enterprise Bargaining indexation.
11. The increase relates to additional expenditure associated with the increase in service activity provided throughamendments to the Service Agreement between Cairns and Hinterland HHS and Department of Health.
Major variations between 2016-17 Estimated Actual and the 2017-18 Budget include:
12. The increase relates to additional funding provided through the Service Agreement between Cairns andHinterland HHS and Department of Health. Additional funding is provided for increases in service activity,enterprise bargaining, block funded services, teaching, training and research funding and own source revenue.
13. Decrease relates to forecasted savings expected to be delivered during 2017-18 in line with financialmanagement strategy.
14. The increase relates to additional expenditure associated with the increase in service activity provided throughamendments to the Service Agreement between Cairns and Hinterland HHS and the Department of Health.
Balance sheetMajor variations between 2016-17 Budget and 2016-17 Estimated Actual include:
15. Cairns and Hinterland Hospital and Health Service's (HHS) operating account is expected to be in overdraft basedon Cairns and Hinterland HHS's current financial position and projected deficit at the end of financial year offset bythe Department of Health's intention to provide Cairns and Hinterland HHS with additional cash via equity of$40 million in 2016-17 and $30 million in 2017-18 to ensure liquidity.
16. Increase attributable to the increase in user charges and fees in line with amendments made to the serviceagreement between the Department of Health and Cairns and Hinterland HHS. Additionally, raised invoicesto Capital Infrastructure Delivery Unit (CIDU) for the Cairns and Hinterland HHS Redevelopment contributesto increase between the 2016-17 budget and estimated actuals.
17. Decrease relates to the revised commissioning schedule for assets to be acquired through Minor CapitalAcquisitions, the Health Technology Equipment Replacement (HTER) program and transfer from CIDU.
Explanation of variances in the financial statements
712017-18 Queensland State Budget - Service Delivery Statements - Cairns and Hinterland Hospital and Health Service
18. Software acquired as part of the Integrated Electronic Medical Record (ieMR)/Digital Hospital Program wasexpected to be capitalised to Cairns and Hinterland HHS balance sheet in the 2016-17 financial year. Varianceexists as this has not yet been capitalised.
19. The decrease is as a result of a reduced operational expenditure on supplies and services.
20. The decrease is due to the reduction of payments received in advance.
21. The movement in total equity is attributed to the HHS's forecasted operating deficit offset by a cash injection fromDepartment of Health to ensure liquidity.
Major variations between 2016-17 Budget and 2017-18 Budget include:
22. Cairns and Hinterland HHS operating account expected to be in overdraft based on Cairns and Hinterland HHS'scurrent financial position and projected deficit at the end of the 2017-18 financial year offset by Department ofHealth's intention to provide the Cairns and Hinterland HHS with additional cash via equity of $40 million in2016-17 and $30 million in 2017-18 to ensure liquidity.
23. Increase attributable to higher estimated user charges and fees as per the Service Agreement.
24. Increase to account for assets to be acquired through Minor Capital Acquisitions, the HTER program and CIDUdelivered capital projects.
25. 2017-18 financial year budget does not account for the software acquired as part of the ieMR/Digital HospitalProgram which was accounted for and expected to be capitalised in the 2016-17 budget.
26. The decrease is as a result of a reduced operational expenditure on supplies and services.
27. The decrease is due to the reduction of payments received in advance.
28. The movement in total equity is attributed to Cairns and Hinterland HHS forecasted operating deficit at yearend offset by a cash injection from Department of Health to ensure liquidity.
Major variations between 2016-17 Estimated Actual and the 2017-18 Budget include:
29. The decrease is in line with the reduction identified for PBS Revenues, particularly around Hep C drugs.
30. Increase to account for assets to be acquired through Minor Capital Acquisitions, the HTER program and CIDUdelivered capital projects.
31. The movement in total equity is attributed to the movement in asset revaluation and a cash injection fromDepartment of Health to ensure liquidity, offset by the budgeted operating deficit position.
Cash flow statementMajor variations between 2016-17 Budget and 2016-17 Estimated Actual include:
32. The increase relates to additional funding provided through amendments to the Service Agreement betweenCairns and Hinterland Hospital and Health Service (HHS) and Department of Health. Additional funding isprovided for increases in service activity, enterprise bargaining, block funded services, teaching, training andresearch funding and own source revenue.
33. Decrease relates to the reduction in funding provided for Checkup Outreach and HACC/CHP.
34. Increase relates to the increased number of Senior Medical Officers employed by the HHS, along with EnterpriseBargaining adjustments.
35. The increase relates to additional expenditure associated with the increase in service activity provided throughamendments to the Service Agreement between Cairns and Hinterland HHS and the Department of Health.
36. The Increase is a result of additional asset acquisitions over and above initial projections at the beginning of the
37.
2016-17 Financial Year.The increase relates to Department of Health's intention to provide additional cash via equity of $40 million in2016-17 and $30 million in 2017-18 to ensure liquidity.
Major variations between 2016-17 Budget and 2017-18 Budget include:
38. The increase relates to additional funding provided through the Service Agreement between Cairns andHinterland HHS and Department of Health. Additional funding is provided for increases in service activity,enterprise bargaining, block funded services, teaching, training and research funding and own source revenue.
39. Decrease relates to the reduction in funding provided for Checkup Outreach and HACC/CHP.
40. Increase to account for the additional Senior Medical Officer FTEs, along with Enterprise Bargaining adjustments.
722017-18 Queensland State Budget - Service Delivery Statements - Cairns and Hinterland Hospital and Health Service
41. Increase in budget to account for additional expenditure associated with the increase in service activity providedthrough the Service Agreement between Cairns and Hinterland HHS and Department of Health.
42. The increase relates to additional expenditure associated with the increase in service activity provided throughamendments to the Service Agreement between Cairns and Hinterland HHS and Department of Health.
43. Increase in assets to be acquired for the 2017-18 financial year attributable to the HTER program and CIDUdelivered capital projects.
44. The increase relates to Department of Health's intention to provide additional cash via equity of $40 million in2016-17 and $30 million in 2017-18 to ensure liquidity.
Major variations between 2016-17 Estimated Actual and the 2017-18 Budget include:
45. The increase relates to additional funding provided through the Service Agreement between Cairns andHinterland HHS and Department of Health. Additional funding is provided for increases in service activity,enterprise bargaining, block funded services, teaching, training and research funding and own source revenue.
46. Decrease relates to the need to have an improved operating position for 2017-18, the balancing item was appliedto other supplies and services. It is noted that Cairns and Hinterland HHS will have a deficit position again in2018, however, the actual figure has not yet been negotiated or approved by Department of Health.
47. The increase relates to additional expenditure associated with the increase in service activity provided throughamendments to the Service Agreement between Cairns and Hinterland HHS and Department of Health.
732017-18 Queensland State Budget - Service Delivery Statements - Cairns and Hinterland Hospital and Health Service
Central Queensland Hospital and Health Service
Overview The Central Queensland Hospital and Health Service (HHS) is an independent statutory body overseen by a local Hospital and Health Board. The Central Queensland HHS is responsible for providing public hospital and health services including medical, surgical, emergency, obstetrics, paediatrics, specialist outpatient clinics, mental health, critical care and clinical support services.
The Central Queensland HHS is responsible for the direct management of more than 16 hospitals and facilities including:
• Baralaba Hospital • Mount Morgan Hospital
• Biloela Hospital • Moura Hospital
• Blackwater Hospital • Rockhampton Hospital
• Capricorn Coast Hospital • Springsure Hospital
• Emerald Hospital • Theodore Hospital
• Gladstone Hospital • Woorabinda Hospital
Central Queensland HHS also provides mental health services, oral health services, offender health services and aged care services, with a number of facilities also providing community health services.
Central Queensland HHS is committed to delivering safe, evidence-based, patient-centred, effective and economically sustainable care with a highly skilled and valued workforce that meets the community’s needs.
Central Queensland HHS’s strategic objectives contribute to the Queensland Government’s objectives for the community: delivering quality frontline services; building safe, caring and connected communities and creating jobs and a diverse economy.
The health service remains committed to delivering safe and high quality care, supporting its valuable workforce and delivering its financial and performance requirements.
Service Summary The Central Queensland HHS has an operating budget of $566.3 million for 2017-18 which is an increase of $34.8 million (6.5 per cent) from the published 2016-17 operating budget of $531.5 million.
A key focus for 2017-18 will be developing a 10-year strategic vision for the effective delivery of health services to meet the needs of Central Queenslanders in a safe and sustainable manner.
The HHS will also continue to ensure that Central Queensland residents have improved access to cancer treatment services, ophthalmology and orthopaedic services.
During 2017-18, additional recurrent funding has been provided through the HHS’s service agreement to increase the midwifery staff to patient ratio and purchase additional nursing and midwifery education and training services for new and existing staff.
Early works on the Rockhampton Hospital carpark began in May 2017 with completion due by late 2018. Construction at Gladstone Hospital is also expected to begin in the first half of the 2017-18.
Planning has also started to deliver a step-up step-down mental health facility at Gladstone and major renovations to the North Rockhampton Nursing Centre.
742017-18 Queensland State Budget - Service Delivery Statements - Central Queensland Hospital and Health Service
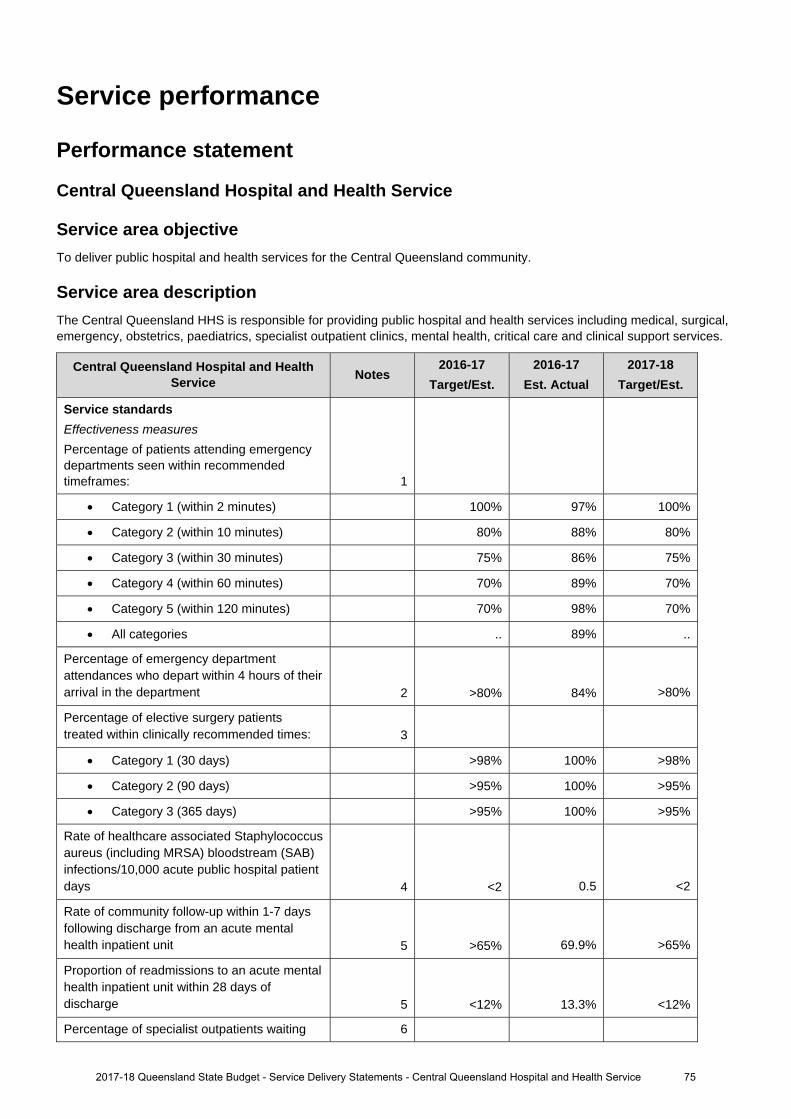
Service performance
Performance statement
Central Queensland Hospital and Health Service
Service area objective To deliver public hospital and health services for the Central Queensland community.
Service area description The Central Queensland HHS is responsible for providing public hospital and health services including medical, surgical, emergency, obstetrics, paediatrics, specialist outpatient clinics, mental health, critical care and clinical support services.
Central Queensland Hospital and Health Service Notes
2016-17 Target/Est.
2016-17 Est. Actual
2017-18 Target/Est.
Service standards
Effectiveness measures Percentage of patients attending emergency departments seen within recommended timeframes: 1
Category 1 (within 2 minutes) 100% 97% 100%
Category 2 (within 10 minutes) 80% 88% 80%
Category 3 (within 30 minutes) 75% 86% 75%
Category 4 (within 60 minutes) 70% 89% 70%
Category 5 (within 120 minutes) 70% 98% 70%
All categories .. 89% ..
Percentage of emergency department attendances who depart within 4 hours of their arrival in the department 2 >80% 84% >80%
Percentage of elective surgery patients treated within clinically recommended times: 3
Category 1 (30 days) >98% 100% >98%
Category 2 (90 days) >95% 100% >95%
Category 3 (365 days) >95% 100% >95%
Rate of healthcare associated Staphylococcus aureus (including MRSA) bloodstream (SAB) infections/10,000 acute public hospital patient days 4 <2 0.5 <2
Rate of community follow-up within 1-7 days following discharge from an acute mental health inpatient unit 5 >65% 69.9% >65%
Proportion of readmissions to an acute mental health inpatient unit within 28 days of discharge 5 <12% 13.3% <12%
Percentage of specialist outpatients waiting 6
2017-18 Queensland State Budget - Service Delivery Statements - Central Queensland Hospital and Health Service 75
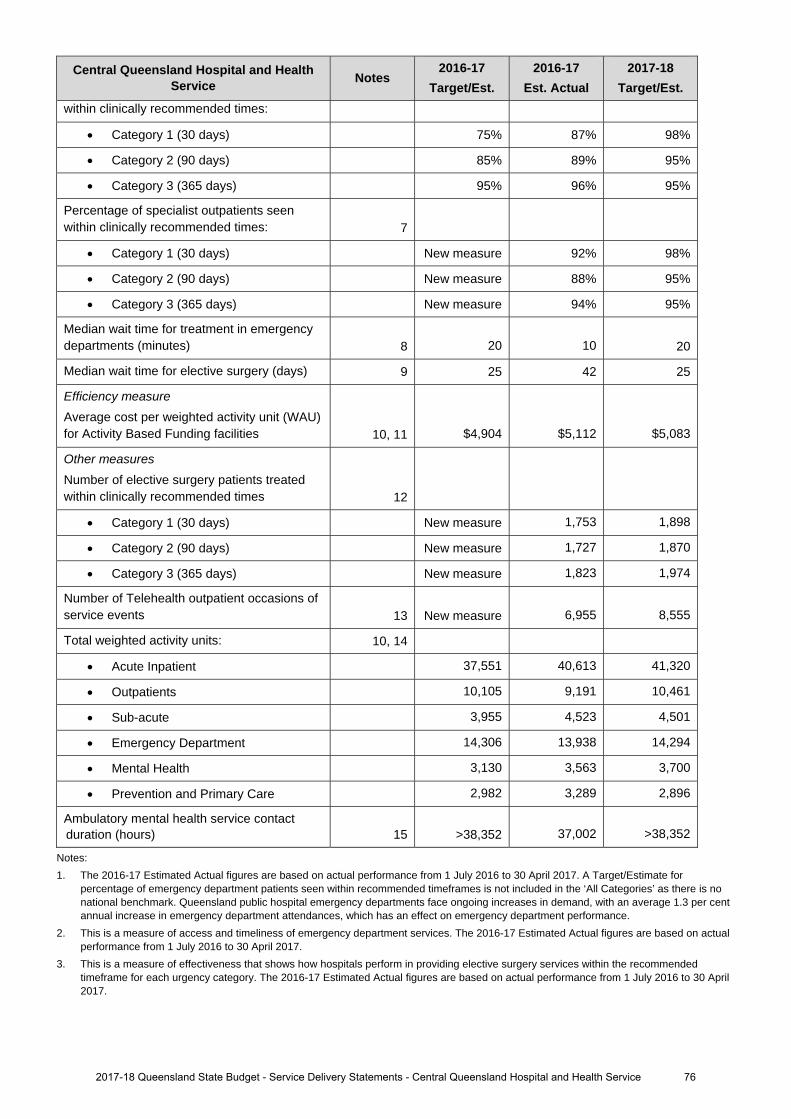
Central Queensland Hospital and Health Service Notes
2016-17 Target/Est.
2016-17 Est. Actual
2017-18 Target/Est.
within clinically recommended times:
Category 1 (30 days) 75% 87% 98%
Category 2 (90 days) 85% 89% 95%
Category 3 (365 days) 95% 96% 95%
Percentage of specialist outpatients seen within clinically recommended times: 7
Category 1 (30 days) New measure 92% 98%
Category 2 (90 days) New measure 88% 95%
Category 3 (365 days) New measure 94% 95%
Median wait time for treatment in emergency departments (minutes) 8 20 10 20
Median wait time for elective surgery (days) 9 25 42 25
Efficiency measure Average cost per weighted activity unit (WAU) for Activity Based Funding facilities 10, 11 $4,904 $5,112 $5,083
Other measures Number of elective surgery patients treated within clinically recommended times 12
Category 1 (30 days) New measure 1,753 1,898
Category 2 (90 days) New measure 1,727 1,870
Category 3 (365 days) New measure 1,823 1,974
Number of Telehealth outpatient occasions of service events 13 New measure 6,955 8,555
Total weighted activity units: 10, 14
Acute Inpatient 37,551 40,613 41,320
Outpatients 10,105 9,191 10,461
Sub-acute 3,955 4,523 4,501
Emergency Department 14,306 13,938 14,294
Mental Health 3,130 3,563 3,700
Prevention and Primary Care 2,982 3,289 2,896
Ambulatory mental health service contact duration (hours) 15 >38,352 37,002 >38,352
Notes: 1. The 2016-17 Estimated Actual figures are based on actual performance from 1 July 2016 to 30 April 2017. A Target/Estimate for
percentage of emergency department patients seen within recommended timeframes is not included in the ‘All Categories’ as there is no national benchmark. Queensland public hospital emergency departments face ongoing increases in demand, with an average 1.3 per cent annual increase in emergency department attendances, which has an effect on emergency department performance.
2. This is a measure of access and timeliness of emergency department services. The 2016-17 Estimated Actual figures are based on actual performance from 1 July 2016 to 30 April 2017.
3. This is a measure of effectiveness that shows how hospitals perform in providing elective surgery services within the recommended timeframe for each urgency category. The 2016-17 Estimated Actual figures are based on actual performance from 1 July 2016 to 30 April 2017.
2017-18 Queensland State Budget - Service Delivery Statements - Central Queensland Hospital and Health Service 76
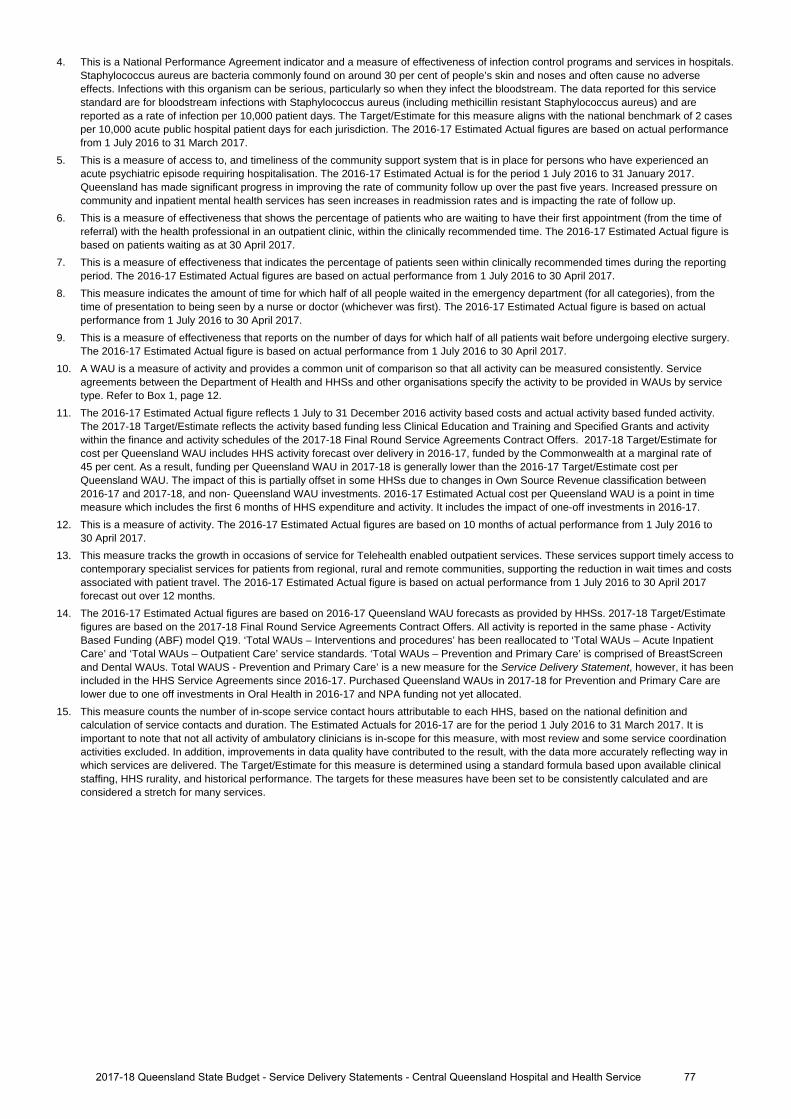
4. This is a National Performance Agreement indicator and a measure of effectiveness of infection control programs and services in hospitals. Staphylococcus aureus are bacteria commonly found on around 30 per cent of people’s skin and noses and often cause no adverse effects. Infections with this organism can be serious, particularly so when they infect the bloodstream. The data reported for this service standard are for bloodstream infections with Staphylococcus aureus (including methicillin resistant Staphylococcus aureus) and are reported as a rate of infection per 10,000 patient days. The Target/Estimate for this measure aligns with the national benchmark of 2 cases per 10,000 acute public hospital patient days for each jurisdiction. The 2016-17 Estimated Actual figures are based on actual performance from 1 July 2016 to 31 March 2017.
5. This is a measure of access to, and timeliness of the community support system that is in place for persons who have experienced an acute psychiatric episode requiring hospitalisation. The 2016-17 Estimated Actual is for the period 1 July 2016 to 31 January 2017. Queensland has made significant progress in improving the rate of community follow up over the past five years. Increased pressure on community and inpatient mental health services has seen increases in readmission rates and is impacting the rate of follow up.
6. This is a measure of effectiveness that shows the percentage of patients who are waiting to have their first appointment (from the time of referral) with the health professional in an outpatient clinic, within the clinically recommended time. The 2016-17 Estimated Actual figure is based on patients waiting as at 30 April 2017.
7. This is a measure of effectiveness that indicates the percentage of patients seen within clinically recommended times during the reporting period. The 2016-17 Estimated Actual figures are based on actual performance from 1 July 2016 to 30 April 2017.
8. This measure indicates the amount of time for which half of all people waited in the emergency department (for all categories), from the time of presentation to being seen by a nurse or doctor (whichever was first). The 2016-17 Estimated Actual figure is based on actual performance from 1 July 2016 to 30 April 2017.
9. This is a measure of effectiveness that reports on the number of days for which half of all patients wait before undergoing elective surgery. The 2016-17 Estimated Actual figure is based on actual performance from 1 July 2016 to 30 April 2017.
10. A WAU is a measure of activity and provides a common unit of comparison so that all activity can be measured consistently. Service agreements between the Department of Health and HHSs and other organisations specify the activity to be provided in WAUs by service type. Refer to Box 1, page 12.
11. The 2016-17 Estimated Actual figure reflects 1 July to 31 December 2016 activity based costs and actual activity based funded activity. The 2017-18 Target/Estimate reflects the activity based funding less Clinical Education and Training and Specified Grants and activity within the finance and activity schedules of the 2017-18 Final Round Service Agreements Contract Offers. 2017-18 Target/Estimate for cost per Queensland WAU includes HHS activity forecast over delivery in 2016-17, funded by the Commonwealth at a marginal rate of 45 per cent. As a result, funding per Queensland WAU in 2017-18 is generally lower than the 2016-17 Target/Estimate cost per Queensland WAU. The impact of this is partially offset in some HHSs due to changes in Own Source Revenue classification between 2016-17 and 2017-18, and non- Queensland WAU investments. 2016-17 Estimated Actual cost per Queensland WAU is a point in time measure which includes the first 6 months of HHS expenditure and activity. It includes the impact of one-off investments in 2016-17.
12. This is a measure of activity. The 2016-17 Estimated Actual figures are based on 10 months of actual performance from 1 July 2016 to 30 April 2017.
13. This measure tracks the growth in occasions of service for Telehealth enabled outpatient services. These services support timely access to contemporary specialist services for patients from regional, rural and remote communities, supporting the reduction in wait times and costs associated with patient travel. The 2016-17 Estimated Actual figure is based on actual performance from 1 July 2016 to 30 April 2017 forecast out over 12 months.
14. The 2016-17 Estimated Actual figures are based on 2016-17 Queensland WAU forecasts as provided by HHSs. 2017-18 Target/Estimate figures are based on the 2017-18 Final Round Service Agreements Contract Offers. All activity is reported in the same phase - Activity Based Funding (ABF) model Q19. ‘Total WAUs – Interventions and procedures’ has been reallocated to ‘Total WAUs – Acute Inpatient Care’ and ‘Total WAUs – Outpatient Care’ service standards. ‘Total WAUs – Prevention and Primary Care’ is comprised of BreastScreen and Dental WAUs. Total WAUS - Prevention and Primary Care’ is a new measure for the Service Delivery Statement, however, it has been included in the HHS Service Agreements since 2016-17. Purchased Queensland WAUs in 2017-18 for Prevention and Primary Care are lower due to one off investments in Oral Health in 2016-17 and NPA funding not yet allocated.
15. This measure counts the number of in-scope service contact hours attributable to each HHS, based on the national definition and calculation of service contacts and duration. The Estimated Actuals for 2016-17 are for the period 1 July 2016 to 31 March 2017. It is important to note that not all activity of ambulatory clinicians is in-scope for this measure, with most review and some service coordination activities excluded. In addition, improvements in data quality have contributed to the result, with the data more accurately reflecting way in which services are delivered. The Target/Estimate for this measure is determined using a standard formula based upon available clinical staffing, HHS rurality, and historical performance. The targets for these measures have been set to be consistently calculated and are considered a stretch for many services.
2017-18 Queensland State Budget - Service Delivery Statements - Central Queensland Hospital and Health Service 77
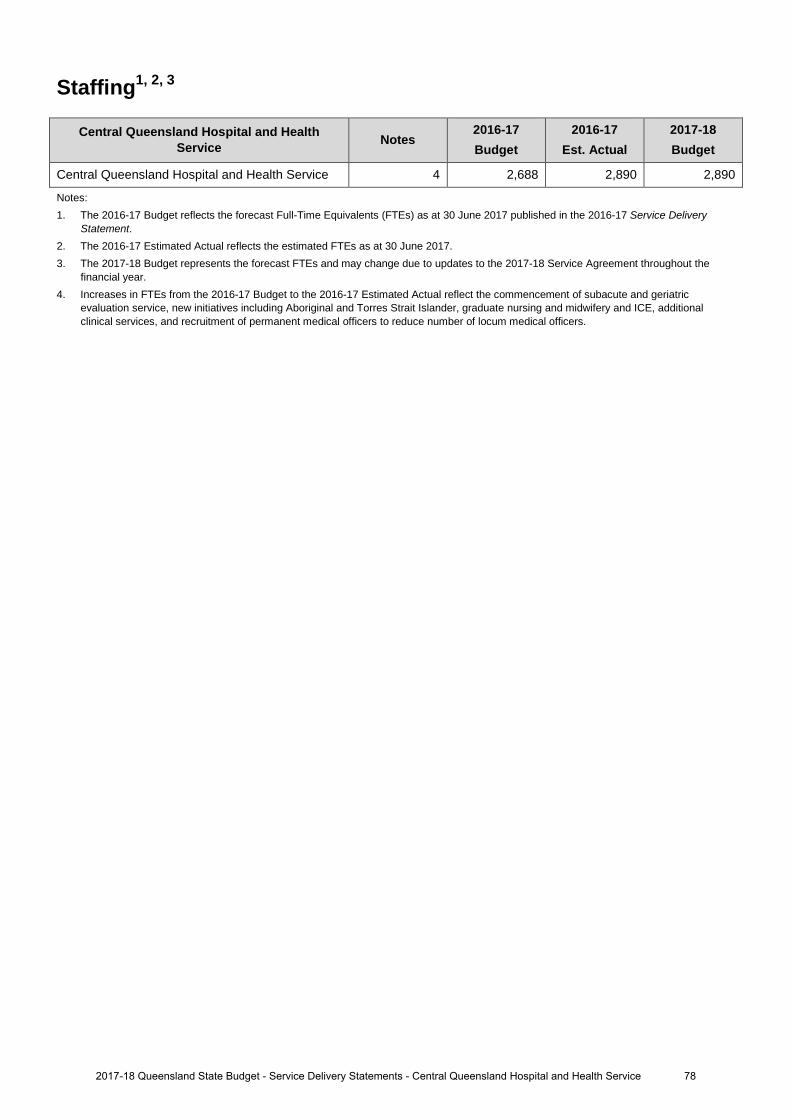
Staffing1, 2, 3
Central Queensland Hospital and Health Service Notes
2016-17 Budget
2016-17 Est. Actual
2017-18 Budget
Central Queensland Hospital and Health Service 4 2,688 2,890 2,890
Notes: 1. The 2016-17 Budget reflects the forecast Full-Time Equivalents (FTEs) as at 30 June 2017 published in the 2016-17 Service Delivery
Statement. 2. The 2016-17 Estimated Actual reflects the estimated FTEs as at 30 June 2017.3. The 2017-18 Budget represents the forecast FTEs and may change due to updates to the 2017-18 Service Agreement throughout the
financial year.4. Increases in FTEs from the 2016-17 Budget to the 2016-17 Estimated Actual reflect the commencement of subacute and geriatric
evaluation service, new initiatives including Aboriginal and Torres Strait Islander, graduate nursing and midwifery and ICE, additionalclinical services, and recruitment of permanent medical officers to reduce number of locum medical officers.
782017-18 Queensland State Budget - Service Delivery Statements - Central Queensland Hospital and Health Service
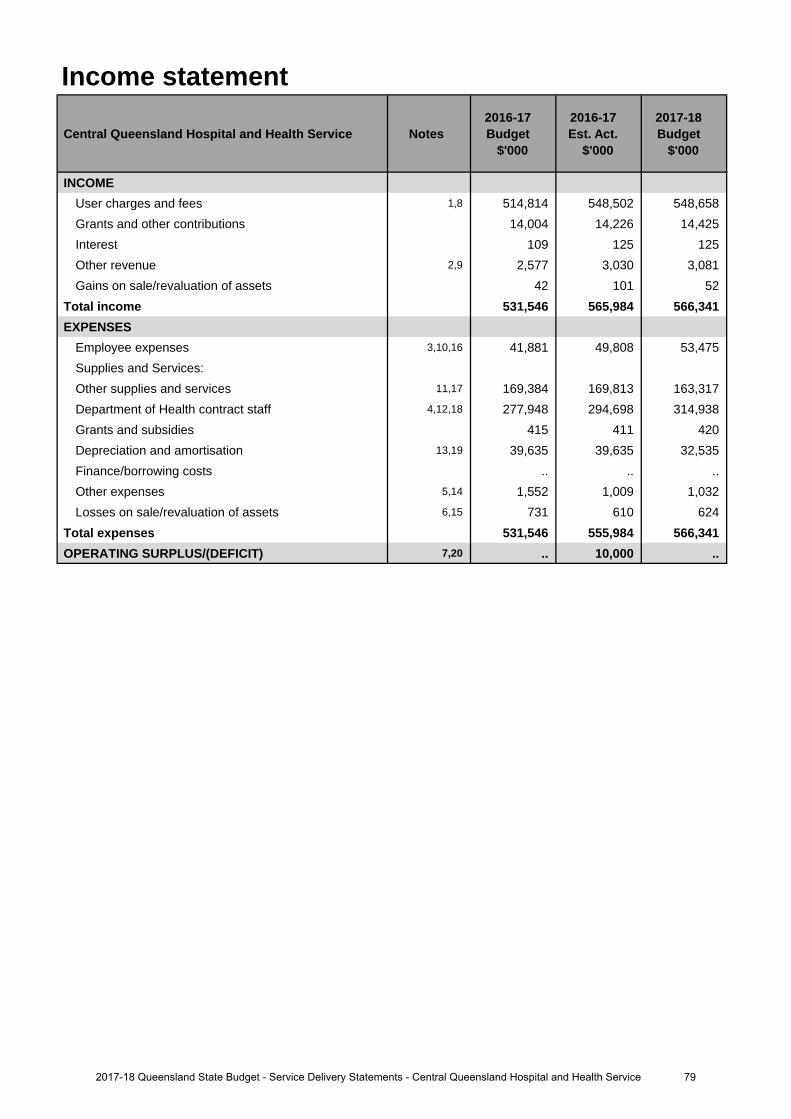
Income statement
Central Queensland Hospital and Health Service Notes 2016-17 Budget
$'000
2016-17 Est. Act.
$'000
2017-18 Budget
$'000
INCOMEUser charges and fees 1,8 514,814 548,502 548,658 Grants and other contributions 14,004 14,226 14,425 Interest 109 125 125Other revenue 2,9 2,577 3,030 3,081Gains on sale/revaluation of assets 42 101 52
Total income 531,546 565,984 566,341 EXPENSES
Employee expenses 3,10,16 41,881 49,808 53,475 Supplies and Services:Other supplies and services 11,17 169,384 169,813 163,317 Department of Health contract staff 4,12,18 277,948 294,698 314,938 Grants and subsidies 415 411 420 Depreciation and amortisation 13,19 39,635 39,635 32,535 Finance/borrowing costs .. .. ..Other expenses 5,14 1,552 1,009 1,032Losses on sale/revaluation of assets 6,15 731 610 624
Total expenses 531,546 555,984 566,341 OPERATING SURPLUS/(DEFICIT) 7,20 .. 10,000 ..
792017-18 Queensland State Budget - Service Delivery Statements - Central Queensland Hospital and Health Service

Balance sheet
Central Queensland Hospital and Health Service Notes 2016-17 Budget
$'000
2016-17 Est. Act.
$'000
2017-18 Budget
$'000
CURRENT ASSETSCash assets 21,27,33 11,135 24,527 25,705 Receivables 22,28 10,871 13,709 13,734 Other financial assets .. .. .. Inventories 23,29 3,171 3,871 3,899Other 24,30 1,142 1,925 1,979Non-financial assets held for sale .. .. ..
Total current assets 26,319 44,032 45,317 NON-CURRENT ASSETS
Receivables .. .. ..Other financial assets .. .. .. Property, plant and equipment 25,31,34 480,102 498,389 538,281 Intangibles .. .. ..Other .. .. ..
Total non-current assets 480,102 498,389 538,281 TOTAL ASSETS 506,421 542,421 583,598 CURRENT LIABILITIES
Payables 29,362 29,224 30,377 Accrued employee benefits 1,182 1,234 1,264 Interest bearing liabilities and derivatives .. .. .. Provisions .. .. ..Other 32 23 23
Total current liabilities 30,576 30,481 31,664 NON-CURRENT LIABILITIES
Payables .. .. ..Accrued employee benefits .. .. .. Interest bearing liabilities and derivatives .. .. .. Provisions .. .. ..Other .. .. ..
Total non-current liabilities .. .. .. TOTAL LIABILITIES 30,576 30,481 31,664 NET ASSETS/(LIABILITIES) 475,845 511,940 551,934 EQUITYTOTAL EQUITY 26,32,35 475,845 511,940 551,934
802017-18 Queensland State Budget - Service Delivery Statements - Central Queensland Hospital and Health Service
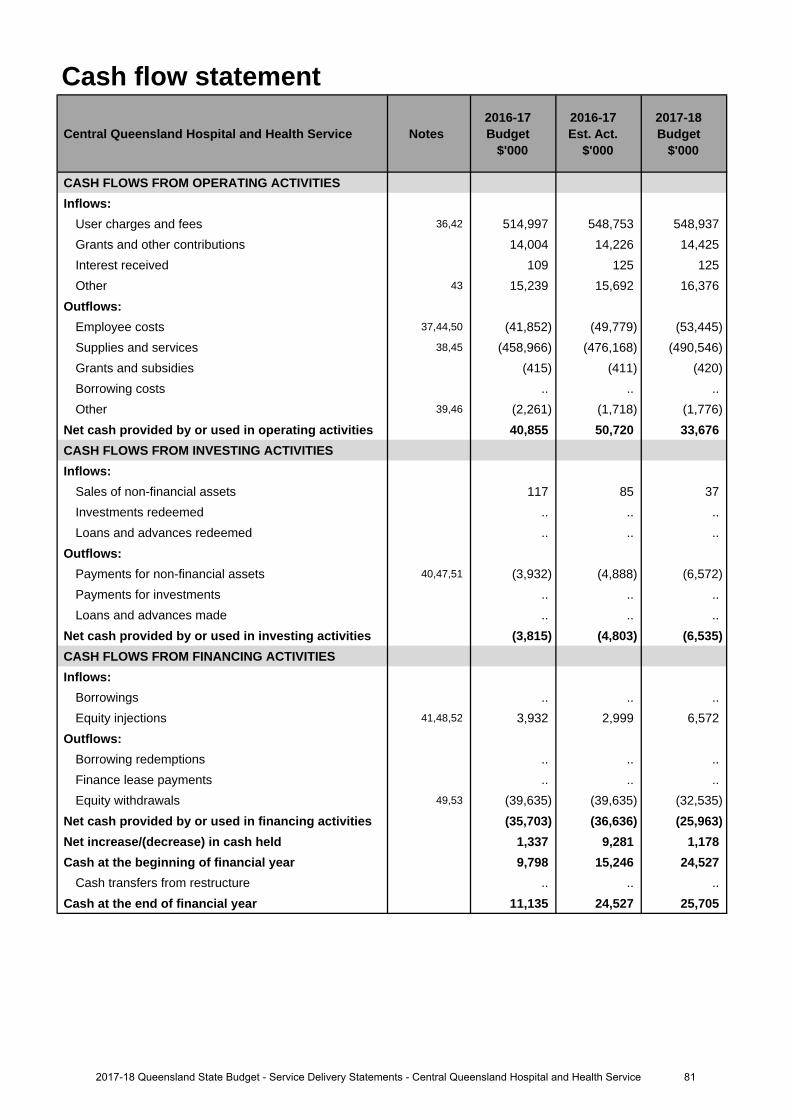
Cash flow statement
Central Queensland Hospital and Health Service Notes 2016-17 Budget
$'000
2016-17 Est. Act.
$'000
2017-18 Budget
$'000
CASH FLOWS FROM OPERATING ACTIVITIESInflows:
User charges and fees 36,42 514,997 548,753 548,937 Grants and other contributions 14,004 14,226 14,425 Interest received 109 125 125Other 43 15,239 15,692 16,376
Outflows:Employee costs 37,44,50 (41,852) (49,779) (53,445)Supplies and services 38,45 (458,966) (476,168) (490,546)Grants and subsidies (415) (411) (420)Borrowing costs .. .. ..Other 39,46 (2,261) (1,718) (1,776)
Net cash provided by or used in operating activities 40,855 50,720 33,676 CASH FLOWS FROM INVESTING ACTIVITIESInflows:
Sales of non-financial assets 117 85 37 Investments redeemed .. .. ..Loans and advances redeemed .. .. ..
Outflows:Payments for non-financial assets 40,47,51 (3,932) (4,888) (6,572)Payments for investments .. .. .. Loans and advances made .. .. ..
Net cash provided by or used in investing activities (3,815) (4,803) (6,535)CASH FLOWS FROM FINANCING ACTIVITIESInflows:
Borrowings .. .. ..Equity injections 41,48,52 3,932 2,999 6,572
Outflows:Borrowing redemptions .. .. ..Finance lease payments .. .. .. Equity withdrawals 49,53 (39,635) (39,635) (32,535)
Net cash provided by or used in financing activities (35,703) (36,636) (25,963)Net increase/(decrease) in cash held 1,337 9,281 1,178 Cash at the beginning of financial year 9,798 15,246 24,527
Cash transfers from restructure .. .. .. Cash at the end of financial year 11,135 24,527 25,705
812017-18 Queensland State Budget - Service Delivery Statements - Central Queensland Hospital and Health Service
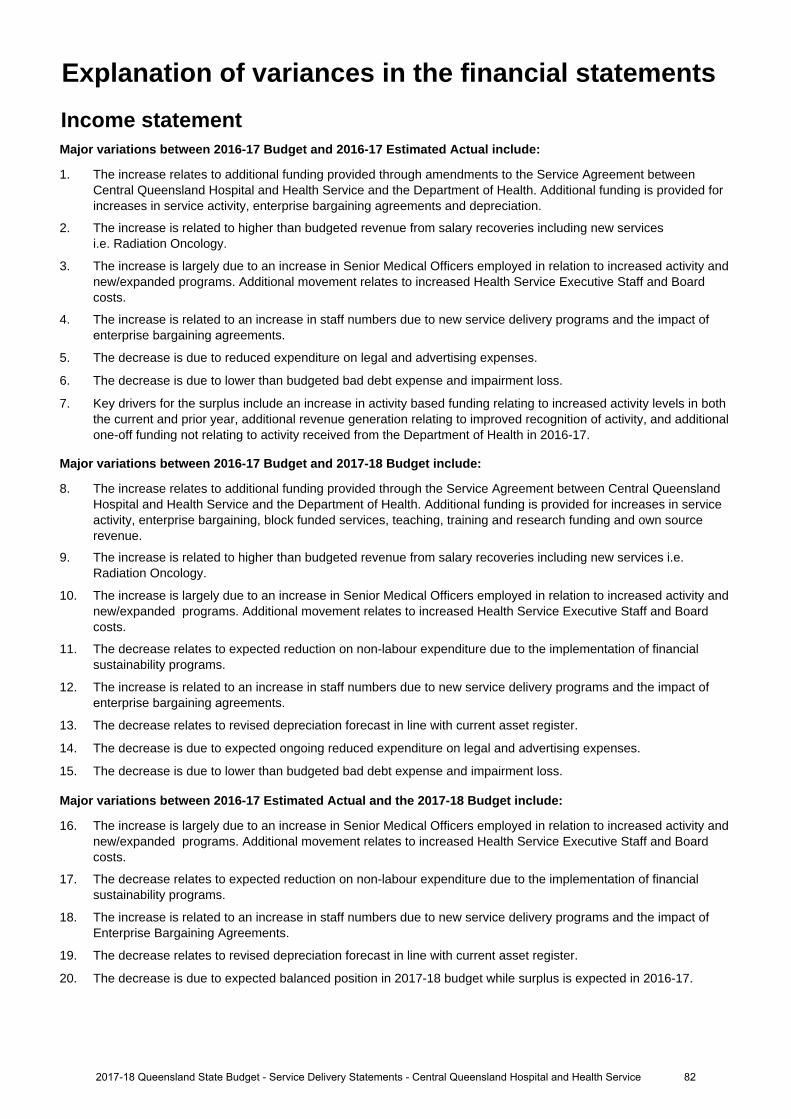
Income statementMajor variations between 2016-17 Budget and 2016-17 Estimated Actual include:
1. The increase relates to additional funding provided through amendments to the Service Agreement betweenCentral Queensland Hospital and Health Service and the Department of Health. Additional funding is provided forincreases in service activity, enterprise bargaining agreements and depreciation.
2. The increase is related to higher than budgeted revenue from salary recoveries including new servicesi.e. Radiation Oncology.
3. The increase is largely due to an increase in Senior Medical Officers employed in relation to increased activity andnew/expanded programs. Additional movement relates to increased Health Service Executive Staff and Boardcosts.
4. The increase is related to an increase in staff numbers due to new service delivery programs and the impact ofenterprise bargaining agreements.
5. The decrease is due to reduced expenditure on legal and advertising expenses.
6. The decrease is due to lower than budgeted bad debt expense and impairment loss.
7. Key drivers for the surplus include an increase in activity based funding relating to increased activity levels in boththe current and prior year, additional revenue generation relating to improved recognition of activity, and additionalone-off funding not relating to activity received from the Department of Health in 2016-17.
Major variations between 2016-17 Budget and 2017-18 Budget include:
8. The increase relates to additional funding provided through the Service Agreement between Central QueenslandHospital and Health Service and the Department of Health. Additional funding is provided for increases in serviceactivity, enterprise bargaining, block funded services, teaching, training and research funding and own sourcerevenue.
9. The increase is related to higher than budgeted revenue from salary recoveries including new services i.e.Radiation Oncology.
10. The increase is largely due to an increase in Senior Medical Officers employed in relation to increased activity andnew/expanded programs. Additional movement relates to increased Health Service Executive Staff and Boardcosts.
11. The decrease relates to expected reduction on non-labour expenditure due to the implementation of financialsustainability programs.
12. The increase is related to an increase in staff numbers due to new service delivery programs and the impact ofenterprise bargaining agreements.
13. The decrease relates to revised depreciation forecast in line with current asset register.
14. The decrease is due to expected ongoing reduced expenditure on legal and advertising expenses.
15. The decrease is due to lower than budgeted bad debt expense and impairment loss.
Major variations between 2016-17 Estimated Actual and the 2017-18 Budget include:
16. The increase is largely due to an increase in Senior Medical Officers employed in relation to increased activity andnew/expanded programs. Additional movement relates to increased Health Service Executive Staff and Boardcosts.
17. The decrease relates to expected reduction on non-labour expenditure due to the implementation of financialsustainability programs.
18. The increase is related to an increase in staff numbers due to new service delivery programs and the impact ofEnterprise Bargaining Agreements.
19. The decrease relates to revised depreciation forecast in line with current asset register.
20. The decrease is due to expected balanced position in 2017-18 budget while surplus is expected in 2016-17.
Explanation of variances in the financial statements
822017-18 Queensland State Budget - Service Delivery Statements - Central Queensland Hospital and Health Service
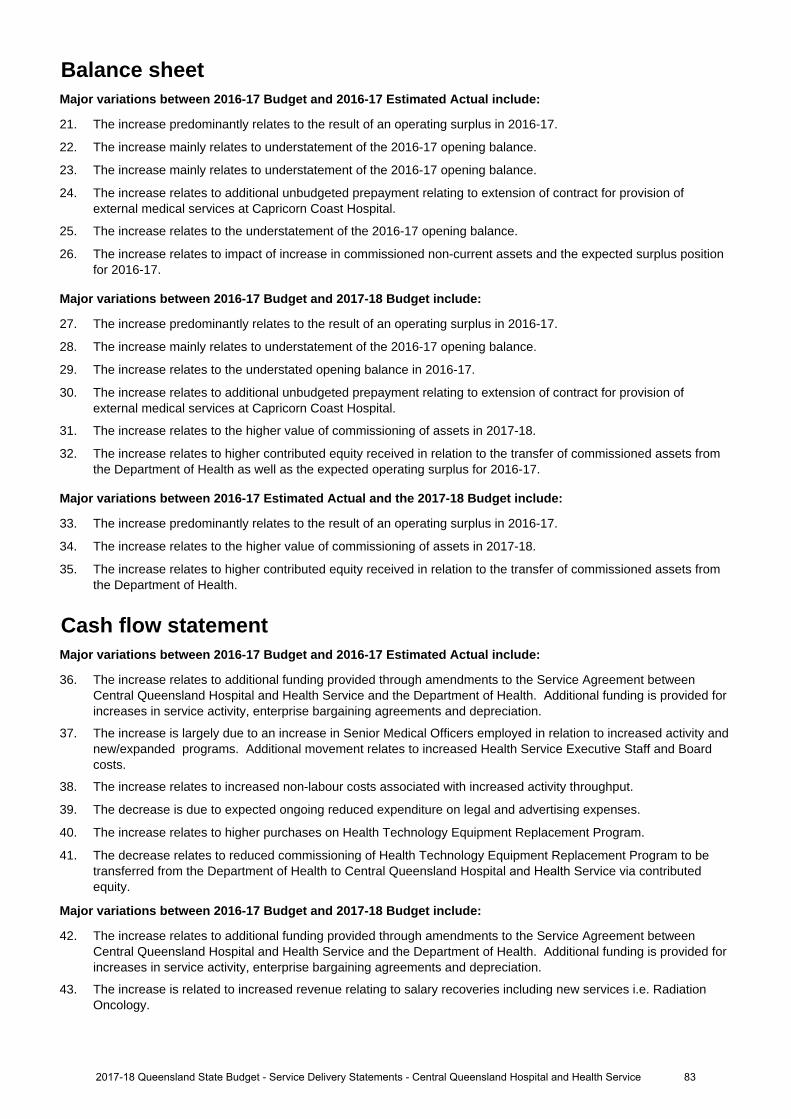
Balance sheetMajor variations between 2016-17 Budget and 2016-17 Estimated Actual include:
21. The increase predominantly relates to the result of an operating surplus in 2016-17.
22. The increase mainly relates to understatement of the 2016-17 opening balance.
23. The increase mainly relates to understatement of the 2016-17 opening balance.
24. The increase relates to additional unbudgeted prepayment relating to extension of contract for provision ofexternal medical services at Capricorn Coast Hospital.
25. The increase relates to the understatement of the 2016-17 opening balance.
26. The increase relates to impact of increase in commissioned non-current assets and the expected surplus positionfor 2016-17.
Major variations between 2016-17 Budget and 2017-18 Budget include:
27. The increase predominantly relates to the result of an operating surplus in 2016-17.
28. The increase mainly relates to understatement of the 2016-17 opening balance.
29. The increase relates to the understated opening balance in 2016-17.
30. The increase relates to additional unbudgeted prepayment relating to extension of contract for provision ofexternal medical services at Capricorn Coast Hospital.
31. The increase relates to the higher value of commissioning of assets in 2017-18.
32. The increase relates to higher contributed equity received in relation to the transfer of commissioned assets fromthe Department of Health as well as the expected operating surplus for 2016-17.
Major variations between 2016-17 Estimated Actual and the 2017-18 Budget include:
33. The increase predominantly relates to the result of an operating surplus in 2016-17.
34. The increase relates to the higher value of commissioning of assets in 2017-18.
35. The increase relates to higher contributed equity received in relation to the transfer of commissioned assets fromthe Department of Health.
Cash flow statementMajor variations between 2016-17 Budget and 2016-17 Estimated Actual include:
36. The increase relates to additional funding provided through amendments to the Service Agreement betweenCentral Queensland Hospital and Health Service and the Department of Health. Additional funding is provided forincreases in service activity, enterprise bargaining agreements and depreciation.
37. The increase is largely due to an increase in Senior Medical Officers employed in relation to increased activity andnew/expanded programs. Additional movement relates to increased Health Service Executive Staff and Boardcosts.
38. The increase relates to increased non-labour costs associated with increased activity throughput.
39. The decrease is due to expected ongoing reduced expenditure on legal and advertising expenses.
40. The increase relates to higher purchases on Health Technology Equipment Replacement Program.
41. The decrease relates to reduced commissioning of Health Technology Equipment Replacement Program to betransferred from the Department of Health to Central Queensland Hospital and Health Service via contributedequity.
Major variations between 2016-17 Budget and 2017-18 Budget include:
42. The increase relates to additional funding provided through amendments to the Service Agreement betweenCentral Queensland Hospital and Health Service and the Department of Health. Additional funding is provided forincreases in service activity, enterprise bargaining agreements and depreciation.
43. The increase is related to increased revenue relating to salary recoveries including new services i.e. RadiationOncology.
832017-18 Queensland State Budget - Service Delivery Statements - Central Queensland Hospital and Health Service
44. The increase is largely due to an increase in Senior Medical Officers employed in relation to increased activity andnew/expanded programs. Additional movement relates to increased Health Service Executive Staff and Boardcosts.
45. The increase relates to increased non-labour costs associated with increased activity throughput.
46. The decrease is due to expected ongoing reduced expenditure on legal and advertising expenses.
47. The increase relates to higher purchases on Health Technology Equipment Replacement Program.
48. The increase relates to higher commissioning of assets to be transferred from the Department of Health to CentralQueensland Hospital and Health Service via contributed equity budgeted in 2017-18.
49. The decreased withdrawals relates to reduction on depreciation revenue, which is subsequently returned toDepartment of Health.
Major variations between 2016-17 Estimated Actual and the 2017-18 Budget include:
50. The increase is largely due to an increase in Senior Medical Officers employed in relation to increased activity and new/expanded programs. Additional movement relates to increased Health Service Executive Staff and Board costs.
51. The increase relates to higher purchases on Health Technology Equipment Replacement Program.
52. The increase relates to higher commissioning of assets to be transferred from the Department of Health to CentralQueensland Hospital and Health Service via contributed equity budgeted in 2017-18.
53. The decreased withdrawals relates to reduction on depreciation revenue, which is subsequently returned toDepartment of Health.
842017-18 Queensland State Budget - Service Delivery Statements - Central Queensland Hospital and Health Service
Central West Hospital and Health Service
Overview The Central West Hospital and Health Service (HHS) is an independent statutory body overseen by a local Hospital and Health Board. The Central West HHS is responsible for providing public hospital and health services including acute care, general surgery, emergency care, medical, paediatrics, gynaecology and obstetrics to the communities of remote central west Queensland from Tambo, in the south-east, to Boulia in the north-west and serves a population of approximately 12,500 people.
The model of service delivery is based on four hospital hubs in Barcaldine, Blackall, Longreach and Winton with satellite primary health clinics at Aramac, Bedourie, Birdsville, Boulia, Isisford, Jericho, Jundah, Muttaburra, Tambo and Windorah, a procedural hub at Longreach and a Multipurpose Health Service at Alpha.
The Central West HHS provides region-wide services for child and maternal health, Aboriginal and Torres Strait Islander health and chronic disease management, together with a range of allied health and community health services based in Longreach and other service hubs. In 2016-17 the dental hub in Barcaldine received a major clinic upgrade supporting a training chair for development of dental students.
Central West HHS doctors also work in general practices across the region under contract to deliver an integrated approach to primary and acute health care.
The Central West HHS will continue to invest in strategies that reduce the health disadvantage in western Queensland communities through the strengthening of general practice, integration of primary and acute healthcare and providing more services locally and by Telehealth. The 'one practice' strategy will connect patient records and clinicians across the region and better help our residents take responsibility for the management of their own care.
Further integration and collaboration is being realised as the three western Queensland HHSs (North West, South West and Central West) operate the Western Queensland Primary Health Network. The collaborative is driving comprehensive planning across this vast region, integrating primary health care and sharing resources to ensure the effective use of health funding.
The Central West HHS remains committed to the highest standards of care and safety and will work with clinicians to implement practices that achieve the best outcomes for our patients.
The health service continues to offer places for graduate nurses to experience rural healthcare, making a major contribution to building tomorrow's rural health workforce.
The Central West HHS's vision is 'excellence in healthcare for remote Queenslanders'. The Central West HHS's strategic objectives are to:
• ensure patients have access to safe and high quality healthcare• integrate primary and acute care services to support patient wellbeing• deliver more services locally where it is safe and sustainable to do so• attract, retain and develop a motivated healthcare workforce to meet our communities future needs• involve our communities and stakeholders in the planning, design and delivery of services in our unique region• provide responsible governance and effective leadership of the healthcare system in the central west.
The Central West HHS contributes to the Queensland Government's objectives for the community to deliver quality frontline services including strengthening the public health system and building safe, caring and connected communities.
852017-18 Queensland State Budget - Service Delivery Statements - Central West Hospital and Health Service
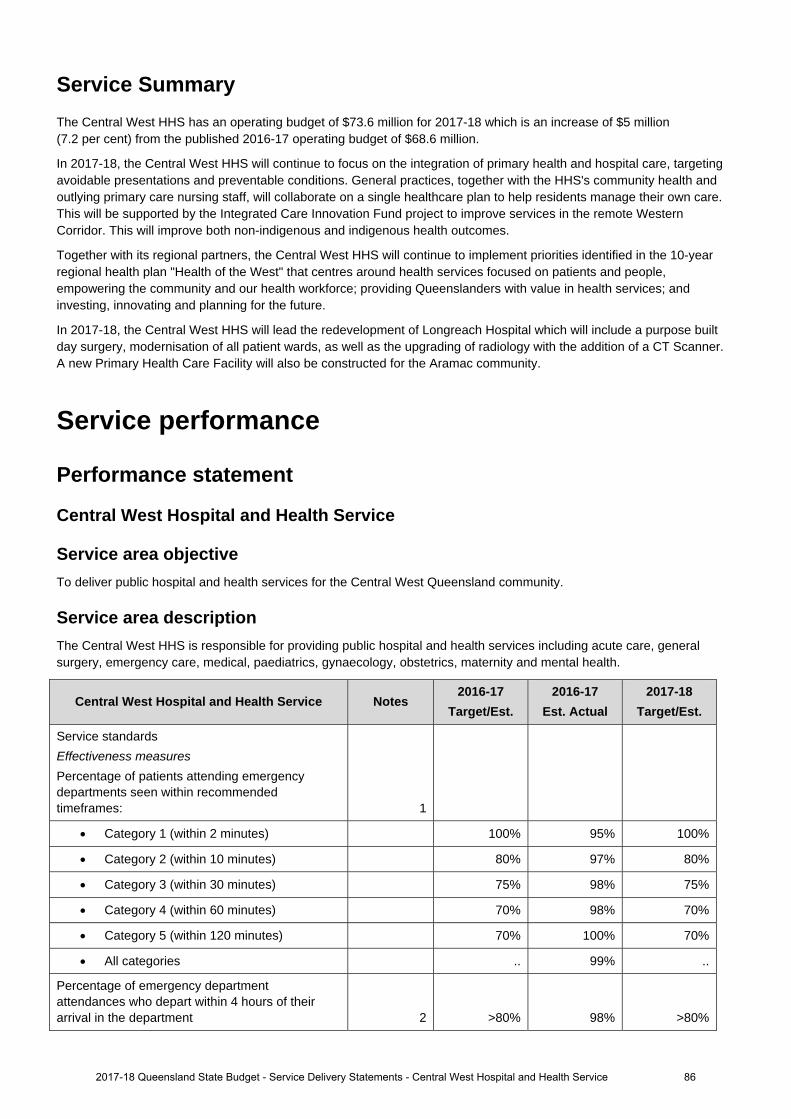
Service Summary The Central West HHS has an operating budget of $73.6 million for 2017-18 which is an increase of $5 million (7.2 per cent) from the published 2016-17 operating budget of $68.6 million.
In 2017-18, the Central West HHS will continue to focus on the integration of primary health and hospital care, targeting avoidable presentations and preventable conditions. General practices, together with the HHS's community health and outlying primary care nursing staff, will collaborate on a single healthcare plan to help residents manage their own care. This will be supported by the Integrated Care Innovation Fund project to improve services in the remote Western Corridor. This will improve both non-indigenous and indigenous health outcomes.
Together with its regional partners, the Central West HHS will continue to implement priorities identified in the 10-year regional health plan "Health of the West" that centres around health services focused on patients and people, empowering the community and our health workforce; providing Queenslanders with value in health services; and investing, innovating and planning for the future.
In 2017-18, the Central West HHS will lead the redevelopment of Longreach Hospital which will include a purpose built day surgery, modernisation of all patient wards, as well as the upgrading of radiology with the addition of a CT Scanner. A new Primary Health Care Facility will also be constructed for the Aramac community.
Service performance
Performance statement
Central West Hospital and Health Service
Service area objective To deliver public hospital and health services for the Central West Queensland community.
Service area description The Central West HHS is responsible for providing public hospital and health services including acute care, general surgery, emergency care, medical, paediatrics, gynaecology, obstetrics, maternity and mental health.
Central West Hospital and Health Service Notes 2016-17
Target/Est. 2016-17
Est. Actual 2017-18
Target/Est.
Service standards Effectiveness measures Percentage of patients attending emergency departments seen within recommended timeframes: 1
Category 1 (within 2 minutes) 100% 95% 100%
Category 2 (within 10 minutes) 80% 97% 80%
Category 3 (within 30 minutes) 75% 98% 75%
Category 4 (within 60 minutes) 70% 98% 70%
Category 5 (within 120 minutes) 70% 100% 70%
All categories .. 99% ..
Percentage of emergency department attendances who depart within 4 hours of their arrival in the department 2 >80% 98% >80%
2017-18 Queensland State Budget - Service Delivery Statements - Central West Hospital and Health Service 86
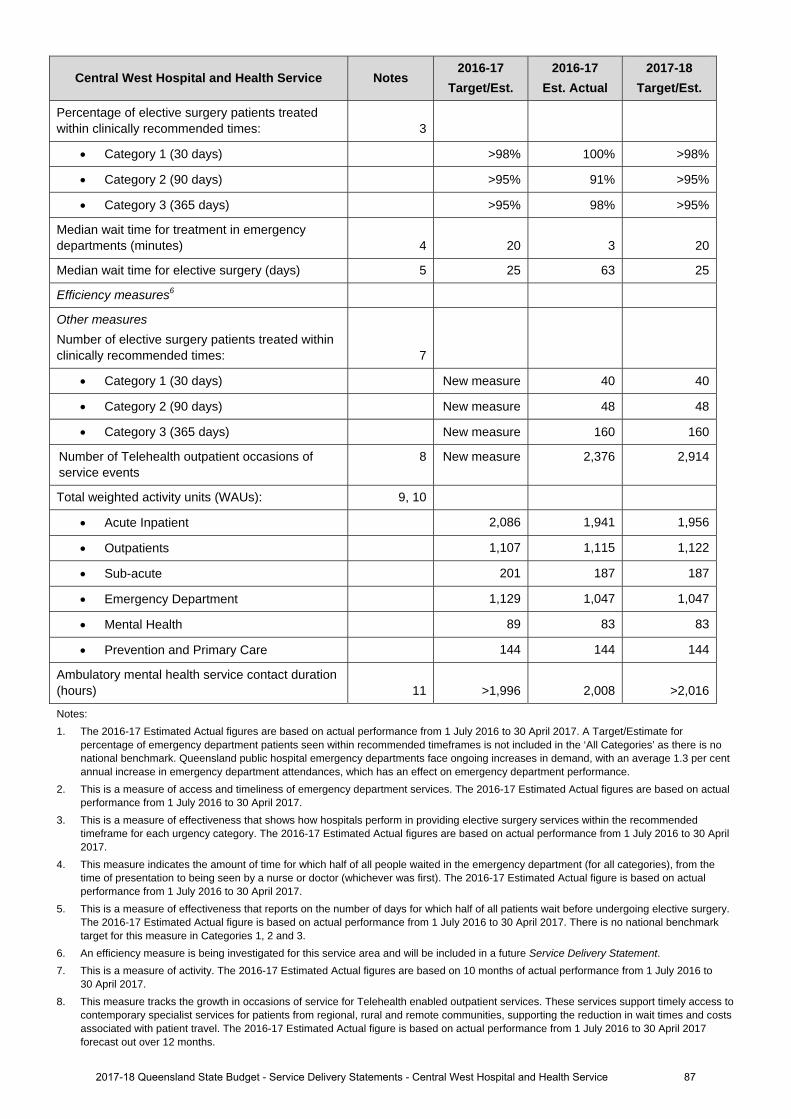
Central West Hospital and Health Service Notes 2016-17
Target/Est. 2016-17
Est. Actual 2017-18
Target/Est.
Percentage of elective surgery patients treated within clinically recommended times: 3
Category 1 (30 days) >98% 100% >98%
Category 2 (90 days) >95% 91% >95%
Category 3 (365 days) >95% 98% >95%
Median wait time for treatment in emergency departments (minutes) 4 20 3 20
Median wait time for elective surgery (days) 5 25 63 25
Efficiency measures6
Other measures Number of elective surgery patients treated within clinically recommended times: 7
Category 1 (30 days) New measure 40 40
Category 2 (90 days) New measure 48 48
Category 3 (365 days) New measure 160 160
Number of Telehealth outpatient occasions of service events
8 New measure 2,376 2,914
Total weighted activity units (WAUs): 9, 10
Acute Inpatient 2,086 1,941 1,956
Outpatients 1,107 1,115 1,122
Sub-acute 201 187 187
Emergency Department 1,129 1,047 1,047
Mental Health 89 83 83
Prevention and Primary Care 144 144 144
Ambulatory mental health service contact duration (hours) 11 >1,996 2,008 >2,016
Notes: 1. The 2016-17 Estimated Actual figures are based on actual performance from 1 July 2016 to 30 April 2017. A Target/Estimate for
percentage of emergency department patients seen within recommended timeframes is not included in the ‘All Categories’ as there is no national benchmark. Queensland public hospital emergency departments face ongoing increases in demand, with an average 1.3 per cent annual increase in emergency department attendances, which has an effect on emergency department performance.
2. This is a measure of access and timeliness of emergency department services. The 2016-17 Estimated Actual figures are based on actual performance from 1 July 2016 to 30 April 2017.
3. This is a measure of effectiveness that shows how hospitals perform in providing elective surgery services within the recommended timeframe for each urgency category. The 2016-17 Estimated Actual figures are based on actual performance from 1 July 2016 to 30 April 2017.
4. This measure indicates the amount of time for which half of all people waited in the emergency department (for all categories), from the time of presentation to being seen by a nurse or doctor (whichever was first). The 2016-17 Estimated Actual figure is based on actual performance from 1 July 2016 to 30 April 2017.
5. This is a measure of effectiveness that reports on the number of days for which half of all patients wait before undergoing elective surgery. The 2016-17 Estimated Actual figure is based on actual performance from 1 July 2016 to 30 April 2017. There is no national benchmark target for this measure in Categories 1, 2 and 3.
6. An efficiency measure is being investigated for this service area and will be included in a future Service Delivery Statement. 7. This is a measure of activity. The 2016-17 Estimated Actual figures are based on 10 months of actual performance from 1 July 2016 to
30 April 2017. 8. This measure tracks the growth in occasions of service for Telehealth enabled outpatient services. These services support timely access to
contemporary specialist services for patients from regional, rural and remote communities, supporting the reduction in wait times and costs associated with patient travel. The 2016-17 Estimated Actual figure is based on actual performance from 1 July 2016 to 30 April 2017 forecast out over 12 months.
2017-18 Queensland State Budget - Service Delivery Statements - Central West Hospital and Health Service 87
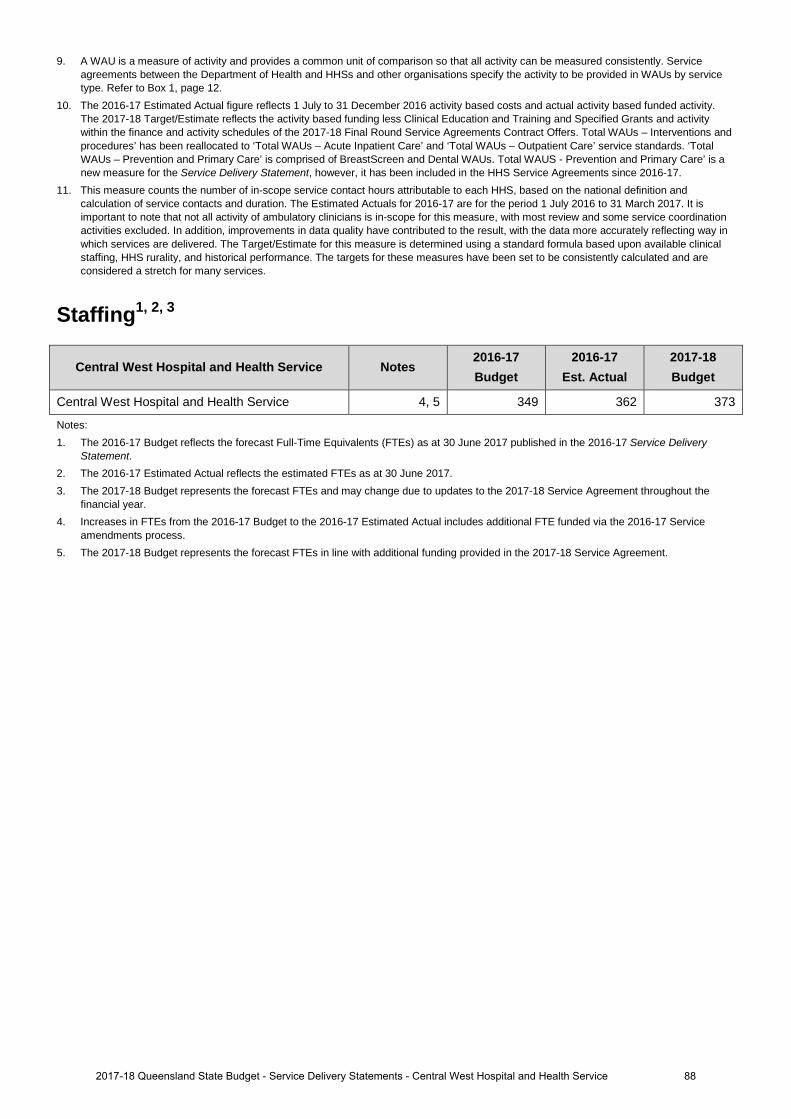
9. A WAU is a measure of activity and provides a common unit of comparison so that all activity can be measured consistently. Serviceagreements between the Department of Health and HHSs and other organisations specify the activity to be provided in WAUs by servicetype. Refer to Box 1, page 12.
10. The 2016-17 Estimated Actual figure reflects 1 July to 31 December 2016 activity based costs and actual activity based funded activity.The 2017-18 Target/Estimate reflects the activity based funding less Clinical Education and Training and Specified Grants and activitywithin the finance and activity schedules of the 2017-18 Final Round Service Agreements Contract Offers. Total WAUs – Interventions andprocedures’ has been reallocated to ‘Total WAUs – Acute Inpatient Care’ and ‘Total WAUs – Outpatient Care’ service standards. ‘TotalWAUs – Prevention and Primary Care’ is comprised of BreastScreen and Dental WAUs. Total WAUS - Prevention and Primary Care’ is anew measure for the Service Delivery Statement, however, it has been included in the HHS Service Agreements since 2016-17.
11. This measure counts the number of in-scope service contact hours attributable to each HHS, based on the national definition andcalculation of service contacts and duration. The Estimated Actuals for 2016-17 are for the period 1 July 2016 to 31 March 2017. It isimportant to note that not all activity of ambulatory clinicians is in-scope for this measure, with most review and some service coordinationactivities excluded. In addition, improvements in data quality have contributed to the result, with the data more accurately reflecting way inwhich services are delivered. The Target/Estimate for this measure is determined using a standard formula based upon available clinicalstaffing, HHS rurality, and historical performance. The targets for these measures have been set to be consistently calculated and areconsidered a stretch for many services.
Staffing1, 2, 3
Central West Hospital and Health Service Notes 2016-17 Budget
2016-17 Est. Actual
2017-18 Budget
Central West Hospital and Health Service 4, 5 349 362 373
Notes: 1. The 2016-17 Budget reflects the forecast Full-Time Equivalents (FTEs) as at 30 June 2017 published in the 2016-17 Service Delivery
Statement. 2. The 2016-17 Estimated Actual reflects the estimated FTEs as at 30 June 2017.3. The 2017-18 Budget represents the forecast FTEs and may change due to updates to the 2017-18 Service Agreement throughout the
financial year.4. Increases in FTEs from the 2016-17 Budget to the 2016-17 Estimated Actual includes additional FTE funded via the 2016-17 Service
amendments process.5. The 2017-18 Budget represents the forecast FTEs in line with additional funding provided in the 2017-18 Service Agreement.
882017-18 Queensland State Budget - Service Delivery Statements - Central West Hospital and Health Service
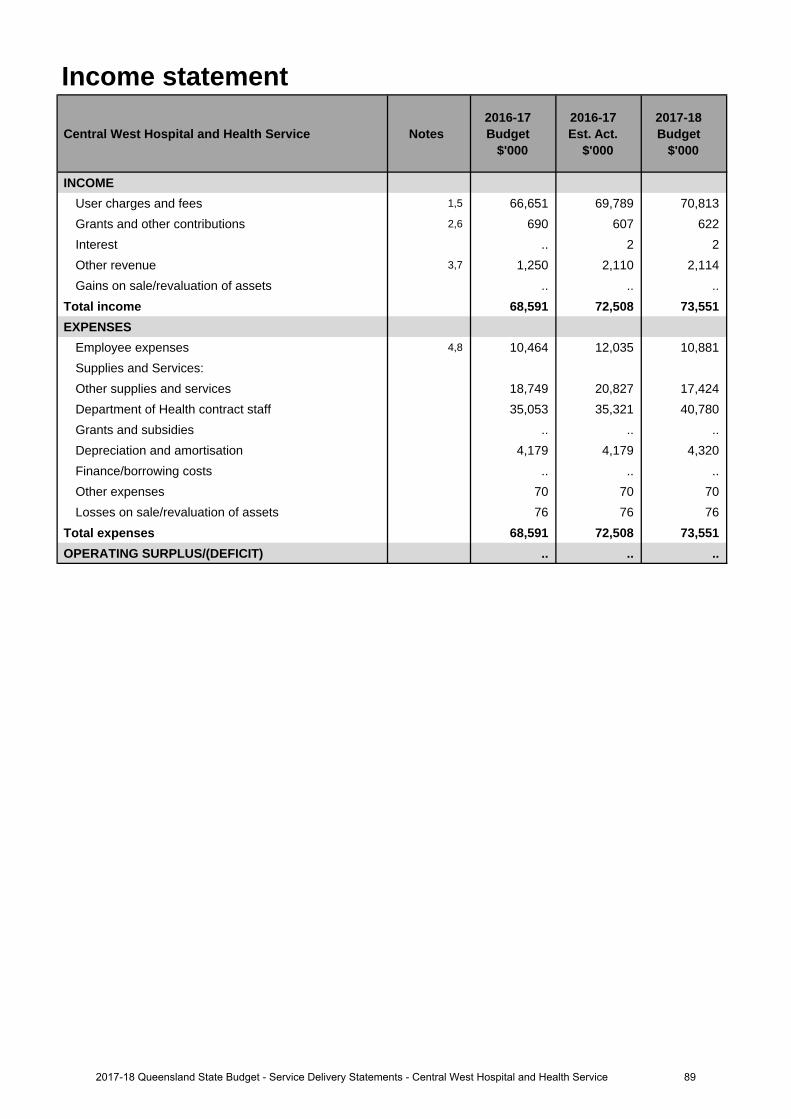
Income statement
Central West Hospital and Health Service Notes 2016-17 Budget
$'000
2016-17 Est. Act.
$'000
2017-18 Budget
$'000
INCOMEUser charges and fees 1,5 66,651 69,789 70,813 Grants and other contributions 2,6 690 607 622 Interest .. 2 2 Other revenue 3,7 1,250 2,110 2,114 Gains on sale/revaluation of assets .. .. ..
Total income 68,591 72,508 73,551 EXPENSES
Employee expenses 4,8 10,464 12,035 10,881 Supplies and Services:Other supplies and services 18,749 20,827 17,424 Department of Health contract staff 35,053 35,321 40,780 Grants and subsidies .. .. .. Depreciation and amortisation 4,179 4,179 4,320 Finance/borrowing costs .. .. .. Other expenses 70 70 70 Losses on sale/revaluation of assets 76 76 76
Total expenses 68,591 72,508 73,551 OPERATING SURPLUS/(DEFICIT) .. .. ..
892017-18 Queensland State Budget - Service Delivery Statements - Central West Hospital and Health Service

Balance sheet
Central West Hospital and Health Service Notes 2016-17 Budget
$'000
2016-17 Est. Act.
$'000
2017-18 Budget
$'000
CURRENT ASSETSCash assets 1,288 1,224 1,204 Receivables 9,13 1,379 1,836 1,844 Other financial assets .. .. .. Inventories 594 565 569 Other 64 63 71 Non-financial assets held for sale .. .. ..
Total current assets 3,325 3,688 3,688 NON-CURRENT ASSETS
Receivables .. .. .. Other financial assets .. .. .. Property, plant and equipment 10,15 69,537 61,719 69,619 Intangibles .. .. .. Other .. .. ..
Total non-current assets 69,537 61,719 69,619 TOTAL ASSETS 72,862 65,407 73,307 CURRENT LIABILITIES
Payables 11,14 1,851 3,906 3,906 Accrued employee benefits 108 174 174 Interest bearing liabilities and derivatives .. .. .. Provisions .. .. .. Other .. .. ..
Total current liabilities 1,959 4,080 4,080 NON-CURRENT LIABILITIES
Payables .. .. .. Accrued employee benefits .. .. .. Interest bearing liabilities and derivatives .. .. .. Provisions .. .. .. Other .. .. ..
Total non-current liabilities .. .. .. TOTAL LIABILITIES 1,959 4,080 4,080 NET ASSETS/(LIABILITIES) 70,903 61,327 69,227 EQUITYTOTAL EQUITY 12,16 70,903 61,327 69,227
902017-18 Queensland State Budget - Service Delivery Statements - Central West Hospital and Health Service
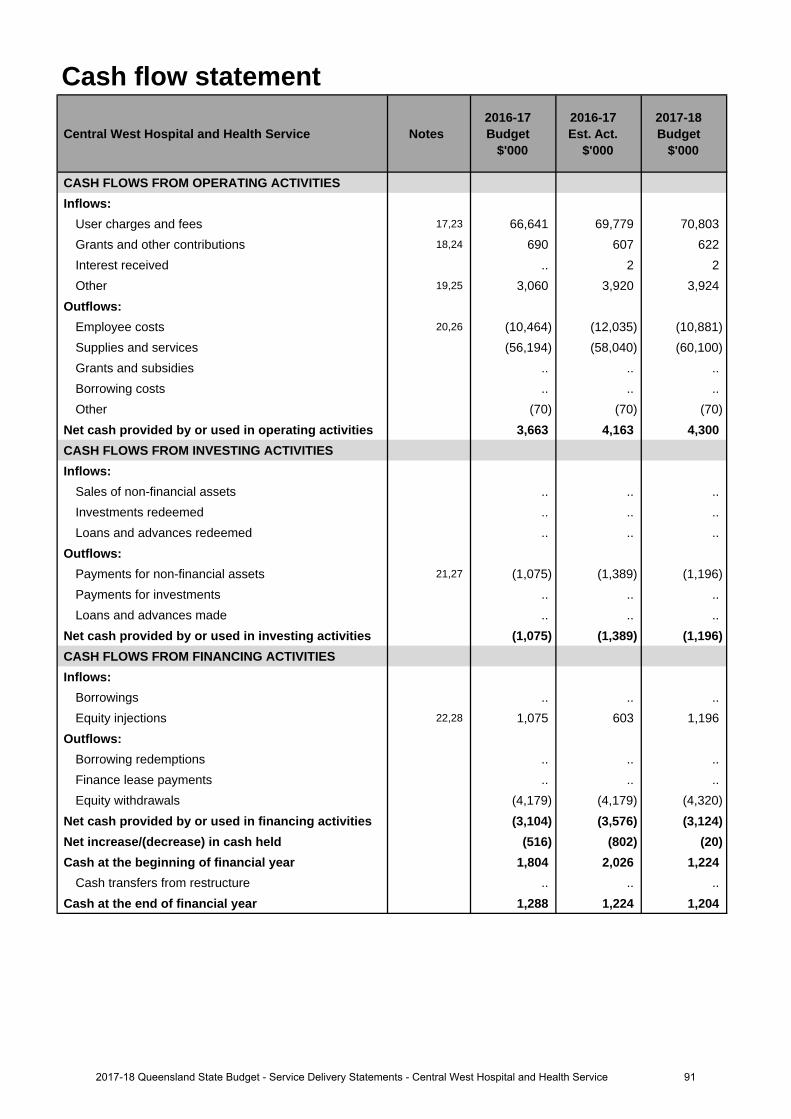
Cash flow statement
Central West Hospital and Health Service Notes 2016-17 Budget
$'000
2016-17 Est. Act.
$'000
2017-18 Budget
$'000
CASH FLOWS FROM OPERATING ACTIVITIESInflows:
User charges and fees 17,23 66,641 69,779 70,803 Grants and other contributions 18,24 690 607 622 Interest received .. 2 2 Other 19,25 3,060 3,920 3,924
Outflows:Employee costs 20,26 (10,464) (12,035) (10,881)Supplies and services (56,194) (58,040) (60,100)Grants and subsidies .. .. .. Borrowing costs .. .. .. Other (70) (70) (70)
Net cash provided by or used in operating activities 3,663 4,163 4,300 CASH FLOWS FROM INVESTING ACTIVITIESInflows:
Sales of non-financial assets .. .. .. Investments redeemed .. .. .. Loans and advances redeemed .. .. ..
Outflows:Payments for non-financial assets 21,27 (1,075) (1,389) (1,196)Payments for investments .. .. .. Loans and advances made .. .. ..
Net cash provided by or used in investing activities (1,075) (1,389) (1,196)CASH FLOWS FROM FINANCING ACTIVITIESInflows:
Borrowings .. .. .. Equity injections 22,28 1,075 603 1,196
Outflows:Borrowing redemptions .. .. .. Finance lease payments .. .. .. Equity withdrawals (4,179) (4,179) (4,320)
Net cash provided by or used in financing activities (3,104) (3,576) (3,124)Net increase/(decrease) in cash held (516) (802) (20)Cash at the beginning of financial year 1,804 2,026 1,224
Cash transfers from restructure .. .. .. Cash at the end of financial year 1,288 1,224 1,204
912017-18 Queensland State Budget - Service Delivery Statements - Central West Hospital and Health Service
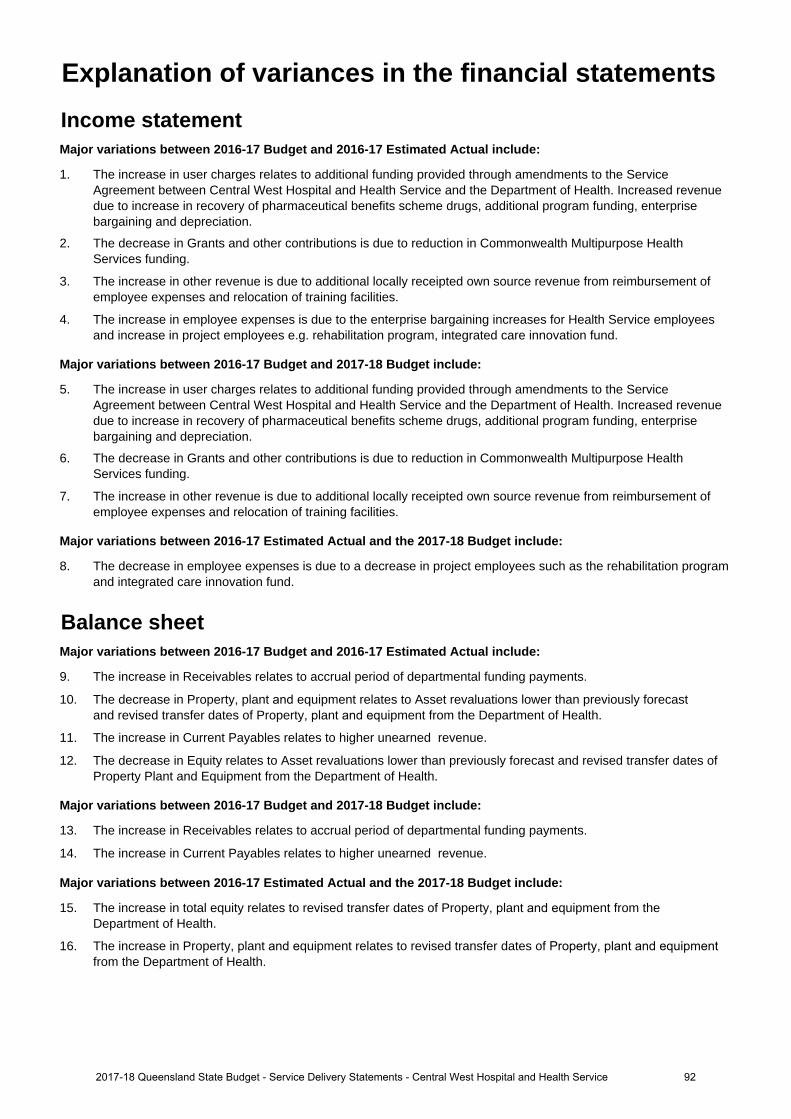
Income statementMajor variations between 2016-17 Budget and 2016-17 Estimated Actual include:
1. The increase in user charges relates to additional funding provided through amendments to the ServiceAgreement between Central West Hospital and Health Service and the Department of Health. Increased revenuedue to increase in recovery of pharmaceutical benefits scheme drugs, additional program funding, enterprisebargaining and depreciation.
2. The decrease in Grants and other contributions is due to reduction in Commonwealth Multipurpose HealthServices funding.
3. The increase in other revenue is due to additional locally receipted own source revenue from reimbursement ofemployee expenses and relocation of training facilities.
4. The increase in employee expenses is due to the enterprise bargaining increases for Health Service employeesand increase in project employees e.g. rehabilitation program, integrated care innovation fund.
Major variations between 2016-17 Budget and 2017-18 Budget include:
5. The increase in user charges relates to additional funding provided through amendments to the ServiceAgreement between Central West Hospital and Health Service and the Department of Health. Increased revenuedue to increase in recovery of pharmaceutical benefits scheme drugs, additional program funding, enterprisebargaining and depreciation.
6. The decrease in Grants and other contributions is due to reduction in Commonwealth Multipurpose HealthServices funding.
7. The increase in other revenue is due to additional locally receipted own source revenue from reimbursement ofemployee expenses and relocation of training facilities.
Major variations between 2016-17 Estimated Actual and the 2017-18 Budget include:
8. The decrease in employee expenses is due to a decrease in project employees such as the rehabilitation programand integrated care innovation fund.
Balance sheetMajor variations between 2016-17 Budget and 2016-17 Estimated Actual include:
9. The increase in Receivables relates to accrual period of departmental funding payments.
10. The decrease in Property, plant and equipment relates to Asset revaluations lower than previously forecast and revised transfer dates of Property, plant and equipment from the Department of Health.
11. The increase in Current Payables relates to higher unearned revenue.
12. The decrease in Equity relates to Asset revaluations lower than previously forecast and revised transfer dates ofProperty Plant and Equipment from the Department of Health.
Major variations between 2016-17 Budget and 2017-18 Budget include:
13. The increase in Receivables relates to accrual period of departmental funding payments.
14. The increase in Current Payables relates to higher unearned revenue.
Major variations between 2016-17 Estimated Actual and the 2017-18 Budget include:
15. The increase in total equity relates to revised transfer dates of Property, plant and equipment from theDepartment of Health.
16. The increase in Property, plant and equipment relates to revised transfer dates of Property, plant and equipmentfrom the Department of Health.
Explanation of variances in the financial statements
922017-18 Queensland State Budget - Service Delivery Statements - Central West Hospital and Health Service
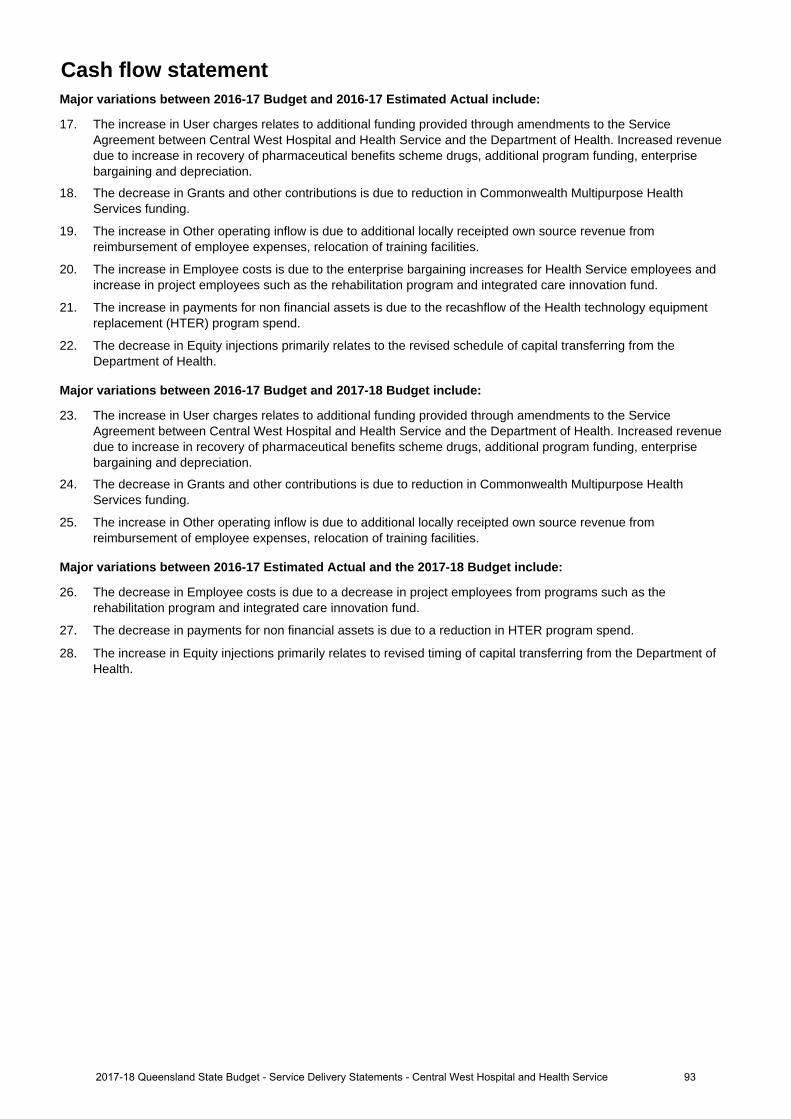
Cash flow statementMajor variations between 2016-17 Budget and 2016-17 Estimated Actual include:
17. The increase in User charges relates to additional funding provided through amendments to the ServiceAgreement between Central West Hospital and Health Service and the Department of Health. Increased revenuedue to increase in recovery of pharmaceutical benefits scheme drugs, additional program funding, enterprisebargaining and depreciation.
18. The decrease in Grants and other contributions is due to reduction in Commonwealth Multipurpose HealthServices funding.
19. The increase in Other operating inflow is due to additional locally receipted own source revenue fromreimbursement of employee expenses, relocation of training facilities.
20. The increase in Employee costs is due to the enterprise bargaining increases for Health Service employees andincrease in project employees such as the rehabilitation program and integrated care innovation fund.
21. The increase in payments for non financial assets is due to the recashflow of the Health technology equipmentreplacement (HTER) program spend.
22. The decrease in Equity injections primarily relates to the revised schedule of capital transferring from theDepartment of Health.
Major variations between 2016-17 Budget and 2017-18 Budget include:
23. The increase in User charges relates to additional funding provided through amendments to the ServiceAgreement between Central West Hospital and Health Service and the Department of Health. Increased revenuedue to increase in recovery of pharmaceutical benefits scheme drugs, additional program funding, enterprisebargaining and depreciation.
24. The decrease in Grants and other contributions is due to reduction in Commonwealth Multipurpose HealthServices funding.
25. The increase in Other operating inflow is due to additional locally receipted own source revenue fromreimbursement of employee expenses, relocation of training facilities.
Major variations between 2016-17 Estimated Actual and the 2017-18 Budget include:
26. The decrease in Employee costs is due to a decrease in project employees from programs such as therehabilitation program and integrated care innovation fund.
27. The decrease in payments for non financial assets is due to a reduction in HTER program spend.
28. The increase in Equity injections primarily relates to revised timing of capital transferring from the Department ofHealth.
932017-18 Queensland State Budget - Service Delivery Statements - Central West Hospital and Health Service
Children’s Health Queensland Hospital and Health Service
Overview Children's Health Queensland Hospital and Health Service (HHS) key priorities and objectives align with and support the Queensland Government’s objectives to deliver quality frontline services for families including strengthening the public health system, and building safe caring and connected communities. Children’s Health Queensland HHS is focused on four overall key objectives: Child and Family Centred Care, Partnerships, People and Performance. The Children’s Health Queensland Strategic Action Plan has 11 focus areas with a number of measurable objectives covering the following focus areas:
• Engaging children, young people, their families and the community• An integrated system of care• Equitable access and improved outcomes• Safety and quality• Excellence, innovation and sustainability• Partnering across the system• Evidence-based service delivery and capacity planning• System-wide service delivery and leadership• An engaged and skilled workforce• Research• Care through digital enablement.
Service summary Children's Health Queensland HHS has an operating budget of $720.2 million for 2017-18 which is an increase of $43 million (6.4 per cent) from the published 2016-17 operating budget of $677.2 million.
The service agreement between Children's Health Queensland HHS and Queensland Health identifies the services to be provided, the funding arrangements for those services and defined performance indicators and targets to ensure outputs and outcomes are achieved. The Children's Health Queensland HHS Strategic Plan reflects priorities for children’s health services in line with whole-of-government and statewide plans and commitments.
Children's Health Queensland HHS is the only statewide HHS, which provides a unique opportunity to work with other HHSs and healthcare providers to improve the healthcare of children across the State. Since establishment with input from a wide range of key stakeholders, Children's Health Queensland HHS continues to define and progressively implement key initiatives in accordance with its statewide paediatric role. Children's Health Queensland HHS is committed to the ongoing implementation of and enhancements to key initiatives including improved complex care coordination, paediatric education and training, and paediatric advice.
942017-18 Queensland State Budget - Service Delivery Statements -Children's Health Queensland Hospital and Health Service
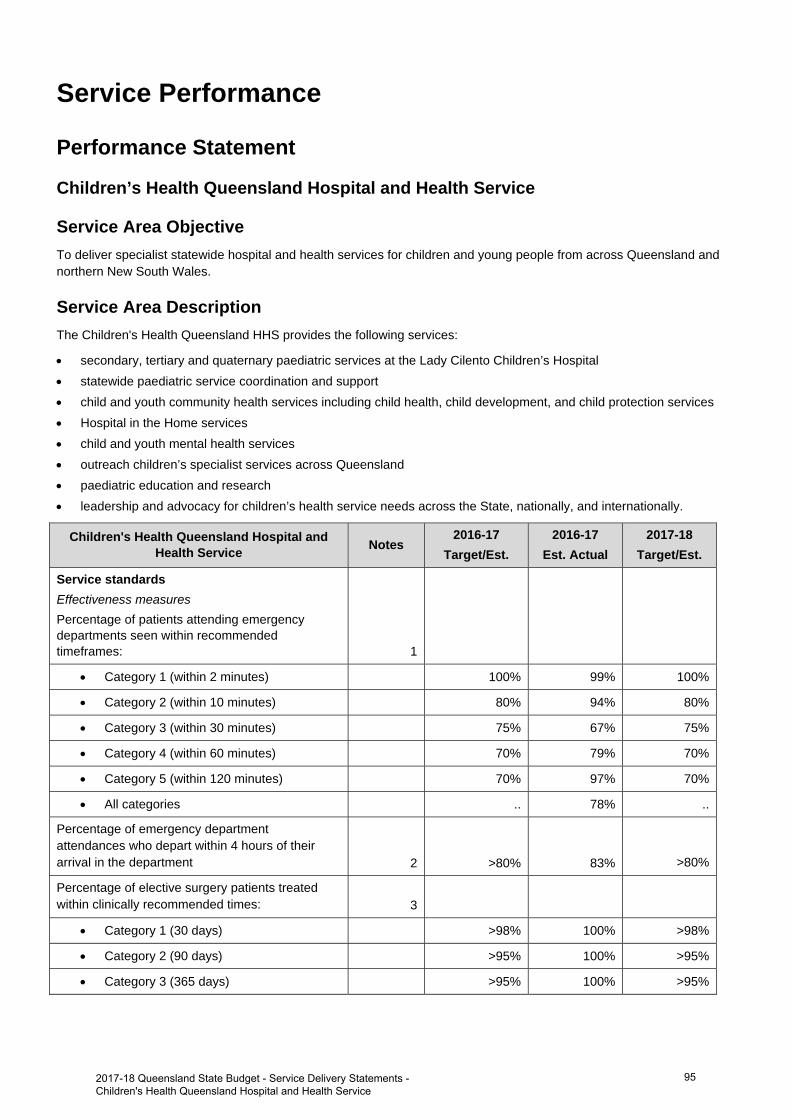
Service Performance
Performance Statement
Children’s Health Queensland Hospital and Health Service
Service Area Objective To deliver specialist statewide hospital and health services for children and young people from across Queensland and northern New South Wales.
Service Area Description The Children's Health Queensland HHS provides the following services:
secondary, tertiary and quaternary paediatric services at the Lady Cilento Children’s Hospital statewide paediatric service coordination and support child and youth community health services including child health, child development, and child protection services Hospital in the Home services child and youth mental health services outreach children’s specialist services across Queensland paediatric education and research leadership and advocacy for children’s health service needs across the State, nationally, and internationally.
Children's Health Queensland Hospital and Health Service Notes
2016-17 Target/Est.
2016-17 Est. Actual
2017-18 Target/Est.
Service standards Effectiveness measures
Percentage of patients attending emergency departments seen within recommended timeframes: 1
Category 1 (within 2 minutes) 100% 99% 100%
Category 2 (within 10 minutes) 80% 94% 80%
Category 3 (within 30 minutes) 75% 67% 75%
Category 4 (within 60 minutes) 70% 79% 70%
Category 5 (within 120 minutes) 70% 97% 70%
All categories .. 78% ..
Percentage of emergency department attendances who depart within 4 hours of their arrival in the department 2 >80% 83% >80%
Percentage of elective surgery patients treated within clinically recommended times: 3
Category 1 (30 days) >98% 100% >98%
Category 2 (90 days) >95% 100% >95%
Category 3 (365 days) >95% 100% >95%
2017-18 Queensland State Budget - Service Delivery Statements - Children's Health Queensland Hospital and Health Service
95
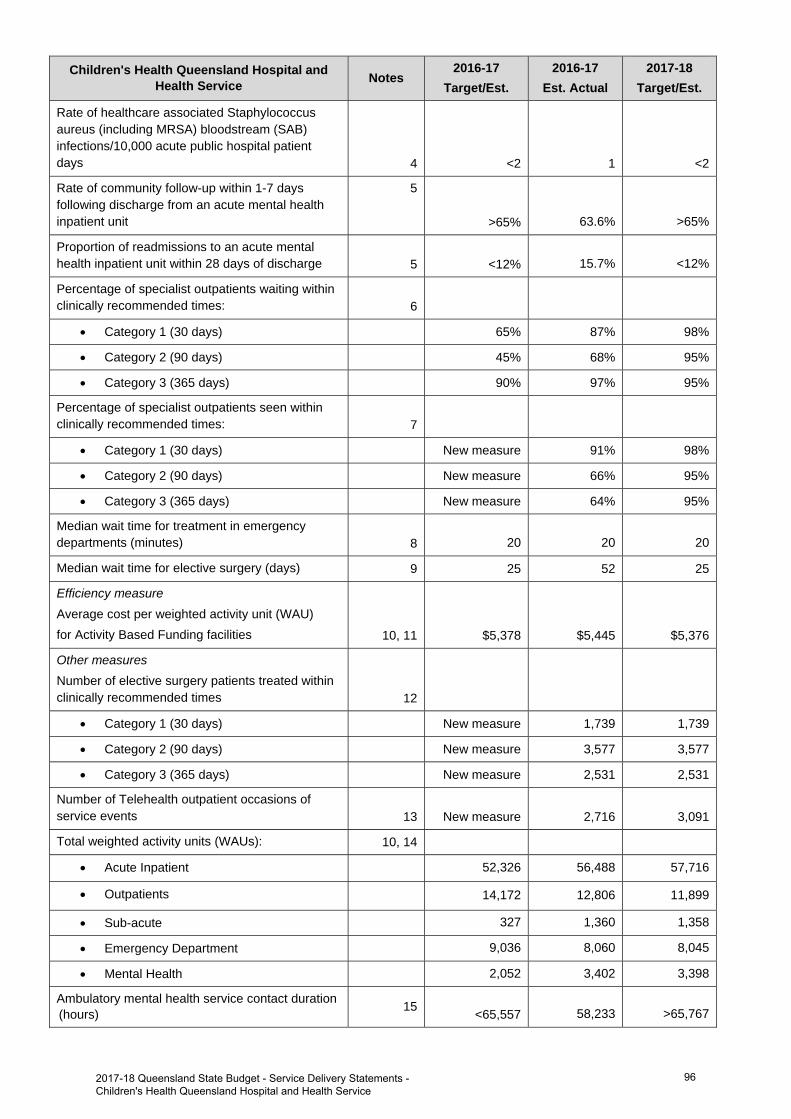
Children's Health Queensland Hospital and Health Service Notes
2016-17 Target/Est.
2016-17 Est. Actual
2017-18 Target/Est.
Rate of healthcare associated Staphylococcus aureus (including MRSA) bloodstream (SAB) infections/10,000 acute public hospital patient days 4 <2 1 <2
Rate of community follow-up within 1-7 days following discharge from an acute mental health inpatient unit
5
>65% 63.6% >65%
Proportion of readmissions to an acute mental health inpatient unit within 28 days of discharge 5 <12% 15.7% <12%
Percentage of specialist outpatients waiting within clinically recommended times: 6
Category 1 (30 days) 65% 87% 98%
Category 2 (90 days) 45% 68% 95%
Category 3 (365 days) 90% 97% 95%
Percentage of specialist outpatients seen within clinically recommended times: 7
Category 1 (30 days) New measure 91% 98%
Category 2 (90 days) New measure 66% 95%
Category 3 (365 days) New measure 64% 95%
Median wait time for treatment in emergency departments (minutes) 8 20 20 20
Median wait time for elective surgery (days) 9 25 52 25
Efficiency measure Average cost per weighted activity unit (WAU) for Activity Based Funding facilities 10, 11 $5,378 $5,445 $5,376
Other measures
Number of elective surgery patients treated within clinically recommended times 12
Category 1 (30 days) New measure 1,739 1,739
Category 2 (90 days) New measure 3,577 3,577
Category 3 (365 days) New measure 2,531 2,531
Number of Telehealth outpatient occasions of service events 13 New measure 2,716 3,091
Total weighted activity units (WAUs): 10, 14
Acute Inpatient 52,326 56,488 57,716
Outpatients 14,172 12,806 11,899
Sub-acute 327 1,360 1,358
Emergency Department 9,036 8,060 8,045
Mental Health 2,052 3,402 3,398
Ambulatory mental health service contact duration (hours) 15 <65,557 58,233 >65,767
2017-18 Queensland State Budget - Service Delivery Statements - Children's Health Queensland Hospital and Health Service
96
Notes: 1. The 2016-17 Estimated Actual figures are based on actual performance from 1 July 2016 to 30 April 2017. A Target/Estimate for
percentage of emergency department patients seen within recommended timeframes is not included in the ‘All Categories’ as there is no national benchmark. Queensland public hospital emergency departments face ongoing increases in demand, with an average 1.3 per cent annual increase in emergency department attendances, which has an effect on emergency department performance.
2. This is a measure of access and timeliness of emergency department services. The 2016-17 Estimated Actual figures are based on actual performance from 1 July 2016 to 30 April 2017.
3. This is a measure of effectiveness that shows how hospitals perform in providing elective surgery services within the recommended timeframe for each urgency category. The 2016-17 Estimated Actual figures are based on actual performance from 1 July 2016 to 30 April 2017.
4. This is a National Performance Agreement indicator and a measure of effectiveness of infection control programs and services in hospitals. Staphylococcus aureus are bacteria commonly found on around 30 per cent of people’s skin and noses and often cause no adverse effects. Infections with this organism can be serious, particularly so when they infect the bloodstream. The data reported for this service standard are for bloodstream infections with Staphylococcus aureus (including methicillin resistant Staphylococcus aureus) and are reported as a rate of infection per 10,000 patient days. The Target/Estimate for this measure aligns with the national benchmark of 2 cases per 10,000 acute public hospital patient days for each jurisdiction. The 2016-17 Estimated Actual figures are based on actual performance from 1 July 2016 to 31 March 2017.
5. This is a measure of access to, and timeliness of the community support system that is in place for persons who have experienced an acute psychiatric episode requiring hospitalisation. The 2016-17 Estimated Actual is for the period 1 July 2016 to 31 January 2017. Queensland has made significant progress in improving the rate of community follow up over the past five years. Increased pressure on community and inpatient mental health services has seen increases in readmission rates and is impacting the rate of follow up.
6. This is a measure of effectiveness that shows the percentage of patients who are waiting to have their first appointment (from the time of referral) with the health professional in an outpatient clinic, within the clinically recommended time. The 2016-17 Estimated Actual figure is based on patients waiting as at 30 April 2017.
7. This is a measure of effectiveness that indicates the percentage of patients seen within clinically recommended times during the reporting period. The 2016-17 Estimated Actual figures are based on actual performance from 1 July 2016 to 30 April 2017.
8. This measure indicates the amount of time for which half of all people waited in the emergency department (for all categories), from the time of presentation to being seen by a nurse or doctor (whichever was first). The 2016-17 Estimated Actual figure is based on actual performance from 1 July 2016 to 30 April 2017.
9. This is a measure of effectiveness that reports on the number of days for which half of all patients wait before undergoing elective surgery. The 2016-17 Estimated Actual figure is based on actual performance from 1 July 2016 to 30 April 2017. There is no national benchmark target for this measure in Categories 1, 2 and 3.
10. A WAU is a measure of activity and provides a common unit of comparison so that all activity can be measured consistently. Service agreements between the Department of Health and HHSs and other organisations specify the activity to be provided in WAUs by service type. Refer to Box 1, page 12.
11. The 2016-17 Estimated Actual figure reflects 1 July to 31 December 2016 activity based costs and actual activity based funded activity. The 2017-18 Target/Estimate reflects the activity based funding less Clinical Education and Training and Specified Grants and activity within the finance and activity schedules of the 2017-18 Final Round Service Agreements Contract Offers. 2017-18 Target/Estimate for cost per Queensland WAU includes HHS activity forecast overdelivery in 2016-17, funded by the Commonwealth at a marginal rate of 45 per cent. As a result, funding per Queensland WAU in 2017-18 is generally lower than the 2016-17 Target/Estimate cost per Queensland WAU. The impact of this is partially offset in some HHSs due to changes in Own Source Revenue classification between 2016-17 and 2017-18, and non-Queensland WAU investments. 2016-17 Estimated Actual cost per Queensland WAU is a point in time measure which includes the first 6 months of HHS expenditure and activity. It includes the impact of one-off investments in 2016-17.
12. This is a measure of activity. The 2016-17 Estimated Actual figures are based on 10 months of actual performance from 1 July 2016 to 30 April 2017. The 2017-18 Target/Estimate is based on achieving 98 per cent category 1, 95 per cent category 2 and 95 per cent category 3 patients seen within clinically recommended time for elective surgery.
13. This measure tracks the growth in occasions of service for Telehealth enabled outpatient services. These services support timely access to contemporary specialist services for patients from regional, rural and remote communities, supporting the reduction in wait times and costs associated with patient travel. The 2016-17 Estimated Actual figure is based on actual performance from 1 July 2016 to 30 April 2017 forecast out over 12 months.
14. The 2016-17 Estimated Actual figures are based on 2016-17 Queensland WAU forecasts as provided by HHSs. 2017-18 Target/Estimate figures are based on the 2017-18 Final Round Service Agreements Contract Offers. All activity is reported in the same phase - Activity Based Funding (ABF) model Q19. ‘Total WAUs – Interventions and procedures’ has been reallocated to ‘Total WAUs – Acute Inpatient Care’ and ‘Total WAUs – Outpatient Care’ service standards.
15. This measure counts the number of in-scope service contact hours attributable to each HHS, based on the national definition and calculation of service contacts and duration. The Estimated Actuals for 2016-17 are for the period 1 July 2016 to 31 March 2017. It is important to note that not all activity of ambulatory clinicians is in-scope for this measure, with most review and some service coordination activities excluded. In addition, improvements in data quality have contributed to the result, with the data more accurately reflecting way in which services are delivered. The Target/Estimate for this measure is determined using a standard formula based upon available clinical staffing, HHS rurality, and historical performance. The targets for these measures have been set to be consistently calculated and are considered a stretch for many services.
2017-18 Queensland State Budget - Service Delivery Statements - Children's Health Queensland Hospital and Health Service
97
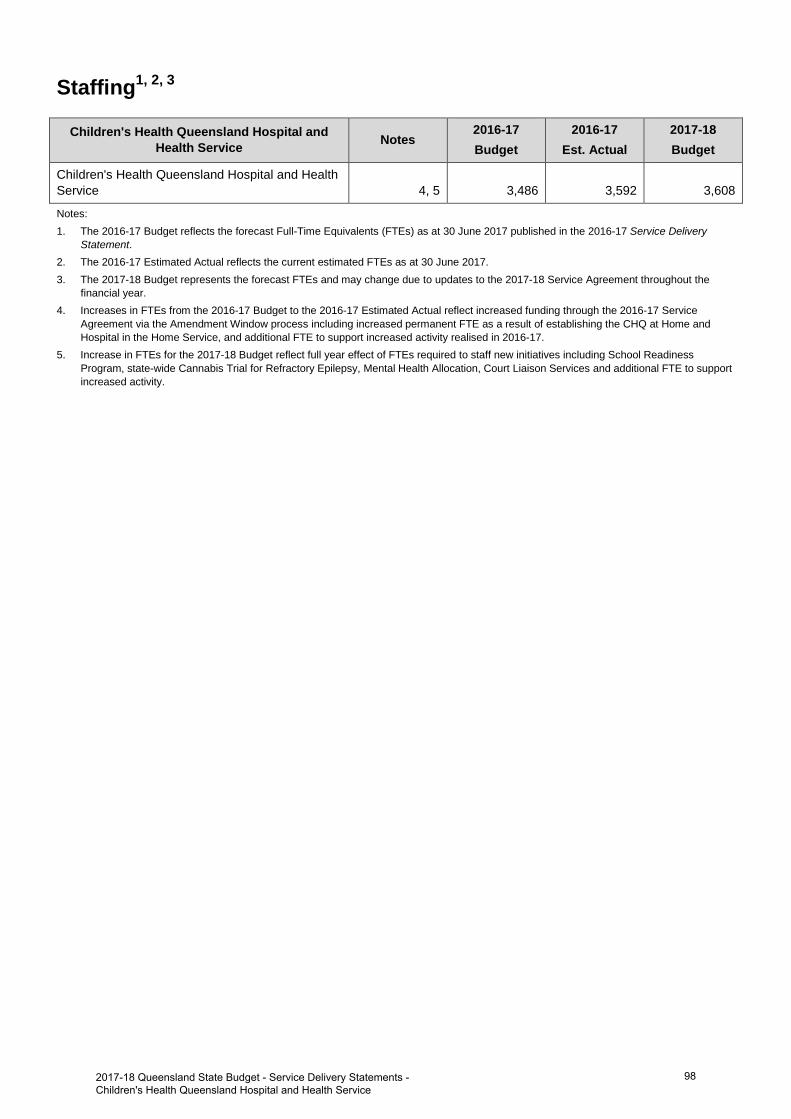
Staffing1, 2, 3
Children's Health Queensland Hospital and Health Service Notes
2016-17 Budget
2016-17 Est. Actual
2017-18 Budget
Children's Health Queensland Hospital and Health Service 4, 5 3,486 3,592 3,608
Notes: 1. The 2016-17 Budget reflects the forecast Full-Time Equivalents (FTEs) as at 30 June 2017 published in the 2016-17 Service Delivery
Statement. 2. The 2016-17 Estimated Actual reflects the current estimated FTEs as at 30 June 2017.3. The 2017-18 Budget represents the forecast FTEs and may change due to updates to the 2017-18 Service Agreement throughout the
financial year.4. Increases in FTEs from the 2016-17 Budget to the 2016-17 Estimated Actual reflect increased funding through the 2016-17 Service
Agreement via the Amendment Window process including increased permanent FTE as a result of establishing the CHQ at Home andHospital in the Home Service, and additional FTE to support increased activity realised in 2016-17.
5. Increase in FTEs for the 2017-18 Budget reflect full year effect of FTEs required to staff new initiatives including School ReadinessProgram, state-wide Cannabis Trial for Refractory Epilepsy, Mental Health Allocation, Court Liaison Services and additional FTE to support increased activity.
982017-18 Queensland State Budget - Service Delivery Statements -Children's Health Queensland Hospital and Health Service
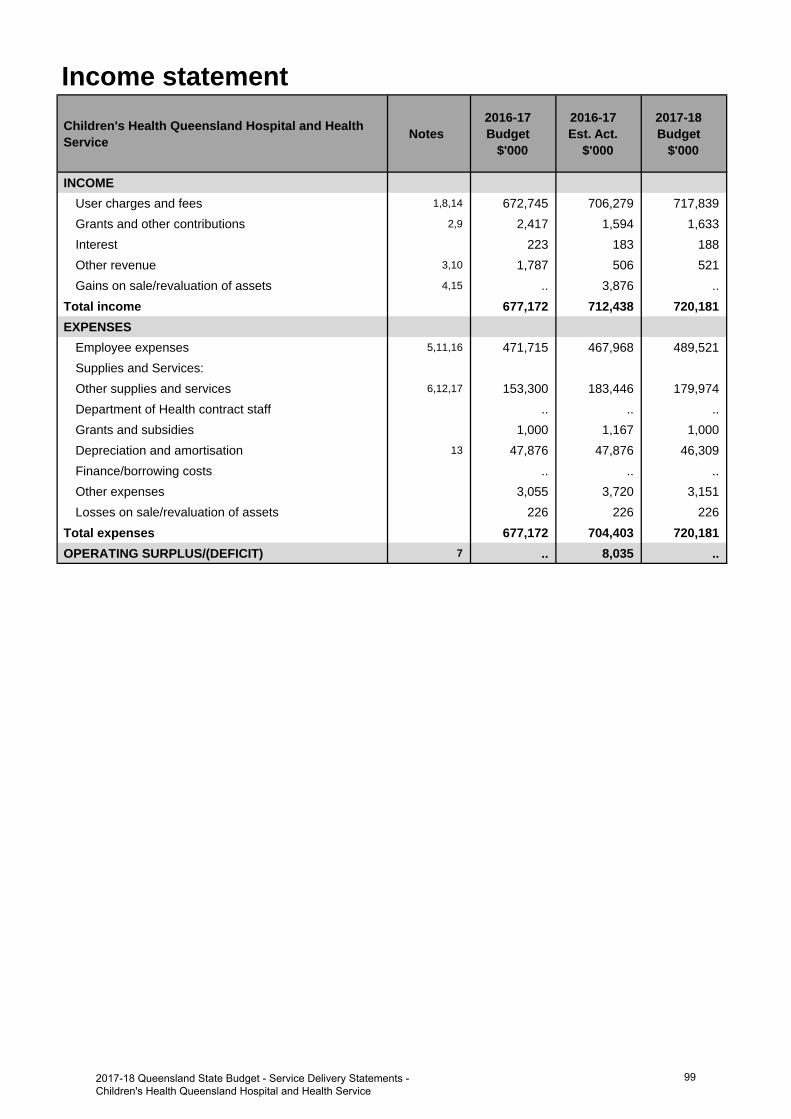
Income statementChildren's Health Queensland Hospital and Health Service Notes
2016-17 Budget
$'000
2016-17 Est. Act.
$'000
2017-18 Budget
$'000
INCOMEUser charges and fees 1,8,14 672,745 706,279 717,839 Grants and other contributions 2,9 2,417 1,594 1,633 Interest 223 183 188 Other revenue 3,10 1,787 506 521 Gains on sale/revaluation of assets 4,15 .. 3,876 ..
Total income 677,172 712,438 720,181 EXPENSES
Employee expenses 5,11,16 471,715 467,968 489,521 Supplies and Services:Other supplies and services 6,12,17 153,300 183,446 179,974 Department of Health contract staff .. .. .. Grants and subsidies 1,000 1,167 1,000 Depreciation and amortisation 13 47,876 47,876 46,309 Finance/borrowing costs .. .. .. Other expenses 3,055 3,720 3,151 Losses on sale/revaluation of assets 226 226 226
Total expenses 677,172 704,403 720,181 OPERATING SURPLUS/(DEFICIT) 7 .. 8,035 ..
992017-18 Queensland State Budget - Service Delivery Statements - Children's Health Queensland Hospital and Health Service
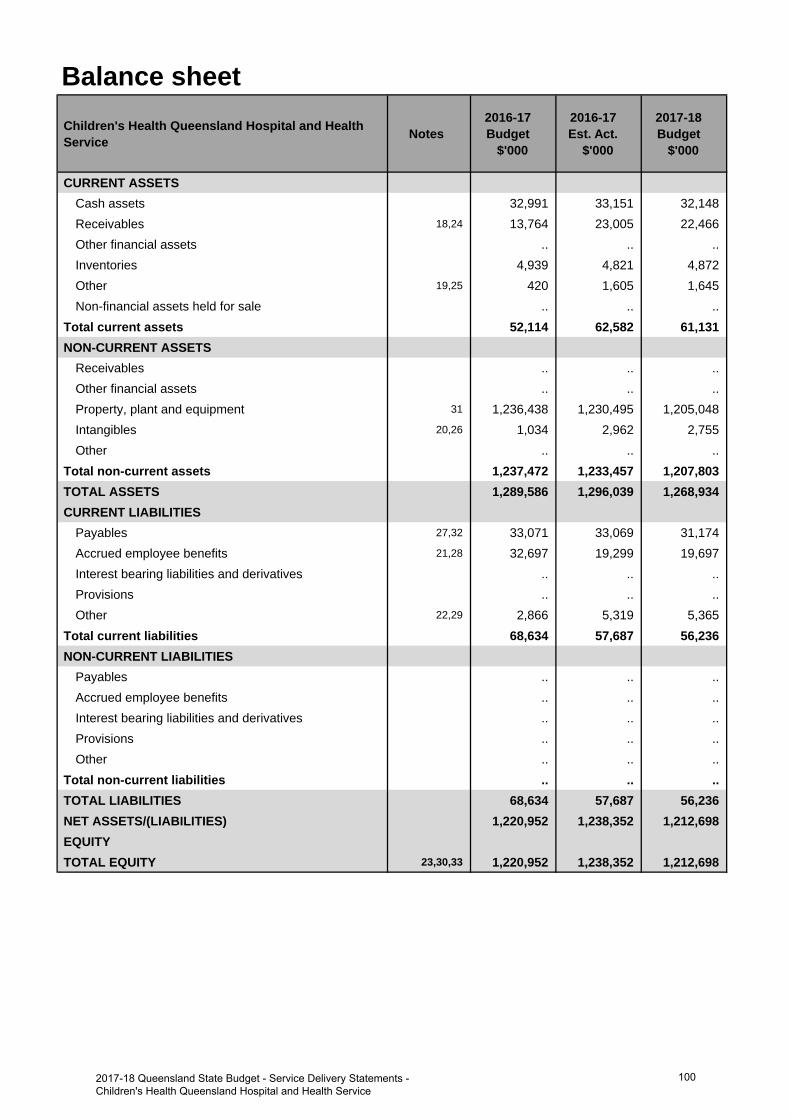
Balance sheetChildren's Health Queensland Hospital and Health Service Notes
2016-17 Budget
$'000
2016-17 Est. Act.
$'000
2017-18 Budget
$'000
CURRENT ASSETSCash assets 32,991 33,151 32,148 Receivables 18,24 13,764 23,005 22,466 Other financial assets .. .. .. Inventories 4,939 4,821 4,872 Other 19,25 420 1,605 1,645 Non-financial assets held for sale .. .. ..
Total current assets 52,114 62,582 61,131 NON-CURRENT ASSETS
Receivables .. .. .. Other financial assets .. .. .. Property, plant and equipment 31 1,236,438 1,230,495 1,205,048 Intangibles 20,26 1,034 2,962 2,755 Other .. .. ..
Total non-current assets 1,237,472 1,233,457 1,207,803 TOTAL ASSETS 1,289,586 1,296,039 1,268,934 CURRENT LIABILITIES
Payables 27,32 33,071 33,069 31,174 Accrued employee benefits 21,28 32,697 19,299 19,697 Interest bearing liabilities and derivatives .. .. .. Provisions .. .. .. Other 22,29 2,866 5,319 5,365
Total current liabilities 68,634 57,687 56,236 NON-CURRENT LIABILITIES
Payables .. .. .. Accrued employee benefits .. .. .. Interest bearing liabilities and derivatives .. .. .. Provisions .. .. .. Other .. .. ..
Total non-current liabilities .. .. .. TOTAL LIABILITIES 68,634 57,687 56,236 NET ASSETS/(LIABILITIES) 1,220,952 1,238,352 1,212,698 EQUITYTOTAL EQUITY 23,30,33 1,220,952 1,238,352 1,212,698
1002017-18 Queensland State Budget - Service Delivery Statements - Children's Health Queensland Hospital and Health Service
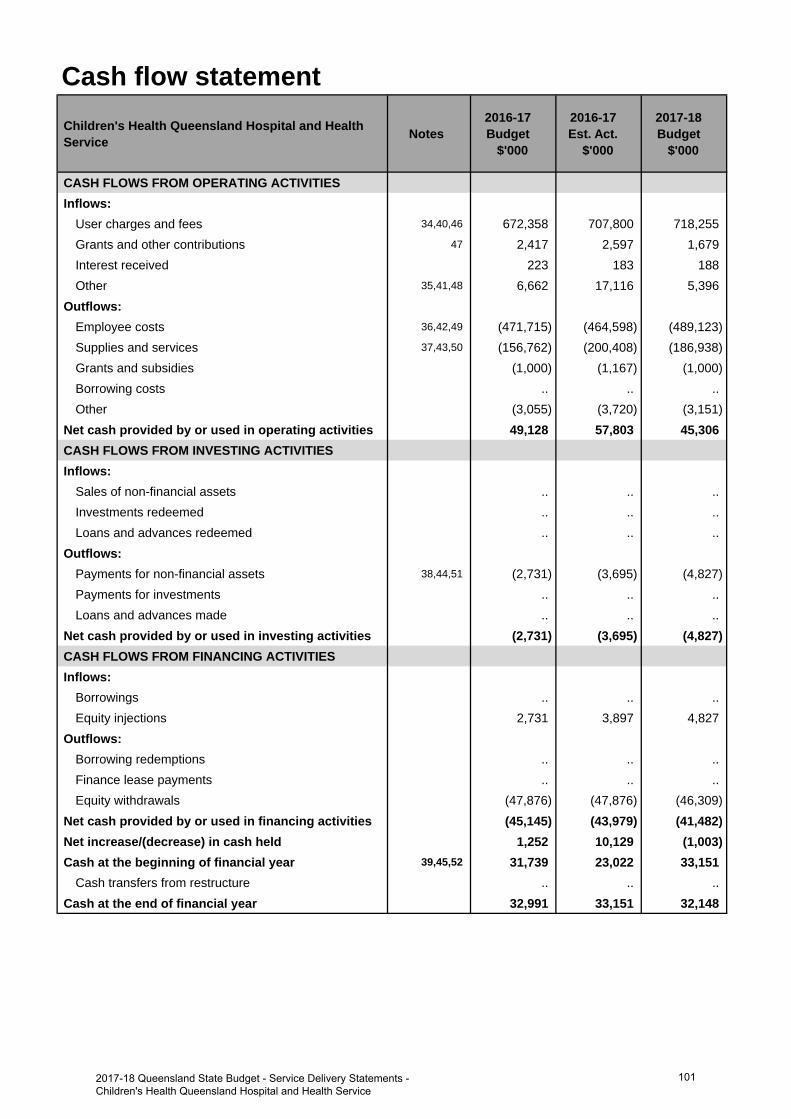
Cash flow statementChildren's Health Queensland Hospital and Health Service Notes
2016-17 Budget
$'000
2016-17 Est. Act.
$'000
2017-18 Budget
$'000
CASH FLOWS FROM OPERATING ACTIVITIESInflows:
User charges and fees 34,40,46 672,358 707,800 718,255 Grants and other contributions 47 2,417 2,597 1,679 Interest received 223 183 188 Other 35,41,48 6,662 17,116 5,396
Outflows:Employee costs 36,42,49 (471,715) (464,598) (489,123)Supplies and services 37,43,50 (156,762) (200,408) (186,938)Grants and subsidies (1,000) (1,167) (1,000)Borrowing costs .. .. .. Other (3,055) (3,720) (3,151)
Net cash provided by or used in operating activities 49,128 57,803 45,306 CASH FLOWS FROM INVESTING ACTIVITIESInflows:
Sales of non-financial assets .. .. .. Investments redeemed .. .. .. Loans and advances redeemed .. .. ..
Outflows:Payments for non-financial assets 38,44,51 (2,731) (3,695) (4,827)Payments for investments .. .. .. Loans and advances made .. .. ..
Net cash provided by or used in investing activities (2,731) (3,695) (4,827)CASH FLOWS FROM FINANCING ACTIVITIESInflows:
Borrowings .. .. .. Equity injections 2,731 3,897 4,827
Outflows:Borrowing redemptions .. .. .. Finance lease payments .. .. .. Equity withdrawals (47,876) (47,876) (46,309)
Net cash provided by or used in financing activities (45,145) (43,979) (41,482)Net increase/(decrease) in cash held 1,252 10,129 (1,003)Cash at the beginning of financial year 39,45,52 31,739 23,022 33,151
Cash transfers from restructure .. .. .. Cash at the end of financial year 32,991 33,151 32,148
1012017-18 Queensland State Budget - Service Delivery Statements - Children's Health Queensland Hospital and Health Service
Income statementMajor variations between 2016-17 Budget and 2016-17 Estimated Actual include:
1. The increase relates to additional funding provided through amendments to the Service Agreement betweenChildren's Health Queensland Hospital and Health Service and the department. This additional funding was a partyear effect of Commonwealth incentive funding for higher patient activity, funded enterprise bargainingagreement, and new specific block funded initiatives.
2. The decrease relates to the reclassification of community based program funding into User charges and fees.
3. The decrease relates to a recovery of outgoings previously recognised as revenue, now treated as an offset toexpenditure.
4. The increase relates to the estimated revaluation of Children's Health Queensland buildings in 2016-17.
5. The decrease in Employee expenses is mainly due to increased Supplies and services for contracted services to deliver Strategic information and communication technology (ICT) projects. This is partially offset by enterprise bargaining agreement increments, increases in staffing levels to meet higher activity within Lady Cilento Children's Hospital, and staff associated with new initiatives that commenced in 2016-17.
6. The increase relates to greater clinical supply costs due to higher activity performed at Lady Cilento Children's Hospital, maintenance costs for Children's Health Queensland buildings, and contracted services to implement Strategic (ICT) projects.
7. The operating surplus increase mainly relates to efficient service delivery models applied by the Lady Cilento Children's Hospital through National Weighted Activity Unit (NWAU) over-performance in 2016-17 arising from higher patient activity at reduced costs, and includes the revaluation of Children's Health Queensland buildings.
Major variations between 2016-17 Budget and 2017-18 Budget include:
8. The increase relates to additional funding provided in the 2017-18 Service Agreement between Children's HealthQueensland Hospital and Health Service and the department. This additional funding includes the full year ofincreases in service activity, enterprise bargaining agreement and specific block funded initiatives.
9. The decrease relates to the reclassification of community based program funding into User charges and fees.
10. The decrease relates to a recovery of outgoings previously recognised as revenue, now treated as an offset toexpenditure.
11. The increase relates to enterprise bargaining agreement increments and increases in staffing levels to meethigher activity within Lady Cilento Children's Hospital including increases in clinical staff to support the growth inbeds and new staff associated with new and enhanced initiatives and programs.
12. The increase relates to clinical supply costs associated with the full year effect of the higher activity within LadyCilento Children's Hospital in line with the funding for growth in beds and full year effect of maintenance andmanagement costs for Children's Health Queensland buildings.
13. The movement relates to asset additions and disposals for the Children's Health Queensland buildings andassociated equipment. The 2016-17 budget was based on Department's best estimates for the Children's HealthQueensland buildings and associated equipment at the time.
Major variations between 2016-17 Estimated Actual and the 2017-18 Budget include:
14. The increase relates to additional funding provided in the 2017-18 Service Agreement between Children's HealthQueensland Hospital and Health Service and the department. This additional funding includes the full year ofincreases in service activity, enterprise bargaining agreement and specific block funded initiatives.
15. The decrease relates to the estimated revaluation of the Lady Cilento Children's Hospital buildings from 2016-17.
16. The increase relates to enterprise bargaining agreement increments, greater staffing levels to meet higher activitywithin Lady Cilento Children's Hospital, including clinical staff to support the growth in beds, and staff associatedwith new and enhanced initiatives and programs including the Hospital in the Home services.
17. The decrease relates to changes from Supplies and services to Employee expenses for the Hospital in the Home services transitioning from external service provision to internal staff, and an estimated reduction in contracted services for the implementation of Strategic ICT projects.
Explanation of variances in the financial statements
1022017-18 Queensland State Budget - Service Delivery Statements - Children's Health Queensland Hospital and Health Service
Balance sheetMajor variations between 2016-17 Budget and 2016-17 Estimated Actual include:
18. The increase in operating receivables is mainly due to the higher actual 2016-17 opening balance.
19. The increase is due to a higher balance for prepayments at the end of the financial year.
20. The increase in intangibles is due to the additional investment in information and communication technology (ICT) programs to support Lady Cilento Children's Hospital services.
21. The decrease to employee benefits is due to a reclassification of liabilities to the Payables category.
22. The increase in Other current liabilities relates to expected increases in unearned revenue for community basedprograms, originally budgeted for completion in 2016-17.
23. The increase in Total Equity relates predominantly to the 2016-17 financial year actual surplus and higher actual2016-17 opening balance.
Major variations between 2016-17 Budget and 2017-18 Budget include:
24. The increase in operating receivables is mainly due to the higher actual 2016-17 opening balance.
25. The increase is due to a higher balance for prepayments at the end of the financial year.
26. The increase in intangibles is due to the additional investment in ICT programs to support Lady Cilento Children'sHospital services.
27. The decrease in Payables mainly relates to a lower estimated end of year position.
28. The decrease to Accrued employee benefits is due to a reclassification of liabilities to the Payables category.
29. The increase in Other current liabilities relates to expected increases in unearned revenue for community basedprograms, originally budgeted for completion in 2016-17.
30. The decrease in the value of Total Equity reflects the impact of depreciation for the period on Children's HealthQueensland Hospital and Health Service existing asset values, partially offset by new acquisitions and upgrades.
Major variations between 2016-17 Estimated Actual and the 2017-18 Budget include:
31. The decrease relates to accumulated depreciation of Children's Health Queensland Hospital and Health Serviceequipment and buildings.
32. The decrease in Payables mainly relates to a lower estimated end of year position.
33. The decrease in the value of Total Equity reflects the impact of depreciation for the period on the Children'sHealth Queensland Hospital and Health Service existing asset values, partially offset by new acquisitions andupgrades.
Cash flow statementMajor variations between 2016-17 Budget and 2016-17 Estimated Actual include:
34. The increase relates to additional funding provided through amendments to the Service Agreement betweenChildren's Health Queensland Hospital and Health Service and the department. This additional funding was a partyear effect of Commonwealth incentive funding for higher patient activity, funded enterprise bargainingagreement, and new specific block funded initiatives.
35. The increase in Other inflows mainly due to the recovery of employee benefits from the Mater Health Services.
36. The decrease in Employee cost outflows is mainly due to an increase for Supplies and services, provided byexternal service providers. This is offset by the increase in enterprise bargaining agreement and increases instaffing levels to meet higher activity within Lady Cilento Children's Hospital and new staff associated with newinitiatives that commenced in 2016-17.
37. The increase relates to clinical supply costs due to higher activity performed at Lady Cilento Children's Hospital, maintenance costs for Children's Health Queensland buildings, contracted services to implement Strategic ICT projects, and payment of Mater Health Service employee benefits to the department.
38. The increase in non-financial assets is due to the additional investment in ICT programs to support Lady CilentoChildren's Hospital services.
39. The decrease in cash relates predominantly to the decrease in the estimated end of year Total current liabilities.
1032017-18 Queensland State Budget - Service Delivery Statements - Children's Health Queensland Hospital and Health Service
Major variations between 2016-17 Budget and 2017-18 Budget include:
40. The increase relates to additional funding provided in the 2017-18 Service Agreement between Children's Health Queensland Hospital and Health Service and the department. This additional funding includes the full year of increases in service activity, enterprise bargaining agreement and specific block funded initiatives.
41. The decrease relates to the estimated balance for receivables as at the end of the financial year.
42. The increase relates to enterprise bargaining agreement increments and increases in staffing levels to meet higher activity within Lady Cilento Children's Hospital including increases in clinical staff to support the growth in beds, and new staff associated with new and enhanced initiatives and programs.
43. The increase in Supplies and services relates to clinical supply costs associated with the full year effect of higher activity within Lady Cilento Children's Hospital in line with funding for growth in beds, and maintenance costs for Children's Health Queensland buildings.
44. The increase in non-financial assets is due to the additional investment in ICT programs and the increased expenditure in the HTER program to support Lady Cilento Children's Hospital.
45. The increase in cash relates predominantly to the actual 2016-17 financial year actual surplus, offset by the increased estimated end of year receivables.
Major variations between 2016-17 Estimated Actual and the 2017-18 Budget include:
46. The increase relates to additional funding provided in the 2017-18 Service Agreement between Children's Health Queensland Hospital and Health Service and the department. This additional funding includes the full year of increases in service activity, enterprise bargaining agreement and specific block funded initiatives.
47. The decrease relates to the lower estimated unearned revenue balance of community based program funding.
48. The decrease to Other Inflows is mainly due to the Estimated Actual 2016-17 recovery of employee benefits from the Mater Health Services.
49. The increase relates to enterprise bargaining agreement increments and increases in staffing levels to meet higher activity within Lady Cilento Children's Hospital including increases in clinical staff to support growth in beds, and new staff associated with new and enhanced initiatives and programs.
50. The decrease in Supplies and services is mainly related to the Estimated Actual 2016-17 payment of Mater Health Service employee benefits to the department.
51. The increase in non-financial assets is due to the additional investment in ICT programs and the increased expenditure in the HTER program to support Lady Cilento Children's Hospital.
52. The increase in cash relates predominantly to the actual 2016-17 financial year actual surplus, offset by the increased estimated end of year receivables.
1042017-18 Queensland State Budget - Service Delivery Statements - Children's Health Queensland Hospital and Health Service
Darling Downs Hospital and Health Service
Overview The Darling Downs Hospital and Health Service (HHS) is an independent statutory body overseen by a local Hospital and Health Board, which provides a comprehensive range of public hospital and healthcare services to nearly 300,000 people across a large and diverse geographic area of approximately 90,000 square kilometres. This service-delivery area includes the local government areas of Toowoomba Regional Council, Western Downs Regional Council, Southern Downs Regional Council, South Burnett Regional Council, Goondiwindi Regional Council, Cherbourg Aboriginal Shire Council and part of the Banana Shire Council (community of Taroom).
The Darling Downs HHS delivers these services from 29 facilities, which includes one large regional referral hospital, three medium sized regional hub hospitals, twelve rural hospitals, three multipurpose health services, three community outpatient clinics, six residential aged care facilities and an extended inpatient mental health service.
With a vision of ‘caring for our communities – healthier together’ the Darling Downs HHS is focused on delivering patient-centred care and services and leading the integration of care across our region to support our communities to be healthier.
The Darling Downs HHS strategic priorities align with and support the Queensland Government’s priorities and objectives for the community in delivering quality frontline services, strengthening the public health system and building safe, caring and connected communities. The Darling Downs HHS has six strategic objectives to support our vision:
• deliver quality evidence-based healthcare for our patients and clients • engage, communicate and collaborate with our partners and communities to ensure we provide integrated, patient-
centred care • demonstrate a commitment to learning, research, innovation and education in rural and regional healthcare • ensure sustainable resources though attentive financial and asset administration • plan and maintain clear and focused processes to facilitate effective corporate and clinical governance • value, develop and engage our workforce to promote professional and personal wellbeing, and to ensure dedicated
delivery of services.
The Darling Downs HHS provides healthcare services in a growing and ageing community. Increasing levels of chronic disease, geographic distance, an ageing workforce, increasing service demand and ongoing fiscal sustainability, especially in our regional communities are among our greatest challenges. Despite these challenges, the Darling Downs HHS is: actively exploring and implementing innovative and integrated health service delivery models; proactively partnering and engaging with the Darling Downs West Moreton Primary Health Network (DDWM PHN), tertiary education sector and our communities to deliver solutions; and investing in training and developing the workforce for the future.
Service summary The Darling Downs HHS has an operating budget of $761.7 million for 2017-18 which is an increase of $87.2 million (12.9 per cent) from the published 2016-17 operating budget of $674.5 million.
During 2017-18, the Darling Downs HHS will continue to focus efforts to ensure that waiting lists for elective surgery, endoscopy, outpatients and dental continue to be kept within clinically recommended timeframes.
Other key deliverables or focus areas for 2017-18 include:
• improving our infrastructure by: − finalising construction of a seventh operating theatre at Toowoomba Hospital − upgrading the Emergency Department at Warwick Hospital to improve staff and patient flow and increase
treatment spaces from 13 to 21 − refurbishing the Toowoomba Hospital Renal Unit to increase access to renal services − building a new dental training clinic and collocated community health service at Kingaroy, delivered in
partnership with Griffith University and Queensland Rural Medical Education (QRME)
1052017-18 Queensland State Budget - Service Delivery Statements - Darling Downs Hospital and Health Service
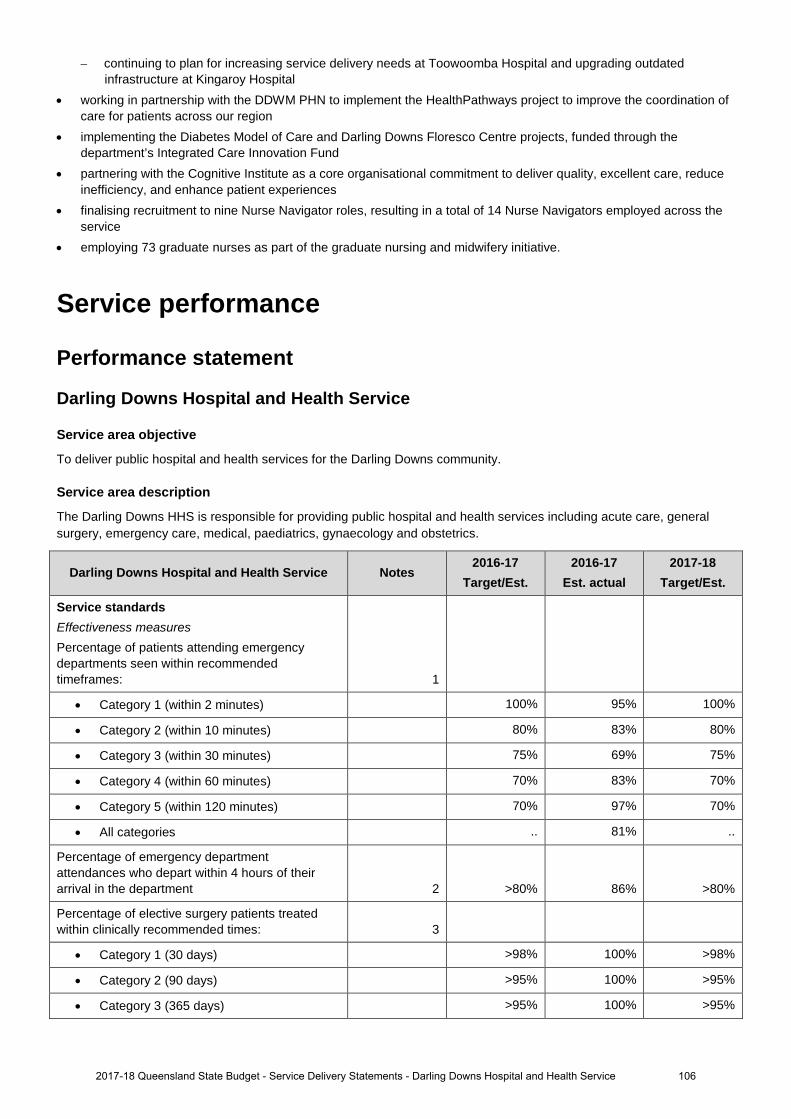
− continuing to plan for increasing service delivery needs at Toowoomba Hospital and upgrading outdated infrastructure at Kingaroy Hospital
• working in partnership with the DDWM PHN to implement the HealthPathways project to improve the coordination of care for patients across our region
• implementing the Diabetes Model of Care and Darling Downs Floresco Centre projects, funded through the department’s Integrated Care Innovation Fund
• partnering with the Cognitive Institute as a core organisational commitment to deliver quality, excellent care, reduce inefficiency, and enhance patient experiences
• finalising recruitment to nine Nurse Navigator roles, resulting in a total of 14 Nurse Navigators employed across the service
• employing 73 graduate nurses as part of the graduate nursing and midwifery initiative.
Service performance
Performance statement
Darling Downs Hospital and Health Service
Service area objective
To deliver public hospital and health services for the Darling Downs community.
Service area description
The Darling Downs HHS is responsible for providing public hospital and health services including acute care, general surgery, emergency care, medical, paediatrics, gynaecology and obstetrics.
Darling Downs Hospital and Health Service Notes 2016-17
Target/Est. 2016-17
Est. actual 2017-18
Target/Est.
Service standards Effectiveness measures Percentage of patients attending emergency departments seen within recommended timeframes: 1
• Category 1 (within 2 minutes) 100% 95% 100%
• Category 2 (within 10 minutes) 80% 83% 80%
• Category 3 (within 30 minutes) 75% 69% 75%
• Category 4 (within 60 minutes) 70% 83% 70%
• Category 5 (within 120 minutes) 70% 97% 70%
• All categories .. 81% ..
Percentage of emergency department attendances who depart within 4 hours of their arrival in the department 2 >80% 86% >80%
Percentage of elective surgery patients treated within clinically recommended times: 3
• Category 1 (30 days) >98% 100% >98%
• Category 2 (90 days) >95% 100% >95%
• Category 3 (365 days) >95% 100% >95%
1062017-18 Queensland State Budget - Service Delivery Statements - Darling Downs Hospital and Health Service
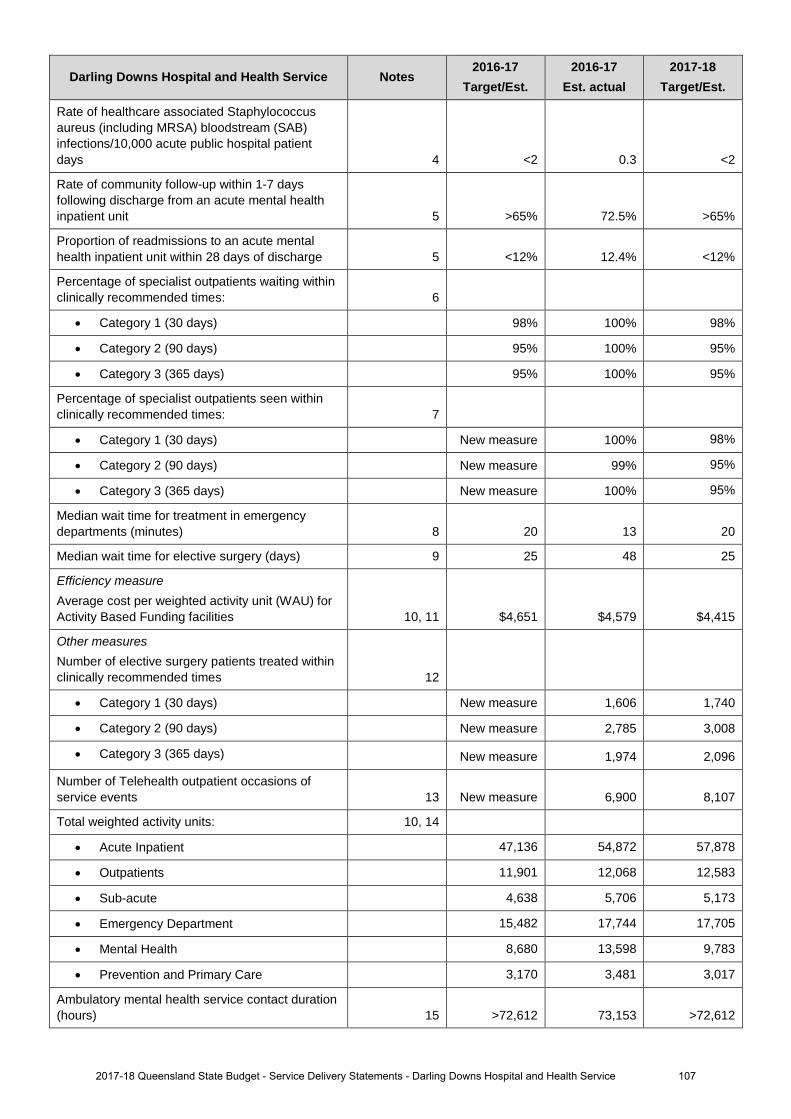
Darling Downs Hospital and Health Service Notes 2016-17
Target/Est. 2016-17
Est. actual 2017-18
Target/Est.
Rate of healthcare associated Staphylococcus aureus (including MRSA) bloodstream (SAB) infections/10,000 acute public hospital patient days 4 <2 0.3 <2
Rate of community follow-up within 1-7 days following discharge from an acute mental health inpatient unit 5 >65% 72.5% >65%
Proportion of readmissions to an acute mental health inpatient unit within 28 days of discharge 5 <12% 12.4% <12%
Percentage of specialist outpatients waiting within clinically recommended times: 6
• Category 1 (30 days) 98% 100% 98%
• Category 2 (90 days) 95% 100% 95%
• Category 3 (365 days) 95% 100% 95%
Percentage of specialist outpatients seen within clinically recommended times: 7
• Category 1 (30 days) New measure 100% 98%
• Category 2 (90 days) New measure 99% 95%
• Category 3 (365 days) New measure 100% 95%
Median wait time for treatment in emergency departments (minutes) 8 20 13 20
Median wait time for elective surgery (days) 9 25 48 25
Efficiency measure Average cost per weighted activity unit (WAU) for Activity Based Funding facilities 10, 11 $4,651 $4,579 $4,415
Other measures Number of elective surgery patients treated within clinically recommended times 12
• Category 1 (30 days) New measure 1,606 1,740
• Category 2 (90 days) New measure 2,785 3,008
• Category 3 (365 days) New measure 1,974 2,096
Number of Telehealth outpatient occasions of service events 13 New measure 6,900 8,107
Total weighted activity units: 10, 14
• Acute Inpatient 47,136 54,872 57,878
• Outpatients 11,901 12,068 12,583
• Sub-acute 4,638 5,706 5,173
• Emergency Department 15,482 17,744 17,705
• Mental Health 8,680 13,598 9,783
• Prevention and Primary Care 3,170 3,481 3,017
Ambulatory mental health service contact duration (hours) 15 >72,612 73,153 >72,612
1072017-18 Queensland State Budget - Service Delivery Statements - Darling Downs Hospital and Health Service
Notes: 1. The 2016-17 Estimated Actual figures are based on actual performance from 1 July 2016 to 30 April 2017. A Target/Estimate for
percentage of emergency department patients seen within recommended timeframes is not included in the ‘All Categories’ as there is no national benchmark. Queensland public hospital emergency departments face ongoing increases in demand, with an average 1.3 per cent annual increase in emergency department attendances, which has an effect on emergency department performance.
2. This is a measure of access and timeliness of emergency department services. The 2016-17 Estimated Actual figures are based on actual performance from 1 July 2016 to 30 April 2017.
3. This is a measure of effectiveness that shows how hospitals perform in providing elective surgery services within the recommended timeframe for each urgency category. The 2016-17 Estimated Actual figures are based on actual performance from 1 July 2016 to 30 April 2017.
4. This is a National Performance Agreement indicator and a measure of effectiveness of infection control programs and services in hospitals. Staphylococcus aureus are bacteria commonly found on around 30 per cent of people’s skin and noses and often cause no adverse effects. Infections with this organism can be serious, particularly so when they infect the bloodstream. The data reported for this service standard are for bloodstream infections with Staphylococcus aureus (including methicillin resistant Staphylococcus aureus) and are reported as a rate of infection per 10,000 patient days. The Target/Estimate for this measure aligns with the national benchmark of 2 cases per 10,000 acute public hospital patient days for each jurisdiction. The 2016-17 Estimated Actual figures are based on actual performance from 1 July 2016 to 31 March 2017.
5. This is a measure of access to, and timeliness of the community support system that is in place for persons who have experienced an acute psychiatric episode requiring hospitalisation. The 2016-17 Estimated Actual is for the period 1 July 2016 to 31 January 2017. Queensland has made significant progress in improving the rate of community follow up over the past five years. Increased pressure on community and inpatient mental health services has seen increases in readmission rates and is impacting the rate of follow up.
6. This is a measure of effectiveness that shows the percentage of patients who are waiting to have their first appointment (from the time of referral) with the health professional in an outpatient clinic, within the clinically recommended time. The 2016-17 Estimated Actual figure is based on patients waiting as at 30 April 2017.
7. This is a measure of effectiveness that indicates the percentage of patients seen within clinically recommended times during the reporting period. The 2016-17 Estimated Actual figures are based on actual performance from 1 July 2016 to 30 April 2017.
8. This measure indicates the amount of time for which half of all people waited in the emergency department (for all categories), from the time of presentation to being seen by a nurse or doctor (whichever was first). The 2016-17 Estimated Actual figure is based on actual performance from 1 July 2016 to 30 April 2017.
9. This is a measure of effectiveness that reports on the number of days for which half of all patients wait before undergoing elective surgery. The 2016-17 Estimated Actual figure is based on actual performance from 1 July 2016 to 30 April 2017.
10. A WAU is a measure of activity and provides a common unit of comparison so that all activity can be measured consistently. Service agreements between the Department of Health and HHSs and other organisations specify the activity to be provided in WAUs by service type. Refer to Box 1, page 12.
11. The 2016-17 Estimated Actual figure reflects 1 July to 31 December 2016 activity based costs and actual activity based funded activity. The 2017-18 Target/Estimate reflects the activity based funding less Clinical Education and Training and Specified Grants and activity within the finance and activity schedules of the 2017-18 Final Round Service Agreements Contract Offers. 2017-18 Target/Estimate for cost per Queensland WAU includes HHS activity forecast overdelivery in 2016-17, funded by the Commonwealth at a marginal rate of 45 per cent. As a result, funding per Queensland WAU in 2017-18 is generally lower than the 2016-17 Target/Estimate cost per Queensland WAU. The impact of this is partially offset in some HHSs due to changes in Own Source Revenue classification between 2016-17 and 2017-18, and non-Queensland WAU investments. 2016-17 Estimated Actual cost per Queensland WAU is a point in time measure which includes the first 6 months of HHS expenditure and activity. It includes the impact of one-off investments in 2016-17 Queensland WAU.
12. This is a measure of activity. The 2016-17 Estimated Actual figures are based on 10 months of actual performance from 1 July 2016 to 30 April 2017 forecast over 12 months.
13. This measure tracks the growth in occasions of service for Telehealth enabled outpatient services. These services support timely access to contemporary specialist services for patients from regional, rural and remote communities, supporting the reduction in wait times and costs associated with patient travel. The 2016-17 Estimated Actual figure is based on actual performance from 1 July 2016 to 20 April forecast over 12 months.
14. The 2016-17 Estimated Actual figures are based on 2016-17 Queensland WAU forecasts as provided by HHSs. 2017-18 Target/Estimate figures are based on the 2017-18 Final Round Service Agreements Contract Offers. All activity is reported in the same phase - Activity Based Funding (ABF) model Q19. ‘Total WAUs – Interventions and procedures’ has been reallocated to ‘Total WAUs – Acute Inpatient Care’ and ‘Total WAUs – Outpatient Care’ service standards. ‘Total WAUs – Prevention and Primary Care’ is comprised of BreastScreen and Dental WAUs. Total WAUS - Prevention and Primary Care’ is a new measure for the Service Delivery Statement, however, it has been included in the HHS Service Agreements since 2016-17. Purchased Queensland WAUs in 2017-18 for Prevention and Primary Care are lower due to one off investments in Oral Health in 2016-17 and NPA funding not yet allocated. 2016-17 Mental Health Estimated Actuals are higher than the 2017-18 Target/Estimate due to the discharge of long stay patients from Non-ABF mental health facilities. This Queensland WAU, whilst funded, has not been built into the 2017-18 Service Agreements as the pattern of patient discharges from these facilities varies considerably from year to year
15. This measure counts the number of in-scope service contact hours attributable to each HHS, based on the national definition and calculation of service contacts and duration. The Estimated Actuals for 2016-17 are for the period 1 July 2016 to 31 March 2017. It is important to note that not all activity of ambulatory clinicians is in-scope for this measure, with most review and some service coordination activities excluded. In addition, improvements in data quality have contributed to the result, with the data more accurately reflecting way in which services are delivered. The Target/Estimate for this measure is determined using a standard formula based upon available clinical staffing, HHS rurality, and historical performance. The targets for these measures have been set to be consistently calculated and are considered a stretch for many services.
1082017-18 Queensland State Budget - Service Delivery Statements - Darling Downs Hospital and Health Service
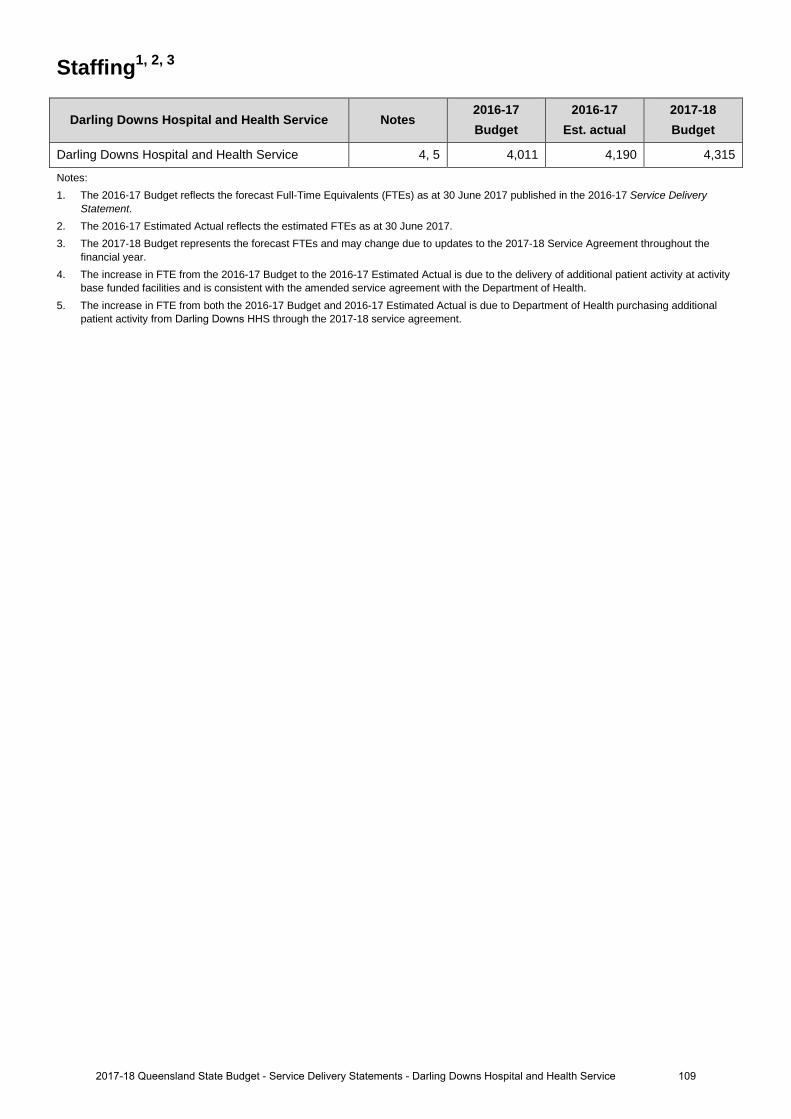
Staffing1, 2, 3
Darling Downs Hospital and Health Service Notes 2016-17 Budget
2016-17 Est. actual
2017-18 Budget
Darling Downs Hospital and Health Service 4, 5 4,011 4,190 4,315
Notes: 1. The 2016-17 Budget reflects the forecast Full-Time Equivalents (FTEs) as at 30 June 2017 published in the 2016-17 Service Delivery
Statement. 2. The 2016-17 Estimated Actual reflects the estimated FTEs as at 30 June 2017.3. The 2017-18 Budget represents the forecast FTEs and may change due to updates to the 2017-18 Service Agreement throughout the
financial year.4. The increase in FTE from the 2016-17 Budget to the 2016-17 Estimated Actual is due to the delivery of additional patient activity at activity
base funded facilities and is consistent with the amended service agreement with the Department of Health.5. The increase in FTE from both the 2016-17 Budget and 2016-17 Estimated Actual is due to Department of Health purchasing additional
patient activity from Darling Downs HHS through the 2017-18 service agreement.
1092017-18 Queensland State Budget - Service Delivery Statements - Darling Downs Hospital and Health Service

Income statement
Darling Downs Hospital and Health Service Notes 2016-17 Budget
$'000
2016-17 Est. Act.
$'000
2017-18 Budget
$'000
INCOMEUser charges and fees 1,5,9 642,584 682,755 730,026 Grants and other contributions 29,837 30,236 30,297 Interest 262 387 387 Other revenue 1,821 1,494 1,034 Gains on sale/revaluation of assets .. .. ..
Total income 674,504 714,872 761,744 EXPENSES
Employee expenses 2,6 54,421 61,986 65,676 Supplies and Services:Other supplies and services 3,7,10 172,948 196,787 211,256 Department of Health contract staff 4,8,11 419,919 428,840 455,385 Grants and subsidies 1,290 1,920 1,541 Depreciation and amortisation 23,117 23,117 24,557 Finance/borrowing costs .. .. .. Other expenses 1,123 1,256 811 Losses on sale/revaluation of assets 1,686 966 2,518
Total expenses 674,504 714,872 761,744 OPERATING SURPLUS/(DEFICIT) .. .. ..
1102017-18 Queensland State Budget - Service Delivery Statements - Darling Downs Hospital and Health Service

Balance sheet
Darling Downs Hospital and Health Service Notes 2016-17 Budget
$'000
2016-17 Est. Act.
$'000
2017-18 Budget
$'000
CURRENT ASSETSCash assets 12 75,944 72,000 74,054 Receivables 14,677 15,525 15,736 Other financial assets .. .. .. Inventories 5,564 6,537 6,700 Other 585 1,029 1,042 Non-financial assets held for sale .. .. ..
Total current assets 96,770 95,091 97,532 NON-CURRENT ASSETS
Receivables .. .. .. Other financial assets .. .. .. Property, plant and equipment 13,16 308,301 312,103 308,004 Intangibles .. .. .. Other 28 .. ..
Total non-current assets 308,329 312,103 308,004 TOTAL ASSETS 405,099 407,194 405,536 CURRENT LIABILITIES
Payables 14,15 38,009 41,275 43,815 Accrued employee benefits 1,508 2,570 2,471 Interest bearing liabilities and derivatives .. .. .. Provisions .. .. .. Other 155 .. ..
Total current liabilities 39,672 43,845 46,286 NON-CURRENT LIABILITIES
Payables .. .. .. Accrued employee benefits .. .. .. Interest bearing liabilities and derivatives .. .. .. Provisions .. .. .. Other .. .. ..
Total non-current liabilities .. .. .. TOTAL LIABILITIES 39,672 43,845 46,286 NET ASSETS/(LIABILITIES) 365,427 363,349 359,250 EQUITYTOTAL EQUITY 365,427 363,349 359,250
1112017-18 Queensland State Budget - Service Delivery Statements - Darling Downs Hospital and Health Service

Cash flow statement
Darling Downs Hospital and Health Service Notes 2016-17 Budget
$'000
2016-17 Est. Act.
$'000
2017-18 Budget
$'000
CASH FLOWS FROM OPERATING ACTIVITIESInflows:
User charges and fees 17,24,28 641,143 680,358 727,467 Grants and other contributions 29,837 30,211 30,297 Interest received 262 387 387 Other 18 9,290 12,094 11,034
Outflows:Employee costs 19,25,29 (54,315) (61,675) (65,775)Supplies and services 20,26,30 (599,544) (628,128) (674,303)Grants and subsidies (1,290) (1,937) (1,541)Borrowing costs .. .. .. Other (1,123) (1,256) (811)
Net cash provided by or used in operating activities 24,260 30,054 26,755 CASH FLOWS FROM INVESTING ACTIVITIESInflows:
Sales of non-financial assets .. (148) (144)Investments redeemed .. .. .. Loans and advances redeemed .. .. ..
Outflows:Payments for non-financial assets 21,27,31 (18,430) (29,443) (8,002)Payments for investments .. .. .. Loans and advances made .. 3 ..
Net cash provided by or used in investing activities (18,430) (29,588) (8,146)CASH FLOWS FROM FINANCING ACTIVITIESInflows:
Borrowings .. .. .. Equity injections 22,32 5,476 16,030 8,002
Outflows:Borrowing redemptions .. .. .. Finance lease payments .. .. .. Equity withdrawals (23,207) (23,207) (24,557)
Net cash provided by or used in financing activities (17,731) (7,177) (16,555)Net increase/(decrease) in cash held (11,901) (6,711) 2,054 Cash at the beginning of financial year 23 87,845 78,711 72,000
Cash transfers from restructure .. .. .. Cash at the end of financial year 75,944 72,000 74,054
1122017-18 Queensland State Budget - Service Delivery Statements - Darling Downs Hospital and Health Service
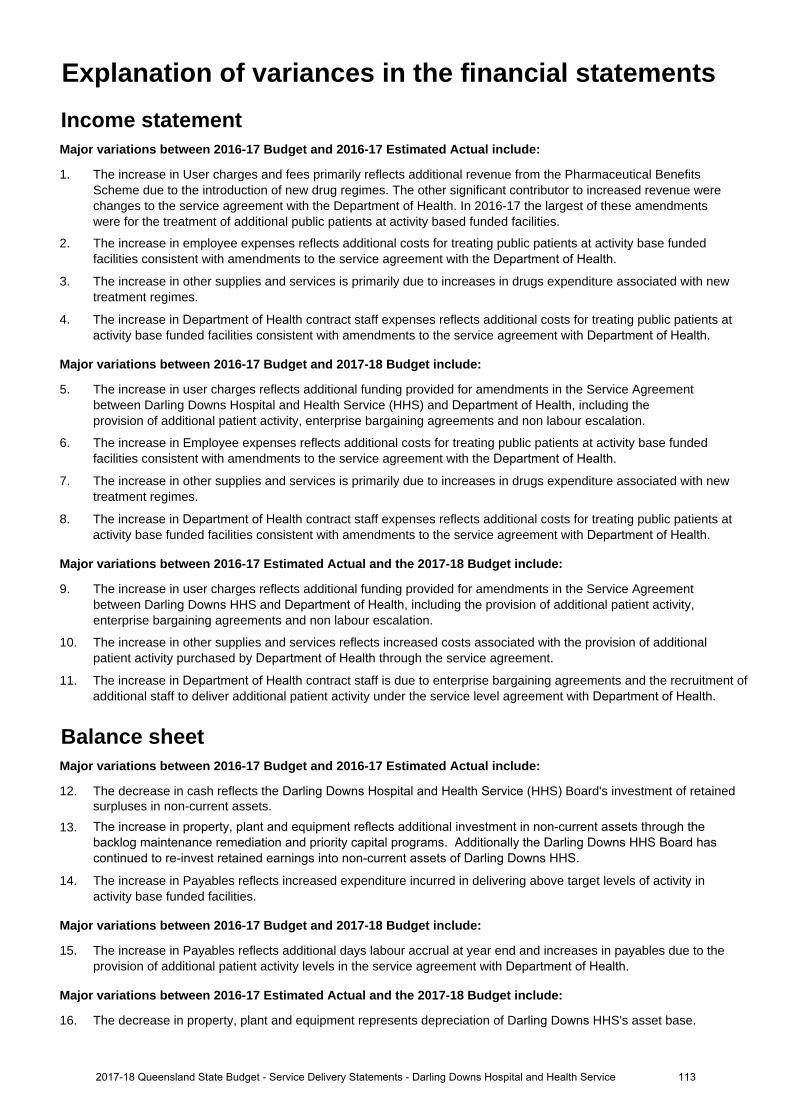
Income statementMajor variations between 2016-17 Budget and 2016-17 Estimated Actual include:
1. The increase in User charges and fees primarily reflects additional revenue from the Pharmaceutical BenefitsScheme due to the introduction of new drug regimes. The other significant contributor to increased revenue werechanges to the service agreement with the Department of Health. In 2016-17 the largest of these amendmentswere for the treatment of additional public patients at activity based funded facilities.
2. The increase in employee expenses reflects additional costs for treating public patients at activity base fundedfacilities consistent with amendments to the service agreement with the Department of Health.
3. The increase in other supplies and services is primarily due to increases in drugs expenditure associated with newtreatment regimes.
4. The increase in Department of Health contract staff expenses reflects additional costs for treating public patients atactivity base funded facilities consistent with amendments to the service agreement with Department of Health.
Major variations between 2016-17 Budget and 2017-18 Budget include:
5. The increase in user charges reflects additional funding provided for amendments in the Service Agreementbetween Darling Downs Hospital and Health Service (HHS) and Department of Health, including theprovision of additional patient activity, enterprise bargaining agreements and non labour escalation.
6. The increase in Employee expenses reflects additional costs for treating public patients at activity base fundedfacilities consistent with amendments to the service agreement with the Department of Health.
7. The increase in other supplies and services is primarily due to increases in drugs expenditure associated with newtreatment regimes.
8. The increase in Department of Health contract staff expenses reflects additional costs for treating public patients atactivity base funded facilities consistent with amendments to the service agreement with Department of Health.
Major variations between 2016-17 Estimated Actual and the 2017-18 Budget include:
9. The increase in user charges reflects additional funding provided for amendments in the Service Agreementbetween Darling Downs HHS and Department of Health, including the provision of additional patient activity,enterprise bargaining agreements and non labour escalation.
10. The increase in other supplies and services reflects increased costs associated with the provision of additionalpatient activity purchased by Department of Health through the service agreement.
11. The increase in Department of Health contract staff is due to enterprise bargaining agreements and the recruitment ofadditional staff to deliver additional patient activity under the service level agreement with Department of Health.
Balance sheetMajor variations between 2016-17 Budget and 2016-17 Estimated Actual include:
12. The decrease in cash reflects the Darling Downs Hospital and Health Service (HHS) Board's investment of retainedsurpluses in non-current assets.
13. The increase in property, plant and equipment reflects additional investment in non-current assets through thebacklog maintenance remediation and priority capital programs. Additionally the Darling Downs HHS Board hascontinued to re-invest retained earnings into non-current assets of Darling Downs HHS.
14. The increase in Payables reflects increased expenditure incurred in delivering above target levels of activity inactivity base funded facilities.
Major variations between 2016-17 Budget and 2017-18 Budget include:
15. The increase in Payables reflects additional days labour accrual at year end and increases in payables due to theprovision of additional patient activity levels in the service agreement with Department of Health.
Major variations between 2016-17 Estimated Actual and the 2017-18 Budget include:
16. The decrease in property, plant and equipment represents depreciation of Darling Downs HHS's asset base.
Explanation of variances in the financial statements
1132017-18 Queensland State Budget - Service Delivery Statements - Darling Downs Hospital and Health Service
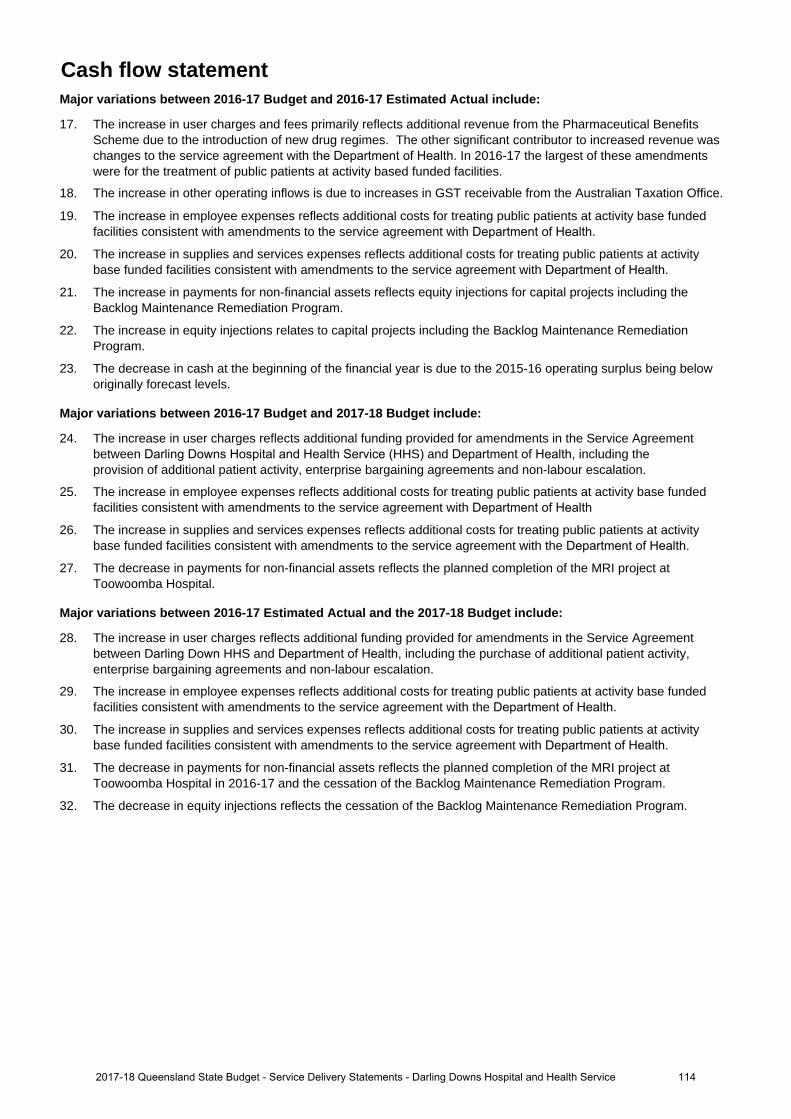
Cash flow statementMajor variations between 2016-17 Budget and 2016-17 Estimated Actual include:
17. The increase in user charges and fees primarily reflects additional revenue from the Pharmaceutical BenefitsScheme due to the introduction of new drug regimes. The other significant contributor to increased revenue waschanges to the service agreement with the Department of Health. In 2016-17 the largest of these amendmentswere for the treatment of public patients at activity based funded facilities.
18. The increase in other operating inflows is due to increases in GST receivable from the Australian Taxation Office.
19. The increase in employee expenses reflects additional costs for treating public patients at activity base fundedfacilities consistent with amendments to the service agreement with Department of Health.
20. The increase in supplies and services expenses reflects additional costs for treating public patients at activitybase funded facilities consistent with amendments to the service agreement with Department of Health.
21. The increase in payments for non-financial assets reflects equity injections for capital projects including theBacklog Maintenance Remediation Program.
22. The increase in equity injections relates to capital projects including the Backlog Maintenance RemediationProgram.
23. The decrease in cash at the beginning of the financial year is due to the 2015-16 operating surplus being beloworiginally forecast levels.
Major variations between 2016-17 Budget and 2017-18 Budget include:
24. The increase in user charges reflects additional funding provided for amendments in the Service Agreementbetween Darling Downs Hospital and Health Service (HHS) and Department of Health, including theprovision of additional patient activity, enterprise bargaining agreements and non-labour escalation.
25. The increase in employee expenses reflects additional costs for treating public patients at activity base fundedfacilities consistent with amendments to the service agreement with Department of Health
26. The increase in supplies and services expenses reflects additional costs for treating public patients at activitybase funded facilities consistent with amendments to the service agreement with the Department of Health.
27. The decrease in payments for non-financial assets reflects the planned completion of the MRI project atToowoomba Hospital.
Major variations between 2016-17 Estimated Actual and the 2017-18 Budget include:
28. The increase in user charges reflects additional funding provided for amendments in the Service Agreementbetween Darling Down HHS and Department of Health, including the purchase of additional patient activity,enterprise bargaining agreements and non-labour escalation.
29. The increase in employee expenses reflects additional costs for treating public patients at activity base fundedfacilities consistent with amendments to the service agreement with the Department of Health.
30. The increase in supplies and services expenses reflects additional costs for treating public patients at activitybase funded facilities consistent with amendments to the service agreement with Department of Health.
31. The decrease in payments for non-financial assets reflects the planned completion of the MRI project atToowoomba Hospital in 2016-17 and the cessation of the Backlog Maintenance Remediation Program.
32. The decrease in equity injections reflects the cessation of the Backlog Maintenance Remediation Program.
1142017-18 Queensland State Budget - Service Delivery Statements - Darling Downs Hospital and Health Service
Gold Coast Hospital and Health Service
Overview The Gold Coast Hospital and Health Service (HHS) is an independent statutory body overseen by a local Hospital and Health Board. The Gold Coast HHS delivers a broad range of secondary and tertiary health services through the Gold Coast University (GCUH) and Robina Hospitals, as well as a number of community settings throughout the region. Key primary health services are also offered such as community child health clinics and oral health services for adults and children.
The Gold Coast HHS’s vision is to be recognised as a centre of excellence for world class healthcare. Our purpose is to provide excellence in sustainable and evidence based healthcare that meets the needs of the community and is guided by local patient needs. The Gold Coast HHS supports the Queensland Government’s objectives for the community through its focus on the delivery of safe, effective and efficient quality frontline services and strengthening the public health system by ensuring patients have access to health services to support a healthy Gold Coast community.
Key strategic enablers for achieving the vision include: fostering a positive work environment; developing capacity and capability in research, teaching and education; including simulation; promoting the use of data to inform decisions; and leveraging our infrastructure and strategic alliances.
An increasing population and demand for public health services on the Gold Coast requires the Gold Coast HHS to monitor its performance against key indicators and continually seek improvements to service delivery, including the consolidation and expansion of a range of tertiary services and an increase in self-sufficiency for services provided within the region.
During 2016-17, the Gold Coast HHS has continued to develop and implement the services at the GCUH to reflect its higher acuity status and the achievement of higher clinical service capabilities in Cardiac Surgery, Children’s Critical Care, Neonatal Intensive Care, Level 1 Trauma, and Maternal Foetal Medicine. The Cancer Care service also commissioned the third linear accelerator and a pharmacy robot was commissioned at the GCUH.
Building on the Gold Coast HHS’s focus on service delivery for complex families, a specialist state-wide four bed Mother and Baby Unit in Mental Health Services was commissioned at GCUH to provides specialist care for women who require admission to hospital for significant mental health difficulties in the first year following childbirth that impact on their ability to function in everyday life and to care for their child.
The Gold Coast HHS has also increased investment in the delivery of secondary and tertiary health services to the community, as well as expansion of services to match the local health needs. In addition, the Gold Coast HHS has continued to invest in strategies to improve integration of care, including partnerships with the Gold Coast Primary Health Network and the non-government sector.
In addition, the Gold Coast Private Hospital, located on the GCUH site, was recently expanded to improve access to health services for the community and to complement Gold Coast health service provision.
Service summary The Gold Coast HHS has an operating budget of $1.391 billion for 2017-18 which is an increase of $107.3 million (8.4 per cent) from the published 2016-17 operating budget of $1.283 billion.
During 2017-18 the statewide Neurodevelopment Exposure Disorder (NED) Centre will be expanded to become Australia’s leading centre for the diagnosis and intervention of Fetal Alcohol Spectrum Disorder.
The Gold Coast HHS will continue to implement initiatives to strive to ensure long waiting patients for outpatient and elective surgery are adequately seen and treated as necessary. In addition, the Gold Coast HHS will strive to decrease the percentages of patients waiting outside clinically recommended timeframes for Categories 1, 2 and 3 outpatients, reflecting that the operational action plan for outpatients is improving performance.
During 2017-18 the Gold Coast HHS will continue to focus on improving integrated care services via the Gold Coast Integrated Care project and the engagement of our staff and partners in healthcare provision to better manage chronic disease within our community and continuing to deliver on additional mental health service delivery enhancements.
1152017-18 Queensland State Budget - Service Delivery Statements - Gold Coast Hospital and Health Service
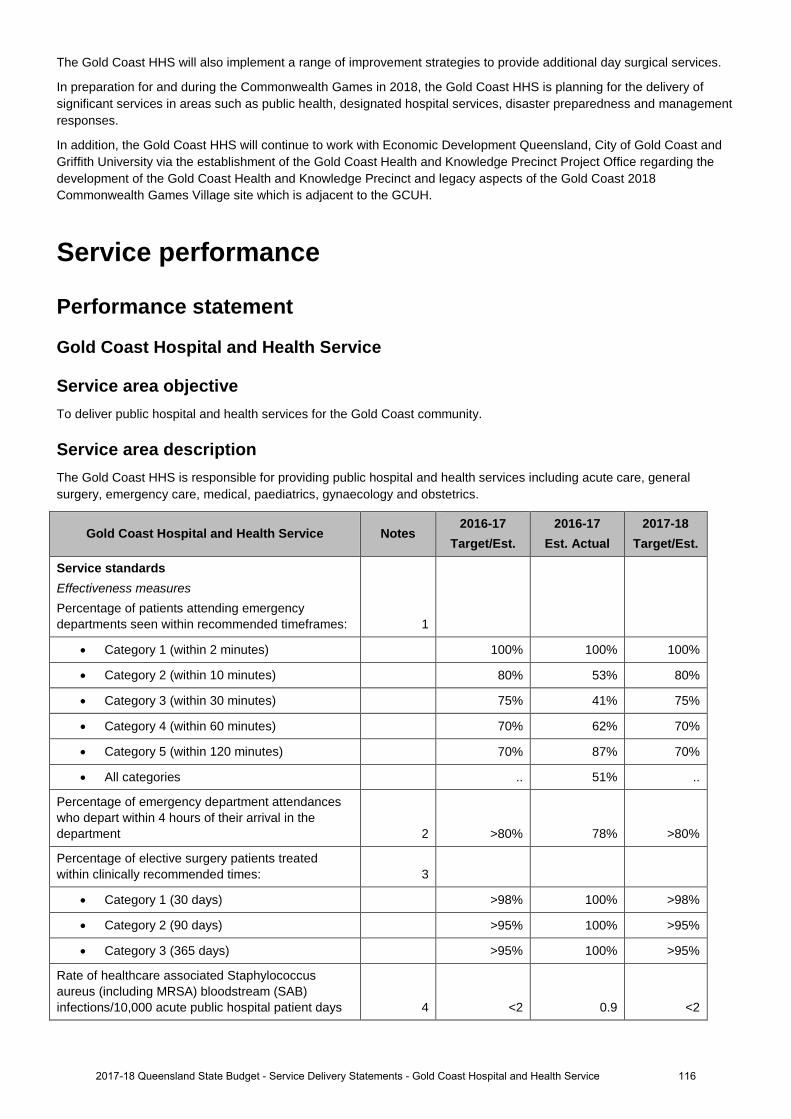
The Gold Coast HHS will also implement a range of improvement strategies to provide additional day surgical services.
In preparation for and during the Commonwealth Games in 2018, the Gold Coast HHS is planning for the delivery of significant services in areas such as public health, designated hospital services, disaster preparedness and management responses.
In addition, the Gold Coast HHS will continue to work with Economic Development Queensland, City of Gold Coast and Griffith University via the establishment of the Gold Coast Health and Knowledge Precinct Project Office regarding the development of the Gold Coast Health and Knowledge Precinct and legacy aspects of the Gold Coast 2018 Commonwealth Games Village site which is adjacent to the GCUH.
Service performance
Performance statement
Gold Coast Hospital and Health Service
Service area objective To deliver public hospital and health services for the Gold Coast community.
Service area description The Gold Coast HHS is responsible for providing public hospital and health services including acute care, general surgery, emergency care, medical, paediatrics, gynaecology and obstetrics.
Gold Coast Hospital and Health Service Notes 2016-17
Target/Est. 2016-17
Est. Actual 2017-18
Target/Est.
Service standards Effectiveness measures Percentage of patients attending emergency departments seen within recommended timeframes: 1
• Category 1 (within 2 minutes) 100% 100% 100%
• Category 2 (within 10 minutes) 80% 53% 80%
• Category 3 (within 30 minutes) 75% 41% 75%
• Category 4 (within 60 minutes) 70% 62% 70%
• Category 5 (within 120 minutes) 70% 87% 70%
• All categories .. 51% ..
Percentage of emergency department attendances who depart within 4 hours of their arrival in the department 2 >80% 78% >80%
Percentage of elective surgery patients treated within clinically recommended times: 3
• Category 1 (30 days) >98% 100% >98%
• Category 2 (90 days) >95% 100% >95%
• Category 3 (365 days) >95% 100% >95%
Rate of healthcare associated Staphylococcus aureus (including MRSA) bloodstream (SAB) infections/10,000 acute public hospital patient days 4 <2 0.9 <2
1162017-18 Queensland State Budget - Service Delivery Statements - Gold Coast Hospital and Health Service
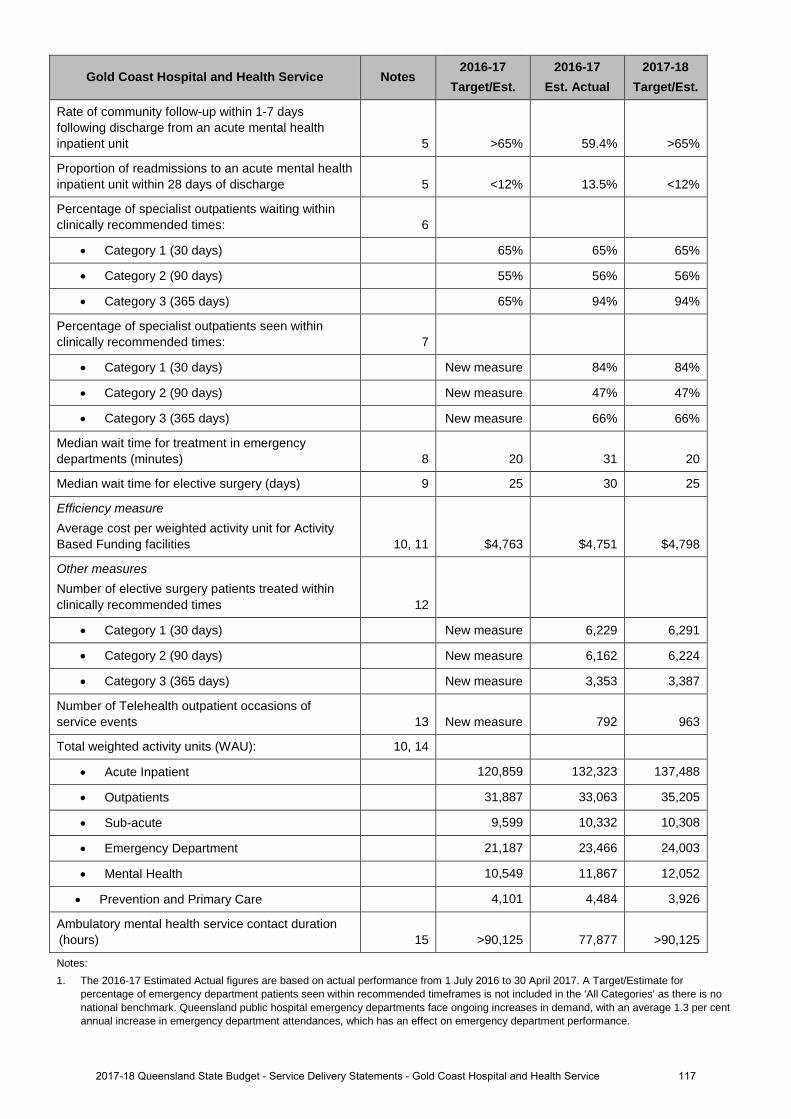
Gold Coast Hospital and Health Service Notes 2016-17
Target/Est. 2016-17
Est. Actual 2017-18
Target/Est.
Rate of community follow-up within 1-7 days following discharge from an acute mental health inpatient unit 5 >65% 59.4% >65%
Proportion of readmissions to an acute mental health inpatient unit within 28 days of discharge 5 <12% 13.5% <12%
Percentage of specialist outpatients waiting within clinically recommended times: 6
• Category 1 (30 days) 65% 65% 65%
• Category 2 (90 days) 55% 56% 56%
• Category 3 (365 days) 65% 94% 94%
Percentage of specialist outpatients seen within clinically recommended times: 7
• Category 1 (30 days) New measure 84% 84%
• Category 2 (90 days) New measure 47% 47%
• Category 3 (365 days) New measure 66% 66%
Median wait time for treatment in emergency departments (minutes) 8 20 31 20
Median wait time for elective surgery (days) 9 25 30 25
Efficiency measure Average cost per weighted activity unit for Activity Based Funding facilities 10, 11 $4,763 $4,751 $4,798
Other measures Number of elective surgery patients treated within clinically recommended times 12
• Category 1 (30 days) New measure 6,229 6,291
• Category 2 (90 days) New measure 6,162 6,224
• Category 3 (365 days) New measure 3,353 3,387
Number of Telehealth outpatient occasions of service events 13 New measure 792 963
Total weighted activity units (WAU): 10, 14
• Acute Inpatient 120,859 132,323 137,488
• Outpatients 31,887 33,063 35,205
• Sub-acute 9,599 10,332 10,308
• Emergency Department 21,187 23,466 24,003
• Mental Health 10,549 11,867 12,052
• Prevention and Primary Care 4,101 4,484 3,926
Ambulatory mental health service contact duration (hours) 15 >90,125 77,877 >90,125
Notes: 1. The 2016-17 Estimated Actual figures are based on actual performance from 1 July 2016 to 30 April 2017. A Target/Estimate for
percentage of emergency department patients seen within recommended timeframes is not included in the ‘All Categories’ as there is no national benchmark. Queensland public hospital emergency departments face ongoing increases in demand, with an average 1.3 per cent annual increase in emergency department attendances, which has an effect on emergency department performance.
1172017-18 Queensland State Budget - Service Delivery Statements - Gold Coast Hospital and Health Service
2. This is a measure of access and timeliness of emergency department services. The 2016-17 Estimated Actual figures are based on actual performance from 1 July 2016 to 30 April 2017.
3. This is a measure of effectiveness that shows how hospitals perform in providing elective surgery services within the recommended timeframe for each urgency category. The 2016-17 Estimated Actual figures are based on actual performance from 1 July 2016 to 30 April 2017.
4. This is a National Performance Agreement indicator and a measure of effectiveness of infection control programs and services in hospitals. Staphylococcus aureus are bacteria commonly found on around 30 per cent of people’s skin and noses and often cause no adverse effects. Infections with this organism can be serious, particularly so when they infect the bloodstream. The data reported for this service standard are for bloodstream infections with Staphylococcus aureus (including methicillin resistant Staphylococcus aureus) and are reported as a rate of infection per 10,000 patient days. The Target/Estimate for this measure aligns with the national benchmark of 2 cases per 10,000 acute public hospital patient days for each jurisdiction. The 2016-17 Estimated Actual figures are based on actual performance from 1 July 2016 to 31 March 2017.
5. This is a measure of access to, and timeliness of the community support system that is in place for persons who have experienced an acute psychiatric episode requiring hospitalisation. The 2016-17 Estimated Actual is for the period 1 July 2016 to 31 January 2017. Queensland has made significant progress in improving the rate of community follow up over the past five years. Increased pressure on community and inpatient mental health services has seen increases in readmission rates and is impacting the rate of follow up.
6. This is a measure of effectiveness that shows the percentage of patients who are waiting to have their first appointment (from the time of referral) with the health professional in an outpatient clinic, within the clinically recommended time. The 2016-17 Estimated Actual figure is based on patients waiting as at 30 April 2017.
7. This is a measure of effectiveness that indicates the percentage of patients seen within clinically recommended times during the reporting period. The 2016-17 Estimated Actual figures are based on actual performance from 1 July 2016 to 30 April 2017.
8. This measure indicates the amount of time for which half of all people waited in the emergency department (for all categories), from the time of presentation to being seen by a nurse or doctor (whichever was first). The 2016-17 Estimated Actual figure is based on actual performance from 1 July 2016 to 30 April 2017.
9. This is a measure of effectiveness that reports on the number of days for which half of all patients wait before undergoing elective surgery. The 2016-17 Estimated Actual figure is based on actual performance from 1 July 2016 to 30 April 2017.
10. A WAU is a measure of activity and provides a common unit of comparison so that all activity can be measured consistently. Service agreements between the Department of Health and HHSs and other organisations specify the activity to be provided in WAUs by service type. Refer to Box 1, page 12.
11. The 2016-17 Estimated Actual figure reflects 1 July to 31 December 2016 activity based costs and actual activity based funded activity. The 2017-18 Target/Estimate reflects the activity based funding less Clinical Education and Training and Specified Grants and activity within the finance and activity schedules of the 2017-18 Final Round Service Agreements Contract Offers. 2017-18 Target/Estimate for cost per Queensland WAU includes HHS activity forecast over delivery in 2016-17, funded by the Commonwealth at a marginal rate of 45 per cent. As a result, funding per Queensland WAU in 2017-18 is generally lower than the 2016-17 Target/Est cost per Queensland WAU. The impact of this is partially offset in some HHSs due to changes in Own Source Revenue classification between 2016-17 and 2017-18, and non- Queensland WAU investments. 2016-17 Est Actual cost per Queensland WAU is a point in time measure which includes the first 6 months of HHS expenditure and activity. It includes the impact of one-off investments in 2016-17.
12. This is a measure of activity. The 2016-17 Estimated Actual figures are based on 10 months of actual performance from 1 July 2016 to 30 April 2017.
13. This measure tracks the growth in occasions of service for Telehealth enabled outpatient services. These services support timely access to contemporary specialist services for patients from regional, rural and remote communities, supporting the reduction in wait times and costs associated with patient travel. The 2016-17 Estimated Actual figure is based on actual performance from 1 July 2016 to 30 April 2017 forecast out over 12 months.
14. The 2016-17 Estimated Actual figures are based on 2016-17 Queensland WAU forecasts as provided by HHSs. 2017-18 Target/Estimate figures are based on the 2017-18 Final Round Service Agreements Contract Offers. All activity is reported in the same phase - Activity Based Funding (ABF) model Q19. ‘Total WAUs – Interventions and procedures’ has been reallocated to ‘Total WAUs – Acute Inpatient Care’ and ‘Total WAUs – Outpatient Care’ service standards. ‘Total WAUs – Prevention and Primary Care’ is comprised of BreastScreen and Dental WAUs. Total WAUS - Prevention and Primary Care’ is a new measure for the Service Delivery Statement, however, it has been included in the HHS Service Agreements since 2016-17. Purchased Queensland WAUs in 2017-18 for Prevention and Primary Care are lower due to one off investments in Oral Health in 2016-17 and NPA funding not yet allocated.
15. This measure counts the number of in-scope service contact hours attributable to each HHS, based on the national definition and calculation of service contacts and duration. The Estimated Actuals for 2016-17 are for the period 1 July 2016 to 31 March 2017. It is important to note that not all activity of ambulatory clinicians is in-scope for this measure, with most review and some service coordination activities excluded. In addition, improvements in data quality have contributed to the result, with the data more accurately reflecting way in which services are delivered. The Target/Estimate for this measure is determined using a standard formula based upon available clinical staffing, HHS rurality, and historical performance. The targets for these measures have been set to be consistently calculated and are considered a stretch for many services.
1182017-18 Queensland State Budget - Service Delivery Statements - Gold Coast Hospital and Health Service
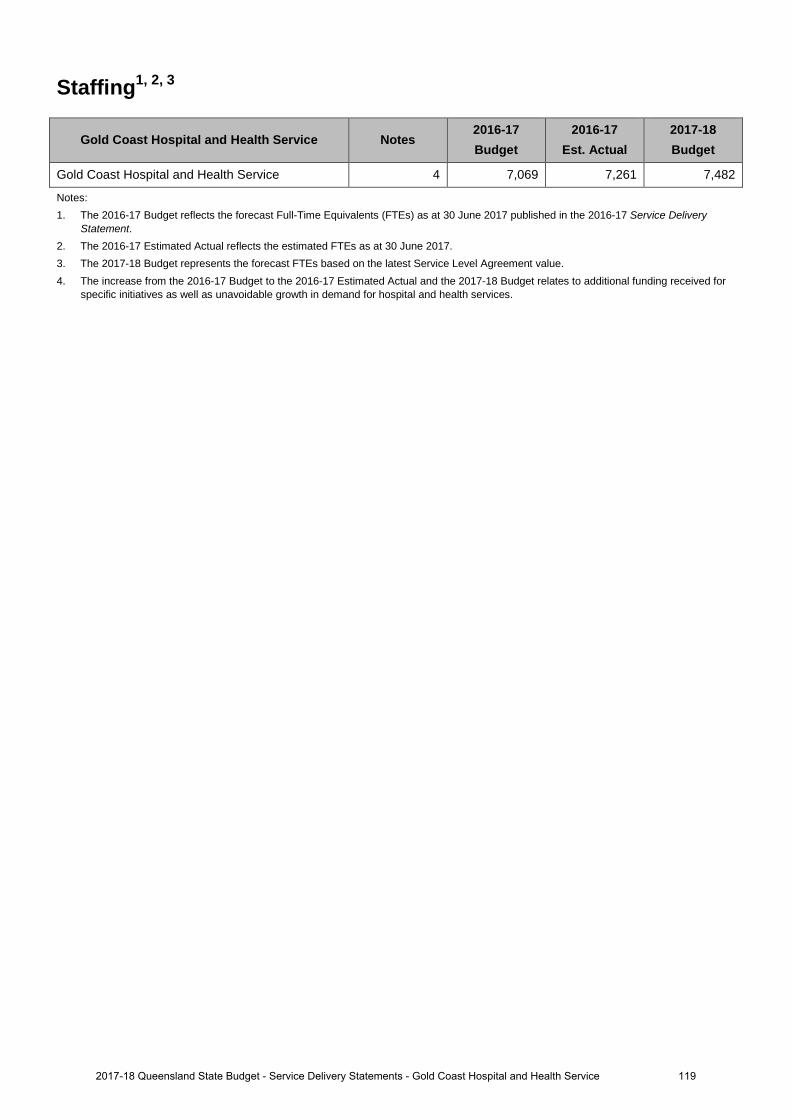
Staffing1, 2, 3
Gold Coast Hospital and Health Service Notes 2016-17 Budget
2016-17 Est. Actual
2017-18 Budget
Gold Coast Hospital and Health Service 4 7,069 7,261 7,482
Notes: 1. The 2016-17 Budget reflects the forecast Full-Time Equivalents (FTEs) as at 30 June 2017 published in the 2016-17 Service Delivery
Statement. 2. The 2016-17 Estimated Actual reflects the estimated FTEs as at 30 June 2017. 3. The 2017-18 Budget represents the forecast FTEs based on the latest Service Level Agreement value. 4. The increase from the 2016-17 Budget to the 2016-17 Estimated Actual and the 2017-18 Budget relates to additional funding received for
specific initiatives as well as unavoidable growth in demand for hospital and health services.
1192017-18 Queensland State Budget - Service Delivery Statements - Gold Coast Hospital and Health Service

Income statement
Gold Coast Hospital and Health Service Notes 2016-17 Budget
$'000
2016-17 Est. Act.
$'000
2017-18 Budget
$'000
INCOMEUser charges and fees 1,6,10 1,270,041 1,308,977 1,376,441 Grants and other contributions 12,656 12,979 12,986 Interest 77 77 77 Other revenue 2,7 663 1,200 1,200 Gains on sale/revaluation of assets .. .. ..
Total income 1,283,437 1,323,233 1,390,704 EXPENSES
Employee expenses 3,8,11 865,404 894,382 946,522 Supplies and Services:Other supplies and services 4,9,12 332,939 344,280 357,630 Department of Health contract staff .. .. .. Grants and subsidies 5,13 1,323 800 1,323 Depreciation and amortisation 79,458 79,458 80,794 Finance/borrowing costs .. .. .. Other expenses 3,128 3,128 3,250 Losses on sale/revaluation of assets 1,185 1,185 1,185
Total expenses 1,283,437 1,323,233 1,390,704 OPERATING SURPLUS/(DEFICIT) .. .. ..
1202017-18 Queensland State Budget - Service Delivery Statements - Gold Coast Hospital and Health Service

Balance sheet
Gold Coast Hospital and Health Service Notes 2016-17 Budget
$'000
2016-17 Est. Act.
$'000
2017-18 Budget
$'000
CURRENT ASSETSCash assets 14,20 20,309 63,521 65,353 Receivables 15,21 44,893 21,429 21,785 Other financial assets .. .. .. Inventories 8,106 8,206 8,295 Other 1,537 1,716 1,983 Non-financial assets held for sale .. .. ..
Total current assets 74,845 94,872 97,416 NON-CURRENT ASSETS
Receivables .. .. .. Other financial assets .. .. .. Property, plant and equipment 16,22,26 1,761,957 1,754,012 1,735,276 Intangibles 727 1,736 1,510 Other .. .. ..
Total non-current assets 1,762,684 1,755,748 1,736,786 TOTAL ASSETS 1,837,529 1,850,620 1,834,202 CURRENT LIABILITIES
Payables 17,23 27,331 40,099 42,637 Accrued employee benefits 18,24 23,170 30,824 30,830 Interest bearing liabilities and derivatives .. .. .. Provisions .. .. .. Other 19,25 5,047 1,132 1,132
Total current liabilities 55,548 72,055 74,599 NON-CURRENT LIABILITIES
Payables .. .. .. Accrued employee benefits .. .. .. Interest bearing liabilities and derivatives .. .. .. Provisions .. .. .. Other .. .. ..
Total non-current liabilities .. .. .. TOTAL LIABILITIES 55,548 72,055 74,599 NET ASSETS/(LIABILITIES) 1,781,981 1,778,565 1,759,603 EQUITYTOTAL EQUITY 1,781,981 1,778,565 1,759,603
1212017-18 Queensland State Budget - Service Delivery Statements - Gold Coast Hospital and Health Service

Cash flow statement
Gold Coast Hospital and Health Service Notes 2016-17 Budget
$'000
2016-17 Est. Act.
$'000
2017-18 Budget
$'000
CASH FLOWS FROM OPERATING ACTIVITIESInflows:
User charges and fees 27,32,35 1,268,740 1,307,676 1,375,140 Grants and other contributions 12,656 12,979 12,986 Interest received 77 77 77Other 8,713 9,250 9,250
Outflows:Employee costs 28,33,36 (865,398) (894,376) (946,516)Supplies and services 29,34 (338,962) (350,303) (363,653)Grants and subsidies 30,37 (1,323) (800) (1,323)Borrowing costs .. .. ..Other (3,128) (3,128) (3,250)
Net cash provided by or used in operating activities 81,375 81,375 82,711 CASH FLOWS FROM INVESTING ACTIVITIESInflows:
Sales of non-financial assets (85) (85) (85)Investments redeemed .. .. ..Loans and advances redeemed .. .. ..
Outflows:Payments for non-financial assets 31,38 (6,389) (13,031) (4,496)Payments for investments .. .. .. Loans and advances made .. .. ..
Net cash provided by or used in investing activities (6,474) (13,116) (4,581)CASH FLOWS FROM FINANCING ACTIVITIESInflows:
Borrowings .. .. ..Equity injections 6,389 12,226 4,496
Outflows:Borrowing redemptions .. .. ..Finance lease payments .. .. .. Equity withdrawals (79,458) (79,458) (80,794)
Net cash provided by or used in financing activities (73,069) (67,232) (76,298)Net increase/(decrease) in cash held 1,832 1,027 1,832 Cash at the beginning of financial year 18,477 62,494 63,521
Cash transfers from restructure .. .. .. Cash at the end of financial year 20,309 63,521 65,353
1222017-18 Queensland State Budget - Service Delivery Statements - Gold Coast Hospital and Health Service
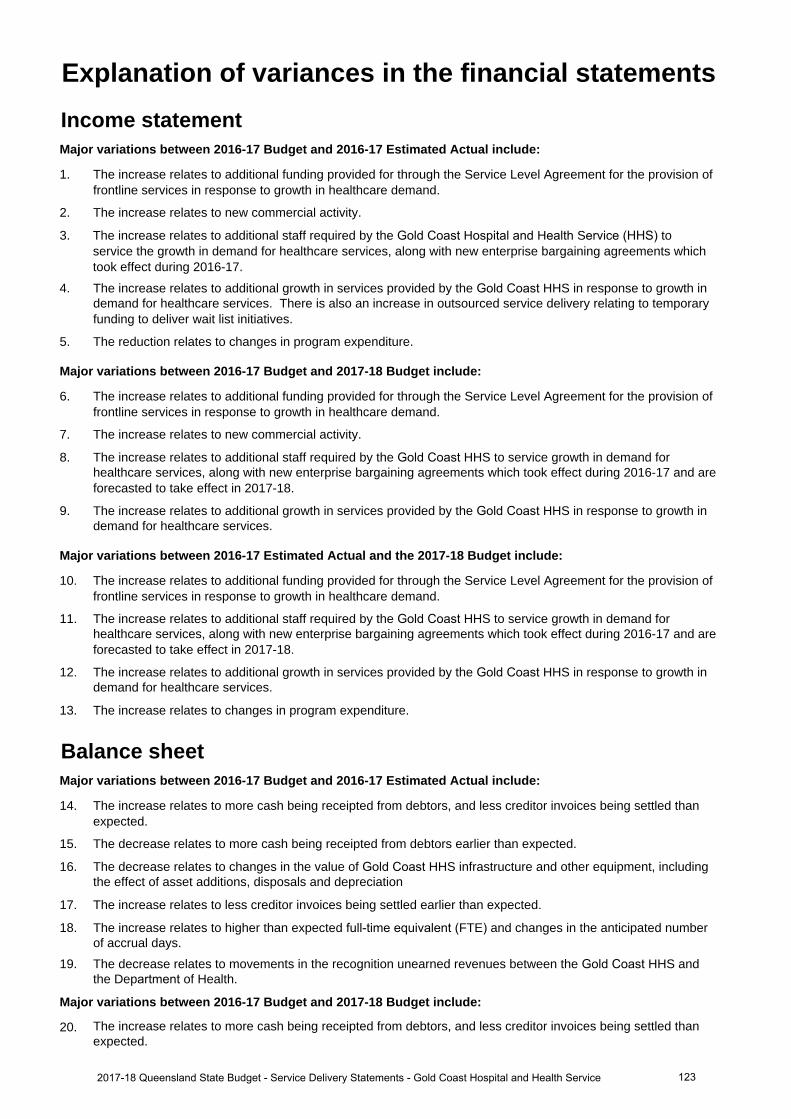
Income statementMajor variations between 2016-17 Budget and 2016-17 Estimated Actual include:
1. The increase relates to additional funding provided for through the Service Level Agreement for the provision offrontline services in response to growth in healthcare demand.
2. The increase relates to new commercial activity.
3. The increase relates to additional staff required by the Gold Coast Hospital and Health Service (HHS) toservice the growth in demand for healthcare services, along with new enterprise bargaining agreements whichtook effect during 2016-17.
4. The increase relates to additional growth in services provided by the Gold Coast HHS in response to growth indemand for
healthcare services. There is also an increase in outsourced service delivery relating to temporary
funding to deliver wait list initiatives.
5. The reduction relates to changes in program expenditure.
Major variations between 2016-17 Budget and 2017-18 Budget include:
6. The increase relates to additional funding provided for through the Service Level Agreement for the provision offrontline services in response to growth in healthcare demand.
7. The increase relates to new commercial activity.
8. The increase relates to additional staff required by the Gold Coast HHS to service growth in demand forhealthcare services,
along with new enterprise bargaining agreements which took effect during 2016-17 and are
forecasted to take effect in 2017-18.
9. The increase relates to additional growth in services provided by the Gold Coast HHS in response to growth indemand for healthcare services.
Major variations between 2016-17 Estimated Actual and the 2017-18 Budget include:
10. The increase relates to additional funding provided for through the Service Level Agreement for the provision offrontline services in response to growth in healthcare demand.
11. The increase relates to additional staff required by the Gold Coast HHS to service growth in demand forhealthcare services,
along with new enterprise bargaining agreements which took effect during 2016-17 and are
forecasted to take effect in 2017-18.
12. The increase relates to additional growth in services provided by the Gold Coast HHS in response to growth indemand for
healthcare services.
13. The increase relates to changes in program expenditure.
Balance sheetMajor variations between 2016-17 Budget and 2016-17 Estimated Actual include:
14. The increase relates to more cash being receipted from debtors, and less creditor invoices being settled thanexpected.
15. The decrease relates to more cash being receipted from debtors earlier than expected.
16. The decrease relates to changes in the value of Gold Coast HHS infrastructure and other equipment, includingthe effect of
asset additions, disposals and depreciation
17. The increase relates to less creditor invoices being settled earlier than expected.
18. The increase relates to higher than expected full-time equivalent (FTE) and changes in the anticipated numberof accrual days.
19. The decrease relates to movements in the recognition unearned revenues between the Gold Coast HHS andthe Department of
Health.
Major variations between 2016-17 Budget and 2017-18 Budget include:
20. The increase relates to more cash being receipted from debtors, and less creditor invoices being settled thanexpected.
Explanation of variances in the financial statements
1232017-18 Queensland State Budget - Service Delivery Statements - Gold Coast Hospital and Health Service
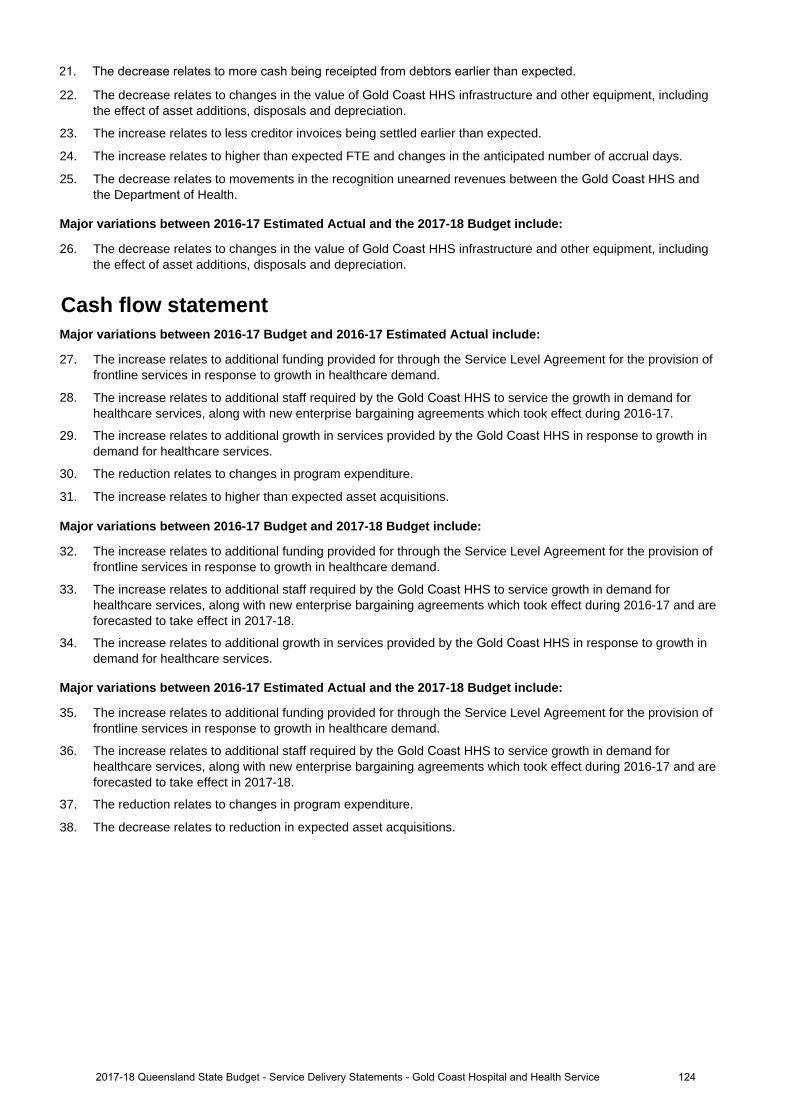
22. The decrease relates to changes in the value of Gold Coast HHS infrastructure and other equipment, includingthe effect of asset additions, disposals and depreciation.
23. The increase relates to less creditor invoices being settled earlier than expected.
24. The increase relates to higher than expected FTE and changes in the anticipated number of accrual days.
25. The decrease relates to movements in the recognition unearned revenues between the Gold Coast HHS andthe Department of Health.
Major variations between 2016-17 Estimated Actual and the 2017-18 Budget include:
26. The decrease relates to changes in the value of Gold Coast HHS infrastructure and other equipment, includingthe effect of asset additions, disposals and depreciation.
Cash flow statementMajor variations between 2016-17 Budget and 2016-17 Estimated Actual include:
27. The increase relates to additional funding provided for through the Service Level Agreement for the provision offrontline services in response to growth in healthcare demand.
28. The increase relates to additional staff required by the Gold Coast HHS to service the growth in demand forhealthcare services, along with new enterprise bargaining agreements which took effect during 2016-17.
29. The increase relates to additional growth in services provided by the Gold Coast HHS in response to growth indemand for healthcare services.
30. The reduction relates to changes in program expenditure.
31. The increase relates to higher than expected asset acquisitions.
Major variations between 2016-17 Budget and 2017-18 Budget include:
32. The increase relates to additional funding provided for through the Service Level Agreement for the provision offrontline services in response to growth in healthcare demand.
33. The increase relates to additional staff required by the Gold Coast HHS to service growth in demand forhealthcare services, along with new enterprise bargaining agreements which took effect during 2016-17 and areforecasted to take effect in 2017-18.
34. The increase relates to additional growth in services provided by the Gold Coast HHS in response to growth indemand for healthcare services.
Major variations between 2016-17 Estimated Actual and the 2017-18 Budget include:
35. The increase relates to additional funding provided for through the Service Level Agreement for the provision offrontline services in response to growth in healthcare demand.
36. The increase relates to additional staff required by the Gold Coast HHS to service growth in demand forhealthcare services, along with new enterprise bargaining agreements which took effect during 2016-17 and areforecasted to take effect in 2017-18.
37. The reduction relates to changes in program expenditure.
38. The decrease relates to reduction in expected asset acquisitions.
1242017-18 Queensland State Budget - Service Delivery Statements - Gold Coast Hospital and Health Service
21. The decrease relates to more cash being receipted from debtors earlier than expected.
Mackay Hospital and Health Service
Overview The Mackay Hospital and Health Service (HHS) is an independent statutory body overseen by an appointed Hospital and Health Board. The Mackay HHS is responsible for the delivery of public hospital and health services to a population of approximately 182,000 people. The geographical catchment of the Mackay HHS spans 90,364 square kilometres, extending from Bowen in the north to St Lawrence in the south, west to Clermont and northwest to Collinsville, and includes Proserpine and the Whitsundays.
The Mackay HHS is responsible for the direct management of eight hospitals and multipurpose health services together with other community health facilities within the HHS’s geographical boundaries, including:
• Bowen Hospital • Mackay Base Hospital
• Clermont Hospital • Moranbah Hospital
• Collinsville Hospital • Proserpine Hospital
• Dysart Hospital • Sarina Hospital
The Mackay HHS aims to deliver outstanding health care services to its communities through its people and partners. The Mackay HHS is working to achieve its 2020 vision ‘Delivering Queensland's Best Rural and Regional Health Care’, through four strategic objectives:
• inspired people• exceptional patient experiences• excellence in integrated care• sustainable service delivery.
The actions under these strategic objectives will enable the HHS to achieve positive outcomes for the Mackay community including: better access to services; safe and excellent care; easier navigation of the health system for patients, and services matched to community health needs. The demand for services in the Mackay HHS continues to grow as more people choose public services over private services in the region. The population also continues to age, with the over 70 age group having the greatest percentage projected increase over the coming years. The Mackay HHS is also one of the largest employers in the region, and recognises its responsibilities and impact through proactive strategies to achieve the objective of ‘Inspired People’.
The strategic objectives of the Mackay HHS contribute to the Queensland Government’s objectives of delivering quality frontline services; creating jobs and a diverse economy and building safe, caring and connected communities.
During 2016-17, the Mackay HHS invested in key developments to deliver enhanced services for our community including:
• reduced waiting times for specialist outpatient appointments and elective surgery• enhanced clinical information technology systems – the Digital Hospital• increased inpatient acute bed capacity through the opening of 12 new beds at the Mackay Base Hospital• supporting clinicians and General Practitioners by way of Health Pathways to better navigate the local health system
for assessment, management and referral of patients.
1252017-18 Queensland State Budget - Service Delivery Statements - Mackay Hospital and Health Service
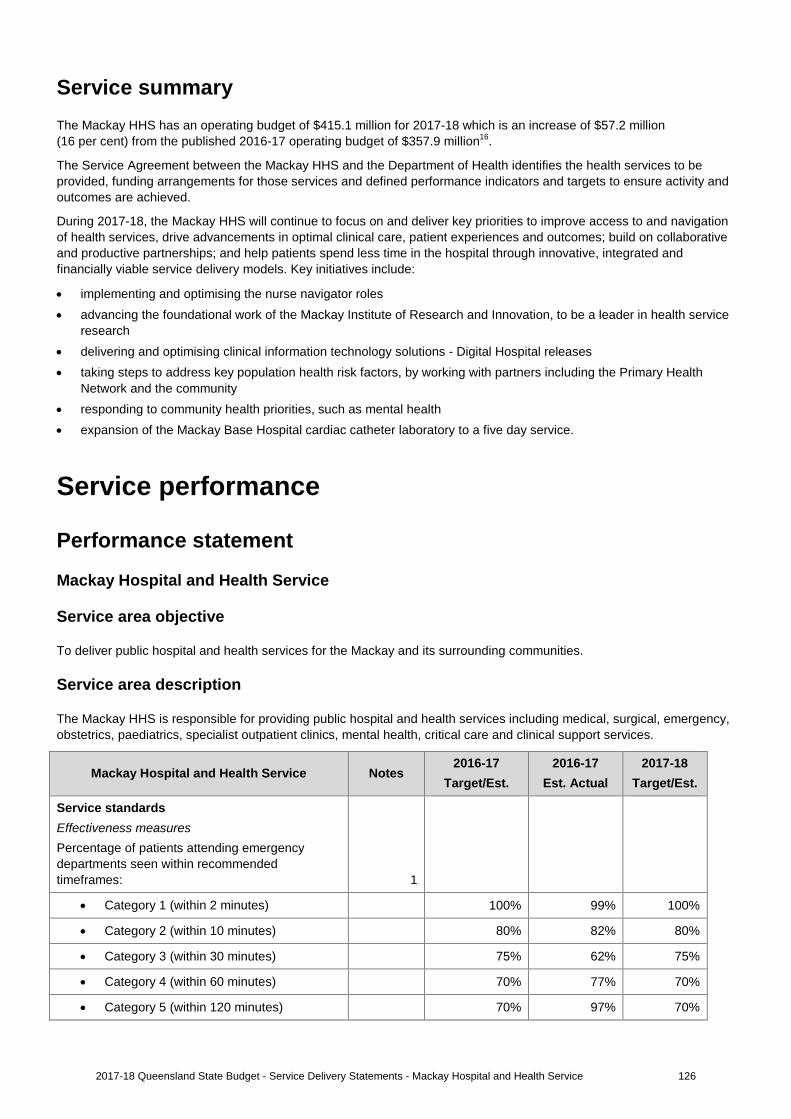
Service summary The Mackay HHS has an operating budget of $415.1 million for 2017-18 which is an increase of $57.2 million (16 per cent) from the published 2016-17 operating budget of $357.9 million16.
The Service Agreement between the Mackay HHS and the Department of Health identifies the health services to be provided, funding arrangements for those services and defined performance indicators and targets to ensure activity and outcomes are achieved.
During 2017-18, the Mackay HHS will continue to focus on and deliver key priorities to improve access to and navigation of health services, drive advancements in optimal clinical care, patient experiences and outcomes; build on collaborative and productive partnerships; and help patients spend less time in the hospital through innovative, integrated and financially viable service delivery models. Key initiatives include:
• implementing and optimising the nurse navigator roles• advancing the foundational work of the Mackay Institute of Research and Innovation, to be a leader in health service
research• delivering and optimising clinical information technology solutions - Digital Hospital releases• taking steps to address key population health risk factors, by working with partners including the Primary Health
Network and the community• responding to community health priorities, such as mental health• expansion of the Mackay Base Hospital cardiac catheter laboratory to a five day service.
Service performance
Performance statement
Mackay Hospital and Health Service
Service area objective
To deliver public hospital and health services for the Mackay and its surrounding communities.
Service area description
The Mackay HHS is responsible for providing public hospital and health services including medical, surgical, emergency, obstetrics, paediatrics, specialist outpatient clinics, mental health, critical care and clinical support services.
Mackay Hospital and Health Service Notes 2016-17
Target/Est. 2016-17
Est. Actual 2017-18
Target/Est.
Service standards Effectiveness measures Percentage of patients attending emergency departments seen within recommended timeframes: 1
• Category 1 (within 2 minutes) 100% 99% 100%
• Category 2 (within 10 minutes) 80% 82% 80%
• Category 3 (within 30 minutes) 75% 62% 75%
• Category 4 (within 60 minutes) 70% 77% 70%
• Category 5 (within 120 minutes) 70% 97% 70%
1262017-18 Queensland State Budget - Service Delivery Statements - Mackay Hospital and Health Service
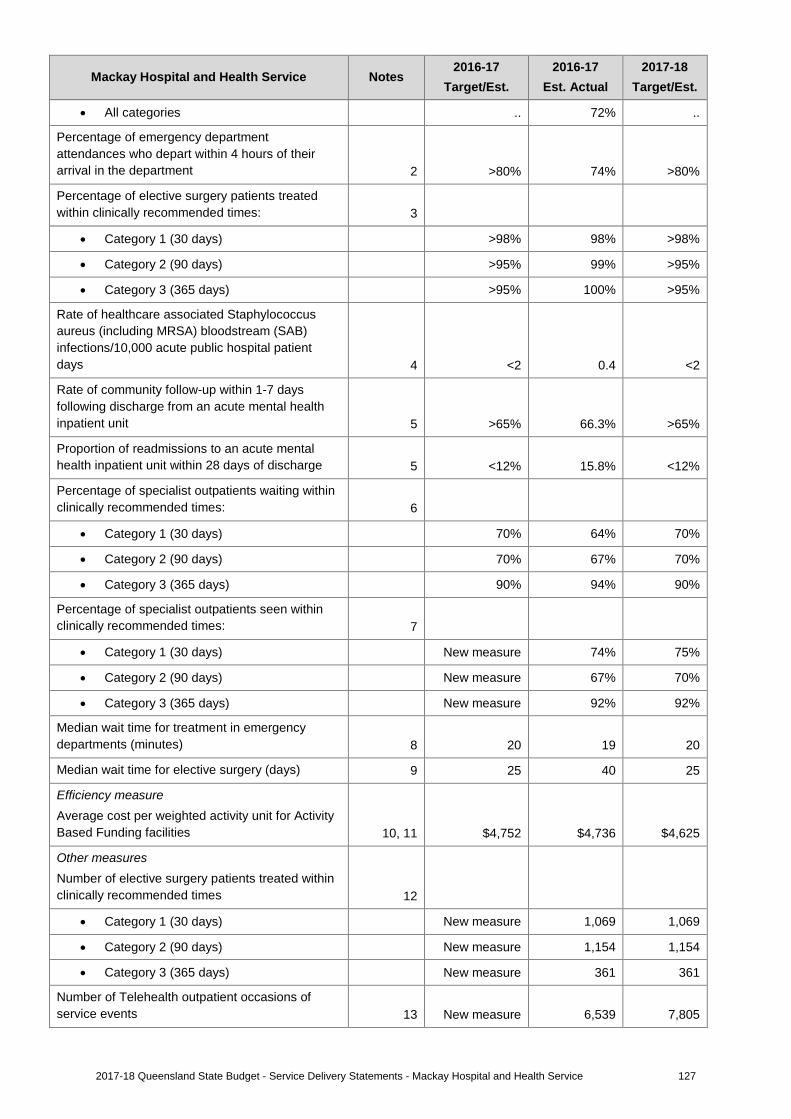
Mackay Hospital and Health Service Notes 2016-17
Target/Est. 2016-17
Est. Actual 2017-18
Target/Est.
• All categories .. 72% ..
Percentage of emergency department attendances who depart within 4 hours of their arrival in the department 2 >80% 74% >80%
Percentage of elective surgery patients treated within clinically recommended times: 3
• Category 1 (30 days) >98% 98% >98%
• Category 2 (90 days) >95% 99% >95%
• Category 3 (365 days) >95% 100% >95%
Rate of healthcare associated Staphylococcus aureus (including MRSA) bloodstream (SAB) infections/10,000 acute public hospital patient days 4 <2 0.4 <2
Rate of community follow-up within 1-7 days following discharge from an acute mental health inpatient unit 5 >65% 66.3% >65%
Proportion of readmissions to an acute mental health inpatient unit within 28 days of discharge 5 <12% 15.8% <12%
Percentage of specialist outpatients waiting within clinically recommended times: 6
• Category 1 (30 days) 70% 64% 70%
• Category 2 (90 days) 70% 67% 70%
• Category 3 (365 days) 90% 94% 90%
Percentage of specialist outpatients seen within clinically recommended times: 7
• Category 1 (30 days) New measure 74% 75%
• Category 2 (90 days) New measure 67% 70%
• Category 3 (365 days) New measure 92% 92%
Median wait time for treatment in emergency departments (minutes) 8 20 19 20
Median wait time for elective surgery (days) 9 25 40 25
Efficiency measure Average cost per weighted activity unit for Activity Based Funding facilities 10, 11 $4,752 $4,736 $4,625
Other measures Number of elective surgery patients treated within clinically recommended times 12
• Category 1 (30 days) New measure 1,069 1,069
• Category 2 (90 days) New measure 1,154 1,154
• Category 3 (365 days) New measure 361 361
Number of Telehealth outpatient occasions of service events 13 New measure 6,539 7,805
1272017-18 Queensland State Budget - Service Delivery Statements - Mackay Hospital and Health Service
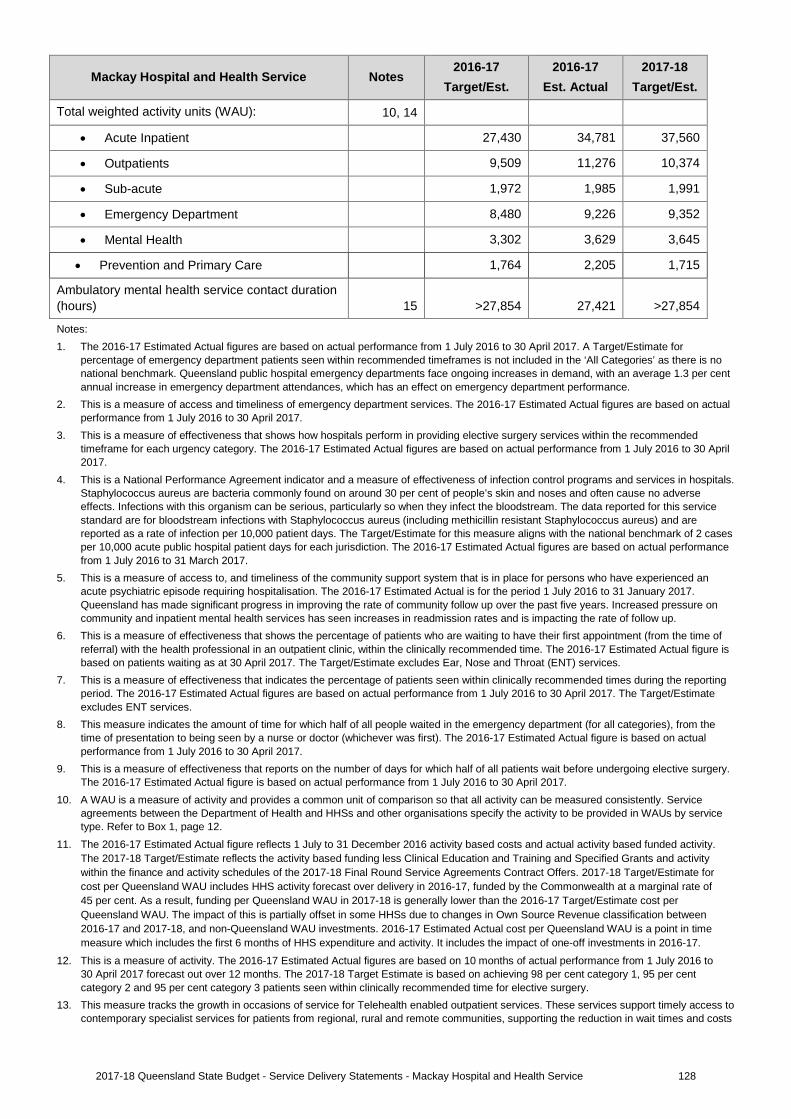
Mackay Hospital and Health Service Notes 2016-17
Target/Est. 2016-17
Est. Actual 2017-18
Target/Est.
Total weighted activity units (WAU): 10, 14
• Acute Inpatient 27,430 34,781 37,560
• Outpatients 9,509 11,276 10,374
• Sub-acute 1,972 1,985 1,991
• Emergency Department 8,480 9,226 9,352
• Mental Health 3,302 3,629 3,645
• Prevention and Primary Care 1,764 2,205 1,715
Ambulatory mental health service contact duration (hours) 15 >27,854 27,421 >27,854
Notes: 1. The 2016-17 Estimated Actual figures are based on actual performance from 1 July 2016 to 30 April 2017. A Target/Estimate for
percentage of emergency department patients seen within recommended timeframes is not included in the ‘All Categories’ as there is no national benchmark. Queensland public hospital emergency departments face ongoing increases in demand, with an average 1.3 per cent annual increase in emergency department attendances, which has an effect on emergency department performance.
2. This is a measure of access and timeliness of emergency department services. The 2016-17 Estimated Actual figures are based on actualperformance from 1 July 2016 to 30 April 2017.
3. This is a measure of effectiveness that shows how hospitals perform in providing elective surgery services within the recommendedtimeframe for each urgency category. The 2016-17 Estimated Actual figures are based on actual performance from 1 July 2016 to 30 April 2017.
4. This is a National Performance Agreement indicator and a measure of effectiveness of infection control programs and services in hospitals.Staphylococcus aureus are bacteria commonly found on around 30 per cent of people’s skin and noses and often cause no adverse effects. Infections with this organism can be serious, particularly so when they infect the bloodstream. The data reported for this service standard are for bloodstream infections with Staphylococcus aureus (including methicillin resistant Staphylococcus aureus) and are reported as a rate of infection per 10,000 patient days. The Target/Estimate for this measure aligns with the national benchmark of 2 cases per 10,000 acute public hospital patient days for each jurisdiction. The 2016-17 Estimated Actual figures are based on actual performance from 1 July 2016 to 31 March 2017.
5. This is a measure of access to, and timeliness of the community support system that is in place for persons who have experienced anacute psychiatric episode requiring hospitalisation. The 2016-17 Estimated Actual is for the period 1 July 2016 to 31 January 2017. Queensland has made significant progress in improving the rate of community follow up over the past five years. Increased pressure on community and inpatient mental health services has seen increases in readmission rates and is impacting the rate of follow up.
6. This is a measure of effectiveness that shows the percentage of patients who are waiting to have their first appointment (from the time ofreferral) with the health professional in an outpatient clinic, within the clinically recommended time. The 2016-17 Estimated Actual figure is based on patients waiting as at 30 April 2017. The Target/Estimate excludes Ear, Nose and Throat (ENT) services.
7. This is a measure of effectiveness that indicates the percentage of patients seen within clinically recommended times during the reportingperiod. The 2016-17 Estimated Actual figures are based on actual performance from 1 July 2016 to 30 April 2017. The Target/Estimate excludes ENT services.
8. This measure indicates the amount of time for which half of all people waited in the emergency department (for all categories), from thetime of presentation to being seen by a nurse or doctor (whichever was first). The 2016-17 Estimated Actual figure is based on actual performance from 1 July 2016 to 30 April 2017.
9. This is a measure of effectiveness that reports on the number of days for which half of all patients wait before undergoing elective surgery.The 2016-17 Estimated Actual figure is based on actual performance from 1 July 2016 to 30 April 2017.
10. A WAU is a measure of activity and provides a common unit of comparison so that all activity can be measured consistently. Serviceagreements between the Department of Health and HHSs and other organisations specify the activity to be provided in WAUs by service type. Refer to Box 1, page 12.
11. The 2016-17 Estimated Actual figure reflects 1 July to 31 December 2016 activity based costs and actual activity based funded activity.The 2017-18 Target/Estimate reflects the activity based funding less Clinical Education and Training and Specified Grants and activitywithin the finance and activity schedules of the 2017-18 Final Round Service Agreements Contract Offers. 2017-18 Target/Estimate forcost per Queensland WAU includes HHS activity forecast over delivery in 2016-17, funded by the Commonwealth at a marginal rate of45 per cent. As a result, funding per Queensland WAU in 2017-18 is generally lower than the 2016-17 Target/Estimate cost perQueensland WAU. The impact of this is partially offset in some HHSs due to changes in Own Source Revenue classification between2016-17 and 2017-18, and non-Queensland WAU investments. 2016-17 Estimated Actual cost per Queensland WAU is a point in timemeasure which includes the first 6 months of HHS expenditure and activity. It includes the impact of one-off investments in 2016-17.
12. This is a measure of activity. The 2016-17 Estimated Actual figures are based on 10 months of actual performance from 1 July 2016 to30 April 2017 forecast out over 12 months. The 2017-18 Target Estimate is based on achieving 98 per cent category 1, 95 per centcategory 2 and 95 per cent category 3 patients seen within clinically recommended time for elective surgery.
13. This measure tracks the growth in occasions of service for Telehealth enabled outpatient services. These services support timely access tocontemporary specialist services for patients from regional, rural and remote communities, supporting the reduction in wait times and costs
1282017-18 Queensland State Budget - Service Delivery Statements - Mackay Hospital and Health Service
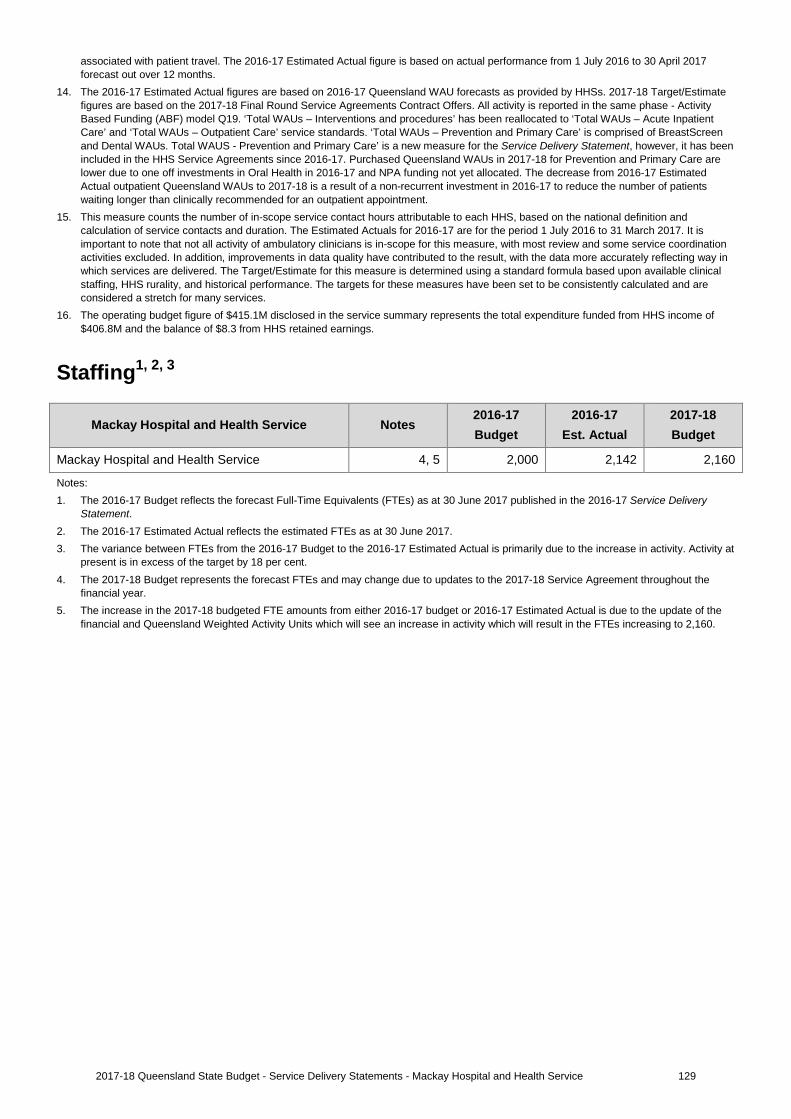
associated with patient travel. The 2016-17 Estimated Actual figure is based on actual performance from 1 July 2016 to 30 April 2017 forecast out over 12 months.
14. The 2016-17 Estimated Actual figures are based on 2016-17 Queensland WAU forecasts as provided by HHSs. 2017-18 Target/Estimatefigures are based on the 2017-18 Final Round Service Agreements Contract Offers. All activity is reported in the same phase - Activity Based Funding (ABF) model Q19. ‘Total WAUs – Interventions and procedures’ has been reallocated to ‘Total WAUs – Acute Inpatient Care’ and ‘Total WAUs – Outpatient Care’ service standards. ‘Total WAUs – Prevention and Primary Care’ is comprised of BreastScreen and Dental WAUs. Total WAUS - Prevention and Primary Care’ is a new measure for the Service Delivery Statement, however, it has been included in the HHS Service Agreements since 2016-17. Purchased Queensland WAUs in 2017-18 for Prevention and Primary Care are lower due to one off investments in Oral Health in 2016-17 and NPA funding not yet allocated. The decrease from 2016-17 Estimated Actual outpatient Queensland WAUs to 2017-18 is a result of a non-recurrent investment in 2016-17 to reduce the number of patients waiting longer than clinically recommended for an outpatient appointment.
15. This measure counts the number of in-scope service contact hours attributable to each HHS, based on the national definition andcalculation of service contacts and duration. The Estimated Actuals for 2016-17 are for the period 1 July 2016 to 31 March 2017. It is important to note that not all activity of ambulatory clinicians is in-scope for this measure, with most review and some service coordination activities excluded. In addition, improvements in data quality have contributed to the result, with the data more accurately reflecting way in which services are delivered. The Target/Estimate for this measure is determined using a standard formula based upon available clinical staffing, HHS rurality, and historical performance. The targets for these measures have been set to be consistently calculated and are considered a stretch for many services.
16. The operating budget figure of $415.1M disclosed in the service summary represents the total expenditure funded from HHS income of$406.8M and the balance of $8.3 from HHS retained earnings.
Staffing1, 2, 3
Mackay Hospital and Health Service Notes 2016-17 Budget
2016-17 Est. Actual
2017-18 Budget
Mackay Hospital and Health Service 4, 5 2,000 2,142 2,160
Notes: 1. The 2016-17 Budget reflects the forecast Full-Time Equivalents (FTEs) as at 30 June 2017 published in the 2016-17 Service Delivery
Statement. 2. The 2016-17 Estimated Actual reflects the estimated FTEs as at 30 June 2017.3. The variance between FTEs from the 2016-17 Budget to the 2016-17 Estimated Actual is primarily due to the increase in activity. Activity at
present is in excess of the target by 18 per cent.4. The 2017-18 Budget represents the forecast FTEs and may change due to updates to the 2017-18 Service Agreement throughout the
financial year.5. The increase in the 2017-18 budgeted FTE amounts from either 2016-17 budget or 2016-17 Estimated Actual is due to the update of the
financial and Queensland Weighted Activity Units which will see an increase in activity which will result in the FTEs increasing to 2,160.
1292017-18 Queensland State Budget - Service Delivery Statements - Mackay Hospital and Health Service
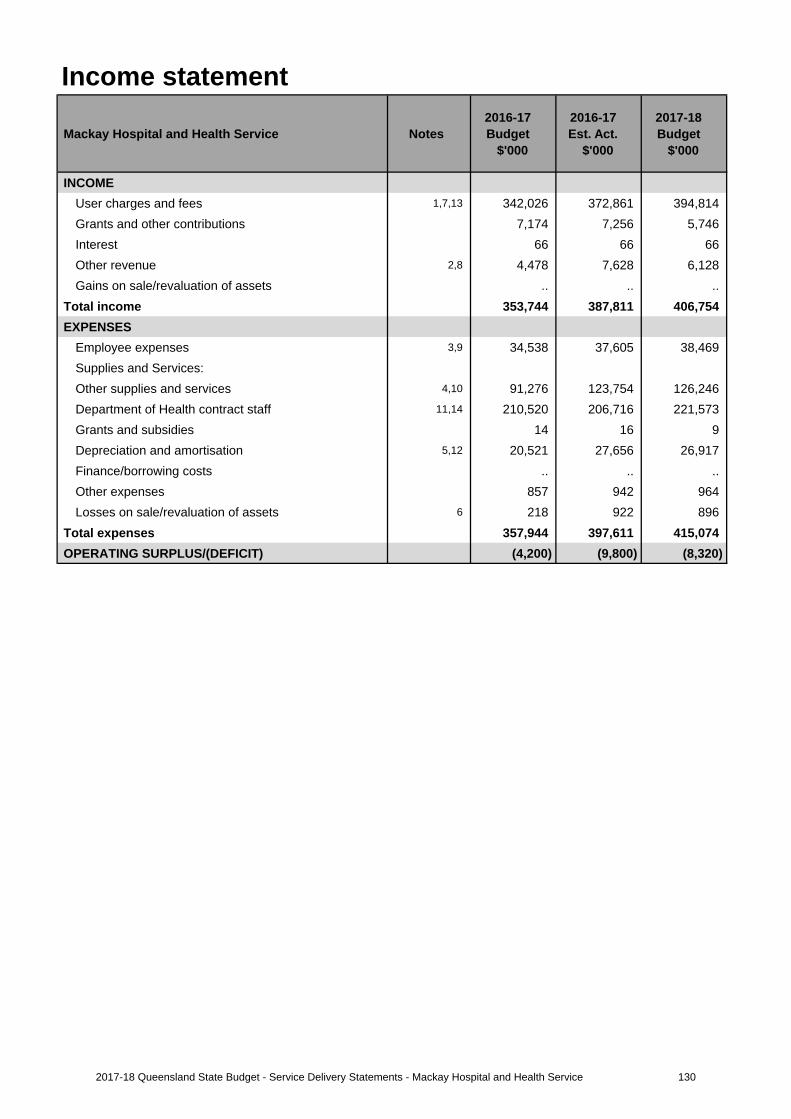
Income statement
Mackay Hospital and Health Service Notes 2016-17 Budget
$'000
2016-17 Est. Act.
$'000
2017-18 Budget
$'000
INCOMEUser charges and fees 1,7,13 342,026 372,861 394,814 Grants and other contributions 7,174 7,256 5,746 Interest 66 66 66Other revenue 2,8 4,478 7,628 6,128Gains on sale/revaluation of assets .. .. ..
Total income 353,744 387,811 406,754 EXPENSES
Employee expenses 3,9 34,538 37,605 38,469 Supplies and Services:Other supplies and services 4,10 91,276 123,754 126,246 Department of Health contract staff 11,14 210,520 206,716 221,573 Grants and subsidies 14 16 9 Depreciation and amortisation 5,12 20,521 27,656 26,917 Finance/borrowing costs .. .. ..Other expenses 857 942 964Losses on sale/revaluation of assets 6 218 922 896
Total expenses 357,944 397,611 415,074 OPERATING SURPLUS/(DEFICIT) (4,200) (9,800) (8,320)
1302017-18 Queensland State Budget - Service Delivery Statements - Mackay Hospital and Health Service

Balance sheet
Mackay Hospital and Health Service Notes 2016-17 Budget
$'000
2016-17 Est. Act.
$'000
2017-18 Budget
$'000
CURRENT ASSETSCash assets 15,22 54,125 48,397 38,951 Receivables 16,23 12,436 9,154 8,658Other financial assets .. .. .. Inventories 2,231 3,745 3,811Other 17 228 627 635Non-financial assets held for sale .. .. ..
Total current assets 69,020 61,923 52,055 NON-CURRENT ASSETS
Receivables .. .. ..Other financial assets .. .. .. Property, plant and equipment 18,24,27 476,010 407,465 411,851 Intangibles .. .. ..Other .. .. ..
Total non-current assets 476,010 407,465 411,851 TOTAL ASSETS 545,030 469,388 463,906 CURRENT LIABILITIES
Payables 19,25 12,531 15,347 16,505 Accrued employee benefits 20 717 1,153 1,276Interest bearing liabilities and derivatives .. .. .. Provisions .. .. ..Other .. 372 372
Total current liabilities 13,248 16,872 18,153 NON-CURRENT LIABILITIES
Payables .. .. ..Accrued employee benefits .. .. .. Interest bearing liabilities and derivatives .. .. .. Provisions .. .. ..Other .. .. ..
Total non-current liabilities .. .. .. TOTAL LIABILITIES 13,248 16,872 18,153 NET ASSETS/(LIABILITIES) 531,782 452,516 445,753 EQUITYTOTAL EQUITY 21,26,28 531,782 452,516 445,753
1312017-18 Queensland State Budget - Service Delivery Statements - Mackay Hospital and Health Service

Cash flow statement
Mackay Hospital and Health Service Notes 2016-17 Budget
$'000
2016-17 Est. Act.
$'000
2017-18 Budget
$'000
CASH FLOWS FROM OPERATING ACTIVITIESInflows:
User charges and fees 29,33 341,860 376,312 396,038 Grants and other contributions 7,174 7,256 5,746 Interest received 66 66 66Other 30,34,37 9,806 15,913 14,470
Outflows:Employee costs (34,538) (37,532) (38,346)Supplies and services 31,35 (306,391) (340,858) (355,512)Grants and subsidies (14) (16) (9)Borrowing costs .. .. ..Other (857) (1,473) (1,504)
Net cash provided by or used in operating activities 17,106 19,668 20,949 CASH FLOWS FROM INVESTING ACTIVITIESInflows:
Sales of non-financial assets .. (26) (26)Investments redeemed .. .. ..Loans and advances redeemed .. .. ..
Outflows:Payments for non-financial assets 38 (2,773) (7,342) (7,353)Payments for investments .. .. .. Loans and advances made .. .. ..
Net cash provided by or used in investing activities (2,773) (7,368) (7,379)CASH FLOWS FROM FINANCING ACTIVITIESInflows:
Borrowings .. .. ..Equity injections 39 2,773 2,968 3,901
Outflows:Borrowing redemptions .. .. ..Finance lease payments .. .. .. Equity withdrawals 32,36 (20,521) (27,656) (26,917)
Net cash provided by or used in financing activities (17,748) (24,688) (23,016)Net increase/(decrease) in cash held (3,415) (12,388) (9,446)Cash at the beginning of financial year 57,540 60,785 48,397
Cash transfers from restructure .. .. .. Cash at the end of financial year 54,125 48,397 38,951
1322017-18 Queensland State Budget - Service Delivery Statements - Mackay Hospital and Health Service
Income statementMajor variations between 2016-17 Budget and 2016-17 Estimated Actual include:
1. The increase from the 2016-17 Budget to the 2016-17 Estimated Actuals relates to additional funding provided through amendments to the Service Agreement between Mackay Hospital and Health Service (HHS) and the Department of Health. Additional funding is provided for increases in service activity, enterprise bargaining agreements and depreciation.
2. The increase from 2016-17 Budget to the 2016-17 Estimated Actuals relates to increases in recognition and receipting of recoverables e.g. Salary & wages and Salary & wages for WorkCover.
3. The increase from 2016-17 Budget to 2016-17 Estimated Actuals recognises those employees of the Mackay HHS. Owing to the increase in activity and relevant enterprise bargaining increases has seen the figure increase from the original Budget. Due to opening of new beds and the filling of senior medical officers vacant positions.
4. The Increase from the 2016-17 Budget to the 2016-17 Estimated Actuals is due mainly to the additional staff in contractors. The use of the contracted staff is for covering vacant positions whilst waiting for permanent staff to be appointed. Additional to this is the full-time equivalent (FTE) being used for special projects being funded out of surpluses from prior years. Contracted staff increase is also being used in projects (mainly the Digital Hospital) which are also funded out of surpluses from prior years. Additional to FTE increase will be increases in expenditure in Drugs, Clinical Supplies, Food, Other Supplies and Telecommunications due in part to the increase in activity and the projects.
5. The Increase from the 2016-17 Budget to the 2016-17 Estimated Actual 2016-17 is due to thecomponentisation of the major buildings throughout the Mackay HHS. Additional to this is building works being done utilising prior year surpluses as well as some accelerated depreciation to buildings in order to be replaced.
6. The increase from the 2016-17 Budget to the 2016-17 Estimated Actual relates to the revaluation of the land in Mackay HHS, which resulted in a decrement of $1.35 million.
Major variations between 2016-17 Budget and 2017-18 Budget include:
7. The increase from the 2016-17 Budget to the 2017-18 Budget relates to additional funding provided through the Service Agreement between Mackay HHS and the Department of Health. Additional funding is provided for increases in service activity, enterprise bargaining, block funded services, teaching, training and research funding and own source funding.
8. The increase from 2016-17 Budget to 2017-18 Budget relates to increases in recognition and receipting of recoverables e.g. Salary & wages and Salary & wages for WorkCover.
9. The increase from 2016-17 Budget to 2017-18 Budget recognises those employees of the Mackay HHS. Owing to the increase in activity and relevant enterprise bargaining increases has seen the figure increase from the original Budget. Due to opening of new beds and the filling of senior medical officers vacant positions.
10. The increase from the 2016-17 Budget to the 2017-18 Budget is due mainly to the additional staff in Contractors.The use of the contracted staff is for covering vacant positions whilst waiting for permanent staff to be appointed. Additional to this is the FTE being used for special projects being funded out of surpluses from prior years. Contracted staff increase is also being used in projects (mainly the Digital Hospital) which are also funded out of surpluses from prior years. Additional to FTE increase will be increases in expenditure in Drugs, Clinical Supplies, Food, Other Supplies and Telecommunications due in part to the increase in activity and the projects.
11. The increase from 2016-17 Budget to 2017-18 Budget is due to enterprise bargaining, additional 12 beds comingon line and increase in activity.
12. The Increase from the 2016-17 Budget to the 2017-18 Budget is due to the componentisation of the major buildings throughout Mackay HHS. Additional to this is buildings works being done utilising prior year surpluses as well as some accelerated depreciation to buildings in order to be replaced.
Explanation of variances in the financial statements
1332017-18 Queensland State Budget - Service Delivery Statements - Mackay Hospital and Health Service
Major variations between 2016-17 Estimated Actual and the 2017-18 Budget include:
13. The increase from the 2016-17 Estimated Actuals to the 2017-18 Budget relates to additional funding provided through the Service Agreement between Mackay HHS and the Department of Health. Additional funding is provided for increases in service activity, enterprise bargaining, block funded services, teaching, training and research funding and own source revenue.
14. The increase from 2016-17 Estimated Actuals to 2017-18 Budget is due to Enterprise Bargaining, additional 12 beds coming on line and increase in activity.
Balance sheetMajor variations between 2016-17 Budget and 2016-17 Estimated Actual include:
15. The decrease from the 2016-17 Budget to the 2016-17 Estimated Actual relates to the projected deficit for the 2016-17 Estimated Actual.
16. The decrease from the 2016-17 Budget to the 2016-17 Estimated Actuals. Current Receivables is due to a reduction in Accrued Funding Revenue. Due mainly to reduction in recoupment of expenditure against capital projects, these projects have since finished and reflect the impact in Estimated Actuals.
17. The increase from the 2016-17 Budget to the 2016-17 Estimated Actual relates to the recognition of inventories relating to imprest cupboards on the wards.
18. The decrease from the 2016-17 Budget to the 2016-17 Estimated Actuals relates to the completion of works across Mackay Hospital and Health Service (HHS). This will also recognise the decrement in the Land valuations which was noted in the Income Statement expenses.
19. The increase from the 2016-17 Budget to the 2016-17 Estimated Actual relates to the Payroll held prior to Department of Health recouping for the monthly period.
20. The increase from the 2016-17 Budget to the 2016-17 Estimated Actual relates to the increase in full-time equivalents (FTE) as highlighted in the Income Statement Note:3.
21. The decrease from the 2016-17 Budget to the 2016-17 Estimated Actuals relates to the recognition of a deficit position for 2016-17 based around projects utilising prior year surpluses.
Major variations between 2016-17 Budget and 2017-18 Budget include:
22. The decrease from the 2016-17 Budget to the 2017-18 Budget refers to the projected deficit for the financial year 2018.
23. The decrease from the 2016-17 Budget to the 2017-18 Budget in Current Receivables is due to a reduction in Accrued Funding Revenue. Due mainly to reduction in recoupment of expenditure against capital projects, these projects have since finished and reflect the impact in Estimated Actuals.
24. The decrease from the 2016-17 Budget relates to the 2017-18 Budget completion of works across Mackay HHS. This will also recognise the decrement in the Land valuations which was noted in the Income Statement expenses.
25. The increase from the 2016-17 Budget to the 2017-18 Budget relates to the Payroll held prior to Department of Health recouping for the monthly period.
26. The decrease from the 2016-17 Budget to the 2017-18 Budget relates to the recognition of a deficit position for 2017-18 based around projects utilising prior year surpluses.
Major variations between 2016-17 Estimated Actual and the 2017-18 Budget include:
27. The increase from the 2016-17 Estimated Actual to the 2017-18 Budget relates to the recognition of completed building works in 2016-17 and the result of the annual revaluation programme.
28. The decrease from the 2016-17 Estimated Actuals to the 2017-18 Budget relates to the recognition of a deficit position for 2017-18 based around projects utilising prior year surpluses.
1342017-18 Queensland State Budget - Service Delivery Statements - Mackay Hospital and Health Service
Cash flow statementMajor variations between 2016-17 Budget and 2016-17 Estimated Actual include:
29. The increase from the 2016-17 Budget to the 2016-17 Estimated Actuals relates to additional funding provided through amendments to the Service Agreement between Mackay Hospital and Health Service (HHS) and the Department of Health. Additional funding is provided for increases in service activity, enterprise bargaining agreements and depreciation.
30. The increase from 2016-17 Budget to the 2016-17 Estimated Actuals relates to increases in recognition and receipting of recoverables e.g. Salary & wages and Salary & wages for WorkCover.
31. The Increase from the 2016-17 Budget to the 2016-17 Estimated Actuals is due mainly to the additional staff both in contractors and QH contracted staff. The use on the contracted staff is for covering vacant positions whilst waiting of permanent staff to be appointed. Additional to this is the full-time equivalents (FTE) being used for special projects being funded out of prior year surpluses. This is also the reason for the QH contracted staff increase these are also being used in projects (mainly the Digital Hospital) which are also funded out of prior year surpluses. Additional to FTE increase will be increases in expenditure in Drugs, Clinical Supplies, Food, Other Supplies and Telecommunications.
32. The increase from 2016-17 Budget to 2016-17 Estimated Actuals in equity withdrawals relates to the increase indepreciation. As stated in Notes 5, 12 and 14.
Major variations between 2016-17 Budget and 2017-18 Budget include:
33. The increase from the 2016-17 Budget to the 2017-18 Budget relates to additional funding provided through amendments to the Service Agreement between Mackay HHS and the Department of Health. Additional funding is provided for increases in service activity, enterprise bargaining agreements, depreciation revenue and Own Source Revenue.
34. The increase from 2016-17 Budget to the 2017-18 Budget relates to increases in recognition and receipting of recoverables e.g. Salary & wages and Salary & wages for WorkCover.
35. The Increase from the 2016-17 Budget to the 2017-18 Budget relates to the additional staff both in contractors and QH contracted staff. The use on the contracted staff is for covering vacant positions whilst waiting of permanent staff to be appointed. Additional to this is the FTE being used for special projects being funded out of prior year surpluses. This is also the reason for the QH contracted staff increase these are also being used in projects (mainly the Digital Hospital) which are also funded out of prior year surpluses. Additional to FTE increase will be increases in expenditure in Drugs, Clinical Supplies, Food, Other Supplies and Telecommunications.
36. The increase from 2016-17 Budget to 2017-18 Budget in equity withdrawals relates to the increase in depreciation. As stated in Notes 5, 12 and 14.
Major variations between 2016-17 Estimated Actual and the 2017-18 Budget include:
37. The increase from 2016-17 Estimated Actuals to 2017-18 Budget relates to increases in recognition and receipting of recoverable e.g. Salary & wages and Salary & wages for WorkCover.
38. The increase from 2016-17 Estimated Actual to 2017-18 Budget relates to additional Health Technology Equipment Replacement Program
39. The increase from 2016-17 Estimated Actuals to 2017-18 Budget relates to the increase in the commissioning of assets to be transferred from the Department of Health to Mackay HHS via contributed equity.
1352017-18 Queensland State Budget - Service Delivery Statements - Mackay Hospital and Health Service
Metro North Hospital and Health Service
Overview The Metro North Hospital and Health Service (HHS) is one of the largest hospital and health services, with a major clinical and research campus in Herston, on the northern CBD fringe of Brisbane. Metro North HHS operates the Royal Brisbane and Women’s Hospital, the Prince Charles Hospital, Redcliffe Hospital, Caboolture Hospital, Kilcoy Hospital, as well as the Brighton Health Campus, and a range of subacute, mental health, community health and oral health facilities. Metro North HHS also provides offender health services to the Woodford Correctional Centre.
With annual revenues approaching $2.7 billion and 15,750 staff, Metro North HHS is responsible for the delivery of public hospitals and health services including medical, surgical, emergency, obstetrics, paediatrics, specialist outpatient clinics, mental health, critical care and clinical support services to a catchment population of 957,590 people residing in a geographic area extending from the Brisbane River to north of Kilcoy, as well as a range of regional and statewide services.
Metro North HHS’s vision is to change the face of health care through compassion, commitment, innovation and connection. This renewed vision will enable the HHS to focus on key risks set to impact our HHS including growth in service demand, an ageing population, workforce capability and capacity, quality and safety, healthcare fragmentation, community confidence and asset management and renewal. The Metro North HHS strategic objectives are:
• always putting people first• improving health equity, access, quality, safety and health outcomes• delivering value based health services through a culture of research, education, learning and innovation.
These strategic objectives contribute to the Queensland Government’s objectives of delivering quality frontline services and Queensland Health’s strategic direction to improve access to quality and safe healthcare in its different form and settings. To achieve these objectives, MNHHS will employ a range of strategies including:
• listening to the voice of patients and their carers and families to improve the patient experience• listening to staff and partners and involving them in organisational development, governance and decision making• leading integration, coordination and continuity of services across and within primary, community and hospital care• creating system capacity• generating new knowledge through research, evaluating what others have learnt and actively bring this knowledge
into practice• creating an environment that promotes innovative approaches to support our people in continuous improvement and
organisational learning• working with our partners to ensure an appropriate balance in health investment between prevention, management
and treatment of disease• providing models of service delivery that are fiscally responsible.
Metro North HHS will prioritise new initiatives across a range of areas including improving care for our older and frail patients. We will continue initiatives in our management of patients with chronic diseases, children and women’s health and mental health.
1362017-18 Queensland State Budget - Service Delivery Statements - Metro North Hospital and Health Service
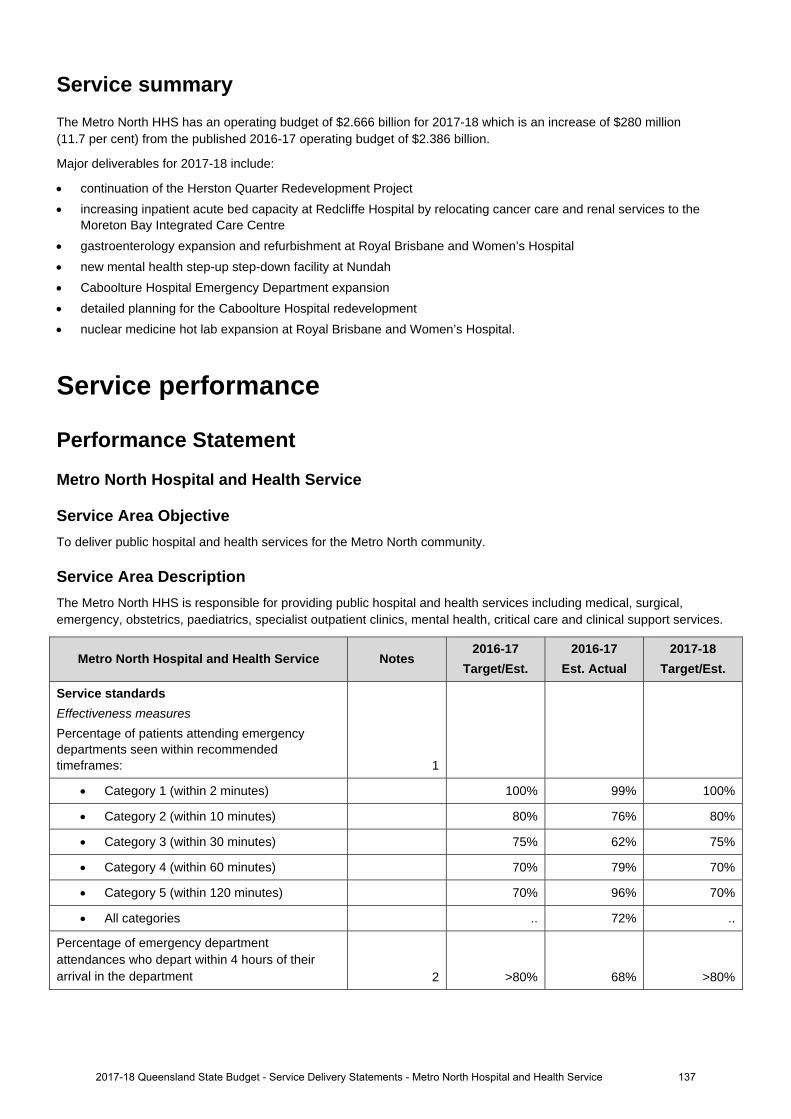
Service summary The Metro North HHS has an operating budget of $2.666 billion for 2017-18 which is an increase of $280 million (11.7 per cent) from the published 2016-17 operating budget of $2.386 billion.
Major deliverables for 2017-18 include:
continuation of the Herston Quarter Redevelopment Project increasing inpatient acute bed capacity at Redcliffe Hospital by relocating cancer care and renal services to the
Moreton Bay Integrated Care Centre gastroenterology expansion and refurbishment at Royal Brisbane and Women’s Hospital new mental health step-up step-down facility at Nundah Caboolture Hospital Emergency Department expansion detailed planning for the Caboolture Hospital redevelopment nuclear medicine hot lab expansion at Royal Brisbane and Women’s Hospital.
Service performance
Performance Statement
Metro North Hospital and Health Service
Service Area Objective To deliver public hospital and health services for the Metro North community.
Service Area Description The Metro North HHS is responsible for providing public hospital and health services including medical, surgical, emergency, obstetrics, paediatrics, specialist outpatient clinics, mental health, critical care and clinical support services.
Metro North Hospital and Health Service Notes 2016-17
Target/Est. 2016-17
Est. Actual 2017-18
Target/Est.
Service standards Effectiveness measures
Percentage of patients attending emergency departments seen within recommended timeframes:
1
Category 1 (within 2 minutes) 100% 99% 100%
Category 2 (within 10 minutes) 80% 76% 80%
Category 3 (within 30 minutes) 75% 62% 75%
Category 4 (within 60 minutes) 70% 79% 70%
Category 5 (within 120 minutes) 70% 96% 70%
All categories .. 72% ..
Percentage of emergency department attendances who depart within 4 hours of their arrival in the department 2 >80% 68% >80%
2017-18 Queensland State Budget - Service Delivery Statements - Metro North Hospital and Health Service 137
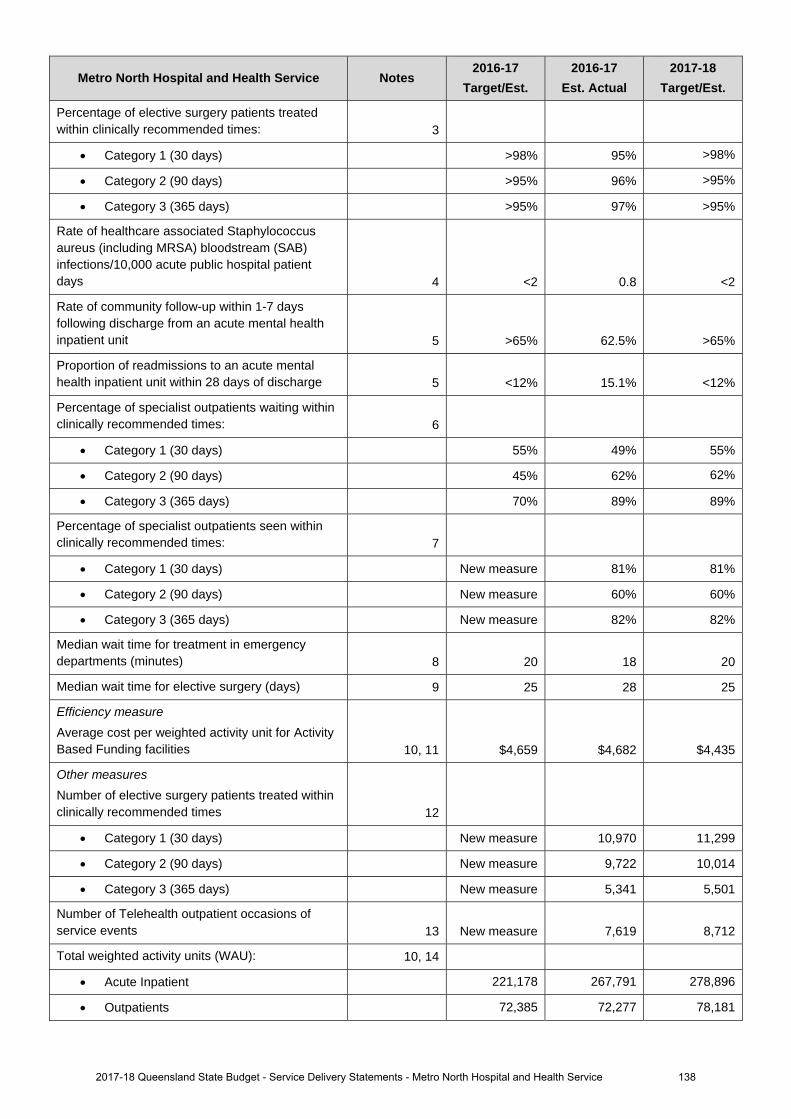
Metro North Hospital and Health Service Notes 2016-17
Target/Est. 2016-17
Est. Actual 2017-18
Target/Est.
Percentage of elective surgery patients treated within clinically recommended times: 3
Category 1 (30 days) >98% 95% >98%
Category 2 (90 days) >95% 96% >95%
Category 3 (365 days) >95% 97% >95%
Rate of healthcare associated Staphylococcus aureus (including MRSA) bloodstream (SAB) infections/10,000 acute public hospital patient days 4 <2 0.8 <2
Rate of community follow-up within 1-7 days following discharge from an acute mental health inpatient unit 5 >65% 62.5% >65%
Proportion of readmissions to an acute mental health inpatient unit within 28 days of discharge 5 <12% 15.1% <12%
Percentage of specialist outpatients waiting within clinically recommended times: 6
Category 1 (30 days) 55% 49% 55%
Category 2 (90 days) 45% 62% 62%
Category 3 (365 days) 70% 89% 89%
Percentage of specialist outpatients seen within clinically recommended times: 7
Category 1 (30 days) New measure 81% 81%
Category 2 (90 days) New measure 60% 60%
Category 3 (365 days) New measure 82% 82%
Median wait time for treatment in emergency departments (minutes) 8 20 18 20
Median wait time for elective surgery (days) 9 25 28 25
Efficiency measure
Average cost per weighted activity unit for Activity Based Funding facilities 10, 11 $4,659 $4,682 $4,435
Other measures
Number of elective surgery patients treated within clinically recommended times 12
Category 1 (30 days) New measure 10,970 11,299
Category 2 (90 days) New measure 9,722 10,014
Category 3 (365 days) New measure 5,341 5,501
Number of Telehealth outpatient occasions of service events 13 New measure 7,619 8,712
Total weighted activity units (WAU): 10, 14
Acute Inpatient 221,178 267,791 278,896
Outpatients 72,385 72,277 78,181
2017-18 Queensland State Budget - Service Delivery Statements - Metro North Hospital and Health Service 138
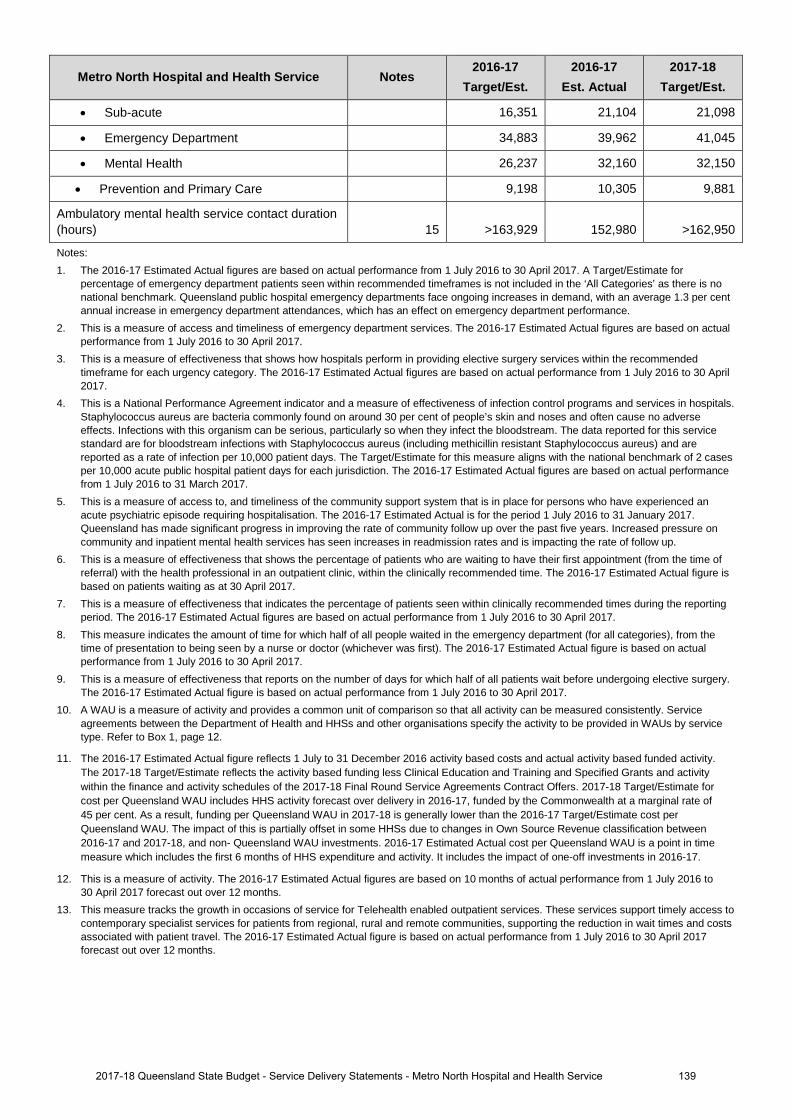
Metro North Hospital and Health Service Notes 2016-17
Target/Est. 2016-17
Est. Actual 2017-18
Target/Est.
• Sub-acute 16,351 21,104 21,098
• Emergency Department 34,883 39,962 41,045
• Mental Health 26,237 32,160 32,150
• Prevention and Primary Care 9,198 10,305 9,881
Ambulatory mental health service contact duration (hours) 15 >163,929 152,980 >162,950
Notes: 1. The 2016-17 Estimated Actual figures are based on actual performance from 1 July 2016 to 30 April 2017. A Target/Estimate for
percentage of emergency department patients seen within recommended timeframes is not included in the ‘All Categories’ as there is no national benchmark. Queensland public hospital emergency departments face ongoing increases in demand, with an average 1.3 per cent annual increase in emergency department attendances, which has an effect on emergency department performance.
2. This is a measure of access and timeliness of emergency department services. The 2016-17 Estimated Actual figures are based on actual performance from 1 July 2016 to 30 April 2017.
3. This is a measure of effectiveness that shows how hospitals perform in providing elective surgery services within the recommended timeframe for each urgency category. The 2016-17 Estimated Actual figures are based on actual performance from 1 July 2016 to 30 April 2017.
4. This is a National Performance Agreement indicator and a measure of effectiveness of infection control programs and services in hospitals. Staphylococcus aureus are bacteria commonly found on around 30 per cent of people’s skin and noses and often cause no adverse effects. Infections with this organism can be serious, particularly so when they infect the bloodstream. The data reported for this service standard are for bloodstream infections with Staphylococcus aureus (including methicillin resistant Staphylococcus aureus) and are reported as a rate of infection per 10,000 patient days. The Target/Estimate for this measure aligns with the national benchmark of 2 cases per 10,000 acute public hospital patient days for each jurisdiction. The 2016-17 Estimated Actual figures are based on actual performance from 1 July 2016 to 31 March 2017.
5. This is a measure of access to, and timeliness of the community support system that is in place for persons who have experienced an acute psychiatric episode requiring hospitalisation. The 2016-17 Estimated Actual is for the period 1 July 2016 to 31 January 2017. Queensland has made significant progress in improving the rate of community follow up over the past five years. Increased pressure on community and inpatient mental health services has seen increases in readmission rates and is impacting the rate of follow up.
6. This is a measure of effectiveness that shows the percentage of patients who are waiting to have their first appointment (from the time of referral) with the health professional in an outpatient clinic, within the clinically recommended time. The 2016-17 Estimated Actual figure is based on patients waiting as at 30 April 2017.
7. This is a measure of effectiveness that indicates the percentage of patients seen within clinically recommended times during the reporting period. The 2016-17 Estimated Actual figures are based on actual performance from 1 July 2016 to 30 April 2017.
8. This measure indicates the amount of time for which half of all people waited in the emergency department (for all categories), from the time of presentation to being seen by a nurse or doctor (whichever was first). The 2016-17 Estimated Actual figure is based on actual performance from 1 July 2016 to 30 April 2017.
9. This is a measure of effectiveness that reports on the number of days for which half of all patients wait before undergoing elective surgery. The 2016-17 Estimated Actual figure is based on actual performance from 1 July 2016 to 30 April 2017.
10. A WAU is a measure of activity and provides a common unit of comparison so that all activity can be measured consistently. Service agreements between the Department of Health and HHSs and other organisations specify the activity to be provided in WAUs by service type. Refer to Box 1, page 12.
11. The 2016-17 Estimated Actual figure reflects 1 July to 31 December 2016 activity based costs and actual activity based funded activity. The 2017-18 Target/Estimate reflects the activity based funding less Clinical Education and Training and Specified Grants and activity within the finance and activity schedules of the 2017-18 Final Round Service Agreements Contract Offers. 2017-18 Target/Estimate for cost per Queensland WAU includes HHS activity forecast over delivery in 2016-17, funded by the Commonwealth at a marginal rate of 45 per cent. As a result, funding per Queensland WAU in 2017-18 is generally lower than the 2016-17 Target/Estimate cost per Queensland WAU. The impact of this is partially offset in some HHSs due to changes in Own Source Revenue classification between 2016-17 and 2017-18, and non- Queensland WAU investments. 2016-17 Estimated Actual cost per Queensland WAU is a point in time measure which includes the first 6 months of HHS expenditure and activity. It includes the impact of one-off investments in 2016-17.
12. This is a measure of activity. The 2016-17 Estimated Actual figures are based on 10 months of actual performance from 1 July 2016 to 30 April 2017 forecast out over 12 months.
13. This measure tracks the growth in occasions of service for Telehealth enabled outpatient services. These services support timely access to contemporary specialist services for patients from regional, rural and remote communities, supporting the reduction in wait times and costs associated with patient travel. The 2016-17 Estimated Actual figure is based on actual performance from 1 July 2016 to 30 April 2017 forecast out over 12 months.
1392017-18 Queensland State Budget - Service Delivery Statements - Metro North Hospital and Health Service
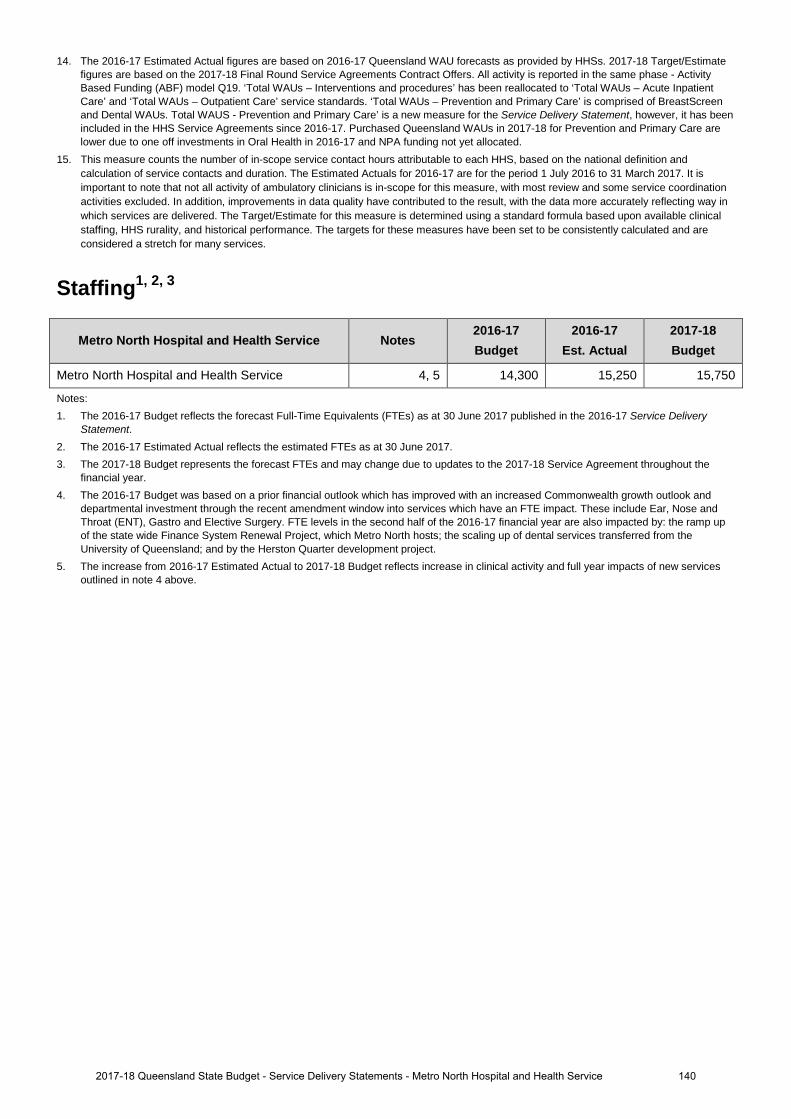
14. The 2016-17 Estimated Actual figures are based on 2016-17 Queensland WAU forecasts as provided by HHSs. 2017-18 Target/Estimate figures are based on the 2017-18 Final Round Service Agreements Contract Offers. All activity is reported in the same phase - Activity Based Funding (ABF) model Q19. ‘Total WAUs – Interventions and procedures’ has been reallocated to ‘Total WAUs – Acute Inpatient Care’ and ‘Total WAUs – Outpatient Care’ service standards. ‘Total WAUs – Prevention and Primary Care’ is comprised of BreastScreen and Dental WAUs. Total WAUS - Prevention and Primary Care’ is a new measure for the Service Delivery Statement, however, it has been included in the HHS Service Agreements since 2016-17. Purchased Queensland WAUs in 2017-18 for Prevention and Primary Care are lower due to one off investments in Oral Health in 2016-17 and NPA funding not yet allocated.
15. This measure counts the number of in-scope service contact hours attributable to each HHS, based on the national definition and calculation of service contacts and duration. The Estimated Actuals for 2016-17 are for the period 1 July 2016 to 31 March 2017. It is important to note that not all activity of ambulatory clinicians is in-scope for this measure, with most review and some service coordination activities excluded. In addition, improvements in data quality have contributed to the result, with the data more accurately reflecting way in which services are delivered. The Target/Estimate for this measure is determined using a standard formula based upon available clinical staffing, HHS rurality, and historical performance. The targets for these measures have been set to be consistently calculated and are considered a stretch for many services.
Staffing1, 2, 3
Metro North Hospital and Health Service Notes 2016-17 Budget
2016-17 Est. Actual
2017-18 Budget
Metro North Hospital and Health Service 4, 5 14,300 15,250 15,750
Notes: 1. The 2016-17 Budget reflects the forecast Full-Time Equivalents (FTEs) as at 30 June 2017 published in the 2016-17 Service Delivery
Statement. 2. The 2016-17 Estimated Actual reflects the estimated FTEs as at 30 June 2017. 3. The 2017-18 Budget represents the forecast FTEs and may change due to updates to the 2017-18 Service Agreement throughout the
financial year. 4. The 2016-17 Budget was based on a prior financial outlook which has improved with an increased Commonwealth growth outlook and
departmental investment through the recent amendment window into services which have an FTE impact. These include Ear, Nose and Throat (ENT), Gastro and Elective Surgery. FTE levels in the second half of the 2016-17 financial year are also impacted by: the ramp up of the state wide Finance System Renewal Project, which Metro North hosts; the scaling up of dental services transferred from the University of Queensland; and by the Herston Quarter development project.
5. The increase from 2016-17 Estimated Actual to 2017-18 Budget reflects increase in clinical activity and full year impacts of new services outlined in note 4 above.
1402017-18 Queensland State Budget - Service Delivery Statements - Metro North Hospital and Health Service
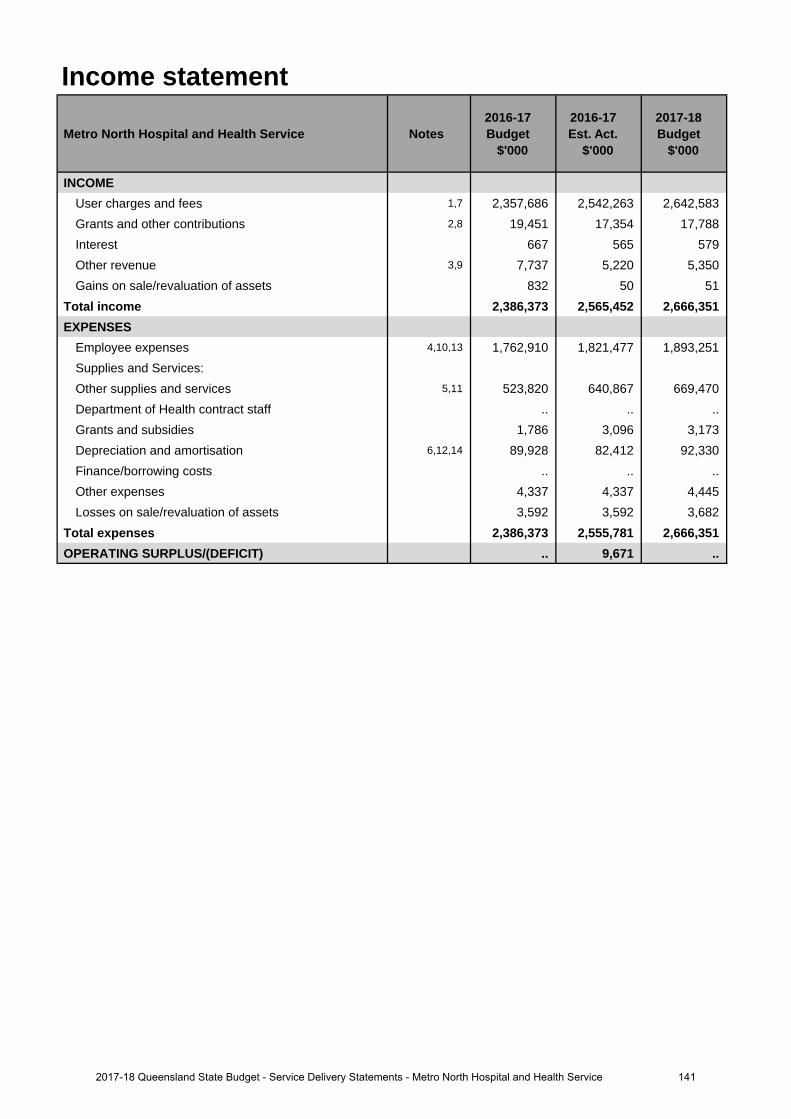
Income statement
Metro North Hospital and Health Service Notes 2016-17 Budget
$'000
2016-17 Est. Act.
$'000
2017-18 Budget
$'000
INCOMEUser charges and fees 1,7 2,357,686 2,542,263 2,642,583 Grants and other contributions 2,8 19,451 17,354 17,788 Interest 667 565 579 Other revenue 3,9 7,737 5,220 5,350 Gains on sale/revaluation of assets 832 50 51
Total income 2,386,373 2,565,452 2,666,351 EXPENSES
Employee expenses 4,10,13 1,762,910 1,821,477 1,893,251 Supplies and Services:Other supplies and services 5,11 523,820 640,867 669,470 Department of Health contract staff .. .. .. Grants and subsidies 1,786 3,096 3,173 Depreciation and amortisation 6,12,14 89,928 82,412 92,330 Finance/borrowing costs .. .. .. Other expenses 4,337 4,337 4,445 Losses on sale/revaluation of assets 3,592 3,592 3,682
Total expenses 2,386,373 2,555,781 2,666,351 OPERATING SURPLUS/(DEFICIT) .. 9,671 ..
1412017-18 Queensland State Budget - Service Delivery Statements - Metro North Hospital and Health Service
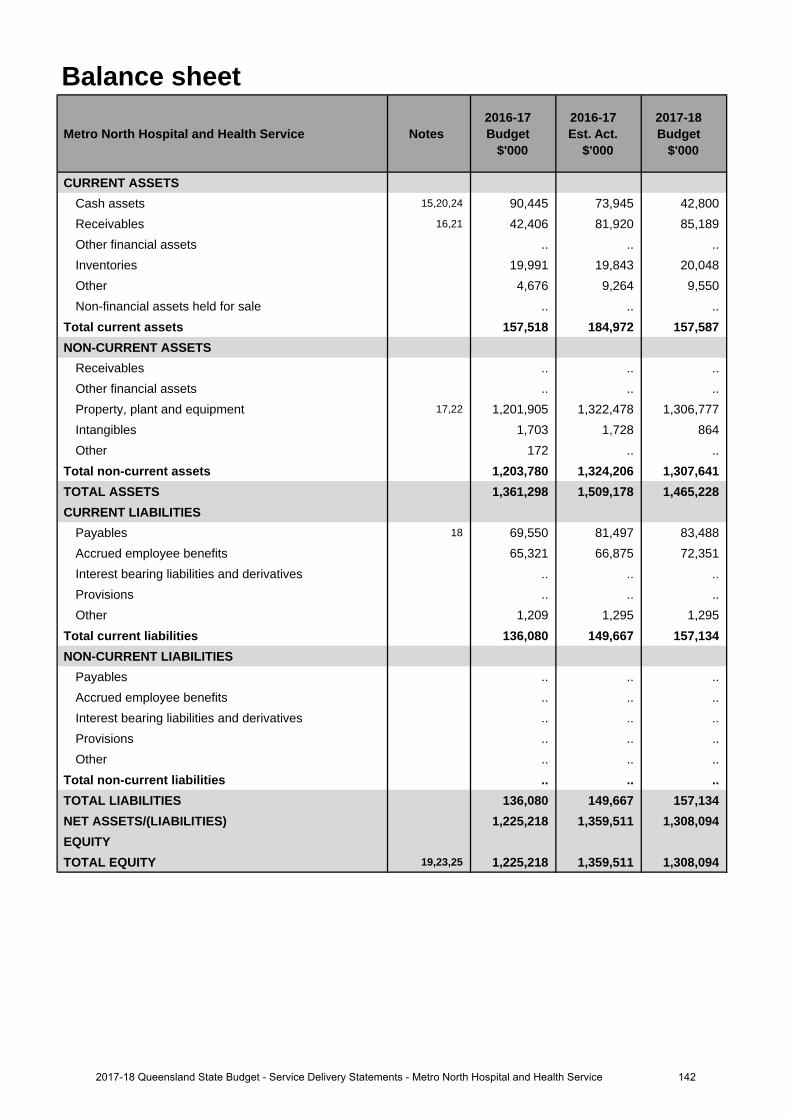
Balance sheet
Metro North Hospital and Health Service Notes 2016-17 Budget
$'000
2016-17 Est. Act.
$'000
2017-18 Budget
$'000
CURRENT ASSETSCash assets 15,20,24 90,445 73,945 42,800 Receivables 16,21 42,406 81,920 85,189 Other financial assets .. .. .. Inventories 19,991 19,843 20,048 Other 4,676 9,264 9,550 Non-financial assets held for sale .. .. ..
Total current assets 157,518 184,972 157,587 NON-CURRENT ASSETS
Receivables .. .. .. Other financial assets .. .. .. Property, plant and equipment 17,22 1,201,905 1,322,478 1,306,777 Intangibles 1,703 1,728 864 Other 172 .. ..
Total non-current assets 1,203,780 1,324,206 1,307,641 TOTAL ASSETS 1,361,298 1,509,178 1,465,228 CURRENT LIABILITIES
Payables 18 69,550 81,497 83,488 Accrued employee benefits 65,321 66,875 72,351 Interest bearing liabilities and derivatives .. .. .. Provisions .. .. .. Other 1,209 1,295 1,295
Total current liabilities 136,080 149,667 157,134 NON-CURRENT LIABILITIES
Payables .. .. .. Accrued employee benefits .. .. .. Interest bearing liabilities and derivatives .. .. .. Provisions .. .. .. Other .. .. ..
Total non-current liabilities .. .. .. TOTAL LIABILITIES 136,080 149,667 157,134 NET ASSETS/(LIABILITIES) 1,225,218 1,359,511 1,308,094 EQUITYTOTAL EQUITY 19,23,25 1,225,218 1,359,511 1,308,094
1422017-18 Queensland State Budget - Service Delivery Statements - Metro North Hospital and Health Service

Cash flow statement
Metro North Hospital and Health Service Notes 2016-17 Budget
$'000
2016-17 Est. Act.
$'000
2017-18 Budget
$'000
CASH FLOWS FROM OPERATING ACTIVITIESInflows:
User charges and fees 26,31 2,352,684 2,575,507 2,635,658 Grants and other contributions 27,32 19,451 17,354 17,788 Interest received 667 565 579 Other 47,460 44,943 45,073
Outflows:Employee costs 28,33,37 (1,757,668) (1,816,235) (1,887,775)Supplies and services 29,34,38 (564,601) (675,379) (707,719)Grants and subsidies (1,786) (3,096) (3,173)Borrowing costs .. .. .. Other (4,337) (4,337) (4,445)
Net cash provided by or used in operating activities 91,870 139,322 95,986 CASH FLOWS FROM INVESTING ACTIVITIESInflows:
Sales of non-financial assets 832 50 51 Investments redeemed .. .. .. Loans and advances redeemed .. .. ..
Outflows:Payments for non-financial assets 30,35,39 (68,989) (83,356) (69,993)Payments for investments .. .. .. Loans and advances made .. .. ..
Net cash provided by or used in investing activities (68,157) (83,306) (69,942)CASH FLOWS FROM FINANCING ACTIVITIESInflows:
Borrowings .. .. .. Equity injections 36,40 23,144 27,292 35,141
Outflows:Borrowing redemptions .. .. .. Finance lease payments .. .. .. Equity withdrawals 41 (82,412) (82,412) (92,330)
Net cash provided by or used in financing activities (59,268) (55,120) (57,189)Net increase/(decrease) in cash held (35,555) 896 (31,145)Cash at the beginning of financial year 126,000 73,049 73,945
Cash transfers from restructure .. .. .. Cash at the end of financial year 90,445 73,945 42,800
1432017-18 Queensland State Budget - Service Delivery Statements - Metro North Hospital and Health Service
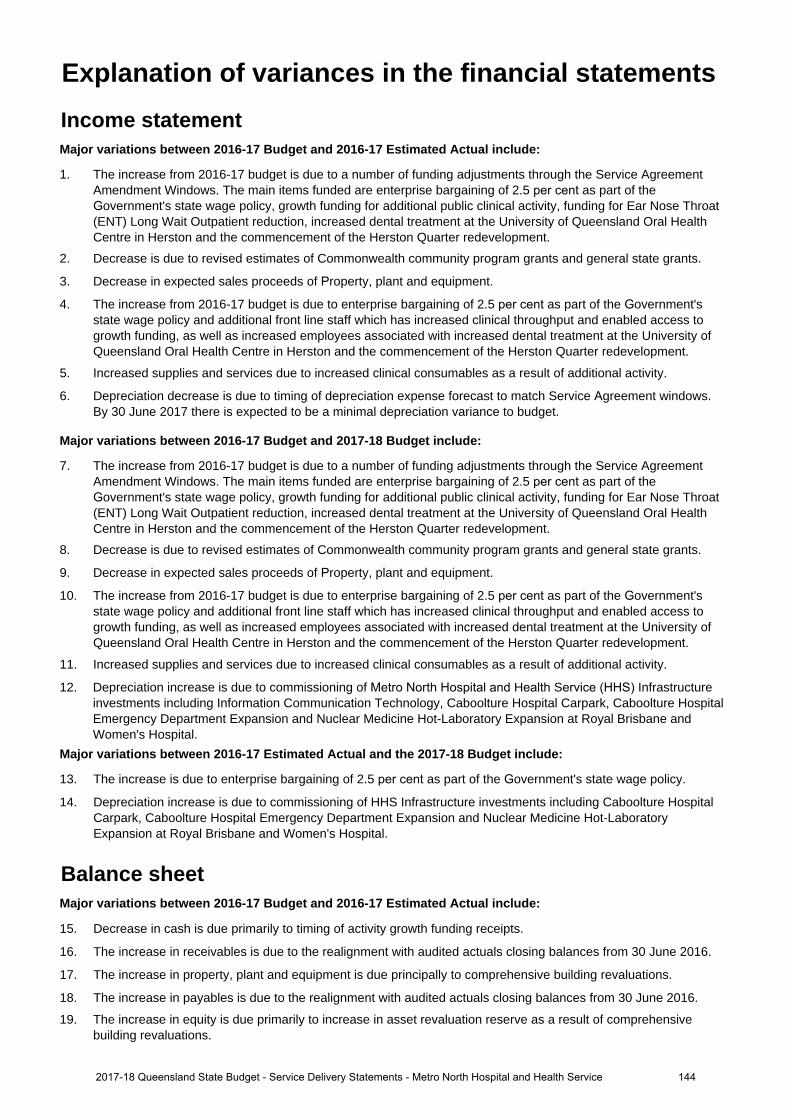
Income statementMajor variations between 2016-17 Budget and 2016-17 Estimated Actual include:
1. The increase from 2016-17 budget is due to a number of funding adjustments through the Service Agreement Amendment Windows. The main items funded are enterprise bargaining of 2.5 per cent as part of the Government's state wage policy, growth funding for additional public clinical activity, funding for Ear Nose Throat (ENT) Long Wait Outpatient reduction, increased dental treatment at the University of Queensland Oral Health Centre in Herston and the commencement of the Herston Quarter redevelopment.
2. Decrease is due to revised estimates of Commonwealth community program grants and general state grants.
3. Decrease in expected sales proceeds of Property, plant and equipment.
4. The increase from 2016-17 budget is due to enterprise bargaining of 2.5 per cent as part of the Government's state wage policy and additional front line staff which has increased clinical throughput and enabled access to growth funding, as well as increased employees associated with increased dental treatment at the University of Queensland Oral Health Centre in Herston and the commencement of the Herston Quarter redevelopment.
5. Increased supplies and services due to increased clinical consumables as a result of additional activity.
6. Depreciation decrease is due to timing of depreciation expense forecast to match Service Agreement windows. By 30 June 2017 there is expected to be a minimal depreciation variance to budget.
Major variations between 2016-17 Budget and 2017-18 Budget include:
7. The increase from 2016-17 budget is due to a number of funding adjustments through the Service Agreement Amendment Windows. The main items funded are enterprise bargaining of 2.5 per cent as part of the Government's state wage policy, growth funding for additional public clinical activity, funding for Ear Nose Throat (ENT) Long Wait Outpatient reduction, increased dental treatment at the University of Queensland Oral Health Centre in Herston and the commencement of the Herston Quarter redevelopment.
8. Decrease is due to revised estimates of Commonwealth community program grants and general state grants.
9. Decrease in expected sales proceeds of Property, plant and equipment.
10. The increase from 2016-17 budget is due to enterprise bargaining of 2.5 per cent as part of the Government's state wage policy and additional front line staff which has increased clinical throughput and enabled access to growth funding, as well as increased employees associated with increased dental treatment at the University of Queensland Oral Health Centre in Herston and the commencement of the Herston Quarter redevelopment.
11. Increased supplies and services due to increased clinical consumables as a result of additional activity.
12. Depreciation increase is due to commissioning of Metro North Hospital and Health Service (HHS) Infrastructure investments including Information Communication Technology, Caboolture Hospital Carpark, Caboolture Hospital Emergency Department Expansion and Nuclear Medicine Hot-Laboratory Expansion at Royal Brisbane and Women's Hospital.
Major variations between 2016-17 Estimated Actual and the 2017-18 Budget include:
13. The increase is due to enterprise bargaining of 2.5 per cent as part of the Government's state wage policy.
14. Depreciation increase is due to commissioning of HHS Infrastructure investments including Caboolture Hospital Carpark, Caboolture Hospital Emergency Department Expansion and Nuclear Medicine Hot-Laboratory Expansion at Royal Brisbane and Women's Hospital.
Balance sheetMajor variations between 2016-17 Budget and 2016-17 Estimated Actual include:
15. Decrease in cash is due primarily to timing of activity growth funding receipts.
16. The increase in receivables is due to the realignment with audited actuals closing balances from 30 June 2016.
17. The increase in property, plant and equipment is due principally to comprehensive building revaluations.
18. The increase in payables is due to the realignment with audited actuals closing balances from 30 June 2016.
19. The increase in equity is due primarily to increase in asset revaluation reserve as a result of comprehensivebuilding revaluations.
Explanation of variances in the financial statements
1442017-18 Queensland State Budget - Service Delivery Statements - Metro North Hospital and Health Service
Major variations between 2016-17 Budget and 2017-18 Budget include:
20. The decrease in cash is due to HHS Infrastructure investments including Nuclear Medicine Hot-LaboratoryExpansion at Royal Brisbane and Women's Hospital and flow through of audited actuals closing balance at30 June 2016.
21. The increase in receivables is due to the realignment with audited actuals closing balances from 30 June 2016.
22. The increase in property, plant and equipment is due to a combination of comprehensive building revaluations,additional Investments from the Queensland Priority Capital Program and new MN Investments including NuclearMedicine Hot-Laboratory Expansion at Royal Brisbane and Women's Hospital.
23. The increase in equity is due primarily to increase in asset revaluation reserve as a result of comprehensivebuilding revaluations.
Major variations between 2016-17 Estimated Actual and the 2017-18 Budget include:
24. The decrease in cash is due to HHS Infrastructure investments including Information Communication Technologyand Nuclear Medicine Hot-Laboratory Expansion at Royal Brisbane and Women's Hospital.
25. The decrease in equity relates to equity withdrawal of depreciation funding to the department exceeding the valueof investment funding provided by the department.
Cash flow statementMajor variations between 2016-17 Budget and 2016-17 Estimated Actual include:
26. The increase from 2016-17 budget is due to a number of funding adjustments through the Service Agreement Amendment Windows. The main items funded are enterprise bargaining of 2.5 per cent as part of the Government's state wage policy, growth funding for additional public clinical activity, funding for Ear Nose Throat (ENT) Long Wait Outpatient reduction, increased dental treatment at the University of Queensland Oral Health Centre in Herston and the commencement of the Herston Quarter redevelopment.
27. Decrease is due to revised estimates of Commonwealth community program grants and general state grants.
28. The increase from 2016-17 budget is due to enterprise bargaining of 2.5 per cent as part of the Government's state wage policy and additional front line staff which has increased clinical throughput and enabled access to growth funding; as well as increased employees associated with increased dental treatment at the University of Queensland Oral Health Centre in Herston and the commencement of the Herston Quarter redevelopment.
29. Increased supplies and services due to increased clinical consumables as a result of additional activity.
30. The increase is due to additional investment in the Health Technology Equipment Replacement program and newHHS investments including Nuclear Medicine Hot-Laboratory Expansion and Ashworth House Refurbishment.
Major variations between 2016-17 Budget and 2017-18 Budget include:
31. The increase from 2016-17 budget is due to a number of funding adjustments through the Service Agreement Amendment Windows. The main items funded are enterprise bargaining of 2.5 per cent as part of the Government's state wage policy, growth funding for additional public clinical activity, funding for Ear Nose Throat (ENT) Long Wait Outpatient reduction, increased dental treatment at the University of Queensland Oral Health Centre in Herston and the commencement of the Herston Quarter redevelopment.
32. Decrease is due to revised estimates of Commonwealth community program grants and general state grants.
33. The increase from 2016-17 budget is due to enterprise bargaining of 2.5 per cent as part of the Government's state wage policy and additional front line staff which has increased clinical throughput and enabled access to growth funding; as well as increased employees associated with increased dental treatment at the University of Queensland Oral Health Centre in Herston and the commencement of the Herston Quarter redevelopment.
34. Increased supplies and services due to increased clinical consumables as a result of additional activity.
35. The increase is due to new HHS Investments including Nuclear Medicine Hot-Laboratory Expansion at RoyalBrisbane and Women's Hospital and Ashworth House Refurbishment.
36. The increase is due to additional funding for the Health Technology Equipment Replacement Program.
1452017-18 Queensland State Budget - Service Delivery Statements - Metro North Hospital and Health Service
Major variations between 2016-17 Estimated Actual and the 2017-18 Budget include:
37. The increase is for enterprise bargaining of 2.5 per cent as part of the Government's state wage policy.
38. Increased supplies and services due to increased clinical consumables as a result of additional activity.
39. Decrease is a result of the majority of spend on HHS Funded Initiatives due to be completed in 2016-17principally, Caboolture Demountable and Caboolture 32 Bed ward.
40. The increase is due to additional funding for the Health Technology Equipment Replacement Program.
41. Increase due to increase in depreciation funding which is returned as an equity withdrawal to the department.
1462017-18 Queensland State Budget - Service Delivery Statements - Metro North Hospital and Health Service
Metro South Hospital and Health Service
Overview The Metro South Hospital and Health Service (HHS) is an independent statutory body overseen by a local Hospital and Health Board. Metro South is the most populated HHS in Queensland with a resident population of over one million people. Metro South HHS covers 3,856 square kilometres and includes Brisbane City south of the Brisbane River, Redland City, Logan City, Beaudesert and the eastern portion of the Scenic Rim. The Metro South HHS operates the following facilities
• Princess Alexandra Hospital • Queen Elizabeth II Jubilee (QEII) Hospital
• Beaudesert Hospital • Redland Hospital
• Logan Hospital • Wynnum Health Service
• North Stradbroke Island emergency clinic
It also comprises a number of residential care facilities, community health centres, mental health and oral health services, as well as outreach and home visiting services.
Metro South HHS’s vision is to be renowned worldwide for excellence in health care, teaching and research. Our purpose is to deliver high quality health care through innovation and evidence-based strategies, enabled by the efficient use of available resources, robust planning processes and stakeholder collaboration.
Metro South HHS delivers a full suite of specialties from nine clinical streams — Addiction and Mental Health Services, Aged Care and Rehabilitation Services, Cancer Services, Emergency Services, Medicine and Chronic Disease Services, Oral Health Services, Patient Flow Program, Surgical Services, and Women’s and Children’s Services.
Metro South HHS is committed to contributing to the Queensland Government’s objectives for the community to deliver quality frontline services and advancing its priorities for health and ambulance delivery. This will be achieved by our focus areas:
• clinical excellence and better health care solutions for patients through redesign and innovation, efficiency and quality
• technology that supports best practice, next generation clinical care • health system integration
and supported by:
• resource management that supports health service delivery needs • enabling and empowering our people • ensuring the needs of our stakeholders influence our efforts.
Service Summary The Metro South HHS has an operating budget of $2.315 billion for 2017-18 which is an increase of $121 million (5.5 per cent) from the published 2016-17 operating budget of $2.194 billion.
Some of the major deliverables for Metro South HHS in 2017-18 include: • opening of Stage 2 of the Southern Queensland Centre of Excellence at Inala • opening of the Wynnum-Manly Community Health Centre (Gundu-Pa) which will offer expanded specialist outpatient,
primary health care, oral health and BreastScreen services and • commencement of oral health services from the new Woolloongabba Community Health Centre, which will be the
largest dental clinic south of the Brisbane River.
1472017-18 Queensland State Budget - Service Delivery Statements - Metro South Hospital and Health Service
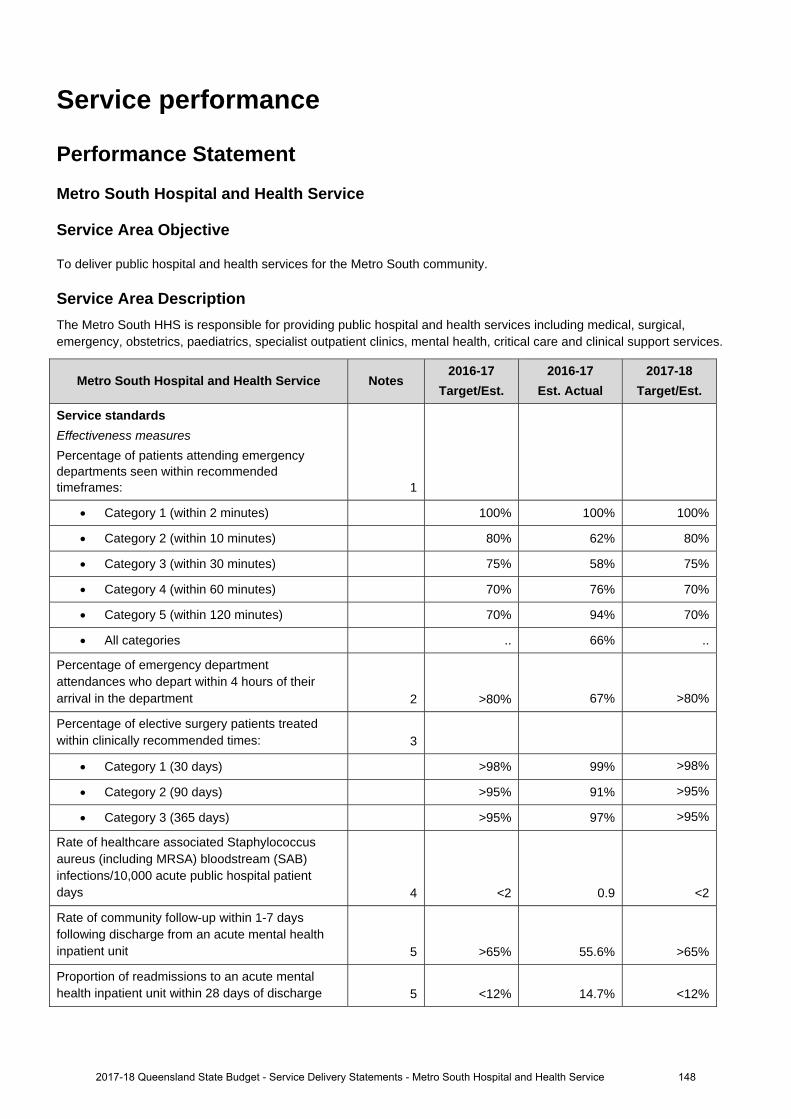
Service performance
Performance Statement
Metro South Hospital and Health Service
Service Area Objective
To deliver public hospital and health services for the Metro South community.
Service Area Description The Metro South HHS is responsible for providing public hospital and health services including medical, surgical, emergency, obstetrics, paediatrics, specialist outpatient clinics, mental health, critical care and clinical support services.
Metro South Hospital and Health Service Notes 2016-17
Target/Est. 2016-17
Est. Actual 2017-18
Target/Est.
Service standards Effectiveness measures
Percentage of patients attending emergency departments seen within recommended timeframes: 1
Category 1 (within 2 minutes) 100% 100% 100%
Category 2 (within 10 minutes) 80% 62% 80%
Category 3 (within 30 minutes) 75% 58% 75%
Category 4 (within 60 minutes) 70% 76% 70%
Category 5 (within 120 minutes) 70% 94% 70%
All categories .. 66% ..
Percentage of emergency department attendances who depart within 4 hours of their arrival in the department 2 >80% 67% >80%
Percentage of elective surgery patients treated within clinically recommended times: 3
Category 1 (30 days) >98% 99% >98%
Category 2 (90 days) >95% 91% >95%
Category 3 (365 days) >95% 97% >95%
Rate of healthcare associated Staphylococcus aureus (including MRSA) bloodstream (SAB) infections/10,000 acute public hospital patient days 4 <2 0.9 <2
Rate of community follow-up within 1-7 days following discharge from an acute mental health inpatient unit 5 >65% 55.6% >65%
Proportion of readmissions to an acute mental health inpatient unit within 28 days of discharge 5 <12% 14.7% <12%
2017-18 Queensland State Budget - Service Delivery Statements - Metro South Hospital and Health Service 148
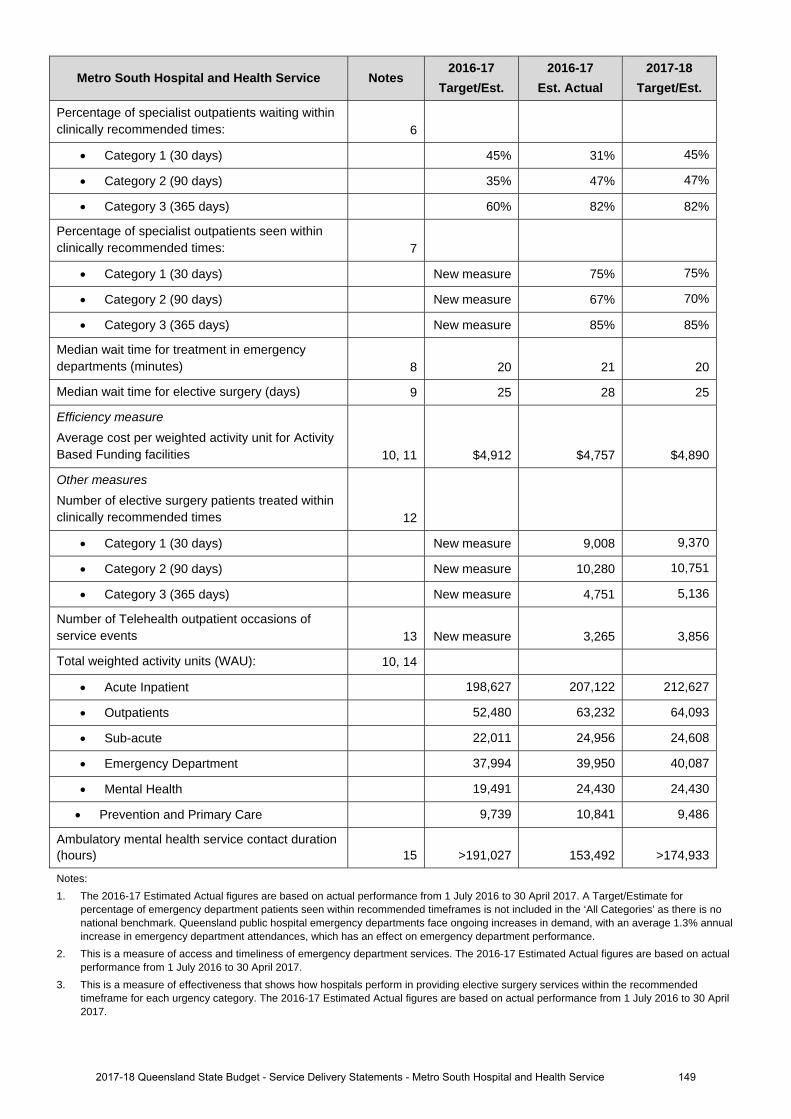
Metro South Hospital and Health Service Notes 2016-17
Target/Est. 2016-17
Est. Actual 2017-18
Target/Est.
Percentage of specialist outpatients waiting within clinically recommended times: 6
Category 1 (30 days) 45% 31% 45%
Category 2 (90 days) 35% 47% 47%
Category 3 (365 days) 60% 82% 82%
Percentage of specialist outpatients seen within clinically recommended times: 7
Category 1 (30 days) New measure 75% 75%
Category 2 (90 days) New measure 67% 70%
Category 3 (365 days) New measure 85% 85%
Median wait time for treatment in emergency departments (minutes) 8 20 21 20
Median wait time for elective surgery (days) 9 25 28 25
Efficiency measure
Average cost per weighted activity unit for Activity Based Funding facilities 10, 11 $4,912 $4,757 $4,890
Other measures
Number of elective surgery patients treated within clinically recommended times 12
Category 1 (30 days) New measure 9,008 9,370
Category 2 (90 days) New measure 10,280 10,751
Category 3 (365 days) New measure 4,751 5,136
Number of Telehealth outpatient occasions of service events 13 New measure 3,265 3,856
Total weighted activity units (WAU): 10, 14
Acute Inpatient 198,627 207,122 212,627
Outpatients 52,480 63,232 64,093
Sub-acute 22,011 24,956 24,608
Emergency Department 37,994 39,950 40,087
Mental Health 19,491 24,430 24,430
Prevention and Primary Care 9,739 10,841 9,486
Ambulatory mental health service contact duration (hours) 15 >191,027 153,492 >174,933
Notes: 1. The 2016-17 Estimated Actual figures are based on actual performance from 1 July 2016 to 30 April 2017. A Target/Estimate for
percentage of emergency department patients seen within recommended timeframes is not included in the ‘All Categories’ as there is no national benchmark. Queensland public hospital emergency departments face ongoing increases in demand, with an average 1.3% annual increase in emergency department attendances, which has an effect on emergency department performance.
2. This is a measure of access and timeliness of emergency department services. The 2016-17 Estimated Actual figures are based on actual performance from 1 July 2016 to 30 April 2017.
3. This is a measure of effectiveness that shows how hospitals perform in providing elective surgery services within the recommended timeframe for each urgency category. The 2016-17 Estimated Actual figures are based on actual performance from 1 July 2016 to 30 April 2017.
2017-18 Queensland State Budget - Service Delivery Statements - Metro South Hospital and Health Service 149
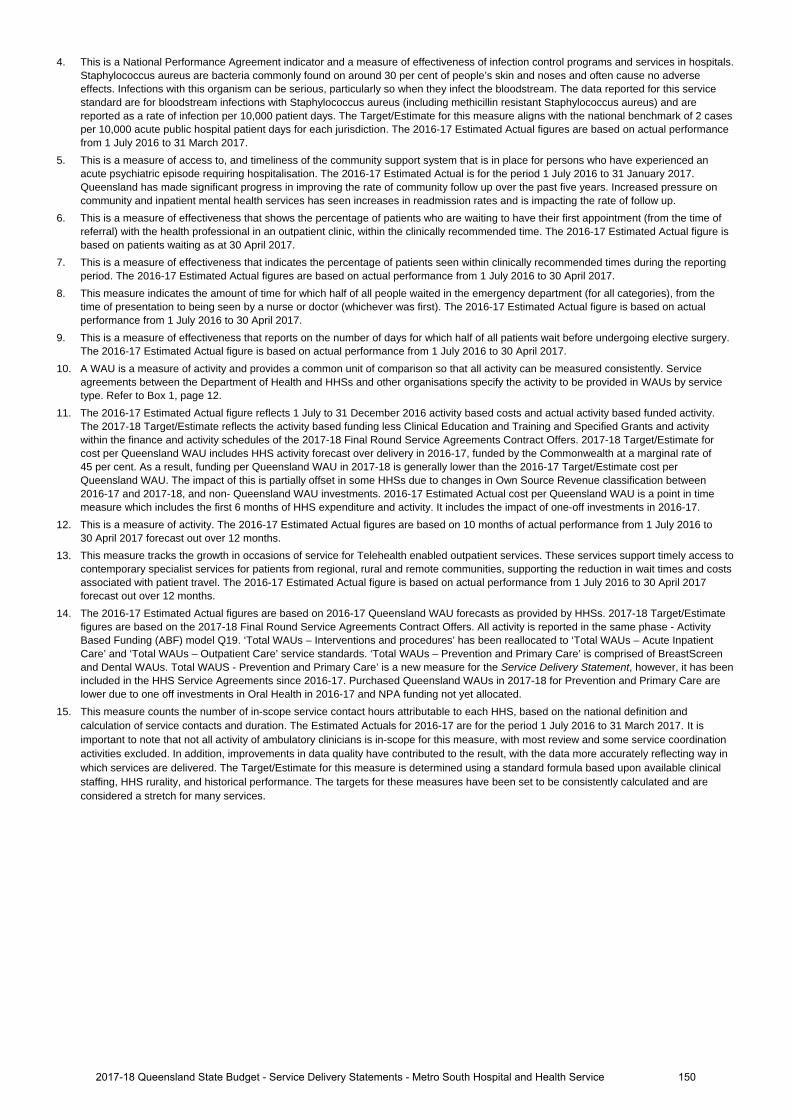
4. This is a National Performance Agreement indicator and a measure of effectiveness of infection control programs and services in hospitals. Staphylococcus aureus are bacteria commonly found on around 30 per cent of people’s skin and noses and often cause no adverse effects. Infections with this organism can be serious, particularly so when they infect the bloodstream. The data reported for this service standard are for bloodstream infections with Staphylococcus aureus (including methicillin resistant Staphylococcus aureus) and are reported as a rate of infection per 10,000 patient days. The Target/Estimate for this measure aligns with the national benchmark of 2 cases per 10,000 acute public hospital patient days for each jurisdiction. The 2016-17 Estimated Actual figures are based on actual performance from 1 July 2016 to 31 March 2017.
5. This is a measure of access to, and timeliness of the community support system that is in place for persons who have experienced an acute psychiatric episode requiring hospitalisation. The 2016-17 Estimated Actual is for the period 1 July 2016 to 31 January 2017. Queensland has made significant progress in improving the rate of community follow up over the past five years. Increased pressure on community and inpatient mental health services has seen increases in readmission rates and is impacting the rate of follow up.
6. This is a measure of effectiveness that shows the percentage of patients who are waiting to have their first appointment (from the time of referral) with the health professional in an outpatient clinic, within the clinically recommended time. The 2016-17 Estimated Actual figure is based on patients waiting as at 30 April 2017.
7. This is a measure of effectiveness that indicates the percentage of patients seen within clinically recommended times during the reporting period. The 2016-17 Estimated Actual figures are based on actual performance from 1 July 2016 to 30 April 2017.
8. This measure indicates the amount of time for which half of all people waited in the emergency department (for all categories), from the time of presentation to being seen by a nurse or doctor (whichever was first). The 2016-17 Estimated Actual figure is based on actual performance from 1 July 2016 to 30 April 2017.
9. This is a measure of effectiveness that reports on the number of days for which half of all patients wait before undergoing elective surgery. The 2016-17 Estimated Actual figure is based on actual performance from 1 July 2016 to 30 April 2017.
10. A WAU is a measure of activity and provides a common unit of comparison so that all activity can be measured consistently. Service agreements between the Department of Health and HHSs and other organisations specify the activity to be provided in WAUs by service type. Refer to Box 1, page 12.
11. The 2016-17 Estimated Actual figure reflects 1 July to 31 December 2016 activity based costs and actual activity based funded activity. The 2017-18 Target/Estimate reflects the activity based funding less Clinical Education and Training and Specified Grants and activity within the finance and activity schedules of the 2017-18 Final Round Service Agreements Contract Offers. 2017-18 Target/Estimate for cost per Queensland WAU includes HHS activity forecast over delivery in 2016-17, funded by the Commonwealth at a marginal rate of 45 per cent. As a result, funding per Queensland WAU in 2017-18 is generally lower than the 2016-17 Target/Estimate cost per Queensland WAU. The impact of this is partially offset in some HHSs due to changes in Own Source Revenue classification between 2016-17 and 2017-18, and non- Queensland WAU investments. 2016-17 Estimated Actual cost per Queensland WAU is a point in time measure which includes the first 6 months of HHS expenditure and activity. It includes the impact of one-off investments in 2016-17.
12. This is a measure of activity. The 2016-17 Estimated Actual figures are based on 10 months of actual performance from 1 July 2016 to 30 April 2017 forecast out over 12 months.
13. This measure tracks the growth in occasions of service for Telehealth enabled outpatient services. These services support timely access to contemporary specialist services for patients from regional, rural and remote communities, supporting the reduction in wait times and costs associated with patient travel. The 2016-17 Estimated Actual figure is based on actual performance from 1 July 2016 to 30 April 2017 forecast out over 12 months.
14. The 2016-17 Estimated Actual figures are based on 2016-17 Queensland WAU forecasts as provided by HHSs. 2017-18 Target/Estimate figures are based on the 2017-18 Final Round Service Agreements Contract Offers. All activity is reported in the same phase - Activity Based Funding (ABF) model Q19. ‘Total WAUs – Interventions and procedures’ has been reallocated to ‘Total WAUs – Acute Inpatient Care’ and ‘Total WAUs – Outpatient Care’ service standards. ‘Total WAUs – Prevention and Primary Care’ is comprised of BreastScreen and Dental WAUs. Total WAUS - Prevention and Primary Care’ is a new measure for the Service Delivery Statement, however, it has been included in the HHS Service Agreements since 2016-17. Purchased Queensland WAUs in 2017-18 for Prevention and Primary Care are lower due to one off investments in Oral Health in 2016-17 and NPA funding not yet allocated.
15. This measure counts the number of in-scope service contact hours attributable to each HHS, based on the national definition and calculation of service contacts and duration. The Estimated Actuals for 2016-17 are for the period 1 July 2016 to 31 March 2017. It is important to note that not all activity of ambulatory clinicians is in-scope for this measure, with most review and some service coordination activities excluded. In addition, improvements in data quality have contributed to the result, with the data more accurately reflecting way in which services are delivered. The Target/Estimate for this measure is determined using a standard formula based upon available clinical staffing, HHS rurality, and historical performance. The targets for these measures have been set to be consistently calculated and are considered a stretch for many services.
2017-18 Queensland State Budget - Service Delivery Statements - Metro South Hospital and Health Service 150
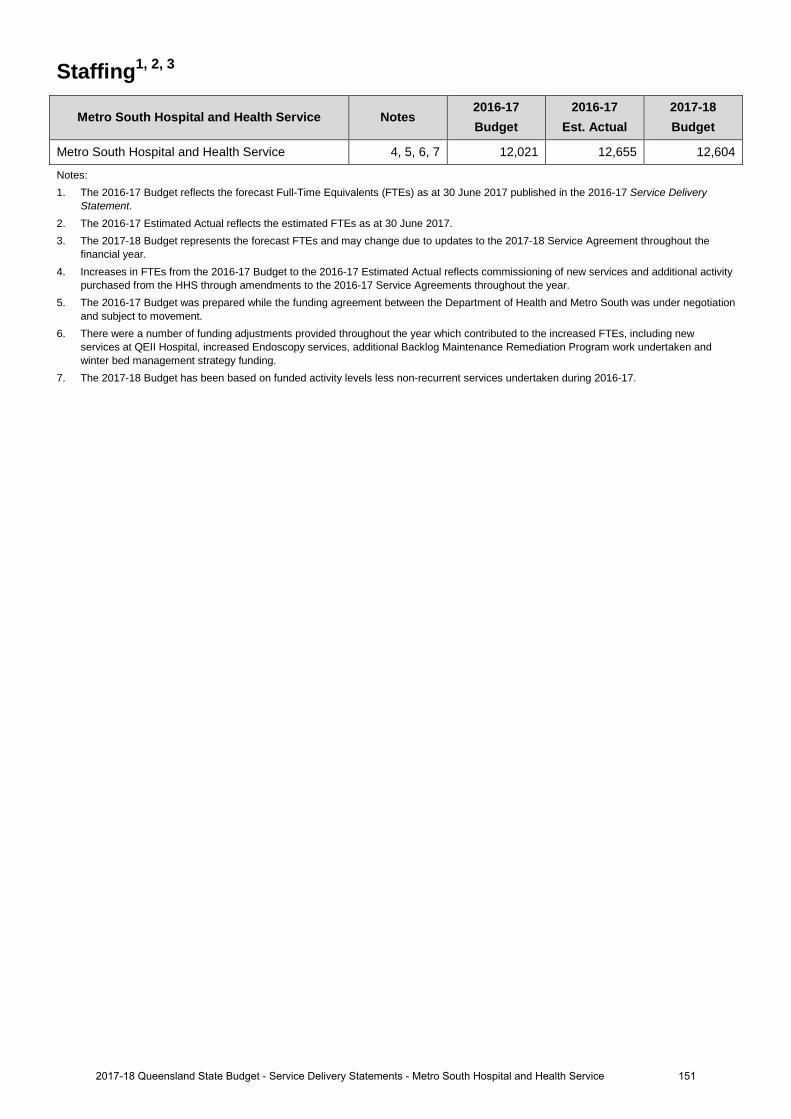
Staffing1, 2, 3
Metro South Hospital and Health Service Notes 2016-17 Budget
2016-17 Est. Actual
2017-18 Budget
Metro South Hospital and Health Service 4, 5, 6, 7 12,021 12,655 12,604
Notes: 1. The 2016-17 Budget reflects the forecast Full-Time Equivalents (FTEs) as at 30 June 2017 published in the 2016-17 Service Delivery
Statement. 2. The 2016-17 Estimated Actual reflects the estimated FTEs as at 30 June 2017. 3. The 2017-18 Budget represents the forecast FTEs and may change due to updates to the 2017-18 Service Agreement throughout the
financial year. 4. Increases in FTEs from the 2016-17 Budget to the 2016-17 Estimated Actual reflects commissioning of new services and additional activity
purchased from the HHS through amendments to the 2016-17 Service Agreements throughout the year. 5. The 2016-17 Budget was prepared while the funding agreement between the Department of Health and Metro South was under negotiation
and subject to movement. 6. There were a number of funding adjustments provided throughout the year which contributed to the increased FTEs, including new
services at QEII Hospital, increased Endoscopy services, additional Backlog Maintenance Remediation Program work undertaken and winter bed management strategy funding.
7. The 2017-18 Budget has been based on funded activity levels less non-recurrent services undertaken during 2016-17.
1512017-18 Queensland State Budget - Service Delivery Statements - Metro South Hospital and Health Service
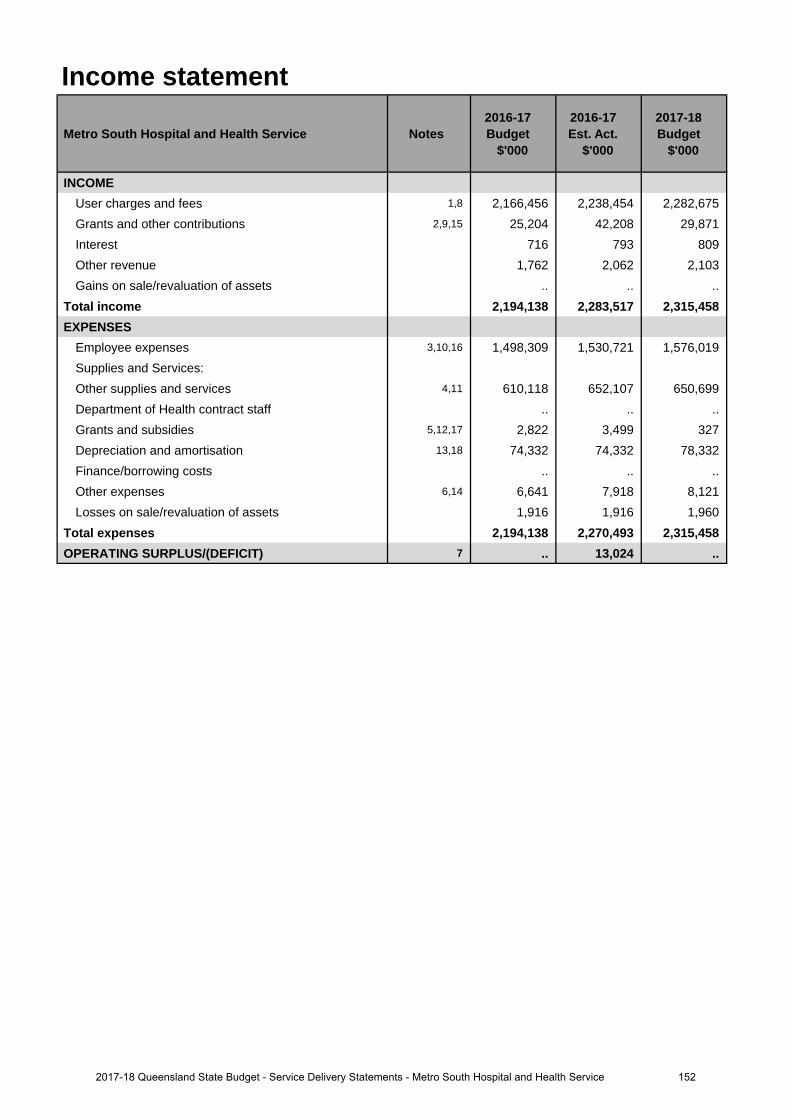
Income statement
Metro South Hospital and Health Service Notes 2016-17 Budget
$'000
2016-17 Est. Act.
$'000
2017-18 Budget
$'000
INCOMEUser charges and fees 1,8 2,166,456 2,238,454 2,282,675 Grants and other contributions 2,9,15 25,204 42,208 29,871 Interest 716 793 809 Other revenue 1,762 2,062 2,103 Gains on sale/revaluation of assets .. .. ..
Total income 2,194,138 2,283,517 2,315,458 EXPENSES
Employee expenses 3,10,16 1,498,309 1,530,721 1,576,019 Supplies and Services:Other supplies and services 4,11 610,118 652,107 650,699 Department of Health contract staff .. .. .. Grants and subsidies 5,12,17 2,822 3,499 327 Depreciation and amortisation 13,18 74,332 74,332 78,332 Finance/borrowing costs .. .. .. Other expenses 6,14 6,641 7,918 8,121 Losses on sale/revaluation of assets 1,916 1,916 1,960
Total expenses 2,194,138 2,270,493 2,315,458 OPERATING SURPLUS/(DEFICIT) 7 .. 13,024 ..
1522017-18 Queensland State Budget - Service Delivery Statements - Metro South Hospital and Health Service
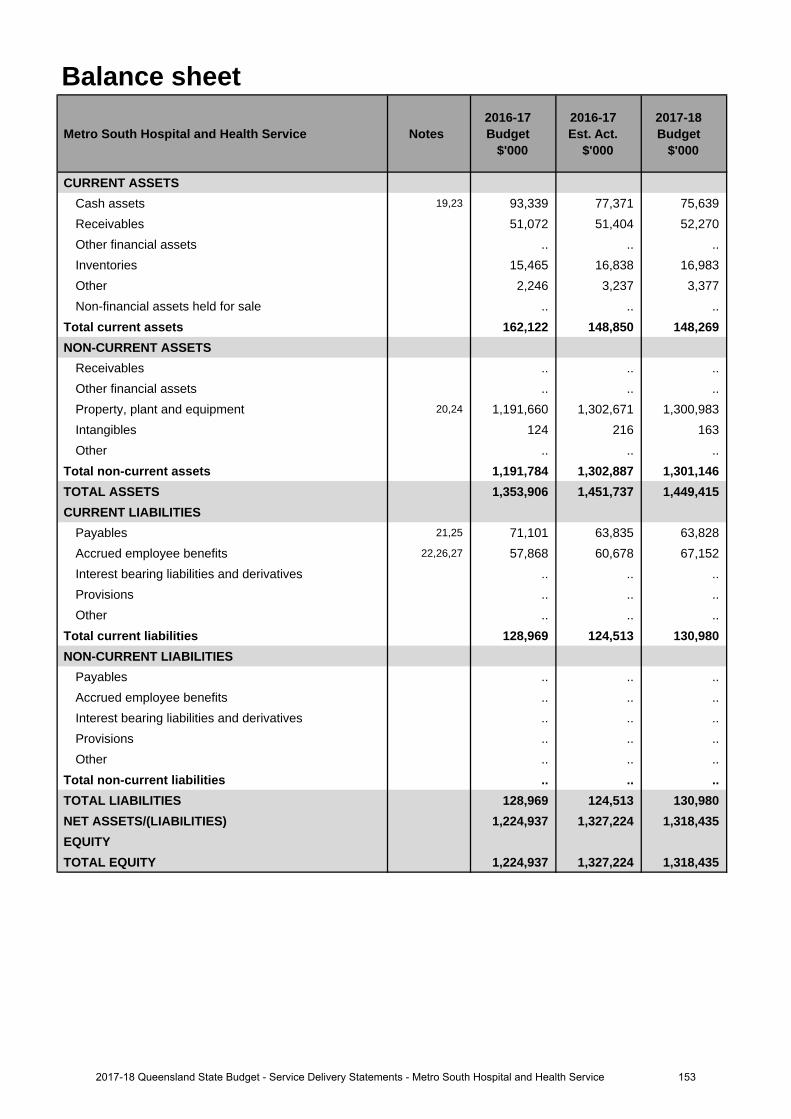
Balance sheet
Metro South Hospital and Health Service Notes 2016-17 Budget
$'000
2016-17 Est. Act.
$'000
2017-18 Budget
$'000
CURRENT ASSETSCash assets 19,23 93,339 77,371 75,639 Receivables 51,072 51,404 52,270 Other financial assets .. .. .. Inventories 15,465 16,838 16,983 Other 2,246 3,237 3,377 Non-financial assets held for sale .. .. ..
Total current assets 162,122 148,850 148,269 NON-CURRENT ASSETS
Receivables .. .. .. Other financial assets .. .. .. Property, plant and equipment 20,24 1,191,660 1,302,671 1,300,983 Intangibles 124 216 163 Other .. .. ..
Total non-current assets 1,191,784 1,302,887 1,301,146 TOTAL ASSETS 1,353,906 1,451,737 1,449,415 CURRENT LIABILITIES
Payables 21,25 71,101 63,835 63,828 Accrued employee benefits 22,26,27 57,868 60,678 67,152 Interest bearing liabilities and derivatives .. .. .. Provisions .. .. .. Other .. .. ..
Total current liabilities 128,969 124,513 130,980 NON-CURRENT LIABILITIES
Payables .. .. .. Accrued employee benefits .. .. .. Interest bearing liabilities and derivatives .. .. .. Provisions .. .. .. Other .. .. ..
Total non-current liabilities .. .. .. TOTAL LIABILITIES 128,969 124,513 130,980 NET ASSETS/(LIABILITIES) 1,224,937 1,327,224 1,318,435 EQUITYTOTAL EQUITY 1,224,937 1,327,224 1,318,435
1532017-18 Queensland State Budget - Service Delivery Statements - Metro South Hospital and Health Service
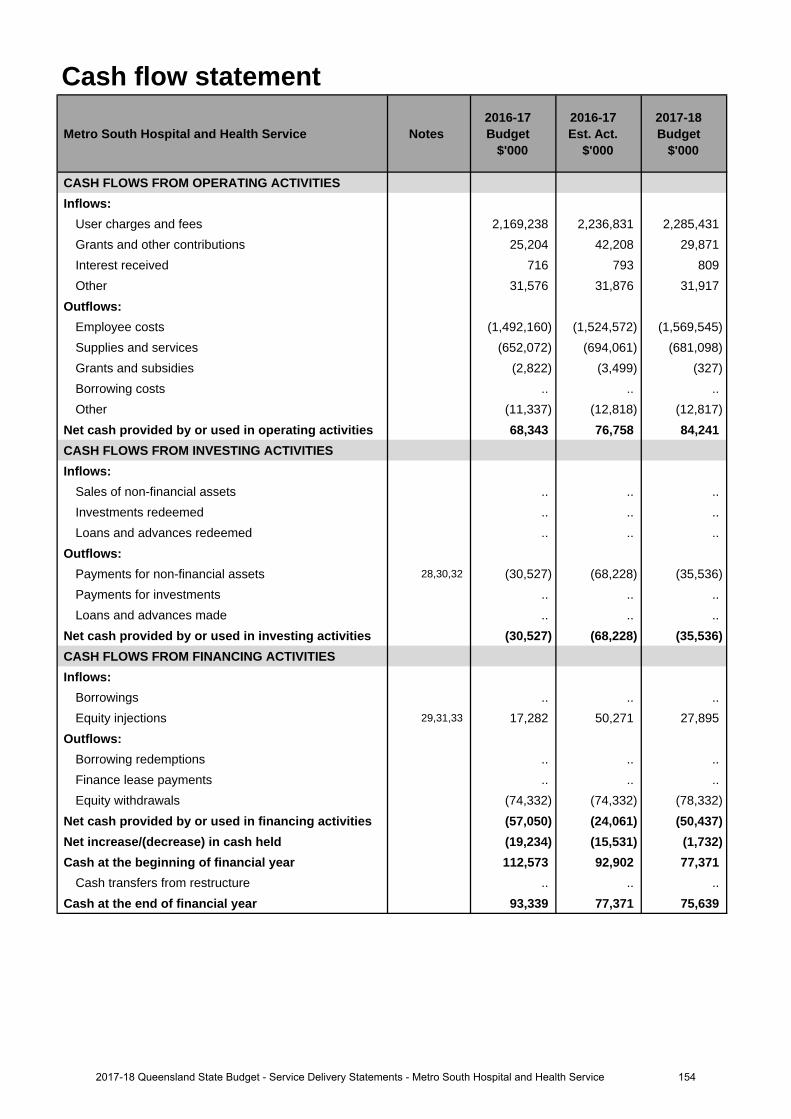
Cash flow statement
Metro South Hospital and Health Service Notes 2016-17 Budget
$'000
2016-17 Est. Act.
$'000
2017-18 Budget
$'000
CASH FLOWS FROM OPERATING ACTIVITIESInflows:
User charges and fees 2,169,238 2,236,831 2,285,431 Grants and other contributions 25,204 42,208 29,871 Interest received 716 793 809 Other 31,576 31,876 31,917
Outflows:Employee costs (1,492,160) (1,524,572) (1,569,545)Supplies and services (652,072) (694,061) (681,098)Grants and subsidies (2,822) (3,499) (327)Borrowing costs .. .. .. Other (11,337) (12,818) (12,817)
Net cash provided by or used in operating activities 68,343 76,758 84,241 CASH FLOWS FROM INVESTING ACTIVITIESInflows:
Sales of non-financial assets .. .. .. Investments redeemed .. .. .. Loans and advances redeemed .. .. ..
Outflows:Payments for non-financial assets 28,30,32 (30,527) (68,228) (35,536)Payments for investments .. .. .. Loans and advances made .. .. ..
Net cash provided by or used in investing activities (30,527) (68,228) (35,536)CASH FLOWS FROM FINANCING ACTIVITIESInflows:
Borrowings .. .. .. Equity injections 29,31,33 17,282 50,271 27,895
Outflows:Borrowing redemptions .. .. .. Finance lease payments .. .. .. Equity withdrawals (74,332) (74,332) (78,332)
Net cash provided by or used in financing activities (57,050) (24,061) (50,437)Net increase/(decrease) in cash held (19,234) (15,531) (1,732)Cash at the beginning of financial year 112,573 92,902 77,371
Cash transfers from restructure .. .. .. Cash at the end of financial year 93,339 77,371 75,639
1542017-18 Queensland State Budget - Service Delivery Statements - Metro South Hospital and Health Service
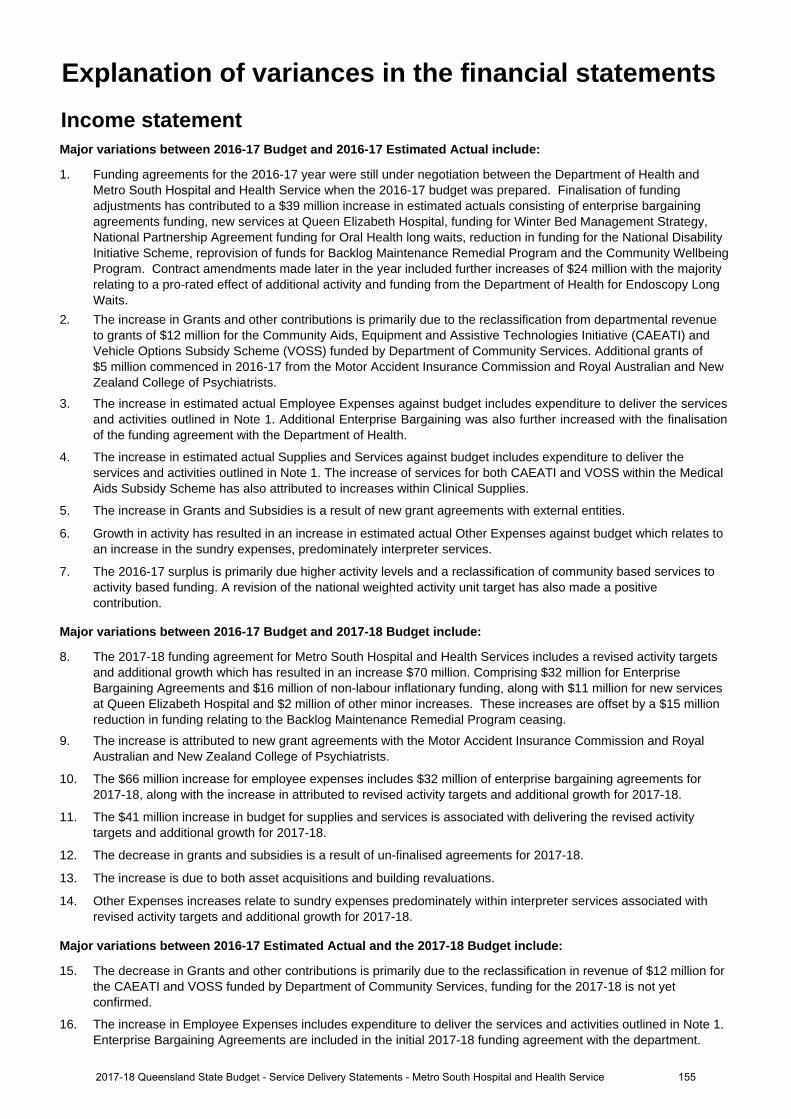
Income statementMajor variations between 2016-17 Budget and 2016-17 Estimated Actual include:
1. Funding agreements for the 2016-17 year were still under negotiation between the Department of Health and Metro South Hospital and Health Service when the 2016-17 budget was prepared. Finalisation of funding adjustments has contributed to a $39 million increase in estimated actuals consisting of enterprise bargaining agreements funding, new services at Queen Elizabeth Hospital, funding for Winter Bed Management Strategy,National Partnership Agreement funding for Oral Health long waits, reduction in funding for the National DisabilityInitiative Scheme, reprovision of funds for Backlog Maintenance Remedial Program and the Community WellbeingProgram. Contract amendments made later in the year included further increases of $24 million with the majorityrelating to a pro-rated effect of additional activity and funding from the Department of Health for Endoscopy LongWaits.
2. The increase in Grants and other contributions is primarily due to the reclassification from departmental revenueto grants of $12 million for the Community Aids, Equipment and Assistive Technologies Initiative (CAEATI) andVehicle Options Subsidy Scheme (VOSS) funded by Department of Community Services. Additional grants of$5 million commenced in 2016-17 from the Motor Accident Insurance Commission and Royal Australian and NewZealand College of Psychiatrists.
3. The increase in estimated actual Employee Expenses against budget includes expenditure to deliver the servicesand activities outlined in Note 1. Additional Enterprise Bargaining was also further increased with the finalisationof the funding agreement with the Department of Health.
4. The increase in estimated actual Supplies and Services against budget includes expenditure to deliver theservices and activities outlined in Note 1. The increase of services for both CAEATI and VOSS within the MedicalAids Subsidy Scheme has also attributed to increases within Clinical Supplies.
5. The increase in Grants and Subsidies is a result of new grant agreements with external entities.
6. Growth in activity has resulted in an increase in estimated actual Other Expenses against budget which relates toan increase in the sundry expenses, predominately interpreter services.
7. The 2016-17 surplus is primarily due higher activity levels and a reclassification of community based services toactivity based funding. A revision of the national weighted activity unit target has also made a positivecontribution.
Major variations between 2016-17 Budget and 2017-18 Budget include:
8. The 2017-18 funding agreement for Metro South Hospital and Health Services includes a revised activity targetsand additional growth which has resulted in an increase $70 million. Comprising $32 million for EnterpriseBargaining Agreements and $16 million of non-labour inflationary funding, along with $11 million for new servicesat Queen Elizabeth Hospital and $2 million of other minor increases. These increases are offset by a $15 millionreduction in funding relating to the Backlog Maintenance Remedial Program ceasing.
9. The increase is attributed to new grant agreements with the Motor Accident Insurance Commission and RoyalAustralian and New Zealand College of Psychiatrists.
10. The $66 million increase for employee expenses includes $32 million of enterprise bargaining agreements for2017-18, along with the increase in attributed to revised activity targets and additional growth for 2017-18.
11. The $41 million increase in budget for supplies and services is associated with delivering the revised activitytargets and additional growth for 2017-18.
12. The decrease in grants and subsidies is a result of un-finalised agreements for 2017-18.
13. The increase is due to both asset acquisitions and building revaluations.
14. Other Expenses increases relate to sundry expenses predominately within interpreter services associated withrevised activity targets and additional growth for 2017-18.
Major variations between 2016-17 Estimated Actual and the 2017-18 Budget include:
15. The decrease in Grants and other contributions is primarily due to the reclassification in revenue of $12 million forthe CAEATI and VOSS funded by Department of Community Services, funding for the 2017-18 is not yetconfirmed.
16. The increase in Employee Expenses includes expenditure to deliver the services and activities outlined in Note 1.Enterprise Bargaining Agreements are included in the initial 2017-18 funding agreement with the department.
Explanation of variances in the financial statements
1552017-18 Queensland State Budget - Service Delivery Statements - Metro South Hospital and Health Service
17. The decrease in grants and subsidies is a result of un-finalised agreements for 2017-18.
18. The increase is the result from build revaluations and asset acquisitions.
Balance sheetMajor variations between 2016-17 Budget and 2016-17 Estimated Actual include:
19. The decrease is due to a less than budgeted opening position relating to 2015-16 operating result.
20. The increase relates to land and building revaluation in addition to planned asset acquisitions.
21. The decrease relates to timing of payables to the Department of Health.
22. The increase relates to employee expenses with a flow on impact from Enterprise Bargaining Agreements.
Major variations between 2016-17 Budget and 2017-18 Budget include:
23. The decrease is due to a less than budgeted opening position relating to 2015-16 operating result.
24. The increase relates to land and building revaluation in addition to planned asset acquisitions.
25. The decrease relates to timing of payables to the Department of Health.
26. The increase is due to an additional end of year accrual day for salaries and wages.
Major variations between 2016-17 Estimated Actual and the 2017-18 Budget include:
27. The increase is due to an additional end of year accrual day for salaries and wages.
Cash flow statementMajor variations between 2016-17 Budget and 2016-17 Estimated Actual include:
28. The increase in payments is due to new capital projects funded by equity and general trust funds.
29. The increase is due to additional funding for new capital projects
Major variations between 2016-17 Budget and 2017-18 Budget include:
30. The increase is due to additional capital projects in 2017-18 budget.
31. The increase is due to additional funding for the Health Technology Equipment Replacement Program.
Major variations between 2016-17 Estimated Actual and the 2017-18 Budget include:
32. The decrease is due to completion of projects in 2016-17.
33. The decrease is due to completion of capital projects in 2016-17.
1562017-18 Queensland State Budget - Service Delivery Statements - Metro South Hospital and Health Service
North West Hospital and Health Service
Overview The North West Hospital and Health Service (HHS) is an independent statutory body overseen by a local Hospital and Health Board. The North West HHS is responsible for the delivery of public hospital and health services including medical, surgical, emergency, obstetrics, paediatrics, specialist outpatient clinics, mental health, critical care and clinical support services to a population of around 34,000 people residing in a geographical area of 300,000 kilometres within north western Queensland and the Gulf of Carpentaria. Mount Isa Hospital is the main referral centre.
The North West HHS is responsible for the direct management of the facilities within the HHS’s geographical boundaries:
• Burketown Health Centre • McKinlay Shire Multi-Purpose Health Service
• Camooweal Health Centre • McKinlay Health Clinic
• Cloncurry Multi-Purpose Health Service • Mornington Island Hospital
• Dajarra Health Clinic • Mount Isa Hospital
• Doomadgee Hospital • Normanton Hospital
The North West HHS provides a comprehensive range of community and primary health services, including aged care assessment, Aboriginal and Torres Strait Islander health programs; child and maternal health services; alcohol, tobacco and other drug services; home care services; community health nursing, sexual health service, allied health, oral health and health promotion programs.
The North West Hospital and Health Board is committed to be Queensland’s leading Hospital and Health Service delivering excellence in rural and remote healthcare. North West HHS has five strategic objectives including:
• providing quality health care for our patients, which are well-coordinated, efficient and sustainable. We will continuously improve our systems, processes and practice
• working with our health partners and local communities to ensure our people can access the health services they need
• supporting our people and developing their skills so they can perform at their best • supporting new thinking and fresh ideas that help us achieve our vision • meeting statutory requirements through good governance principles.
These strategic objectives contribute to the Queensland Government’s objectives of delivering quality frontline services and Queensland Health’s strategic direction to improve access to quality and safe healthcare in its different forms and settings.
Service summary The North West HHS has an operating budget of $172.5 million for 2017-18 which is an increase of $16.2 million (10.4 per cent) from the published 2016-17 operating budget of $156.3 million.
During 2017-18, the North West HHS will focus efforts to continue to:
• achieve the Queensland Emergency Access Target with 90 per cent of patients treated and discharged within four hours
• maintain elective surgery zero long waits • maintain endoscopy zero long waits • maintain zero outpatient long waits • employ the highest number of nurse practitioners in Queensland across a variety of clinical specialty areas, including
renal, heart failure, cardiac, emergency department, diabetes, maternal and child health, as well as five rural and remote nurse practitioners
1572017-18 Queensland State Budget - Service Delivery Statements - North West Hospital and Health Service
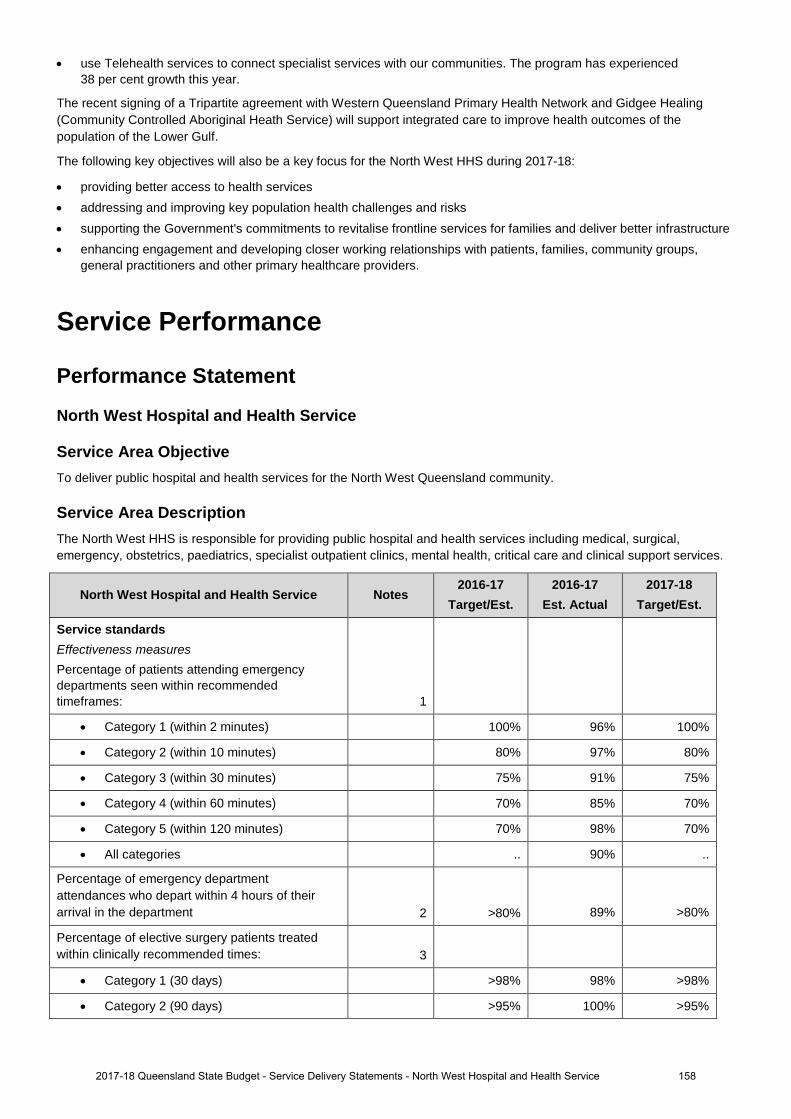
• use Telehealth services to connect specialist services with our communities. The program has experienced 38 per cent growth this year.
The recent signing of a Tripartite agreement with Western Queensland Primary Health Network and Gidgee Healing (Community Controlled Aboriginal Heath Service) will support integrated care to improve health outcomes of the population of the Lower Gulf.
The following key objectives will also be a key focus for the North West HHS during 2017-18:
• providing better access to health services • addressing and improving key population health challenges and risks • supporting the Government's commitments to revitalise frontline services for families and deliver better infrastructure • enhancing engagement and developing closer working relationships with patients, families, community groups,
general practitioners and other primary healthcare providers.
Service Performance
Performance Statement
North West Hospital and Health Service
Service Area Objective To deliver public hospital and health services for the North West Queensland community.
Service Area Description The North West HHS is responsible for providing public hospital and health services including medical, surgical, emergency, obstetrics, paediatrics, specialist outpatient clinics, mental health, critical care and clinical support services.
North West Hospital and Health Service Notes 2016-17
Target/Est. 2016-17
Est. Actual 2017-18
Target/Est.
Service standards Effectiveness measures Percentage of patients attending emergency departments seen within recommended timeframes: 1
• Category 1 (within 2 minutes) 100% 96% 100%
• Category 2 (within 10 minutes) 80% 97% 80%
• Category 3 (within 30 minutes) 75% 91% 75%
• Category 4 (within 60 minutes) 70% 85% 70%
• Category 5 (within 120 minutes) 70% 98% 70%
• All categories .. 90% ..
Percentage of emergency department attendances who depart within 4 hours of their arrival in the department 2 >80% 89% >80%
Percentage of elective surgery patients treated within clinically recommended times: 3
• Category 1 (30 days) >98% 98% >98%
• Category 2 (90 days) >95% 100% >95%
1582017-18 Queensland State Budget - Service Delivery Statements - North West Hospital and Health Service
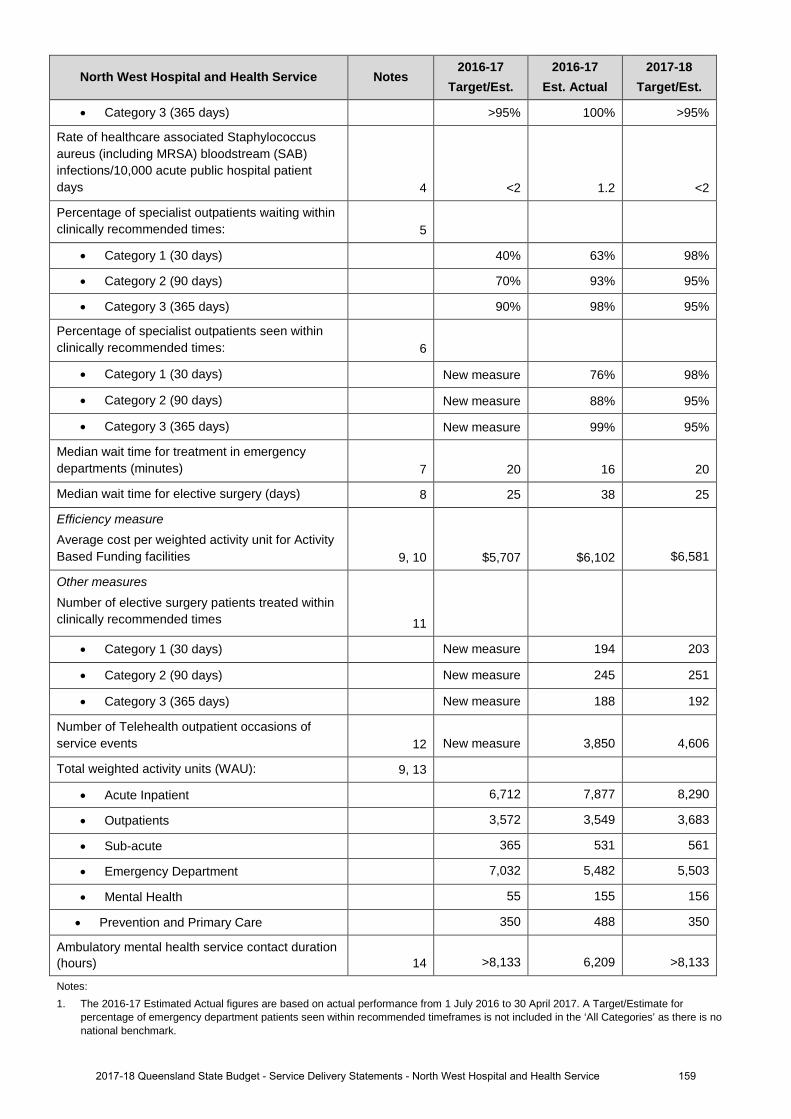
North West Hospital and Health Service Notes 2016-17
Target/Est. 2016-17
Est. Actual 2017-18
Target/Est.
• Category 3 (365 days) >95% 100% >95%
Rate of healthcare associated Staphylococcus aureus (including MRSA) bloodstream (SAB) infections/10,000 acute public hospital patient days 4 <2 1.2 <2
Percentage of specialist outpatients waiting within clinically recommended times: 5
• Category 1 (30 days) 40% 63% 98%
• Category 2 (90 days) 70% 93% 95%
• Category 3 (365 days) 90% 98% 95%
Percentage of specialist outpatients seen within clinically recommended times: 6
• Category 1 (30 days) New measure 76% 98%
• Category 2 (90 days) New measure 88% 95%
• Category 3 (365 days) New measure 99% 95%
Median wait time for treatment in emergency departments (minutes) 7 20 16 20
Median wait time for elective surgery (days) 8 25 38 25
Efficiency measure Average cost per weighted activity unit for Activity Based Funding facilities 9, 10 $5,707 $6,102 $6,581
Other measures Number of elective surgery patients treated within clinically recommended times 11
• Category 1 (30 days) New measure 194 203
• Category 2 (90 days) New measure 245 251
• Category 3 (365 days) New measure 188 192
Number of Telehealth outpatient occasions of service events 12 New measure 3,850 4,606
Total weighted activity units (WAU): 9, 13
• Acute Inpatient 6,712 7,877 8,290
• Outpatients 3,572 3,549 3,683
• Sub-acute 365 531 561
• Emergency Department 7,032 5,482 5,503
• Mental Health 55 155 156
• Prevention and Primary Care 350 488 350
Ambulatory mental health service contact duration (hours) 14 >8,133 6,209 >8,133
Notes: 1. The 2016-17 Estimated Actual figures are based on actual performance from 1 July 2016 to 30 April 2017. A Target/Estimate for
percentage of emergency department patients seen within recommended timeframes is not included in the ‘All Categories’ as there is no national benchmark.
1592017-18 Queensland State Budget - Service Delivery Statements - North West Hospital and Health Service
2. This is a measure of access and timeliness of emergency department services. The 2016-17 Estimated Actual figures are based on actual performance from 1 July 2016 to 30 April 2017.
3. This is a measure of effectiveness that shows how hospitals perform in providing elective surgery services within the recommended timeframe for each urgency category. The 2016-17 Estimated Actual figures are based on actual performance from 1 July 2016 to 30 April 2017.
4. This is a National Performance Agreement indicator and a measure of effectiveness of infection control programs and services in hospitals. Staphylococcus aureus are bacteria commonly found on around 30 per cent of people’s skin and noses and often cause no adverse effects. Infections with this organism can be serious, particularly so when they infect the bloodstream. The data reported for this service standard are for bloodstream infections with Staphylococcus aureus (including methicillin resistant Staphylococcus aureus) and are reported as a rate of infection per 10,000 patient days. The Target/Estimate for this measure aligns with the national benchmark of 2 cases per 10,000 acute public hospital patient days for each jurisdiction. The 2016-17 Estimated Actual figures are based on actual performance from 1 July 2016 to 31 March 2017.
5. This is a measure of effectiveness that shows the percentage of patients who are waiting to have their first appointment (from the time of referral) with the health professional in an outpatient clinic, within the clinically recommended time. The 2016-17 Estimated Actual figure is based on patients waiting as at 30 April 2017.
6. This is a measure of effectiveness that indicates the percentage of patients seen within clinically recommended times during the reporting period. The 2016-17 Estimated Actual figures are based on actual performance from 1 July 2016 to 30 April 2017.
7. This measure indicates the amount of time for which half of all people waited in the emergency department (for all categories), from the time of presentation to being seen by a nurse or doctor (whichever was first). The 2016-17 Estimated Actual figure is based on actual performance from 1 July 2016 to 30 April 2017.
8. This is a measure of effectiveness that reports on the number of days for which half of all patients wait before undergoing elective surgery. The 2016-17 Estimated Actual figure is based on actual performance from 1 July 2016 to 30 April 2017.
9. A WAU is a measure of activity and provides a common unit of comparison so that all activity can be measured consistently. Service agreements between the Department of Health and HHSs and other organisations specify the activity to be provided in WAUs by service type. Refer to Box 1, page 12.
10. The 2016-17 Estimated Actual figure reflects 1 July to 31 December 2016 activity based costs and actual activity based funded activity. The 2017-18 Target/Estimate reflects the activity based funding less Clinical Education and Training and Specified Grants and activity within the finance and activity schedules of the 2017-18 Final Round Service Agreements Contract Offers. 2017-18 Target/Estimate for cost per Queensland WAU includes HHS activity forecast over delivery in 2016-17, funded by the Commonwealth at a marginal rate of 45 per cent. The impact of this is partially offset in some HHSs due to changes in Own Source Revenue classification between 2016-17 and 2017-18, and non- Queensland WAU investments. 2016-17 Estimated Actual cost per Queensland WAU is a point in time measure which includes the first 6 months of HHS expenditure and activity. It includes the impact of one-off investments in 2016-17.
11. This is a measure of activity. The 2016-17 Estimated Actual figures are based on 10 months of actual performance from 1 July 2016 to 30 April 2017 forecast out over 12 months.
12. This measure tracks the growth in occasions of service for Telehealth enabled outpatient services. These services support timely access to contemporary specialist services for patients from regional, rural and remote communities, supporting the reduction in wait times and costs associated with patient travel. The 2016-17 Estimated Actual figure is based on actual performance from 1 July 2016 to 30 April 2017 forecast out over 12 months.
13. The 2016-17 Estimated Actual figures are based on 2016-17 Queensland WAU forecasts as provided by HHSs. 2017-18 Target/Estimate figures are based on the 2017-18 Final Round Service Agreements Contract Offers. All activity is reported in the same phase - Activity Based Funding (ABF) model Q19. ‘Total WAUs – Interventions and procedures’ has been reallocated to ‘Total WAUs – Acute Inpatient Care’ and ‘Total WAUs – Outpatient Care’ service standards. ‘Total WAUs – Prevention and Primary Care’ is comprised of BreastScreen and Dental WAUs. Total WAUS - Prevention and Primary Care’ is a new measure for the Service Delivery Statement, however, it has been included in the HHS Service Agreements since 2016-17. Purchased Queensland WAUs in 2017-18 for Prevention and Primary Care are lower due to one off investments in Oral Health in 2016-17 and NPA funding not yet allocated.
14. This measure counts the number of in-scope service contact hours attributable to each HHS, based on the national definition and calculation of service contacts and duration. The Estimated Actuals for 2016-17 are for the period 1 July 2016 to 31 March 2017. It is important to note that not all activity of ambulatory clinicians is in-scope for this measure, with most review and some service coordination activities excluded. In addition, improvements in data quality have contributed to the result, with the data more accurately reflecting way in which services are delivered. The Target/Estimate for this measure is determined using a standard formula based upon available clinical staffing, HHS rurality, and historical performance. The targets for these measures have been set to be consistently calculated and are considered a stretch for many services.
1602017-18 Queensland State Budget - Service Delivery Statements - North West Hospital and Health Service
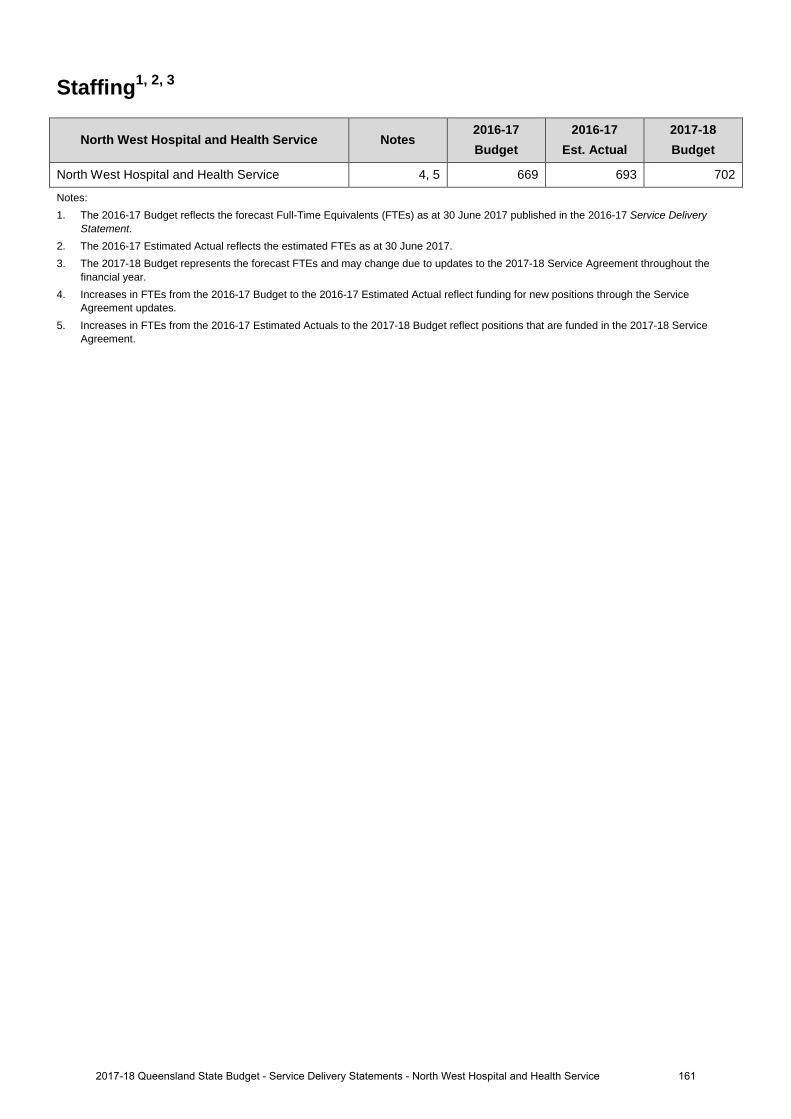
Staffing1, 2, 3
North West Hospital and Health Service Notes 2016-17 Budget
2016-17 Est. Actual
2017-18 Budget
North West Hospital and Health Service 4, 5 669 693 702
Notes: 1. The 2016-17 Budget reflects the forecast Full-Time Equivalents (FTEs) as at 30 June 2017 published in the 2016-17 Service Delivery
Statement. 2. The 2016-17 Estimated Actual reflects the estimated FTEs as at 30 June 2017. 3. The 2017-18 Budget represents the forecast FTEs and may change due to updates to the 2017-18 Service Agreement throughout the
financial year. 4. Increases in FTEs from the 2016-17 Budget to the 2016-17 Estimated Actual reflect funding for new positions through the Service
Agreement updates. 5. Increases in FTEs from the 2016-17 Estimated Actuals to the 2017-18 Budget reflect positions that are funded in the 2017-18 Service
Agreement.
1612017-18 Queensland State Budget - Service Delivery Statements - North West Hospital and Health Service
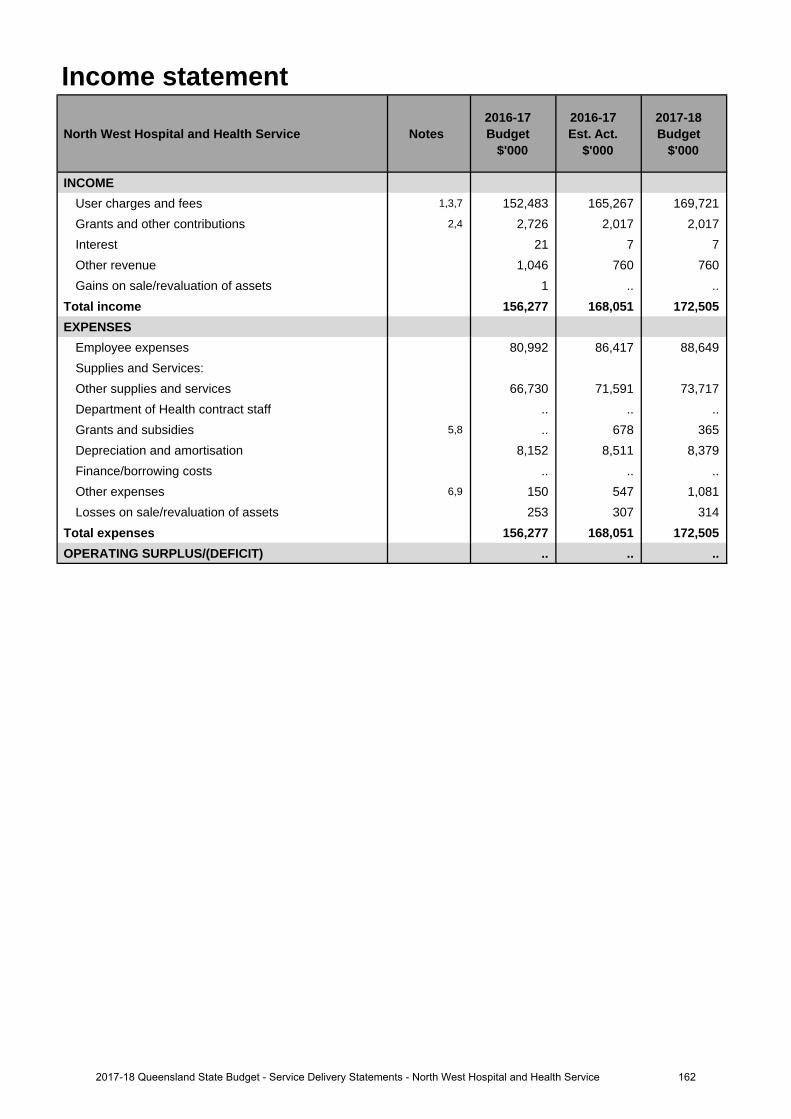
Income statement
North West Hospital and Health Service Notes 2016-17 Budget
$'000
2016-17 Est. Act.
$'000
2017-18 Budget
$'000
INCOMEUser charges and fees 1,3,7 152,483 165,267 169,721 Grants and other contributions 2,4 2,726 2,017 2,017 Interest 21 7 7 Other revenue 1,046 760 760 Gains on sale/revaluation of assets 1 .. ..
Total income 156,277 168,051 172,505 EXPENSES
Employee expenses 80,992 86,417 88,649 Supplies and Services:Other supplies and services 66,730 71,591 73,717 Department of Health contract staff .. .. .. Grants and subsidies 5,8 .. 678 365 Depreciation and amortisation 8,152 8,511 8,379 Finance/borrowing costs .. .. .. Other expenses 6,9 150 547 1,081 Losses on sale/revaluation of assets 253 307 314
Total expenses 156,277 168,051 172,505 OPERATING SURPLUS/(DEFICIT) .. .. ..
1622017-18 Queensland State Budget - Service Delivery Statements - North West Hospital and Health Service

Balance sheet
North West Hospital and Health Service Notes 2016-17 Budget
$'000
2016-17 Est. Act.
$'000
2017-18 Budget
$'000
CURRENT ASSETSCash assets 10,14 (868) 2,066 2,361 Receivables 11,15 855 7,328 7,342 Other financial assets .. .. .. Inventories 1,025 960 971 Other (2) 12 11 Non-financial assets held for sale .. .. ..
Total current assets 1,010 10,366 10,685 NON-CURRENT ASSETS
Receivables .. .. .. Other financial assets .. .. .. Property, plant and equipment 119,556 115,610 121,349 Intangibles .. .. .. Other .. .. ..
Total non-current assets 119,556 115,610 121,349 TOTAL ASSETS 120,566 125,976 132,034 CURRENT LIABILITIES
Payables 12,16 8,628 5,254 5,573 Accrued employee benefits 13,17 51 2,928 2,928 Interest bearing liabilities and derivatives .. .. .. Provisions .. .. .. Other 559 .. ..
Total current liabilities 9,238 8,182 8,501 NON-CURRENT LIABILITIES
Payables .. .. .. Accrued employee benefits .. .. .. Interest bearing liabilities and derivatives .. .. .. Provisions .. .. .. Other .. .. ..
Total non-current liabilities .. .. .. TOTAL LIABILITIES 9,238 8,182 8,501 NET ASSETS/(LIABILITIES) 111,328 117,794 123,533 EQUITYTOTAL EQUITY 18 111,328 117,794 123,533
1632017-18 Queensland State Budget - Service Delivery Statements - North West Hospital and Health Service

Cash flow statement
North West Hospital and Health Service Notes 2016-17 Budget
$'000
2016-17 Est. Act.
$'000
2017-18 Budget
$'000
CASH FLOWS FROM OPERATING ACTIVITIESInflows:
User charges and fees 19,22 152,284 165,067 169,517 Grants and other contributions 20,23 2,726 2,017 2,017 Interest received 21 7 7 Other 5,277 4,991 4,991
Outflows:Employee costs (80,992) (86,417) (88,649)Supplies and services (70,720) (75,616) (77,744)Grants and subsidies 24,27 .. (678) (365)Borrowing costs .. .. .. Other 25,28 (150) (547) (1,081)
Net cash provided by or used in operating activities 8,446 8,824 8,693 CASH FLOWS FROM INVESTING ACTIVITIESInflows:
Sales of non-financial assets 1 (18) (19)Investments redeemed .. .. .. Loans and advances redeemed .. .. ..
Outflows:Payments for non-financial assets 21,26 (1,218) (1,984) (1,554)Payments for investments .. .. .. Loans and advances made .. .. ..
Net cash provided by or used in investing activities (1,217) (2,002) (1,573)CASH FLOWS FROM FINANCING ACTIVITIESInflows:
Borrowings .. .. .. Equity injections 1,218 1,243 1,554
Outflows:Borrowing redemptions .. .. .. Finance lease payments .. .. .. Equity withdrawals (8,152) (8,152) (8,379)
Net cash provided by or used in financing activities (6,934) (6,909) (6,825)Net increase/(decrease) in cash held 295 (87) 295 Cash at the beginning of financial year (1,163) 2,153 2,066
Cash transfers from restructure .. .. .. Cash at the end of financial year (868) 2,066 2,361
1642017-18 Queensland State Budget - Service Delivery Statements - North West Hospital and Health Service
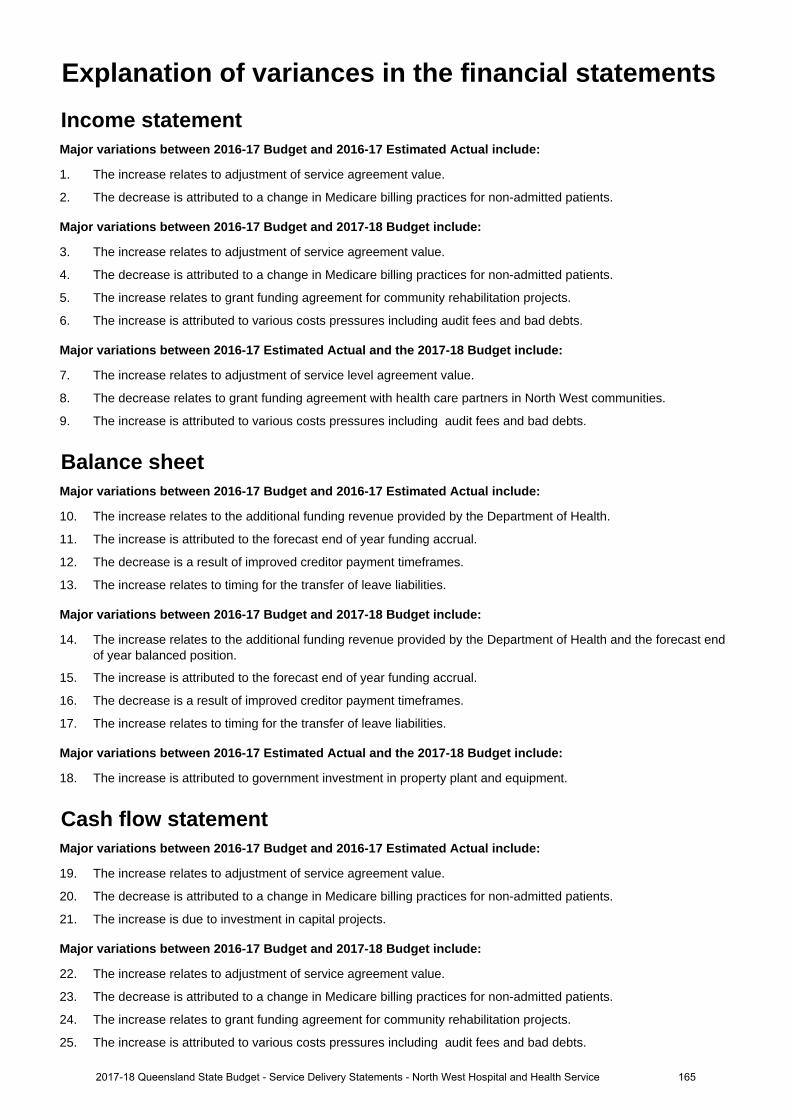
Income statementMajor variations between 2016-17 Budget and 2016-17 Estimated Actual include:
1. The increase relates to adjustment of service agreement value.
2. The decrease is attributed to a change in Medicare billing practices for non-admitted patients.
Major variations between 2016-17 Budget and 2017-18 Budget include:
3. The increase relates to adjustment of service agreement value.
4. The decrease is attributed to a change in Medicare billing practices for non-admitted patients.
5. The increase relates to grant funding agreement for community rehabilitation projects.
6. The increase is attributed to various costs pressures including audit fees and bad debts.
Major variations between 2016-17 Estimated Actual and the 2017-18 Budget include:
7. The increase relates to adjustment of service level agreement value.
8. The decrease relates to grant funding agreement with health care partners in North West communities.
9. The increase is attributed to various costs pressures including audit fees and bad debts.
Balance sheetMajor variations between 2016-17 Budget and 2016-17 Estimated Actual include:
10. The increase relates to the additional funding revenue provided by the Department of Health.
11. The increase is attributed to the forecast end of year funding accrual.
12. The decrease is a result of improved creditor payment timeframes.
13. The increase relates to timing for the transfer of leave liabilities.
Major variations between 2016-17 Budget and 2017-18 Budget include:
14. The increase relates to the additional funding revenue provided by the Department of Health and the forecast endof year balanced position.
15. The increase is attributed to the forecast end of year funding accrual.
16. The decrease is a result of improved creditor payment timeframes.
17. The increase relates to timing for the transfer of leave liabilities.
Major variations between 2016-17 Estimated Actual and the 2017-18 Budget include:
18. The increase is attributed to government investment in property plant and equipment.
Cash flow statementMajor variations between 2016-17 Budget and 2016-17 Estimated Actual include:
19. The increase relates to adjustment of service agreement value.
20. The decrease is attributed to a change in Medicare billing practices for non-admitted patients.
21. The increase is due to investment in capital projects.
Major variations between 2016-17 Budget and 2017-18 Budget include:
22. The increase relates to adjustment of service agreement value.
23. The decrease is attributed to a change in Medicare billing practices for non-admitted patients.
24. The increase relates to grant funding agreement for community rehabilitation projects.
25. The increase is attributed to various costs pressures including audit fees and bad debts.
Explanation of variances in the financial statements
1652017-18 Queensland State Budget - Service Delivery Statements - North West Hospital and Health Service
26. The increase is due to investment in capital projects.
Major variations between 2016-17 Estimated Actual and the 2017-18 Budget include:
27. The decrease relates to grant funding agreement with health care partners in North West communities.
28. The increase is attributed to various costs pressures including audit fees and bad debts.
1662017-18 Queensland State Budget - Service Delivery Statements - North West Hospital and Health Service
South West Hospital and Health Service Overview The South West Hospital and Health Service (HHS) is an independent statutory body overseen by a local Hospital and Health Board. The South West HHS is responsible for the delivery of public hospital and health services including medical, surgical, emergency, obstetrics, paediatrics, specialist outpatient clinics, mental health, critical care and clinical support services to a population of approximately 26,000 residing over 319,000 square kilometres including the three main centres, Roma, Charleville and St George, and the surrounding areas of Augathella, Bollon, Cunnamulla, Dirranbandi, Injune, Mitchell, Morven, Mungindi, Quilpie, Surat, Thargomindah and Wallumbilla.
The South West HHS is responsible for the direct management of the facilities and services within the HHS’s geographical boundaries including its four hospitals at Charleville, Cunnamulla, Roma and St George. It also manages seven Multi-Purpose Health Services (MPHSs), four community clinics, nine general practices and two aged care facilities.
• Augathella MPHS • Morven Community Clinic • Dirranbandi Medical Centre
• Dirranbandi MPHS • Thargomindah Community Clinic • Injune Medical Practice
• Injune MPHS • Wallumbilla Community Clinic • Mitchell Medical Practice
• Mitchell MPHS • Waroona Aged Care Facility • Mungindi Doctors Surgery
• Mungindi MPHS • Westhaven Aged Care Facility • Quilpie Medical Practice
• Quilpie MPHS • Augathella Doctors Surgery • Surat Medical Practice
• Surat MPHS • Charleville Health Clinic • Dirranbandi Medical Centre
• Bollon Community Clinic • Cunnamulla Medical Practice • Injune Medical Practice
Service summary The South West HHS has an operating budget of $141.6 million for 2017-18 which is an increase of $5.8 million (4.3 per cent) from the published 2016-17 operating budget of $135.8 million.
The South West HHS contributes to the Queensland Government's objectives for the community to deliver quality frontline services including strengthening the public health system and building safe, caring and connected communities.
During 2017-18, the South West HHS will focus efforts to:
• strengthen access to health services, and expand models of care across the region• increase investment in preventative health• provide endoscopy rural generalist model with advanced skills• implement skin checks across all sites within the South West• develop and implement an integrated health system through strategic partnerships with the primary health care
sector• implement a paediatric development model of care in partnership with the Lady Cilento Children’s Hospital• implement HOPE Projects (Harmony Opportunity Potential and Empowerment) for Cunnamulla and Charleville• implement integrated primary care centre services in Cunnamulla between SWHHS and Cunnamulla Aboriginal
Corporation for Health (CACH)• increase investment in public surgical services of ophthalmology, urology and orthopaedics• improve patient safety and quality
1672017-18 Queensland State Budget - Service Delivery Statements - South West Hospital and Health Service
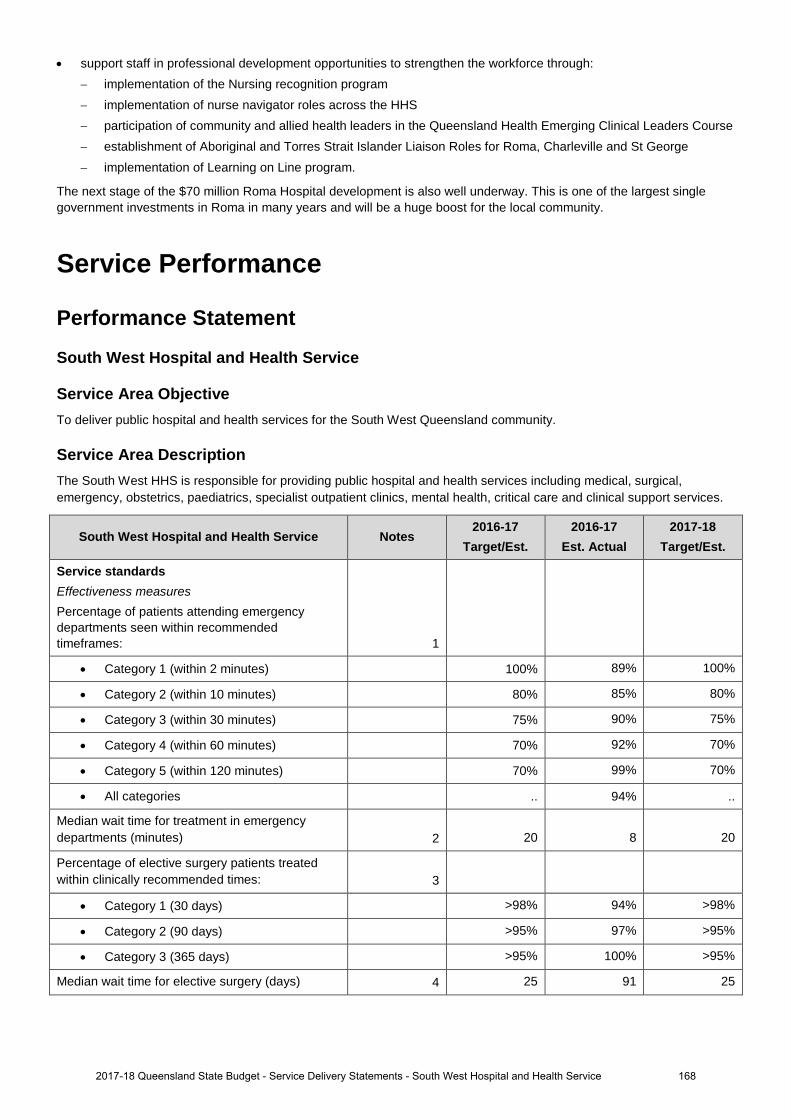
• support staff in professional development opportunities to strengthen the workforce through: − implementation of the Nursing recognition program − implementation of nurse navigator roles across the HHS − participation of community and allied health leaders in the Queensland Health Emerging Clinical Leaders Course − establishment of Aboriginal and Torres Strait Islander Liaison Roles for Roma, Charleville and St George − implementation of Learning on Line program.
The next stage of the $70 million Roma Hospital development is also well underway. This is one of the largest single government investments in Roma in many years and will be a huge boost for the local community.
Service Performance
Performance Statement
South West Hospital and Health Service
Service Area Objective To deliver public hospital and health services for the South West Queensland community.
Service Area Description The South West HHS is responsible for providing public hospital and health services including medical, surgical, emergency, obstetrics, paediatrics, specialist outpatient clinics, mental health, critical care and clinical support services.
South West Hospital and Health Service Notes 2016-17
Target/Est. 2016-17
Est. Actual 2017-18
Target/Est.
Service standards Effectiveness measures Percentage of patients attending emergency departments seen within recommended timeframes: 1
• Category 1 (within 2 minutes) 100% 89% 100%
• Category 2 (within 10 minutes) 80% 85% 80%
• Category 3 (within 30 minutes) 75% 90% 75%
• Category 4 (within 60 minutes) 70% 92% 70%
• Category 5 (within 120 minutes) 70% 99% 70%
• All categories .. 94% ..
Median wait time for treatment in emergency departments (minutes) 2 20 8 20
Percentage of elective surgery patients treated within clinically recommended times: 3
• Category 1 (30 days) >98% 94% >98%
• Category 2 (90 days) >95% 97% >95%
• Category 3 (365 days) >95% 100% >95%
Median wait time for elective surgery (days) 4 25 91 25
1682017-18 Queensland State Budget - Service Delivery Statements - South West Hospital and Health Service
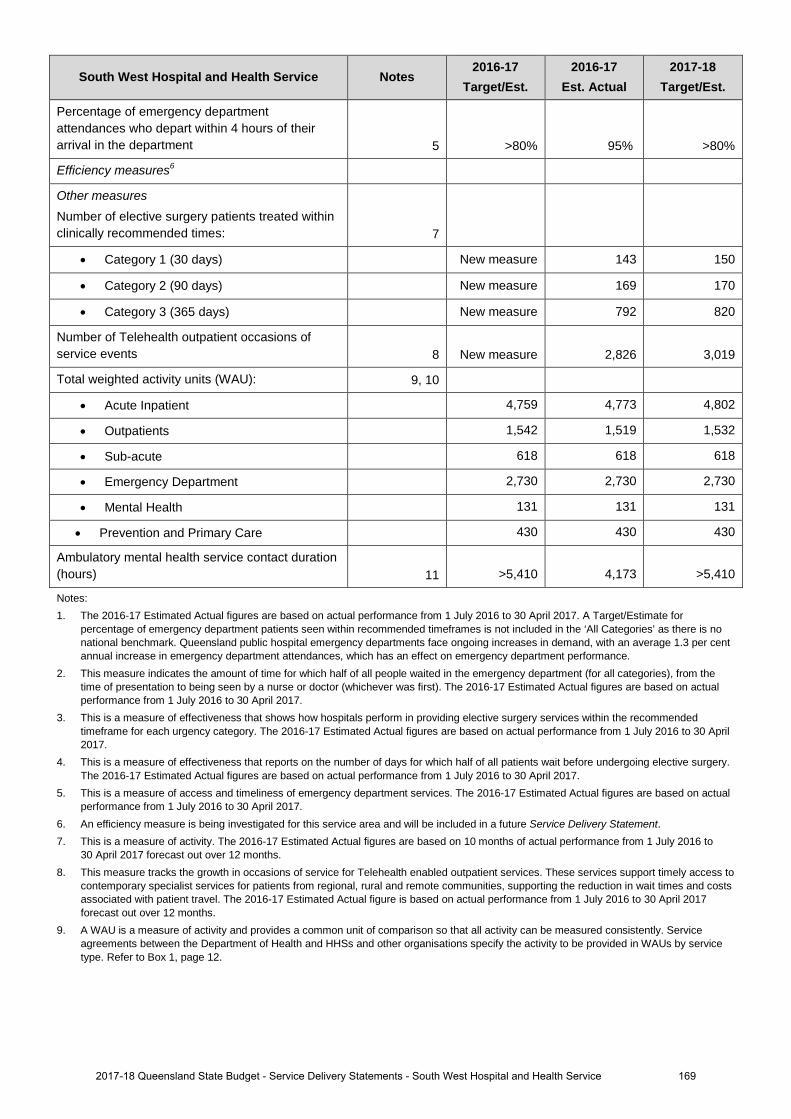
South West Hospital and Health Service Notes 2016-17
Target/Est. 2016-17
Est. Actual 2017-18
Target/Est.
Percentage of emergency department attendances who depart within 4 hours of their arrival in the department 5 >80% 95% >80%
Efficiency measures6
Other measures Number of elective surgery patients treated within clinically recommended times: 7
• Category 1 (30 days) New measure 143 150
• Category 2 (90 days) New measure 169 170
• Category 3 (365 days) New measure 792 820
Number of Telehealth outpatient occasions of service events 8 New measure 2,826 3,019
Total weighted activity units (WAU): 9, 10
• Acute Inpatient 4,759 4,773 4,802
• Outpatients 1,542 1,519 1,532
• Sub-acute 618 618 618
• Emergency Department 2,730 2,730 2,730
• Mental Health 131 131 131
• Prevention and Primary Care 430 430 430
Ambulatory mental health service contact duration (hours) 11 >5,410 4,173 >5,410
Notes: 1. The 2016-17 Estimated Actual figures are based on actual performance from 1 July 2016 to 30 April 2017. A Target/Estimate for
percentage of emergency department patients seen within recommended timeframes is not included in the ‘All Categories’ as there is no national benchmark. Queensland public hospital emergency departments face ongoing increases in demand, with an average 1.3 per cent annual increase in emergency department attendances, which has an effect on emergency department performance.
2. This measure indicates the amount of time for which half of all people waited in the emergency department (for all categories), from the time of presentation to being seen by a nurse or doctor (whichever was first). The 2016-17 Estimated Actual figures are based on actual performance from 1 July 2016 to 30 April 2017.
3. This is a measure of effectiveness that shows how hospitals perform in providing elective surgery services within the recommended timeframe for each urgency category. The 2016-17 Estimated Actual figures are based on actual performance from 1 July 2016 to 30 April 2017.
4. This is a measure of effectiveness that reports on the number of days for which half of all patients wait before undergoing elective surgery. The 2016-17 Estimated Actual figures are based on actual performance from 1 July 2016 to 30 April 2017.
5. This is a measure of access and timeliness of emergency department services. The 2016-17 Estimated Actual figures are based on actual performance from 1 July 2016 to 30 April 2017.
6. An efficiency measure is being investigated for this service area and will be included in a future Service Delivery Statement. 7. This is a measure of activity. The 2016-17 Estimated Actual figures are based on 10 months of actual performance from 1 July 2016 to
30 April 2017 forecast out over 12 months. 8. This measure tracks the growth in occasions of service for Telehealth enabled outpatient services. These services support timely access to
contemporary specialist services for patients from regional, rural and remote communities, supporting the reduction in wait times and costs associated with patient travel. The 2016-17 Estimated Actual figure is based on actual performance from 1 July 2016 to 30 April 2017 forecast out over 12 months.
9. A WAU is a measure of activity and provides a common unit of comparison so that all activity can be measured consistently. Service agreements between the Department of Health and HHSs and other organisations specify the activity to be provided in WAUs by service type. Refer to Box 1, page 12.
1692017-18 Queensland State Budget - Service Delivery Statements - South West Hospital and Health Service
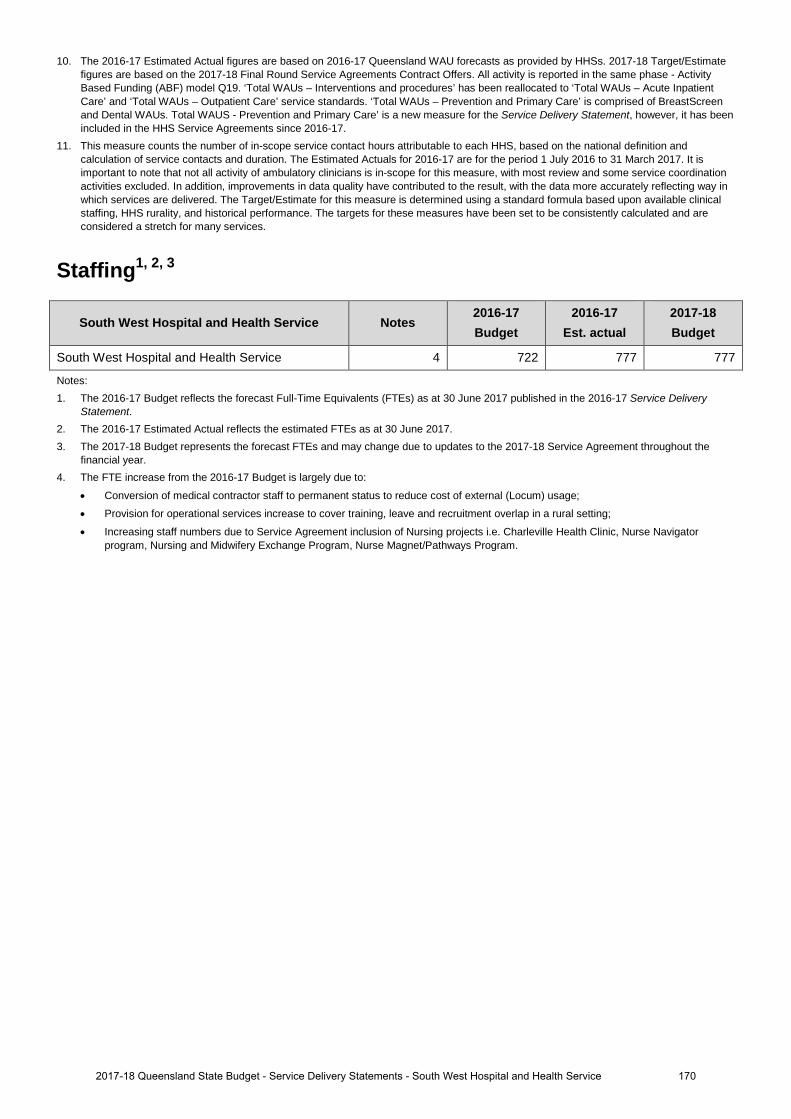
10. The 2016-17 Estimated Actual figures are based on 2016-17 Queensland WAU forecasts as provided by HHSs. 2017-18 Target/Estimatefigures are based on the 2017-18 Final Round Service Agreements Contract Offers. All activity is reported in the same phase - ActivityBased Funding (ABF) model Q19. ‘Total WAUs – Interventions and procedures’ has been reallocated to ‘Total WAUs – Acute InpatientCare’ and ‘Total WAUs – Outpatient Care’ service standards. ‘Total WAUs – Prevention and Primary Care’ is comprised of BreastScreenand Dental WAUs. Total WAUS - Prevention and Primary Care’ is a new measure for the Service Delivery Statement, however, it has beenincluded in the HHS Service Agreements since 2016-17.
11. This measure counts the number of in-scope service contact hours attributable to each HHS, based on the national definition andcalculation of service contacts and duration. The Estimated Actuals for 2016-17 are for the period 1 July 2016 to 31 March 2017. It isimportant to note that not all activity of ambulatory clinicians is in-scope for this measure, with most review and some service coordinationactivities excluded. In addition, improvements in data quality have contributed to the result, with the data more accurately reflecting way inwhich services are delivered. The Target/Estimate for this measure is determined using a standard formula based upon available clinicalstaffing, HHS rurality, and historical performance. The targets for these measures have been set to be consistently calculated and areconsidered a stretch for many services.
Staffing1, 2, 3
South West Hospital and Health Service Notes 2016-17 Budget
2016-17 Est. actual
2017-18 Budget
South West Hospital and Health Service 4 722 777 777
Notes: 1. The 2016-17 Budget reflects the forecast Full-Time Equivalents (FTEs) as at 30 June 2017 published in the 2016-17 Service Delivery
Statement. 2. The 2016-17 Estimated Actual reflects the estimated FTEs as at 30 June 2017.3. The 2017-18 Budget represents the forecast FTEs and may change due to updates to the 2017-18 Service Agreement throughout the
financial year.4. The FTE increase from the 2016-17 Budget is largely due to:
• Conversion of medical contractor staff to permanent status to reduce cost of external (Locum) usage;
• Provision for operational services increase to cover training, leave and recruitment overlap in a rural setting;
• Increasing staff numbers due to Service Agreement inclusion of Nursing projects i.e. Charleville Health Clinic, Nurse Navigatorprogram, Nursing and Midwifery Exchange Program, Nurse Magnet/Pathways Program.
1702017-18 Queensland State Budget - Service Delivery Statements - South West Hospital and Health Service

Income statement
South West Hospital and Health Service Notes 2016-17 Budget
$'000
2016-17 Est. Act.
$'000
2017-18 Budget
$'000
INCOMEUser charges and fees 1,6,10 127,952 130,493 133,711 Grants and other contributions 7,532 7,368 7,368 Interest 16 .. .. Other revenue 2 277 536 536 Gains on sale/revaluation of assets .. .. ..
Total income 135,777 138,397 141,615 EXPENSES
Employee expenses 3,7 8,118 9,341 9,365 Supplies and Services:Other supplies and services 4,8,11 49,632 46,882 46,078 Department of Health contract staff 70,544 73,429 78,558 Grants and subsidies .. .. .. Depreciation and amortisation 6,319 6,319 6,236 Finance/borrowing costs .. .. .. Other expenses 5,9 1,094 1,276 1,308 Losses on sale/revaluation of assets 70 150 70
Total expenses 135,777 137,397 141,615 OPERATING SURPLUS/(DEFICIT) .. 1,000 ..
1712017-18 Queensland State Budget - Service Delivery Statements - South West Hospital and Health Service

Balance sheet
South West Hospital and Health Service Notes 2016-17 Budget
$'000
2016-17 Est. Act.
$'000
2017-18 Budget
$'000
CURRENT ASSETSCash assets 16,076 17,304 17,169 Receivables 1,109 2,016 2,053 Other financial assets .. .. .. Inventories 693 713 717 Other 10 40 42 Non-financial assets held for sale .. .. ..
Total current assets 17,888 20,073 19,981 NON-CURRENT ASSETS
Receivables .. .. .. Other financial assets .. .. .. Property, plant and equipment 12,13,14 101,712 90,669 86,151 Intangibles .. .. .. Other .. .. ..
Total non-current assets 101,712 90,669 86,151 TOTAL ASSETS 119,600 110,742 106,132 CURRENT LIABILITIES
Payables 9,691 9,316 9,616 Accrued employee benefits 211 275 275 Interest bearing liabilities and derivatives .. .. .. Provisions .. .. .. Other 46 .. ..
Total current liabilities 9,948 9,591 9,891 NON-CURRENT LIABILITIES
Payables .. .. .. Accrued employee benefits .. .. .. Interest bearing liabilities and derivatives .. .. .. Provisions .. .. .. Other .. .. ..
Total non-current liabilities .. .. .. TOTAL LIABILITIES 9,948 9,591 9,891 NET ASSETS/(LIABILITIES) 109,652 101,151 96,241 EQUITYTOTAL EQUITY 109,652 101,151 96,241
1722017-18 Queensland State Budget - Service Delivery Statements - South West Hospital and Health Service

Cash flow statement
South West Hospital and Health Service Notes 2016-17 Budget
$'000
2016-17 Est. Act.
$'000
2017-18 Budget
$'000
CASH FLOWS FROM OPERATING ACTIVITIESInflows:
User charges and fees 15,20,23 127,898 131,561 133,650 Grants and other contributions 7,532 7,368 7,368 Interest received 16 .. .. Other 4,972 5,231 5,231
Outflows:Employee costs 16,21 (8,118) (9,277) (9,365)Supplies and services 17,22,24 (124,675) (124,649) (129,135)Grants and subsidies .. .. .. Borrowing costs .. .. .. Other (1,094) (1,028) (1,308)
Net cash provided by or used in operating activities 6,531 9,206 6,441 CASH FLOWS FROM INVESTING ACTIVITIESInflows:
Sales of non-financial assets .. .. .. Investments redeemed .. .. .. Loans and advances redeemed .. .. ..
Outflows:Payments for non-financial assets 18,25 (1,465) (5,889) (1,718)Payments for investments .. .. .. Loans and advances made .. .. ..
Net cash provided by or used in investing activities (1,465) (5,889) (1,718)CASH FLOWS FROM FINANCING ACTIVITIESInflows:
Borrowings .. .. .. Equity injections 19,26 1,465 2,153 1,378
Outflows:Borrowing redemptions .. .. .. Finance lease payments .. .. .. Equity withdrawals (6,319) (6,319) (6,236)
Net cash provided by or used in financing activities (4,854) (4,166) (4,858)Net increase/(decrease) in cash held 212 (849) (135)Cash at the beginning of financial year 15,864 18,153 17,304
Cash transfers from restructure .. .. .. Cash at the end of financial year 16,076 17,304 17,169
1732017-18 Queensland State Budget - Service Delivery Statements - South West Hospital and Health Service
Income statementMajor variations between 2016-17 Budget and 2016-17 Estimated Actual include:
1. The increase is due to reimbursements for Pharmaceutical Benefits Scheme (PBS) drugs, and amendments to the Service Agreement between South West Hospital and Health Service (HHS) and the Department of Health.
2. The increase is due to specific purpose funding to implement telehealth service models and development of ruralgeneralist nurse program in 2016-17.
3. The increase is due to the appointment of additional senior medical officers in 2016-17.
4. The changes are due to increases in contracted radiology services, with decreases in travel expenses and contractors expense.
5. The increase is due to facility fees incurred for the provision of medical services at private practices.
Major variations between 2016-17 Budget and 2017-18 Budget include:
6. The increase is due to reimbursements for PBS drugs, deferrals of funding from 2016-17 to 2017-18, enterprise bargaining funding, amendments to the service agreement between South West HHS and the Department of Health.
7. The increase is due to the appointment of additional senior medical officers in 2016-17.
8. Overall impact is a decrease in medical locum contractors and others supplies and services. Partially offset by anincrease in outsourced radiology services.
9. The increase is due to facility fees incurred for the provision of medical services at private practices.
Major variations between 2016-17 Estimated Actual and the 2017-18 Budget include:
10. The increase is due to deferrals of funding from 2016-17 to 2017-18, enterprise bargaining funding, amendments to the service agreement between South West HHS and the Department of Health.
11. The changes are due to increases in contracted radiology services, with decreases in travel expenses and contractors expense.
Balance sheetMajor variations between 2016-17 Budget and 2016-17 Estimated Actual include:
12. The decrease is due to the roll forward process for revalued asset balances and write downs.
Major variations between 2016-17 Budget and 2017-18 Budget include:
13. The decrease is due to the annual depreciation of assets, roll forward process for revalued asset balances andwrite downs.
Major variations between 2016-17 Estimated Actual and the 2017-18 Budget include:
14. The decrease is due to the annual depeciation on assets.
Cash flow statementMajor variations between 2016-17 Budget and 2016-17 Estimated Actual include:
15. The increase is due to additional inflow from accounts receivable, reimbursements for PBS drugs and amendments to the service agreement between South West Hospital and Health Service (HHS) and the Department of Health.
16. The increase is due to the appointment of additional senior medical officers in 2016-17.
17. The change is due to an increase in payments to Department of Health for employed clinical staff to deliver approved programs
under the service agreement, partially offset by a reduction in contracted clinical staff.
18. This is related to the timing of budgeted works for Charleville and Cunnamulla occurring in the subsequent year. The utilisation of a larger percentage of our HTER funding in the first year of the program 2016-17 rather than in
2017-18.
Explanation of variances in the financial statements
1742017-18 Queensland State Budget - Service Delivery Statements - South West Hospital and Health Service
19. This is related to the utilisation of a larger percentage of our HTER funding in the first year of the program 2016- 17 rather than in 2017-18. The HTER program is funded via Equity Injections.
Major variations between 2016-17 Budget and 2017-18 Budget include:
20. The increase is due to additional inflow from accounts receivable, reimbursements for PBS drugs and amendments to the service agreement between South West HHS and the Department of Health.
21. The increase is due to the appointment of additional senior medical officers in 2016-17
22. The change is due to enterprise bargaining funding, increase in staffing levels to deliver approved clinicalprograms under the service agreement, and a decrease in other supplies and services.
Major variations between 2016-17 Estimated Actual and the 2017-18 Budget include:
23. The increase is due to additional inflow from accounts receivable, reimbursements for PBS drugs and amendments to the service agreement between South West HHS and the Department of Health.
24. The change is due to enterprise bargaining funding, increase in staffing levels to deliver approved clinicalprograms under the service agreement, and a decrease in other supplies and services.
25. This is related to the timing of budgeted works for Charleville and Cunnamulla occurring in the subsequent year.The utilisation of a larger percentage of our HTER funding in the first year of the program 2016-17 rather than in2017-18.
26. This is related to the utilisation of a larger percentage of our HTER funding in the first year of the program 2016-17 rather than in 2017-18. The HTER program is funded via Equity Injections.
1752017-18 Queensland State Budget - Service Delivery Statements - South West Hospital and Health Service
Sunshine Coast Hospital and Health Service
Overview The Sunshine Coast Hospital and Health Service (HHS) is an independent statutory body overseen by a local Hospital and Health Board. The Sunshine Coast HHS provides public health services through the geographical area that extends from Caloundra in the south to Gympie in the north. The Sunshine Coast HHS operates the following facilities:
• Sunshine Coast University Hospital• Caloundra Hospital• Glenbrook Residential Aged Care Facility• Gympie Hospital• Maleny Soldiers Memorial Hospital• Nambour General Hospital.
Public patients also have access to care at Noosa Hospital and the Sunshine Coast University Private Hospital under contractual arrangements.
The Sunshine Coast HHS also provides a comprehensive range of community and primary health services across its catchment.
The Sunshine Coast HHS is a dynamic health service provider that operates in an environment where quality patient care is paramount. Our vision, as a health service, is to provide health and wellbeing through exceptional care.
The Sunshine Coast HHS strategic objectives are:
• better care and experience for individuals• better outcomes for our local population• better use of resources for healthcare• better organisational capability.
The Sunshine Coast HHS has aligned its future planning to the Queensland Government’s objectives for the community: creating jobs and a diverse economy; delivering quality frontline services; and building safe, caring and connected communities. This will be achieved through:
• further development of tertiary services at the Sunshine Coast University Hospital• further development and enhancement of the expected tertiary health care provider level initiatives at the Sunshine
Coast Health Institute, a skills, academic and research centre, in partnership with University of the Sunshine Coast,TAFE Queensland East Coast and a medical school partner
• implementing models of care/service delivery that include workforce innovation, service redesign and newtechnologies to improve access, safety and consistent care across all Sunshine Coast HHS services and locations
• continuing direct engagement and involvement of staff in the planning and preparing for the expanded range oftertiary services that will be provided following the next stage of the university hospital
• further embedding community and consumer engagement in service planning and evaluation.
The Sunshine Coast HHS’s most significant challenge is meeting service demands associated with its rapidly growing and ageing population. The commencement of services at Sunshine Coast University Hospital and its ongoing planned growth to its built capacity, together with the redevelopments of Nambour and Caloundra Hospitals, as well as the extension of the clinical service capability of Gympie Hospital, will change the way services are delivered across the health service. This exciting opportunity has supported the HHS to introduce innovative models of care that will better meet the diverse health care needs of its community.
1762017-18 Queensland State Budget - Service Delivery Statements - Sunshine Coast Hospital and Health Service
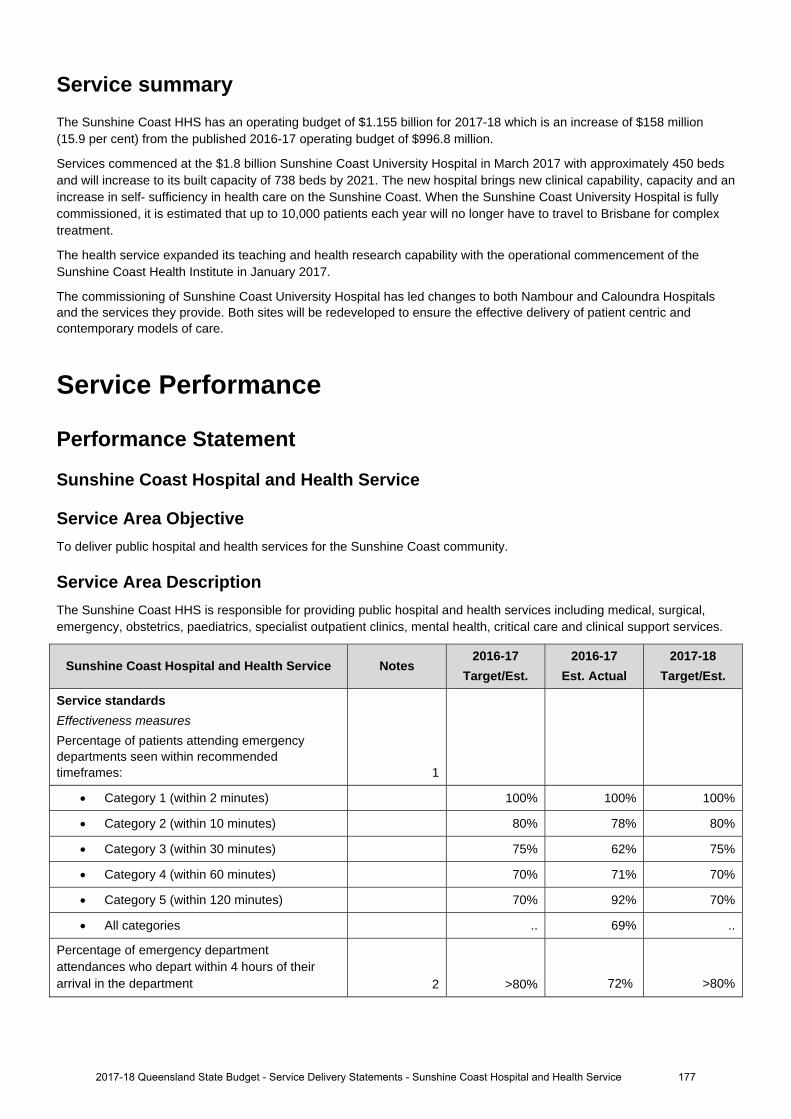
Service summary The Sunshine Coast HHS has an operating budget of $1.155 billion for 2017-18 which is an increase of $158 million (15.9 per cent) from the published 2016-17 operating budget of $996.8 million.
Services commenced at the $1.8 billion Sunshine Coast University Hospital in March 2017 with approximately 450 beds and will increase to its built capacity of 738 beds by 2021. The new hospital brings new clinical capability, capacity and an increase in self- sufficiency in health care on the Sunshine Coast. When the Sunshine Coast University Hospital is fully commissioned, it is estimated that up to 10,000 patients each year will no longer have to travel to Brisbane for complex treatment.
The health service expanded its teaching and health research capability with the operational commencement of the Sunshine Coast Health Institute in January 2017.
The commissioning of Sunshine Coast University Hospital has led changes to both Nambour and Caloundra Hospitals and the services they provide. Both sites will be redeveloped to ensure the effective delivery of patient centric and contemporary models of care.
Service Performance
Performance Statement
Sunshine Coast Hospital and Health Service
Service Area Objective To deliver public hospital and health services for the Sunshine Coast community.
Service Area Description The Sunshine Coast HHS is responsible for providing public hospital and health services including medical, surgical, emergency, obstetrics, paediatrics, specialist outpatient clinics, mental health, critical care and clinical support services.
Sunshine Coast Hospital and Health Service Notes 2016-17
Target/Est. 2016-17
Est. Actual 2017-18
Target/Est.
Service standards Effectiveness measures
Percentage of patients attending emergency departments seen within recommended timeframes: 1
Category 1 (within 2 minutes) 100% 100% 100%
Category 2 (within 10 minutes) 80% 78% 80%
Category 3 (within 30 minutes) 75% 62% 75%
Category 4 (within 60 minutes) 70% 71% 70%
Category 5 (within 120 minutes) 70% 92% 70%
All categories .. 69% ..
Percentage of emergency department attendances who depart within 4 hours of their arrival in the department 2 >80% 72% >80%
2017-18 Queensland State Budget - Service Delivery Statements - Sunshine Coast Hospital and Health Service 177
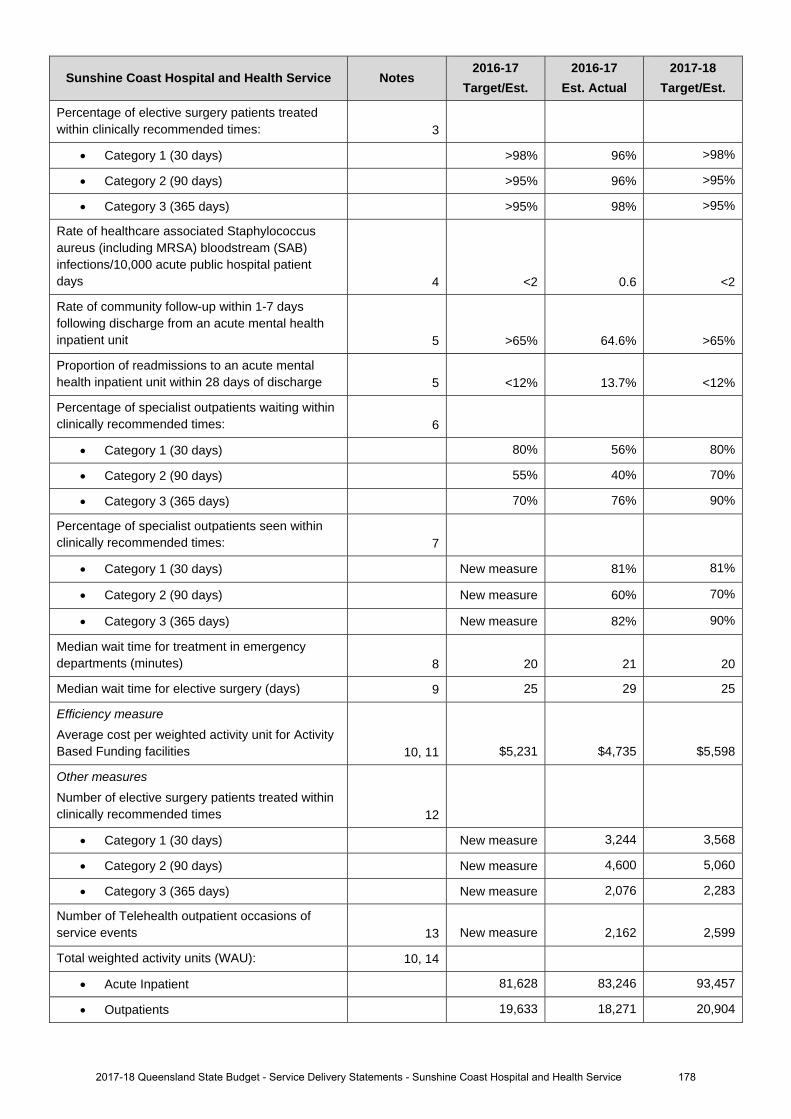
Sunshine Coast Hospital and Health Service Notes 2016-17
Target/Est. 2016-17
Est. Actual 2017-18
Target/Est.
Percentage of elective surgery patients treated within clinically recommended times: 3
Category 1 (30 days) >98% 96% >98%
Category 2 (90 days) >95% 96% >95%
Category 3 (365 days) >95% 98% >95%
Rate of healthcare associated Staphylococcus aureus (including MRSA) bloodstream (SAB) infections/10,000 acute public hospital patient days 4 <2 0.6 <2
Rate of community follow-up within 1-7 days following discharge from an acute mental health inpatient unit 5 >65% 64.6% >65%
Proportion of readmissions to an acute mental health inpatient unit within 28 days of discharge 5 <12% 13.7% <12%
Percentage of specialist outpatients waiting within clinically recommended times: 6
Category 1 (30 days) 80% 56% 80%
Category 2 (90 days) 55% 40% 70%
Category 3 (365 days) 70% 76% 90%
Percentage of specialist outpatients seen within clinically recommended times: 7
Category 1 (30 days) New measure 81% 81%
Category 2 (90 days) New measure 60% 70%
Category 3 (365 days) New measure 82% 90%
Median wait time for treatment in emergency departments (minutes) 8 20 21 20
Median wait time for elective surgery (days) 9 25 29 25
Efficiency measure
Average cost per weighted activity unit for Activity Based Funding facilities 10, 11 $5,231 $4,735 $5,598
Other measures
Number of elective surgery patients treated within clinically recommended times 12
Category 1 (30 days) New measure 3,244 3,568
Category 2 (90 days) New measure 4,600 5,060
Category 3 (365 days) New measure 2,076 2,283
Number of Telehealth outpatient occasions of service events 13 New measure 2,162 2,599
Total weighted activity units (WAU): 10, 14
Acute Inpatient 81,628 83,246 93,457
Outpatients 19,633 18,271 20,904
2017-18 Queensland State Budget - Service Delivery Statements - Sunshine Coast Hospital and Health Service 178
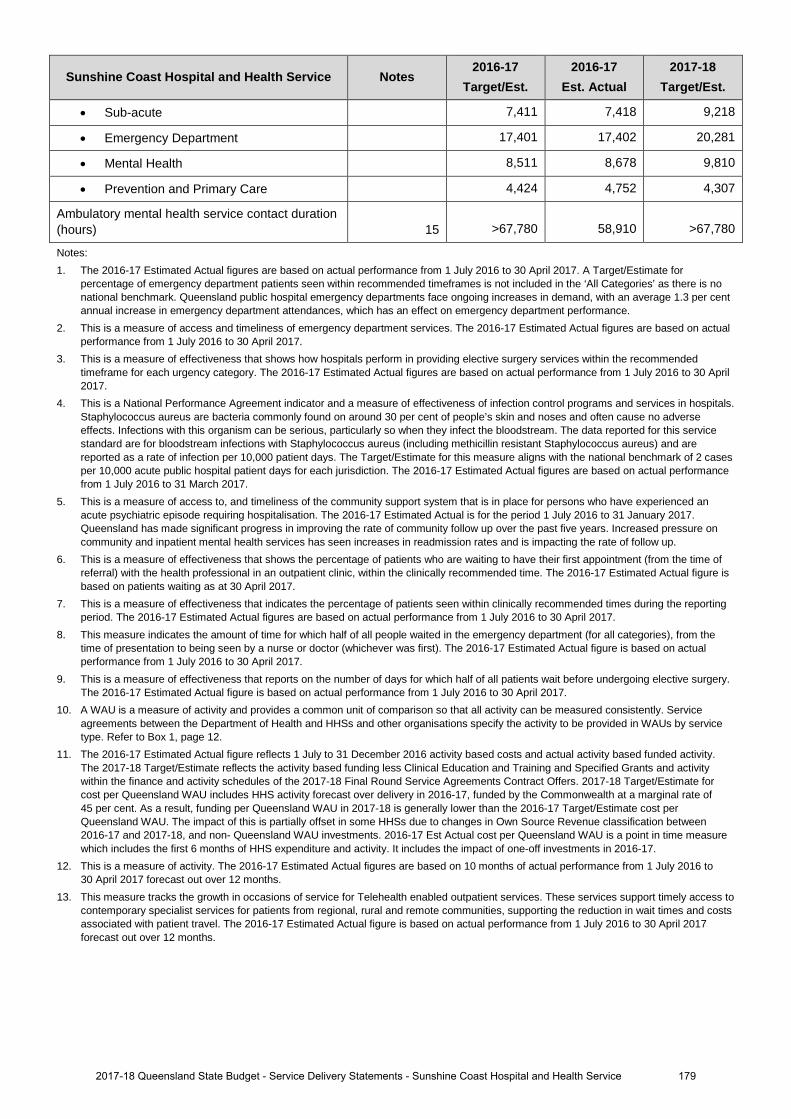
Sunshine Coast Hospital and Health Service Notes 2016-17
Target/Est. 2016-17
Est. Actual 2017-18
Target/Est.
• Sub-acute 7,411 7,418 9,218
• Emergency Department 17,401 17,402 20,281
• Mental Health 8,511 8,678 9,810
• Prevention and Primary Care 4,424 4,752 4,307
Ambulatory mental health service contact duration (hours) 15 >67,780 58,910 >67,780
Notes: 1. The 2016-17 Estimated Actual figures are based on actual performance from 1 July 2016 to 30 April 2017. A Target/Estimate for
percentage of emergency department patients seen within recommended timeframes is not included in the ‘All Categories’ as there is no national benchmark. Queensland public hospital emergency departments face ongoing increases in demand, with an average 1.3 per cent annual increase in emergency department attendances, which has an effect on emergency department performance.
2. This is a measure of access and timeliness of emergency department services. The 2016-17 Estimated Actual figures are based on actual performance from 1 July 2016 to 30 April 2017.
3. This is a measure of effectiveness that shows how hospitals perform in providing elective surgery services within the recommended timeframe for each urgency category. The 2016-17 Estimated Actual figures are based on actual performance from 1 July 2016 to 30 April 2017.
4. This is a National Performance Agreement indicator and a measure of effectiveness of infection control programs and services in hospitals. Staphylococcus aureus are bacteria commonly found on around 30 per cent of people’s skin and noses and often cause no adverse effects. Infections with this organism can be serious, particularly so when they infect the bloodstream. The data reported for this service standard are for bloodstream infections with Staphylococcus aureus (including methicillin resistant Staphylococcus aureus) and are reported as a rate of infection per 10,000 patient days. The Target/Estimate for this measure aligns with the national benchmark of 2 cases per 10,000 acute public hospital patient days for each jurisdiction. The 2016-17 Estimated Actual figures are based on actual performance from 1 July 2016 to 31 March 2017.
5. This is a measure of access to, and timeliness of the community support system that is in place for persons who have experienced an acute psychiatric episode requiring hospitalisation. The 2016-17 Estimated Actual is for the period 1 July 2016 to 31 January 2017. Queensland has made significant progress in improving the rate of community follow up over the past five years. Increased pressure on community and inpatient mental health services has seen increases in readmission rates and is impacting the rate of follow up.
6. This is a measure of effectiveness that shows the percentage of patients who are waiting to have their first appointment (from the time of referral) with the health professional in an outpatient clinic, within the clinically recommended time. The 2016-17 Estimated Actual figure is based on patients waiting as at 30 April 2017.
7. This is a measure of effectiveness that indicates the percentage of patients seen within clinically recommended times during the reporting period. The 2016-17 Estimated Actual figures are based on actual performance from 1 July 2016 to 30 April 2017.
8. This measure indicates the amount of time for which half of all people waited in the emergency department (for all categories), from the time of presentation to being seen by a nurse or doctor (whichever was first). The 2016-17 Estimated Actual figure is based on actual performance from 1 July 2016 to 30 April 2017.
9. This is a measure of effectiveness that reports on the number of days for which half of all patients wait before undergoing elective surgery. The 2016-17 Estimated Actual figure is based on actual performance from 1 July 2016 to 30 April 2017.
10. A WAU is a measure of activity and provides a common unit of comparison so that all activity can be measured consistently. Service agreements between the Department of Health and HHSs and other organisations specify the activity to be provided in WAUs by service type. Refer to Box 1, page 12.
11. The 2016-17 Estimated Actual figure reflects 1 July to 31 December 2016 activity based costs and actual activity based funded activity. The 2017-18 Target/Estimate reflects the activity based funding less Clinical Education and Training and Specified Grants and activity within the finance and activity schedules of the 2017-18 Final Round Service Agreements Contract Offers. 2017-18 Target/Estimate for cost per Queensland WAU includes HHS activity forecast over delivery in 2016-17, funded by the Commonwealth at a marginal rate of 45 per cent. As a result, funding per Queensland WAU in 2017-18 is generally lower than the 2016-17 Target/Estimate cost per Queensland WAU. The impact of this is partially offset in some HHSs due to changes in Own Source Revenue classification between 2016-17 and 2017-18, and non- Queensland WAU investments. 2016-17 Est Actual cost per Queensland WAU is a point in time measure which includes the first 6 months of HHS expenditure and activity. It includes the impact of one-off investments in 2016-17.
12. This is a measure of activity. The 2016-17 Estimated Actual figures are based on 10 months of actual performance from 1 July 2016 to 30 April 2017 forecast out over 12 months.
13. This measure tracks the growth in occasions of service for Telehealth enabled outpatient services. These services support timely access to contemporary specialist services for patients from regional, rural and remote communities, supporting the reduction in wait times and costs associated with patient travel. The 2016-17 Estimated Actual figure is based on actual performance from 1 July 2016 to 30 April 2017 forecast out over 12 months.
1792017-18 Queensland State Budget - Service Delivery Statements - Sunshine Coast Hospital and Health Service
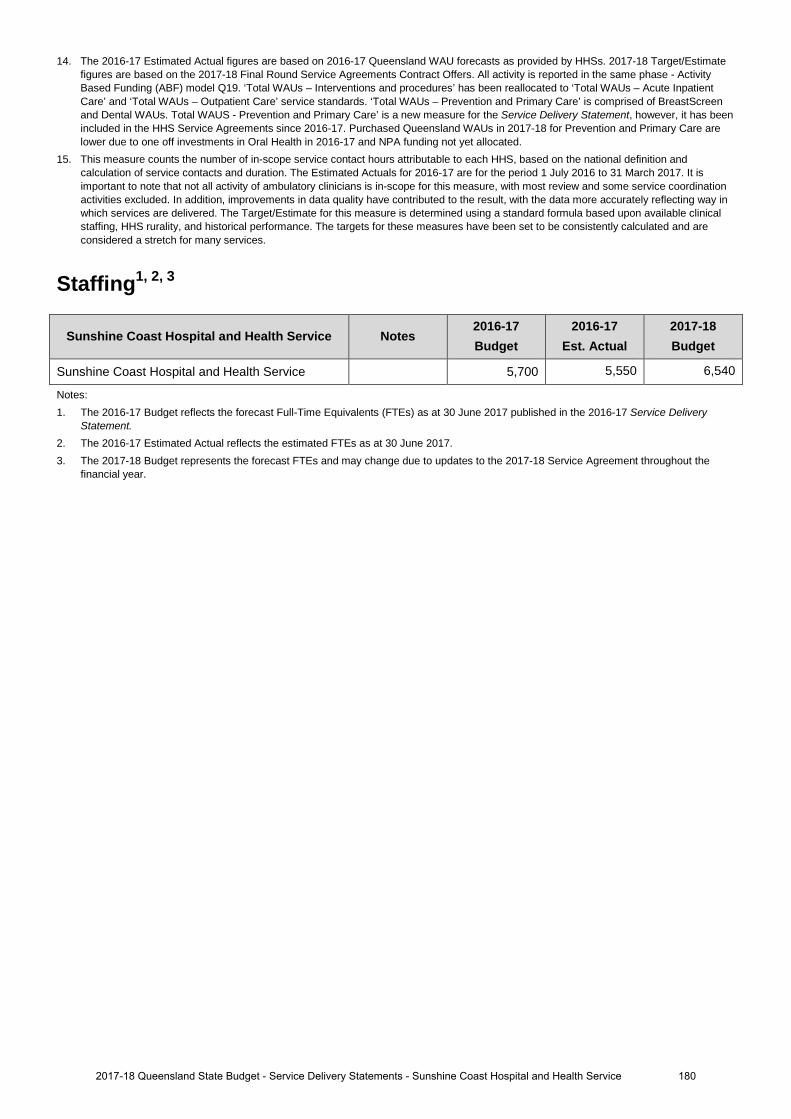
14. The 2016-17 Estimated Actual figures are based on 2016-17 Queensland WAU forecasts as provided by HHSs. 2017-18 Target/Estimate figures are based on the 2017-18 Final Round Service Agreements Contract Offers. All activity is reported in the same phase - Activity Based Funding (ABF) model Q19. ‘Total WAUs – Interventions and procedures’ has been reallocated to ‘Total WAUs – Acute Inpatient Care’ and ‘Total WAUs – Outpatient Care’ service standards. ‘Total WAUs – Prevention and Primary Care’ is comprised of BreastScreen and Dental WAUs. Total WAUS - Prevention and Primary Care’ is a new measure for the Service Delivery Statement, however, it has been included in the HHS Service Agreements since 2016-17. Purchased Queensland WAUs in 2017-18 for Prevention and Primary Care are lower due to one off investments in Oral Health in 2016-17 and NPA funding not yet allocated.
15. This measure counts the number of in-scope service contact hours attributable to each HHS, based on the national definition and calculation of service contacts and duration. The Estimated Actuals for 2016-17 are for the period 1 July 2016 to 31 March 2017. It is important to note that not all activity of ambulatory clinicians is in-scope for this measure, with most review and some service coordination activities excluded. In addition, improvements in data quality have contributed to the result, with the data more accurately reflecting way in which services are delivered. The Target/Estimate for this measure is determined using a standard formula based upon available clinical staffing, HHS rurality, and historical performance. The targets for these measures have been set to be consistently calculated and are considered a stretch for many services.
Staffing1, 2, 3
Sunshine Coast Hospital and Health Service Notes 2016-17 Budget
2016-17 Est. Actual
2017-18 Budget
Sunshine Coast Hospital and Health Service 5,700 5,550 6,540
Notes: 1. The 2016-17 Budget reflects the forecast Full-Time Equivalents (FTEs) as at 30 June 2017 published in the 2016-17 Service Delivery
Statement. 2. The 2016-17 Estimated Actual reflects the estimated FTEs as at 30 June 2017. 3. The 2017-18 Budget represents the forecast FTEs and may change due to updates to the 2017-18 Service Agreement throughout the
financial year.
1802017-18 Queensland State Budget - Service Delivery Statements - Sunshine Coast Hospital and Health Service
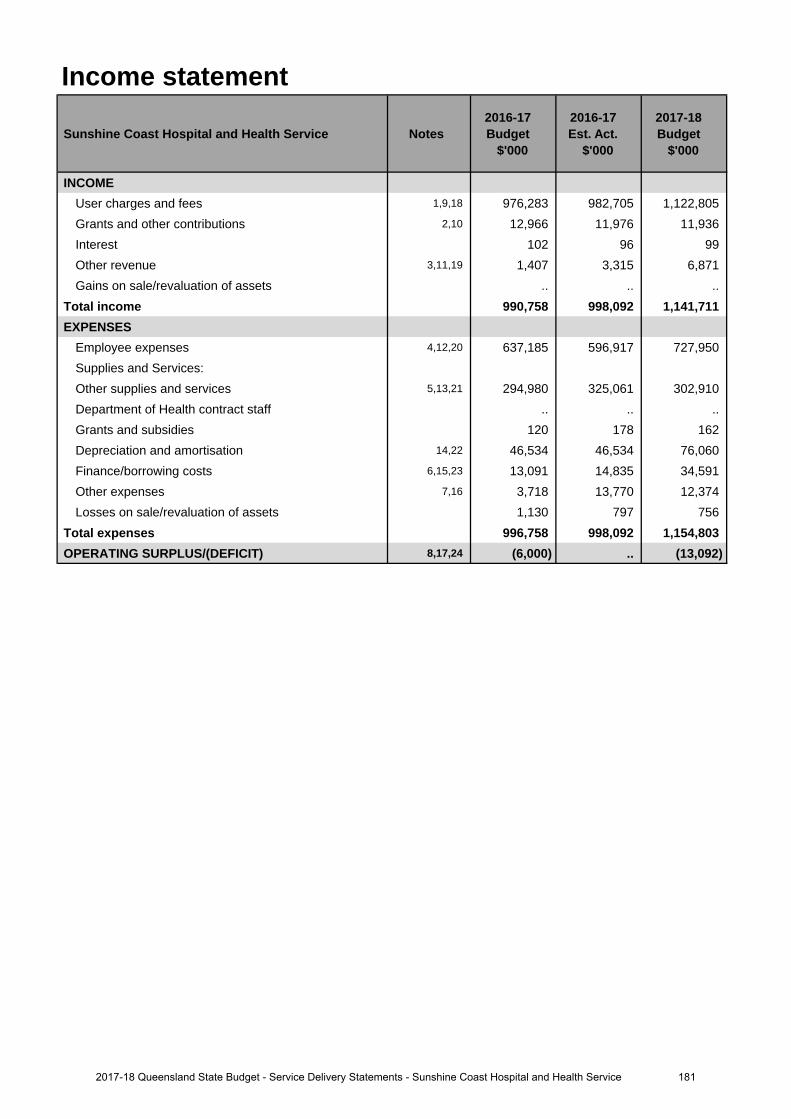
Income statement
Sunshine Coast Hospital and Health Service Notes 2016-17 Budget
$'000
2016-17 Est. Act.
$'000
2017-18 Budget
$'000
INCOMEUser charges and fees 1,9,18 976,283 982,705 1,122,805 Grants and other contributions 2,10 12,966 11,976 11,936 Interest 102 96 99 Other revenue 3,11,19 1,407 3,315 6,871 Gains on sale/revaluation of assets .. .. ..
Total income 990,758 998,092 1,141,711 EXPENSES
Employee expenses 4,12,20 637,185 596,917 727,950 Supplies and Services:Other supplies and services 5,13,21 294,980 325,061 302,910 Department of Health contract staff .. .. .. Grants and subsidies 120 178 162 Depreciation and amortisation 14,22 46,534 46,534 76,060 Finance/borrowing costs 6,15,23 13,091 14,835 34,591 Other expenses 7,16 3,718 13,770 12,374 Losses on sale/revaluation of assets 1,130 797 756
Total expenses 996,758 998,092 1,154,803 OPERATING SURPLUS/(DEFICIT) 8,17,24 (6,000) .. (13,092)
1812017-18 Queensland State Budget - Service Delivery Statements - Sunshine Coast Hospital and Health Service

Balance sheet
Sunshine Coast Hospital and Health Service Notes 2016-17 Budget
$'000
2016-17 Est. Act.
$'000
2017-18 Budget
$'000
CURRENT ASSETSCash assets 25,43 60,078 88,232 64,136 Receivables 26,35 12,831 15,559 15,937 Other financial assets .. .. .. Inventories 27,36 4,335 5,891 5,999 Other 504 791 832 Non-financial assets held for sale .. .. ..
Total current assets 77,748 110,473 86,904 NON-CURRENT ASSETS
Receivables .. .. .. Other financial assets .. .. .. Property, plant and equipment 28,37 1,493,647 1,620,891 1,603,804 Intangibles 29,38,44 44,512 18,236 21,547 Other .. .. ..
Total non-current assets 1,538,159 1,639,127 1,625,351 TOTAL ASSETS 1,615,907 1,749,600 1,712,255 CURRENT LIABILITIES
Payables 30,39 37,884 49,785 50,815 Accrued employee benefits 31,45 23,709 21,674 23,538 Interest bearing liabilities and derivatives 32,40,46 .. 6,459 7,048 Provisions .. .. .. Other .. 1 1
Total current liabilities 61,593 77,919 81,402 NON-CURRENT LIABILITIES
Payables .. .. .. Accrued employee benefits .. .. .. Interest bearing liabilities and derivatives 33,41,47 .. 451,223 444,175 Provisions .. .. .. Other .. .. ..
Total non-current liabilities .. 451,223 444,175 TOTAL LIABILITIES 61,593 529,142 525,577 NET ASSETS/(LIABILITIES) 1,554,314 1,220,458 1,186,678 EQUITYTOTAL EQUITY 34,42 1,554,314 1,220,458 1,186,678
1822017-18 Queensland State Budget - Service Delivery Statements - Sunshine Coast Hospital and Health Service

Cash flow statement
Sunshine Coast Hospital and Health Service Notes 2016-17 Budget
$'000
2016-17 Est. Act.
$'000
2017-18 Budget
$'000
CASH FLOWS FROM OPERATING ACTIVITIESInflows:
User charges and fees 48,58,69 975,004 1,006,630 1,122,121 Grants and other contributions 49,59 12,898 11,867 11,825 Interest received 102 96 99 Other 50,60,70 19,805 21,713 25,913
Outflows:Employee costs 51,61,71 (632,636) (593,548) (726,086)Supplies and services 52,62,72 (316,895) (336,208) (320,872)Grants and subsidies (120) (178) (162)Borrowing costs 53,63,73 (13,091) (14,835) (34,591)Other 54,64 (3,828) (13,948) (12,740)
Net cash provided by or used in operating activities 41,239 81,589 65,507 CASH FLOWS FROM INVESTING ACTIVITIESInflows:
Sales of non-financial assets (139) (172) (172)Investments redeemed .. .. .. Loans and advances redeemed .. .. ..
Outflows:Payments for non-financial assets 55,65,74 (27,939) (19,644) (14,950)Payments for investments .. .. .. Loans and advances made .. .. ..
Net cash provided by or used in investing activities (28,078) (19,816) (15,122)CASH FLOWS FROM FINANCING ACTIVITIESInflows:
Borrowings .. .. .. Equity injections 56,66,75 6,145 4,342 8,038
Outflows:Borrowing redemptions 57,67,76 .. (2,303) (6,459)Finance lease payments .. .. .. Equity withdrawals 68,77 (46,534) (46,534) (76,060)
Net cash provided by or used in financing activities (40,389) (44,495) (74,481)Net increase/(decrease) in cash held (27,228) 17,278 (24,096)Cash at the beginning of financial year 87,306 70,954 88,232
Cash transfers from restructure .. .. .. Cash at the end of financial year 60,078 88,232 64,136
1832017-18 Queensland State Budget - Service Delivery Statements - Sunshine Coast Hospital and Health Service
Income statementMajor variations between 2016-17 Budget and 2016-17 Estimated Actual include:
1. The increase in user charges and fees relates to additional funding provided under amendments to the serviceagreement between the Sunshine Coast Hospital and Health Service and the Department of Health for thecommencement of services at the new Sunshine Coast University Hospital and enterprise bargaining agreements.
2. The decrease in grants and other contributions relates to a revision of the accrual of transition care expenditurereimbursements receivable from the Commonwealth Government and the reclassification of Home andCommunity Care revenues from grants and other contributions to user charges.
3. The increase in other revenue relates to full year revenues from staff car parking fees (ultimately charged by Exemplar Health) at the new Sunshine Coast University Hospital. There is an equal and offsetting increase in expenses associated with this revenue when fees collected are paid to Exemplar Health by the health service.
4. The decrease in employee expenses relates to the re-phasing of onboarding of employees as part of the stagedphased commencement of services at the new Sunshine Coast University Hospital.
5. The increase in other supplies and services relates to additional expenditure funded under amendments to theservice agreement between the Sunshine Coast Hospital and Health Service and the Department of Health for thenew Sunshine Coast University Hospital including contractor costs re-classified from capital expenditure tooperating expenditure for the construction of information and communications technology assets, clinical supplies,computer related expenses and the service maintenance agreement with Exemplar Health.
6. The increase in finance/borrowing costs relates to revised expenses for the Sunshine Coast University Hospitalassets which are partially funded under an interest bearing liability. Budgeted expenditure in 2017-18 represents afull year whereas budgeted expenditure in 2016-17 was only part year.
7. The increase in other expenses relates to costs reclassified from supplies and services under the serviceagreement between the Sunshine Coast Hospital and Health Service and Exemplar Health for the new SunshineCoast University Hospital.
8. A deficit is no longer expected in 2016-17 due to effective financial controls and savings flowing from the re-phasing of employee on-boarding as part of the phased commencement of services at the new Sunshine CoastUniversity Hospital.
Major variations between 2016-17 Budget and 2017-18 Budget include:
9. The increase in user charges and fees relates to additional funding provided under amendments to the serviceagreement between the Sunshine Coast Hospital and Health Service and the Department of Health for growth atthe new Sunshine Coast University Hospital and enterprise bargaining agreements.
10. The decrease in grants and other contributions relates to a revision of the accrual of transition care expenditurereimbursements receivable from the Commonwealth Government and the reclassification of Home andCommunity Care revenues from grants and other contributions to user charges.
11. The increase in other revenue relates to full year revenues from staff car parking fees (ultimately charged by Exemplar Health) at the new Sunshine Coast University Hospital. There is an equal and offsetting increase in expenses associated with this revenue when fees collected are paid to Exemplar Health by the health service.
12. The increase in employee expenses relates to the full year impact of additional expenditure funded underamendments to the service agreement between the Sunshine Coast Hospital and Health Service and theDepartment of Health for continued on-boarding of employees as part of the phased commencement of servicesat the new Sunshine Coast University Hospital, and enterprise bargaining agreements. Budgeted expenditure in2017-18 represents a full year of expanded services whereas budgeted expenditure in 2016-17 was only partyear.
13. The increase in other supplies and services relates to the full year impact of additional expenditure funded underamendments to the service agreement between the Sunshine Coast Hospital and Health Service and theDepartment of Health for the new Sunshine Coast University Hospital including contractor costs re-classified fromcapital expenditure to operating expenditure for the construction of information and communications technologyassets, clinical supplies, communications/computer related expenses and the service maintenance agreementwith Exemplar Health. Budgeted expenditure in 2017-18 represents a full year of expanded services whereasbudgeted expenditure in 2016-17 was only part year.
14. The increase in depreciation and amortisation represents the additional expense to be incurred following thecompletion of the construction of the Sunshine Coast University Hospital.
Explanation of variances in the financial statements
1842017-18 Queensland State Budget - Service Delivery Statements - Sunshine Coast Hospital and Health Service
15. The increase in finance/borrowing costs relates to interest expenses for the Sunshine Coast University Hospitalassets which are partially funded under an interest bearing liability.
16. The increase in other expenses relates to costs reclassified from other supplies and services under the serviceagreement between the Sunshine Coast Hospital and Health Service and Exemplar Health for the SunshineCoast University Hospital.
17. The deficit budgeted in 2017-18 relates to amendments to the service agreement between the Sunshine CoastHospital and Health Service and the Department of Health to fund non-recurrent expenditure as part of thecommencement of services at the new Sunshine Coast University Hospital. The deficit will be partially fundedfrom cash reserves accumulated from operating surpluses in previous years.
Major variations between 2016-17 Estimated Actual and the 2017-18 Budget include:
18. The increase in user charges and fees relates to additional funding provided under amendments to the serviceagreement between the Sunshine Coast Hospital and Health Service and the Department of Health for growth atthe new Sunshine Coast University Hospital and enterprise bargaining agreements.
19. The increase in other revenue relates to revenues from staff car parking fees at the new Sunshine Coast University Hospital. There is an equal and offsetting increase in expenses associated with this revenue when fees collected are paid to Exemplar Health by the health service.
20. The increase in employee expenses relates to the full year impact of additional expenditure funded underamendments to the service agreement between the Sunshine Coast Hospital and Health Service and theDepartment of Health for continued on-boarding of employees as part of the phased commencement of servicesat the new Sunshine Coast University Hospital, and enterprise bargaining agreements. Budgeted expenditure in2017-18 represents a full year of expanded services whereas budgeted expenditure in 2016-17 was only partyear.
21. The decrease in other supplies and services relates to a reduction in expenditure funded under amendments tothe service agreement between the Sunshine Coast Hospital and Health Service and the Department of Health forreduced services outsourced to Ramsay Health Care for patients transferred to the Sunshine Coast UniversityPrivate Hospital.
22. The increase in depreciation and amortisation represents the additional expense to be incurred following thecompletion of the construction of the Sunshine Coast University Hospital.
23. The increase in finance/borrowing costs relates to interest expenses for the Sunshine Coast University Hospitalassets which are partially funded under an interest bearing liability. Budgeted expenditure in 2017-18 representsa full year whereas expenditure in 2016-17 is only part year.
24. The deficit in 2017-18 relates to amendments to the service agreement between the Sunshine Coast Hospital andHealth Service and the Department of Health to fund non-recurrent expenditure as part of the commencement ofservices at the new Sunshine Coast University Hospital. The deficit will be partially funded from cash reservesaccumulated from operating surpluses in previous years.
Balance sheetMajor variations between 2016-17 Budget and 2016-17 Estimated Actual include:
25. The increase in cash assets relates to the unspent portion of funding received for the final quarterly servicepayment for 2016-17 to Exemplar Health for the Sunshine Coast University Hospital. The payment of thisexpenditure is scheduled in 2017-18.
26. The increase in receivables relates to higher expected claims for reimbursement from the CommonwealthGovernment under the Pharmaceutical Benefits Scheme.
27. The increase in inventories relates to higher expected holdings of clinical supplies due to growth associated withthe new Sunshine Coast University Hospital.
28. The increase in property, plant and equipment relates to a higher expected value of property, plant and equipmenttransferred from the Department of Health to the Sunshine Coast Hospital and Health Service for the newSunshine Coast University Hospital.
29. The decrease in intangibles relates to the re-phasing of the timing of construction of information andcommunications technology assets as part of the commencement of services at the new Sunshine CoastUniversity Hospital and the re-classification of a portion of capital expenditure as operating expenditure.
30. The increase in payables relates to the accrual of the final quarterly service payment for 2016-17 to ExemplarHealth for the Sunshine Coast University Hospital.
1852017-18 Queensland State Budget - Service Delivery Statements - Sunshine Coast Hospital and Health Service
31. The decrease in accrued employee benefits relates to a downward revision of the growth in estimated salariesand wages payable at year end.
32. The increase in interest bearing liabilities and derivatives relates to the transfer of Sunshine Coast UniversityHospital assets which are partially funded under an interest bearing liability.
33. The increase in interest bearing liabilities and derivatives relates to the transfer of Sunshine Coast UniversityHospital assets which are partially funded under an interest bearing liability.
34. The decrease in total equity relates to the transfer of Sunshine Coast University Hospital assets which are partiallyfunded under an interest bearing liability.
Major variations between 2016-17 Budget and 2017-18 Budget include:
35. The increase in receivables relates to higher expected claims for reimbursement from the CommonwealthGovernment under the Pharmaceutical Benefits Scheme.
36. The increase in inventories relates to higher expected holdings of clinical supplies due to growth associated withthe new Sunshine Coast University Hospital.
37. The increase in property, plant and equipment relates to a higher expected value of property, plant and equipmenttransferred from the Department of Health to the Sunshine Coast Hospital and Health Service for the newSunshine Coast University Hospital.
38. The decrease in intangibles relates to the re-phasing of the timing of construction of information andcommunications technology assets as part of the commencement of services at the new Sunshine CoastUniversity Hospital and the re-classification of a portion of capital expenditure as operating expenditure.
39. The increase in payables relates to the accrual of the final quarterly service payment for 2017-18 to ExemplarHealth for the Sunshine Coast University Hospital.
40. The increase in interest bearing liabilities and derivatives relates to the transfer of Sunshine Coast UniversityHospital assets which are partially funded under an interest bearing liability.
41. The increase in interest bearing liabilities and derivatives relates to the transfer of Sunshine Coast UniversityHospital assets which are partially funded under an interest bearing liability.
42. The decrease in total equity relates to the transfer of Sunshine Coast University Hospital assets which are partiallyfunded under an interest bearing liability.
Major variations between 2016-17 Estimated Actual and the 2017-18 Budget include:
43. The decrease in cash assets relates to payment of the final quarterly service payment for 2016-17 to ExemplarHealth in 2017-18 for the Sunshine Coast University Hospital and the draw-down of cash reserves to fund thedeficit budgeted in 2017-18.
44. The increase in intangibles relates to capital expenditure on information and communications technology assetsas part of the phased commencement of services at the new Sunshine Coast University Hospital.
45. The increase in accrued employee benefits relates to an increase in estimated salaries and wages payable due toan additional accrual day, enterprise bargaining agreements and employee growth.
46. The increase in interest bearing liabilities and derivatives relates to the transfer of Sunshine Coast UniversityHospital assets which are partially funded under an interest bearing liability.
47. The decrease in interest bearing liabilities and derivatives relates to the partial redemption of the interest bearingliability used to fund a portion of the Sunshine Coast University Hospital assets.
Cash flow statementMajor variations between 2016-17 Budget and 2016-17 Estimated Actual include:
48. The increase in user charges and fees relates to the receipt of 2015-16 funding from the Department of Healthduring 2016-17 and to additional funding provided under amendments to the service agreement between theSunshine Coast Hospital and Health Service and the Department of Health for growth associated with thecommencement of services at the new Sunshine Coast University Hospital, and enterprise bargainingagreements.
49. The decrease in grants and other contributions relates to a reduction in transition care expenditurereimbursements from the Commonwealth Government and the reclassification of Home and Community Carerevenues from grants and other contributions to user charges.
1862017-18 Queensland State Budget - Service Delivery Statements - Sunshine Coast Hospital and Health Service
50. The increase in other operating inflows relates to revenues from staff car parking fees at the new Sunshine CoastUniversity Hospital. There is an equal and offsetting increase in expenses associated with this revenue when feescollected are paid to Exemplar Health by the health service.
51. The decrease in employee costs relates to the re-phasing of on-boarding of employees as part of the phasedcommencement of services at the new Sunshine Coast University Hospital
52. The increase in supplies and services relates to additional expenditure funded under amendments to the serviceagreement between the Sunshine Coast Hospital and Health Service and the Department of Health for the newSunshine Coast University Hospital including clinical supplies, communications/computer related expenses andthe service maintenance agreement with Exemplar Health. Budgeted outflows in 2017-18 represent a full year ofexpanded services whereas outflows budgeted in 2016-17 were only part year.
53. The increase in borrowing costs relates to revised interest expenses for the Sunshine Coast University Hospitalassets which are partially funded under an interest bearing liability.
54. The increase in other operating outflows relates to costs reclassified from supplies and services under the serviceagreement between the Sunshine Coast Hospital and Health Service and Exemplar Health for the new SunshineCoast University Hospital.
55. The decrease in payments for non-financial assets relates to the re-phasing of the timing of completion ofinformation and communications technology assets as part of the commencement of services at the newSunshine Coast University Hospital and the re-classification of a portion of cash flows from investing activities tooperating activities.
56. The decrease in equity injections relates to delayed expenditure under the Health Technology EquipmentReplacement program in 2016-17. Equity injections originally budgeted in 2016-17 will now be received in2017-18.
57. The increase in borrowing redemptions relates to the transfer of Sunshine Coast University Hospital assets whichare partially funded under an interest bearing liability.
Major variations between 2016-17 Budget and 2017-18 Budget include:
58. The increase in user charges and fees relates to additional funding provided under amendments to the serviceagreement between the Sunshine Coast Hospital and Health Service and the Department of Health for the newSunshine Coast University Hospital and enterprise bargaining agreements.
59. The decrease in grants and other contributions relates to a reduction in transition care expenditurereimbursements from the Commonwealth Government and the reclassification of Home and Community Carerevenues from grants and other contributions to user charges.
60. The increase in other operating inflows relates to revenues from staff car parking fees at the new Sunshine CoastUniversity Hospital. There is an equal and offsetting increase in expenses associated with this revenue when feescollected are paid to Exemplar Health by the health service.
61. The increase in employee costs relates to additional expenditure funded under amendments to the serviceagreement between the Sunshine Coast Hospital and Health Service and the Department of Health for thecontinued on-boarding of employees as part of the phased commencement of services at the new SunshineCoast University Hospital, and enterprise bargaining agreements. Budgeted outflows in 2017-18 represent a fullyear of expanded services whereas outflows budgeted in 2016-17 were only part year.
62. The increase in supplies and services relates to additional expenditure funded under amendments to the serviceagreement between the Sunshine Coast Hospital and Health Service and the Department of Health for the newSunshine Coast University Hospital including contractor costs re-classified from capital expenditure to operatingexpenditure for the construction of information and communications technology assets, clinical supplies,communications/computer related expenses and the service maintenance agreement with Exemplar Health.
63. The increase in borrowing costs relates to interest expenses for the Sunshine Coast University Hospital assetswhich are partially funded under an interest bearing liability.
64. The increase in other operating outflows relates to costs reclassified from supplies and services under the serviceagreement between the Sunshine Coast Hospital and Health Service and Exemplar Health for the new SunshineCoast University Hospital.
65. The decrease in payments for non-financial assets relates to the re-phasing of the timing of construction ofinformation and communications technology assets as part of the commencement of services at the newSunshine Coast University Hospital and the re-classification of a portion of cash flows from investing activities tooperating activities.
66. The increase in equity injections relates to the impact of delayed expenditure under the Health TechnologyEquipment Replacement program in 2016-17. Equity injections originally budgeted in 2016-17 will now bereceived in 2017-18.
1872017-18 Queensland State Budget - Service Delivery Statements - Sunshine Coast Hospital and Health Service
67. The increase in borrowing redemptions relates to the transfer of Sunshine Coast University Hospital assets whichare partially funded under an interest bearing liability.
68. The increase in equity withdrawals relates to a corresponding increase in depreciation expense due to completionof the construction of the Sunshine Coast University Hospital. Under current arrangements funding received fordepreciation expense is returned to the Department of Health as an equity withdrawal.
Major variations between 2016-17 Estimated Actual and the 2017-18 Budget include:
69. The increase in user charges and fees relates to additional funding provided under amendments to the serviceagreement between the Sunshine Coast Hospital and Health Service and the Department of Health for the newSunshine Coast University Hospital and enterprise bargaining agreements.
70. The increase in other operating inflows relates to revenues from staff car parking fees at the new Sunshine Coast University Hospital. There is an equal and offsetting increase in expenses associated with this revenue when fees collected are paid to Exemplar Health by the health service.
71. The increase in employee costs relates to additional expenditure funded under amendments to the serviceagreement between the Sunshine Coast Hospital and Health Service and the Department of Health for thecontinued on-boarding of employees as part of the phased commencement of services at the new SunshineCoast University Hospital and enterprise bargaining agreements.
72. The decrease in supplies and services relates to a reduction in expenditure funded under amendments to theservice agreement between the Sunshine Coast Hospital and Health Service and the Department of Health forreduced services outsourced to Ramsay Health Care for patients transferred to the Sunshine Coast UniversityPrivate Hospital.
73. The increase in borrowing costs relates to interest expenses for the Sunshine Coast University Hospital assetswhich are partially funded under an interest bearing liability.
74. The decrease in payments for non-financial assets relates to lower capital expenditure on information andcommunications technology assets relative to 2016-17 as part of the commencement of services at the newSunshine Coast University Hospital.
75. The increase in equity injections relates to the impact of delayed expenditure under the Health TechnologyEquipment Replacement program in 2016-17. Equity injections originally budgeted in 2016-17 will now bereceived in 2017-18.
76. The increase in borrowing redemptions relates to the transfer of Sunshine Coast University Hospital assets whichare partially funded under an interest bearing liability.
77. The increase in equity withdrawals relates to a corresponding increase in depreciation expense due to completionof the construction of the Sunshine Coast University Hospital. Under current arrangements funding received fordepreciation expense is returned to the Department of Health as an equity withdrawal.
1882017-18 Queensland State Budget - Service Delivery Statements - Sunshine Coast Hospital and Health Service
Torres and Cape Hospital and Health Service
Overview Torres and Cape Hospital and Health Service (HHS) is the largest provider of public healthcare services across 180,000 square kilometres of the most northern and remote areas of Queensland including 18 islands in the Torres Strait. The health service delivers care to some 26,000 residents, two thirds of whom are Aboriginal or Torres Strait Islanders.
The Torres and Cape HHS operates four hospitals (two of which provide multi-purpose aged care services) and 31 primary health centres that provide accident and emergency care, general surgery, medical imaging, primary healthcare, chronic disease management, obstetric and birthing services, maternal and child health services, men’s and women’s health services, oral health, mental health, allied health, post-acute rehabilitation, aged care, palliative and respite services, visiting specialist services, general home and community care services, and family support.
The health service employs over around 900 employees and supports a wide range of healthcare providers including outreach teams and visiting specialist services from other hospital and health services as well as non-government providers including Apunipima Cape York Health Council, the Northern Queensland Primary Health Network and the Royal Flying Doctor Service.
The health service’s vision is to have ‘healthy people and healthy communities’ and aims to achieve this by working with local communities to plan health care, strengthening primary care services to eliminate preventable disease and manage chronic conditions and building the health service’s cultural capability. The health service’s strategic intent is to:
• deliver integrated care models that connect primary and acute services to provide a seamless heath care journey• deliver more services within our region through the use of technology, and expanding our partnerships with other
health providers• progress regionalisation of the workforce to better support front line services within our communities.
The Torres and Cape HHS vision aligns with the Queensland Government’s objectives for the community of delivering quality frontline services and building safe, caring and connected communities.
Service summary The Torres and Cape HHS has an operating budget of $202.9 million for 2017-18, which is an increase of $1.7 million (0.9 per cent) from the published 2016-17 operating budget of $201.2 million.
In 2017-18, Torres and Cape HHS will:
• invest a further $25.3 million in health infrastructure works in the Torres Strait and Cape York includingredevelopment of Thursday Island Hospital
• continue transition of primary health services to community control in up to four more communities and strengthencollaboration in other communities
• support the pilot implementation of a shared electronic health record for primary and community health care acrossthe Torres and Cape and Cairns and Hinterland regions
• improve the coordination of renal care across the Cape and establish a community peritoneal dialysis chair to bettersupport home dialysis patients in Kowanyama and
• boost physiotherapy and occupational health services to six Cape York communities with the creation of a new alliedhealth position.
1892017-18 Queensland State Budget - Service Delivery Statements - Torres and Cape Hospital and Health Service
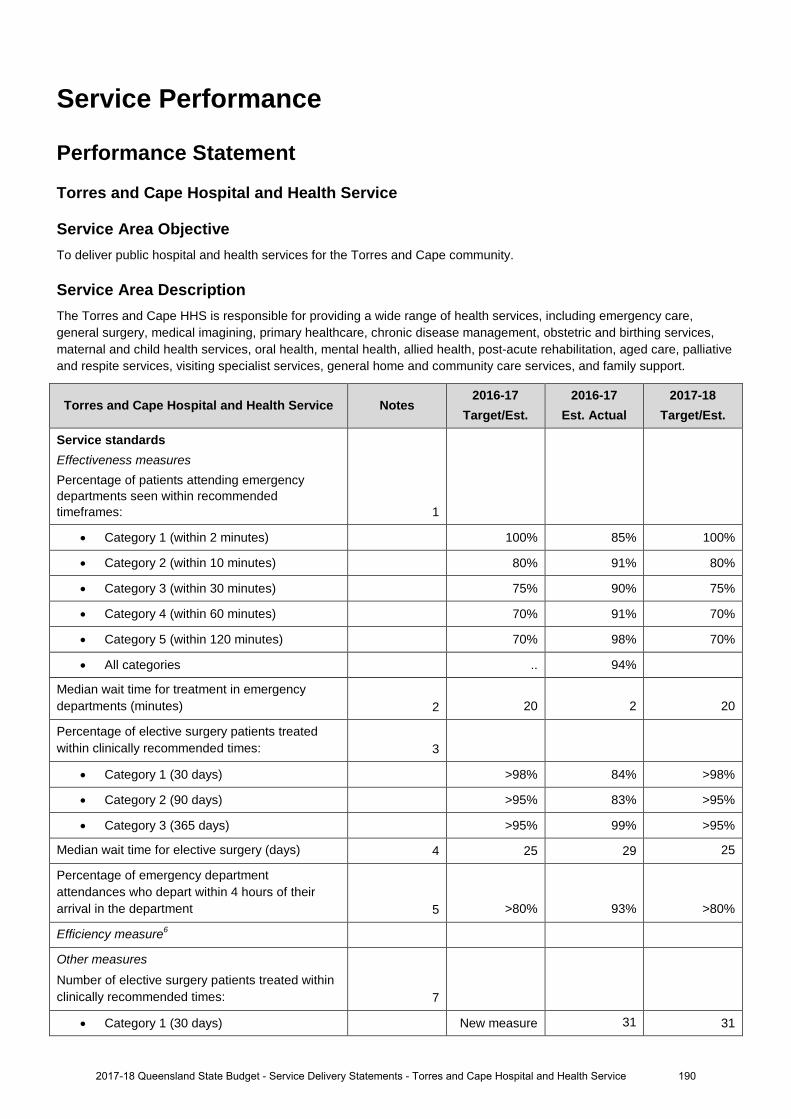
Service Performance
Performance Statement
Torres and Cape Hospital and Health Service
Service Area Objective To deliver public hospital and health services for the Torres and Cape community.
Service Area Description The Torres and Cape HHS is responsible for providing a wide range of health services, including emergency care, general surgery, medical imagining, primary healthcare, chronic disease management, obstetric and birthing services, maternal and child health services, oral health, mental health, allied health, post-acute rehabilitation, aged care, palliative and respite services, visiting specialist services, general home and community care services, and family support.
Torres and Cape Hospital and Health Service Notes 2016-17
Target/Est. 2016-17
Est. Actual 2017-18
Target/Est.
Service standards Effectiveness measures Percentage of patients attending emergency departments seen within recommended timeframes: 1
• Category 1 (within 2 minutes) 100% 85% 100%
• Category 2 (within 10 minutes) 80% 91% 80%
• Category 3 (within 30 minutes) 75% 90% 75%
• Category 4 (within 60 minutes) 70% 91% 70%
• Category 5 (within 120 minutes) 70% 98% 70%
• All categories .. 94%
Median wait time for treatment in emergency departments (minutes) 2 20 2 20
Percentage of elective surgery patients treated within clinically recommended times: 3
• Category 1 (30 days) >98% 84% >98%
• Category 2 (90 days) >95% 83% >95%
• Category 3 (365 days) >95% 99% >95%
Median wait time for elective surgery (days) 4 25 29 25
Percentage of emergency department attendances who depart within 4 hours of their arrival in the department 5 >80% 93% >80%
Efficiency measure6
Other measures Number of elective surgery patients treated within clinically recommended times: 7
• Category 1 (30 days) New measure 31 31
1902017-18 Queensland State Budget - Service Delivery Statements - Torres and Cape Hospital and Health Service
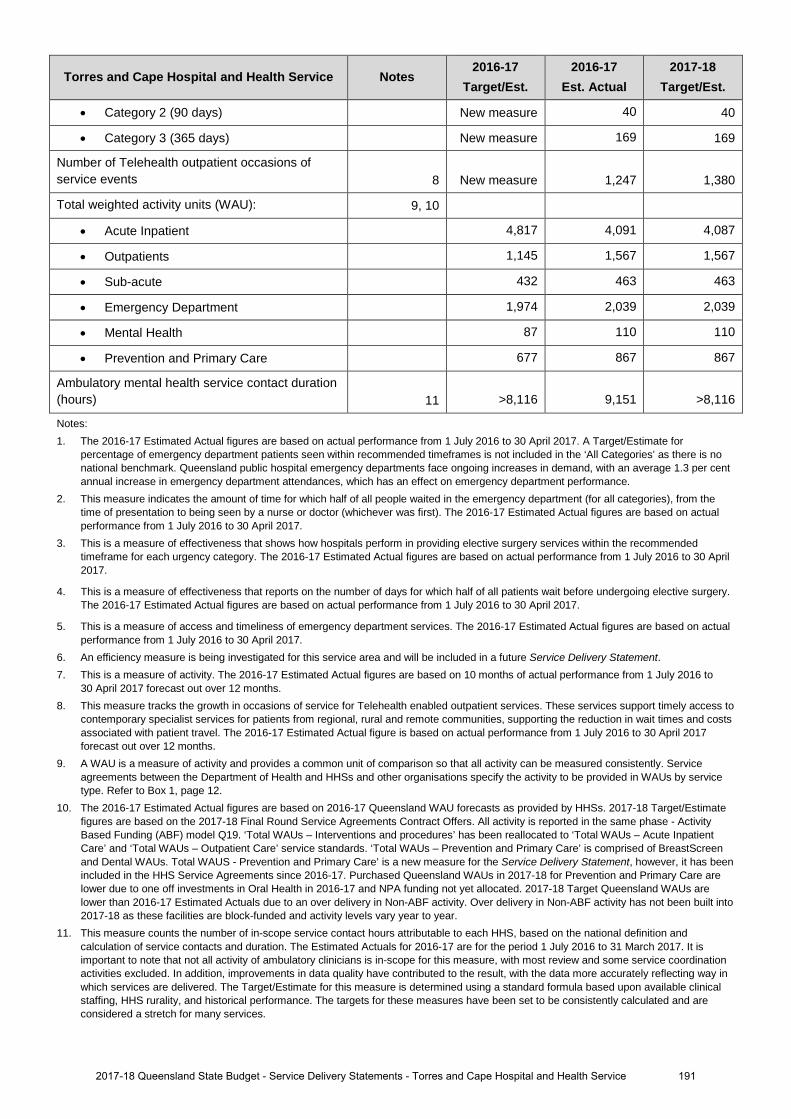
Torres and Cape Hospital and Health Service Notes 2016-17
Target/Est. 2016-17
Est. Actual 2017-18
Target/Est.
• Category 2 (90 days) New measure 40 40
• Category 3 (365 days) New measure 169 169
Number of Telehealth outpatient occasions of service events 8 New measure 1,247 1,380
Total weighted activity units (WAU): 9, 10
• Acute Inpatient 4,817 4,091 4,087
• Outpatients 1,145 1,567 1,567
• Sub-acute 432 463 463
• Emergency Department 1,974 2,039 2,039
• Mental Health 87 110 110
• Prevention and Primary Care 677 867 867
Ambulatory mental health service contact duration (hours) 11 >8,116 9,151 >8,116
Notes: 1. The 2016-17 Estimated Actual figures are based on actual performance from 1 July 2016 to 30 April 2017. A Target/Estimate for
percentage of emergency department patients seen within recommended timeframes is not included in the ‘All Categories’ as there is no national benchmark. Queensland public hospital emergency departments face ongoing increases in demand, with an average 1.3 per cent annual increase in emergency department attendances, which has an effect on emergency department performance.
2. This measure indicates the amount of time for which half of all people waited in the emergency department (for all categories), from the time of presentation to being seen by a nurse or doctor (whichever was first). The 2016-17 Estimated Actual figures are based on actual performance from 1 July 2016 to 30 April 2017.
3. This is a measure of effectiveness that shows how hospitals perform in providing elective surgery services within the recommended timeframe for each urgency category. The 2016-17 Estimated Actual figures are based on actual performance from 1 July 2016 to 30 April 2017.
4. This is a measure of effectiveness that reports on the number of days for which half of all patients wait before undergoing elective surgery. The 2016-17 Estimated Actual figures are based on actual performance from 1 July 2016 to 30 April 2017.
5. This is a measure of access and timeliness of emergency department services. The 2016-17 Estimated Actual figures are based on actual performance from 1 July 2016 to 30 April 2017.
6. An efficiency measure is being investigated for this service area and will be included in a future Service Delivery Statement. 7. This is a measure of activity. The 2016-17 Estimated Actual figures are based on 10 months of actual performance from 1 July 2016 to
30 April 2017 forecast out over 12 months. 8. This measure tracks the growth in occasions of service for Telehealth enabled outpatient services. These services support timely access to
contemporary specialist services for patients from regional, rural and remote communities, supporting the reduction in wait times and costs associated with patient travel. The 2016-17 Estimated Actual figure is based on actual performance from 1 July 2016 to 30 April 2017 forecast out over 12 months.
9. A WAU is a measure of activity and provides a common unit of comparison so that all activity can be measured consistently. Service agreements between the Department of Health and HHSs and other organisations specify the activity to be provided in WAUs by service type. Refer to Box 1, page 12.
10. The 2016-17 Estimated Actual figures are based on 2016-17 Queensland WAU forecasts as provided by HHSs. 2017-18 Target/Estimate figures are based on the 2017-18 Final Round Service Agreements Contract Offers. All activity is reported in the same phase - Activity Based Funding (ABF) model Q19. ‘Total WAUs – Interventions and procedures’ has been reallocated to ‘Total WAUs – Acute Inpatient Care’ and ‘Total WAUs – Outpatient Care’ service standards. ‘Total WAUs – Prevention and Primary Care’ is comprised of BreastScreen and Dental WAUs. Total WAUS - Prevention and Primary Care’ is a new measure for the Service Delivery Statement, however, it has been included in the HHS Service Agreements since 2016-17. Purchased Queensland WAUs in 2017-18 for Prevention and Primary Care are lower due to one off investments in Oral Health in 2016-17 and NPA funding not yet allocated. 2017-18 Target Queensland WAUs are lower than 2016-17 Estimated Actuals due to an over delivery in Non-ABF activity. Over delivery in Non-ABF activity has not been built into 2017-18 as these facilities are block-funded and activity levels vary year to year.
11. This measure counts the number of in-scope service contact hours attributable to each HHS, based on the national definition and calculation of service contacts and duration. The Estimated Actuals for 2016-17 are for the period 1 July 2016 to 31 March 2017. It is important to note that not all activity of ambulatory clinicians is in-scope for this measure, with most review and some service coordination activities excluded. In addition, improvements in data quality have contributed to the result, with the data more accurately reflecting way in which services are delivered. The Target/Estimate for this measure is determined using a standard formula based upon available clinical staffing, HHS rurality, and historical performance. The targets for these measures have been set to be consistently calculated and are considered a stretch for many services.
1912017-18 Queensland State Budget - Service Delivery Statements - Torres and Cape Hospital and Health Service
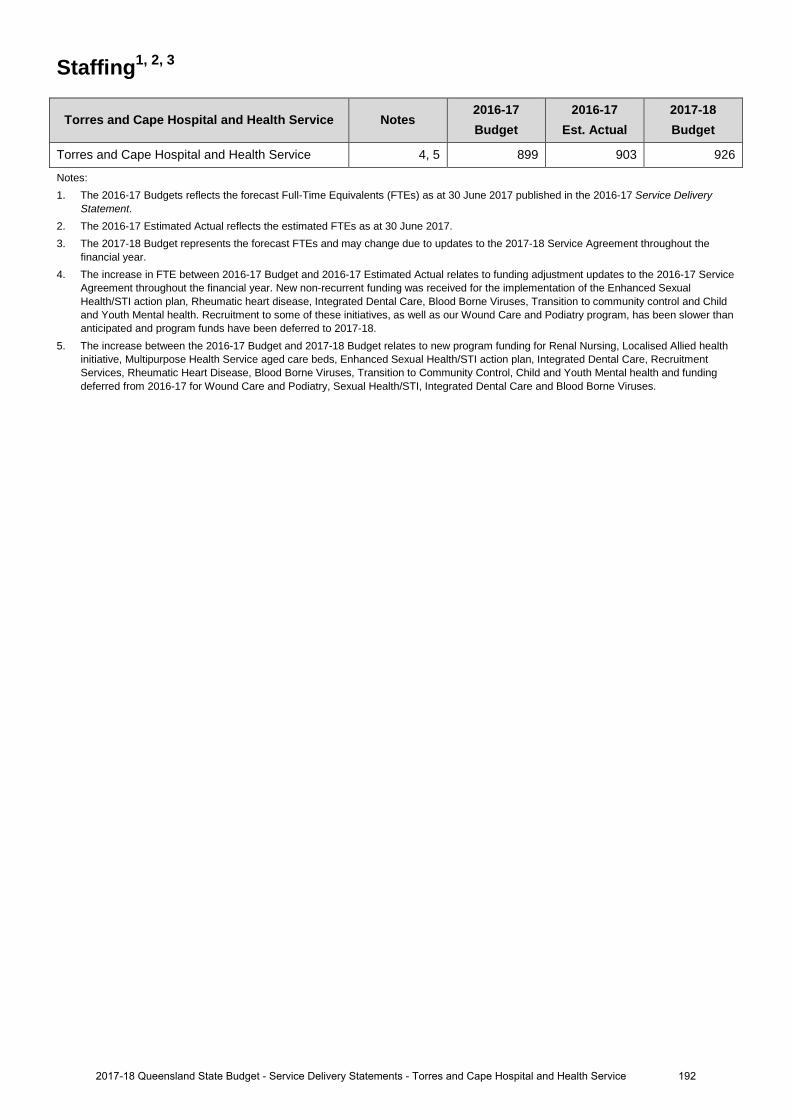
Staffing1, 2, 3
Torres and Cape Hospital and Health Service Notes 2016-17 Budget
2016-17 Est. Actual
2017-18 Budget
Torres and Cape Hospital and Health Service 4, 5 899 903 926
Notes: 1. The 2016-17 Budgets reflects the forecast Full-Time Equivalents (FTEs) as at 30 June 2017 published in the 2016-17 Service Delivery
Statement. 2. The 2016-17 Estimated Actual reflects the estimated FTEs as at 30 June 2017. 3. The 2017-18 Budget represents the forecast FTEs and may change due to updates to the 2017-18 Service Agreement throughout the
financial year. 4. The increase in FTE between 2016-17 Budget and 2016-17 Estimated Actual relates to funding adjustment updates to the 2016-17 Service
Agreement throughout the financial year. New non-recurrent funding was received for the implementation of the Enhanced Sexual Health/STI action plan, Rheumatic heart disease, Integrated Dental Care, Blood Borne Viruses, Transition to community control and Child and Youth Mental health. Recruitment to some of these initiatives, as well as our Wound Care and Podiatry program, has been slower than anticipated and program funds have been deferred to 2017-18.
5. The increase between the 2016-17 Budget and 2017-18 Budget relates to new program funding for Renal Nursing, Localised Allied health initiative, Multipurpose Health Service aged care beds, Enhanced Sexual Health/STI action plan, Integrated Dental Care, Recruitment Services, Rheumatic Heart Disease, Blood Borne Viruses, Transition to Community Control, Child and Youth Mental health and funding deferred from 2016-17 for Wound Care and Podiatry, Sexual Health/STI, Integrated Dental Care and Blood Borne Viruses.
1922017-18 Queensland State Budget - Service Delivery Statements - Torres and Cape Hospital and Health Service

Income statement
Torres and Cape Hospital and Health Service Notes 2016-17 Budget
$'000
2016-17 Est. Act.
$'000
2017-18 Budget
$'000
INCOMEUser charges and fees 1,8,16 189,304 192,555 190,592 Grants and other contributions 2,9,17 11,136 11,297 11,521 Interest 24 2 2 Other revenue 3,10,18 689 1,495 794 Gains on sale/revaluation of assets .. .. ..
Total income 201,153 205,349 202,909 EXPENSES
Employee expenses 4,11,19 9,200 13,885 14,215 Supplies and Services:Other supplies and services 5,12,20 71,170 85,313 76,700 Department of Health contract staff 6,13,21 108,952 93,555 99,721 Grants and subsidies .. 38 .. Depreciation and amortisation 14,22 11,326 11,326 11,552 Finance/borrowing costs .. .. .. Other expenses 7,15,23 500 1,195 712 Losses on sale/revaluation of assets 5 37 9
Total expenses 201,153 205,349 202,909 OPERATING SURPLUS/(DEFICIT) .. .. ..
1932017-18 Queensland State Budget - Service Delivery Statements - Torres and Cape Hospital and Health Service
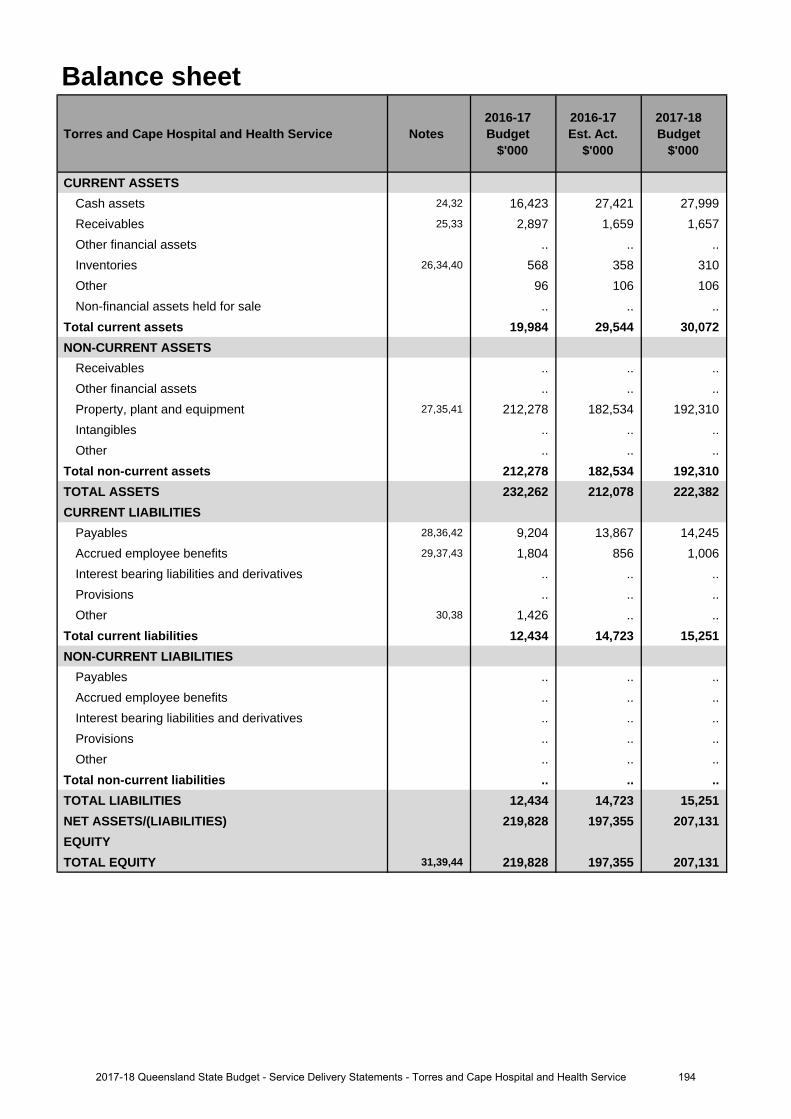
Balance sheet
Torres and Cape Hospital and Health Service Notes 2016-17 Budget
$'000
2016-17 Est. Act.
$'000
2017-18 Budget
$'000
CURRENT ASSETSCash assets 24,32 16,423 27,421 27,999 Receivables 25,33 2,897 1,659 1,657 Other financial assets .. .. .. Inventories 26,34,40 568 358 310 Other 96 106 106 Non-financial assets held for sale .. .. ..
Total current assets 19,984 29,544 30,072 NON-CURRENT ASSETS
Receivables .. .. .. Other financial assets .. .. .. Property, plant and equipment 27,35,41 212,278 182,534 192,310 Intangibles .. .. .. Other .. .. ..
Total non-current assets 212,278 182,534 192,310 TOTAL ASSETS 232,262 212,078 222,382 CURRENT LIABILITIES
Payables 28,36,42 9,204 13,867 14,245 Accrued employee benefits 29,37,43 1,804 856 1,006 Interest bearing liabilities and derivatives .. .. .. Provisions .. .. .. Other 30,38 1,426 .. ..
Total current liabilities 12,434 14,723 15,251 NON-CURRENT LIABILITIES
Payables .. .. .. Accrued employee benefits .. .. .. Interest bearing liabilities and derivatives .. .. .. Provisions .. .. .. Other .. .. ..
Total non-current liabilities .. .. .. TOTAL LIABILITIES 12,434 14,723 15,251 NET ASSETS/(LIABILITIES) 219,828 197,355 207,131 EQUITYTOTAL EQUITY 31,39,44 219,828 197,355 207,131
1942017-18 Queensland State Budget - Service Delivery Statements - Torres and Cape Hospital and Health Service
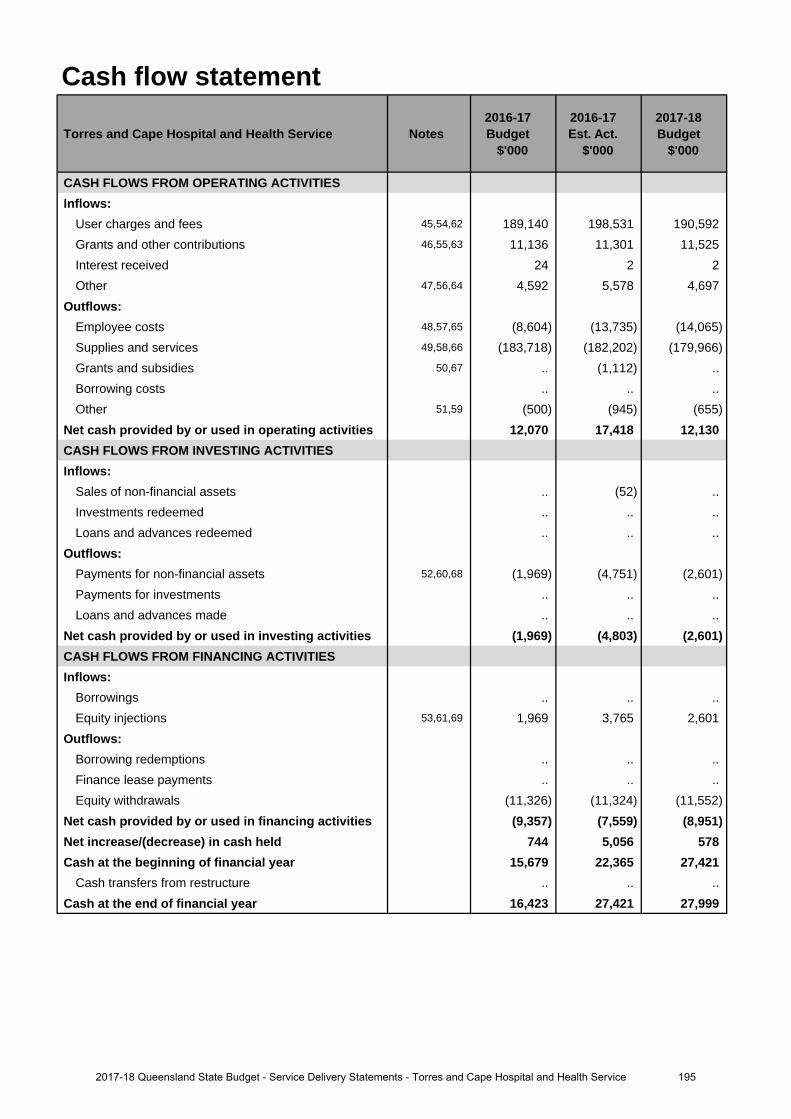
Cash flow statement
Torres and Cape Hospital and Health Service Notes 2016-17 Budget
$'000
2016-17 Est. Act.
$'000
2017-18 Budget
$'000
CASH FLOWS FROM OPERATING ACTIVITIESInflows:
User charges and fees 45,54,62 189,140 198,531 190,592 Grants and other contributions 46,55,63 11,136 11,301 11,525 Interest received 24 2 2 Other 47,56,64 4,592 5,578 4,697
Outflows:Employee costs 48,57,65 (8,604) (13,735) (14,065)Supplies and services 49,58,66 (183,718) (182,202) (179,966)Grants and subsidies 50,67 .. (1,112) .. Borrowing costs .. .. .. Other 51,59 (500) (945) (655)
Net cash provided by or used in operating activities 12,070 17,418 12,130 CASH FLOWS FROM INVESTING ACTIVITIESInflows:
Sales of non-financial assets .. (52) .. Investments redeemed .. .. .. Loans and advances redeemed .. .. ..
Outflows:Payments for non-financial assets 52,60,68 (1,969) (4,751) (2,601)Payments for investments .. .. .. Loans and advances made .. .. ..
Net cash provided by or used in investing activities (1,969) (4,803) (2,601)CASH FLOWS FROM FINANCING ACTIVITIESInflows:
Borrowings .. .. .. Equity injections 53,61,69 1,969 3,765 2,601
Outflows:Borrowing redemptions .. .. .. Finance lease payments .. .. .. Equity withdrawals (11,326) (11,324) (11,552)
Net cash provided by or used in financing activities (9,357) (7,559) (8,951)Net increase/(decrease) in cash held 744 5,056 578 Cash at the beginning of financial year 15,679 22,365 27,421
Cash transfers from restructure .. .. .. Cash at the end of financial year 16,423 27,421 27,999
1952017-18 Queensland State Budget - Service Delivery Statements - Torres and Cape Hospital and Health Service
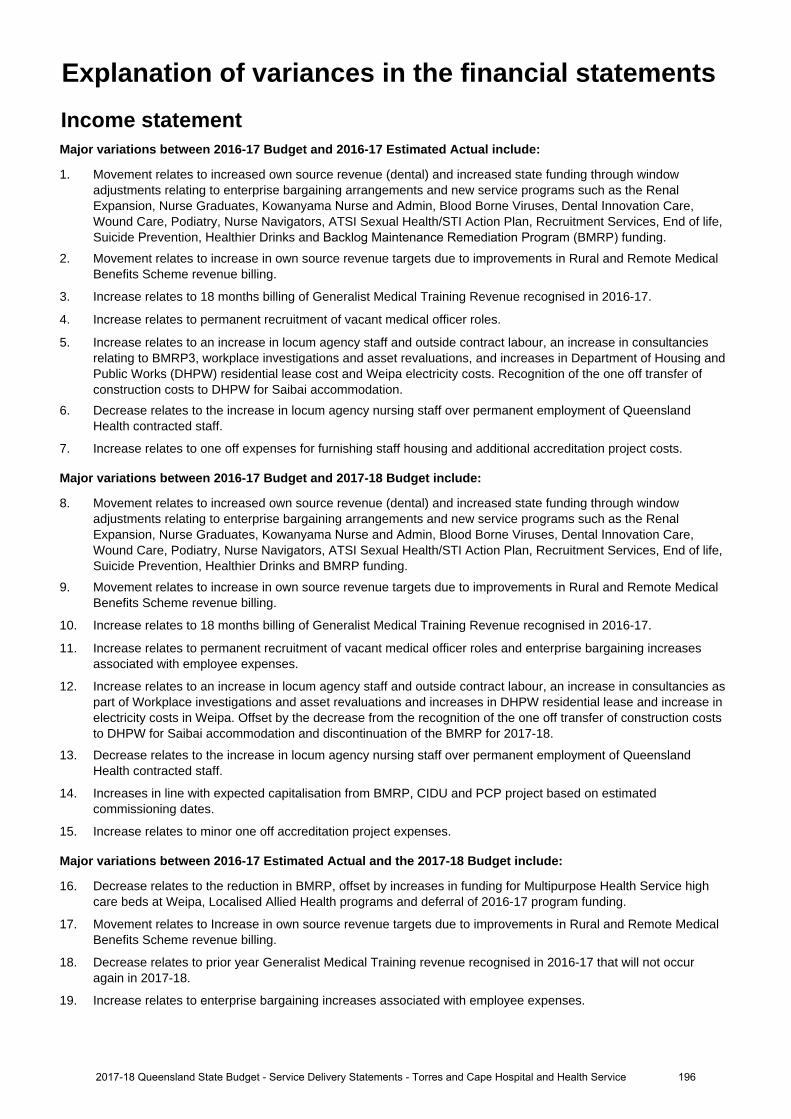
Income statementMajor variations between 2016-17 Budget and 2016-17 Estimated Actual include:
1. Movement relates to increased own source revenue (dental) and increased state funding through window adjustments relating to enterprise bargaining arrangements and new service programs such as the Renal Expansion, Nurse Graduates, Kowanyama Nurse and Admin, Blood Borne Viruses, Dental Innovation Care, Wound Care, Podiatry, Nurse Navigators, ATSI Sexual Health/STI Action Plan, Recruitment Services, End of life, Suicide Prevention, Healthier Drinks and Backlog Maintenance Remediation Program (BMRP) funding.
2. Movement relates to increase in own source revenue targets due to improvements in Rural and Remote MedicalBenefits Scheme revenue billing.
3. Increase relates to 18 months billing of Generalist Medical Training Revenue recognised in 2016-17.
4. Increase relates to permanent recruitment of vacant medical officer roles.
5. Increase relates to an increase in locum agency staff and outside contract labour, an increase in consultancies relating to BMRP3, workplace investigations and asset revaluations, and increases in Department of Housing and Public Works (DHPW) residential lease cost and Weipa electricity costs. Recognition of the one off transfer of construction costs to DHPW for Saibai accommodation.
6. Decrease relates to the increase in locum agency nursing staff over permanent employment of QueenslandHealth contracted staff.
7. Increase relates to one off expenses for furnishing staff housing and additional accreditation project costs.
Major variations between 2016-17 Budget and 2017-18 Budget include:
8. Movement relates to increased own source revenue (dental) and increased state funding through windowadjustments relating to enterprise bargaining arrangements and new service programs such as the RenalExpansion, Nurse Graduates, Kowanyama Nurse and Admin, Blood Borne Viruses, Dental Innovation Care,Wound Care, Podiatry, Nurse Navigators, ATSI Sexual Health/STI Action Plan, Recruitment Services, End of life,Suicide Prevention, Healthier Drinks and BMRP funding.
9. Movement relates to increase in own source revenue targets due to improvements in Rural and Remote MedicalBenefits Scheme revenue billing.
10. Increase relates to 18 months billing of Generalist Medical Training Revenue recognised in 2016-17.
11. Increase relates to permanent recruitment of vacant medical officer roles and enterprise bargaining increasesassociated with employee expenses.
12. Increase relates to an increase in locum agency staff and outside contract labour, an increase in consultancies aspart of Workplace investigations and asset revaluations and increases in DHPW residential lease and increase inelectricity costs in Weipa. Offset by the decrease from the recognition of the one off transfer of construction coststo DHPW for Saibai accommodation and discontinuation of the BMRP for 2017-18.
13. Decrease relates to the increase in locum agency nursing staff over permanent employment of QueenslandHealth contracted staff.
14. Increases in line with expected capitalisation from BMRP, CIDU and PCP project based on estimatedcommissioning dates.
15. Increase relates to minor one off accreditation project expenses.
Major variations between 2016-17 Estimated Actual and the 2017-18 Budget include:
16. Decrease relates to the reduction in BMRP, offset by increases in funding for Multipurpose Health Service highcare beds at Weipa, Localised Allied Health programs and deferral of 2016-17 program funding.
17. Movement relates to Increase in own source revenue targets due to improvements in Rural and Remote MedicalBenefits Scheme revenue billing.
18. Decrease relates to prior year Generalist Medical Training revenue recognised in 2016-17 that will not occuragain in 2017-18.
19. Increase relates to enterprise bargaining increases associated with employee expenses.
Explanation of variances in the financial statements
1962017-18 Queensland State Budget - Service Delivery Statements - Torres and Cape Hospital and Health Service
20. Decrease relates to the decrease from the recognition of the one off transfer of construction costs to DHPW forSaibai accommodation and previous BMRP expenditure offset by increase in consultancies as part of Workplaceinvestigations and asset revaluations and increases in residential lease and increase in electricity costs in Weipaand increase in anticipated locum staff and outside contract labour.
21. Increase relates to new program MOHRI FTE funding and enterprise bargaining increases associated with Queensland Health contracted staff.
22. Increases in line with expected capitalisation from BMRP, Capital Infrastructure Delivery Unit (CIDU) and PriorityCapital Program (PCP) project based on estimated commissioning dates.
23. Decrease relates to one off expenses for furnishing staff housing not reoccurring.
Balance sheetMajor variations between 2016-17 Budget and 2016-17 Estimated Actual include:
24. Increase relates to cash surpluses from the 2015-16 financial year that related to new and deferred programs, a reduction in outstanding receivables and increase in outstanding payables.
25. Decrease relates to lower expected Department of Health accrued revenue recognised as part of the end of year(EOY) technical adjustment and clearance of old receivable impairment after completion of the debt collectionprocess.
26. Decrease relates to a reduction in stock balance due to changes in pharmacy inventory controls and imprest lists.
27. Decrease relates to valuations forecasting a minimal revaluation increment and slow uptake of revisedexpenditure forecast.
28. Increase relates to late settlement of Outsourced Service delivery contracts.
29. Decrease relates to the change in classification of Queensland Health employees as Torres and Cape Hospital and Health Service (HHS) employees in 2015-16.
30. Decrease due to no forecast revenue received in advance at end of year.
31. Decrease relates to valuations forecasting a minimal revaluation increment and slow uptake of allocated capitalspend.
Major variations between 2016-17 Budget and 2017-18 Budget include:
32. Increase relates to cash surpluses from the 2015-16 financial year that related to new and deferred programs, a reduction in outstanding receivables and increase in outstanding payables.
33. Decrease relates to lower expected Department of Health accrued revenue recognised as part of the EOYtechnical adjustment and clearance of old receivable impairment after completion of the debt collection process.
34. Decreases relates to a reduction in stock balance due to changes in pharmacy inventory controls and imprest lists.
35. Decrease relates to valuations forecasting a minimal revaluation increment and slow uptake of revisedexpenditure forecast.
36. Increase relates to timing of the payroll accrual at June 2017 for 12 days, enterprise bargaining adjustments and late settlement of Outsourced Service delivery contracts.
37. Decrease relates to the change in classification of Queensland Health employees as Torres and Cape HHS employees in 2015-16.
38. Decrease due to no forecast revenue received in advance at end of year.
39. Decrease relates to valuations forecasting a minimal revaluation increment and slow uptake of revisedexpenditure forecast.
Major variations between 2016-17 Estimated Actual and the 2017-18 Budget include:
40. Decreases relates to a reduction in stock balance due to changes in pharmacy inventory controls and imprest lists(reduced stock on hand).
41. Increase relates to capitalisation of PCP funding (split over 2 years), Aurukun upgrade, Health Technology Equipment Replacement Program (HTER) and Minor capital and the revaluation impact from Backlog maintenance related items completed in April-June 2017.
42. Increase relates to additional payables related to deferrals and new programs.
43. Increase relates to full recruitment of reclassed Torres and Cape HHS employees.
1972017-18 Queensland State Budget - Service Delivery Statements - Torres and Cape Hospital and Health Service
44. Increase relates to Capital contributed for the Capital Program and forecast asset revaluation increase.
Cash flow statementMajor variations between 2016-17 Budget and 2016-17 Estimated Actual include:
45. Movement relates to increased own source revenue (dental) and increased state funding through window adjustments relating to enterprise bargaining arrangements and new service programs such as the Renal Expansion, Nurse Graduates, Kowanyama nurse and admin, Blood Borne Viruses, Dental Innovation Care, Wound Care, Podiatry, Nurse Navigators, ATSI Sexual Health/STI Action Plan, Recruitment Services, End of life, Suicide Prevention, Healthier Drinks and BMRP funding.
46. Movement relates to Increase in own source revenue targets due to improvements is Rural and Remote MedicalBenefits Scheme revenue billing.
47. Increase relates to 18 months billing of Generalist Medical Training Revenue recognised in 2016-17.
48. Increase relates to permanent recruitment of vacant medical officer roles.
49. Decrease relates to a decrease in permanent Queensland Health staff, offset by increases in payment to locum agency staff and outside contractors and increase in consultancies as part of BMRP, Workplace investigations and asset revaluations and increases in residential lease and increase in electricity costs in Weipa and recognition of the one off transfer of construction costs to DHPW for Saibai accommodation.
50. Increase relates to return unspent program funding to fund providers.
51. Increase relates to one off expenses for Fittings, furniture and equipment (FF&E), Vehicle automated tracking.
52. Increase relates to deferral of Minor Capital and reprofiling BMRP operational funding to equity.
53. Decrease relates to timing of Health Technology Equipment Replacement Program (HTER), CIDU spend and reprofiling BMRP operational funding to equity.
Major variations between 2016-17 Budget and 2017-18 Budget include:
54. Movement relates to increased own source revenue (dental) and increased state funding through window adjustments relating to enterprise bargaining arrangements and new service programs such as the Renal Expansion, Nurse Graduates, Kowanyama nurse and admin, Blood Borne Viruses, Dental Innovation Care,
Wound Care, Podiatry, Nurse Navigators, ATSI Sexual Health/STI Action Plan, Recruitment Services, End of life, Suicide Prevention, Healthier Drinks and BMRP funding.
55. Movement relates to Increase in own source revenue targets due to improvements is Rural and Remote MedicalBenefits Scheme revenue billing.
56. Increase relates to 18 months billing of Generalist Medical Training Revenue recognised in 2016-17.
57. Increase relates to permanent recruitment of vacant medical officer roles and enterprise bargaining increases associated with employee expenses.
58. Decrease relates to the decrease from the recognition of the one off transfer of construction costs to DHPW forSaibai accommodation and previous BMRP expenditure.
59. Increase relates to one off expenses for FF&E, Vehicle automated tracking.
60. Increase relates to deferral of HTER and CIDU project spend into 2017-18 Financial Years.61. Increase relates to deferral of HTER and CIDU project spend into 2017-18 Financial Years.
Major variations between 2016-17 Estimated Actual and the 2017-18 Budget include:
62. Decrease relates to the reduction in BMRP, offset by increases in funding for Multipurpose Health Service highcare beds at Weipa, Localised Allied Health programs and deferral of 2016-17 program funding.
63. Movement relates to increase in own source revenue targets due to improvements is Rural and Remote Medical Benefits Scheme revenue billing.
64. Decrease relates to prior year Generalist Medical Training revenue recognised in 2016-17 that will not occur again in 2017-18.
65. Increase relates to enterprise bargaining increases associated with employee expenses.
66. Decrease relates to the decrease from the recognition of the one off transfer of construction costs to DHPW forSaibai accommodation and previous BMRP expenditure.
67. Decrease relates to plan to fully spend program funding.
1982017-18 Queensland State Budget - Service Delivery Statements - Torres and Cape Hospital and Health Service
68. Increase relates to deferral of HTER and Minor Capital spend into 2017-18 Financial Years.
69. Increase relates to deferral of HTER and Minor Capital spend into 2017-18 Financial Years.
1992017-18 Queensland State Budget - Service Delivery Statements - Torres and Cape Hospital and Health Service
Townsville Hospital and Health Service
Overview The Townsville Hospital and Health Service (HHS) is an independent statutory body overseen by a local Hospital and Health Board. The Townsville HHS is responsible for the delivery of local public hospital and health services including medical, surgical, emergency, obstetrics, paediatrics, specialist outpatient clinics, mental health, intensive care and clinical support services to a population of approximately 240,000 people. The Townsville Hospital is the main referral hospital of North and Far North Queensland providing tertiary services to a population of approximately 670,000.
The Townsville HHS operates the following facilities:
• Alec Illin Secure Mental Health Rehabilitation Unit • Ingham Health Service
• Ayr Health Service • Joyce Palmer Health Service
• Cardwell Community Clinic • Kirwan Health Campus
• Charters Towers Health Service • Kirwan Mental Health Rehabilitation Unit
• Charters Towers Rehabilitation Unit • Magnetic Island Community Clinic
• Eventide Residential Aged Care Facility • Parklands Residential Aged Care Facility
• Home Hill Health Service • Richmond Health Service
• Hughenden Multi-Purpose Health Service • The Townsville Hospital
• Josephine Sailor Adolescent Inpatient Unit andDay Service
The Townsville HHS contributes to the delivery of the Queensland Government’s objectives for the community, specifically through the delivery of quality frontline health care services and contributing towards strengthening our public health system as a whole. The Townsville HHS is committed to delivering on the following strategic pillars as health services evolve to meet the needs of our community by:
• building healthier communities• focusing on individual health outcomes• providing safe, efficient, effective and sustainable services• leading excellence and innovation• working collaboratively• maintaining an exceptional workforce.
Service summary The Townsville HHS has an operating budget of $935.9 million for 2017-18 which is an increase of $71.6 million (8.3 per cent) from the published 2016-17 operating budget of $864.3 million.
During 2017-18 the Townsville HHS will:
• deliver services to children and adults who need day and overnight procedures including ophthalmology, ear, noseand throat, plastic and general through the recently opened Planned Procedure Unit
• complete the $6.6 million expansion of The Townsville Hospital paediatric ward• undertake the majority of construction of the $16.5 million Palm Island Primary Care Centre, after early works in
2016-17• complete the planning and preparation phases for enhanced functionality to the existing ieMR for the modules of
closed-loop electronic medications management, theatre management, enterprise scheduling or appointments,anaesthetic record integration, and research support.
2002017-18 Queensland State Budget - Service Delivery Statements - Townsville Hospital and Health Service
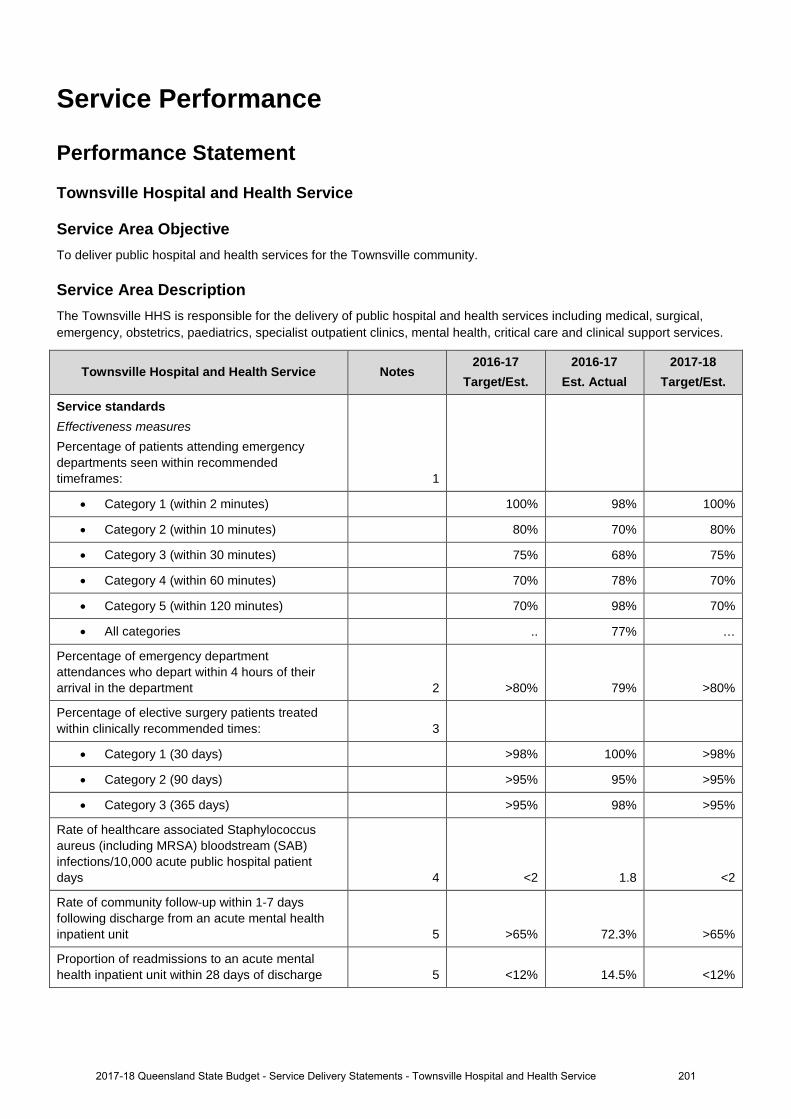
Service Performance
Performance Statement
Townsville Hospital and Health Service
Service Area Objective To deliver public hospital and health services for the Townsville community.
Service Area Description The Townsville HHS is responsible for the delivery of public hospital and health services including medical, surgical, emergency, obstetrics, paediatrics, specialist outpatient clinics, mental health, critical care and clinical support services.
Townsville Hospital and Health Service Notes 2016-17
Target/Est. 2016-17
Est. Actual 2017-18
Target/Est.
Service standards Effectiveness measures Percentage of patients attending emergency departments seen within recommended timeframes: 1
• Category 1 (within 2 minutes) 100% 98% 100%
• Category 2 (within 10 minutes) 80% 70% 80%
• Category 3 (within 30 minutes) 75% 68% 75%
• Category 4 (within 60 minutes) 70% 78% 70%
• Category 5 (within 120 minutes) 70% 98% 70%
• All categories .. 77% …
Percentage of emergency department attendances who depart within 4 hours of their arrival in the department 2 >80% 79% >80%
Percentage of elective surgery patients treated within clinically recommended times: 3
• Category 1 (30 days) >98% 100% >98%
• Category 2 (90 days) >95% 95% >95%
• Category 3 (365 days) >95% 98% >95%
Rate of healthcare associated Staphylococcus aureus (including MRSA) bloodstream (SAB) infections/10,000 acute public hospital patient days 4 <2 1.8 <2
Rate of community follow-up within 1-7 days following discharge from an acute mental health inpatient unit 5 >65% 72.3% >65%
Proportion of readmissions to an acute mental health inpatient unit within 28 days of discharge 5 <12% 14.5% <12%
2012017-18 Queensland State Budget - Service Delivery Statements - Townsville Hospital and Health Service
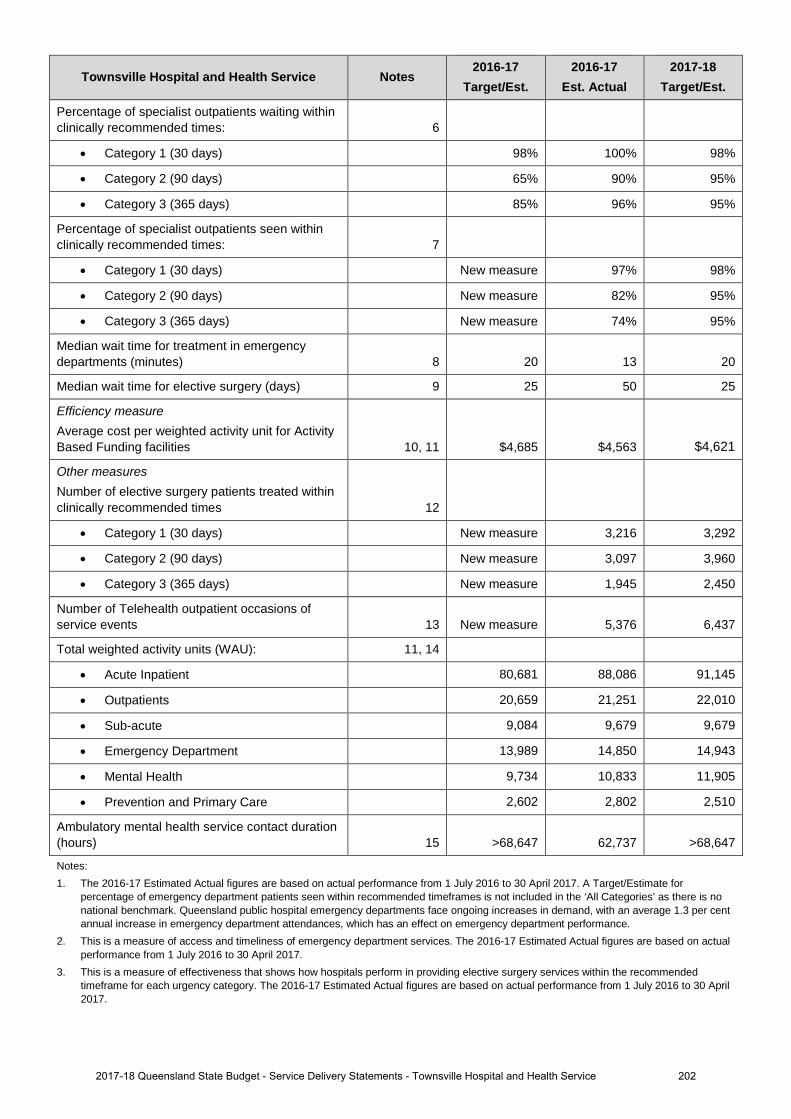
Townsville Hospital and Health Service Notes 2016-17
Target/Est. 2016-17
Est. Actual 2017-18
Target/Est.
Percentage of specialist outpatients waiting within clinically recommended times: 6
• Category 1 (30 days) 98% 100% 98%
• Category 2 (90 days) 65% 90% 95%
• Category 3 (365 days) 85% 96% 95%
Percentage of specialist outpatients seen within clinically recommended times: 7
• Category 1 (30 days) New measure 97% 98%
• Category 2 (90 days) New measure 82% 95%
• Category 3 (365 days) New measure 74% 95%
Median wait time for treatment in emergency departments (minutes) 8 20 13 20
Median wait time for elective surgery (days) 9 25 50 25
Efficiency measure Average cost per weighted activity unit for Activity Based Funding facilities 10, 11 $4,685 $4,563 $4,621
Other measures Number of elective surgery patients treated within clinically recommended times 12
• Category 1 (30 days) New measure 3,216 3,292
• Category 2 (90 days) New measure 3,097 3,960
• Category 3 (365 days) New measure 1,945 2,450
Number of Telehealth outpatient occasions of service events 13 New measure 5,376 6,437
Total weighted activity units (WAU): 11, 14
• Acute Inpatient 80,681 88,086 91,145
• Outpatients 20,659 21,251 22,010
• Sub-acute 9,084 9,679 9,679
• Emergency Department 13,989 14,850 14,943
• Mental Health 9,734 10,833 11,905
• Prevention and Primary Care 2,602 2,802 2,510
Ambulatory mental health service contact duration (hours) 15 >68,647 62,737 >68,647
Notes: 1. The 2016-17 Estimated Actual figures are based on actual performance from 1 July 2016 to 30 April 2017. A Target/Estimate for
percentage of emergency department patients seen within recommended timeframes is not included in the ‘All Categories’ as there is no national benchmark. Queensland public hospital emergency departments face ongoing increases in demand, with an average 1.3 per cent annual increase in emergency department attendances, which has an effect on emergency department performance.
2. This is a measure of access and timeliness of emergency department services. The 2016-17 Estimated Actual figures are based on actualperformance from 1 July 2016 to 30 April 2017.
3. This is a measure of effectiveness that shows how hospitals perform in providing elective surgery services within the recommendedtimeframe for each urgency category. The 2016-17 Estimated Actual figures are based on actual performance from 1 July 2016 to 30 April 2017.
2022017-18 Queensland State Budget - Service Delivery Statements - Townsville Hospital and Health Service
4. This is a National Performance Agreement indicator and a measure of effectiveness of infection control programs and services in hospitals.Staphylococcus aureus are bacteria commonly found on around 30 per cent of people’s skin and noses and often cause no adverseeffects. Infections with this organism can be serious, particularly so when they infect the bloodstream. The data reported for this servicestandard are for bloodstream infections with Staphylococcus aureus (including methicillin resistant Staphylococcus aureus) and arereported as a rate of infection per 10,000 patient days. The Target/Estimate for this measure aligns with the national benchmark of 2 casesper 10,000 acute public hospital patient days for each jurisdiction. The 2016-17 Estimated Actual figures are based on actual performancefrom 1 July 2016 to 31 March 2017.
5. This is a measure of access to, and timeliness of the community support system that is in place for persons who have experienced anacute psychiatric episode requiring hospitalisation. The 2016-17 Estimated Actual is for the period 1 July 2016 to 31 January 2017.Queensland has made significant progress in improving the rate of community follow up over the past five years. Increased pressure oncommunity and inpatient mental health services has seen increases in readmission rates and is impacting the rate of follow up.
6. This is a measure of effectiveness that shows the percentage of patients who are waiting to have their first appointment (from the time ofreferral) with the health professional in an outpatient clinic, within the clinically recommended time. The 2016-17 Estimated Actual figure isbased on patients waiting as at 30 April 2017.
7. This is a measure of effectiveness that indicates the percentage of patients seen within clinically recommended times during the reportingperiod. The 2016-17 Estimated Actual figures are based on actual performance from 1 July 2016 to 30 April 2017.
8. This measure indicates the amount of time for which half of all people waited in the emergency department (for all categories), from thetime of presentation to being seen by a nurse or doctor (whichever was first). The 2016-17 Estimated Actual figure is based on actualperformance from 1 July 2016 to 30 April 2017.
9. This is a measure of effectiveness that reports on the number of days for which half of all patients wait before undergoing elective surgery.The 2016-17 Estimated Actual figures are based on actual performance from 1 July 2016 to 30 April 2017.
10. A WAU is a measure of activity and provides a common unit of comparison so that all activity can be measured consistently. Serviceagreements between the Department of Health and HHSs and other organisations specify the activity to be provided in WAUs by servicetype. Refer to Box 1, page 12.
11. The 2016-17 Estimated Actual figure reflects 1 July to 31 December 2016 activity based costs and actual activity based funded activity.The 2017-18 Target/Estimate reflects the activity based funding less Clinical Education and Training and Specified Grants and activitywithin the finance and activity schedules of the 2017-18 Final Round Service Agreements Contract Offers. 2017-18 Target/Estimate forcost per Queensland WAU includes HHS activity forecast over delivery in 2016-17, funded by the Commonwealth at a marginal rate of45 per cent. As a result, funding per Queensland WAU in 2017-18 is generally lower than the 2016-17 Target/Estimate cost perQueensland WAU. The impact of this is partially offset in some HHSs due to changes in Own Source Revenue classification between2016-17 and 2017-18, and non- Queensland WAU investments. 2016-17 Estimated Actual cost per Queensland WAU is a point in timemeasure which includes the first 6 months of HHS expenditure and activity. It includes the impact of one-off investments in 2016-17.
12. This is a measure of activity. The 2016-17 Estimated Actual figures are based on 10 months of actual performance from 1 July 2016 to30 April 2017 forecast over 12 months.
13. This measure tracks the growth in occasions of service for Telehealth enabled outpatient services. These services support timely access tocontemporary specialist services for patients from regional, rural and remote communities, supporting the reduction in wait times and costsassociated with patient travel. The 2016-17 Estimated Actual figure is based on actual performance from 1 July 2016 to 30 April 2017forecast over 12 months.
14. The 2016-17 Estimated Actual figures are based on 2016-17 Queensland WAU forecasts as provided by HHSs. 2017-18 Target/Estimatefigures are based on the 2017-18 Final Round Service Agreements Contract Offers. All activity is reported in the same phase - ActivityBased Funding (ABF) model Q19. ‘Total WAUs – Interventions and procedures’ has been reallocated to ‘Total WAUs – Acute InpatientCare’ and ‘Total WAUs – Outpatient Care’ service standards. ‘Total WAUs – Prevention and Primary Care’ is comprised of BreastScreenand Dental WAUs. Total WAUS - Prevention and Primary Care’ is a new measure for the Service Delivery Statement, however, it has beenincluded in the HHS Service Agreements since 2016-17. Purchased Queensland WAUs in 2017-18 for Prevention and Primary Care arelower due to one off investments in Oral Health in 2016-17 and NPA funding not yet allocated. 2017-18 Target Queensland WAUs arelower than 2016-17 Estimated Actuals due to an over delivery in Non-ABF activity.
15. This measure counts the number of in-scope service contact hours attributable to each HHS, based on the national definition andcalculation of service contacts and duration. The Estimated Actuals for 2016-17 are for the period 1 July 2016 to 31 March 2017. It isimportant to note that not all activity of ambulatory clinicians is in-scope for this measure, with most review and some service coordinationactivities excluded. In addition, improvements in data quality have contributed to the result, with the data more accurately reflecting way inwhich services are delivered. The Target/Estimate for this measure is determined using a standard formula based upon available clinicalstaffing, HHS rurality, and historical performance. The target for this measure is calculated by the Department of Health to ensureconsistency across the state.
2032017-18 Queensland State Budget - Service Delivery Statements - Townsville Hospital and Health Service
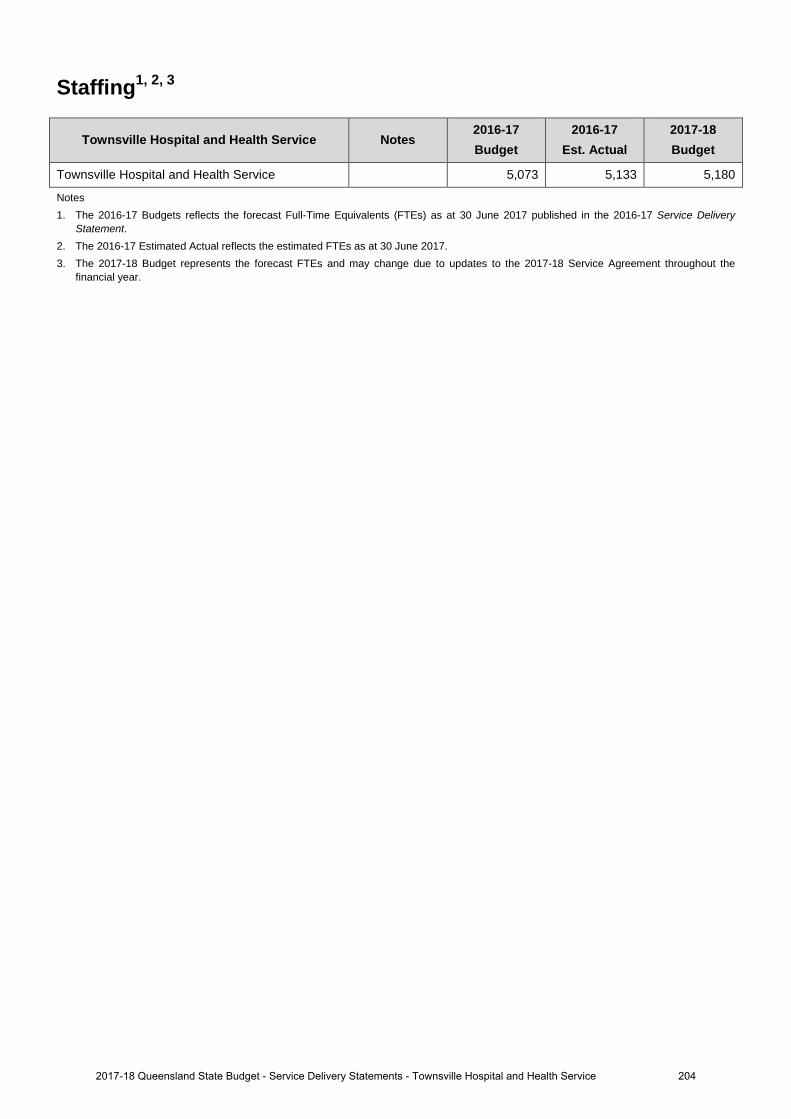
Staffing1, 2, 3
Townsville Hospital and Health Service Notes 2016-17 Budget
2016-17 Est. Actual
2017-18 Budget
Townsville Hospital and Health Service 5,073 5,133 5,180
Notes 1. The 2016-17 Budgets reflects the forecast Full-Time Equivalents (FTEs) as at 30 June 2017 published in the 2016-17 Service Delivery
Statement. 2. The 2016-17 Estimated Actual reflects the estimated FTEs as at 30 June 2017.3. The 2017-18 Budget represents the forecast FTEs and may change due to updates to the 2017-18 Service Agreement throughout the
financial year.
2042017-18 Queensland State Budget - Service Delivery Statements - Townsville Hospital and Health Service

Income statement
Townsville Hospital and Health Service Notes 2016-17 Budget
$'000
2016-17 Est. Act.
$'000
2017-18 Budget
$'000
INCOMEUser charges and fees 1,6,13 840,564 865,407 908,770 Grants and other contributions 2,7,14 22,172 22,382 22,748 Interest 270 305 281Other revenue 3,8 1,235 4,059 4,060Gains on sale/revaluation of assets 20 20 20
Total income 864,261 892,173 935,879 EXPENSES
Employee expenses 4,9,15 617,161 630,161 656,384 Supplies and Services:Other supplies and services 5,10,16 195,254 202,166 228,106 Department of Health contract staff .. .. .. Grants and subsidies 11,17 4,082 4,082 3,300Depreciation and amortisation 43,623 43,623 43,623 Finance/borrowing costs .. .. ..Other expenses 12,18 1,923 1,923 2,228Losses on sale/revaluation of assets 2,218 2,218 2,238
Total expenses 864,261 884,173 935,879 OPERATING SURPLUS/(DEFICIT) .. 8,000 ..
2052017-18 Queensland State Budget - Service Delivery Statements - Townsville Hospital and Health Service
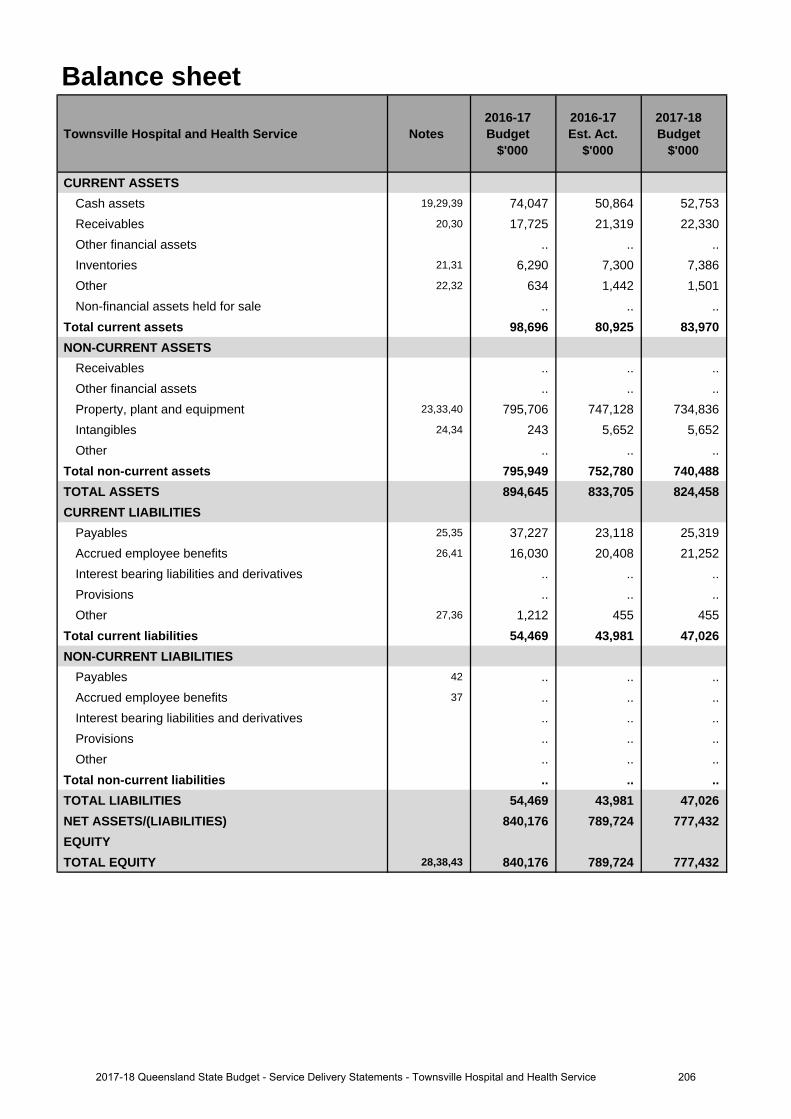
Balance sheet
Townsville Hospital and Health Service Notes 2016-17 Budget
$'000
2016-17 Est. Act.
$'000
2017-18 Budget
$'000
CURRENT ASSETSCash assets 19,29,39 74,047 50,864 52,753 Receivables 20,30 17,725 21,319 22,330 Other financial assets .. .. .. Inventories 21,31 6,290 7,300 7,386Other 22,32 634 1,442 1,501Non-financial assets held for sale .. .. ..
Total current assets 98,696 80,925 83,970 NON-CURRENT ASSETS
Receivables .. .. ..Other financial assets .. .. .. Property, plant and equipment 23,33,40 795,706 747,128 734,836 Intangibles 24,34 243 5,652 5,652Other .. .. ..
Total non-current assets 795,949 752,780 740,488 TOTAL ASSETS 894,645 833,705 824,458 CURRENT LIABILITIES
Payables 25,35 37,227 23,118 25,319 Accrued employee benefits 26,41 16,030 20,408 21,252 Interest bearing liabilities and derivatives .. .. .. Provisions .. .. ..Other 27,36 1,212 455 455
Total current liabilities 54,469 43,981 47,026 NON-CURRENT LIABILITIES
Payables 42 .. .. ..Accrued employee benefits 37 .. .. ..Interest bearing liabilities and derivatives .. .. .. Provisions .. .. ..Other .. .. ..
Total non-current liabilities .. .. .. TOTAL LIABILITIES 54,469 43,981 47,026 NET ASSETS/(LIABILITIES) 840,176 789,724 777,432 EQUITYTOTAL EQUITY 28,38,43 840,176 789,724 777,432
2062017-18 Queensland State Budget - Service Delivery Statements - Townsville Hospital and Health Service

Cash flow statement
Townsville Hospital and Health Service Notes 2016-17 Budget
$'000
2016-17 Est. Act.
$'000
2017-18 Budget
$'000
CASH FLOWS FROM OPERATING ACTIVITIESInflows:
User charges and fees 44,48,51 838,150 861,049 905,642 Grants and other contributions 22,172 22,382 22,748 Interest received 270 305 281Other 17,186 20,010 20,011
Outflows:Employee costs 45,49,52 (617,161) (630,161) (655,540)Supplies and services 46,50,53 (209,270) (216,182) (242,122)Grants and subsidies (4,082) (4,082) (3,300)Borrowing costs .. .. ..Other (1,923) (1,923) (2,228)
Net cash provided by or used in operating activities 45,342 51,398 45,492 CASH FLOWS FROM INVESTING ACTIVITIESInflows:
Sales of non-financial assets 20 20 20 Investments redeemed .. .. ..Loans and advances redeemed .. .. ..
Outflows:Payments for non-financial assets 47 (8,270) (24,692) (11,540)Payments for investments .. .. .. Loans and advances made .. .. ..
Net cash provided by or used in investing activities (8,250) (24,672) (11,520)CASH FLOWS FROM FINANCING ACTIVITIESInflows:
Borrowings .. .. ..Equity injections 8,270 15,627 11,540
Outflows:Borrowing redemptions .. .. ..Finance lease payments .. .. .. Equity withdrawals (43,623) (43,623) (43,623)
Net cash provided by or used in financing activities (35,353) (27,996) (32,083)Net increase/(decrease) in cash held 1,739 (1,270) 1,889 Cash at the beginning of financial year 72,308 52,134 50,864
Cash transfers from restructure .. .. .. Cash at the end of financial year 74,047 50,864 52,753
2072017-18 Queensland State Budget - Service Delivery Statements - Townsville Hospital and Health Service
Income statementMajor variations between 2016-17 Budget and 2016-17 Estimated Actual include:
1. The increase relates to additional funding provided through amendments to the Service Agreement betweenTownsville Hospital and Health Service (HHS) and the Department of Health. Additional funding is providedfor increases in service activity, enterprise bargaining agreements.
2. The increase relates to increased number of grants from external agencies.
3. The increase relates to a revision of other revenue such as the treatment of recoveries.
4. The increase relates to additional funding provided through amendments to the Service Agreement betweenTownsville HHS and the Department of Health. Additional funding is provided for increases in service activity,enterprise bargaining agreements.
5. The increase relates to the purchase of increased service activity by the Department of Health.
Major variations between 2016-17 Budget and 2017-18 Budget include:
6. The increase relates to additional funding provided through the Service Agreement between Townsville HHS andthe Department of Health. Additional funding is provided for increases in service activity, enterprise bargaining,block funded services, teaching, training and research funding and own source revenue.
7. The increase relates to increased number of grants from external agencies.
8. The increase relates to a revision of other revenue such as the treatment of recoveries.
9. The increase relates to additional funding provided through amendments to the Service Agreement betweenTownsville HHS and the Department of Health for increases in service activity and enterprise bargainingagreements.
10. The increase relates to the purchase of increased service activity by the Department of Health.
11. The decrease relates to a reduction in the number of grants provided to external agencies.
12. The increase relates to revision of expenses such as audit fees and other miscellaneous operating expenses.
Major variations between 2016-17 Estimated Actual and the 2017-18 Budget include:
13. The increase relates to additional funding provided through amendments to the Service Agreement betweenTownsville HHS and the Department of Health. Additional funding is provided for increases in service activity,enterprise bargaining agreements.
14. The increase relates to increased number of grants from external agencies.
15. The increase relates to additional funding provided through amendments to the Service Agreement betweenTownsville HHS and the Department of Health. Additional funding is provided for increases in service activity,enterprise bargaining agreements.
16. The increase relates to the purchase of increased service activity by the Department of Health.
17. The decrease relates to a reduction in number of grants provided to external agencies.
18. The increase relates to a revision of expenses such as audit fees and other miscellaneous operating expenses.
Balance sheetMajor variations between 2016-17 Budget and 2016-17 Estimated Actual include:
19. The decrease relates to the provision and timing of funds from the Department of Health to the TownsvilleHospital and Health Service (HHS) combined with the timing around settlement of current payables.
20. The increase is due to additional funding payable from the Department of Health to the Townsville HHS as aresult of financial year technical adjustments.
21. The increase is due to additional inventory levels on hand compared to 2016-17 Budget estimate.
22. The increase relates to additional volume of prepayments compared to 2016-17 Budget estimate.
23. The decrease relates to change in the asset revaluation reserve and a change in the value of assets realised.
Explanation of variances in the financial statements
2082017-18 Queensland State Budget - Service Delivery Statements - Townsville Hospital and Health Service
24. The increase relates to the investment in information technology assets.
25. The decrease relates to the timing around settlement of current payables from the Department of Health.
26. The increase relates to salaries and wages as a result of increased service activity and enterprise bargainingagreements.
27. The decrease relates to the lower unearned revenue at period end.
28. The decrease relates to change in the asset revaluation reserve and a change in the value of assets.
Major variations between 2016-17 Budget and 2017-18 Budget include:
29. The decrease relates to the provision and timing of funds from the Department of Health to the Townsville HHScombined with the timing around settlement of current payables.
30. The increase is due to additional funding payable from the Department of Health to the Townsville HHS as aresult of financial year technical adjustments.
31. The increase is due to additional inventory levels on hand compared to estimated levels at period end.
32. The increase relates to additional volume of prepayments compared to estimated at peroid end.
33. The decrease relates to change in the asset revaluation reserve and a change in the value of assets realised.
34. The increase relates to the investment in information technology assets.
35. The decrease relates to the timing around settlement of current payables from the Department of Health.
36. The decrease relates to the lower unearned revenue at period end.
37. The increase relates to salaries and wages as a result of increased service activity and enterprise bargainingagreements.
38. The decrease relates to a change in asset revaluations and value of assets plus 2016-17 surplus.
Major variations between 2016-17 Estimated Actual and the 2017-18 Budget include:
39. The increase relates to the improved cash flow from additional funding provided through the 2017-18 serviceagreement between Townsville HHS and the Department of Health.
40. The increase relates to the result of the annual revaluation program in 2017-18.
41. The increase relates to increases in salaries and wages from increased service activity and enterprise bargainingagreements.
42. The increase relates to an increase in other supplies and services expenditure in 2017-18.
43. The decrease it is due to forecast depreciation of Non-Current Assets offset by increase in asset revaluationreserve
Cash flow statementMajor variations between 2016-17 Budget and 2016-17 Estimated Actual include:
44. The increase relates to additional funding provided through amendments to the Service Agreement betweenTownsville Hospital and Health Service (HHS) and the Department of Health. Additional funding is providedfor increases in service activity, enterprise bargaining agreements.
45. The increase relates to additional funding provided through amendments to the Service Agreement betweenTownsville HHS and the Department of Health. Additional funding is provided for increases in serviceactivity, enterprise bargaining agreements.
46. The increase relates to additional funding provided through amendments to the Service Agreement betweenTownsville HHS and the Department of Health. Additional funding is provided for increases in serviceactivity, enterprise bargaining agreements.
47. The increase relates to additional Townsville HHS contribution to capital program.
Major variations between 2016-17 Budget and 2017-18 Budget include:
48. The increase relates to additional funding provided through amendments to the Service Agreement betweenTownsville HHS and the Department of Health. Additional funding is provided for increases in serviceactivity, enterprise bargaining agreements.
2092017-18 Queensland State Budget - Service Delivery Statements - Townsville Hospital and Health Service
49. The increase relates to additional funding provided through amendments to the Service Agreement between Townsville HHS and the Department of Health. Additional funding is provided for increases in service activity, enterprise bargaining agreements.
50. The increase relates to additional funding provided through amendments to the Service Agreement between Townsville HHS and the Department of Health. Additional funding is provided for increases in service activity, enterprise bargaining agreements.
Major variations between 2016-17 Estimated Actual and the 2017-18 Budget include:
51. The increase relates to additional funding provided through amendments to the Service Agreement between Townsville HHS and the Department of Health. Additional funding is provided for increases in service activity, enterprise bargaining agreements.
52. The increase relates to additional funding provided through amendments to the Service Agreement between Townsville HHS and the Department of Health. Additional funding is provided for increases in service activity, enterprise bargaining agreements.
53. The increase relates to additional funding provided through amendments to the Service Agreement between Townsville HHS and the Department of Health. Additional funding is provided for increases in service activity, enterprise bargaining agreements.
2102017-18 Queensland State Budget - Service Delivery Statements - Townsville Hospital and Health Service
West Moreton Hospital and Health Service
Overview The West Moreton Hospital and Health Service (HHS) is an independent statutory body overseen by a local Hospital and Health Board. West Moreton HHS is responsible for the delivery of public hospital and health services, including medical, surgical, emergency, obstetrics, paediatrics, specialist outpatient clinics, mental health, critical care, sub-acute and clinical support services to a population of over 252,000 people residing in a geographical area covering 9,521km which extends from Ipswich in the east, to Boonah in the south, north to Esk and west to Gatton.
West Moreton HHS will experience significant growth in the region with the population expected to increase to approximately 593,000 people by 2036. This equates to an increase in excess of 136 per cent on the current population, making West Moreton the fastest growing hospital and health service in the State.
West Moreton is responsible for the direct management of the facilities within the health service’s geographical boundaries including:
• Boonah Health Service • Ipswich Community Health
• Esk Health Service • Ipswich Hospital
• Gailes Community Care Unit • Laidley Health Service
• Gatton Health Service • The Park – Centre for Mental Health
• Goodna Community Health
West Moreton HHS also provides school-based primary oral health care services, community mental health services for all age groups and services for alcohol, tobacco and other drug illnesses and has a range of responsibilities for prison health services including Brisbane Women’s, Wolston and Brisbane Correctional facilities and the Borallon Training and Correctional Centre. Other statewide services provided by West Moreton HHS include the Queensland Centre for Mental Health research, the Queensland Centre for Mental Health Learning and the Queensland Mental Health Benchmarking Unit.
West Moreton Hospital and Health Service has six interrelated strategic directions:
• excellence in patient and family centred care • enable staff to be their best and give their best • provide an agile, resilient health service that anticipates and responds to need • excellence in service delivery through innovation, research and lifelong learning • providing Queenslanders with value in health services • implement integrated governance and systems that transform the delivery of healthcare excellence now and in the
future.
These strategic directions align with My health, Queensland’s future: Advancing health 2026 and support the Queensland Government’s objectives for the community to deliver quality frontline services and strengthen our public health system.
West Moreton is currently undertaking a review of its Strategic Plan. The outputs of the review will drive the implementation of West Moreton’s Service Blueprint. The Service Blueprint outlines West Moreton’s future challenges in delivering care to a rapidly growing and diverse community.
2112017-18 Queensland State Budget - Service Delivery Statements - West Moreton Hospital and Health Service
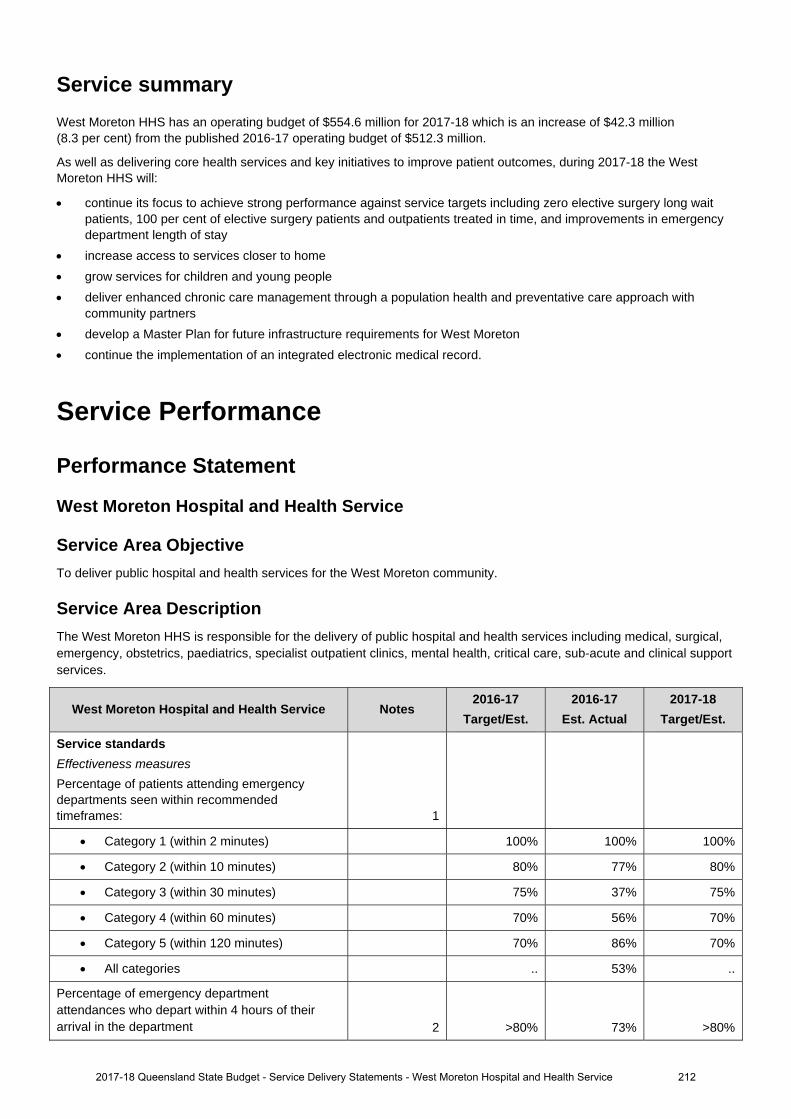
Service summary
West Moreton HHS has an operating budget of $554.6 million for 2017-18 which is an increase of $42.3 million (8.3 per cent) from the published 2016-17 operating budget of $512.3 million.
As well as delivering core health services and key initiatives to improve patient outcomes, during 2017-18 the West Moreton HHS will:
continue its focus to achieve strong performance against service targets including zero elective surgery long wait patients, 100 per cent of elective surgery patients and outpatients treated in time, and improvements in emergency department length of stay
increase access to services closer to home grow services for children and young people deliver enhanced chronic care management through a population health and preventative care approach with
community partners develop a Master Plan for future infrastructure requirements for West Moreton continue the implementation of an integrated electronic medical record.
Service Performance
Performance Statement
West Moreton Hospital and Health Service
Service Area Objective To deliver public hospital and health services for the West Moreton community.
Service Area Description The West Moreton HHS is responsible for the delivery of public hospital and health services including medical, surgical, emergency, obstetrics, paediatrics, specialist outpatient clinics, mental health, critical care, sub-acute and clinical support services.
West Moreton Hospital and Health Service Notes 2016-17
Target/Est. 2016-17
Est. Actual 2017-18
Target/Est.
Service standards
Effectiveness measures Percentage of patients attending emergency departments seen within recommended timeframes: 1
Category 1 (within 2 minutes) 100% 100% 100%
Category 2 (within 10 minutes) 80% 77% 80%
Category 3 (within 30 minutes) 75% 37% 75%
Category 4 (within 60 minutes) 70% 56% 70%
Category 5 (within 120 minutes) 70% 86% 70%
All categories .. 53% ..
Percentage of emergency department attendances who depart within 4 hours of their arrival in the department 2 >80% 73% >80%
2017-18 Queensland State Budget - Service Delivery Statements - West Moreton Hospital and Health Service 212
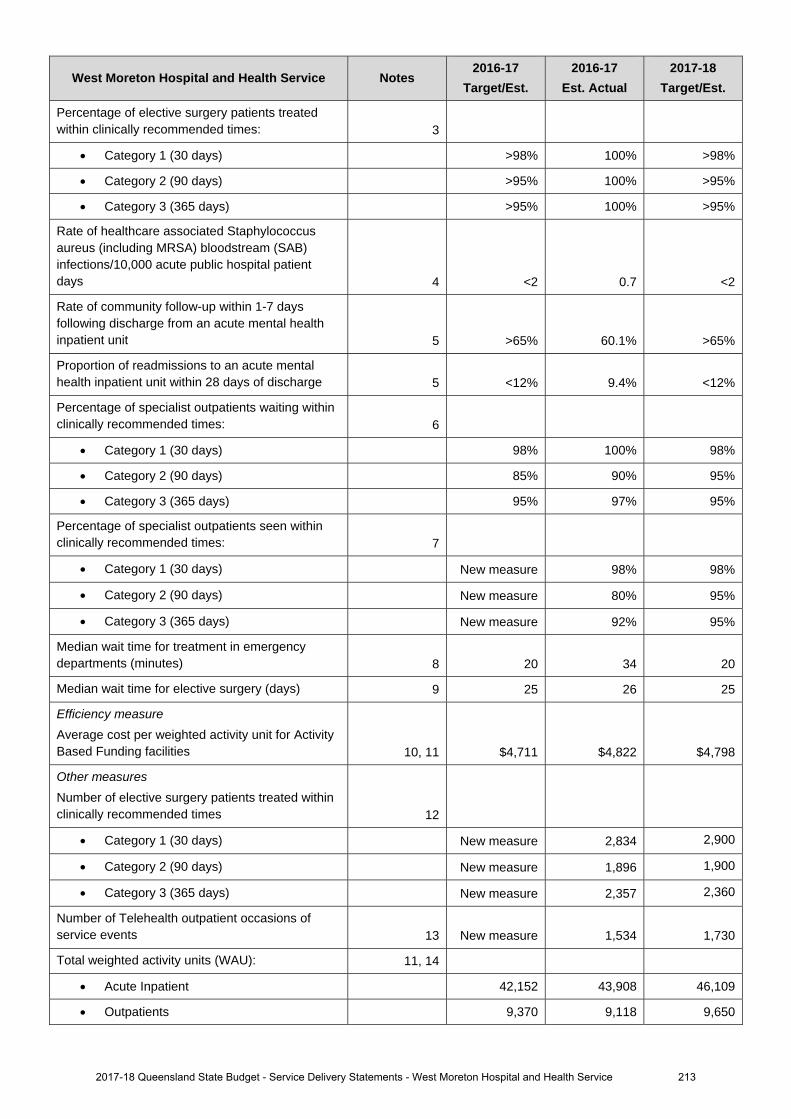
West Moreton Hospital and Health Service Notes 2016-17
Target/Est. 2016-17
Est. Actual 2017-18
Target/Est.
Percentage of elective surgery patients treated within clinically recommended times: 3
Category 1 (30 days) >98% 100% >98%
Category 2 (90 days) >95% 100% >95%
Category 3 (365 days) >95% 100% >95%
Rate of healthcare associated Staphylococcus aureus (including MRSA) bloodstream (SAB) infections/10,000 acute public hospital patient days 4 <2 0.7 <2
Rate of community follow-up within 1-7 days following discharge from an acute mental health inpatient unit 5 >65% 60.1% >65%
Proportion of readmissions to an acute mental health inpatient unit within 28 days of discharge 5 <12% 9.4% <12%
Percentage of specialist outpatients waiting within clinically recommended times: 6
Category 1 (30 days) 98% 100% 98%
Category 2 (90 days) 85% 90% 95%
Category 3 (365 days) 95% 97% 95%
Percentage of specialist outpatients seen within clinically recommended times: 7
Category 1 (30 days) New measure 98% 98%
Category 2 (90 days) New measure 80% 95%
Category 3 (365 days) New measure 92% 95%
Median wait time for treatment in emergency departments (minutes) 8 20 34 20
Median wait time for elective surgery (days) 9 25 26 25
Efficiency measure Average cost per weighted activity unit for Activity Based Funding facilities 10, 11 $4,711 $4,822 $4,798
Other measures Number of elective surgery patients treated within clinically recommended times 12
Category 1 (30 days) New measure 2,834 2,900
Category 2 (90 days) New measure 1,896 1,900
Category 3 (365 days) New measure 2,357 2,360
Number of Telehealth outpatient occasions of service events 13 New measure 1,534 1,730
Total weighted activity units (WAU): 11, 14
Acute Inpatient 42,152 43,908 46,109
Outpatients 9,370 9,118 9,650
2017-18 Queensland State Budget - Service Delivery Statements - West Moreton Hospital and Health Service 213
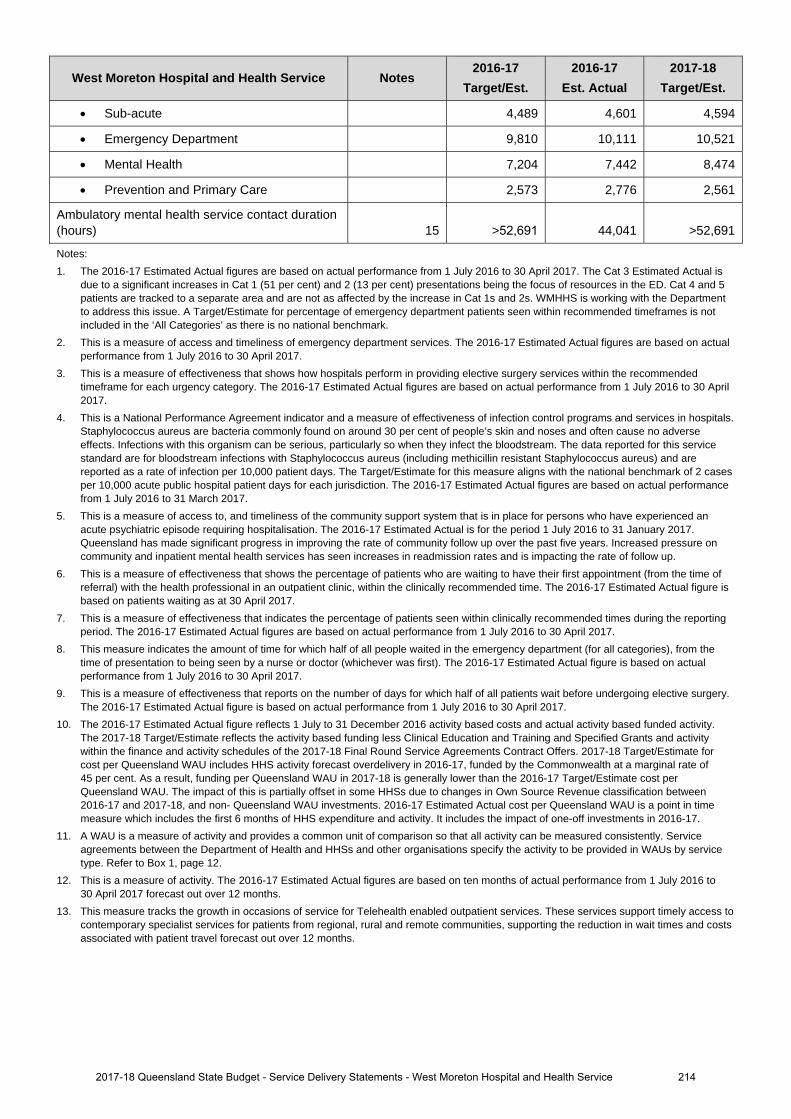
West Moreton Hospital and Health Service Notes 2016-17
Target/Est. 2016-17
Est. Actual 2017-18
Target/Est.
Sub-acute 4,489 4,601 4,594
Emergency Department 9,810 10,111 10,521
Mental Health 7,204 7,442 8,474
Prevention and Primary Care 2,573 2,776 2,561
Ambulatory mental health service contact duration (hours) 15 >52,691 44,041 >52,691
Notes: 1. The 2016-17 Estimated Actual figures are based on actual performance from 1 July 2016 to 30 April 2017. The Cat 3 Estimated Actual is
due to a significant increases in Cat 1 (51 per cent) and 2 (13 per cent) presentations being the focus of resources in the ED. Cat 4 and 5 patients are tracked to a separate area and are not as affected by the increase in Cat 1s and 2s. WMHHS is working with the Department to address this issue. A Target/Estimate for percentage of emergency department patients seen within recommended timeframes is not included in the ‘All Categories’ as there is no national benchmark.
2. This is a measure of access and timeliness of emergency department services. The 2016-17 Estimated Actual figures are based on actualperformance from 1 July 2016 to 30 April 2017.
3. This is a measure of effectiveness that shows how hospitals perform in providing elective surgery services within the recommendedtimeframe for each urgency category. The 2016-17 Estimated Actual figures are based on actual performance from 1 July 2016 to 30 April 2017.
4. This is a National Performance Agreement indicator and a measure of effectiveness of infection control programs and services in hospitals.Staphylococcus aureus are bacteria commonly found on around 30 per cent of people’s skin and noses and often cause no adverse effects. Infections with this organism can be serious, particularly so when they infect the bloodstream. The data reported for this service standard are for bloodstream infections with Staphylococcus aureus (including methicillin resistant Staphylococcus aureus) and are reported as a rate of infection per 10,000 patient days. The Target/Estimate for this measure aligns with the national benchmark of 2 cases per 10,000 acute public hospital patient days for each jurisdiction. The 2016-17 Estimated Actual figures are based on actual performance from 1 July 2016 to 31 March 2017.
5. This is a measure of access to, and timeliness of the community support system that is in place for persons who have experienced anacute psychiatric episode requiring hospitalisation. The 2016-17 Estimated Actual is for the period 1 July 2016 to 31 January 2017. Queensland has made significant progress in improving the rate of community follow up over the past five years. Increased pressure on community and inpatient mental health services has seen increases in readmission rates and is impacting the rate of follow up.
6. This is a measure of effectiveness that shows the percentage of patients who are waiting to have their first appointment (from the time ofreferral) with the health professional in an outpatient clinic, within the clinically recommended time. The 2016-17 Estimated Actual figure is based on patients waiting as at 30 April 2017.
7. This is a measure of effectiveness that indicates the percentage of patients seen within clinically recommended times during the reportingperiod. The 2016-17 Estimated Actual figures are based on actual performance from 1 July 2016 to 30 April 2017.
8. This measure indicates the amount of time for which half of all people waited in the emergency department (for all categories), from thetime of presentation to being seen by a nurse or doctor (whichever was first). The 2016-17 Estimated Actual figure is based on actual performance from 1 July 2016 to 30 April 2017.
9. This is a measure of effectiveness that reports on the number of days for which half of all patients wait before undergoing elective surgery.The 2016-17 Estimated Actual figure is based on actual performance from 1 July 2016 to 30 April 2017.
10. The 2016-17 Estimated Actual figure reflects 1 July to 31 December 2016 activity based costs and actual activity based funded activity.The 2017-18 Target/Estimate reflects the activity based funding less Clinical Education and Training and Specified Grants and activity within the finance and activity schedules of the 2017-18 Final Round Service Agreements Contract Offers. 2017-18 Target/Estimate for cost per Queensland WAU includes HHS activity forecast overdelivery in 2016-17, funded by the Commonwealth at a marginal rate of 45 per cent. As a result, funding per Queensland WAU in 2017-18 is generally lower than the 2016-17 Target/Estimate cost per Queensland WAU. The impact of this is partially offset in some HHSs due to changes in Own Source Revenue classification between 2016-17 and 2017-18, and non- Queensland WAU investments. 2016-17 Estimated Actual cost per Queensland WAU is a point in time measure which includes the first 6 months of HHS expenditure and activity. It includes the impact of one-off investments in 2016-17.
11. A WAU is a measure of activity and provides a common unit of comparison so that all activity can be measured consistently. Serviceagreements between the Department of Health and HHSs and other organisations specify the activity to be provided in WAUs by service type. Refer to Box 1, page 12.
12. This is a measure of activity. The 2016-17 Estimated Actual figures are based on ten months of actual performance from 1 July 2016 to30 April 2017 forecast out over 12 months.
13. This measure tracks the growth in occasions of service for Telehealth enabled outpatient services. These services support timely access tocontemporary specialist services for patients from regional, rural and remote communities, supporting the reduction in wait times and costs associated with patient travel forecast out over 12 months.
2017-18 Queensland State Budget - Service Delivery Statements - West Moreton Hospital and Health Service 214
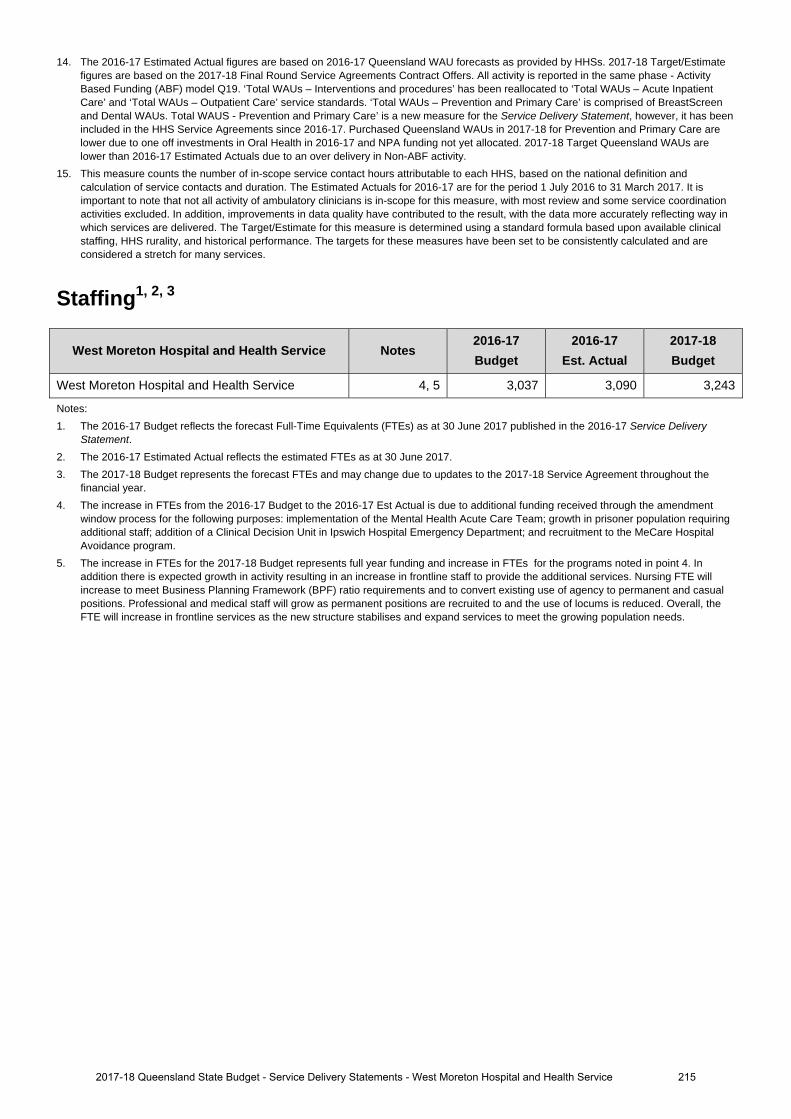
14. The 2016-17 Estimated Actual figures are based on 2016-17 Queensland WAU forecasts as provided by HHSs. 2017-18 Target/Estimatefigures are based on the 2017-18 Final Round Service Agreements Contract Offers. All activity is reported in the same phase - ActivityBased Funding (ABF) model Q19. ‘Total WAUs – Interventions and procedures’ has been reallocated to ‘Total WAUs – Acute InpatientCare’ and ‘Total WAUs – Outpatient Care’ service standards. ‘Total WAUs – Prevention and Primary Care’ is comprised of BreastScreenand Dental WAUs. Total WAUS - Prevention and Primary Care’ is a new measure for the Service Delivery Statement, however, it has beenincluded in the HHS Service Agreements since 2016-17. Purchased Queensland WAUs in 2017-18 for Prevention and Primary Care arelower due to one off investments in Oral Health in 2016-17 and NPA funding not yet allocated. 2017-18 Target Queensland WAUs arelower than 2016-17 Estimated Actuals due to an over delivery in Non-ABF activity.
15. This measure counts the number of in-scope service contact hours attributable to each HHS, based on the national definition andcalculation of service contacts and duration. The Estimated Actuals for 2016-17 are for the period 1 July 2016 to 31 March 2017. It isimportant to note that not all activity of ambulatory clinicians is in-scope for this measure, with most review and some service coordinationactivities excluded. In addition, improvements in data quality have contributed to the result, with the data more accurately reflecting way inwhich services are delivered. The Target/Estimate for this measure is determined using a standard formula based upon available clinicalstaffing, HHS rurality, and historical performance. The targets for these measures have been set to be consistently calculated and areconsidered a stretch for many services.
Staffing1, 2, 3
West Moreton Hospital and Health Service Notes 2016-17 Budget
2016-17 Est. Actual
2017-18 Budget
West Moreton Hospital and Health Service 4, 5 3,037 3,090 3,243
Notes: 1. The 2016-17 Budget reflects the forecast Full-Time Equivalents (FTEs) as at 30 June 2017 published in the 2016-17 Service Delivery
Statement. 2. The 2016-17 Estimated Actual reflects the estimated FTEs as at 30 June 2017.3. The 2017-18 Budget represents the forecast FTEs and may change due to updates to the 2017-18 Service Agreement throughout the
financial year.4. The increase in FTEs from the 2016-17 Budget to the 2016-17 Est Actual is due to additional funding received through the amendment
window process for the following purposes: implementation of the Mental Health Acute Care Team; growth in prisoner population requiringadditional staff; addition of a Clinical Decision Unit in Ipswich Hospital Emergency Department; and recruitment to the MeCare HospitalAvoidance program.
5. The increase in FTEs for the 2017-18 Budget represents full year funding and increase in FTEs for the programs noted in point 4. Inaddition there is expected growth in activity resulting in an increase in frontline staff to provide the additional services. Nursing FTE willincrease to meet Business Planning Framework (BPF) ratio requirements and to convert existing use of agency to permanent and casualpositions. Professional and medical staff will grow as permanent positions are recruited to and the use of locums is reduced. Overall, theFTE will increase in frontline services as the new structure stabilises and expand services to meet the growing population needs.
2017-18 Queensland State Budget - Service Delivery Statements - West Moreton Hospital and Health Service 215

Income statement
West Moreton Hospital and Health Service Notes 2016-17 Budget
$'000
2016-17 Est. Act.
$'000
2017-18 Budget
$'000
INCOMEUser charges and fees 1,6,10 508,097 522,025 551,178 Grants and other contributions 2 3,409 2,611 2,674 Interest 31 31 32 Other revenue 728 641 669 Gains on sale/revaluation of assets 28 .. ..
Total income 512,293 525,308 554,553 EXPENSES
Employee expenses 3,7,11 393,448 379,193 420,649 Supplies and Services:Other supplies and services 4,8,12 99,439 132,992 111,286 Department of Health contract staff .. .. .. Grants and subsidies 473 376 387 Depreciation and amortisation 9,13 15,241 15,241 18,416 Finance/borrowing costs .. .. .. Other expenses 1,906 2,101 2,079 Losses on sale/revaluation of assets 1,786 1,705 1,736
Total expenses 512,293 531,608 554,553 OPERATING SURPLUS/(DEFICIT) 5 .. (6,300) ..
2162017-18 Queensland State Budget - Service Delivery Statements - West Moreton Hospital and Health Service
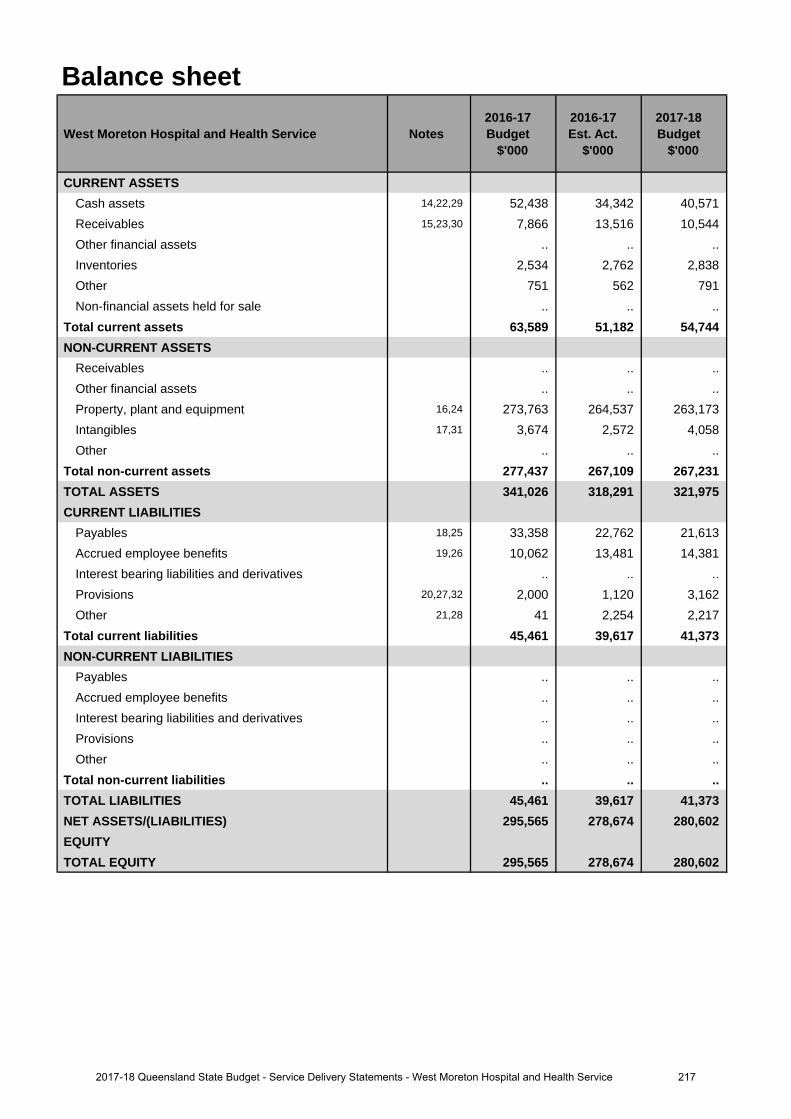
Balance sheet
West Moreton Hospital and Health Service Notes 2016-17 Budget
$'000
2016-17 Est. Act.
$'000
2017-18 Budget
$'000
CURRENT ASSETSCash assets 14,22,29 52,438 34,342 40,571 Receivables 15,23,30 7,866 13,516 10,544 Other financial assets .. .. .. Inventories 2,534 2,762 2,838 Other 751 562 791 Non-financial assets held for sale .. .. ..
Total current assets 63,589 51,182 54,744 NON-CURRENT ASSETS
Receivables .. .. .. Other financial assets .. .. .. Property, plant and equipment 16,24 273,763 264,537 263,173 Intangibles 17,31 3,674 2,572 4,058 Other .. .. ..
Total non-current assets 277,437 267,109 267,231 TOTAL ASSETS 341,026 318,291 321,975 CURRENT LIABILITIES
Payables 18,25 33,358 22,762 21,613 Accrued employee benefits 19,26 10,062 13,481 14,381 Interest bearing liabilities and derivatives .. .. .. Provisions 20,27,32 2,000 1,120 3,162 Other 21,28 41 2,254 2,217
Total current liabilities 45,461 39,617 41,373 NON-CURRENT LIABILITIES
Payables .. .. .. Accrued employee benefits .. .. .. Interest bearing liabilities and derivatives .. .. .. Provisions .. .. .. Other .. .. ..
Total non-current liabilities .. .. .. TOTAL LIABILITIES 45,461 39,617 41,373 NET ASSETS/(LIABILITIES) 295,565 278,674 280,602 EQUITYTOTAL EQUITY 295,565 278,674 280,602
2172017-18 Queensland State Budget - Service Delivery Statements - West Moreton Hospital and Health Service

Cash flow statement
West Moreton Hospital and Health Service Notes 2016-17 Budget
$'000
2016-17 Est. Act.
$'000
2017-18 Budget
$'000
CASH FLOWS FROM OPERATING ACTIVITIESInflows:
User charges and fees 33,40,47 504,617 518,191 553,489 Grants and other contributions 34,41 3,409 2,611 2,674 Interest received 31 31 32 Other 10,632 10,531 10,579
Outflows:Employee costs 35,42,48 (392,583) (378,328) (419,749)Supplies and services 36,43,49 (107,445) (140,943) (122,456)Grants and subsidies (473) (376) (387)Borrowing costs .. .. .. Other (826) (1,023) 541
Net cash provided by or used in operating activities 17,362 10,694 24,723 CASH FLOWS FROM INVESTING ACTIVITIESInflows:
Sales of non-financial assets 37,44 3,033 (71) (79)Investments redeemed .. .. .. Loans and advances redeemed .. .. ..
Outflows:Payments for non-financial assets 38,45,50 (11,043) (7,383) (5,397)Payments for investments .. .. .. Loans and advances made .. .. ..
Net cash provided by or used in investing activities (8,010) (7,454) (5,476)CASH FLOWS FROM FINANCING ACTIVITIESInflows:
Borrowings .. .. .. Equity injections 39,46 3,690 5,585 5,398
Outflows:Borrowing redemptions .. .. .. Finance lease payments .. .. .. Equity withdrawals (15,241) (15,241) (18,416)
Net cash provided by or used in financing activities (11,551) (9,656) (13,018)Net increase/(decrease) in cash held (2,199) (6,416) 6,229 Cash at the beginning of financial year 54,637 40,758 34,342
Cash transfers from restructure .. .. .. Cash at the end of financial year 52,438 34,342 40,571
2182017-18 Queensland State Budget - Service Delivery Statements - West Moreton Hospital and Health Service
Income statementMajor variations between 2016-17 Budget and 2016-17 Estimated Actual include:
1. The increase relates to additional funding provided through the amendments to the Service Agreement betweenWest Moreton Hospital and Health Service (HHS) and the department. Additional funding was provided forincreases in service activity, enterprise bargaining agreements and depreciation expense.
2. The decrease relates to reclassifying funding to User Charges and Fees.
3. The decrease primarily relates to the use of external labour full-time equivalents (FTEs) used being costed toSupplies and Services.
4. The increase relates to increased service activity, additional projects from retained earnings, and increasedoutsourcing to external providers.
5. The deficit in 2016-17 predominately relates to higher operating expenditure, costs associated with emergentIntensive Care Unit works, and to the transfer of ICT Work In Progress for ceased projects to operationalexpenditure in 2016-17.
Major variations between 2016-17 Budget and 2017-18 Budget include:
6. The increase relates to additional funding provided through amendments to the Service Agreement betweenWest Moreton HHS and the department. Additional funding was provided for increases in service activity,enterprise bargaining agreements and depreciation expense.
7. The increase mainly relates to additional expenditure associated with the increase in FTE numbers within WestMoreton HHS and enterprise bargaining arrangements. FTE numbers have increased for a number of reasonsincluding the addition of nurse navigators, increase in nursing graduate numbers, an increase in the prisonerpopulation at correctional facilities and the opening of the Clinical Decision Unit in the Emergency Department.
8. The increase reflects the estimated cost of outsourced services to support activity demand.
9. The increase refers to an increase in the asset base.
Major variations between 2016-17 Estimated Actual and the 2017-18 Budget include:
10. The increase relates to additional funding provided through the amendments to the Service Agreement betweenWest Moreton HHS and the department. Additional funding was provided for increases in service activity,enterprise bargaining agreements and depreciation expense.
11. The increase mainly relates to additional expenditure associated with the increase in FTE numbers within WestMoreton HHS and the enterprise bargaining arrangements. FTE numbers have increased for a number ofreasons including the addition of nurse navigators, increase in nursing graduate numbers, an increase in theprisoner population at correctional facilities and the opening of the Clinical Decision Unit in the EmergencyDepartment.
12. The decrease relates to a return of normal supplies and service expenditure in the 2017-18 budget.
13. The increase refers to an increase in the asset base.
Balance sheetMajor variations between 2016-17 Budget and 2016-17 Estimated Actual include:
14. The decrease relates to the net movement in debtors and creditors, offset by the expected deficit in 2016-17, andthe expected timing of receipts and payments.
15. The increase relates to higher expected debtors - due to recognising revenue based on activity this year and theexpected provision of additional activity funding above contracted amount.
16. The decrease relates to lower than expected increase in fair value of land and buildings and the transfer of$10.8 million land and building at "The Park" out of West Moreton Hospital and Health Service balance sheet toother areas in the department.
17. The decrease relates to lower than expected intangibles due to a number of ICT projects being expensed as theywill be replaced with the Integrated Electronic Medical Record (iEMR) in 2017-18.
Explanation of variances in the financial statements
2192017-18 Queensland State Budget - Service Delivery Statements - West Moreton Hospital and Health Service
18. The decrease relates to lower expected creditors due to timing of payroll payments requiring a significantly lowerpayable in 2016-17 compared to 2015-16.
19. The increase refers to higher expected employee accruals at end of year - due to timing of pay periods.
20. The decrease relates to lower than expected provision for outstanding claims.
21. The increase relates to higher than expected unearned revenue.
Major variations between 2016-17 Budget and 2017-18 Budget include:
22. The decrease relates to the net movement in debtors and creditors, offset by the expected deficit in 2016-17, andthe expected timing of payments and receipts.
23. The increase relates to higher expected debtors - due to expected timing of payments and recognition of revenuebased on activity.
24. The decrease relates to lower than anticipated depreciation.
25. The decrease relates to lower expected creditors due to timing of payroll payments requiring a lower payable in2017-18 compared to 2016-17.
26. The increase refers to higher expected employee accruals at end of year - Enterprise Bargaining andadditional accrual day.
27. The increase relates to an expected higher level of provision for outstanding claims.
28. The increase relates to higher expected unearned revenue.
Major variations between 2016-17 Estimated Actual and the 2017-18 Budget include:
29. The increase relates to the net movement in debtors and creditors offset by the expected deficit in 2016-17.
30. The decrease relates to lower expected debtors - due to expected timing of payments and recognition of revenuebased on activity.
31. The increase relates to higher expected Information Technology projects.
32. The increase relates to higher expected provisions for outstanding claims.
Cash flow statementMajor variations between 2016-17 Budget and 2016-17 Estimated Actual include:
33. The increase relates to additional funding provided through amendments to the Service Agreement between West Moreton HHS and the department. Additional funding was provided for increases in service activity and enterprise bargaining agreements.
34. The decrease relates to reclassifying funding to User Charges and Fees.
35. The decrease primarily relates to the use of external labour full-time equivalents (FTEs) used being costed toSupplies and Services.
36. The increase primarily relates to the use of external labour FTEs used being costed to Supplies & Servicesand to the outsourcing to external providers of activity to meet activity demand.
37. The decrease relates to lower than expected sales of assets.
38. The decrease relates to lower than expected payments for non-financial assets.
39. The increase relates to additional capital funds.
Major variations between 2016-17 Budget and 2017-18 Budget include:
40. The increase relates to additional funding provided through the amendments to the Service Agreement betweenWest Moreton HHS and the department. Additional funding was provided for increases in service activity andenterprise bargaining agreements.
41. The decrease relates to reclassifying funding to User Charges and Fees.
42. The increase relates to an increase of FTEs to service increased activity.
43. The increase is due to costs associated with the increase in activity.
44. The decrease relates to lower than expected sales of assets.
2202017-18 Queensland State Budget - Service Delivery Statements - West Moreton Hospital and Health Service
45. The decrease relates to lower than expected payments for non-financial assets
46. The increase relates to additional capital funds.
Major variations between 2016-17 Estimated Actual and the 2017-18 Budget include:
47. The increase relates to additional funding provided through the Service Agreement between West MoretonHHS and the department. Additional funding was provided for increases in service activity.
48. The increase relates to an increase of labour FTEs to service increased activity.
49. The decrease primarily relates to the reduction of use of external labour FTEs being costed to Supplies and Services and outsourcing to external providers.
50. The decrease relates to lower than expected payments for non-financial assets.
2212017-18 Queensland State Budget - Service Delivery Statements - West Moreton Hospital and Health Service
Wide Bay Hospital and Health Service
Overview The Wide Bay Hospital and Health Service (HHS) is an independent statutory body overseen by a local Hospital and Health Board. The Wide Bay HHS delivers health services to more than 212,000 people across Wide Bay.
The Wide Bay HHS is responsible for the delivery of public hospital and health services including medical, surgical, emergency, obstetrics, paediatrics, specialist outpatient clinics, mental health, critical care and clinical support services to people residing in a geographical area which incorporates the North Burnett, Bundaberg and Fraser Coast local government areas and part of Gladstone Regional Council (Miriam Vale).
The Wide Bay HHS is responsible for the direct management of the facilities and community health services based within the HHS’s geographical boundaries including:
• Bundaberg Hospital • Gin Gin Hospital
• Maryborough Hospital • Monto Hospital
• Hervey Bay Hospital • Biggenden MPHS
• Childers Multi-Purpose Health Service (MPHS) • Eidsvold MPHS
• Mundubbera MPHS • Mount Perry Health Centre
• Gayndah Hospital
The Wide Bay HHS’s vision of ‘Improving health, together’ and the strategic plan consider and support the Queensland Government’s objectives for the community to deliver quality frontline services that strengthen the public health system, and its healthcare priorities to provide patient-centred care. In this context, five pledges to our community have been developed and committed including:
• delivering sustainable, patient centred, quality health services• engaging with our communities and partners• developing and empowering our workforce• encouraging innovation and excellence• delivering value for money.
The Wide Bay HHS will actively engage in opportunity to respond to increasing demands on local public health services including clinical redesign programs, technology initiatives, new funding models, workforce development and strengthening partnerships with primary and aged care sectors.
Service summary The Wide Bay HHS has an operating budget of $581.9 million for 2017-18 which is an increase of $57.4 million (10.9 per cent) from the published 2016-17 operating budget of $524.5 million.
As well as delivering core health services and key initiatives to improve patient outcomes, during 2017-18 the Wide Bay HHS will:
• pilot accreditation ready every day (SNAAP – Short Notice Accreditation Assessment Project), in collaboration withthe Australian Council on Healthcare Standards (ACHS) and the Australian Commission of Safety and Quality inHealth Care (ACSQHC)
• complete construction and commissioning of the new Emergency Department at Hervey Bay Hospital• complete electrical upgrades at Maryborough Hospital and the new mental health step-up – step down facility in
Bundaberg.
2222017-18 Queensland State Budget - Service Delivery Statements - Wide Bay Hospital and Health Service
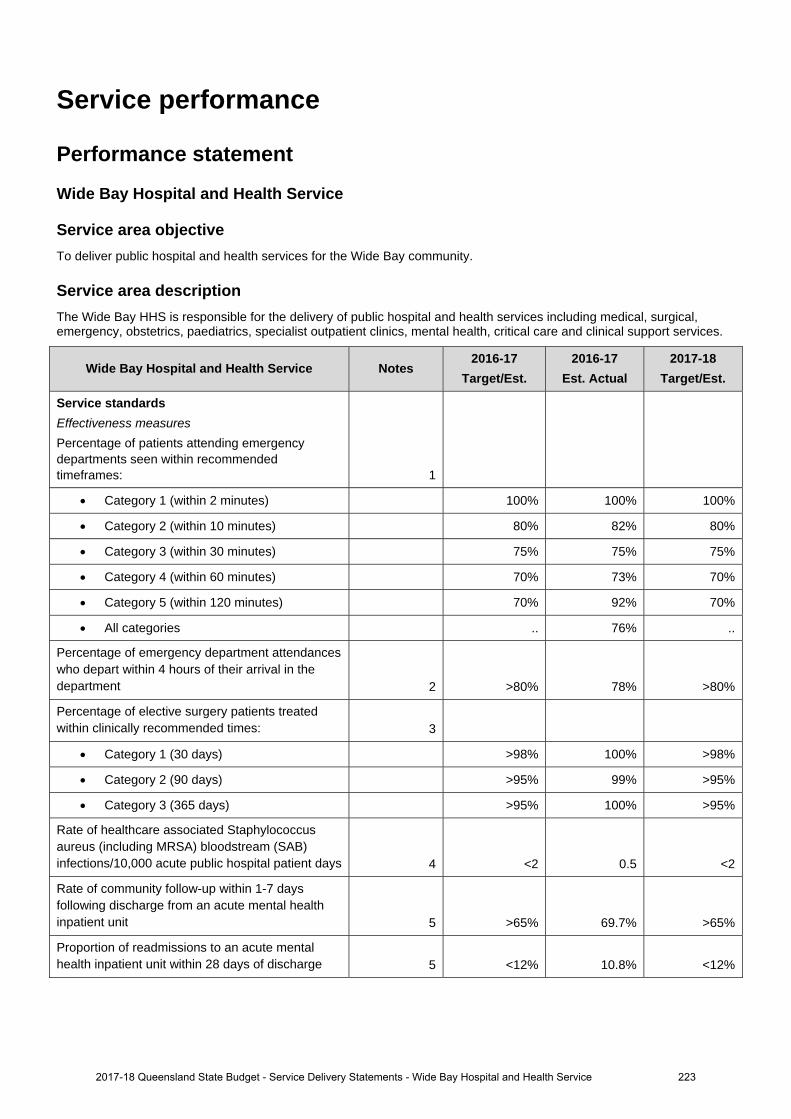
Service performance
Performance statement
Wide Bay Hospital and Health Service
Service area objective To deliver public hospital and health services for the Wide Bay community.
Service area description The Wide Bay HHS is responsible for the delivery of public hospital and health services including medical, surgical, emergency, obstetrics, paediatrics, specialist outpatient clinics, mental health, critical care and clinical support services.
Wide Bay Hospital and Health Service Notes 2016-17
Target/Est. 2016-17
Est. Actual 2017-18
Target/Est.
Service standards
Effectiveness measures Percentage of patients attending emergency departments seen within recommended timeframes: 1
Category 1 (within 2 minutes) 100% 100% 100%
Category 2 (within 10 minutes) 80% 82% 80%
Category 3 (within 30 minutes) 75% 75% 75%
Category 4 (within 60 minutes) 70% 73% 70%
Category 5 (within 120 minutes) 70% 92% 70%
All categories .. 76% ..
Percentage of emergency department attendances who depart within 4 hours of their arrival in the department 2 >80% 78% >80%
Percentage of elective surgery patients treated within clinically recommended times: 3
Category 1 (30 days) >98% 100% >98%
Category 2 (90 days) >95% 99% >95%
Category 3 (365 days) >95% 100% >95%
Rate of healthcare associated Staphylococcus aureus (including MRSA) bloodstream (SAB) infections/10,000 acute public hospital patient days 4 <2 0.5 <2
Rate of community follow-up within 1-7 days following discharge from an acute mental health inpatient unit 5 >65% 69.7% >65%
Proportion of readmissions to an acute mental health inpatient unit within 28 days of discharge 5 <12% 10.8% <12%
2017-18 Queensland State Budget - Service Delivery Statements - Wide Bay Hospital and Health Service 223

Wide Bay Hospital and Health Service Notes 2016-17
Target/Est. 2016-17
Est. Actual 2017-18
Target/Est.
Percentage of specialist outpatients waiting within clinically recommended times: 6
Category 1 (30 days) 98% 99% 98%
Category 2 (90 days) 95% 99% 95%
Category 3 (365 days) 95% 100% 95%
Percentage of specialist outpatients seen within clinically recommended times: 7
Category 1 (30 days) New measure 98% 98%
Category 2 (90 days) New measure 93% 95%
Category 3 (365 days) New measure 98% 95%
Median wait time for treatment in emergency departments (minutes) 8 20 20 20
Median wait time for elective surgery (days) 9 25 32 25
Efficiency measure Average cost per weighted activity unit for Activity Based Funding facilities 10, 11 $4,926 $4,764 $4,891
Other measures Number of elective surgery patients treated within clinically recommended times 12
Category 1 (30 days) New measure 1,879 1,880
Category 2 (90 days) New measure 1,622 1,632
Category 3 (365 days) New measure 1,198 1,198
Number of Telehealth outpatient occasions of service events 13 New measure 5,022 5,783
Total weighted activity units (WAU): 11, 14
Acute Inpatient 46,578 52,433 53,956
Outpatients 12,743 13,206 13,264
Sub-acute 5,542 6,782 6,374
Emergency Department 12,164 13,968 13,965
Mental Health 3,455 3,515 3,516
Prevention and Primary Care 3,310 4,281 3,272
Ambulatory mental health service contact duration (hours) 15 >34,523 33,721 >34,523
Notes: 1. The 2016-17 Estimated Actual figures are based on actual performance from 1 July 2016 to 30 April 2017. A Target/Estimate for
percentage of emergency department patients seen within recommended timeframes is not included in the ‘All Categories’ as there is no national benchmark. Queensland public hospital emergency departments face ongoing increases in demand, with an average 1.3 per cent annual increase in emergency department attendances, which has an effect on emergency department performance.
2. This is a measure of access and timeliness of emergency department services. The 2016-17 Estimated Actual figures are based on actualperformance from 1 July 2016 to 30 April 2017.
3. This is a measure of effectiveness that shows how hospitals perform in providing elective surgery services within the recommendedtimeframe for each urgency category. The 2016-17 Estimated Actual figures are based on actual performance from 1 July 2016 to 30 April 2017.
2017-18 Queensland State Budget - Service Delivery Statements - Wide Bay Hospital and Health Service 224
4. This is a National Performance Agreement indicator and a measure of effectiveness of infection control programs and services in hospitals. Staphylococcus aureus are bacteria commonly found on around 30 per cent of people’s skin and noses and often cause no adverse effects. Infections with this organism can be serious, particularly so when they infect the bloodstream. The data reported for this service standard are for bloodstream infections with Staphylococcus aureus (including methicillin resistant Staphylococcus aureus) and are reported as a rate of infection per 10,000 patient days. The Target/Estimate for this measure aligns with the national benchmark of 2 cases per 10,000 acute public hospital patient days for each jurisdiction. The 2016-17 Estimated Actual figures are based on actual performance from 1 July 2016 to 31 March 2017.
5. This is a measure of access to, and timeliness of the community support system that is in place for persons who have experienced an acute psychiatric episode requiring hospitalisation. The 2016-17 Estimated Actual is for the period 1 July 2016 to 31 January 2017. Queensland has made significant progress in improving the rate of community follow up over the past five years. Increased pressure on community and inpatient mental health services has seen increases in readmission rates and is impacting the rate of follow up.
6. This is a measure of effectiveness that shows the percentage of patients who are waiting to have their first appointment (from the time of referral) with the health professional in an outpatient clinic, within the clinically recommended time. The 2016-17 Estimated Actual figure is based on patients waiting as at 30 April 2017.
7. This is a measure of effectiveness that indicates the percentage of patients seen within clinically recommended times during the reporting period. The 2016-17 Estimated Actual figures are based on actual performance from 1 July 2016 to 30 April 2017.
8. This measure indicates the amount of time for which half of all people waited in the emergency department (for all categories), from the time of presentation to being seen by a nurse or doctor (whichever was first). The 2016-17 Estimated Actual figure is based on actual performance from 1 July 2016 to 30 April 2017.
9. This is a measure of effectiveness that reports on the number of days for which half of all patients wait before undergoing elective surgery. The 2016-17 Estimated Actual figures are based on actual performance from 1 July 2016 to 30 April 2017.
10. The 2016-17 Estimated Actual figure reflects 1 July to 31 December 2016 activity based costs and actual activity based funded activity. The 2017-18 Target/Estimate reflects the activity based funding less Clinical Education and Training and Specified Grants and activity within the finance and activity schedules of the 2017-18 Final Round Service Agreements Contract Offers. 2017-18 Target/Estimate for cost per Queensland WAU includes HHS activity forecast over delivery in 2016-17, funded by the Commonwealth at a marginal rate of 45 per cent. As a result, funding per Queensland WAU in 2017-18 is generally lower than the 2016-17 Target/Estimate cost per Queensland WAU. The impact of this is partially offset in some HHSs due to changes in Own Source Revenue classification between 2016-17 and 2017-18, and non- Queensland WAU investments. 2016-17 Estimated Actual cost per Queensland WAU is a point in time measure which includes the first 6 months of HHS expenditure and activity. It includes the impact of one-off investments in 2016-17.
11. A WAU is a measure of activity and provides a common unit of comparison so that all activity can be measured consistently. Service agreements between the Department of Health and HHSs and other organisations specify the activity to be provided in WAUs by service type. Refer to Box 1, page 12.
12. This is a measure of activity. The 2016-17 Estimated Actual figures are based on 10 months of actual performance from 1 July 2016 to 30 April 2017 forecast out over 12 months.
13. This measure tracks the growth in occasions of service for Telehealth enabled outpatient services. These services support timely access to contemporary specialist services for patients from regional, rural and remote communities, supporting the reduction in wait times and costs associated with patient travel. The 2016-17 Estimated Actual figure is based on actual performance from 1 July 2016 to 30 April 2017 forecast out over 12 months.
14. The 2016-17 Estimated Actual figures are based on 2016-17 Queensland WAU forecasts as provided by HHSs. 2017-18 Target/Estimate figures are based on the 2017-18 Final Round Service Agreements Contract Offers. All activity is reported in the same phase - Activity Based Funding (ABF) model Q19. ‘Total WAUs – Interventions and procedures’ has been reallocated to ‘Total WAUs – Acute Inpatient Care’ and ‘Total WAUs – Outpatient Care’ service standards. ‘Total WAUs – Prevention and Primary Care’ is comprised of BreastScreen and Dental WAUs. Total WAUS - Prevention and Primary Care’ is a new measure for the Service Delivery Statement, however, it has been included in the HHS Service Agreements since 2016-17. Purchased Queensland WAUs in 2017-18 for Prevention and Primary Care are lower due to one off investments in Oral Health in 2016-17 and NPA funding not yet allocated. 2017-18 Target Queensland WAUs are lower than 2016-17 Estimated Actuals due to an over delivery in Non-ABF activity.
15. This measure counts the number of in-scope service contact hours attributable to each HHS, based on the national definition and calculation of service contacts and duration. The Estimated Actuals for 2016-17 are for the period 1 July 2016 to 31 March 2017. It is important to note that not all activity of ambulatory clinicians is in-scope for this measure, with most review and some service coordination activities excluded. In addition, improvements in data quality have contributed to the result, with the data more accurately reflecting way in which services are delivered. The Target/Estimate for this measure is determined using a standard formula based upon available clinical staffing, HHS rurality, and historical performance. The targets for these measures have been set to be consistently calculated and are considered a stretch for many services.
2252017-18 Queensland State Budget - Service Delivery Statements - Wide Bay Hospital and Health Service
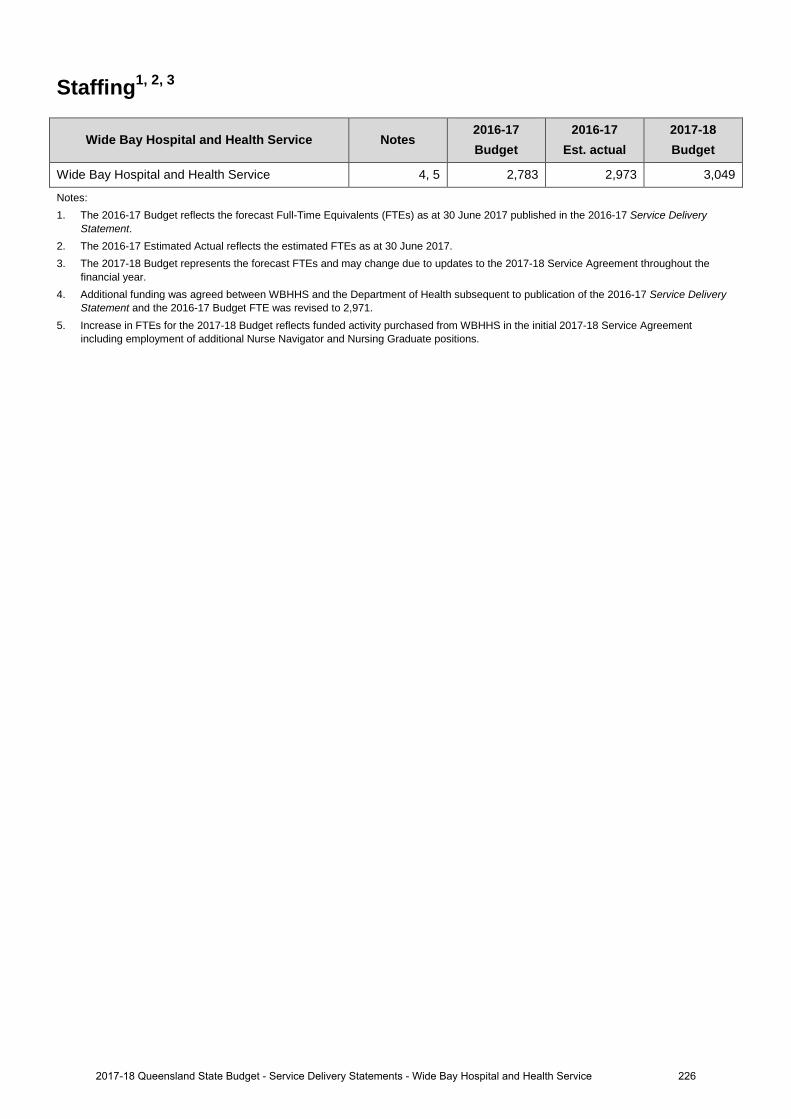
Staffing1, 2, 3
Wide Bay Hospital and Health Service Notes 2016-17 Budget
2016-17 Est. actual
2017-18 Budget
Wide Bay Hospital and Health Service 4, 5 2,783 2,973 3,049
Notes: 1. The 2016-17 Budget reflects the forecast Full-Time Equivalents (FTEs) as at 30 June 2017 published in the 2016-17 Service Delivery
Statement. 2. The 2016-17 Estimated Actual reflects the estimated FTEs as at 30 June 2017. 3. The 2017-18 Budget represents the forecast FTEs and may change due to updates to the 2017-18 Service Agreement throughout the
financial year. 4. Additional funding was agreed between WBHHS and the Department of Health subsequent to publication of the 2016-17 Service Delivery
Statement and the 2016-17 Budget FTE was revised to 2,971. 5. Increase in FTEs for the 2017-18 Budget reflects funded activity purchased from WBHHS in the initial 2017-18 Service Agreement
including employment of additional Nurse Navigator and Nursing Graduate positions.
2262017-18 Queensland State Budget - Service Delivery Statements - Wide Bay Hospital and Health Service

Income statement
Wide Bay Hospital and Health Service Notes 2016-17 Budget
$'000
2016-17 Est. Act.
$'000
2017-18 Budget
$'000
INCOMEUser charges and fees 1,5,9 516,090 556,826 573,182 Grants and other contributions 3,703 3,529 3,584 Interest 58 56 58 Other revenue 4,687 5,376 4,976 Gains on sale/revaluation of assets .. 89 93
Total income 524,538 565,876 581,893 EXPENSES
Employee expenses 2,6 57,347 64,762 66,382 Supplies and Services:Other supplies and services 3,7 161,849 169,927 177,421 Department of Health contract staff 4,8,10 288,578 305,216 321,375 Grants and subsidies .. .. .. Depreciation and amortisation 15,859 15,859 15,577 Finance/borrowing costs .. .. .. Other expenses 733 552 566 Losses on sale/revaluation of assets 172 560 572
Total expenses 524,538 556,876 581,893 OPERATING SURPLUS/(DEFICIT) .. 9,000 ..
2272017-18 Queensland State Budget - Service Delivery Statements - Wide Bay Hospital and Health Service

Balance sheet
Wide Bay Hospital and Health Service Notes 2016-17 Budget
$'000
2016-17 Est. Act.
$'000
2017-18 Budget
$'000
CURRENT ASSETSCash assets 11,13,15 4,419 11,629 12,673 Receivables 12,14 6,992 11,937 12,079 Other financial assets .. .. .. Inventories 4,202 4,065 4,099 Other 311 463 496 Non-financial assets held for sale .. .. ..
Total current assets 15,924 28,094 29,347 NON-CURRENT ASSETS
Receivables .. .. .. Other financial assets .. .. .. Property, plant and equipment 218,589 210,753 219,655 Intangibles 82 61 41 Other .. .. ..
Total non-current assets 218,671 210,814 219,696 TOTAL ASSETS 234,595 238,908 249,043 CURRENT LIABILITIES
Payables 28,253 29,150 30,403 Accrued employee benefits 981 1,877 1,877 Interest bearing liabilities and derivatives .. .. .. Provisions .. .. .. Other 82 284 284
Total current liabilities 29,316 31,311 32,564 NON-CURRENT LIABILITIES
Payables .. .. .. Accrued employee benefits .. .. .. Interest bearing liabilities and derivatives .. .. .. Provisions .. .. .. Other .. .. ..
Total non-current liabilities .. .. .. TOTAL LIABILITIES 29,316 31,311 32,564 NET ASSETS/(LIABILITIES) 205,279 207,597 216,479 EQUITYTOTAL EQUITY 205,279 207,597 216,479
2282017-18 Queensland State Budget - Service Delivery Statements - Wide Bay Hospital and Health Service
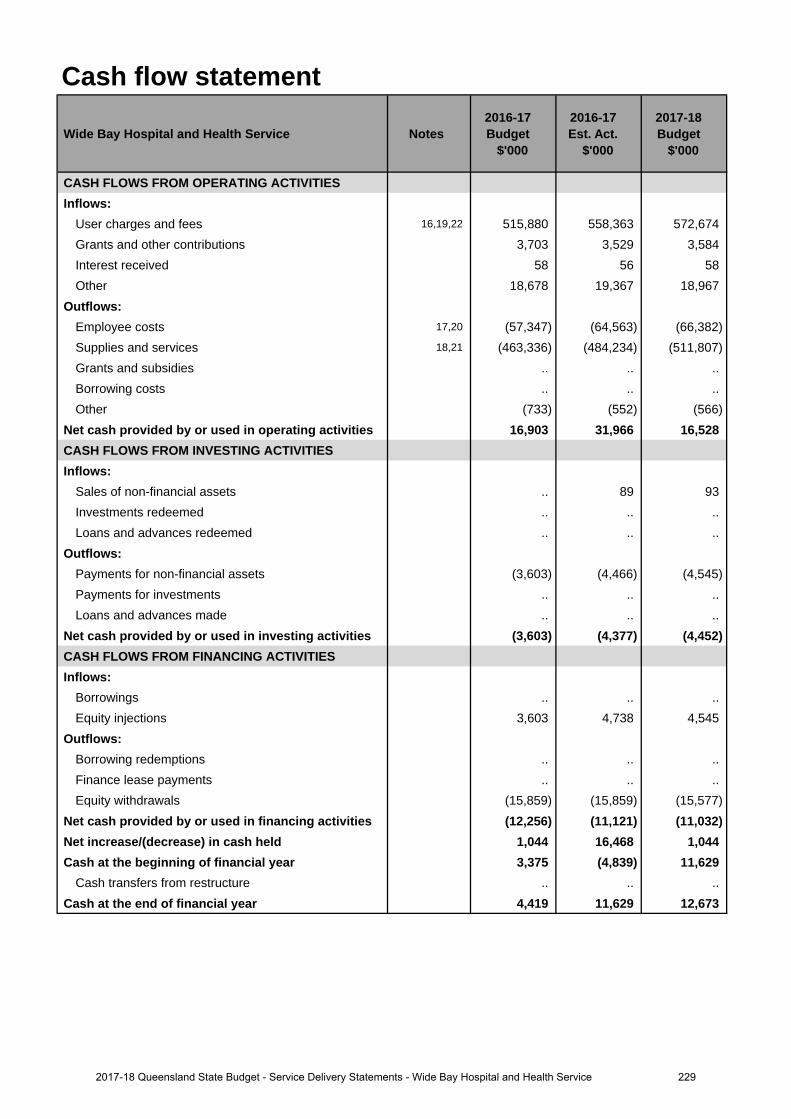
Cash flow statement
Wide Bay Hospital and Health Service Notes 2016-17 Budget
$'000
2016-17 Est. Act.
$'000
2017-18 Budget
$'000
CASH FLOWS FROM OPERATING ACTIVITIESInflows:
User charges and fees 16,19,22 515,880 558,363 572,674 Grants and other contributions 3,703 3,529 3,584 Interest received 58 56 58 Other 18,678 19,367 18,967
Outflows:Employee costs 17,20 (57,347) (64,563) (66,382)Supplies and services 18,21 (463,336) (484,234) (511,807)Grants and subsidies .. .. .. Borrowing costs .. .. .. Other (733) (552) (566)
Net cash provided by or used in operating activities 16,903 31,966 16,528 CASH FLOWS FROM INVESTING ACTIVITIESInflows:
Sales of non-financial assets .. 89 93 Investments redeemed .. .. .. Loans and advances redeemed .. .. ..
Outflows:Payments for non-financial assets (3,603) (4,466) (4,545)Payments for investments .. .. .. Loans and advances made .. .. ..
Net cash provided by or used in investing activities (3,603) (4,377) (4,452)CASH FLOWS FROM FINANCING ACTIVITIESInflows:
Borrowings .. .. .. Equity injections 3,603 4,738 4,545
Outflows:Borrowing redemptions .. .. .. Finance lease payments .. .. .. Equity withdrawals (15,859) (15,859) (15,577)
Net cash provided by or used in financing activities (12,256) (11,121) (11,032)Net increase/(decrease) in cash held 1,044 16,468 1,044 Cash at the beginning of financial year 3,375 (4,839) 11,629
Cash transfers from restructure .. .. .. Cash at the end of financial year 4,419 11,629 12,673
2292017-18 Queensland State Budget - Service Delivery Statements - Wide Bay Hospital and Health Service
Income statementMajor variations between 2016-17 Budget and 2016-17 Estimated Actual include:
1. Increase relates to additional funding provided through amendments to the Service Agreement between Wide Bay Hospital and Health Service (HHS) and the Department of Health for increases in purchased service activity together with changes to Own Source Revenue estimates (especially high cost drug reimbursement).
2. Increase relates to additional Senior Medical Officers permanently recruited during 2016-17 which has been offsetby a reduction in Locums.
3. Increase relates to additional funding provided through amendments to the Service Agreement between Wide Bay HHS and the Department of Health for increases in purchased service activity together with additional reimbursable high cost drug expenditure offset in part by reduced expenditure on Locums.
4. Increase relates to additional funding provided through amendments to the Service Agreement between Wide Bay HHS and the Department of Health for increases in purchased service activity.
Major variations between 2016-17 Budget and 2017-18 Budget include:
5. Increase relates to additional funding provided through amendments to the Service Agreement between Wide Bay HHS and the Department of Health for increases in purchased service activity and Enterprise Bargaining Agreements together with changes to Own Source Revenue estimates (especially high cost drug reimbursement).
6. Increase relates to additional Senior Medical Officers permanently recruited during 2016-17 which has been offsetby a reduction in Locums together with Enterprise Bargaining Agreements.
7. Increase relates to additional funding provided through amendments to the Service Agreement between Wide Bay HHS and the Department of Health for increases in purchased service activity together with additional reimbursable high cost drug expenditure offset in part by reduced expenditure on Locums.
8. Increase relates to additional funding provided through amendments to the Service Agreement between Wide Bay HHS and the Department of Health for increases in purchased service activity together with Enterprise Bargaining Agreements.
Major variations between 2016-17 Estimated Actual and the 2017-18 Budget include:
9. Increase relates to Enterprise Bargaining Agreements and non-labour escalation.
10. Increase relates to additional funding provided through amendments to the Service Agreement between Wide Bay HHS
and the Department of Health for increases in purchased service activity together with Enterprise
Bargaining Agreements.
Balance sheetMajor variations between 2016-17 Budget and 2016-17 Estimated Actual include:
11. Increase is due primarily to the forecast surplus position at June 2017.
12. Increase relates to funding not yet received by Wide Bay Hospital and Health Service (HHS) from the department as a result of end of year technical adjustments including Commonwealth Growth funding.
Major variations between 2016-17 Budget and 2017-18 Budget include:
13. Increase is due primarily to the forecast surplus position at June 2017.
14. Increase relates to funding not yet received by Wide Bay HHS from the department as a result of end of year technical adjustments including Commonwealth Growth funding.
Major variations between 2016-17 Estimated Actual and the 2017-18 Budget include:
15. Increase is due primarily to the forecast surplus position at June 2017.
Explanation of variances in the financial statements
2302017-18 Queensland State Budget - Service Delivery Statements - Wide Bay Hospital and Health Service
Cash flow statementMajor variations between 2016-17 Budget and 2016-17 Estimated Actual include:
16. Increase relates to additional funding provided through amendments to the Service Agreement between Wide Bay Health and Hospital Service (HHS) and the Department of Health for increases in purchased service activity together with changes to Own Source Revenue estimates (especially high cost drug reimbursement).
17. Increase relates to additional Senior Medical Officers permanently recruited during 2016-17 which has been offsetby a reduction in Locums.
18. Increase relates to additional funding provided through amendments to the Service Agreement between Wide Bay HHS and the Department of Health for increases in purchased service activity together with additional reimbursable high cost drug expenditure offset in part by reduced expenditure on Locums.
Major variations between 2016-17 Budget and 2017-18 Budget include:
19. Increase relates to additional funding provided through amendments to the Service Agreement between Wide Bay HHS and the Department of Health for increases in purchased service activity and Enterprise Bargaining Agreements together with changes to Own Source Revenue estimates (especially high cost drug reimbursement).
20. Increase relates to additional Senior Medical Officers permanently recruited during 2016-17 which has been offsetby a reduction in Locums together with Enterprise Bargaining Agreements.
21. Increase relates to additional funding provided through amendments to the Service Agreement between Wide Bay HHS and the Department of Health for increases in purchased service activity together with additional reimbursable high cost drug expenditure offset in part by reduced expenditure on Locums.
Major variations between 2016-17 Estimated Actual and the 2017-18 Budget include:
22. Increase relates to Enterprise Bargaining Agreements and non-labour escalation.
2312017-18 Queensland State Budget - Service Delivery Statements - Wide Bay Hospital and Health Service
The Council of the Queensland Institute of Medical Research
Overview The Council of the Queensland Institute of Medical Research, known as the QIMR Berghofer Medical Research Institute (QIMR Berghofer), is a world-leading translational research institute, established as a statutory body under the Queensland Institute of Medical Research Act 1945. QIMR Berghofer’s research strategy focuses on four major areas: Cancer, Infectious Diseases, Mental Health and Chronic Disorders.
QIMR Berghofer aims to improve health by developing prevention strategies, new diagnostics and better health treatments. Its current strategic objectives are to:
• foster scientific excellence, including training researchers of the future • build scientific, institutional and international connectivity and • undertake research with clinical, economic and community consequences.
The realisation of QIMR Berghofer’s strategic objectives is dependent on its success in securing funding from both government and non-government sources, including community and philanthropic donations and income from commercialisation activities. In 2017-18, QIMR Berghofer will receive $18.9 million from the Queensland Government, representing approximately 15 per cent of total revenue. This, together with competitive peer-reviewed medical research grants, is QIMR Berghofer’s most significant source of funding. The State Government grant, and the support operations it finances, enables QIMR Berghofer to leverage this funding to secure competitive peer-reviewed medical research grants and other income.
Service summary QIMR Berghofer is Queensland’s statutory medical research institute. The Institute interacts broadly and deeply with the State’s Hospital and Health Services, others engaged in medical research and communities throughout the Queensland.
QIMR Berghofer contributes to the Queensland Government’s objective of creating jobs and a diverse economy. The Institute is experiencing a period of growth. We are actively recruiting researchers in areas of high importance to Queensland - including tropical diseases, vaccine development, cancer and genomics - to increase our capacity to approximately 1,000 staff, students and visiting scientists by the year 2020. Each of the four themes; Cancer, Infectious Diseases, Mental Health and Chronic Disorders - has been selected to align with the needs of Queensland.
QIMR Berghofer directly contributes to the Queensland Government’s objectives relating to a stronger public health system by translating the knowledge we produce and discoveries we make into improved clinical practice. By advancing medical knowledge and improving public health, we also contribute to the Queensland Government’s objective of building safe, caring and connected communities. Our research in cancer, in particular our world-leading research on immunotherapy, is having a major impact and is particularly important given our ageing population and the heavy occurrence and burden of this family of diseases. Our work in infectious diseases, especially tropical diseases, is vital for the people of northern Queensland, the tourism industry, and for the greater population given the pole-ward migration of species due to climate change bringing tropical diseases closer to major southern population centres. In this program our malaria trials are unique and extensively used by the Gates Foundation. Our research into mental health, such as dementia, Alzheimer’s and depression, is increasingly relevant due to increases in the incidence of these diseases. Our work in our newly established Chronic Disorders program will address many of the health impacts associated with changes in our demographics and lifestyles. Our work is helping to broaden and deepen Queensland’s economic base, especially in the high-value, high-growth health and medical sector.
2322017-18 Queensland State Budget - Service Delivery Statements - The Council of the Queensland Institute of Medical Research
QIMR Berghofer is a translational research facility, where research develops from the laboratory bench through to the patient’s bedside. In doing so we embrace the need to promote and develop links with industry in keeping with our understanding that the path from the bench to the bedside passes through a business phase; hence our mantra of 'Bench to Business to Bedside' (B2B2B). QIMR Berghofer’s research supports different Queensland scientific and medical sectors by researching and creating new and improved treatments and screening programs for various diseases and disorders.
QIMR Berghofer’s research focuses on improving the prevention, diagnosis and treatment of a range of diseases and conditions relevant to Queenslanders, which will help address pressures facing the public health care sector by lessening rates of disease, and improving quality of life and health care practices.
During 2016–2017, QIMR Berghofer:
• produced around 800 scientific papers (more than double the figure of 10 years ago) and recorded a 10-fold increase in citations of Institute papers by researchers worldwide in the past 10 years. These are indicators of the quantity and quality of the research
• developed new immunotherapies – therapies that use the body’s own immune system to prevent secondary spread of cancer
• conducted studies on Zika virus using a newly developed animal model • conducted 17 ongoing clinical trials led by our researchers and contributed to 35 third-party-sponsored ongoing
clinical trials • expanded Q-Gen Cellular Therapeutics, our TGA-certified good manufacturing practice (GMP) facility, to
accommodate an increase in manufacturing of cellular therapeutics • showed that melanoma rates in Australia are declining (a world-first), demonstrating that the primary prevention
recommendations arising from the Institute’s research are being implemented effectively • added health economics to our research activities • established The SEEDBox® (Scientific Exploitation and Entrepreneurial Development) to nurture and mature
promising commercial projects, and saw the first projects transferred to the Institute’s SEEDBox™ laboratory for support through to commercialisation
• welcomed BGI, one of the world’s largest genomics companies, to establish its Asia-Pacific headquarters in the Institute
• introduced financial support for female researchers who are mothers with the goal of retaining women in science, thereby maximising the benefit of the public investment in their training
• introduced a novel ‘Leave of Absence for Entrepreneurs’ policy • presented to more than 2,000 high school students and almost 4,000 members of the community.
In 2017–18, QIMR Berghofer will:
• develop new blood-based biomarkers for the detection and monitoring of cancers • progress studies on Alzheimers disease using a combination of genetics and imaging (at the Herston Imaging
Research Facility) • progress a major study into malignant mesothelioma, investigating mutations, biomarkers and potential new
therapeutic targets for this aggressive asbestos-related cancer • use a Zika virus animal model to test internal and external research hypotheses and treatments • expand the Institute’s proteomics capacity to include metabolomics and lipidomics • test at least six new anti-malaria drugs in our ‘human challenge’ trials performed at our Clinical Trials company,
Q-Pharm • continue leading D-Health, a five-year randomised trial of more than 20,000 people investigating the role of
vitamin D supplementation in preventing premature death, cancer and other chronic diseases • complete the genetic analysis of 19,000 participants in the QSkin study – the world’s largest study of skin cancer • establish a start-up genomics company.
2332017-18 Queensland State Budget - Service Delivery Statements - The Council of the Queensland Institute of Medical Research
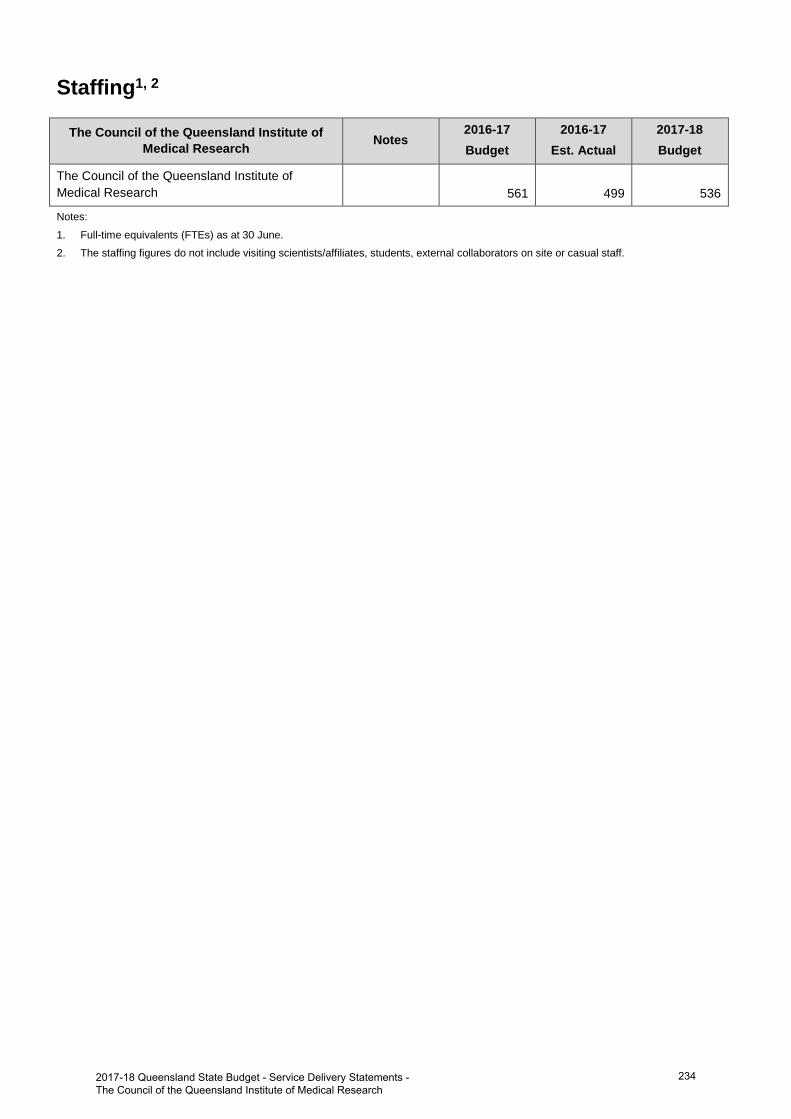
Staffing1, 2
The Council of the Queensland Institute of Medical Research
Notes 2016-17 Budget
2016-17 Est. Actual
2017-18 Budget
The Council of the Queensland Institute of Medical Research 561 499 536
Notes:
1. Full-time equivalents (FTEs) as at 30 June.
2. The staffing figures do not include visiting scientists/affiliates, students, external collaborators on site or casual staff.
2342017-18 Queensland State Budget - Service Delivery Statements - The Council of the Queensland Institute of Medical Research
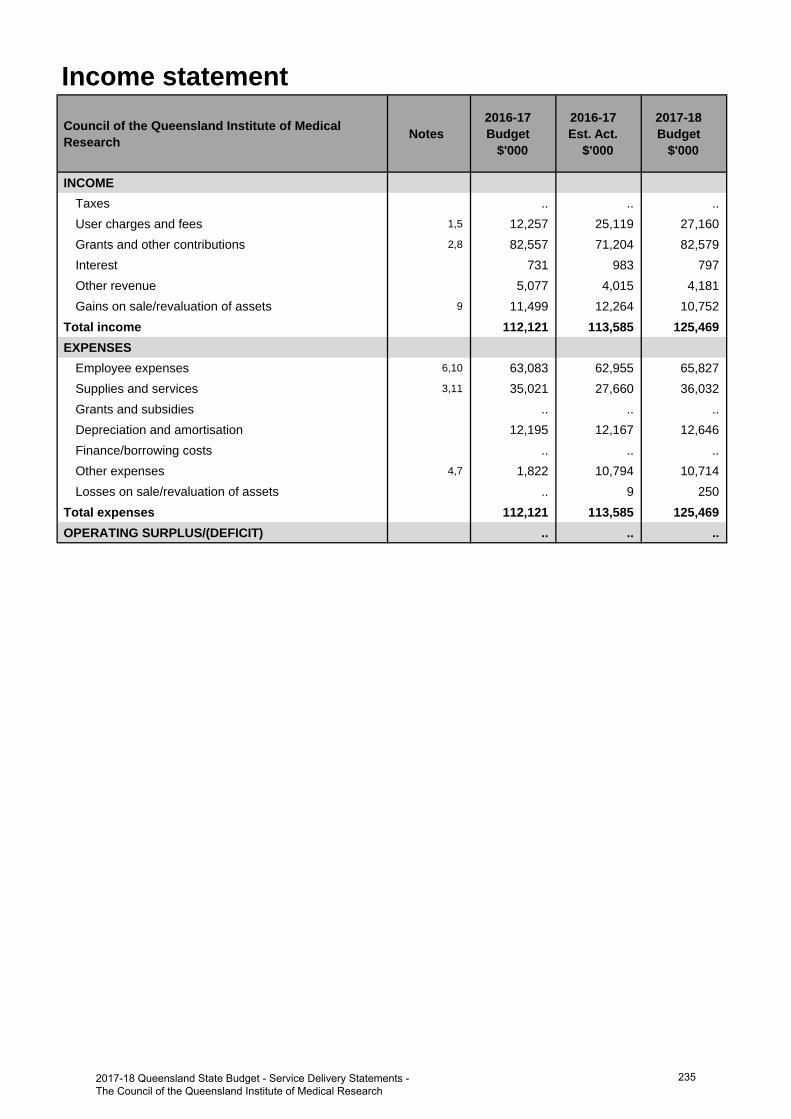
Income statementCouncil of the Queensland Institute of Medical Research Notes
2016-17 Budget
$'000
2016-17 Est. Act.
$'000
2017-18 Budget
$'000
INCOMETaxes .. .. .. User charges and fees 1,5 12,257 25,119 27,160 Grants and other contributions 2,8 82,557 71,204 82,579 Interest 731 983 797 Other revenue 5,077 4,015 4,181 Gains on sale/revaluation of assets 9 11,499 12,264 10,752
Total income 112,121 113,585 125,469 EXPENSES
Employee expenses 6,10 63,083 62,955 65,827 Supplies and services 3,11 35,021 27,660 36,032 Grants and subsidies .. .. .. Depreciation and amortisation 12,195 12,167 12,646 Finance/borrowing costs .. .. .. Other expenses 4,7 1,822 10,794 10,714 Losses on sale/revaluation of assets .. 9 250
Total expenses 112,121 113,585 125,469 OPERATING SURPLUS/(DEFICIT) .. .. ..
2352017-18 Queensland State Budget - Service Delivery Statements - The Council of the Queensland Institute of Medical Research
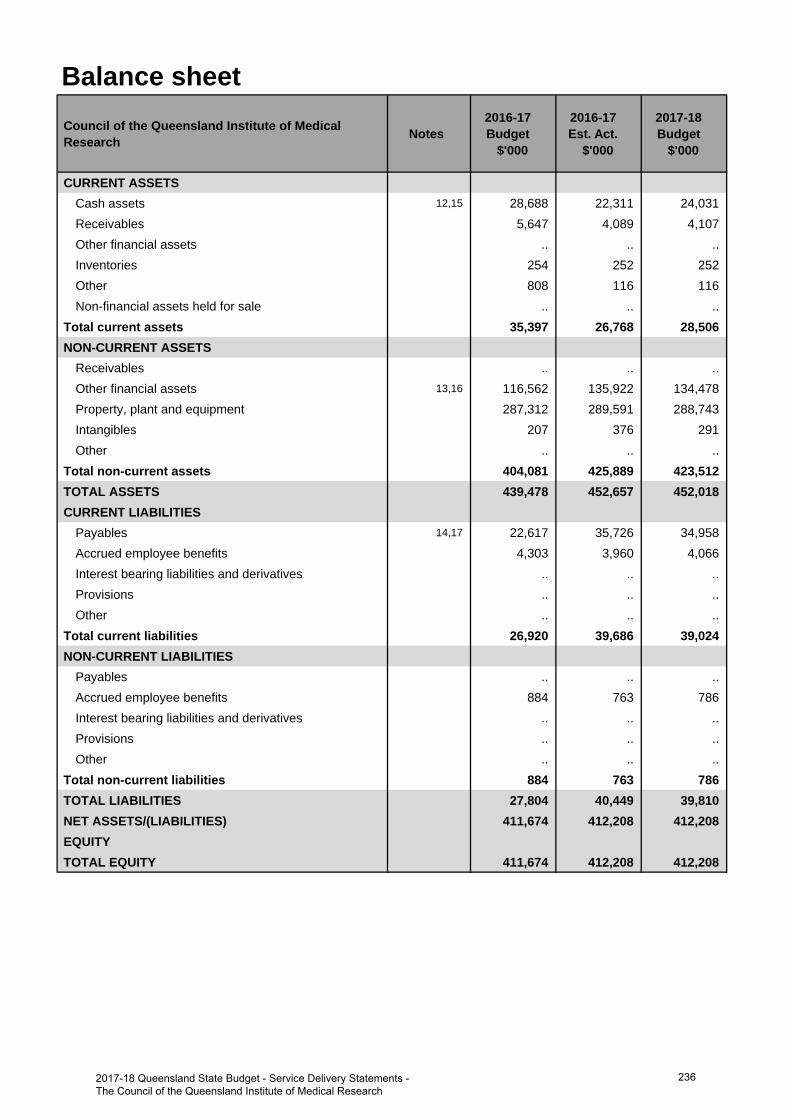
Balance sheetCouncil of the Queensland Institute of Medical Research Notes
2016-17 Budget
$'000
2016-17 Est. Act.
$'000
2017-18 Budget
$'000
CURRENT ASSETSCash assets 12,15 28,688 22,311 24,031 Receivables 5,647 4,089 4,107 Other financial assets .. .. .. Inventories 254 252 252 Other 808 116 116 Non-financial assets held for sale .. .. ..
Total current assets 35,397 26,768 28,506 NON-CURRENT ASSETS
Receivables .. .. .. Other financial assets 13,16 116,562 135,922 134,478 Property, plant and equipment 287,312 289,591 288,743 Intangibles 207 376 291 Other .. .. ..
Total non-current assets 404,081 425,889 423,512 TOTAL ASSETS 439,478 452,657 452,018 CURRENT LIABILITIES
Payables 14,17 22,617 35,726 34,958 Accrued employee benefits 4,303 3,960 4,066 Interest bearing liabilities and derivatives .. .. .. Provisions .. .. .. Other .. .. ..
Total current liabilities 26,920 39,686 39,024 NON-CURRENT LIABILITIES
Payables .. .. .. Accrued employee benefits 884 763 786 Interest bearing liabilities and derivatives .. .. .. Provisions .. .. .. Other .. .. ..
Total non-current liabilities 884 763 786 TOTAL LIABILITIES 27,804 40,449 39,810 NET ASSETS/(LIABILITIES) 411,674 412,208 412,208 EQUITYTOTAL EQUITY 411,674 412,208 412,208
2362017-18 Queensland State Budget - Service Delivery Statements - The Council of the Queensland Institute of Medical Research
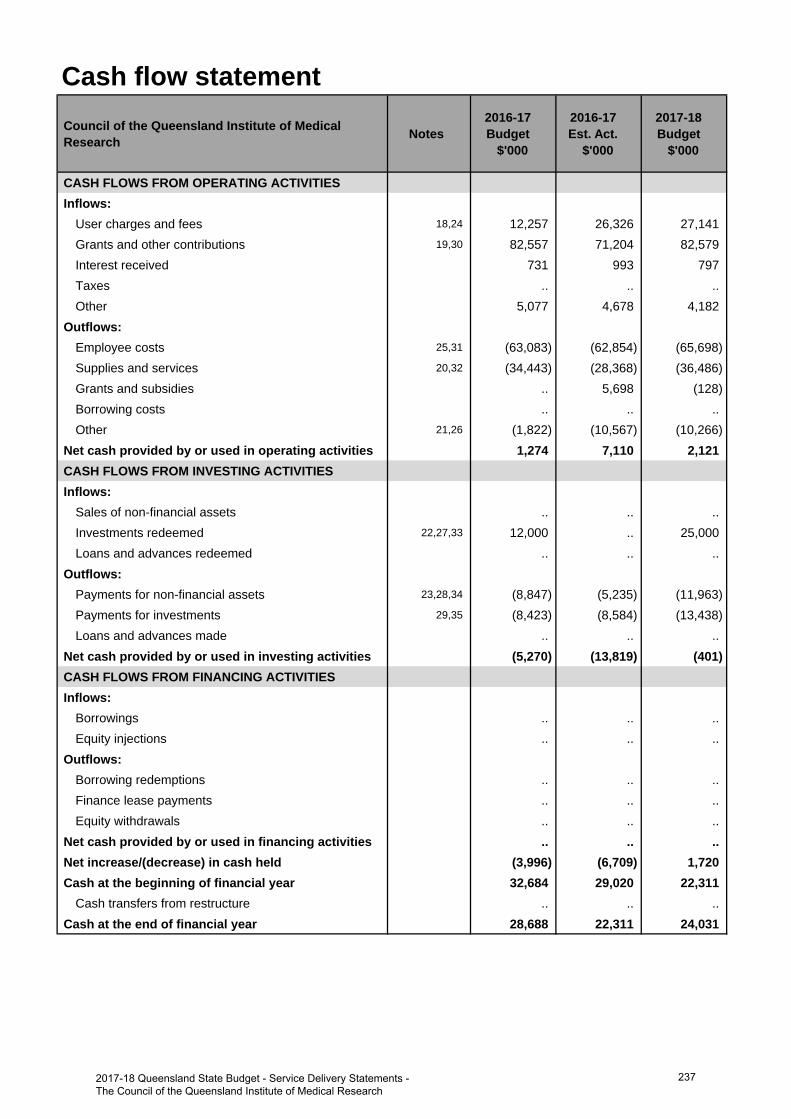
Cash flow statementCouncil of the Queensland Institute of Medical Research Notes
2016-17 Budget
$'000
2016-17 Est. Act.
$'000
2017-18 Budget
$'000
CASH FLOWS FROM OPERATING ACTIVITIESInflows:
User charges and fees 18,24 12,257 26,326 27,141 Grants and other contributions 19,30 82,557 71,204 82,579 Interest received 731 993 797 Taxes .. .. .. Other 5,077 4,678 4,182
Outflows:Employee costs 25,31 (63,083) (62,854) (65,698)Supplies and services 20,32 (34,443) (28,368) (36,486)Grants and subsidies .. 5,698 (128)Borrowing costs .. .. .. Other 21,26 (1,822) (10,567) (10,266)
Net cash provided by or used in operating activities 1,274 7,110 2,121 CASH FLOWS FROM INVESTING ACTIVITIESInflows:
Sales of non-financial assets .. .. .. Investments redeemed 22,27,33 12,000 .. 25,000 Loans and advances redeemed .. .. ..
Outflows:Payments for non-financial assets 23,28,34 (8,847) (5,235) (11,963)Payments for investments 29,35 (8,423) (8,584) (13,438)Loans and advances made .. .. ..
Net cash provided by or used in investing activities (5,270) (13,819) (401)CASH FLOWS FROM FINANCING ACTIVITIESInflows:
Borrowings .. .. .. Equity injections .. .. ..
Outflows:Borrowing redemptions .. .. .. Finance lease payments .. .. .. Equity withdrawals .. .. ..
Net cash provided by or used in financing activities .. .. .. Net increase/(decrease) in cash held (3,996) (6,709) 1,720 Cash at the beginning of financial year 32,684 29,020 22,311
Cash transfers from restructure .. .. .. Cash at the end of financial year 28,688 22,311 24,031
2372017-18 Queensland State Budget - Service Delivery Statements - The Council of the Queensland Institute of Medical Research
Income statementMajor variations between 2016-17 Budget and 2016-17 Estimated Actual include:
1. Increased contract research and commercialisation income in 2016-17 Estimated Actual compared to 2016-17Budget, due to the ongoing success of projects and initiatives in these areas.
2. The 2016-17 Estimated Actual forecasts a reduction in grant and fundraising income compared to the 2016-17Budget, reflecting the highly competitive environment for both National Health and Medical Research Council(NHMRC) funding and community donations.
3. Lower spending on supplies in the 2016-2017 Estimated Actual in line with the reduction in research grant incomecompared to 2016-17 Budget.
4. 2016-17 Estimated Actual reflects the increased level of expenses associated with increased commercialisationand contract research activity.
Major variations between 2016-17 Budget and 2017-18 Budget include:
5. The 2017-18 Budget reflects an increase in contract research compared to the 2016-17 Budget with a continuedfocus on securing value from commercial contracts.
6. The 2017-18 Budget reflects salary increases of 2.5 per cent forecast for the new Enterprise Agreement and higher expected salary support for researchers due to reduced availability of NHMRC fellowships.
7. 2017-18 Budget reflects the increased level of expenses associated with increased commercialisation andcontract research activity.
Major variations between 2016-17 Estimated Actual and the 2017-18 Budget include:
8. The 2017-18 fundraising targets, including bequest income and major gifts, are budgeted to increase from the2016-17 Estimated Actual with additional initiatives and campaigns planned. In addition, an increase in capitalgrants for scientific equipment is budgeted for 2017-18.
9. Investment returns for 2017-18 are budgeted to reduce returning to long term trend levels compared to theforecast higher return investment return in 2016-17 Estimated Actual.
10. The 2017-18 Budget reflects salary increases in line with the current Enterprise Agreement as well as higherexpected salary support for researchers due to reduced availability of NHMRC fellowships.
11. Increased supplies and services in the 2017-18 Budget arise predominantly due to additional budgeted incomeinvested in research activities.
Balance sheetMajor variations between 2016-17 Budget and 2016-17 Estimated Actual include:
12. The decrease in the 2016-17 Estimated Actual cash balance is due to management of cash balances to optimiseOther Financial Assets. Higher than budgeted operating cashflow has generated the ability to maintain longer-term financial assets.
13. The expected higher market value of QIMR Berghofer's long term investments reflects an expected positivemarket performance in the 2016-17 Estimated Actuals combined with lower than budgeted redemptions.
14. The higher 2016-17 Estimated Actual Payables balance is driven by an increase in the balance of unexpendedgrant, contract research and associated collaboration payments payable as at the end of year compared to the2016-17 Budget.
Major variations between 2016-17 Budget and 2017-18 Budget include:
15. The decrease in the 2017-18 Budget cash balance reflects a lower balance of operating funds to be held in on-callaccounts at the end of the year being broadly in line with that forecast for 2016-17.
16. The expected higher market value of QIMR Berghofer's long term investments in the 2017-18 Budget reflects thehigher opening balance than previous Budget and increased income, offset in part by redemptions to fundresearch in the 2017-18 Budget year.
Explanation of variances in the financial statements
2382017-18 Queensland State Budget - Service Delivery Statements - The Council of the Queensland Institute of Medical Research
17. The higher 2017-18 Budget Payables balance is driven by an increase in the balance of unexpended grant and contract research revenue at the end of year. The 2017-18 Budget balance of payables is line with the level forecast for 2016-17.
Cash flow statementMajor variations between 2016-17 Budget and 2016-17 Estimated Actual include:
18. Increased contract research and commercialisation income in 2016-17 Estimated Actual compared to 2016-17 Budget, due to the ongoing success of projects and initiatives.
19. The 2016-17 Estimated Actual forecasts a reduction in grant and fundraising income compared to the 2016-17 Budget, reflecting the competitive environment for both NHMRC funding and community donations.
20. Lower spending on supplies in the 2016-2017 Estimated Actual are in line with the reduction in research grant income compared to 2016-17 Budget.
21. 2016-17 Estimated Actual reflects the increased level of expenses associated with increased commercialisation and contract research activity.
22. The 2016-17 Estimated Actual requires no redemptions from long term investments to fund QIMR Berghofer's research and capital expenditure requirements due to higher net operating cashflows and availability of short term cash investments.
23. Capital expenditure requirements in 2016-17 Estimated Actuals are $3.3m lower than 2016-17 Budget due to postponement of building works and lower capital grant funding.
Major variations between 2016-17 Budget and 2017-18 Budget include:
24. The 2017-18 Budget reflects an increase in contract research compared to the 2016-17 Budget with a continued focus on securing value from commercial contracts.
25. The 2017-18 Budget reflects salary increases in line with the current Enterprise Agreement and higher expected salary support for researchers due to reduced availability of NHMRC fellowships.
26. 2017-18 Budget reflects the increased level of expenses associated with increased commercialisation and contract research activity.
27. Increased redemptions from long term investments are expected to be required to fund the Institute's research and capital expenditure requirements for Budget 2017-18 due to the competitive environment for NHMRC grants and fellowships.
28. 2017-18 Budget includes additional capital expenditure, including Building Renewal expenditure and additional investment in state of the art equipment for research.
29. Payments for Investments will increase in 2017-18 Budget in line with the expected increase in income.
Major variations between 2016-17 Estimated Actual and the 2017-18 Budget include:
30. The 2017-18 fundraising targets, including bequest income and major gifts, are budgeted to increase from the 2016-17 Estimated Actual with additional initiatives and campaigns planned. In addition, an increase in capital grants for scientific equipment is budgeted for 2017-18.
31. The 2017-18 Budget reflects salary increases in line with the current Enterprise Agreement as well as higher expected recruitment costs and salary support for researchers due to reduced availability of NHMRC fellowships.
32. Increased supplies and services in the 2017-18 Budget arise predominantly due to additional grant funds to be expended on research activities.
33. Increased redemptions from long term investments are expected to be required to fund the Institute's research and capital expenditure requirements for Budget 2017-18.
34. 2017-18 Budget includes additional capital expenditure including ongoing Building Renewal expenditure and additional investment in state of the art equipment for research.
35. Payments for Investments will increase in 2017-18 Budget in line with the expected increase in income.
2392017-18 Queensland State Budget - Service Delivery Statements - The Council of the Queensland Institute of Medical Research
Queensland Mental Health Commission
Overview The Queensland Mental Health Commission (the Commission) was established on 1 July 2013 as an independent statutory body under the Queensland Mental Health Commission Act 2013.
The Commission’s vision is: Queenslanders working together to improve mental health and wellbeing.
The Commission's purpose is to drive ongoing reform towards a more integrated, evidence-based, recovery-oriented mental health, alcohol and other drugs service system in Queensland, with a broad objective to improve the mental health and wellbeing of Queenslanders by:
• reaching consensus on and making progress towards achieving system wide reforms• maximising the collective impact of lived experience and professional expertise.
The focus for the Commission's work is encouraging and fostering activities that increase the mental health and wellbeing of all Queenslander with a particular focus on the lives of people with lived experience of mental illness and problematic alcohol and other drug use and people affected by suicide.
This work contributes to the Queensland Government's objectives for the community, delivering quality front line services, creating jobs and a diverse economy and building safe, caring and connected communities with a focus on mental health issues and drug and alcohol problems.
Service summary The Commission has an operating budget of $9.0 million in 2017-18 reflecting minimal variation with the published 2016-17 operating budget of $8.8 million.
During 2016-17, the Commission:
• reported on the implementation of the Queensland Mental Health, Drug and Alcohol Strategic Plan 2014-2019 andassociated whole-of-government action plans including 193 specific actions implemented by 22 State Governmentagencies
• commenced a review of the Queensland Mental Health, Drug and Alcohol Strategic Plan 2014-2019• released the Queensland Aboriginal Torres Strait Islander Social and Emotional Wellbeing Action Plan 2016-18 and
the Queensland Rural and Remote Action Plan 2016-18• provided $0.9 million for 24 initiatives in the Stronger Community Mental Health and Wellbeing Grants program to
enable locally-led implementation of the Queensland Mental Health, Drug and Alcohol Strategic Plan 2014-2019• supported research to develop models for expanding the EdLinQ Program and MATES in Construction project• completed research into tailored suicide prevention initiatives for people from culturally and linguistically diverse
backgrounds• commenced a project in south west Queensland to design and implemented a place-based approach to suicide
prevention• increased community awareness of mental health issues including through increased participation in Mental Health
Week and World Suicide Prevention Day activities• commenced research into ways to reduce stigma experienced by people living with mental illness and problematic
alcohol and drug use including stigma which impacts on the ability to gain and retain employment• continued to input into the implementation of the Mental Health Act 2016 with a focus on ensuring the principles in
the Act are reflected in practice• responded to the Public Service Commission independent review of the performance of the Commission and
contributed to the Queensland Mental Health Commission Act 2013
• implemented efficiencies to business administration systems to ensure resources are focused on outcomes.
2402017-18 Queensland State Budget - Service Delivery Statements - Queensland Mental Health Commission
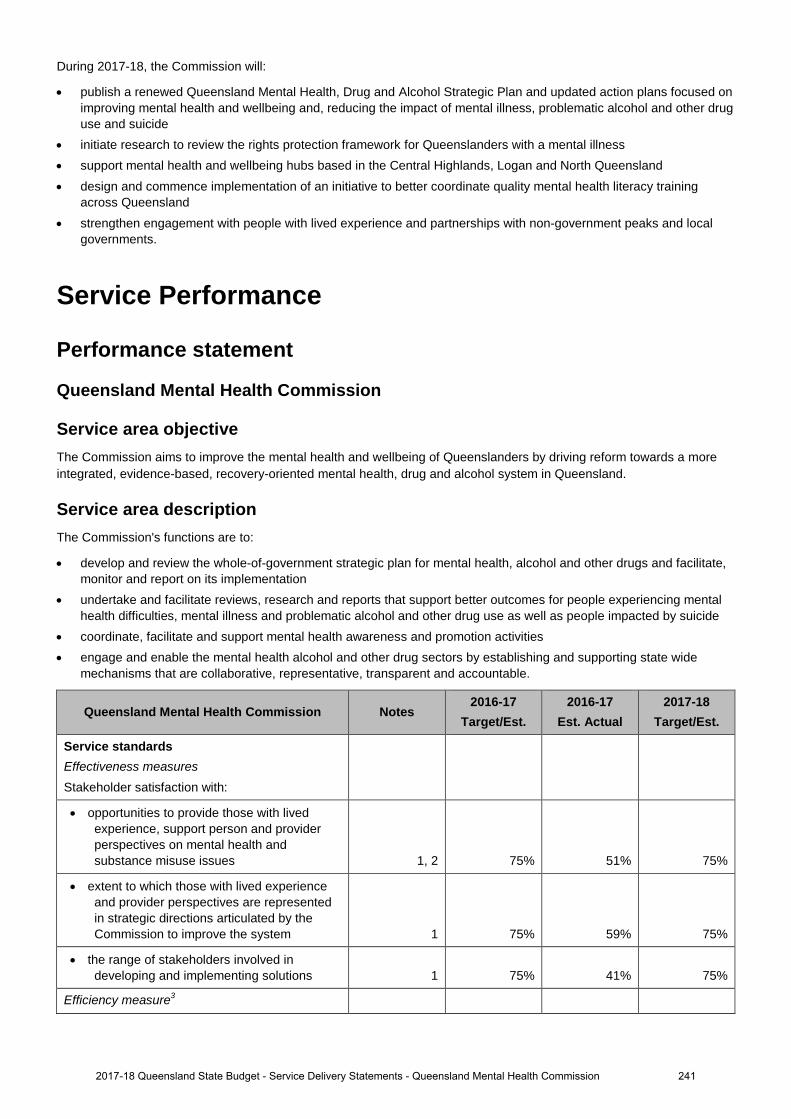
During 2017-18, the Commission will:
• publish a renewed Queensland Mental Health, Drug and Alcohol Strategic Plan and updated action plans focused onimproving mental health and wellbeing and, reducing the impact of mental illness, problematic alcohol and other druguse and suicide
• initiate research to review the rights protection framework for Queenslanders with a mental illness• support mental health and wellbeing hubs based in the Central Highlands, Logan and North Queensland• design and commence implementation of an initiative to better coordinate quality mental health literacy training
across Queensland• strengthen engagement with people with lived experience and partnerships with non-government peaks and local
governments.
Service Performance
Performance statement
Queensland Mental Health Commission
Service area objective The Commission aims to improve the mental health and wellbeing of Queenslanders by driving reform towards a more integrated, evidence-based, recovery-oriented mental health, drug and alcohol system in Queensland.
Service area description The Commission's functions are to:
• develop and review the whole-of-government strategic plan for mental health, alcohol and other drugs and facilitate,monitor and report on its implementation
• undertake and facilitate reviews, research and reports that support better outcomes for people experiencing mentalhealth difficulties, mental illness and problematic alcohol and other drug use as well as people impacted by suicide
• coordinate, facilitate and support mental health awareness and promotion activities• engage and enable the mental health alcohol and other drug sectors by establishing and supporting state wide
mechanisms that are collaborative, representative, transparent and accountable.
Queensland Mental Health Commission Notes 2016-17
Target/Est. 2016-17
Est. Actual 2017-18
Target/Est.
Service standards Effectiveness measures Stakeholder satisfaction with:
• opportunities to provide those with livedexperience, support person and provider perspectives on mental health and substance misuse issues 1, 2 75% 51% 75%
• extent to which those with lived experienceand provider perspectives are represented in strategic directions articulated by the Commission to improve the system 1 75% 59% 75%
• the range of stakeholders involved indeveloping and implementing solutions 1 75% 41% 75%
Efficiency measure3
2412017-18 Queensland State Budget - Service Delivery Statements - Queensland Mental Health Commission
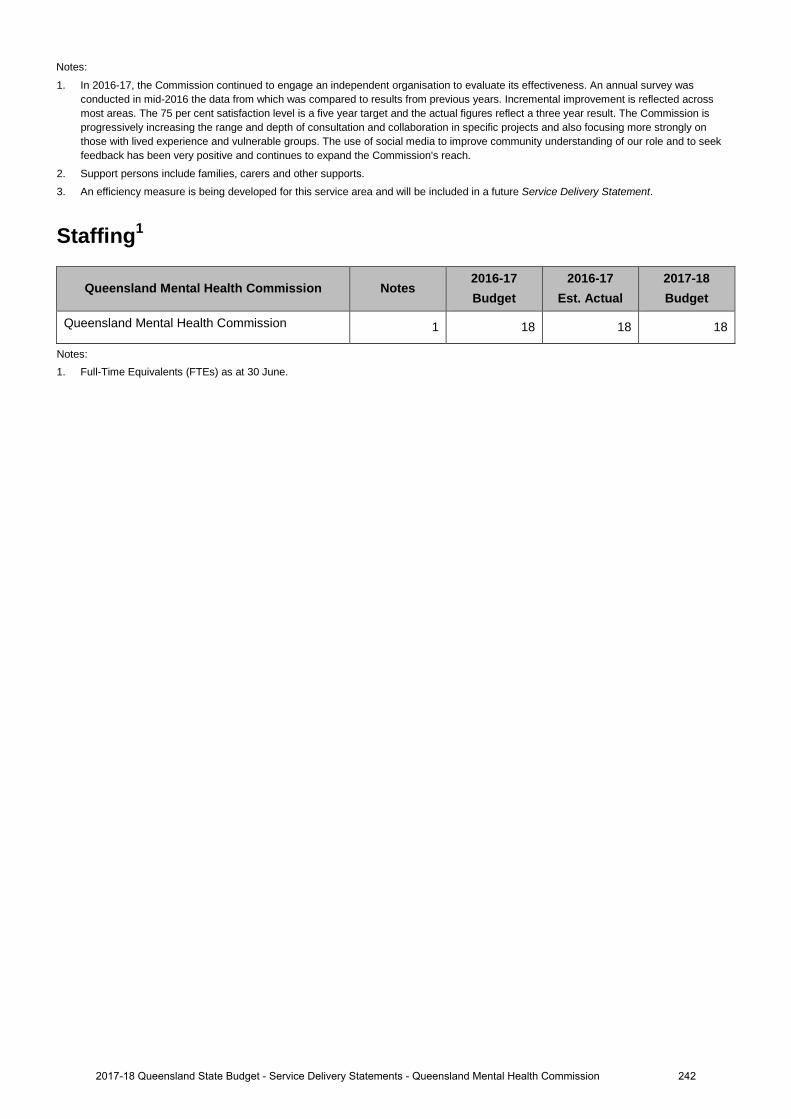
1. In 2016-17, the Commission continued to engage an independent organisation to evaluate its effectiveness. An annual survey wasconducted in mid-2016 the data from which was compared to results from previous years. Incremental improvement is reflected acrossmost areas. The 75 per cent satisfaction level is a five year target and the actual figures reflect a three year result. The Commission isprogressively increasing the range and depth of consultation and collaboration in specific projects and also focusing more strongly onthose with lived experience and vulnerable groups. The use of social media to improve community understanding of our role and to seekfeedback has been very positive and continues to expand the Commission's reach.
2. Support persons include families, carers and other supports.
3. An efficiency measure is being developed for this service area and will be included in a future Service Delivery Statement.
Staffing1
Queensland Mental Health Commission Notes 2016-17 Budget
2016-17 Est. Actual
2017-18 Budget
Queensland Mental Health Commission 1 18 18 18
Notes: 1. Full-Time Equivalents (FTEs) as at 30 June.
2422017-18 Queensland State Budget - Service Delivery Statements - Queensland Mental Health Commission
Notes:
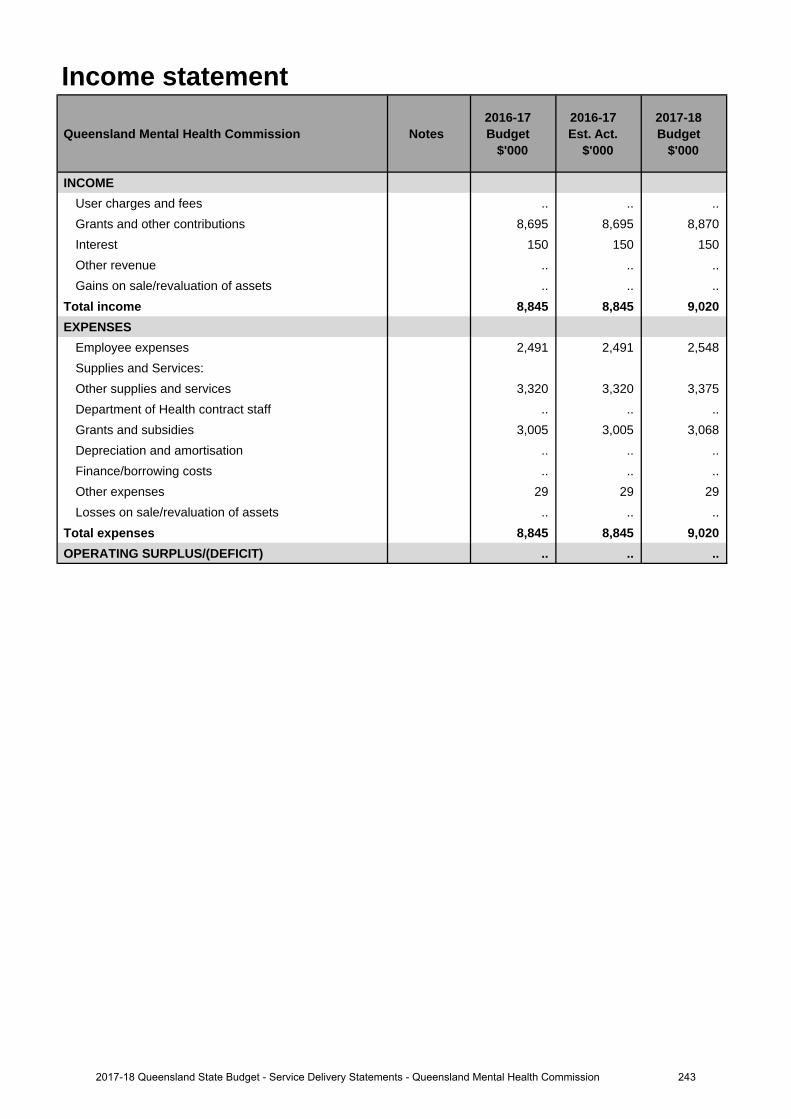
Income statement
Queensland Mental Health Commission Notes 2016-17 Budget
$'000
2016-17 Est. Act.
$'000
2017-18 Budget
$'000
INCOMEUser charges and fees .. .. .. Grants and other contributions 8,695 8,695 8,870 Interest 150 150 150Other revenue .. .. ..Gains on sale/revaluation of assets .. .. ..
Total income 8,845 8,845 9,020EXPENSES
Employee expenses 2,491 2,491 2,548Supplies and Services:Other supplies and services 3,320 3,320 3,375 Department of Health contract staff .. .. .. Grants and subsidies 3,005 3,005 3,068 Depreciation and amortisation .. .. .. Finance/borrowing costs .. .. ..Other expenses 29 29 29Losses on sale/revaluation of assets .. .. ..
Total expenses 8,845 8,845 9,020OPERATING SURPLUS/(DEFICIT) .. .. ..
2432017-18 Queensland State Budget - Service Delivery Statements - Queensland Mental Health Commission
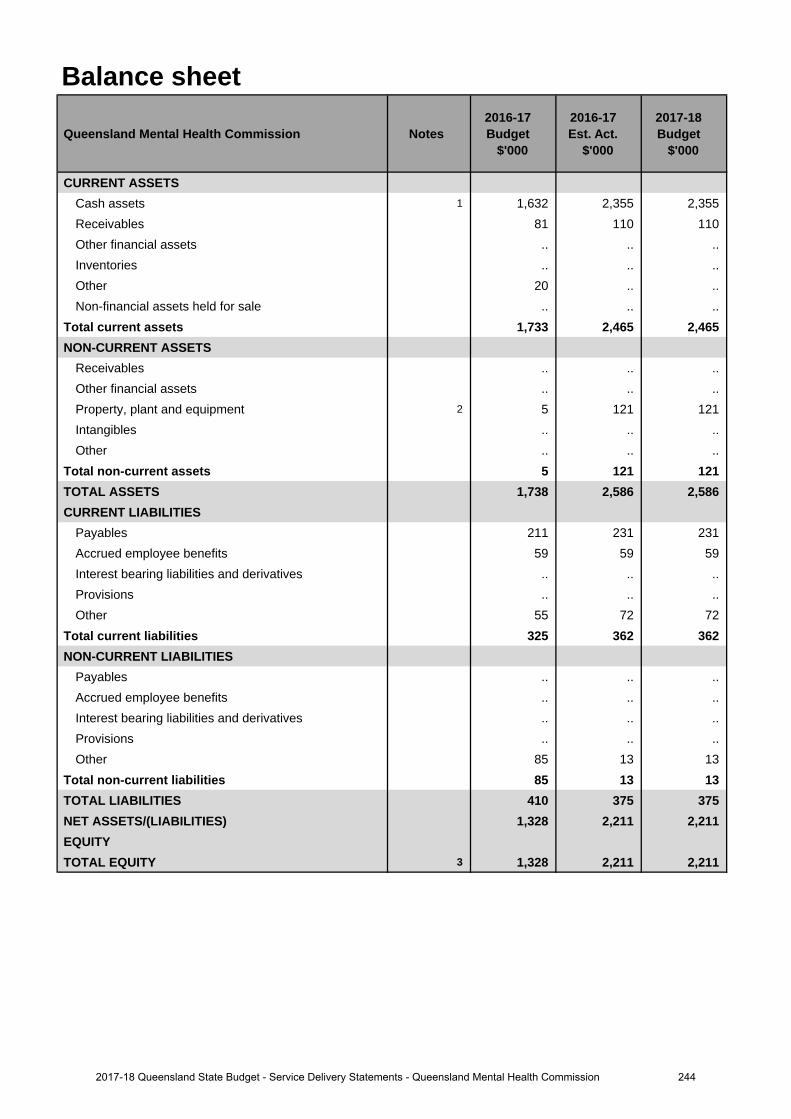
Balance sheet
Queensland Mental Health Commission Notes 2016-17 Budget
$'000
2016-17 Est. Act.
$'000
2017-18 Budget
$'000
CURRENT ASSETSCash assets 1 1,632 2,355 2,355Receivables 81 110 110Other financial assets .. .. .. Inventories .. .. ..Other 20 .. ..Non-financial assets held for sale .. .. ..
Total current assets 1,733 2,465 2,465 NON-CURRENT ASSETS
Receivables .. .. ..Other financial assets .. .. .. Property, plant and equipment 2 5 121 121Intangibles .. .. ..Other .. .. ..
Total non-current assets 5 121 121 TOTAL ASSETS 1,738 2,586 2,586CURRENT LIABILITIES
Payables 211 231 231Accrued employee benefits 59 59 59 Interest bearing liabilities and derivatives .. .. .. Provisions .. .. ..Other 55 72 72
Total current liabilities 325 362 362 NON-CURRENT LIABILITIES
Payables .. .. ..Accrued employee benefits .. .. .. Interest bearing liabilities and derivatives .. .. .. Provisions .. .. ..Other 85 13 13
Total non-current liabilities 85 13 13 TOTAL LIABILITIES 410 375 375NET ASSETS/(LIABILITIES) 1,328 2,211 2,211EQUITYTOTAL EQUITY 3 1,328 2,211 2,211
2442017-18 Queensland State Budget - Service Delivery Statements - Queensland Mental Health Commission

Cash flow statement
Queensland Mental Health Commission Notes 2016-17 Budget
$'000
2016-17 Est. Act.
$'000
2017-18 Budget
$'000
CASH FLOWS FROM OPERATING ACTIVITIESInflows:
User charges and fees .. .. .. Grants and other contributions 8,695 8,695 8,870 Interest received 150 150 150Other .. .. ..
Outflows:Employee costs (2,491) (2,491) (2,548)Supplies and services (3,320) (3,320) (3,375)Grants and subsidies (3,005) (3,005) (3,068)Borrowing costs .. .. ..Other (29) (29) (29)
Net cash provided by or used in operating activities .. .. .. CASH FLOWS FROM INVESTING ACTIVITIESInflows:
Sales of non-financial assets .. .. .. Investments redeemed .. .. ..Loans and advances redeemed .. .. ..
Outflows:Payments for non-financial assets .. .. .. Payments for investments .. .. .. Loans and advances made .. .. ..
Net cash provided by or used in investing activities .. .. .. CASH FLOWS FROM FINANCING ACTIVITIESInflows:
Borrowings .. .. ..Equity injections .. .. ..
Outflows:Borrowing redemptions .. .. ..Finance lease payments .. .. .. Equity withdrawals .. .. ..
Net cash provided by or used in financing activities .. .. .. Net increase/(decrease) in cash held .. .. .. Cash at the beginning of financial year 4 1,632 2,355 2,355
Cash transfers from restructure .. .. .. Cash at the end of financial year 5 1,632 2,355 2,355
2452017-18 Queensland State Budget - Service Delivery Statements - Queensland Mental Health Commission
Balance sheetMajor variations between 2016-17 Budget and 2016-17 Estimated Actual include:
1. Increase reflects planned consultancy work and associated costs not delivered in the current year.
2. Increase reflects depreciation costs against accommodation fitout assets transferred from the previous tenant.
3. The increase reflects $230,000 of accommodation fitout assets transferred from the previous tenant and a$653K increase in cash at bank resulting from planned consultancy work and associated costs not delivered inthe current year.
Cash flow statementMajor variations between 2016-17 Budget and 2016-17 Estimated Actual include:
4. Increase reflects planned consultancy work and associated costs not delivered in the previous year.
5. Increase reflects planned consultancy work and associated costs not delivered in the current year.
Explanation of variances in the financial statements
2462017-18 Queensland State Budget - Service Delivery Statements - Queensland Mental Health Commission
Office of the Health Ombudsman
Overview The Health Ombudsman, supported by the Office of the Health Ombudsman (OHO), commenced dealing with health complaints on 1 July 2014. The primary functions of the Health Ombudsman are to:
• receive and investigate complaints about health services and health service providers, including registered andunregistered health practitioners
• decide what action should be taken in relation to those complaints and, in certain instances, take immediate action toprotect the safety of the public
• monitor the health, conduct and performance functions of the Australian Health Practitioner Regulation Agency(AHPRA) and national health practitioner boards
• provide information about minimising and resolving health service complaints• report publicly on the performance of its functions.
The OHO directly supports the Queensland Government’s objective of delivering quality frontline services including strengthening the public health system by assessing, investigating, resolving or prosecuting complaints about registered practitioners, unregistered healthcare workers and health service providers, and identifying systemic healthcare issues and making recommendations on improvements.
The key objectives of the OHO are:
• protecting the health and safety of the public• promoting professional, safe and competent practice and high standards of service delivery from health practitioners
and health service organisations• delivering robust and accountable business operations and fostering a culture of transparency, accountability and
continual improvement• maintaining public confidence in the management of complaints and other matters relating to the provision of health
services.
Key factors impacting on the OHO include:
• continued increases in contacts, which impact the ability to meet legislated timeframes• increases in the number of matters resulting in immediate action• increases in the number of matters referred to the Director of Proceedings• increases in the number of matters heard before the Queensland Civil and Administrative Tribunal• delays in or prohibitions against receiving information from other government bodies due to legislative barriers• reinvestigation of some transferred matters to ensure sufficiency of evidence and adequate consideration of public
interest factors.
During 2016-17 the Health, Communities, Disability Services and Domestic and Family Violence Prevention Committee conducted an inquiry into the performance of the Health Ombudsman’s functions pursuant to section 179 of the Health Ombudsman Act 2013. The Parliamentary Committee tabled its report and accompanying recommendations on 16 December 2016, with the Queensland Government’s subsequent response tabled on 16 March 2017.
2472017-18 Queensland State Budget - Service Delivery Statements - Office of the Health Ombudsman
Service summary The OHO has an operating budget of $14.6 million for 2017-18, which is the same as the published 2016-17 operating budget.
The OHO works with complainants, healthcare consumers and health service providers to resolve complaints as quickly as possible. The service is independent, impartial and free.
Key initiatives focused on by the OHO in 2016-17 include:
• development and review of operational workflows, practices and procedures to support staff in providing efficient andeffective service delivery
• identification and management of immediate actions• oversight and reporting on AHPRA and the Boards• progressing Phase 3 of the case management system database• scoping of a legal case management system to support litigation practises• proposing legislative amendments to improve the effective operation of the OHO and the coregulatory system in
Queensland• preliminary work to produce nationally-consistent health service complaint data with AHPRA, as recommended by
the Parliamentary Committee.
During 2017-18 the OHO will:
• continue identification and management of immediate actions and its oversight and reporting on AHPRA and theBoards
• complete Phase 3 of the case management system database• continue development of the legal case management system to support litigation practises• implement any legislative principles resulting from amendments to the Health Ombudsman Act 2013 and the Health
Practitioner Regulation National Law (Queensland) 2009• support the Government in its work to consider and progress of recommendations from the Parliamentary
Committee’s inquiry report.
Service Performance
Performance Statement
Office of the Health Ombudsman
Service Area Objective To provide a transparent, accountable and fair system for effectively and quickly dealing with complaints and other healthcare matters in Queensland.
Service Area Description • Receives and investigates complaints about health services and health service providers, including registered and
unregistered health practitioners• Decides what action to take in relation to those complaints and, in certain instances, takes immediate action to
protect the safety of the public• Monitors the health, conduct and performance functions of the Australian Health Practitioner Regulation Agency and
national health practitioner boards.
2482017-18 Queensland State Budget - Service Delivery Statements - Office of the Health Ombudsman
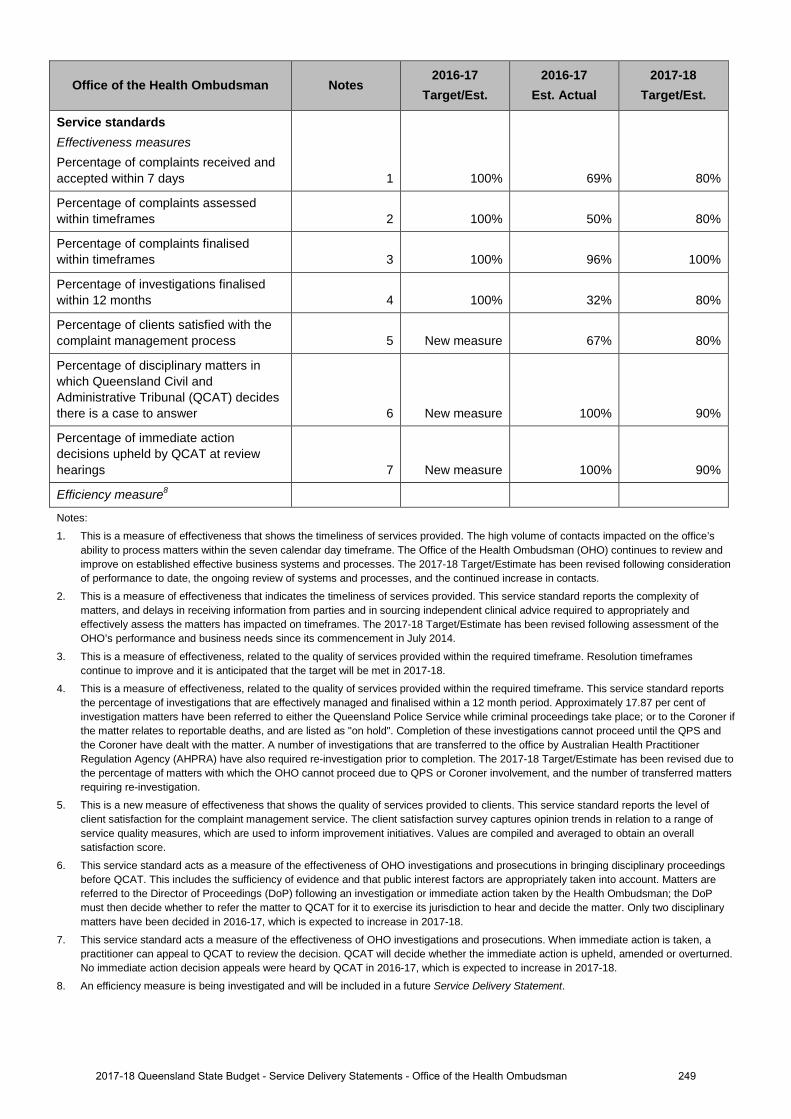
Office of the Health Ombudsman Notes 2016-17
Target/Est. 2016-17
Est. Actual 2017-18
Target/Est.
Service standards Effectiveness measures Percentage of complaints received and accepted within 7 days 1 100% 69% 80%
Percentage of complaints assessed within timeframes 2 100% 50% 80%
Percentage of complaints finalised within timeframes 3 100% 96% 100%
Percentage of investigations finalised within 12 months 4 100% 32% 80%
Percentage of clients satisfied with the complaint management process 5 New measure 67% 80%
Percentage of disciplinary matters in which Queensland Civil and Administrative Tribunal (QCAT) decides there is a case to answer 6 New measure 100% 90%
Percentage of immediate action decisions upheld by QCAT at review hearings 7 New measure 100% 90%
Efficiency measure8
Notes:
1. This is a measure of effectiveness that shows the timeliness of services provided. The high volume of contacts impacted on the office’sability to process matters within the seven calendar day timeframe. The Office of the Health Ombudsman (OHO) continues to review andimprove on established effective business systems and processes. The 2017-18 Target/Estimate has been revised following considerationof performance to date, the ongoing review of systems and processes, and the continued increase in contacts.
2. This is a measure of effectiveness that indicates the timeliness of services provided. This service standard reports the complexity ofmatters, and delays in receiving information from parties and in sourcing independent clinical advice required to appropriately andeffectively assess the matters has impacted on timeframes. The 2017-18 Target/Estimate has been revised following assessment of theOHO’s performance and business needs since its commencement in July 2014.
3. This is a measure of effectiveness, related to the quality of services provided within the required timeframe. Resolution timeframescontinue to improve and it is anticipated that the target will be met in 2017-18.
4. This is a measure of effectiveness, related to the quality of services provided within the required timeframe. This service standard reportsthe percentage of investigations that are effectively managed and finalised within a 12 month period. Approximately 17.87 per cent ofinvestigation matters have been referred to either the Queensland Police Service while criminal proceedings take place; or to the Coroner ifthe matter relates to reportable deaths, and are listed as "on hold". Completion of these investigations cannot proceed until the QPS andthe Coroner have dealt with the matter. A number of investigations that are transferred to the office by Australian Health PractitionerRegulation Agency (AHPRA) have also required re-investigation prior to completion. The 2017-18 Target/Estimate has been revised due tothe percentage of matters with which the OHO cannot proceed due to QPS or Coroner involvement, and the number of transferred mattersrequiring re-investigation.
5. This is a new measure of effectiveness that shows the quality of services provided to clients. This service standard reports the level ofclient satisfaction for the complaint management service. The client satisfaction survey captures opinion trends in relation to a range ofservice quality measures, which are used to inform improvement initiatives. Values are compiled and averaged to obtain an overallsatisfaction score.
6. This service standard acts as a measure of the effectiveness of OHO investigations and prosecutions in bringing disciplinary proceedingsbefore QCAT. This includes the sufficiency of evidence and that public interest factors are appropriately taken into account. Matters arereferred to the Director of Proceedings (DoP) following an investigation or immediate action taken by the Health Ombudsman; the DoPmust then decide whether to refer the matter to QCAT for it to exercise its jurisdiction to hear and decide the matter. Only two disciplinarymatters have been decided in 2016-17, which is expected to increase in 2017-18.
7. This service standard acts a measure of the effectiveness of OHO investigations and prosecutions. When immediate action is taken, apractitioner can appeal to QCAT to review the decision. QCAT will decide whether the immediate action is upheld, amended or overturned.No immediate action decision appeals were heard by QCAT in 2016-17, which is expected to increase in 2017-18.
8. An efficiency measure is being investigated and will be included in a future Service Delivery Statement.
2492017-18 Queensland State Budget - Service Delivery Statements - Office of the Health Ombudsman
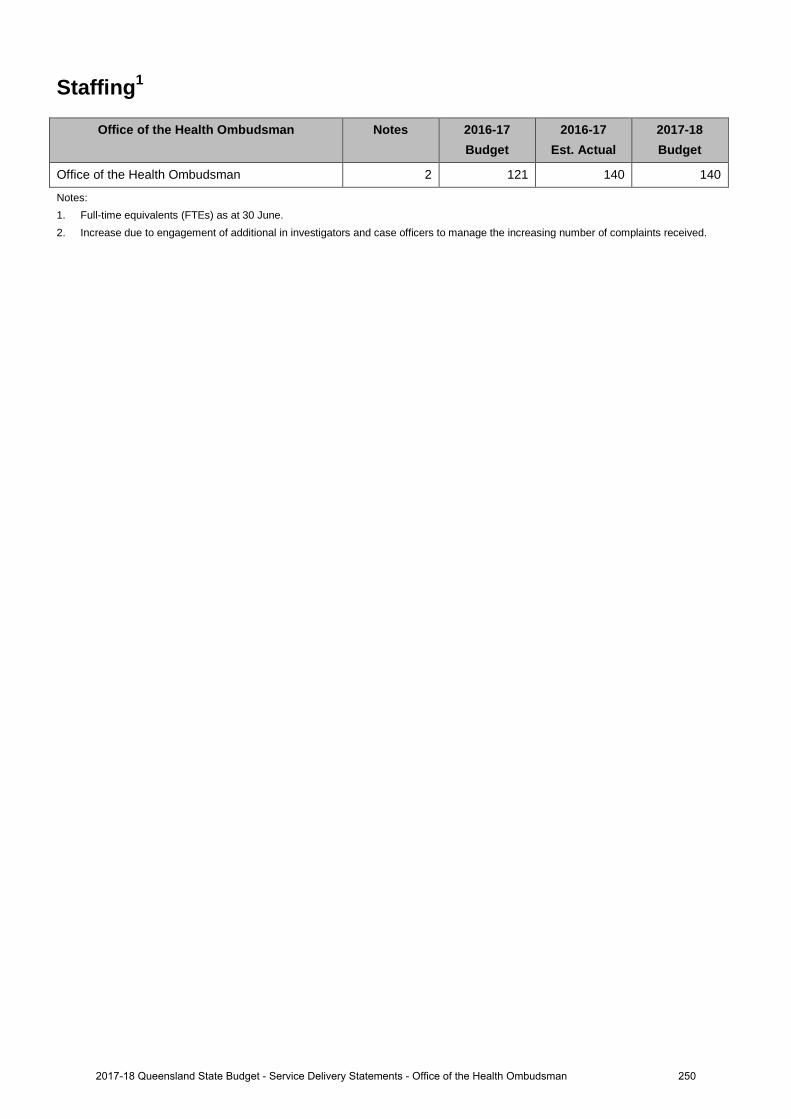
Staffing1
Office of the Health Ombudsman Notes 2016-17 Budget
2016-17 Est. Actual
2017-18 Budget
Office of the Health Ombudsman 2 121 140 140
Notes: 1. Full-time equivalents (FTEs) as at 30 June.2. Increase due to engagement of additional in investigators and case officers to manage the increasing number of complaints received.
2502017-18 Queensland State Budget - Service Delivery Statements - Office of the Health Ombudsman
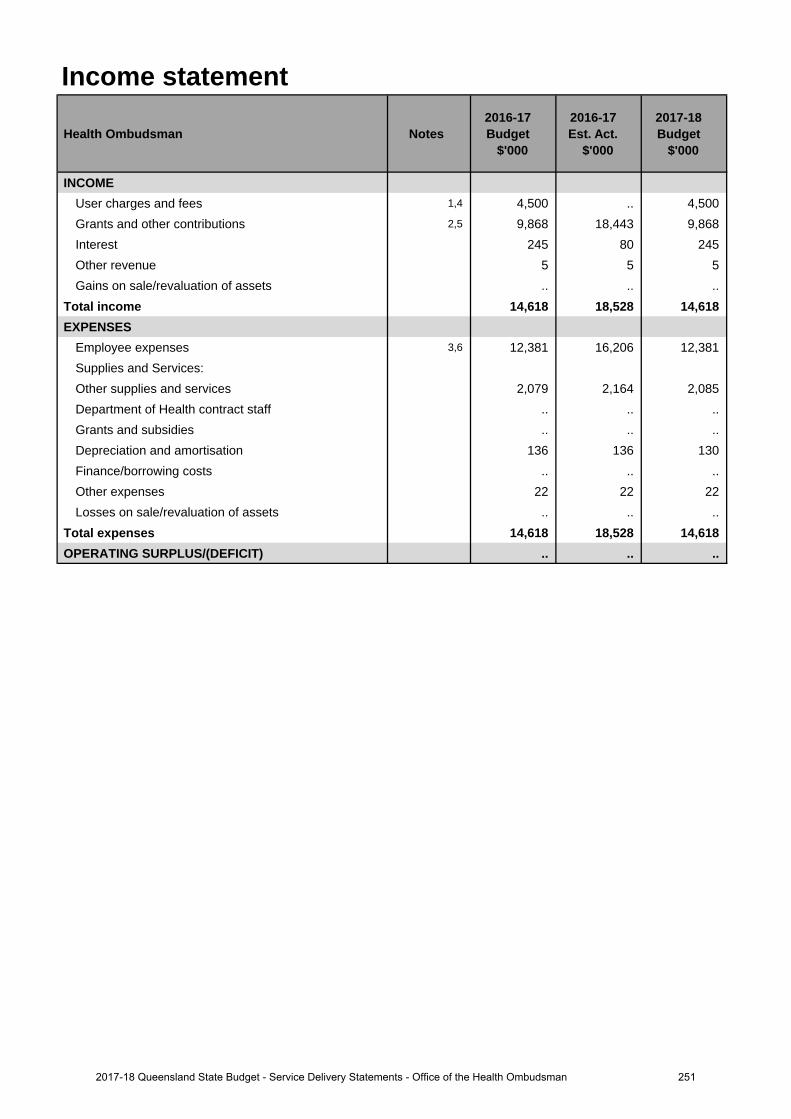
Income statement
Health Ombudsman Notes 2016-17 Budget
$'000
2016-17 Est. Act.
$'000
2017-18 Budget
$'000
INCOMEUser charges and fees 1,4 4,500 .. 4,500Grants and other contributions 2,5 9,868 18,443 9,868 Interest 245 80 245Other revenue 5 5 5Gains on sale/revaluation of assets .. .. ..
Total income 14,618 18,528 14,618 EXPENSES
Employee expenses 3,6 12,381 16,206 12,381 Supplies and Services:Other supplies and services 2,079 2,164 2,085 Department of Health contract staff .. .. .. Grants and subsidies .. .. .. Depreciation and amortisation 136 136 130 Finance/borrowing costs .. .. ..Other expenses 22 22 22Losses on sale/revaluation of assets .. .. ..
Total expenses 14,618 18,528 14,618 OPERATING SURPLUS/(DEFICIT) .. .. ..
2512017-18 Queensland State Budget - Service Delivery Statements - Office of the Health Ombudsman

Balance sheet
Health Ombudsman Notes 2016-17 Budget
$'000
2016-17 Est. Act.
$'000
2017-18 Budget
$'000
CURRENT ASSETSCash assets 7,9 3,877 1,585 1,635Receivables 235 283 283Other financial assets .. .. .. Inventories .. .. ..Other 106 109 109Non-financial assets held for sale .. .. ..
Total current assets 4,218 1,977 2,027 NON-CURRENT ASSETS
Receivables .. .. ..Other financial assets .. .. .. Property, plant and equipment 201 234 104 Intangibles .. .. ..Other 64 33 33
Total non-current assets 265 267 137 TOTAL ASSETS 4,483 2,244 2,164CURRENT LIABILITIES
Payables 180 147 147Accrued employee benefits 352 558 558 Interest bearing liabilities and derivatives .. .. .. Provisions .. .. ..Other .. .. ..
Total current liabilities 532 705 705 NON-CURRENT LIABILITIES
Payables .. .. ..Accrued employee benefits .. .. .. Interest bearing liabilities and derivatives .. .. .. Provisions .. .. ..Other 106 156 156
Total non-current liabilities 106 156 156 TOTAL LIABILITIES 638 861 861NET ASSETS/(LIABILITIES) 3,845 1,383 1,303EQUITYTOTAL EQUITY 8,10 3,845 1,383 1,303
2522017-18 Queensland State Budget - Service Delivery Statements - Office of the Health Ombudsman
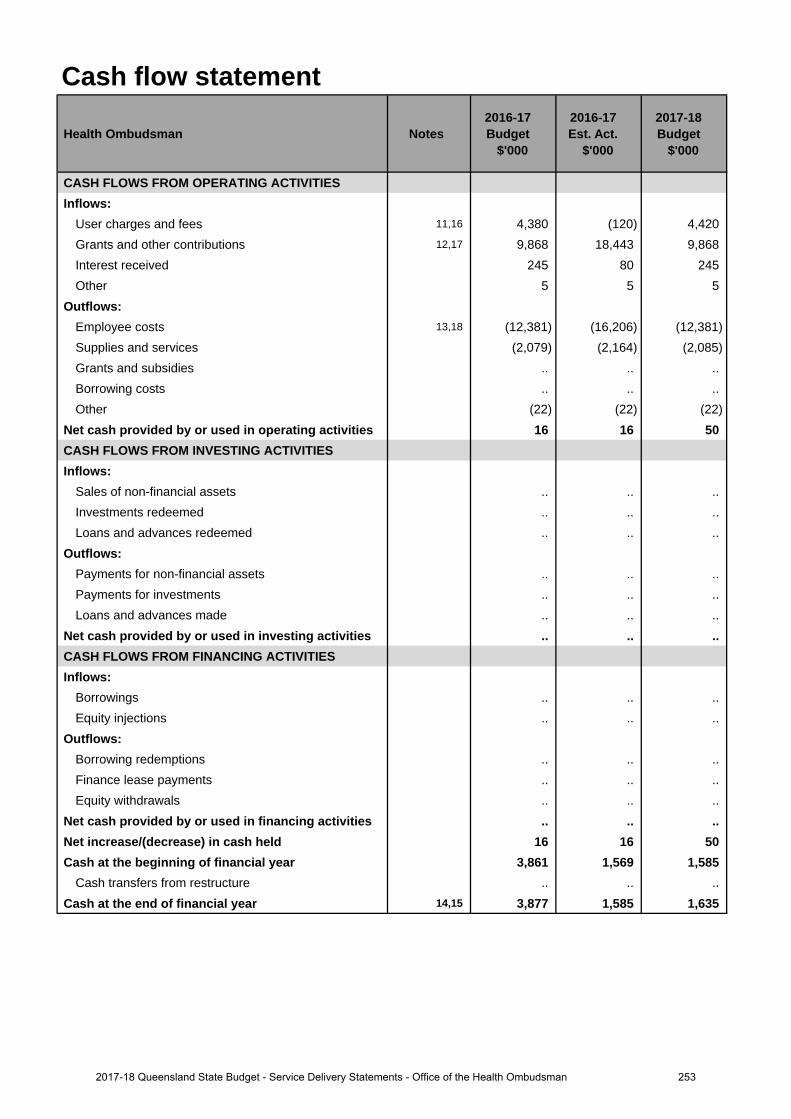
Cash flow statement
Health Ombudsman Notes 2016-17 Budget
$'000
2016-17 Est. Act.
$'000
2017-18 Budget
$'000
CASH FLOWS FROM OPERATING ACTIVITIESInflows:
User charges and fees 11,16 4,380 (120) 4,420Grants and other contributions 12,17 9,868 18,443 9,868 Interest received 245 80 245 Other 5 5 5
Outflows:Employee costs 13,18 (12,381) (16,206) (12,381)Supplies and services (2,079) (2,164) (2,085)Grants and subsidies .. .. .. Borrowing costs .. .. ..Other (22) (22) (22)
Net cash provided by or used in operating activities 16 16 50 CASH FLOWS FROM INVESTING ACTIVITIESInflows:
Sales of non-financial assets .. .. .. Investments redeemed .. .. ..Loans and advances redeemed .. .. ..
Outflows:Payments for non-financial assets .. .. .. Payments for investments .. .. .. Loans and advances made .. .. ..
Net cash provided by or used in investing activities .. .. .. CASH FLOWS FROM FINANCING ACTIVITIESInflows:
Borrowings .. .. ..Equity injections .. .. ..
Outflows:Borrowing redemptions .. .. ..Finance lease payments .. .. .. Equity withdrawals .. .. ..
Net cash provided by or used in financing activities .. .. .. Net increase/(decrease) in cash held 16 16 50 Cash at the beginning of financial year 3,861 1,569 1,585
Cash transfers from restructure .. .. .. Cash at the end of financial year 14,15 3,877 1,585 1,635
2532017-18 Queensland State Budget - Service Delivery Statements - Office of the Health Ombudsman
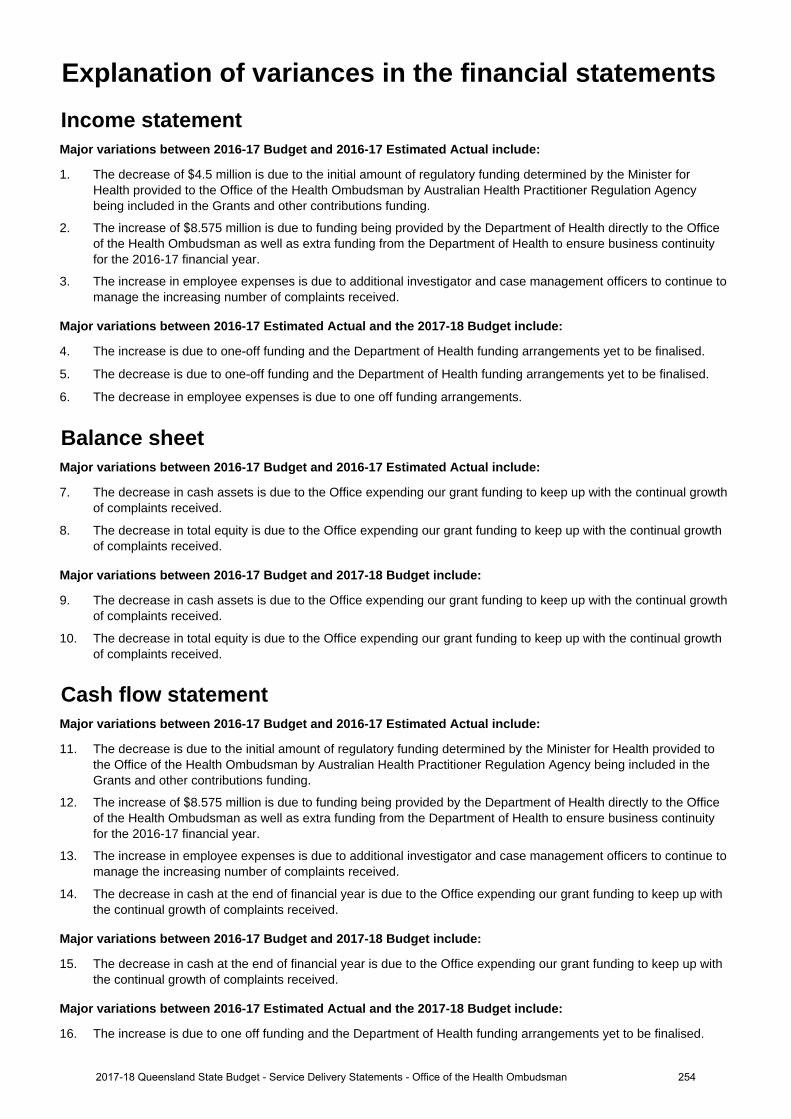
Income statementMajor variations between 2016-17 Budget and 2016-17 Estimated Actual include:
1. The decrease of $4.5 million is due to the initial amount of regulatory funding determined by the Minister forHealth provided to the Office of the Health Ombudsman by Australian Health Practitioner Regulation Agencybeing included in the Grants and other contributions funding.
2. The increase of $8.575 million is due to funding being provided by the Department of Health directly to the Officeof the Health Ombudsman as well as extra funding from the Department of Health to ensure business continuityfor the 2016-17 financial year.
3. The increase in employee expenses is due to additional investigator and case management officers to continue tomanage the increasing number of complaints received.
Major variations between 2016-17 Estimated Actual and the 2017-18 Budget include:
4. The increase is due to one-off funding and the Department of Health funding arrangements yet to be finalised.
5. The decrease is due to one-off funding and the Department of Health funding arrangements yet to be finalised.
6. The decrease in employee expenses is due to one off funding arrangements.
Balance sheetMajor variations between 2016-17 Budget and 2016-17 Estimated Actual include:
7. The decrease in cash assets is due to the Office expending our grant funding to keep up with the continual growthof complaints received.
8. The decrease in total equity is due to the Office expending our grant funding to keep up with the continual growthof complaints received.
Major variations between 2016-17 Budget and 2017-18 Budget include:
9. The decrease in cash assets is due to the Office expending our grant funding to keep up with the continual growthof complaints received.
10. The decrease in total equity is due to the Office expending our grant funding to keep up with the continual growthof complaints received.
Cash flow statementMajor variations between 2016-17 Budget and 2016-17 Estimated Actual include:
11. The decrease is due to the initial amount of regulatory funding determined by the Minister for Health provided tothe Office of the Health Ombudsman by Australian Health Practitioner Regulation Agency being included in theGrants and other contributions funding.
12. The increase of $8.575 million is due to funding being provided by the Department of Health directly to the Officeof the Health Ombudsman as well as extra funding from the Department of Health to ensure business continuityfor the 2016-17 financial year.
13. The increase in employee expenses is due to additional investigator and case management officers to continue tomanage the increasing number of complaints received.
14. The decrease in cash at the end of financial year is due to the Office expending our grant funding to keep up withthe continual growth of complaints received.
Major variations between 2016-17 Budget and 2017-18 Budget include:
15. The decrease in cash at the end of financial year is due to the Office expending our grant funding to keep up withthe continual growth of complaints received.
Major variations between 2016-17 Estimated Actual and the 2017-18 Budget include:
16. The increase is due to one off funding and the Department of Health funding arrangements yet to be finalised.
Explanation of variances in the financial statements
2542017-18 Queensland State Budget - Service Delivery Statements - Office of the Health Ombudsman
17. The decrease is due to one off funding and the Department of Health funding arrangements yet to be finalised.
18. The decrease is due to one off funding and the Department of Health funding arrangements yet to be finalised.
2552017-18 Queensland State Budget - Service Delivery Statements - Office of the Health Ombudsman
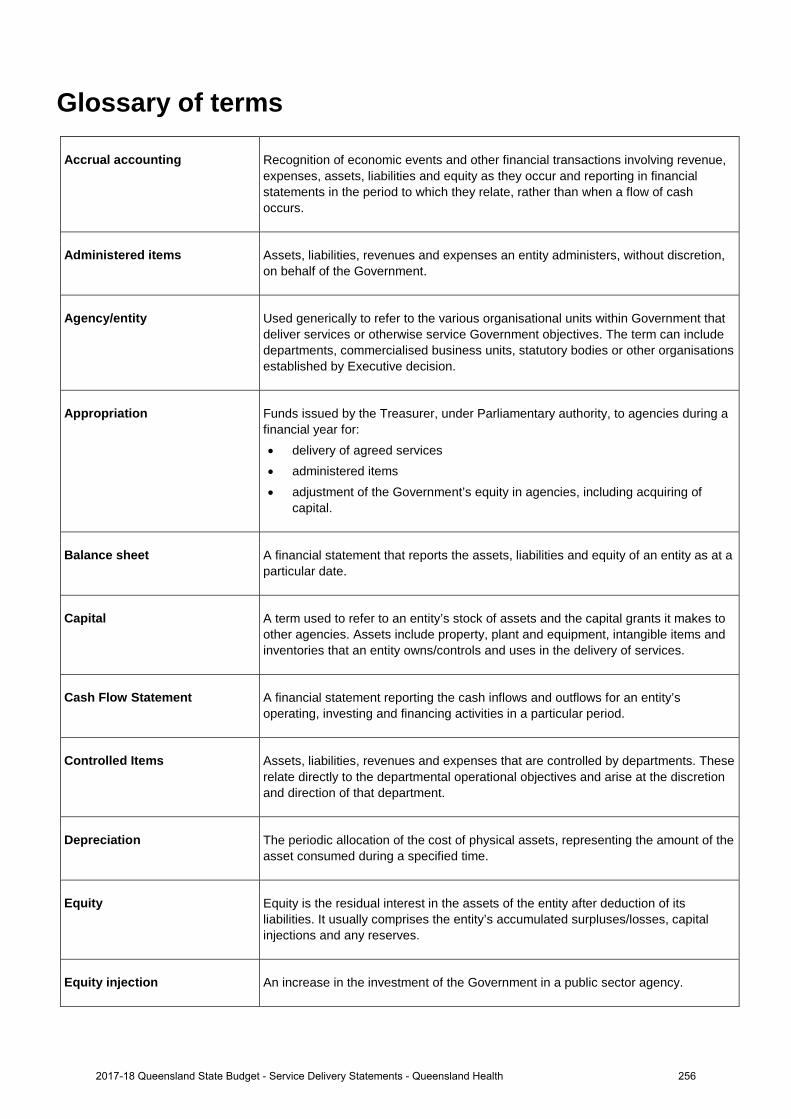
Glossary of terms
Accrual accounting Recognition of economic events and other financial transactions involving revenue, expenses, assets, liabilities and equity as they occur and reporting in financial statements in the period to which they relate, rather than when a flow of cash occurs.
Administered items Assets, liabilities, revenues and expenses an entity administers, without discretion, on behalf of the Government.
Agency/entity Used generically to refer to the various organisational units within Government that deliver services or otherwise service Government objectives. The term can include departments, commercialised business units, statutory bodies or other organisations established by Executive decision.
Appropriation Funds issued by the Treasurer, under Parliamentary authority, to agencies during a financial year for: • delivery of agreed services• administered items• adjustment of the Government’s equity in agencies, including acquiring of
capital.
Balance sheet A financial statement that reports the assets, liabilities and equity of an entity as at a particular date.
Capital A term used to refer to an entity’s stock of assets and the capital grants it makes to other agencies. Assets include property, plant and equipment, intangible items and inventories that an entity owns/controls and uses in the delivery of services.
Cash Flow Statement A financial statement reporting the cash inflows and outflows for an entity’s operating, investing and financing activities in a particular period.
Controlled Items Assets, liabilities, revenues and expenses that are controlled by departments. These relate directly to the departmental operational objectives and arise at the discretion and direction of that department.
Depreciation The periodic allocation of the cost of physical assets, representing the amount of the asset consumed during a specified time.
Equity Equity is the residual interest in the assets of the entity after deduction of its liabilities. It usually comprises the entity’s accumulated surpluses/losses, capital injections and any reserves.
Equity injection An increase in the investment of the Government in a public sector agency.
2562017-18 Queensland State Budget - Service Delivery Statements - Queensland Health
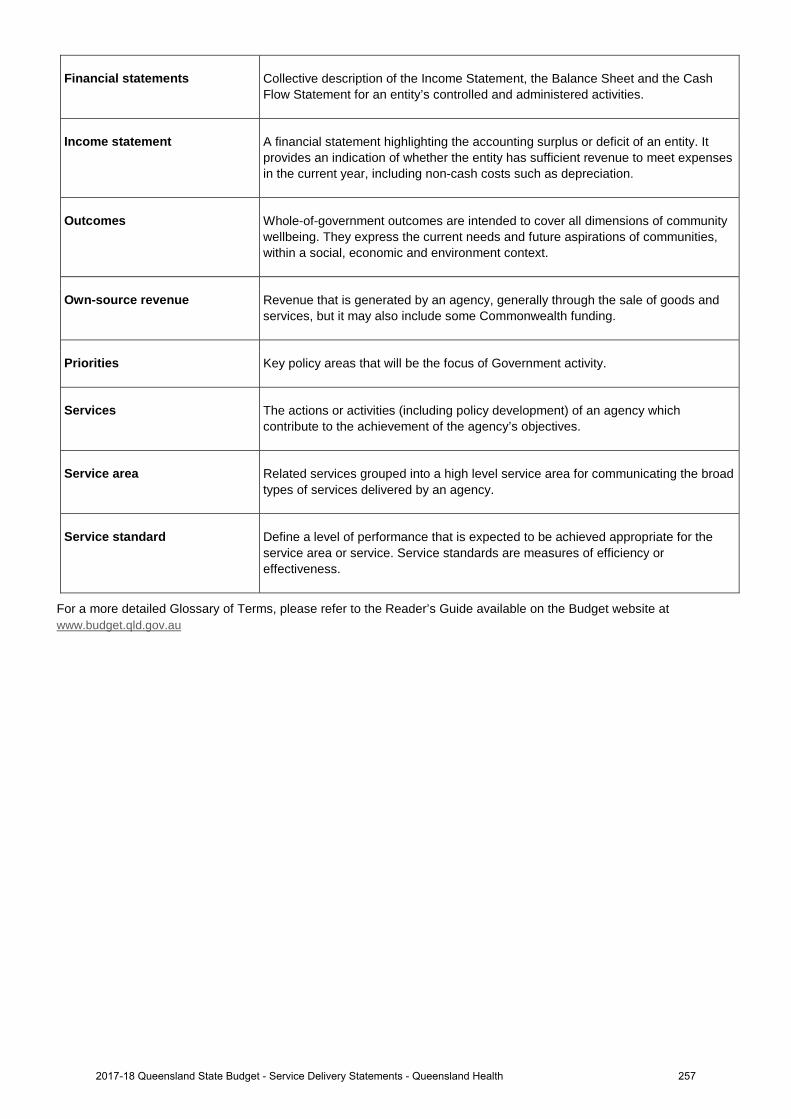
Financial statements Collective description of the Income Statement, the Balance Sheet and the Cash Flow Statement for an entity’s controlled and administered activities.
Income statement A financial statement highlighting the accounting surplus or deficit of an entity. It provides an indication of whether the entity has sufficient revenue to meet expenses in the current year, including non-cash costs such as depreciation.
Outcomes Whole-of-government outcomes are intended to cover all dimensions of community wellbeing. They express the current needs and future aspirations of communities, within a social, economic and environment context.
Own-source revenue Revenue that is generated by an agency, generally through the sale of goods and services, but it may also include some Commonwealth funding.
Priorities Key policy areas that will be the focus of Government activity.
Services The actions or activities (including policy development) of an agency which contribute to the achievement of the agency’s objectives.
Service area Related services grouped into a high level service area for communicating the broad types of services delivered by an agency.
Service standard Define a level of performance that is expected to be achieved appropriate for the service area or service. Service standards are measures of efficiency or effectiveness.
For a more detailed Glossary of Terms, please refer to the Reader’s Guide available on the Budget website at www.budget.qld.gov.au
2572017-18 Queensland State Budget - Service Delivery Statements - Queensland Health

2017-18 Queensland Budget Papers1. Budget Speech
2. Budget Strategy and Outlook
3. Capital Statement
4. Budget Measures
5. Service Delivery Statements
Appropriation Bills
Budget Highlights
The Budget Papers are available online at budget.qld.gov.au
© Crown copyright All rights reservedQueensland Government 2017
Excerpts from this publication may be reproduced, with appropriate acknowledgement, as permitted under the Copyright Act.
Service Delivery StatementsISSN 1445-4890 (Print)ISSN 1445-4904 (Online) Queensland Budget 2017-18 Service Delivery Statements

2017-18QueenslandBudget
Queensland Budget 2017-18
Service Delivery Statements
budget.qld.gov.au
Department of Aboriginal and Torres Strait Islander Partnerships
SERVICE DELIVERYSTATEMENTS