Embed Size (px)
Citation preview
Page 1 of 126
SERVICE DELIVERY PLAN
FY’s 2013-2018
Broward Healthy Start Coalition, Inc.
Cypress Creek Business Park
6555 Powerline Road, Suite 304
Fort Lauderdale, FL 33309
954-563-7583
www.browardhsc.org
Page 2 of 126
TABLE OF CONTENTS Page
Number EXECUTIVE SUMMARY
3
INTRODUCTION
3
SERVICE DELIVERY PLAN DEVELOPMENT PROCESS
4
SUMMARY OF FINDINGS FROM THE NEEDS ASSESSMENT
11
MATERNAL AND CHILD HEALTH INDICATORS AND TRENDS
19
MAJOR HEALTH INDICATORS SELECTED FOR PLANNING CYCLE
56
TARGET POPULATION AND AREAS OF SPECIAL EMPHASIS
58
RESOURCE INVENTORY AND SERVICE GAPS
59
COALITION ACCOMPLISHMENTS
61
HEALTHY START SYSTEM
62
FUNDING ALLOCATION PROCESS
64
COALITION PRIORITIES
65
TURN THE CURVE REPORTS AND FISH BONES
67
PLANNING SUMMARY SHEET FOR THE HEALTHY START SYSTEM
88
INTERNAL AND EXTERNAL QUALITY IMPROVEMENT/
QUALITY ASSURANCE PLAN
95
ACTION PLANS - CATEGORY B
99
Provider satisfaction survey 129
Attachments
-Client satisfaction survey
-Fishbone diagrams
Page 3 of 126
EXECUTIVE SUMMARY
Broward Healthy Start Coalition, Inc. (BHSC) is one of the first of the existing Coalitions in the state of Florida;
established in 1991. The Coalition is focused on reducing infant mortality, babies born at low birth weights and
pre-term, as well as improving maternal and child health and development. To this end, the Coalition provides
universal screenings for infants and pregnant women, care coordination and wraparound services aimed at
identifying and providing support and education to reduce risks to pregnant women and infants.
The Service Delivery Plan (SDP) is driven by data from a Needs Assessment, which examines the most
important maternal and infant outcome indicators in Broward County. The Needs Assessment process included
the gathering, review and analysis of demographic and health data, community input and a review of the Healthy
Start System. A major change from the Coalition’s 2008-2013 SDP is the adoption of Results Based
Accountability (http://www.resultsaccountability.com/) as a basis for identifying, and addressing areas of concern
from a community perspective. These issues are tracked through “Turn The Curve” reports and have become
our Community Action Teams, derived from the Fetal Infant Mortality Review Community Action Group (FIMR
CAG). These teams have spent a great deal of time during the past two years aligning their work with the RBA
structures under the guidance of BHSC. Community surveys related to access to HS services, breastfeeding
and childcare were also conducted to elicit input. Key stake holders were also interviewed and surveyed as a
part of the planning process.
INTRODUCTION
The Broward Healthy Start Coalition, Inc. (BHSC) is charged with reducing infant mortality, low birth weight and
preterm babies and improving maternal and child health and development and is funded primarily through the
Florida Department of Health (FDOH). BHSC is committed to providing care coordination and wraparound
services to pregnant women and children, birth through three years. During this Five Year Service Delivery Plan
Cycle, the Coalition will focus on:
Aligning and implementing the strategies identified in the Best Practice Model “Results Based
Accountability (RBA)”
Tracking results of each of the seven “Turn The Curve Reports” from the RBA Model by
prioritizing and implementing strategies based on data, resources and best practices to impact
the identified issues
Page 4 of 126
Decreasing healthcare related racial disparities found within the Black population
Maintaining FY 2011/2012 levels of Prenatal and Infant screening rates
Identifying system gaps and developing appropriate responses on an on-going basis as part of
a comprehensive Quality Improvement/Quality Assurance Plan
Ensuring fiscal accountability toward increased and diversified funding for the Coalition, with
emphasis on in-kind donations through collaboration and partnerships
Preparations for the Healthy Start Redesign process
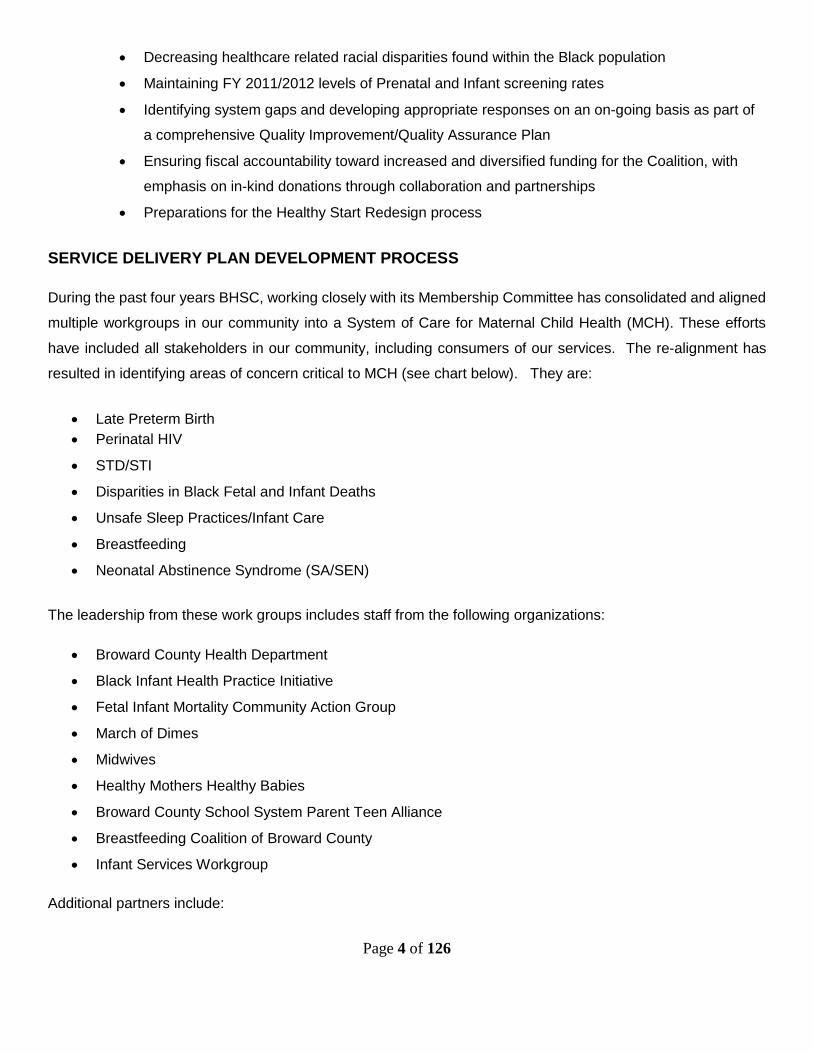
SERVICE DELIVERY PLAN DEVELOPMENT PROCESS
During the past four years BHSC, working closely with its Membership Committee has consolidated and aligned
multiple workgroups in our community into a System of Care for Maternal Child Health (MCH). These efforts
have included all stakeholders in our community, including consumers of our services. The re-alignment has
resulted in identifying areas of concern critical to MCH (see chart below). They are:
Late Preterm Birth
Perinatal HIV
STD/STI
Disparities in Black Fetal and Infant Deaths
Unsafe Sleep Practices/Infant Care
Breastfeeding
Neonatal Abstinence Syndrome (SA/SEN)
The leadership from these work groups includes staff from the following organizations:
Broward County Health Department
Black Infant Health Practice Initiative
Fetal Infant Mortality Community Action Group
March of Dimes
Midwives
Healthy Mothers Healthy Babies
Broward County School System Parent Teen Alliance
Breastfeeding Coalition of Broward County
Infant Services Workgroup
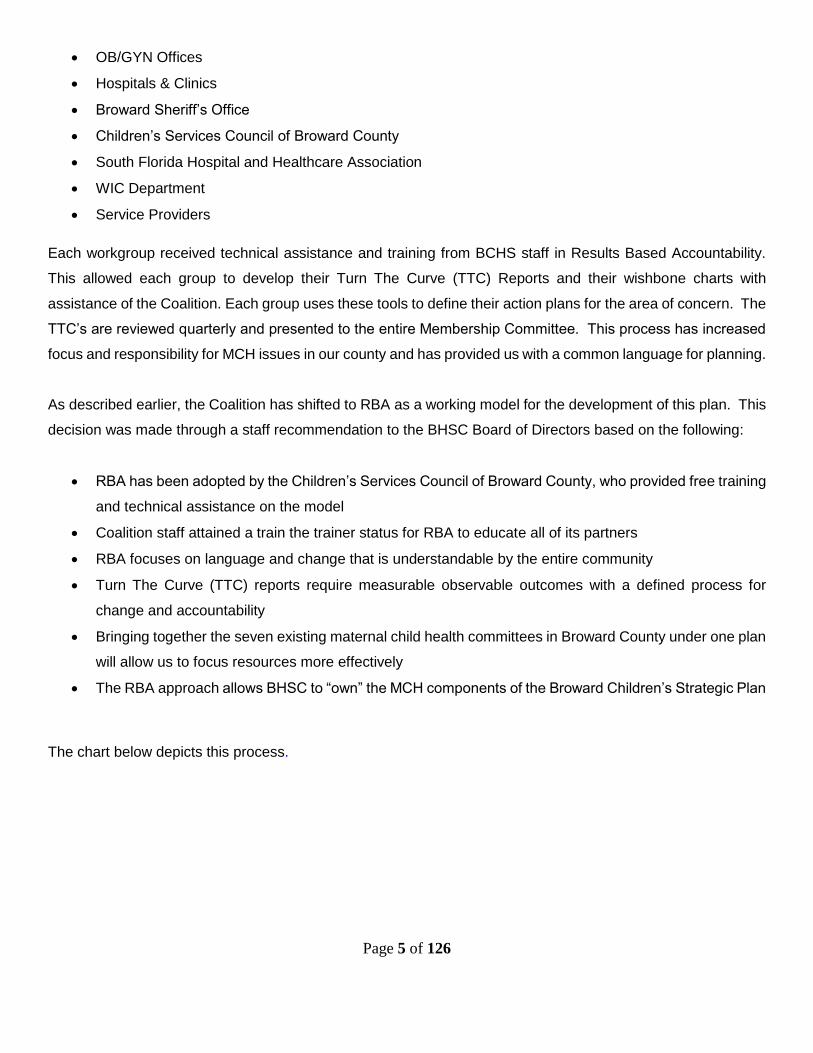
Additional partners include:
Page 5 of 126
OB/GYN Offices
Hospitals & Clinics
Broward Sheriff’s Office
Children’s Services Council of Broward County
South Florida Hospital and Healthcare Association
WIC Department
Service Providers
Each workgroup received technical assistance and training from BCHS staff in Results Based Accountability.
This allowed each group to develop their Turn The Curve (TTC) Reports and their wishbone charts with
assistance of the Coalition. Each group uses these tools to define their action plans for the area of concern. The
TTC’s are reviewed quarterly and presented to the entire Membership Committee. This process has increased
focus and responsibility for MCH issues in our county and has provided us with a common language for planning.
As described earlier, the Coalition has shifted to RBA as a working model for the development of this plan. This
decision was made through a staff recommendation to the BHSC Board of Directors based on the following:
RBA has been adopted by the Children’s Services Council of Broward County, who provided free training
and technical assistance on the model
Coalition staff attained a train the trainer status for RBA to educate all of its partners
RBA focuses on language and change that is understandable by the entire community
Turn The Curve (TTC) reports require measurable observable outcomes with a defined process for
change and accountability
Bringing together the seven existing maternal child health committees in Broward County under one plan
will allow us to focus resources more effectively
The RBA approach allows BHSC to “own” the MCH components of the Broward Children’s Strategic Plan
The chart below depicts this process.
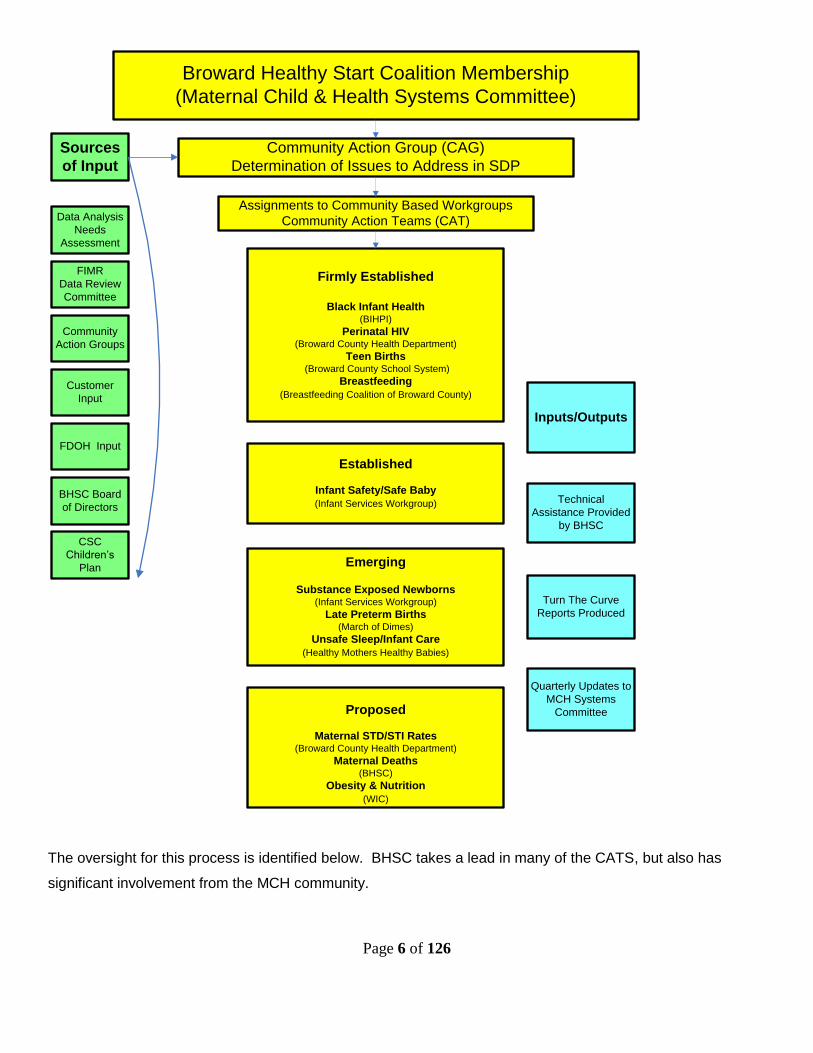
Page 6 of 126
Broward Healthy Start Coalition Membership
(Maternal Child & Health Systems Committee)
Community Action Group (CAG)
Determination of Issues to Address in SDP
Assignments to Community Based Workgroups
Community Action Teams (CAT)
FIMR
Data Review
Committee
Firmly Established
Black Infant Health (BIHPI)
Perinatal HIV(Broward County Health Department)
Teen Births (Broward County School System)
Breastfeeding
(Breastfeeding Coalition of Broward County)
Technical
Assistance Provided
by BHSC
Turn The Curve
Reports Produced
Quarterly Updates to
MCH Systems
Committee
Data Analysis
Needs
Assessment
Community
Action Groups
Customer
Input
FDOH Input
Sources
of Input
BHSC Board
of Directors
CSC
Children’s
Plan
Established
Infant Safety/Safe Baby
(Infant Services Workgroup)
Emerging
Substance Exposed Newborns (Infant Services Workgroup)
Late Preterm Births (March of Dimes)
Unsafe Sleep/Infant Care
(Healthy Mothers Healthy Babies)
Proposed
Maternal STD/STI Rates (Broward County Health Department)
Maternal Deaths(BHSC)
Obesity & Nutrition
(WIC)
Inputs/Outputs
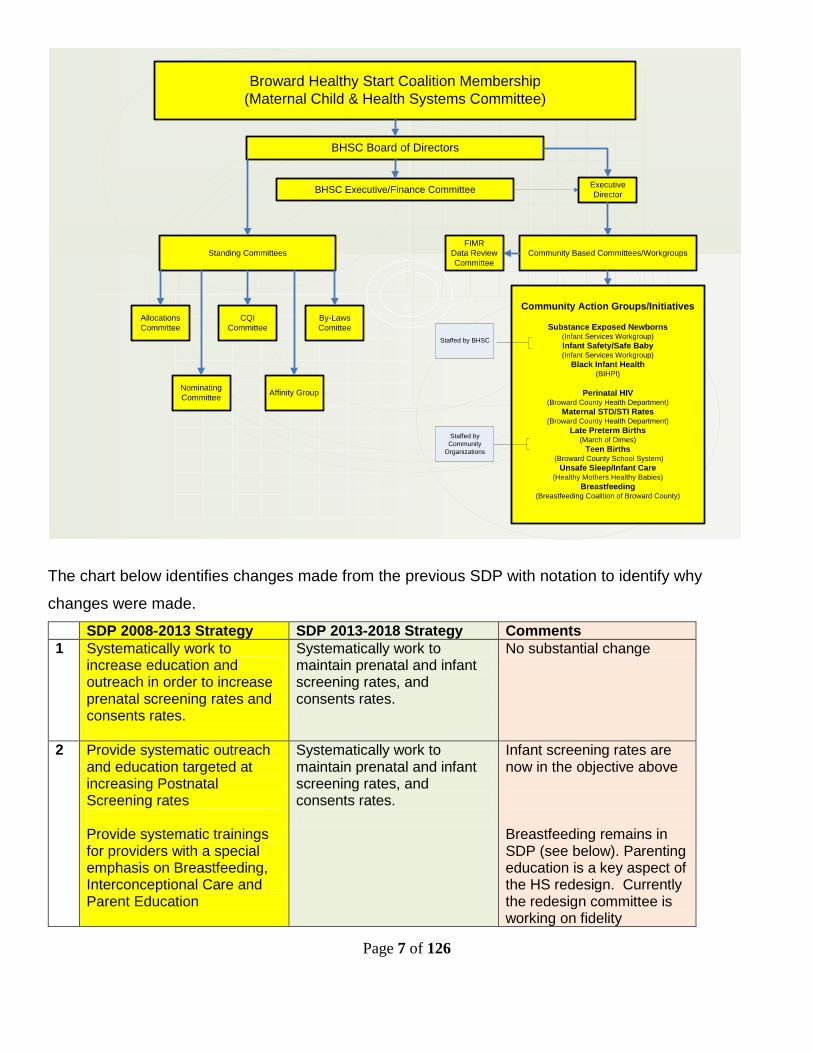
The oversight for this process is identified below. BHSC takes a lead in many of the CATS, but also has
significant involvement from the MCH community.
Page 7 of 126
Broward Healthy Start Coalition Membership
(Maternal Child & Health Systems Committee)
BHSC Board of Directors
BHSC Executive/Finance Committee
Standing Committees
Allocations
Committee
CQI
Committee
By-Laws
Comittee
Nominating
CommitteeAffinity Group
Executive
Director
Community Based Committees/Workgroups
FIMR
Data Review
Committee
Community Action Groups/Initiatives
Substance Exposed Newborns (Infant Services Workgroup)
Infant Safety/Safe Baby (Infant Services Workgroup)
Black Infant Health (BIHPI)
Perinatal HIV(Broward County Health Department)
Maternal STD/STI Rates (Broward County Health Department)
Late Preterm Births (March of Dimes)
Teen Births (Broward County School System)
Unsafe Sleep/Infant Care (Healthy Mothers Healthy Babies)
Breastfeeding (Breastfeeding Coalition of Broward County)
Staffed by BHSC
Staffed by
Community
Organizations
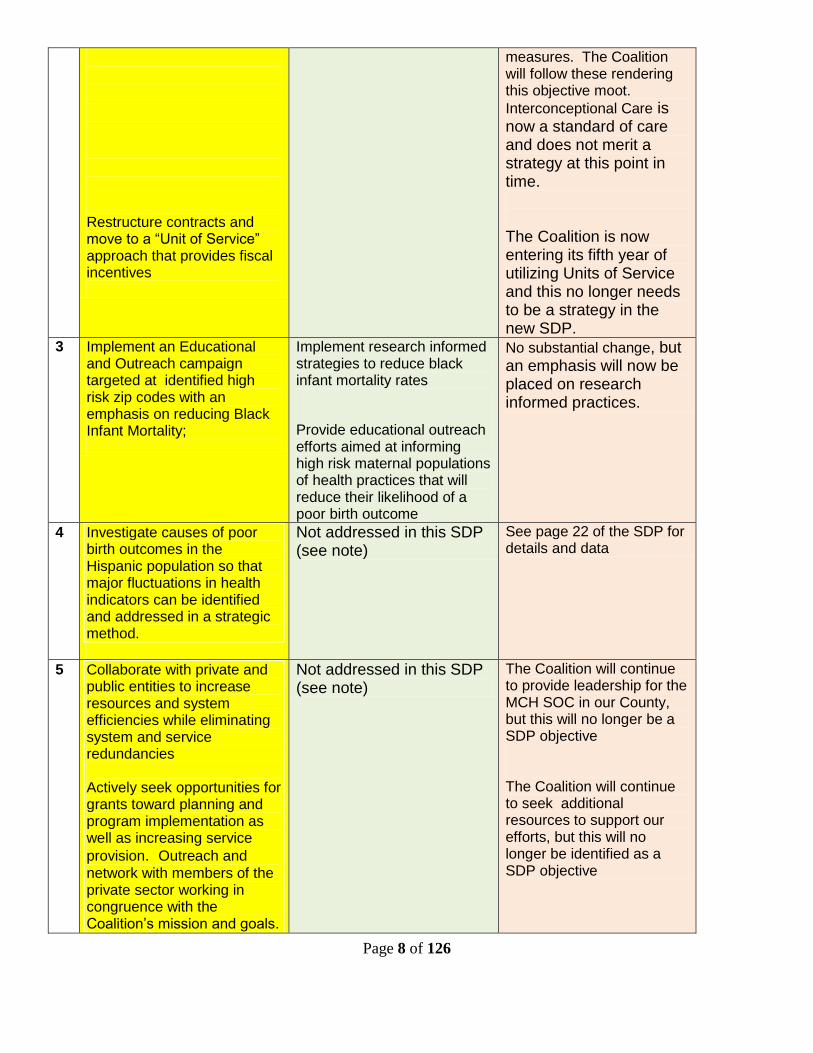
The chart below identifies changes made from the previous SDP with notation to identify why
changes were made.
SDP 2008-2013 Strategy SDP 2013-2018 Strategy Comments
1 Systematically work to increase education and outreach in order to increase prenatal screening rates and consents rates.
Systematically work to maintain prenatal and infant screening rates, and consents rates.
No substantial change
2 Provide systematic outreach and education targeted at increasing Postnatal Screening rates
Provide systematic trainings for providers with a special emphasis on Breastfeeding, Interconceptional Care and Parent Education
Systematically work to maintain prenatal and infant screening rates, and consents rates.
Infant screening rates are now in the objective above Breastfeeding remains in SDP (see below). Parenting education is a key aspect of the HS redesign. Currently the redesign committee is working on fidelity
Page 8 of 126
Restructure contracts and move to a “Unit of Service” approach that provides fiscal incentives
measures. The Coalition will follow these rendering this objective moot.
Interconceptional Care is now a standard of care and does not merit a strategy at this point in time. The Coalition is now entering its fifth year of utilizing Units of Service and this no longer needs to be a strategy in the new SDP.
3 Implement an Educational and Outreach campaign targeted at identified high risk zip codes with an emphasis on reducing Black Infant Mortality;
Implement research informed strategies to reduce black infant mortality rates
Provide educational outreach efforts aimed at informing high risk maternal populations of health practices that will reduce their likelihood of a poor birth outcome
No substantial change, but an emphasis will now be placed on research informed practices.
4 Investigate causes of poor birth outcomes in the Hispanic population so that major fluctuations in health indicators can be identified and addressed in a strategic method.
Not addressed in this SDP (see note)
See page 22 of the SDP for details and data
5 Collaborate with private and public entities to increase resources and system efficiencies while eliminating system and service redundancies Actively seek opportunities for grants toward planning and program implementation as well as increasing service
provision. Outreach and
network with members of the private sector working in congruence with the Coalition’s mission and goals.
Not addressed in this SDP (see note)
The Coalition will continue to provide leadership for the MCH SOC in our County, but this will no longer be a SDP objective The Coalition will continue to seek additional resources to support our efforts, but this will no longer be identified as a SDP objective
Page 9 of 126
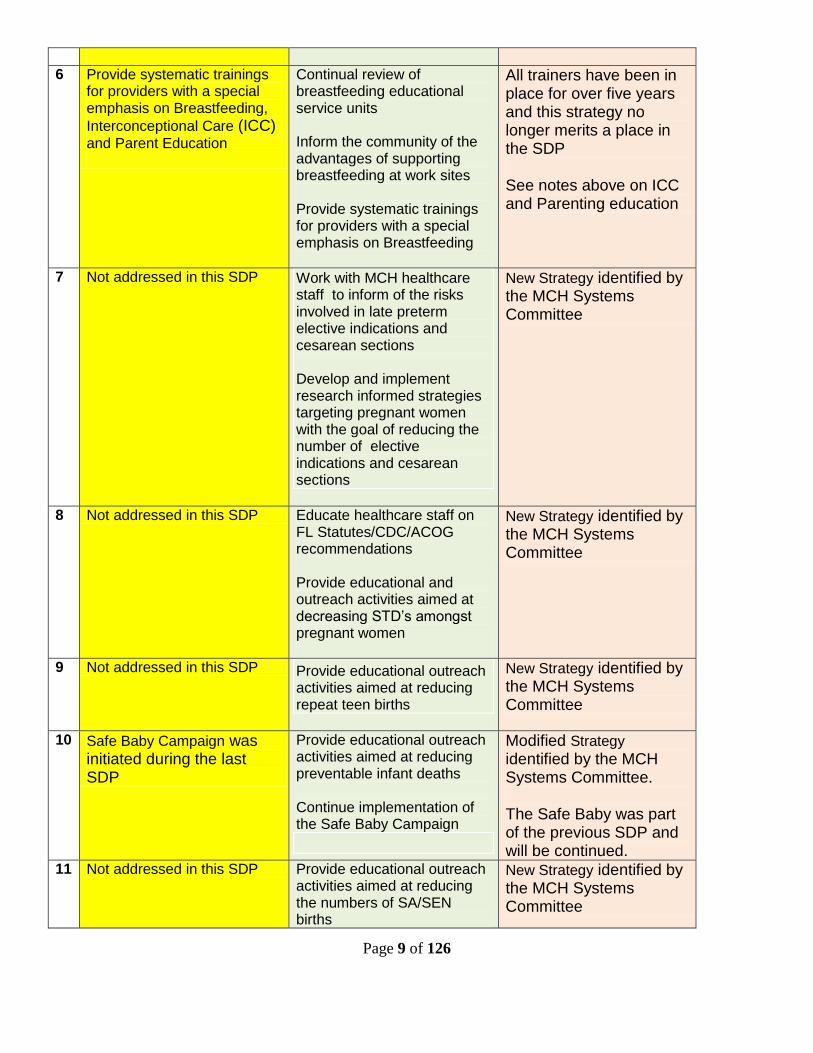
6 Provide systematic trainings for providers with a special emphasis on Breastfeeding,
Interconceptional Care (ICC) and Parent Education
Continual review of breastfeeding educational service units Inform the community of the advantages of supporting breastfeeding at work sites Provide systematic trainings for providers with a special emphasis on Breastfeeding
All trainers have been in place for over five years and this strategy no longer merits a place in the SDP See notes above on ICC and Parenting education
7 Not addressed in this SDP Work with MCH healthcare staff to inform of the risks involved in late preterm elective indications and cesarean sections Develop and implement research informed strategies targeting pregnant women with the goal of reducing the number of elective indications and cesarean sections
New Strategy identified by the MCH Systems Committee
8 Not addressed in this SDP Educate healthcare staff on FL Statutes/CDC/ACOG recommendations Provide educational and outreach activities aimed at decreasing STD’s amongst pregnant women
New Strategy identified by the MCH Systems Committee
9 Not addressed in this SDP Provide educational outreach activities aimed at reducing repeat teen births
New Strategy identified by the MCH Systems Committee
10 Safe Baby Campaign was initiated during the last SDP
Provide educational outreach activities aimed at reducing preventable infant deaths Continue implementation of the Safe Baby Campaign
Modified Strategy identified by the MCH Systems Committee. The Safe Baby was part of the previous SDP and will be continued.
11 Not addressed in this SDP Provide educational outreach activities aimed at reducing the numbers of SA/SEN births
New Strategy identified by the MCH Systems Committee

Page 10 of 126
Support a system of care approach that has early identification through screening, education and treatment for mothers experiencing substance related problems
Page 11 of 126
SUMMARY OF FINDINGS FROM THE NEEDS ASSESSMENT/METHODOLOGY
The Healthy Start Needs Assessment is a surveillance effort led by BHSC in collaboration with the Maternal
Child Health Systems Committee. This process has been ongoing since the fall of 2010, and concurrent with
the state guided and mandated service delivery planning requirements. This Service Delivery Plan and related
documents is primarily driven by data from this assessment, which examines the critical maternal and infant
outcome indicators in Broward County. To determine the maternal and child health needs, outcomes, trends
and systemic issues, extensive quantitative and qualitative data collection and analyses were utilized.
Quantitative data reviewed and analyzed include information from Florida Department of Health, Vital Statistics;
Florida governmental departments/agencies; County Health and Governmental Agencies and National
Organizations. Zip codes within the county were reviewed and analyzed to prioritize geographical areas of most
need, based on seven critical health indicators; these include prenatal care, births to teens, preterm and low-
birth weight births, fetal and infant mortality. Qualitative data was collected from consumers, funded providers
and community stake holders, through key informant interviews, focus groups, and surveys.
These data findings constitute a great portion of the 2013-2018 Service Delivery Plan, coupled with updates from
the previous version to reflect current and ongoing strategies undertaken by the Coalition and its providers.
Quantitative and qualitative data collection and analysis have provided the information necessary to assess
Broward County’s emergent health, behavioral and service trends and utilization to draw conclusions. Perinatal
Periods of Risk (PPOR) Analysis and FIMR reports were also used throughout this process (See attached FIMR
Report).
Sources of Data
Quantitative
Broward County Health Department
Broward County Fetal Infant Mortality Review (FIMR): Case Review Data
Broward Regional Health Planning Council
Federation for American Immigration Reform (FAIR)
Florida CHARTS
Healthy People
Healthy Start Coalition of Broward County: Consumer Survey Results
Healthy Start Coalition of Broward County
Healthy Start Coalition of Broward County: Board of Directors and Membership Survey Results
March of Dimes
Page 12 of 126
School Board of Broward County
US Bureau of Census, Census 2011, Broward County Health Profile
US Bureau of Census: American Community Survey Profile, 2011
Qualitative
Community Surveys
Stakeholder Surveys
Demographics
Population
Broward County’s population for 2011 was 1,780,172 and is the second most populous county in Florida, with
more than 9.7% of the state’s residents. An analysis of the 2011 Census data reveals that 5.9 % of
Broward County's population was less than 5 years old and 22.0% between the ages of 0-19 years. 51.4% of
the population is female, with 445,778 women between the ages of 15 and 50, which equates to about 25% of
the population being of childbearing age.
In 2011, there were 21,075 babies born in Broward County; 54.61% were White, and 38.43% Black. Infant
mortality rates have stabilized since 2004, but notable disparities between Whites and Blacks remain. Similarly,
neonatal rates have remained stable; however, post neonatal mortality has increased for the period of record.
Fetal and infant health serves as significant indicators of the overall health status for the county and is the
impetus for planning efforts and strategies included in the plan. Census data from 2011 indicate that Blacks
account for 27.4% of the population, while 25.8% of the population is Hispanic. More Black foreigners immigrated
to Broward County between 2006 and 2010 than any other county in the United States. At the same time,
Hispanics have continued to move into the county from neighboring Miami-Dade County and from Latin America.
80% of the foreign born population in our county originates from Latin American counties. The population change
is significant in at least one respect: The percentage of population identified as non-Hispanic White has now
dropped to less than half, at 43.1%. As such, Broward County is now a "minority-majority.”
The graph below summarizes the racial makeup of our county in 2011.
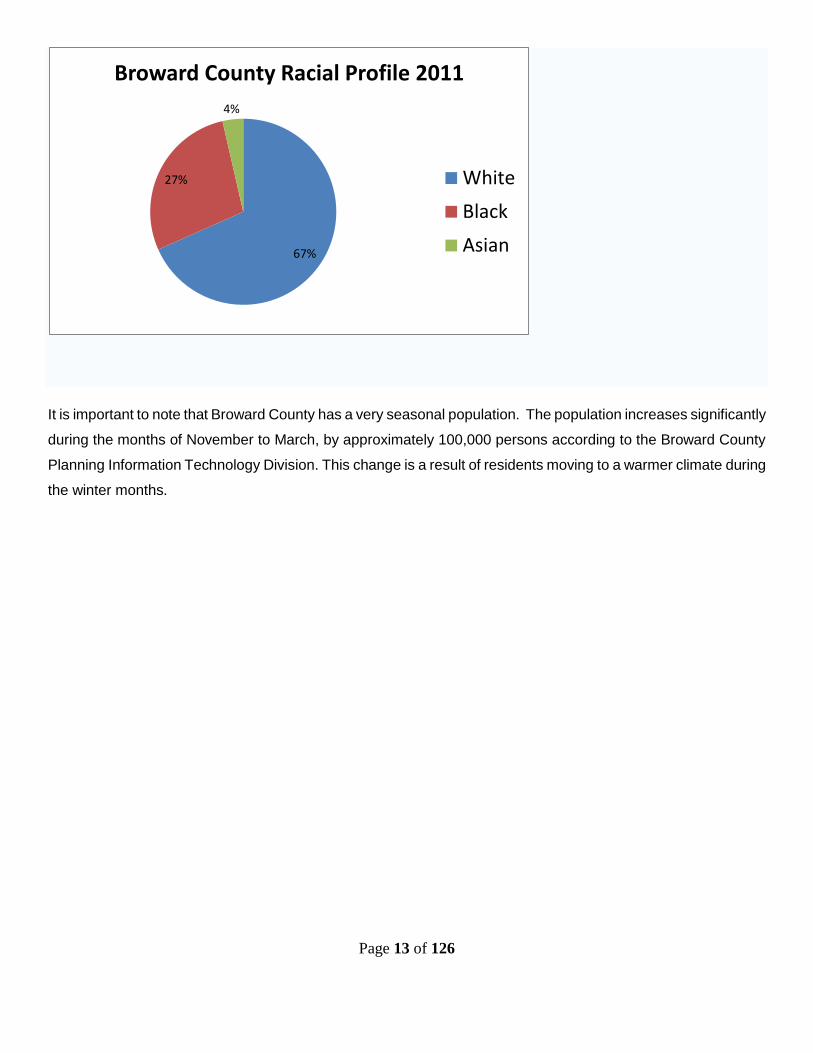
Page 13 of 126
It is important to note that Broward County has a very seasonal population. The population increases significantly
during the months of November to March, by approximately 100,000 persons according to the Broward County
Planning Information Technology Division. This change is a result of residents moving to a warmer climate during
the winter months.
67%
27%
4%
Broward County Racial Profile 2011
White
Black
Asian
Page 14 of 126
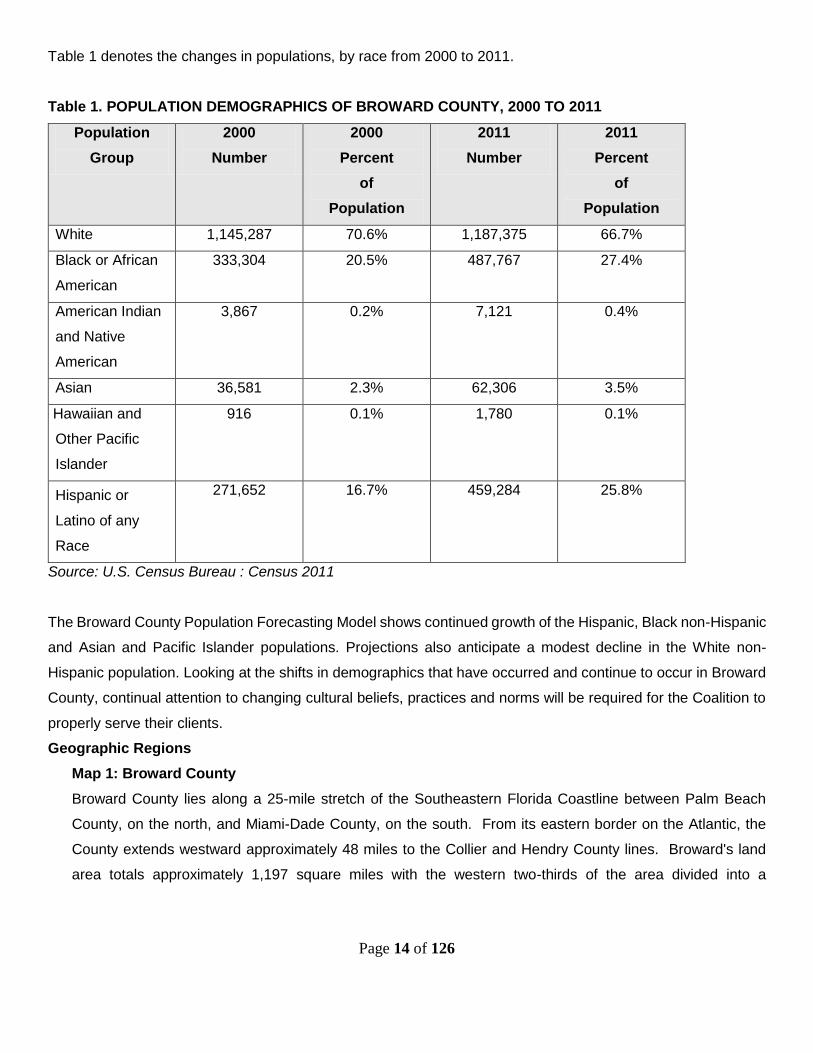
Table 1 denotes the changes in populations, by race from 2000 to 2011.
Table 1. POPULATION DEMOGRAPHICS OF BROWARD COUNTY, 2000 TO 2011
Population
Group
2000
Number
2000
Percent
of
Population
2011
Number
2011
Percent
of
Population
White 1,145,287 70.6% 1,187,375 66.7%
Black or African
American
333,304 20.5% 487,767 27.4%
American Indian
and Native
American
3,867 0.2% 7,121 0.4%
Asian 36,581 2.3% 62,306 3.5%
Native Hawaiian and
Other Pacific
Islander
916 0.1% 1,780 0.1%
Hispanic or
Latino of any
Race
271,652 16.7% 459,284 25.8%
Source: U.S. Census Bureau : Census 2011
The Broward County Population Forecasting Model shows continued growth of the Hispanic, Black non-Hispanic
and Asian and Pacific Islander populations. Projections also anticipate a modest decline in the White non-
Hispanic population. Looking at the shifts in demographics that have occurred and continue to occur in Broward
County, continual attention to changing cultural beliefs, practices and norms will be required for the Coalition to
properly serve their clients.
Geographic Regions
Map 1: Broward County
Broward County lies along a 25-mile stretch of the Southeastern Florida Coastline between Palm Beach
County, on the north, and Miami-Dade County, on the south. From its eastern border on the Atlantic, the
County extends westward approximately 48 miles to the Collier and Hendry County lines. Broward's land
area totals approximately 1,197 square miles with the western two-thirds of the area divided into a

Page 15 of 126
conservation area (622 square miles) and an
Indian reservation (165 square miles). Over
8.6% of the County’s area is water totaling 114
square miles.
The profile of Broward County shows some
significant changes during the past decade. A
steady increase in population is owed primarily to
the rapid development of the central, western,
and southwestern portions of the County
following the aftermath of Hurricane Andrew in
1992. The region's population has become
increasingly diverse, with significant growth
among racial and ethnic minority groups.
According to Broward County Planning Services
Division, population growth through 2010
occurred most rapidly within the southwest and
northwest pockets of the county. This growth is
anticipated to continue through 2012 as undeveloped land is absorbed; a shift toward redevelopment in the
eastern regions is also anticipated to accommodate the projected population increase.
The 2011 People Quick Facts survey identified that 31% of Broward’s residents were foreign born, and 37% of
households spoke another language at home other than English. Though specific data on undocumented
residents is often difficult to ascertain, an estimated 7 to 10 million are believed to be residing within our state
(FAIR, 2010). Best estimates surmise that Miami-Dade and Broward counties account for the majority of these
residents. A large, uncounted number of undocumented residents, located principally in the central corridor of
the County, add to a dramatic increase in population and have and will continue to impact the county’s health
and economy.
In a recent study conducted by the federal government of those receiving amnesty through the Immigration
Reform and Control Act, data showed that 94 percent of those surveyed had migrated for economic reasons.
Data from the aforementioned study further indicates that 15 percent of those sampled spoke English, 80 percent
used public health services and 49 percent had no health insurance. Their median age was 32, with an average
household of four, seven years education, an hourly wage of $5.45, an annual individual income of $8,982, and
annual family income of $15,364 (FAIR, 2010). They are clearly an economically deprived population.
Page 16 of 126
Of specific concern to this plan is the growing Haitian population in our county. The babies of Haitian women are
identified as being the highest risk group that contributes to the disparity between Black and White infant mortality
in Broward County. During the years 2008-10, in the eight zip codes indentified as having the highest risks for
infant mortality in the county, Haitian babies were dying at the rate of three times that of White babies and nearly
twice that of Black babies (source: Florida Department of Health).
Issues of access to care, navigating a predominantly English only healthcare system and immigration concerns
prove to be barriers to care for undocumented residents. With poor education, narrow opportunities for work and
no health insurance, our county’s undocumented residents are at risk for poor health outcomes; with their median
age being within childbearing years, these residents are also at risk for poor pregnancy and birth outcomes.
Household Size and Income
In 2011, there were 810,795 households in Broward County with the average household size being 2.57. The
median family income within the county was $42,418, down nearly $5,000 from 2007, with per capita income of
$27,278. 11.1% of our residents are living below the poverty level. Income or lack thereof can contribute to a
variety of poor health, behavioral, and psychosocial outcomes.
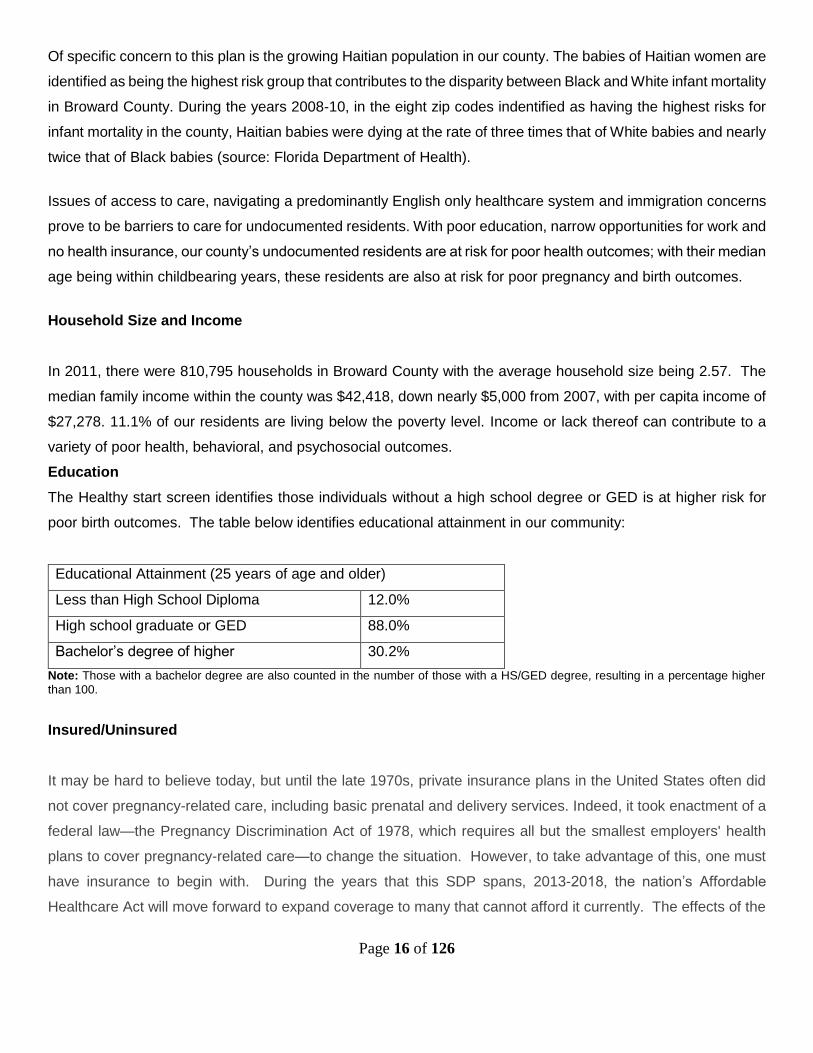
Education
The Healthy start screen identifies those individuals without a high school degree or GED is at higher risk for
poor birth outcomes. The table below identifies educational attainment in our community:
Educational Attainment (25 years of age and older)
Less than High School Diploma 12.0%
High school graduate or GED 88.0%
Bachelor’s degree of higher 30.2%
Note: Those with a bachelor degree are also counted in the number of those with a HS/GED degree, resulting in a percentage higher
than 100.
Insured/Uninsured
It may be hard to believe today, but until the late 1970s, private insurance plans in the United States often did
not cover pregnancy-related care, including basic prenatal and delivery services. Indeed, it took enactment of a
federal law—the Pregnancy Discrimination Act of 1978, which requires all but the smallest employers' health
plans to cover pregnancy-related care—to change the situation. However, to take advantage of this, one must
have insurance to begin with. During the years that this SDP spans, 2013-2018, the nation’s Affordable
Healthcare Act will move forward to expand coverage to many that cannot afford it currently. The effects of the
Page 17 of 126
recently approved Medicaid expansion will also need to be tracked of the next five years, as more individuals
will have access to healthcare.
Access to healthcare continues to be a challenge in our community. Only 58.1% of individuals have private
insurance, while nearly one in five individuals in Broward County in 2011 had no health insurance, an additional
26.5% were able to access Medicaid. A concern that is extremely relevant to this SDP is that many of our most
recent residents are undocumented, and are not eligible for Medicaid, even when pregnant. With the alarmingly
high rates of infant mortality amongst Haitian women, merely advising them to get prenatal care is of no avail if
they cannot afford it. Many of these women simply show up in an emergency room at the onset of labor.
Addressing this issue requires more than a social plan, it is one that will require a policy change through a political
solution, as well as one of increasing resources.
Medicaid Population
The Pregnancy Discrimination Act played a major role in ensuring that those with private insurance had
coverage for pregnancy-related care, but left a gap in coverage for the lowest income Americans, who rarely
have access to employer-sponsored insurance. According to Guttmacher, nearly 15 million women of
reproductive age had no insurance for pregnancy-related care, and many low-income pregnant women faced a
host of financial obstacles to care that could easily turn what is supposed to be a happy event into a period of
extraordinary stress. Congress and state governments moved to close the gaps by progressively increasing
the income level at which women become eligible for Medicaid-funded prenatal, delivery and postpartum care.
States are required to provide coverage for pregnancy-related services for women with incomes up to 133% of
the federal poverty level—far above most states' regular Medicaid eligibility ceilings. At their option, states can
include women with incomes up to 185% of poverty and even beyond. Florida has chosen the higher option.
The Medicaid eligibility expansion revolutionized how pregnancy-related care is paid for in this country.
Enrollment of pregnant women under Medicaid has increased dramatically under the expansions, and since
1985, the proportion of all births financed by Medicaid has soared (see chart). As might be expected, this
policy change in Medicaid improved early initiation of prenatal care among disadvantaged women.
In 2011 there were 8,536 births (40.1%) in Broward covered by Medicaid. The state average for Medicaid
covered births is 48.7%. There is speculation that the recent changes to the process of applying for services
may have served as a possible barrier for potential clients. Similarly, there has been a decrease in Medicaid
utilization within the county, community leaders also speculate that this may correlate to the changes in
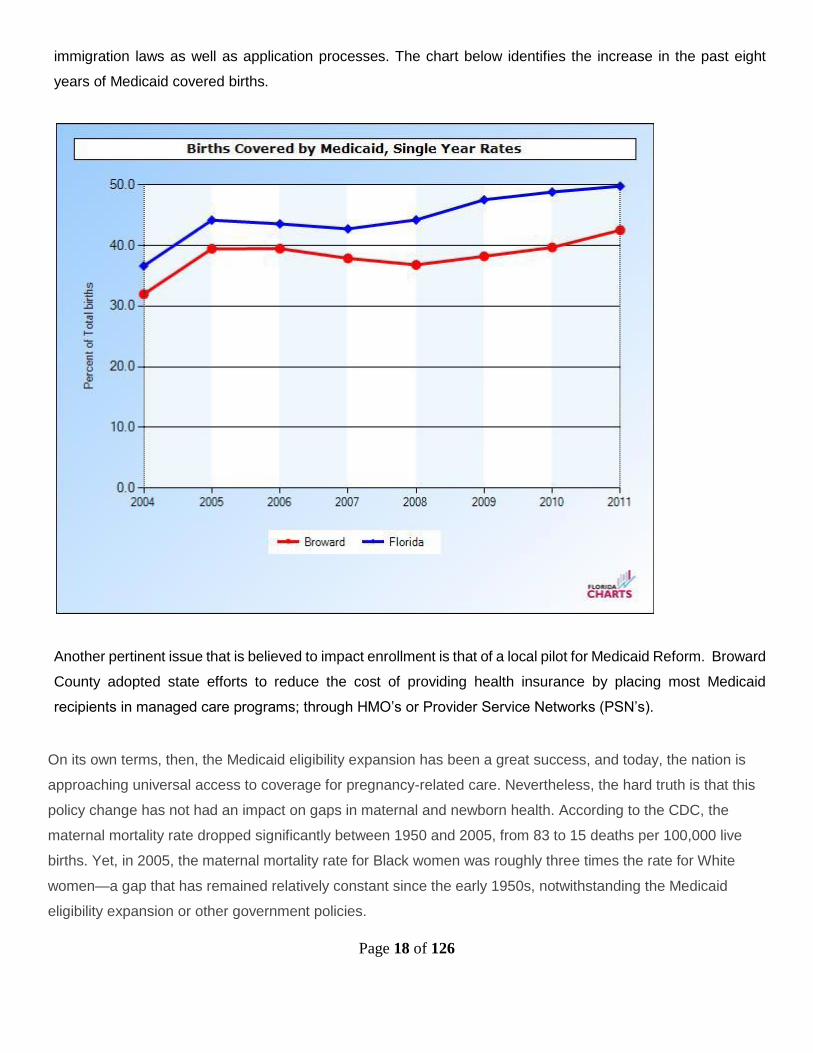
Page 18 of 126
immigration laws as well as application processes. The chart below identifies the increase in the past eight
years of Medicaid covered births.
Another pertinent issue that is believed to impact enrollment is that of a local pilot for Medicaid Reform. Broward
County adopted state efforts to reduce the cost of providing health insurance by placing most Medicaid
recipients in managed care programs; through HMO’s or Provider Service Networks (PSN’s).
On its own terms, then, the Medicaid eligibility expansion has been a great success, and today, the nation is
approaching universal access to coverage for pregnancy-related care. Nevertheless, the hard truth is that this
policy change has not had an impact on gaps in maternal and newborn health. According to the CDC, the
maternal mortality rate dropped significantly between 1950 and 2005, from 83 to 15 deaths per 100,000 live
births. Yet, in 2005, the maternal mortality rate for Black women was roughly three times the rate for White
women—a gap that has remained relatively constant since the early 1950s, notwithstanding the Medicaid
eligibility expansion or other government policies.
Page 19 of 126
In addition, there is little evidence that the Medicaid eligibility expansion has had an effect on birth outcomes,
and large differences in low-birth-weight births by socioeconomic group remain. In fact, according to the Urban
Institute's study, for African-Americans, rates actually increased over the period of the Medicaid expansion, as
did the gaps between Whites and African-Americans. Today, the risk of low birth weight among Black infants is
more than twice that among White infants. Clearly, more research is needed to better understand what is
behind the disparities in maternal and infant health outcomes.
Infant mortality is a primary indicator of health in a community because of its association with a variety of factors
such as maternal health, quality of and access to medical care, socio-economic conditions, public health
practices and the general quality of life experienced by its residents. Unique socio-economic factors impact the
health of our residents in Broward County. These include migration and immigration reforms, insurance reform
and demographic and geographic shifts in resident populous. Increasing property prices and saturated
transportation also impact on health in Broward. One of the most disturbing facts that can be drawn from the
data is the racial disparity that exists in almost all measurable areas related to MCH. BHSC has been active for
many years in addressing this issue and this SDP will hopefully bring that to a new level.
MATERNAL AND CHILD HEALTH INDICATORS AND TRENDS
Like other communities, Broward County has multiple health problems and limited resources. Preterm births,
infant mortality, fetal mortality, increasing teen birth rates, the prevalence of sexually transmitted infections and
increased rates of smoking during pregnancy pose risks to our community’s overall health and wellness.
Ensuring Healthy Start screens and appropriate service provision are paramount to improving Broward County’s
health outcomes. In order to maximize our county’s resources, the following maternal child health problems have
been identified from our needs assessment.
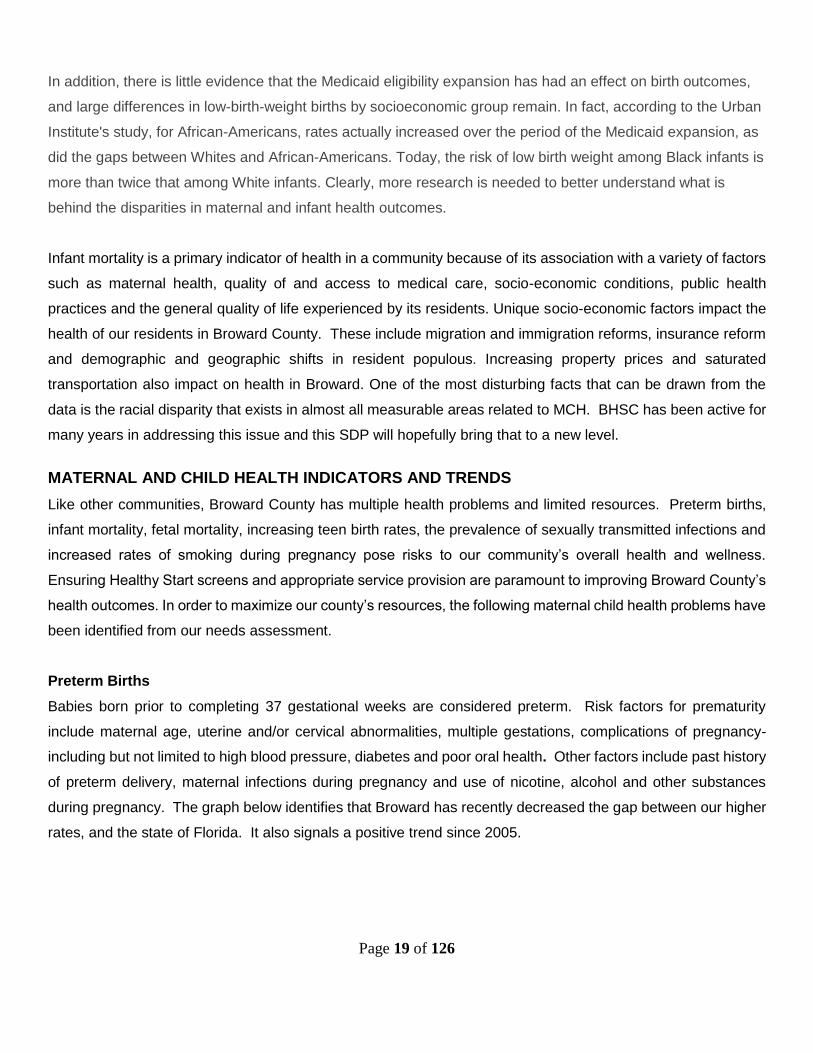
Preterm Births
Babies born prior to completing 37 gestational weeks are considered preterm. Risk factors for prematurity
include maternal age, uterine and/or cervical abnormalities, multiple gestations, complications of pregnancy-
including but not limited to high blood pressure, diabetes and poor oral health. Other factors include past history
of preterm delivery, maternal infections during pregnancy and use of nicotine, alcohol and other substances
during pregnancy. The graph below identifies that Broward has recently decreased the gap between our higher
rates, and the state of Florida. It also signals a positive trend since 2005.

Page 20 of 126
Preterm Births by Race
Preterm births are one of the primary causes of infant mortality. While there has been a decline in pre-term
births in our community over the past five years, the racial disparity remains stagnant as indicated in the chart
and graph below.
Pre-term Births in Broward County
2008 2009 2010
Whites 12.9% 12.1% 11.5%
Blacks 14.7% 14.2% 13.3%
Haitians 16.9% 17.8% 16.6%
Data Source: Florida Department of Health, Office of Vital Statistics.
Page 21 of 126
The stubborn racial disparity that exists on many of the critical MCH indicators will be addressed in the Action
Plans of this SDP, and will require new approaches in addressing this problem as well as service delivery
approaches to the at risk populations.
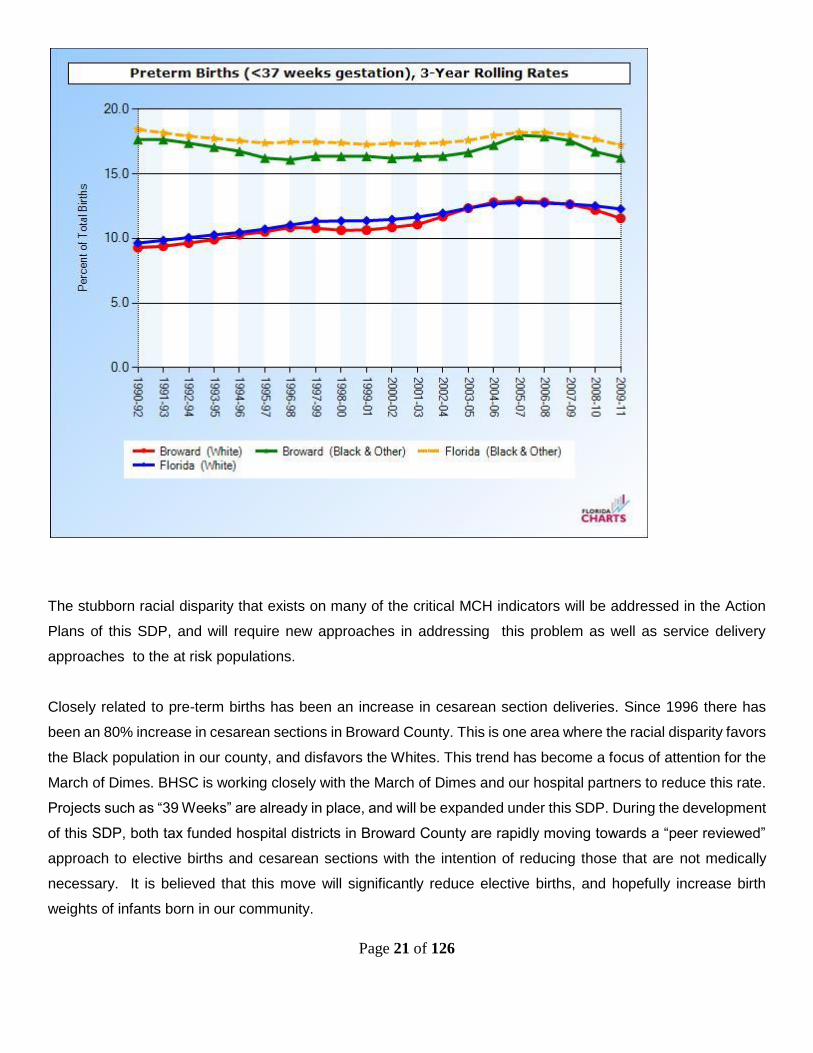
Closely related to pre-term births has been an increase in cesarean section deliveries. Since 1996 there has
been an 80% increase in cesarean sections in Broward County. This is one area where the racial disparity favors
the Black population in our county, and disfavors the Whites. This trend has become a focus of attention for the
March of Dimes. BHSC is working closely with the March of Dimes and our hospital partners to reduce this rate.
Projects such as “39 Weeks” are already in place, and will be expanded under this SDP. During the development
of this SDP, both tax funded hospital districts in Broward County are rapidly moving towards a “peer reviewed”
approach to elective births and cesarean sections with the intention of reducing those that are not medically
necessary. It is believed that this move will significantly reduce elective births, and hopefully increase birth
weights of infants born in our community.
Page 22 of 126
Infant Mortality
The infant mortality rate, considered to be a leading indicator of the health of a community, includes deaths
during the first year of life. It is a reflection on the health of the mother, the effectiveness of the maternal care
system, the health and care of the newborn and follow-up during the first year of life with well child services. The
graph below indicates a decade of decrease in mortality rates from 1990 through 2000, followed by a period of
stabilization, and then a recent negative turn over the past five years.
Page 23 of 126
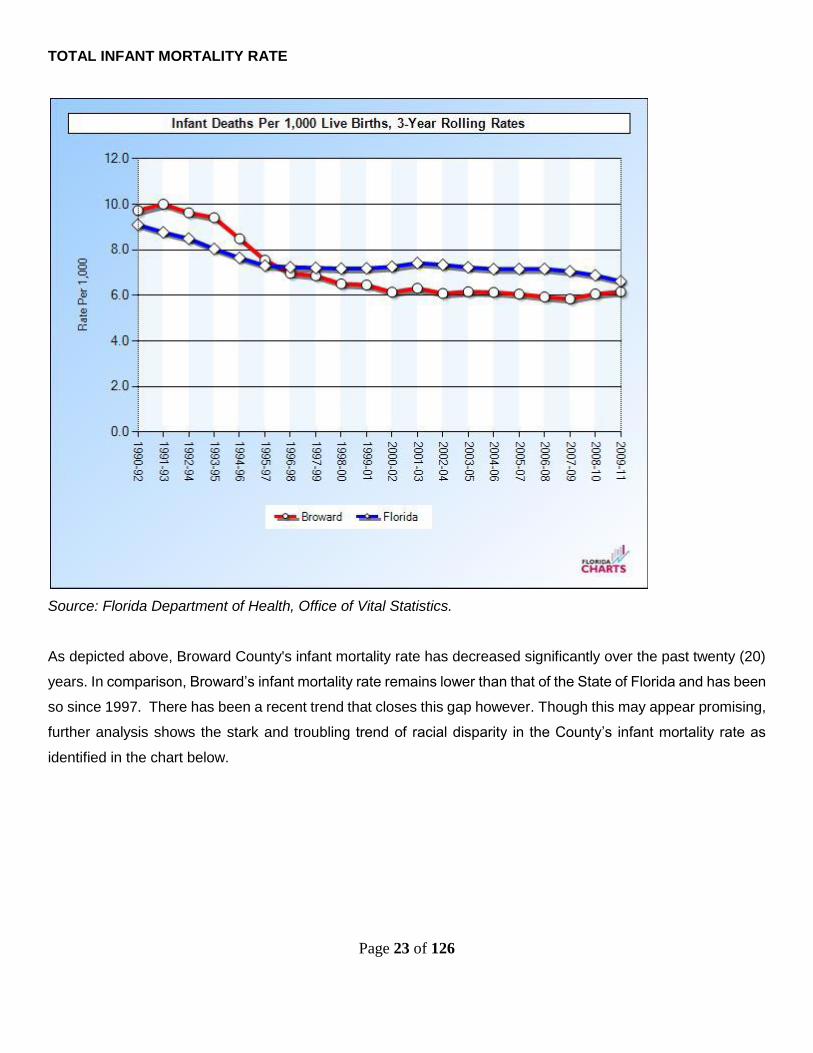
TOTAL INFANT MORTALITY RATE
Source: Florida Department of Health, Office of Vital Statistics.
As depicted above, Broward County's infant mortality rate has decreased significantly over the past twenty (20)
years. In comparison, Broward’s infant mortality rate remains lower than that of the State of Florida and has been
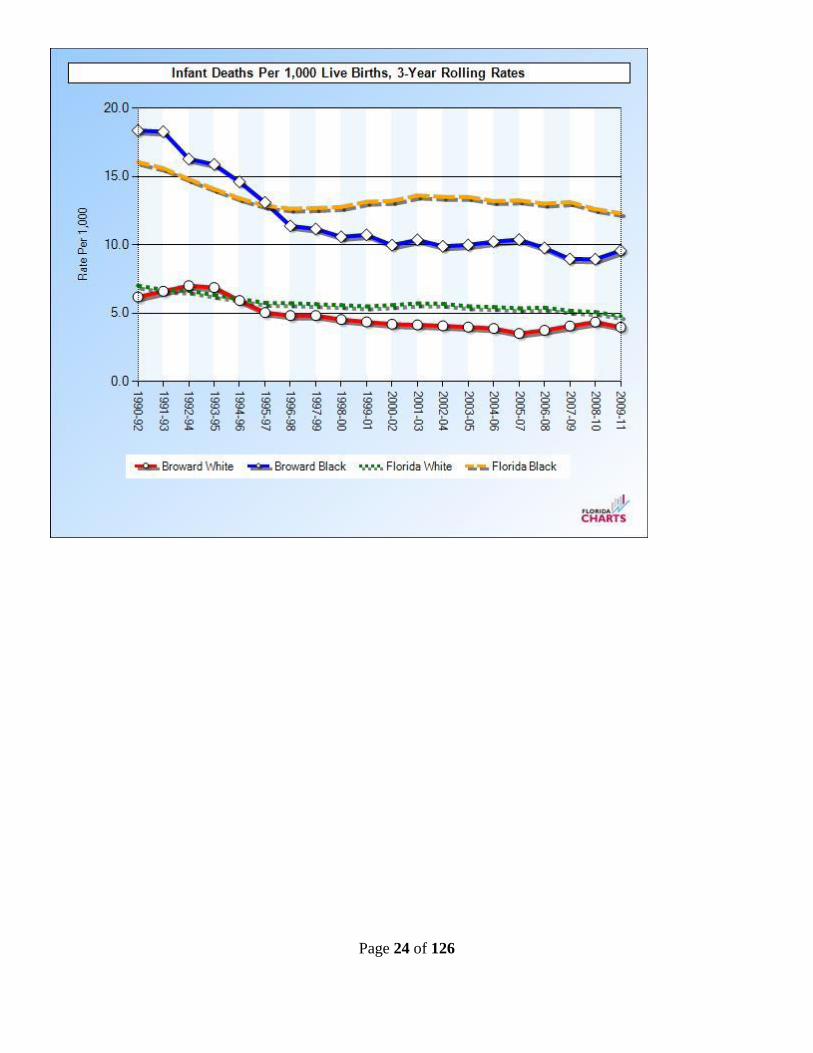
so since 1997. There has been a recent trend that closes this gap however. Though this may appear promising,
further analysis shows the stark and troubling trend of racial disparity in the County’s infant mortality rate as
identified in the chart below.
Page 24 of 126

Page 25 of 126
When infant mortality is drilled down by zip code and includes Hispanics and Haitians, a very different picture emerges.
2008-2010 Infant Mortality Rate per 1,000 Births
Source: FDOH, Office of Vital Statistics.
Zip
code All White Black Hispanic Haitian
33064 13.8 10.1 17.7 7.5 24.2
33065 11.3 8.0 21.7 8.0 14.9
33068 7.9 0.0 12.8 4.7 14.6
33309 7.2 3.2 4.5 8.2 16.9
33311 16.7 2.0 19.7 11.8 22.6
33312 9.8 9.7 6.7 9.1 22.5
33319 14.9 10.7 14.4 3.3 25.5
33351 7.4 8.9 6.8 5.1 26.8
Total 10.74 7.47 13.62 6.72 21.66
Data Source: Broward County Health Department
This data indicates that the disparity of infant mortality in the selected zip codes is nearly twice the rate for Blacks
as it is for Whites, but nearly three times the rate for Haitians as it is for Whites. This SDP will address the
alarmingly high rates of Infant Mortality for Haitians in our county as a subset of addressing mortality rates for all
races and ethnicities. . GIS mapping of these deaths is included as an attachment to this SDP, and bring a
disturbing pictorial to the data. Overall, Hispanics in Broward County fare well as compared to the overall rates,
and whites. As a result of this, efforts specifically noted in the previous SDP will be maintained, but Hispanics
will not be targeted as a special population in this SDP.
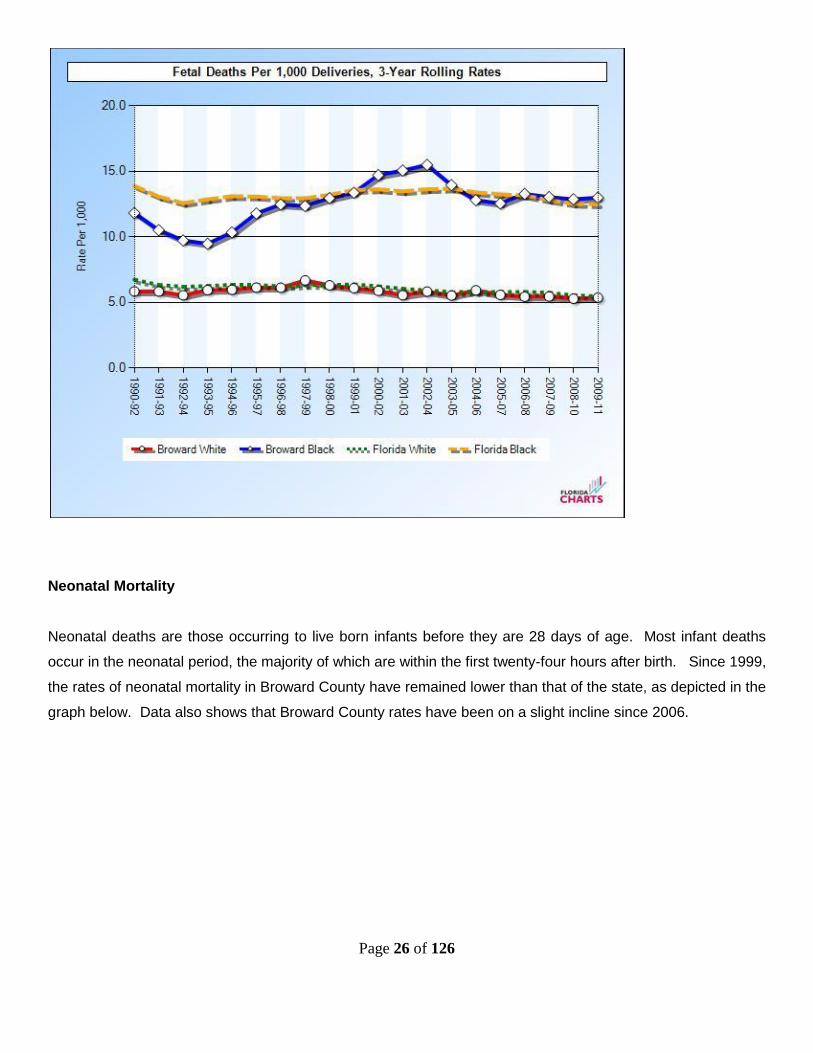
Fetal Mortality
Fetal Mortality is defined as the stillbirth of a baby more than 20 gestational weeks, born without signs of breath
or heartbeat. Broward’s rates for White Fetal deaths parallel those of the state during the past 15 years. The
Black Fetal deaths have fluctuated during this time, but the gap between White and Black remains significant as
identified in the graph below.
Page 26 of 126
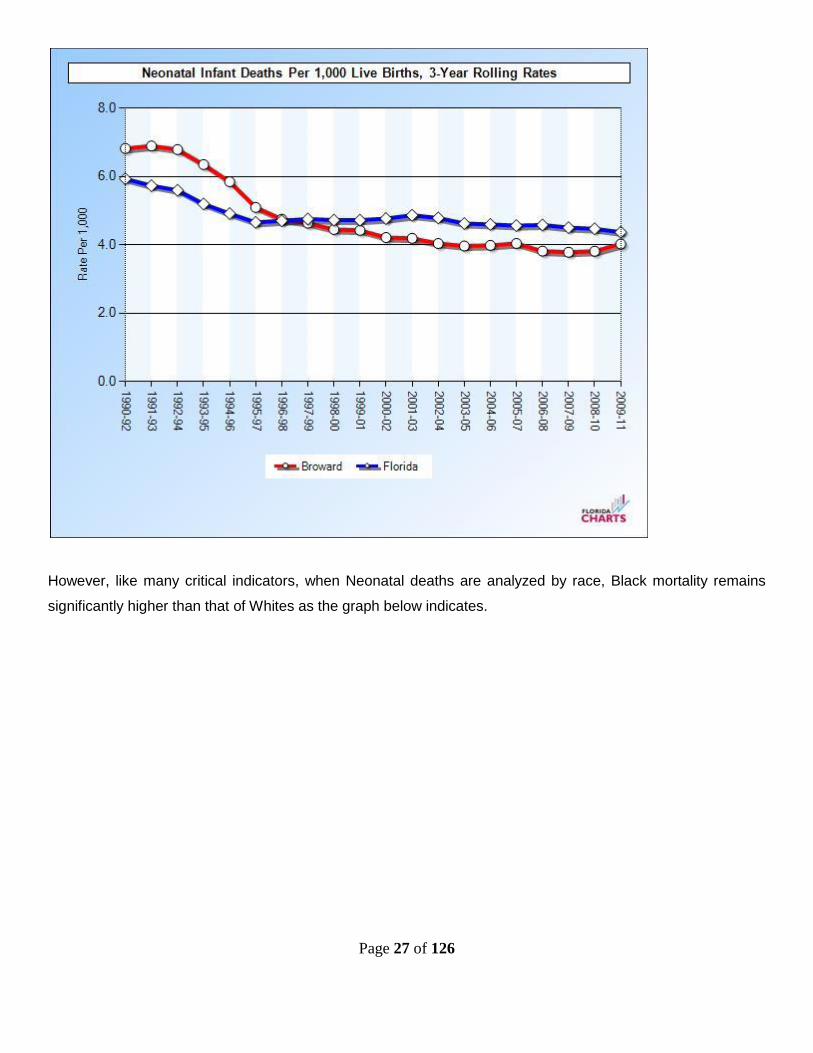
Neonatal Mortality
Neonatal deaths are those occurring to live born infants before they are 28 days of age. Most infant deaths
occur in the neonatal period, the majority of which are within the first twenty-four hours after birth. Since 1999,
the rates of neonatal mortality in Broward County have remained lower than that of the state, as depicted in the
graph below. Data also shows that Broward County rates have been on a slight incline since 2006.
Page 27 of 126
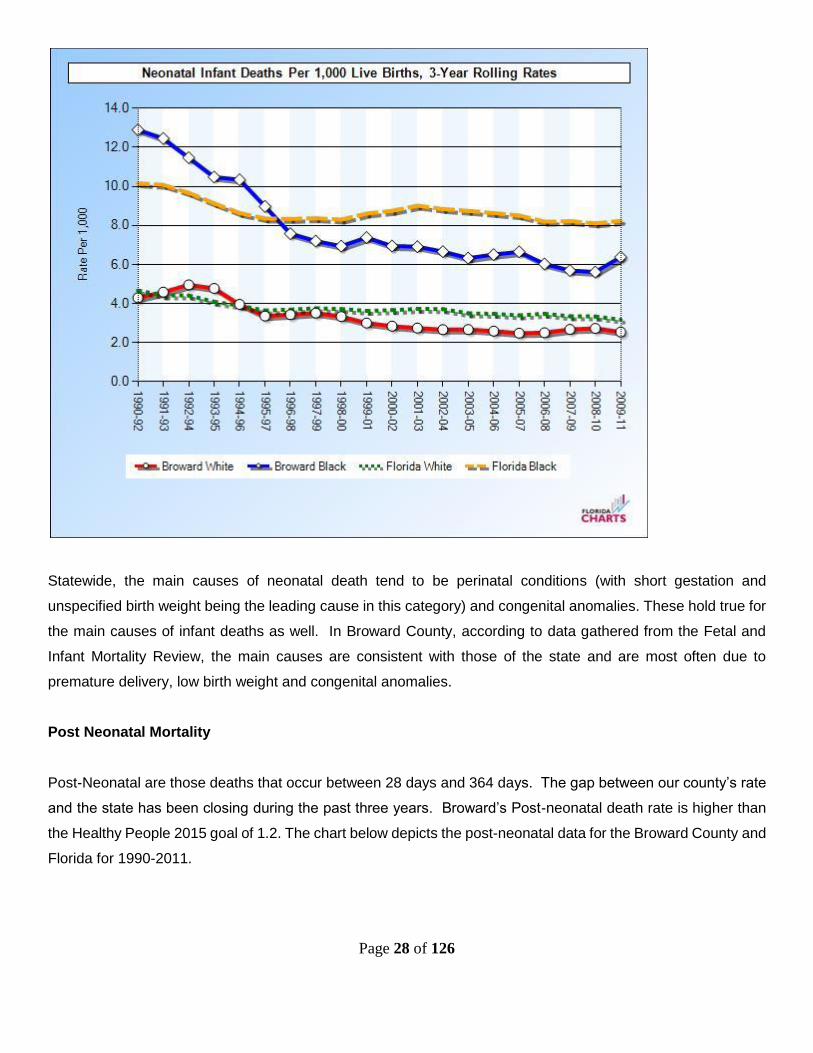
However, like many critical indicators, when Neonatal deaths are analyzed by race, Black mortality remains
significantly higher than that of Whites as the graph below indicates.
Page 28 of 126
Statewide, the main causes of neonatal death tend to be perinatal conditions (with short gestation and
unspecified birth weight being the leading cause in this category) and congenital anomalies. These hold true for
the main causes of infant deaths as well. In Broward County, according to data gathered from the Fetal and
Infant Mortality Review, the main causes are consistent with those of the state and are most often due to
premature delivery, low birth weight and congenital anomalies.
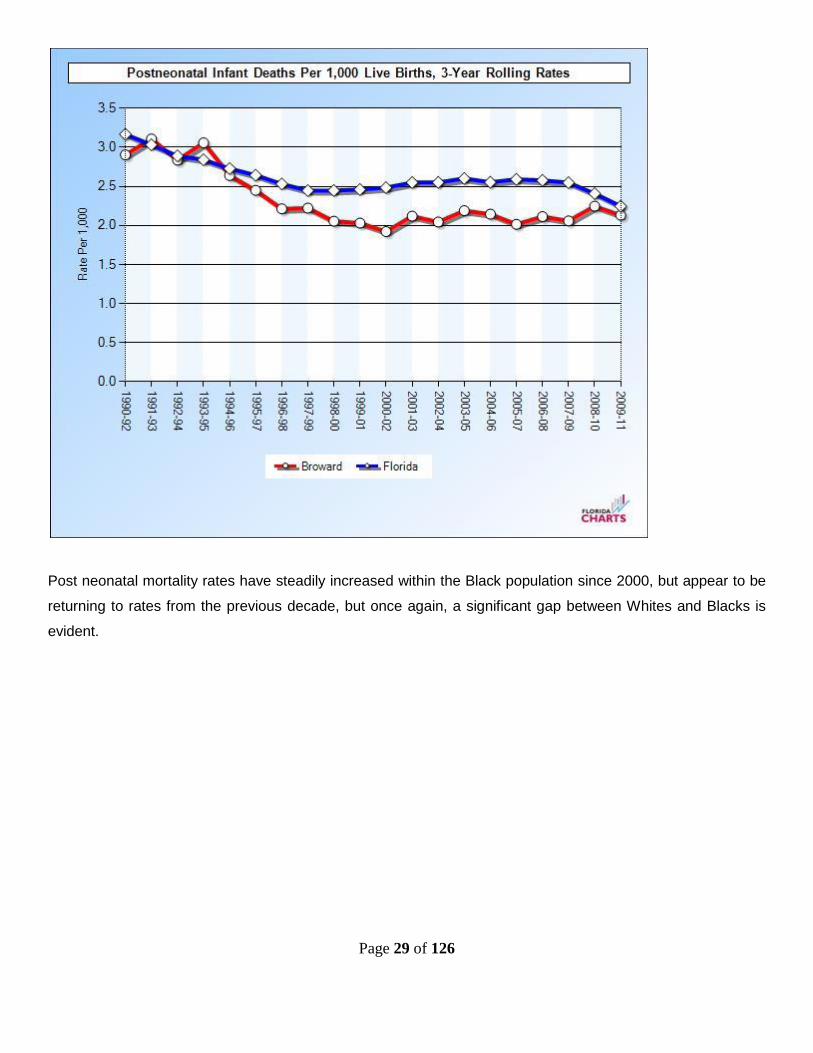
Post Neonatal Mortality
Post-Neonatal are those deaths that occur between 28 days and 364 days. The gap between our county’s rate
and the state has been closing during the past three years. Broward’s Post-neonatal death rate is higher than
the Healthy People 2015 goal of 1.2. The chart below depicts the post-neonatal data for the Broward County and
Florida for 1990-2011.
Page 29 of 126
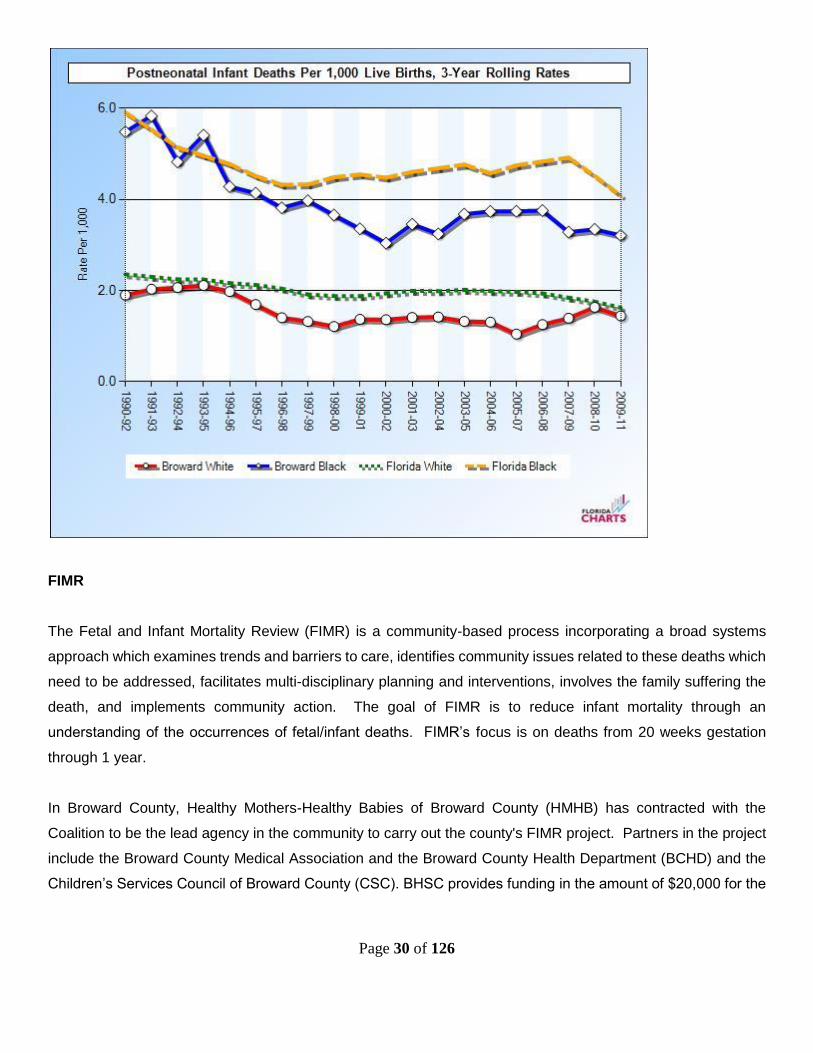
Post neonatal mortality rates have steadily increased within the Black population since 2000, but appear to be
returning to rates from the previous decade, but once again, a significant gap between Whites and Blacks is
evident.
Page 30 of 126
FIMR
The Fetal and Infant Mortality Review (FIMR) is a community-based process incorporating a broad systems
approach which examines trends and barriers to care, identifies community issues related to these deaths which
need to be addressed, facilitates multi-disciplinary planning and interventions, involves the family suffering the
death, and implements community action. The goal of FIMR is to reduce infant mortality through an
understanding of the occurrences of fetal/infant deaths. FIMR’s focus is on deaths from 20 weeks gestation
through 1 year.
In Broward County, Healthy Mothers-Healthy Babies of Broward County (HMHB) has contracted with the
Coalition to be the lead agency in the community to carry out the county's FIMR project. Partners in the project
include the Broward County Medical Association and the Broward County Health Department (BCHD) and the
Children’s Services Council of Broward County (CSC). BHSC provides funding in the amount of $20,000 for the
Page 31 of 126
review of 26 cases. The CSC provided HMHB with an additional $116,000 for the review of an additional 30
case reviews, and support for the project.
The Case Review Team (CRT) is the public health subcommittee of the Broward County Medical Association
and is comprised of obstetricians, pediatricians, the Broward County Medical Examiner's Office, pediatric and
obstetrical nurses, epidemiologist of the Broward County Health Department (BCHD) and other maternal and
child health staff, representatives from Children's Medical Services (CMS), and Healthy Start. The CRT meets
monthly, reviewing a random sample of 4-5 cases each month. In addition, families of the infants are interviewed
to complement information from the record review. It is important to note that this is not an epidemiological
research study; rather, it is a community's study to look at cases with the worst outcomes in order to gain
information to plan preventive actions for the future. The local health department assists in this process by
providing the perinatal Periods of Risk (PPOR) data that is utilized in determining case selection.
From January through December 2011 the Case Review Team (CRT) reviewed 45 cases that had been
abstracted in depth by the FIMR Medical Abstractor. Of the 45 cases reviewed, 29% were White deaths, and
69% were Black deaths.
Below is a synopsis of some of the factors present in these 45 reviewed cases. Based on this sampling and
findings, the factors identified are observed to be those most statistically evident and indicative of social and
medical implications during that span. Only 15% (7) of the cases went past 39 weeks gestation. Preterm births
are the greatest contributing factor to infant mortality.
18 of the cases appeared to be preventable (see page 9 of report), 8 were Sudden Infant Death in Infancy (SUID)
and medical complications were a major factor in the balance of the cases. The preventable deaths reviewed by
the CRT make up approximately 5% of all births in the county. While useful information can be gleaned from
these reviews, the small sampling of preventable deaths, and the intentional use of PPOR raise a cautionary
flag when attempting to draw conclusions relative to the overall birth population in the community.
Page 32 of 126
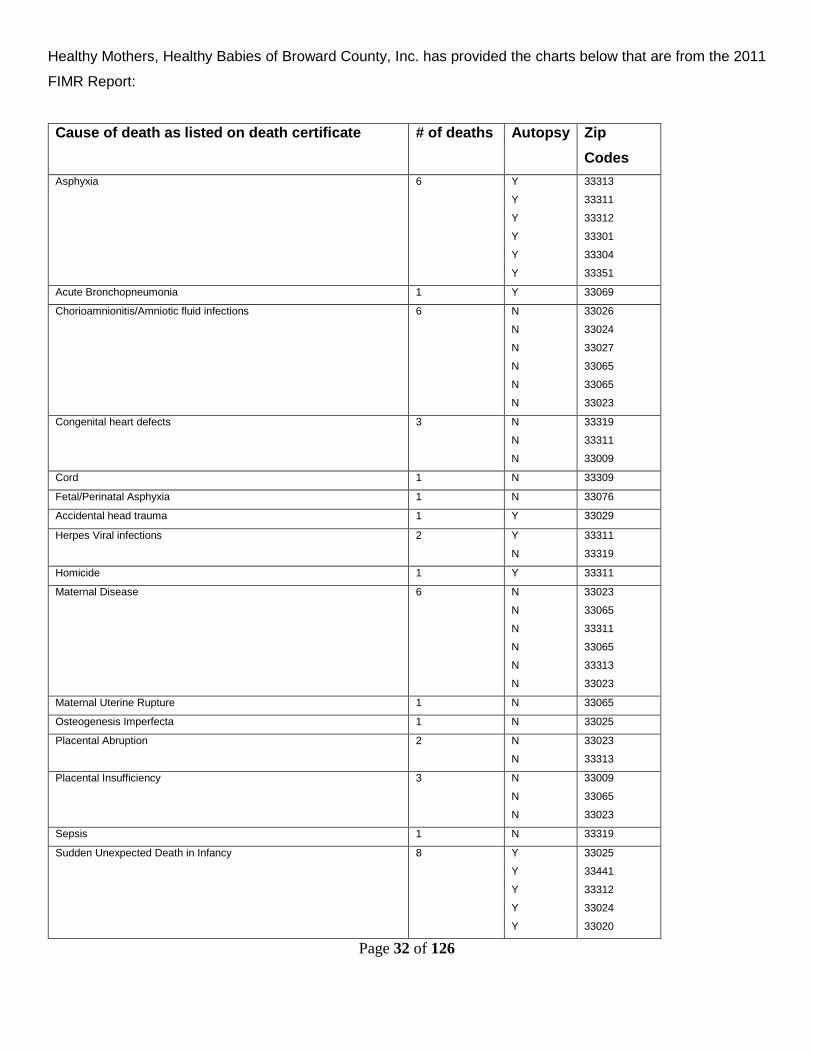
Healthy Mothers, Healthy Babies of Broward County, Inc. has provided the charts below that are from the 2011
FIMR Report:
Cause of death as listed on death certificate # of deaths Autopsy Zip
Codes
Asphyxia 6 Y
Y
Y
Y
Y
Y
33313
33311
33312
33301
33304
33351
Acute Bronchopneumonia 1 Y 33069
Chorioamnionitis/Amniotic fluid infections 6 N
N
N
N
N
N
33026
33024
33027
33065
33065
33023
Congenital heart defects 3 N
N
N
33319
33311
33009
Cord 1 N 33309
Fetal/Perinatal Asphyxia 1 N 33076
Accidental head trauma 1 Y 33029
Herpes Viral infections 2 Y
N
33311
33319
Homicide 1 Y 33311
Maternal Disease 6 N
N
N
N
N
N
33023
33065
33311
33065
33313
33023
Maternal Uterine Rupture 1 N 33065
Osteogenesis Imperfecta 1 N 33025
Placental Abruption 2 N
N
33023
33313
Placental Insufficiency 3 N
N
N
33009
33065
33023
Sepsis 1 N 33319
Sudden Unexpected Death in Infancy 8 Y
Y
Y
Y
Y
33025
33441
33312
33024
33020
Page 33 of 126
Y
Y
Y
33319
33311
33311
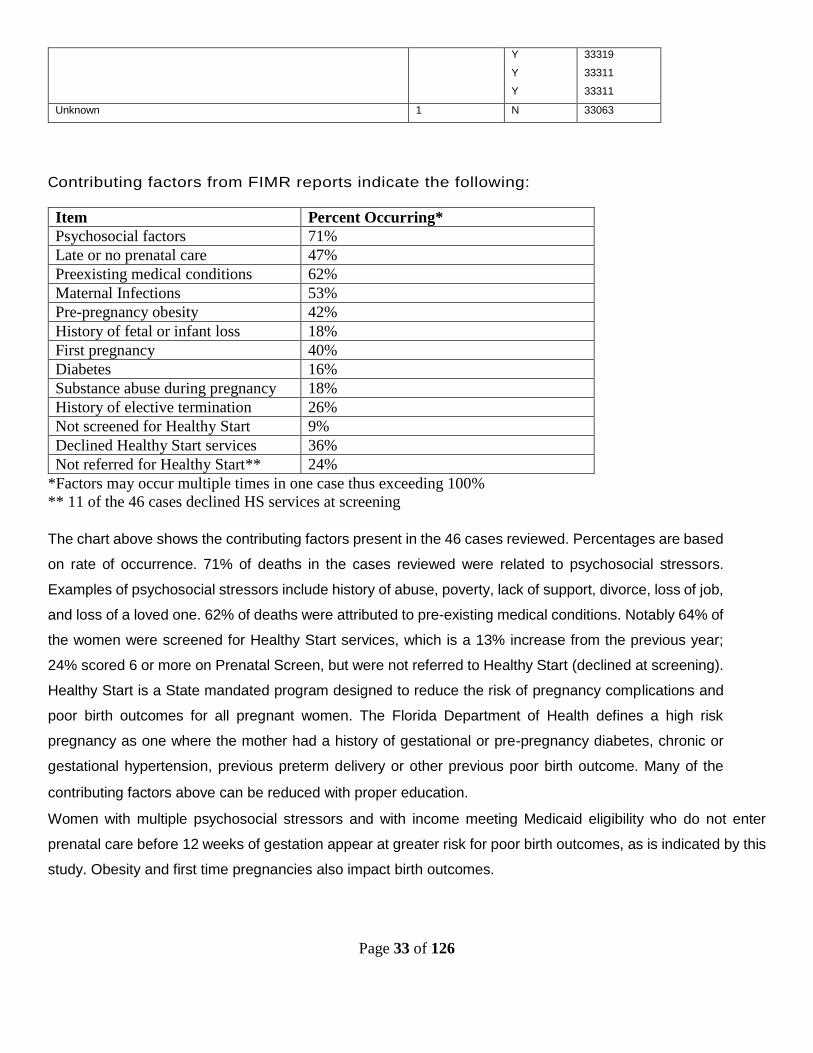
Unknown 1 N 33063
Contributing factors from FIMR reports indicate the following:
Item Percent Occurring*
Psychosocial factors 71%
Late or no prenatal care 47%
Preexisting medical conditions 62%
Maternal Infections 53%
Pre-pregnancy obesity 42%
History of fetal or infant loss 18%
First pregnancy 40%
Diabetes 16%
Substance abuse during pregnancy 18%
History of elective termination 26%
Not screened for Healthy Start 9%
Declined Healthy Start services 36%
Not referred for Healthy Start** 24%
*Factors may occur multiple times in one case thus exceeding 100%
** 11 of the 46 cases declined HS services at screening
The chart above shows the contributing factors present in the 46 cases reviewed. Percentages are based
on rate of occurrence. 71% of deaths in the cases reviewed were related to psychosocial stressors.
Examples of psychosocial stressors include history of abuse, poverty, lack of support, divorce, loss of job,
and loss of a loved one. 62% of deaths were attributed to pre-existing medical conditions. Notably 64% of
the women were screened for Healthy Start services, which is a 13% increase from the previous year;
24% scored 6 or more on Prenatal Screen, but were not referred to Healthy Start (declined at screening).
Healthy Start is a State mandated program designed to reduce the risk of pregnancy complications and
poor birth outcomes for all pregnant women. The Florida Department of Health defines a high risk
pregnancy as one where the mother had a history of gestational or pre-pregnancy diabetes, chronic or
gestational hypertension, previous preterm delivery or other previous poor birth outcome. Many of the
contributing factors above can be reduced with proper education.ual Report 2011
Women with multiple psychosocial stressors and with income meeting Medicaid eligibility who do not enter
prenatal care before 12 weeks of gestation appear at greater risk for poor birth outcomes, as is indicated by this
study. Obesity and first time pregnancies also impact birth outcomes.
Page 34 of 126
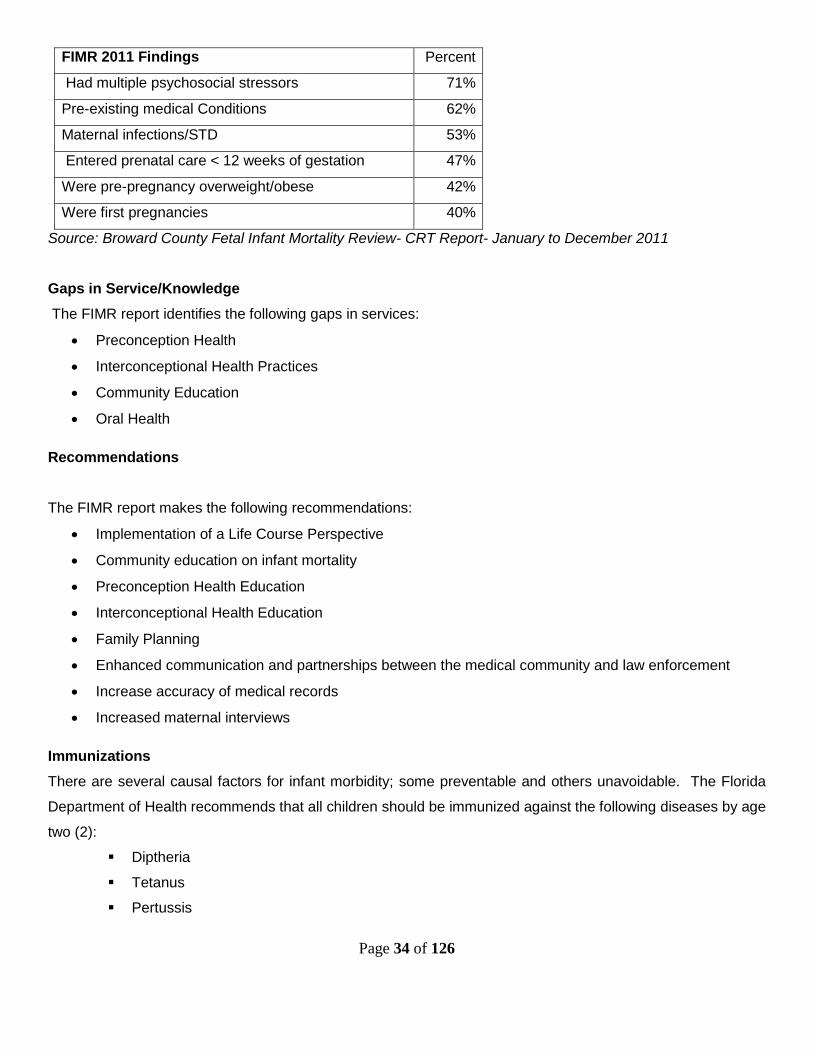
FIMR 2011 Findings Percent
Had multiple psychosocial stressors 71%
Pre-existing medical Conditions 62%
Maternal infections/STD 53%
Entered prenatal care < 12 weeks of gestation 47%
Were pre-pregnancy overweight/obese 42%
Were first pregnancies 40%
Source: Broward County Fetal Infant Mortality Review- CRT Report- January to December 2011
Gaps in Service/Knowledge
The FIMR report identifies the following gaps in services:
Preconception Health
Interconceptional Health Practices
Community Education
Oral Health
Recommendations
The FIMR report makes the following recommendations:
Implementation of a Life Course Perspective
Community education on infant mortality
Preconception Health Education
Interconceptional Health Education
Family Planning
Enhanced communication and partnerships between the medical community and law enforcement
Increase accuracy of medical records
Increased maternal interviews
Immunizations
There are several causal factors for infant morbidity; some preventable and others unavoidable. The Florida
Department of Health recommends that all children should be immunized against the following diseases by age
two (2):
Diptheria
Tetanus
Pertussis
Page 35 of 126
Hepatitis B
Influenza type b
Measles
Mumps
Rubella
Polio
Pneumococcal Conjugate
Varicella
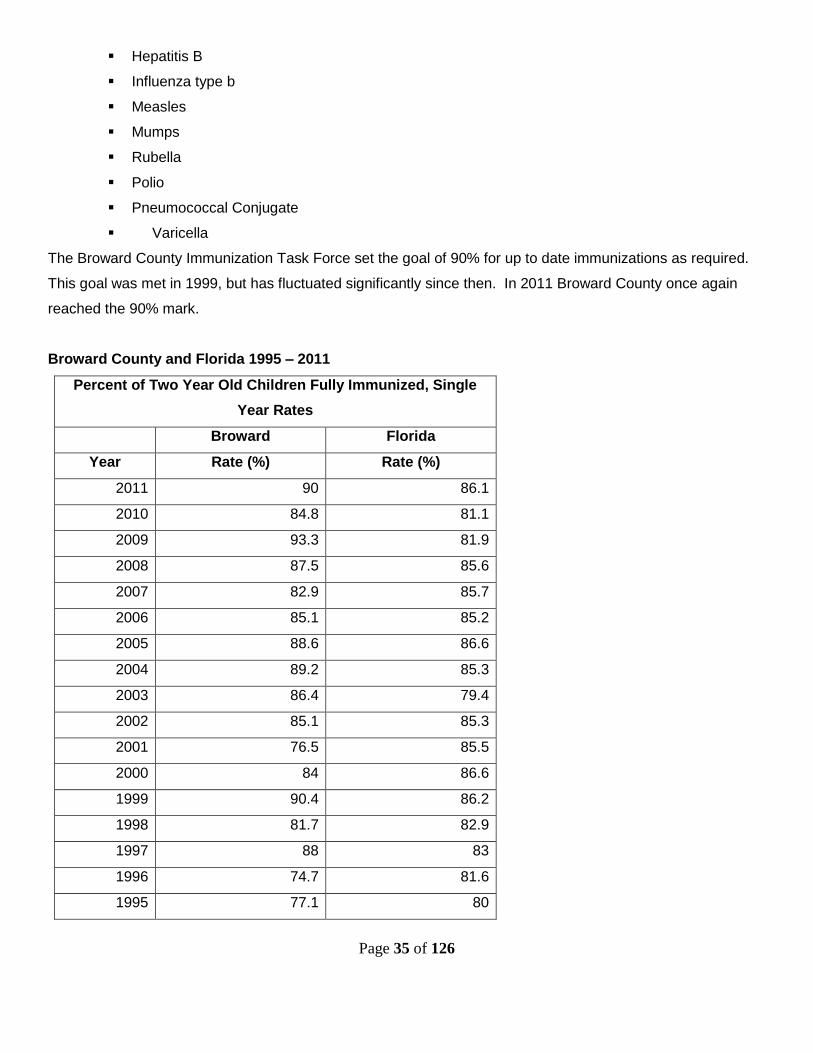
The Broward County Immunization Task Force set the goal of 90% for up to date immunizations as required.
This goal was met in 1999, but has fluctuated significantly since then. In 2011 Broward County once again
reached the 90% mark.
Broward County and Florida 1995 – 2011
Percent of Two Year Old Children Fully Immunized, Single
Year Rates
Broward Florida
Year Rate (%) Rate (%)
2011 90 86.1
2010 84.8 81.1
2009 93.3 81.9
2008 87.5 85.6
2007 82.9 85.7
2006 85.1 85.2
2005 88.6 86.6
2004 89.2 85.3
2003 86.4 79.4
2002 85.1 85.3
2001 76.5 85.5
2000 84 86.6
1999 90.4 86.2
1998 81.7 82.9
1997 88 83
1996 74.7 81.6
1995 77.1 80
Page 36 of 126
Source: Broward County Health Department, Survey of Immunization Levels in Two-Year Old Children and
Florida Charts
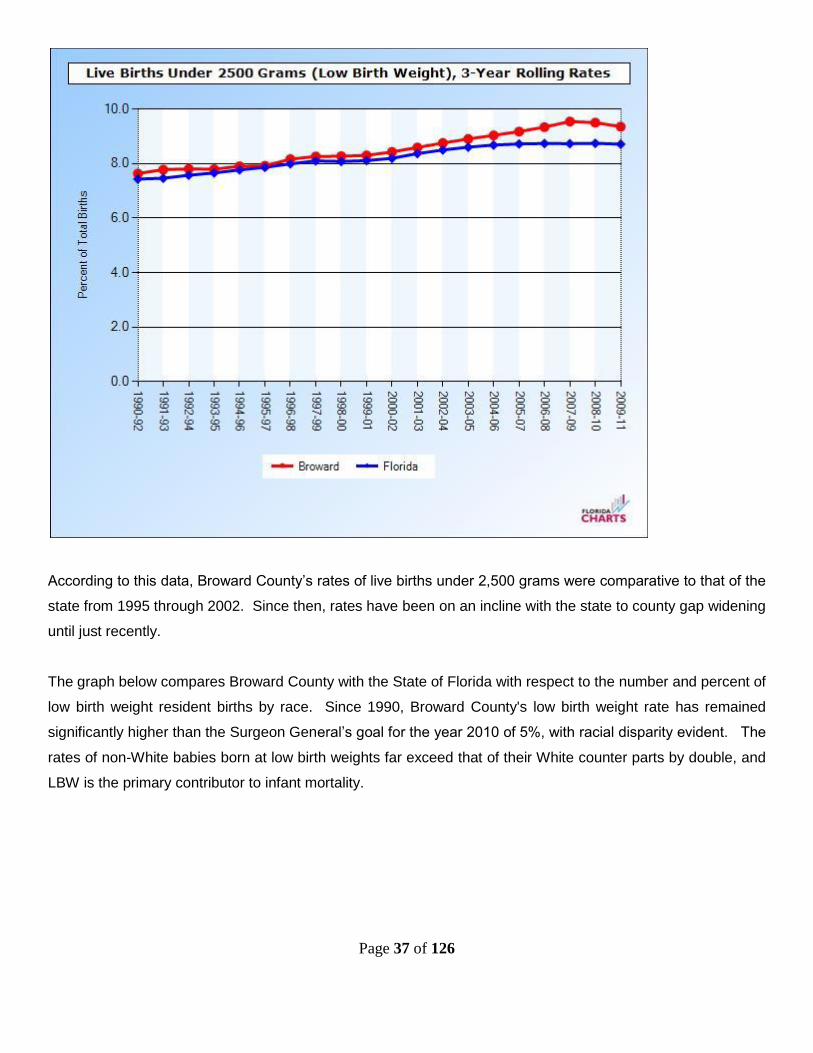
Low Birth Weight Births
According to the United States Department of Health and Human Services, low birth weight is the risk factor
most closely associated with neonatal deaths. Consequently, improvements in infant birth weight can contribute
substantially to a reduction in infant death rates. Babies born at less than 2,500 grams are within this category.
Low birth weight babies often survive as children with various neurosensory, developmental, health and
psychosocial problems.
Prematurity is often the cause of low birth weight. Prior delivery of a preterm baby is a strong predictor of a low
birth weight in subsequent deliveries. Prenatal care, good nutrition and other maternal health behaviors and
effective education can positively impact birth weight.
The Healthy People 2015 objective aims to achieve a reality in which the percentage of low birth weight babies
will be no more than 5%. The graphs below depict the rates of babies born at less than 2,500 grams per 1,000
born in Broward County, as compared to the state of Florida, and by race.
Page 37 of 126
According to this data, Broward County’s rates of live births under 2,500 grams were comparative to that of the
state from 1995 through 2002. Since then, rates have been on an incline with the state to county gap widening
until just recently.
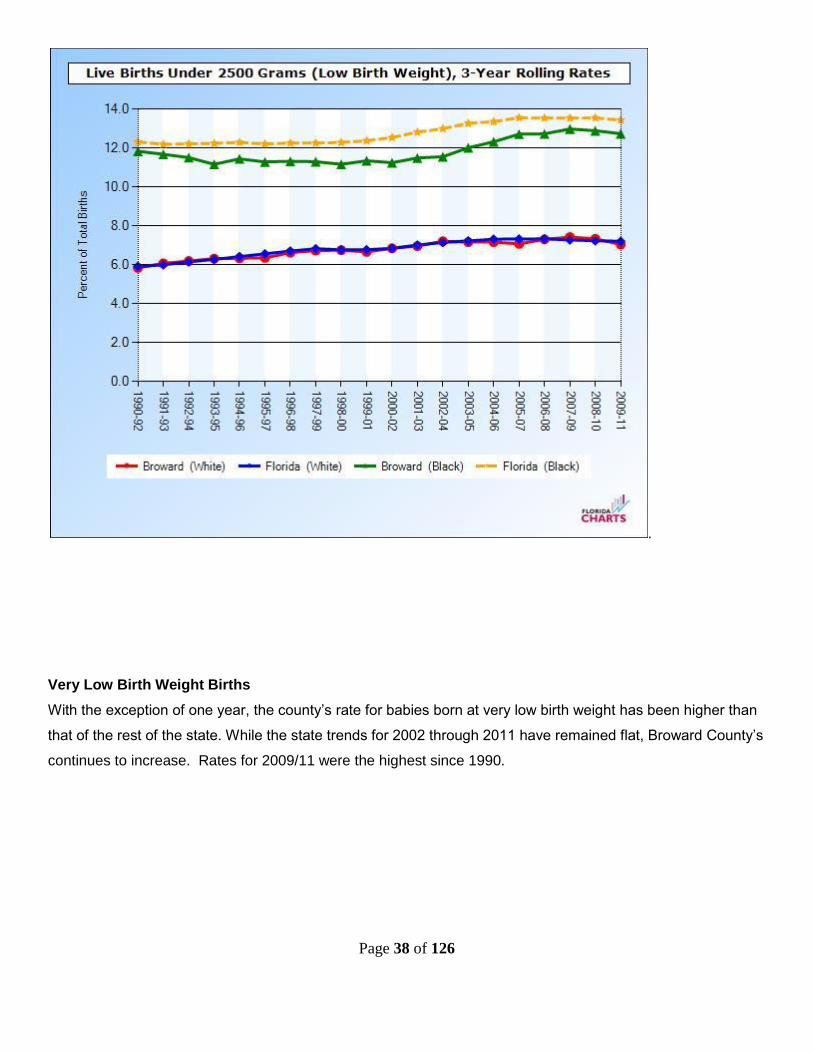
The graph below compares Broward County with the State of Florida with respect to the number and percent of
low birth weight resident births by race. Since 1990, Broward County's low birth weight rate has remained
significantly higher than the Surgeon General’s goal for the year 2010 of 5%, with racial disparity evident. The
rates of non-White babies born at low birth weights far exceed that of their White counter parts by double, and
LBW is the primary contributor to infant mortality.
Page 38 of 126
.
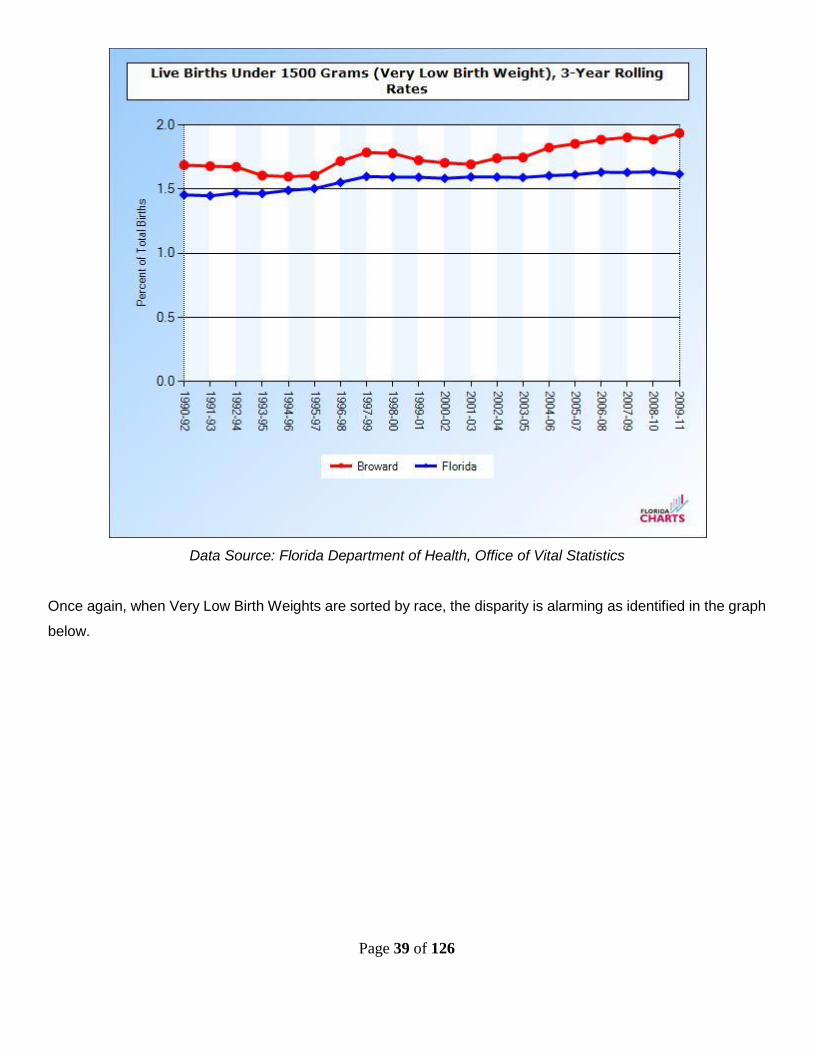
Very Low Birth Weight Births
With the exception of one year, the county’s rate for babies born at very low birth weight has been higher than
that of the rest of the state. While the state trends for 2002 through 2011 have remained flat, Broward County’s
continues to increase. Rates for 2009/11 were the highest since 1990.
Page 39 of 126
Data Source: Florida Department of Health, Office of Vital Statistics
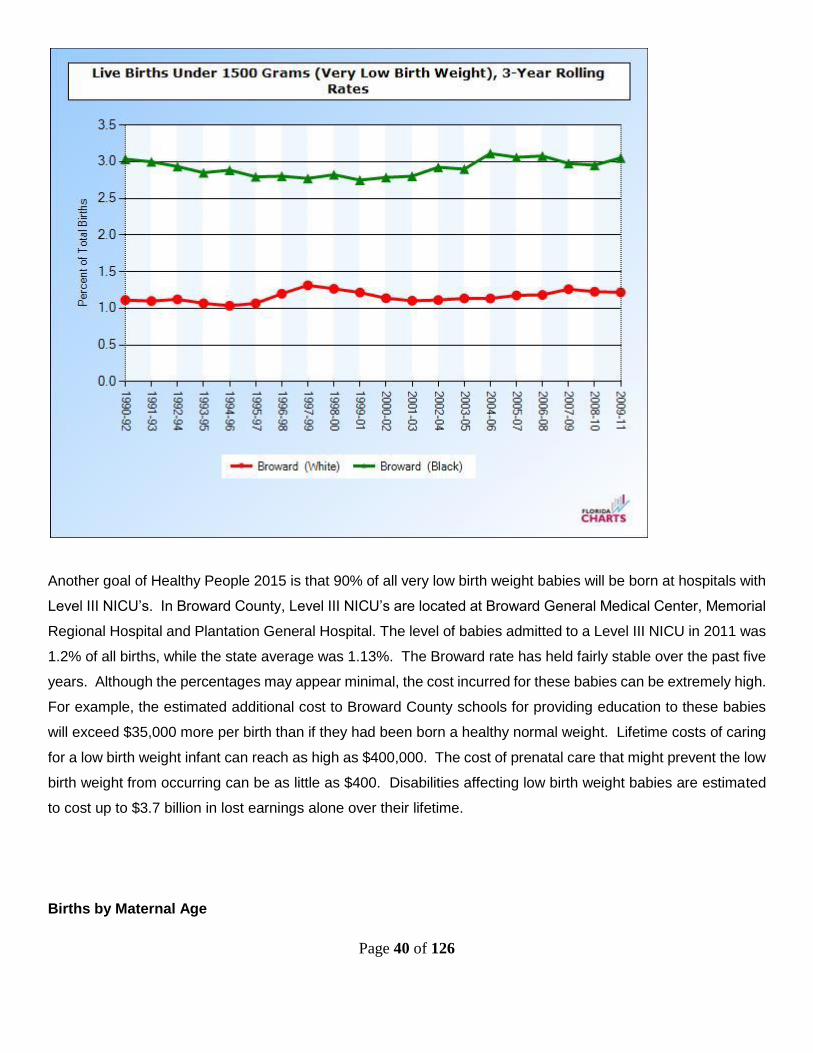
Once again, when Very Low Birth Weights are sorted by race, the disparity is alarming as identified in the graph
below.
Page 40 of 126
Another goal of Healthy People 2015 is that 90% of all very low birth weight babies will be born at hospitals with
Level III NICU’s. In Broward County, Level III NICU’s are located at Broward General Medical Center, Memorial
Regional Hospital and Plantation General Hospital. The level of babies admitted to a Level III NICU in 2011 was
1.2% of all births, while the state average was 1.13%. The Broward rate has held fairly stable over the past five
years. Although the percentages may appear minimal, the cost incurred for these babies can be extremely high.
For example, the estimated additional cost to Broward County schools for providing education to these babies
will exceed $35,000 more per birth than if they had been born a healthy normal weight. Lifetime costs of caring
for a low birth weight infant can reach as high as $400,000. The cost of prenatal care that might prevent the low
birth weight from occurring can be as little as $400. Disabilities affecting low birth weight babies are estimated
to cost up to $3.7 billion in lost earnings alone over their lifetime.
Births by Maternal Age
Page 41 of 126
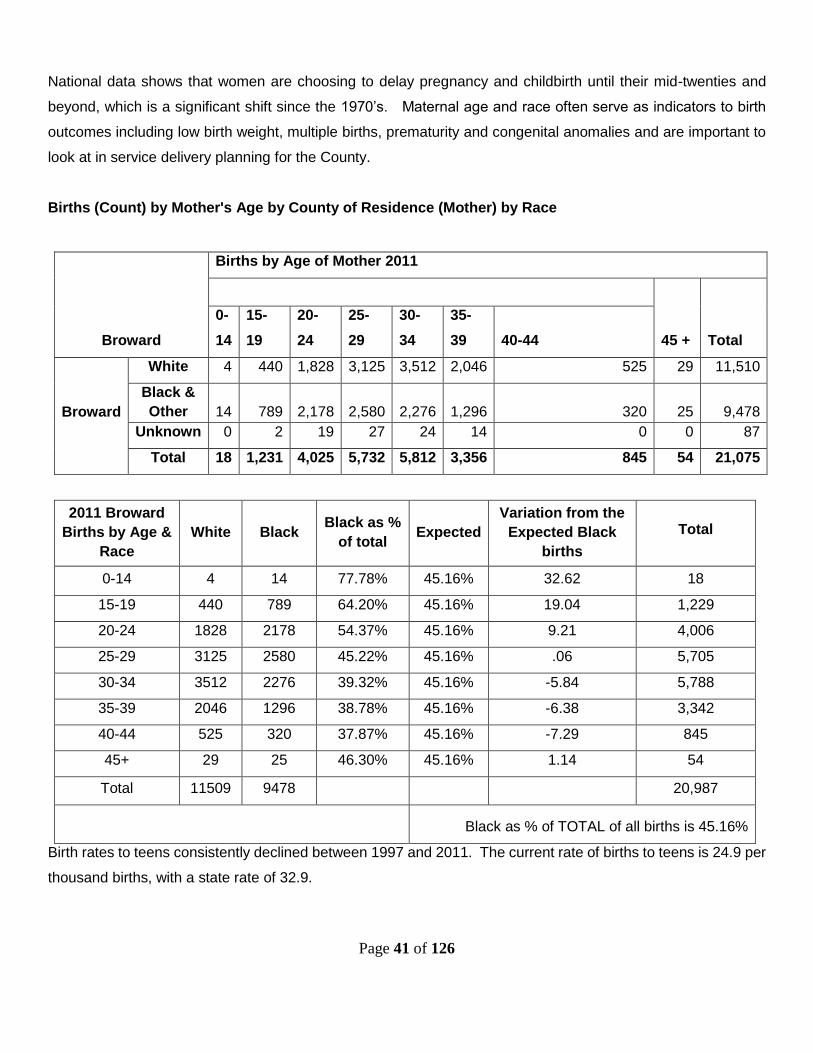
National data shows that women are choosing to delay pregnancy and childbirth until their mid-twenties and
beyond, which is a significant shift since the 1970’s. Maternal age and race often serve as indicators to birth
outcomes including low birth weight, multiple births, prematurity and congenital anomalies and are important to
look at in service delivery planning for the County.
Births (Count) by Mother's Age by County of Residence (Mother) by Race
Broward
Births by Age of Mother 2011
45 + Total
0-
14
15-
19
20-
24
25-
29
30-
34
35-
39 40-44
Broward
White 4 440 1,828 3,125 3,512 2,046 525 29 11,510
Black &
Other 14 789 2,178 2,580 2,276 1,296 320 25 9,478
Unknown 0 2 19 27 24 14 0 0 87
Total 18 1,231 4,025 5,732 5,812 3,356 845 54 21,075
2011 Broward
Births by Age &
Race
White Black Black as %
of total Expected
Variation from the
Expected Black
births
Total
0-14 4 14 77.78% 45.16% 32.62 18
15-19 440 789 64.20% 45.16% 19.04 1,229
20-24 1828 2178 54.37% 45.16% 9.21 4,006
25-29 3125 2580 45.22% 45.16% .06 5,705
30-34 3512 2276 39.32% 45.16% -5.84 5,788
35-39 2046 1296 38.78% 45.16% -6.38 3,342
40-44 525 320 37.87% 45.16% -7.29 845
45+ 29 25 46.30% 45.16% 1.14 54
Total 11509 9478 20,987
Black as % of TOTAL of all births is 45.16%
Birth rates to teens consistently declined between 1997 and 2011. The current rate of births to teens is 24.9 per
thousand births, with a state rate of 32.9.
Page 42 of 126
Teen birth rates remain lower than they were twenty years ago, and for fifteen years, Broward county’s rates
have declined consistently. Teenage mothers are more likely than older women to receive inadequate prenatal
care, experience inadequate weight gain, experience maternal anemia and pregnancy induced hypertension.
Complications of labor and delivery such as fetal distress are also reportedly more common among teenagers.
Babies born to teenagers are at an increased risk for low birth weight, preterm birth, newborn anemia, respiratory
distress syndrome, meconium aspiration and assisted ventilation.
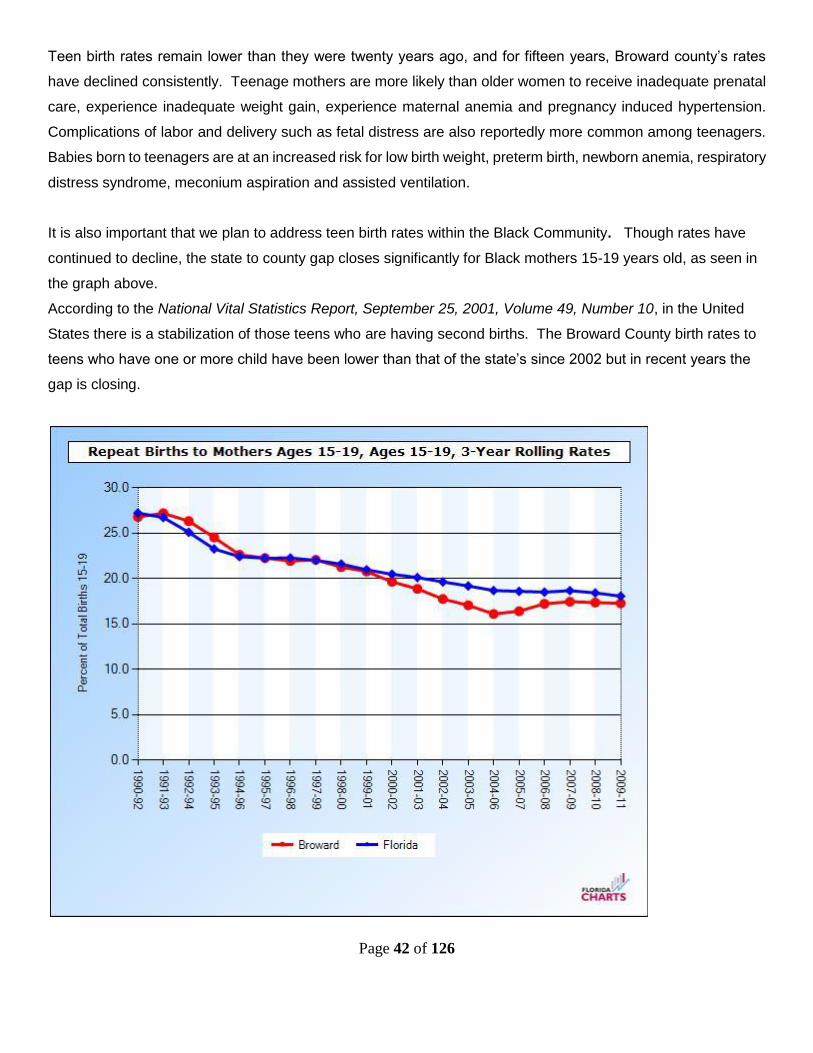
It is also important that we plan to address teen birth rates within the Black Community. Though rates have
continued to decline, the state to county gap closes significantly for Black mothers 15-19 years old, as seen in
the graph above.
According to the National Vital Statistics Report, September 25, 2001, Volume 49, Number 10, in the United
States there is a stabilization of those teens who are having second births. The Broward County birth rates to
teens who have one or more child have been lower than that of the state’s since 2002 but in recent years the
gap is closing.
Page 43 of 126
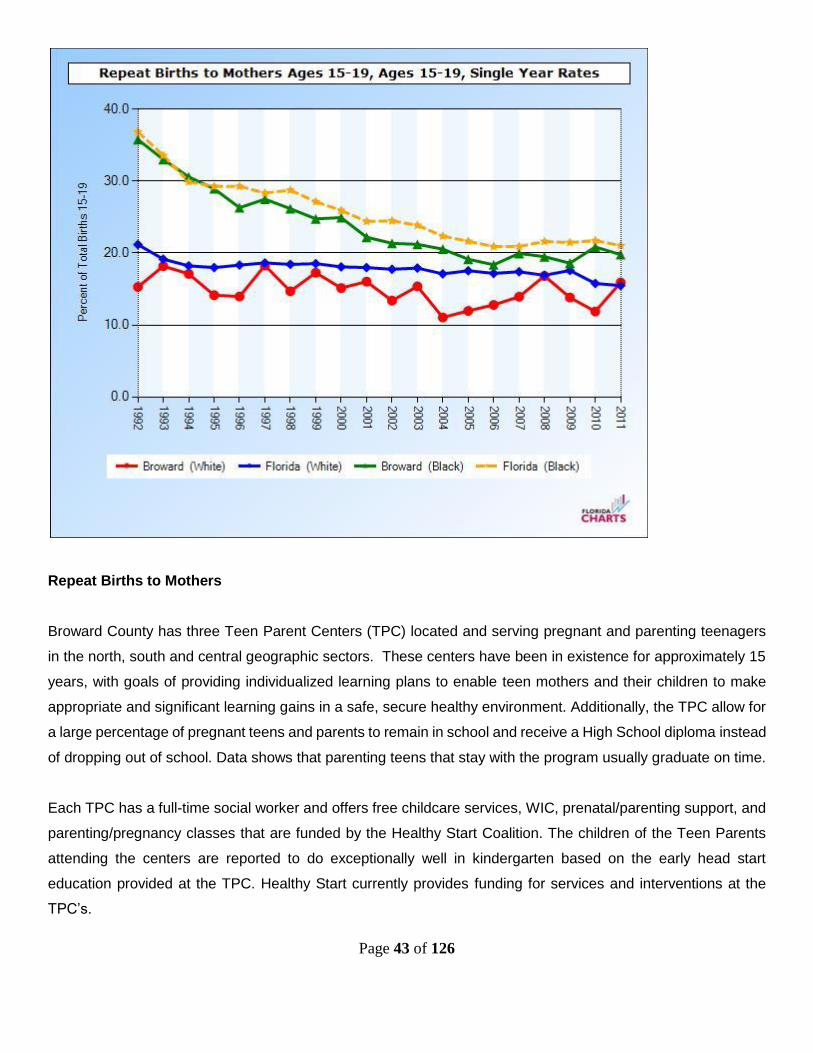
Repeat Births to Mothers
Broward County has three Teen Parent Centers (TPC) located and serving pregnant and parenting teenagers
in the north, south and central geographic sectors. These centers have been in existence for approximately 15
years, with goals of providing individualized learning plans to enable teen mothers and their children to make
appropriate and significant learning gains in a safe, secure healthy environment. Additionally, the TPC allow for
a large percentage of pregnant teens and parents to remain in school and receive a High School diploma instead
of dropping out of school. Data shows that parenting teens that stay with the program usually graduate on time.
Each TPC has a full-time social worker and offers free childcare services, WIC, prenatal/parenting support, and
parenting/pregnancy classes that are funded by the Healthy Start Coalition. The children of the Teen Parents
attending the centers are reported to do exceptionally well in kindergarten based on the early head start
education provided at the TPC. Healthy Start currently provides funding for services and interventions at the
TPC’s.
Page 44 of 126
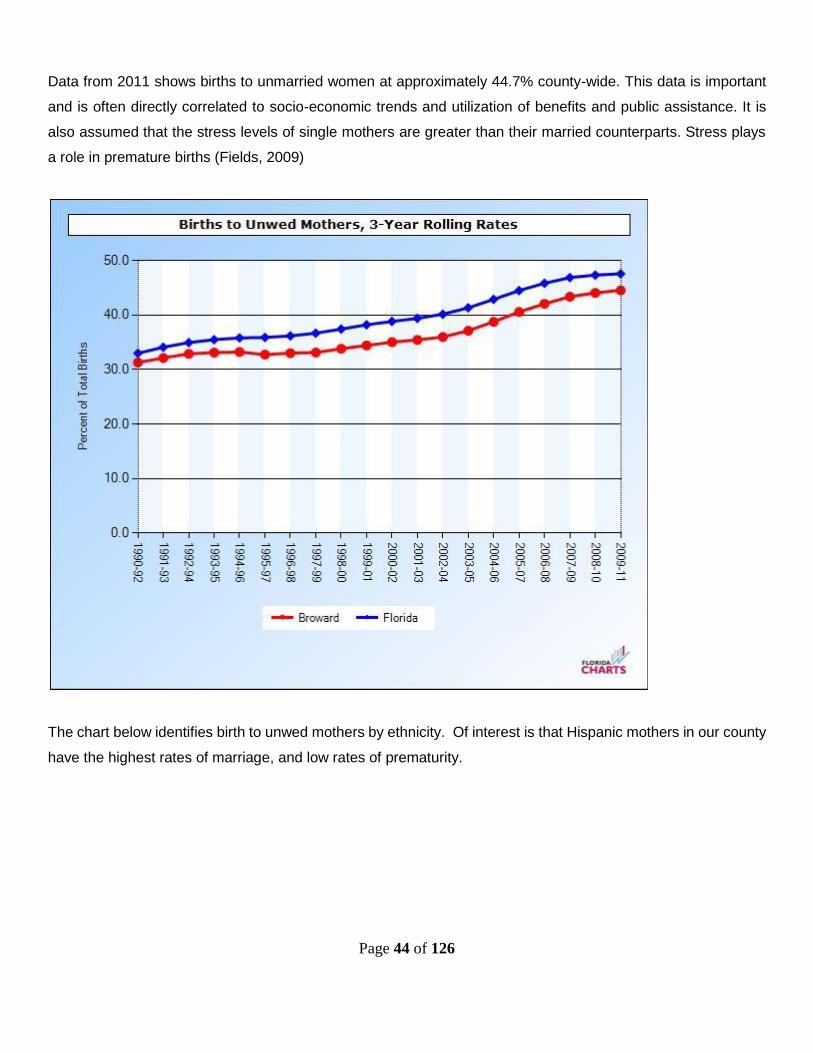
Data from 2011 shows births to unmarried women at approximately 44.7% county-wide. This data is important
and is often directly correlated to socio-economic trends and utilization of benefits and public assistance. It is
also assumed that the stress levels of single mothers are greater than their married counterparts. Stress plays
a role in premature births (Fields, 2009)
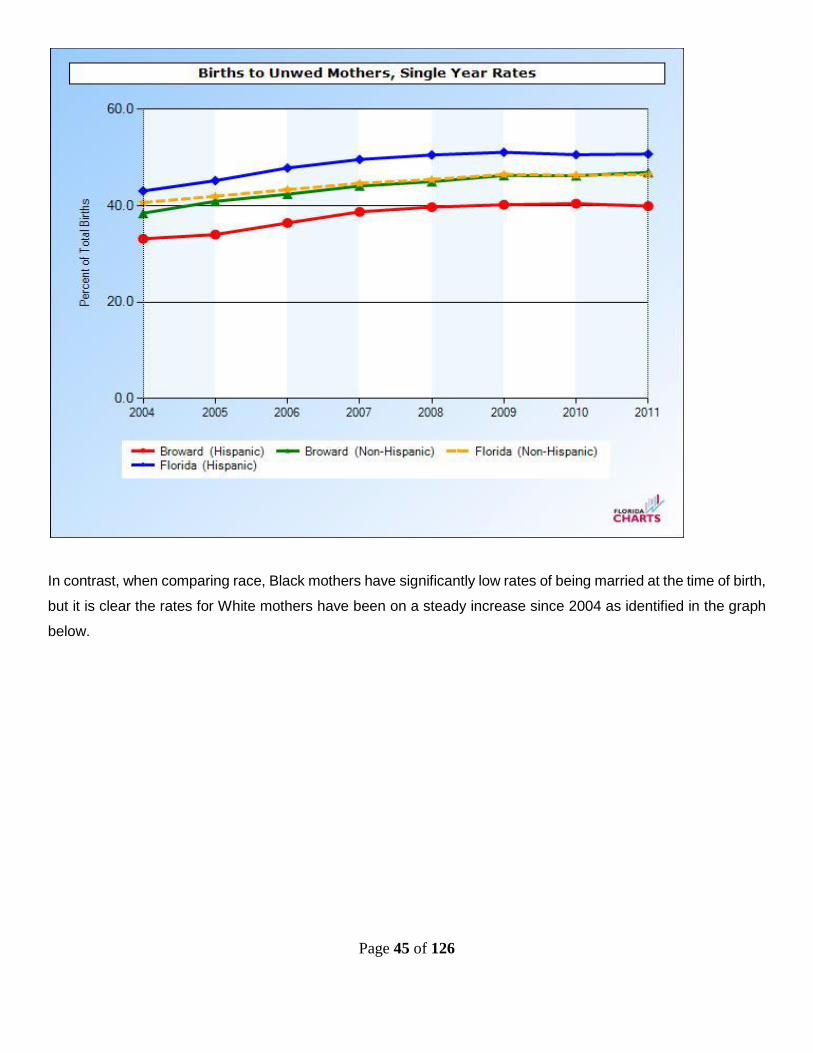
The chart below identifies birth to unwed mothers by ethnicity. Of interest is that Hispanic mothers in our county
have the highest rates of marriage, and low rates of prematurity.
Page 45 of 126
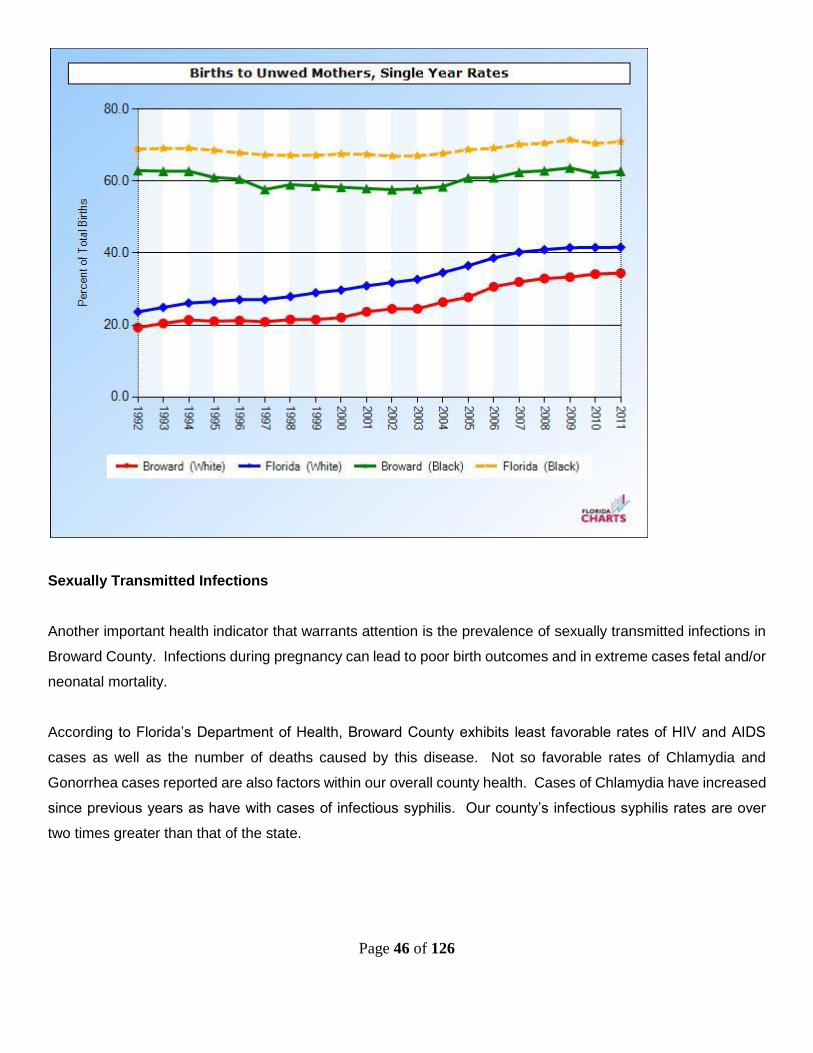
In contrast, when comparing race, Black mothers have significantly low rates of being married at the time of birth,
but it is clear the rates for White mothers have been on a steady increase since 2004 as identified in the graph
below.
Page 46 of 126
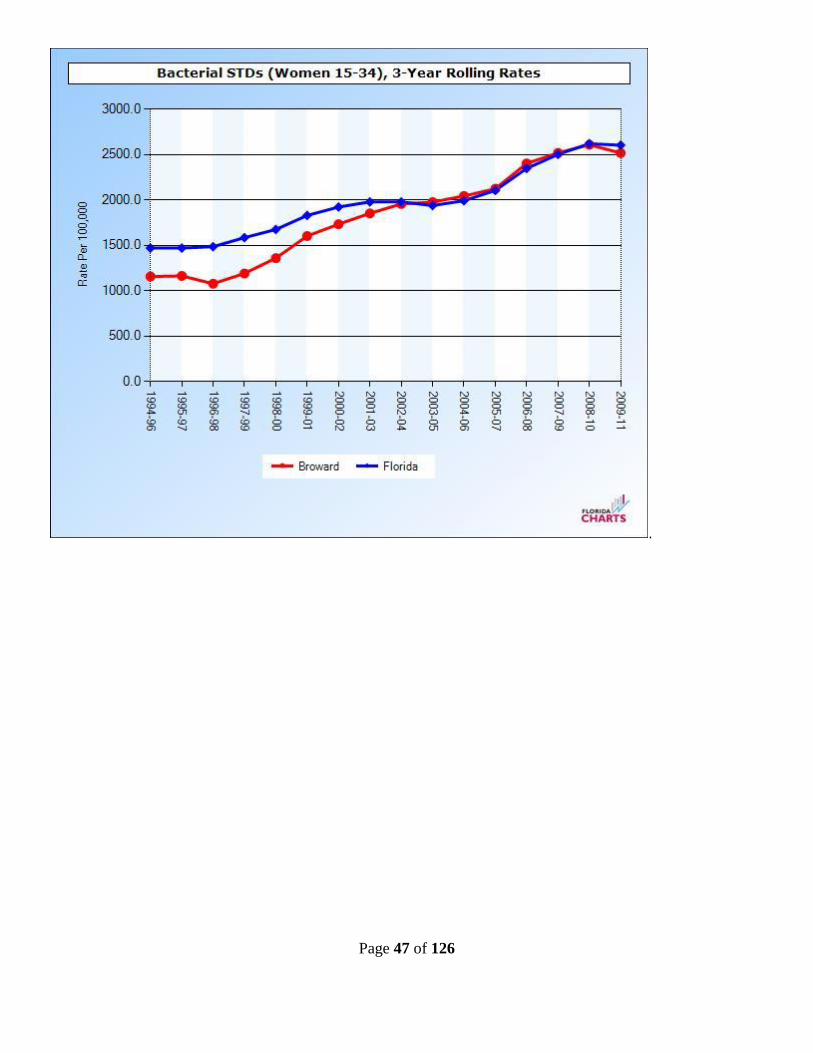
Sexually Transmitted Infections
Another important health indicator that warrants attention is the prevalence of sexually transmitted infections in
Broward County. Infections during pregnancy can lead to poor birth outcomes and in extreme cases fetal and/or
neonatal mortality.
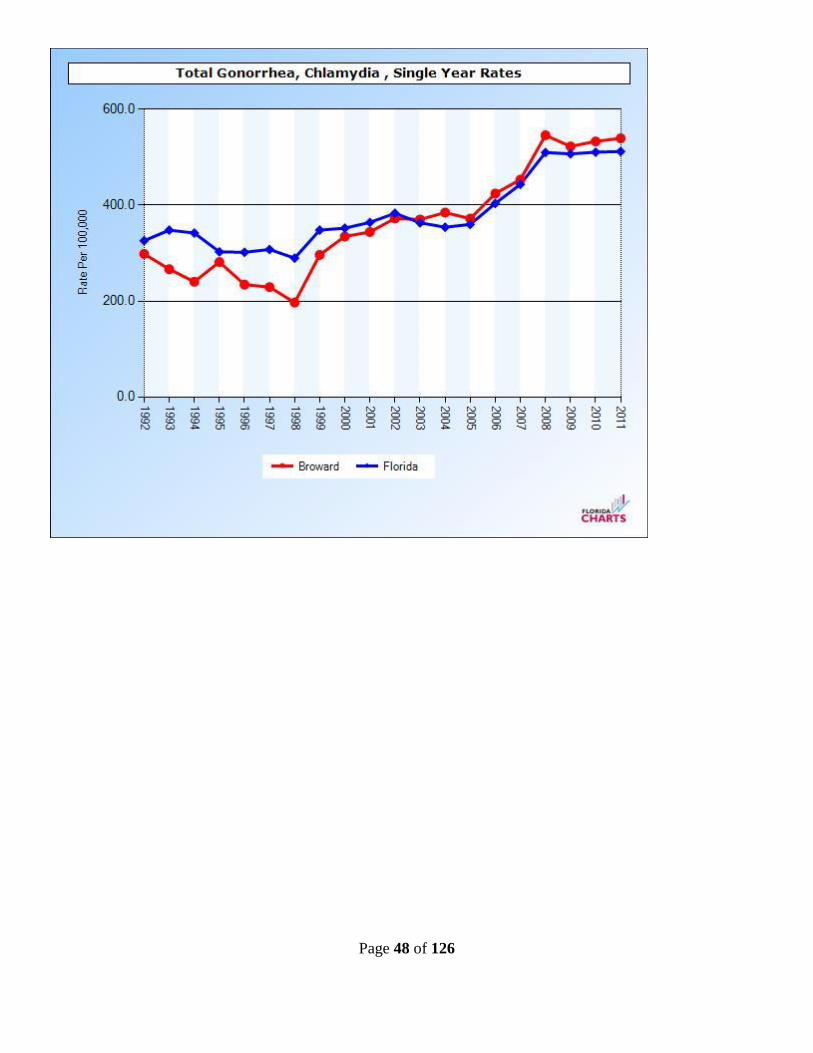
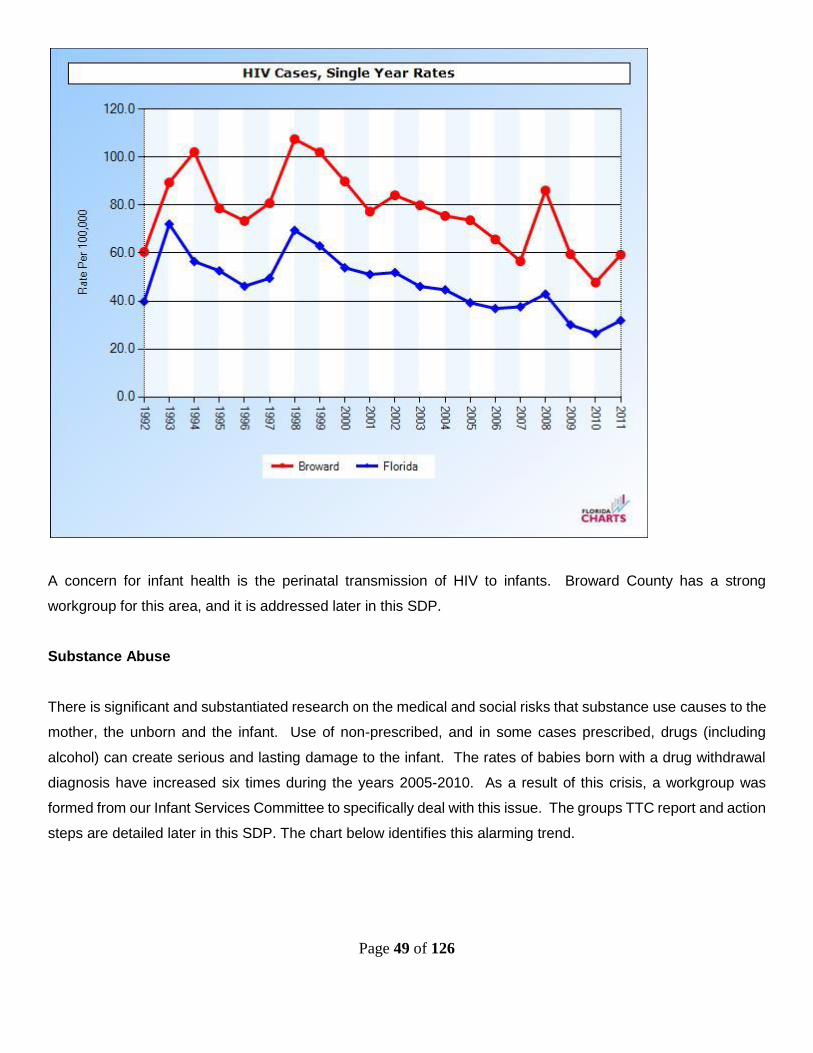
According to Florida’s Department of Health, Broward County exhibits least favorable rates of HIV and AIDS
cases as well as the number of deaths caused by this disease. Not so favorable rates of Chlamydia and
Gonorrhea cases reported are also factors within our overall county health. Cases of Chlamydia have increased
since previous years as have with cases of infectious syphilis. Our county’s infectious syphilis rates are over
two times greater than that of the state.
Page 47 of 126
.
Page 48 of 126
Page 49 of 126
A concern for infant health is the perinatal transmission of HIV to infants. Broward County has a strong
workgroup for this area, and it is addressed later in this SDP.
Substance Abuse
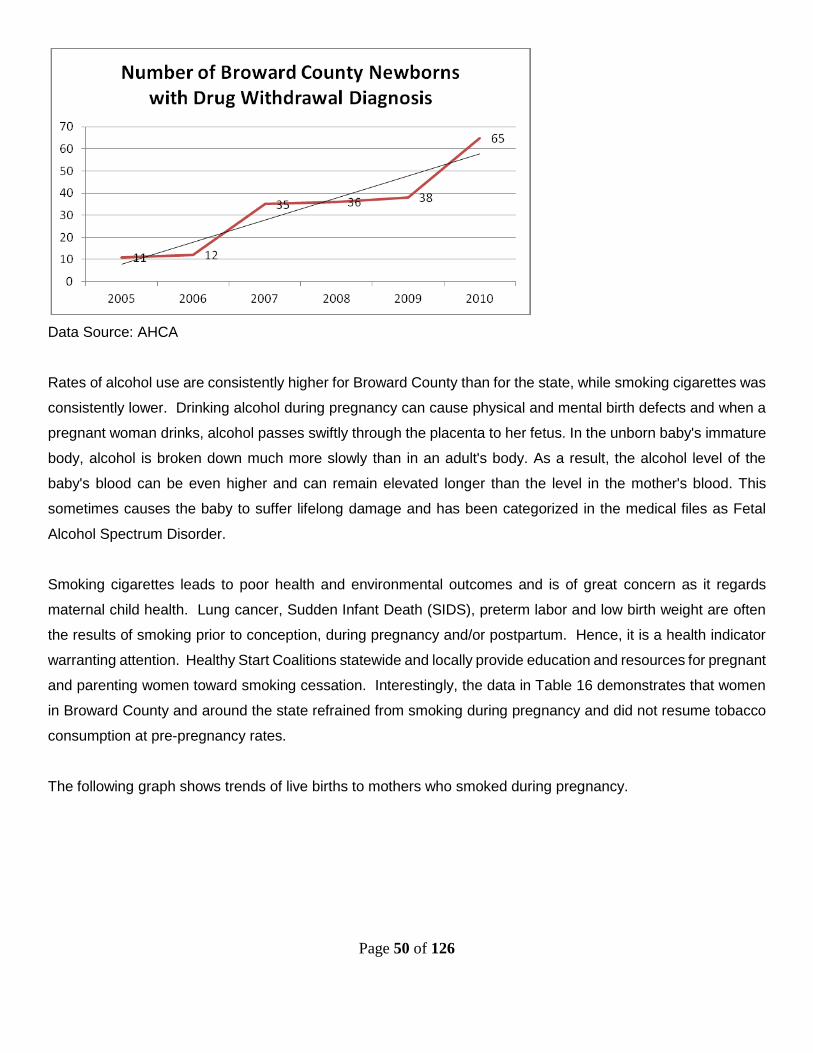
There is significant and substantiated research on the medical and social risks that substance use causes to the
mother, the unborn and the infant. Use of non-prescribed, and in some cases prescribed, drugs (including
alcohol) can create serious and lasting damage to the infant. The rates of babies born with a drug withdrawal
diagnosis have increased six times during the years 2005-2010. As a result of this crisis, a workgroup was
formed from our Infant Services Committee to specifically deal with this issue. The groups TTC report and action
steps are detailed later in this SDP. The chart below identifies this alarming trend.
Page 50 of 126
Data Source: AHCA
Rates of alcohol use are consistently higher for Broward County than for the state, while smoking cigarettes was
consistently lower. Drinking alcohol during pregnancy can cause physical and mental birth defects and when a
pregnant woman drinks, alcohol passes swiftly through the placenta to her fetus. In the unborn baby's immature
body, alcohol is broken down much more slowly than in an adult's body. As a result, the alcohol level of the
baby's blood can be even higher and can remain elevated longer than the level in the mother's blood. This
sometimes causes the baby to suffer lifelong damage and has been categorized in the medical files as Fetal
Alcohol Spectrum Disorder.
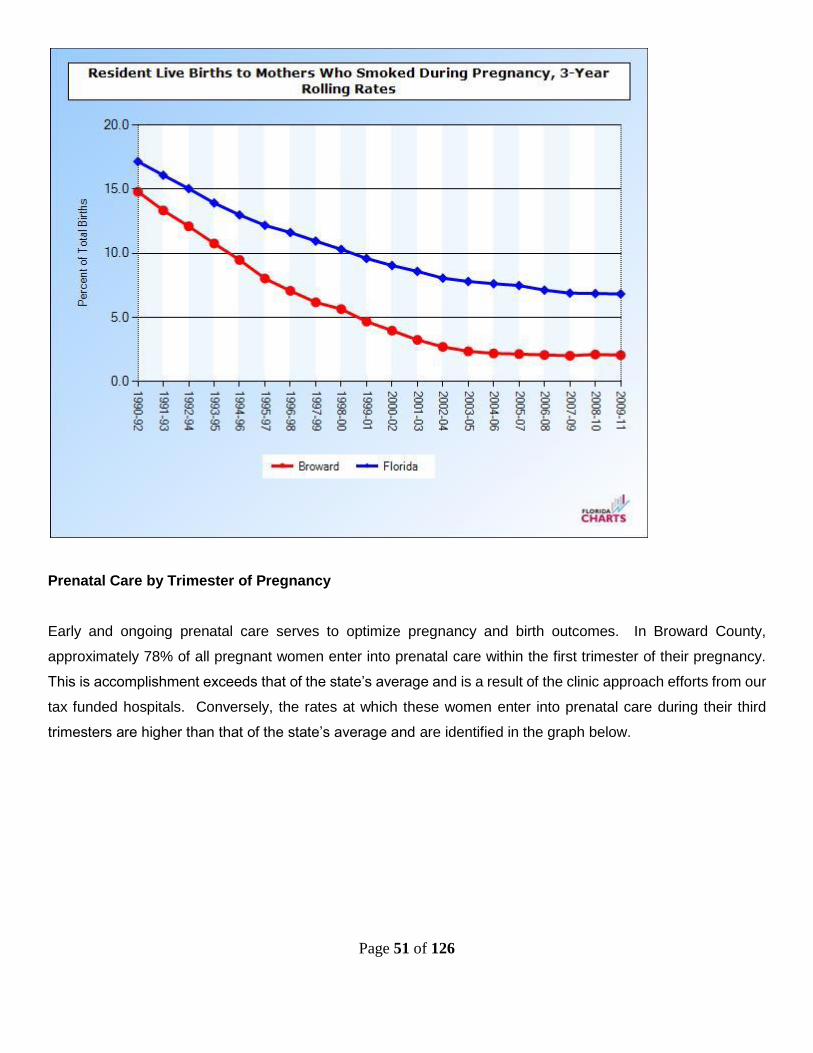
Smoking cigarettes leads to poor health and environmental outcomes and is of great concern as it regards
maternal child health. Lung cancer, Sudden Infant Death (SIDS), preterm labor and low birth weight are often
the results of smoking prior to conception, during pregnancy and/or postpartum. Hence, it is a health indicator
warranting attention. Healthy Start Coalitions statewide and locally provide education and resources for pregnant
and parenting women toward smoking cessation. Interestingly, the data in Table 16 demonstrates that women
in Broward County and around the state refrained from smoking during pregnancy and did not resume tobacco
consumption at pre-pregnancy rates.
The following graph shows trends of live births to mothers who smoked during pregnancy.
Page 51 of 126
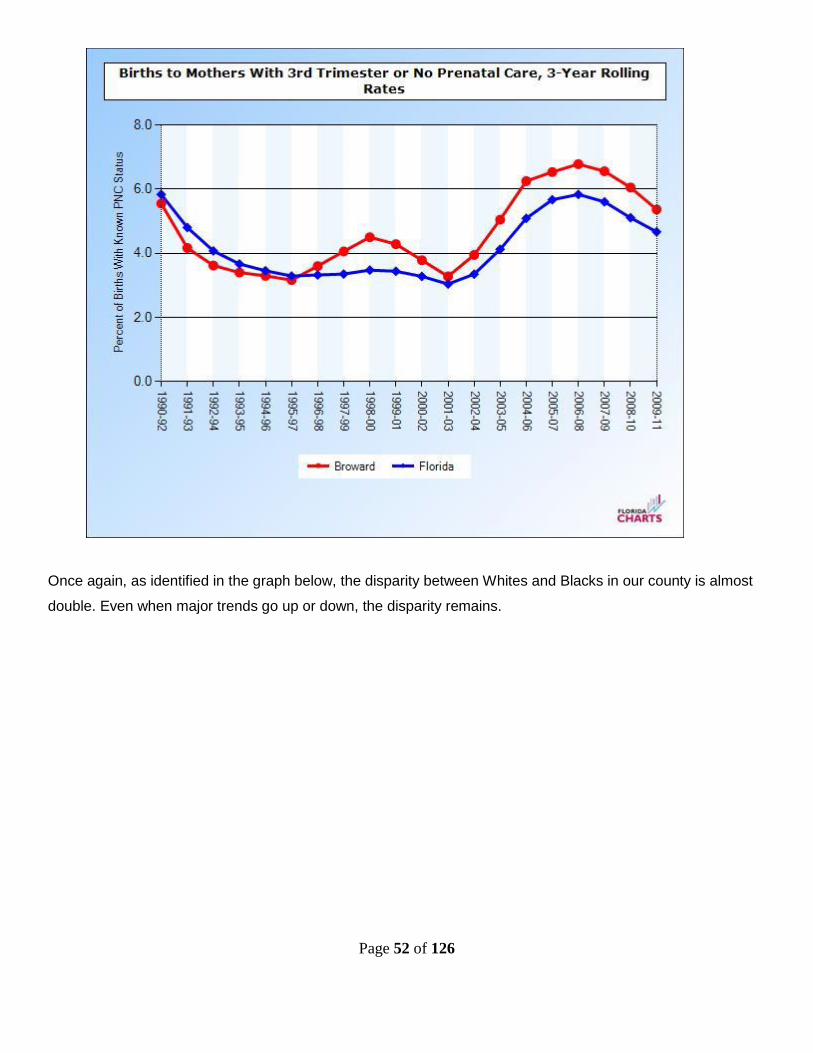
Prenatal Care by Trimester of Pregnancy
Early and ongoing prenatal care serves to optimize pregnancy and birth outcomes. In Broward County,
approximately 78% of all pregnant women enter into prenatal care within the first trimester of their pregnancy.
This is accomplishment exceeds that of the state’s average and is a result of the clinic approach efforts from our
tax funded hospitals. Conversely, the rates at which these women enter into prenatal care during their third
trimesters are higher than that of the state’s average and are identified in the graph below.
Page 52 of 126
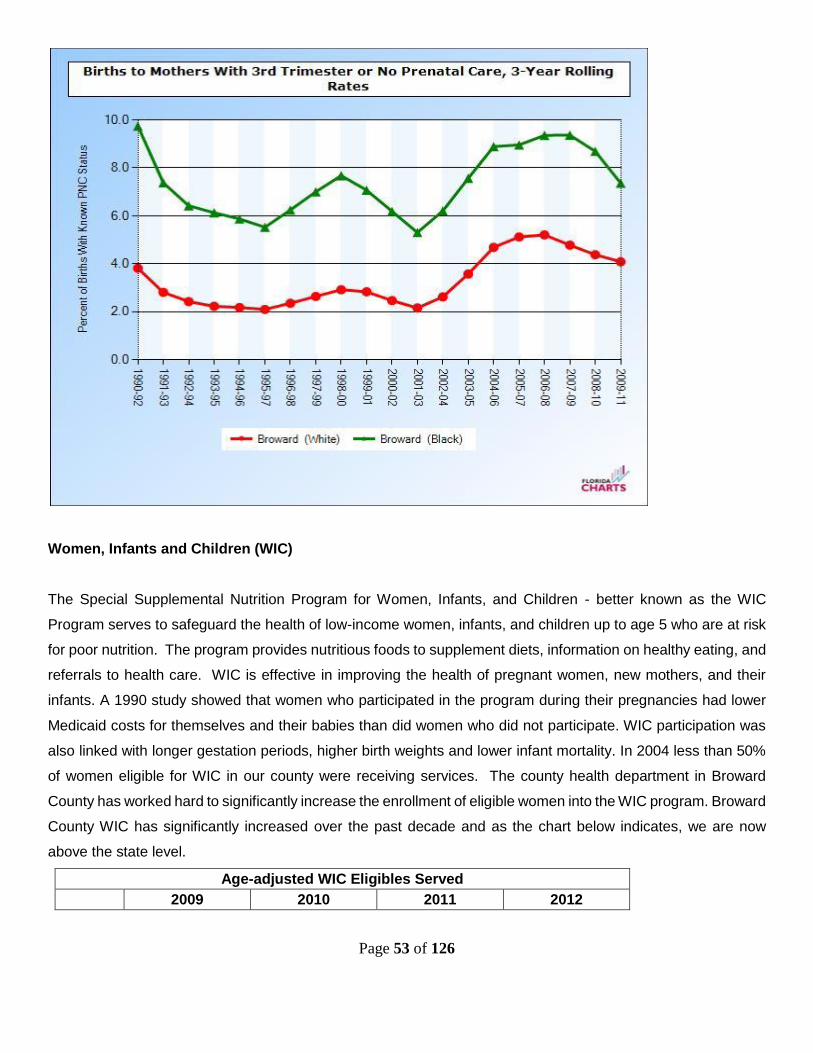
Once again, as identified in the graph below, the disparity between Whites and Blacks in our county is almost
double. Even when major trends go up or down, the disparity remains.
Page 53 of 126
Women, Infants and Children (WIC)
The Special Supplemental Nutrition Program for Women, Infants, and Children - better known as the WIC
Program serves to safeguard the health of low-income women, infants, and children up to age 5 who are at risk
for poor nutrition. The program provides nutritious foods to supplement diets, information on healthy eating, and
referrals to health care. WIC is effective in improving the health of pregnant women, new mothers, and their
infants. A 1990 study showed that women who participated in the program during their pregnancies had lower
Medicaid costs for themselves and their babies than did women who did not participate. WIC participation was
also linked with longer gestation periods, higher birth weights and lower infant mortality. In 2004 less than 50%
of women eligible for WIC in our county were receiving services. The county health department in Broward
County has worked hard to significantly increase the enrollment of eligible women into the WIC program. Broward
County WIC has significantly increased over the past decade and as the chart below indicates, we are now
above the state level.
Age-adjusted WIC Eligibles Served
2009 2010 2011 2012
Page 54 of 126
County Count Rate (%)
Count Rate (%)
Count Rate (%)
Count Rate (%)
Florida 496,969 83.9 502,959 86.6 502,959 86.6 481,110 82.9
Broward 35,494 75 39,757 85.2 39,757 85.2 42,037 89.7 Source: BCHD
WIC enrollment is crucial to improving pregnancy and birth outcomes and toward sustaining rates for
breastfeeding. Improved nutrition supports a reduction in preterm births, babies born at low and very low birth
weights and fetal mortality. In addition, increased breastfeeding rates lead to a reduction in infant infections and
illnesses, which serve to positively impact the rates of infant mortality. It is imperative that Broward County
continues to prioritize WIC enrollment through publicity and linkages.
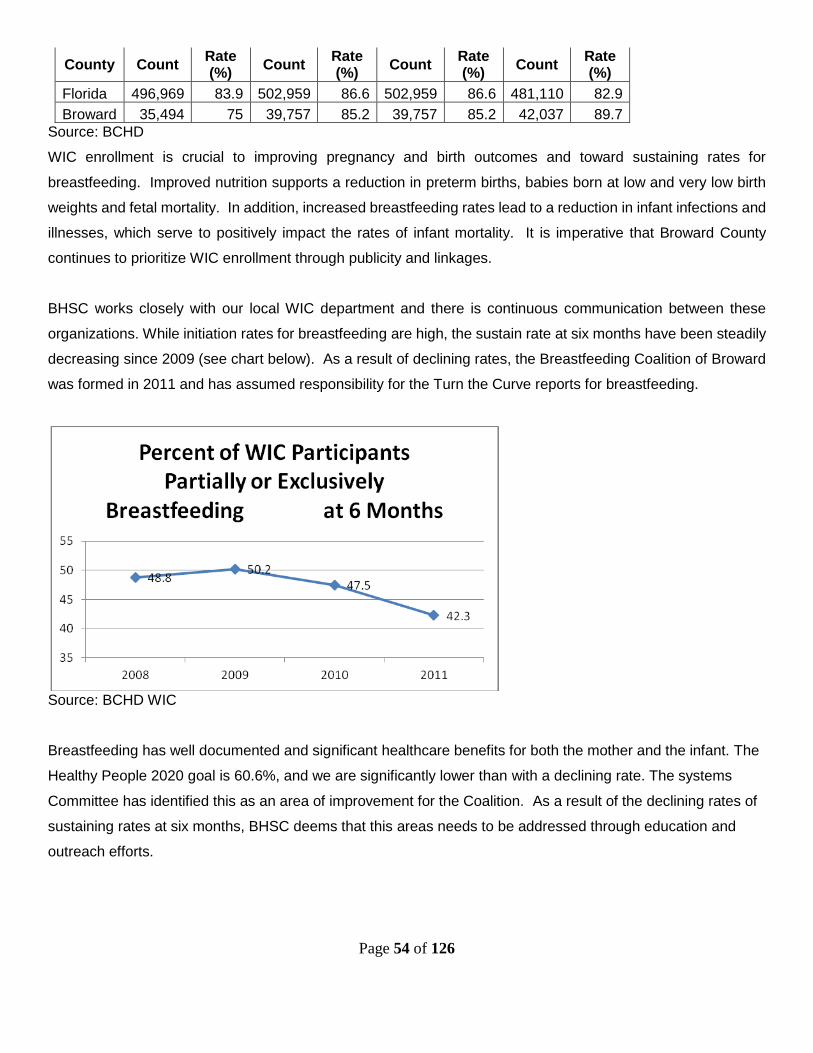
BHSC works closely with our local WIC department and there is continuous communication between these
organizations. While initiation rates for breastfeeding are high, the sustain rate at six months have been steadily
decreasing since 2009 (see chart below). As a result of declining rates, the Breastfeeding Coalition of Broward
was formed in 2011 and has assumed responsibility for the Turn the Curve reports for breastfeeding.
Source: BCHD WIC
Breastfeeding has well documented and significant healthcare benefits for both the mother and the infant. The
Healthy People 2020 goal is 60.6%, and we are significantly lower than with a declining rate. The systems
Committee has identified this as an area of improvement for the Coalition. As a result of the declining rates of
sustaining rates at six months, BHSC deems that this areas needs to be addressed through education and
outreach efforts.
Page 55 of 126
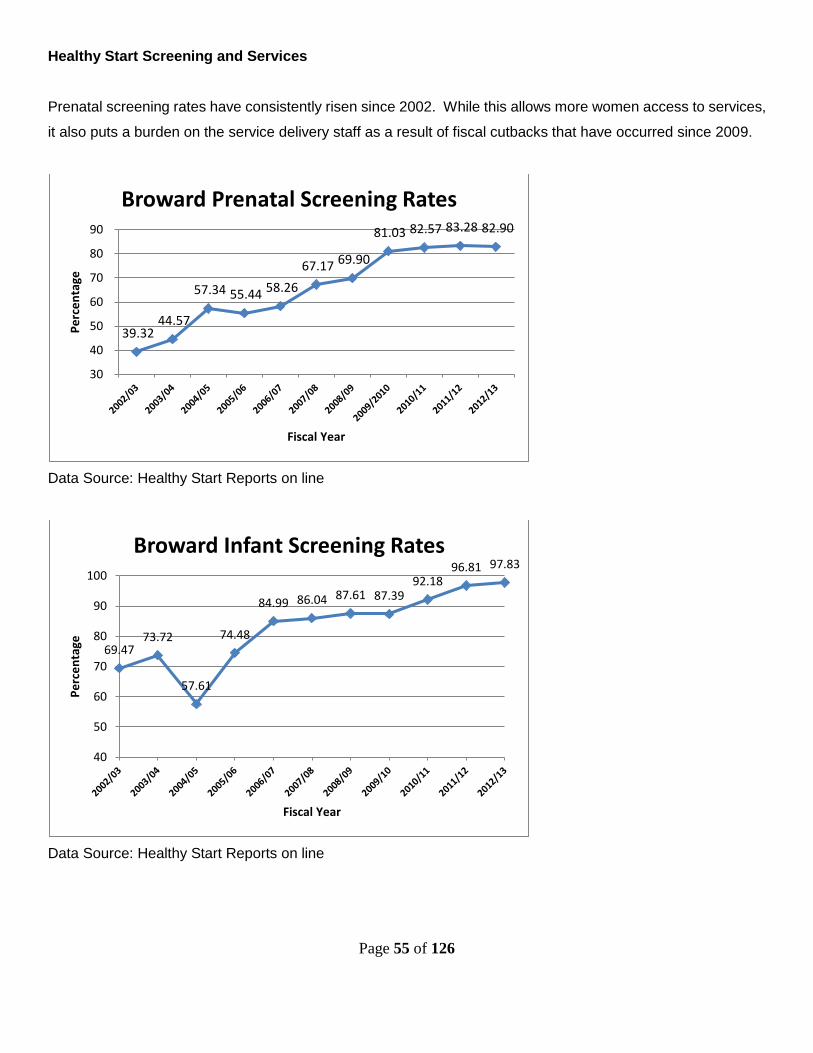
Healthy Start Screening and Services
Prenatal screening rates have consistently risen since 2002. While this allows more women access to services,
it also puts a burden on the service delivery staff as a result of fiscal cutbacks that have occurred since 2009.
Data Source: Healthy Start Reports on line
Data Source: Healthy Start Reports on line
39.32 44.57
57.34 55.44 58.26
67.17 69.90
81.03 82.57 83.28 82.90
30
40
50
60
70
80
90
Pe
rce
nta
ge
Fiscal Year
Broward Prenatal Screening Rates
69.4773.72
57.61
74.48
84.99 86.04 87.61 87.3992.18
96.81 97.83
40
50
60
70
80
90
100
Pe
rce
nta
ge
Fiscal Year
Broward Infant Screening Rates
Page 56 of 126
The infant screening rates have been significantly bolstered as a result of the new Electronic Birth Record
process, initiated by the Florida Vital Statistics offices. This requires the completion of the HS screen prior to
issuing a birth certificate.
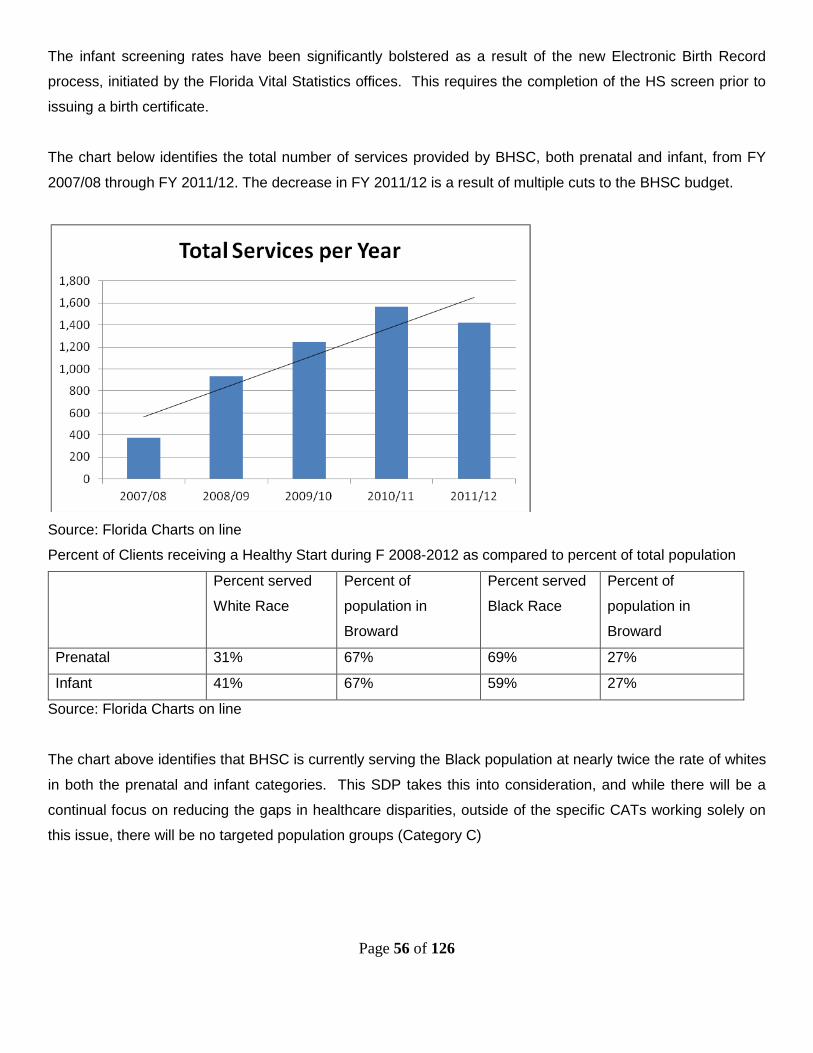
The chart below identifies the total number of services provided by BHSC, both prenatal and infant, from FY
2007/08 through FY 2011/12. The decrease in FY 2011/12 is a result of multiple cuts to the BHSC budget.
Source: Florida Charts on line
Percent of Clients receiving a Healthy Start during F 2008-2012 as compared to percent of total population
Percent served
White Race
Percent of
population in
Broward
Percent served
Black Race
Percent of
population in
Broward
Prenatal 31% 67% 69% 27%
Infant 41% 67% 59% 27%
Source: Florida Charts on line
The chart above identifies that BHSC is currently serving the Black population at nearly twice the rate of whites
in both the prenatal and infant categories. This SDP takes this into consideration, and while there will be a
continual focus on reducing the gaps in healthcare disparities, outside of the specific CATs working solely on
this issue, there will be no targeted population groups (Category C)
Page 57 of 126
Overview of Key Findings
A review of the data from the 2013 Needs Assessment reveals the following challenges in Broward County:
I. Black women and their infants experience higher rates of infant, neonatal and post neonatal
mortality than women of other ethnicities. Overall there is only one indicator identified in the
data above where Blacks in Broward County fare better than Whites.
II. While there are good numbers of women who initiate breastfeeding, there is a sharp drop off
at 6 months.
III. There has been a steady increase in cesarean sections over the past 10 years and this
correlates with high numbers of late preterm babies being born, especially to white women.
IV. Broward has a lower rate of Medicaid funded births than the Florida average.
V. STD and HIV rates are higher than state averages.
VI. Since 2005, the rates of SA/SEN have risen six fold.
VII. Increased diversity in population will require culturally competent service provision.
VIII. Women with multiple psychosocial stressors, and have an income meeting Medicaid eligibility,
who do not enter prenatal care before 12 weeks of gestation appear to be at greater risk for
poor birth outcomes. Obesity and first time pregnancies also impact birth outcomes.
IX. Immunization rates remain high for children at two years of age.
X. Teen birth rates remain lower than twenty years ago, however a slight increase has been
noted since 2003. Repeat teen births have also increased since 2003 and appear to be on
an upward trend. There have been changes in enrollment in the numbers of teens in the Teen
Pregnancy Centers, with pregnant and parenting teens remaining in their home school as
opposed to participating in TPC designed to meet their needs and that of their children.
MAJOR HEALTH INDICATORS SELECTED FOR PLANNING CYCLE
Indicators
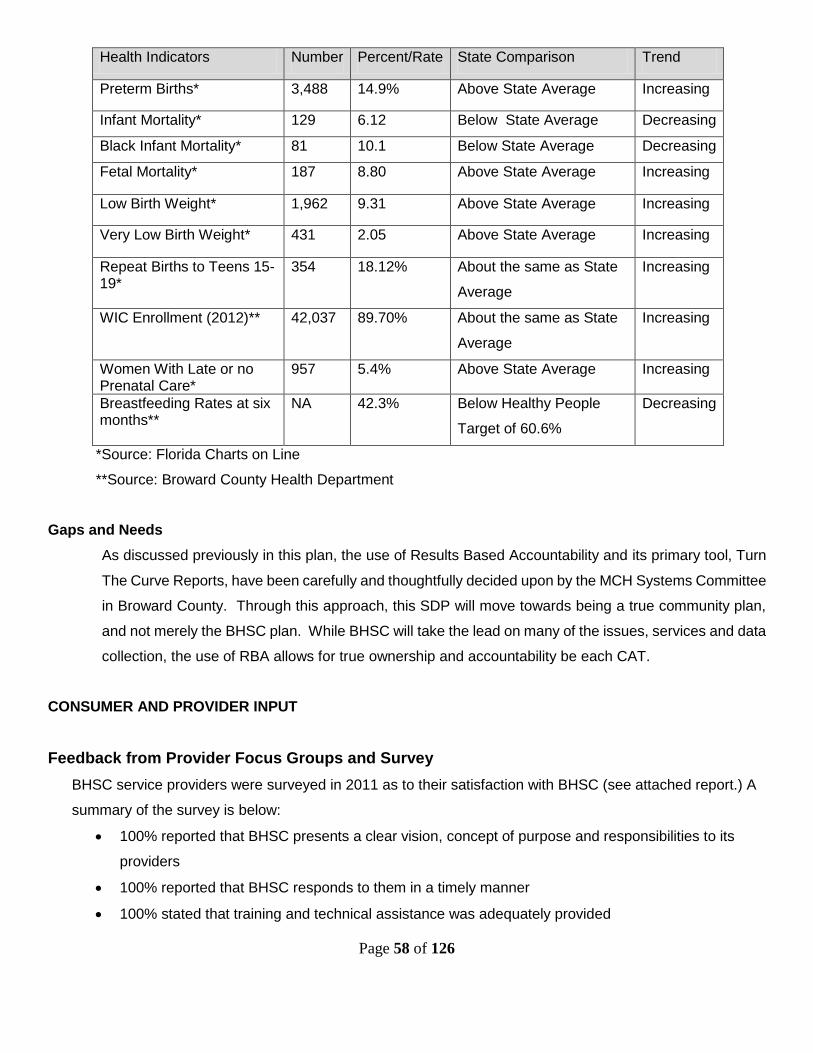
Based on the findings of the 2013 Needs Assessment, eight health indicators were reviewed: preterm
births, infant mortality, fetal mortality, low birth weight births, very low birth weight births, births to teens
and WIC enrollment. These areas are interrelated and capture the greatest number of contributing factors
of mothers and babies at risk for poor birth and health outcomes.
2011 Critical Health Indicators, Broward County
Page 58 of 126
Health Indicators Number Percent/Rate State Comparison Trend
Preterm Births* 3,488 14.9% Above State Average Increasing
Infant Mortality* 129 6.12 Below State Average Decreasing
Black Infant Mortality* 81 10.1 Below State Average Decreasing
Fetal Mortality* 187 8.80 Above State Average Increasing
Low Birth Weight* 1,962 9.31 Above State Average Increasing
Very Low Birth Weight* 431 2.05 Above State Average Increasing
Repeat Births to Teens 15-19*
354 18.12% About the same as State
Average
Increasing
WIC Enrollment (2012)** 42,037 89.70% About the same as State
Average
Increasing
Women With Late or no Prenatal Care*
957 5.4% Above State Average Increasing
Breastfeeding Rates at six months**
NA 42.3% Below Healthy People
Target of 60.6%
Decreasing
*Source: Florida Charts on Line
**Source: Broward County Health Department
Gaps and Needs
As discussed previously in this plan, the use of Results Based Accountability and its primary tool, Turn
The Curve Reports, have been carefully and thoughtfully decided upon by the MCH Systems Committee
in Broward County. Through this approach, this SDP will move towards being a true community plan,
and not merely the BHSC plan. While BHSC will take the lead on many of the issues, services and data
collection, the use of RBA allows for true ownership and accountability be each CAT.
CONSUMER AND PROVIDER INPUT
Feedback from Provider Focus Groups and Survey
BHSC service providers were surveyed in 2011 as to their satisfaction with BHSC (see attached report.) A
summary of the survey is below:
100% reported that BHSC presents a clear vision, concept of purpose and responsibilities to its
providers
100% reported that BHSC responds to them in a timely manner
100% stated that training and technical assistance was adequately provided
Page 59 of 126
100% reported that BHSC clearly communicates on important contractual matters
100% stated that BHSC fosters a sense of team work with its providers
100% reported that the Executive director provides local and state leadership for Healthy Start
Consumer Input
In 2010 BHSC surveyed 92 healthy Start participants who had completed their program services (see
attached report). A summary of the survey is below:
93% of respondents were satisfied with their Care Coordination
95% were satisfied with the educational services provided
98% were satisfied with the Psychosocial Counseling services provided
96% would recommend Healthy Start services
80% rated the services as good or very good
98% reported that they were treated with respect while in the program
96% said the services were provided at a convenient time
While the majority of participants said they liked the program and would not change anything,
29% said it should offer more information
TARGET POPULATION AND AREAS OF SPECIAL EMPHASIS
The primary goals of the Healthy Start Coalition of Broward for this current SDP are to:
Improve Perinatal Conditions to decrease rates of fetal mortality, increase the number of babies
born at normal and above birth weights, improve entry to prenatal care, decrease rates of early
preterm births
Outreach to Black Population for improved outcomes particularly as it relates to reducing infant
mortality and repeat teen births
Decrease rates of SA/SEN infants
Increase breastfeeding rates
Decrease perinatal HIV, STD and STI rates amongst pregnant women and infants
Decrease preventable infant mortality
In order to meet these targets, the Coalition intends to increase its collaboration with other entities within
the maternal child health system as well as with members of the private sector to develop a seamless
and collaborative system of care, and to maximize services, human capital and fiscal resources.
Page 60 of 126
Increased collaboration is intended to improve perinatal conditions, and will focus on pre-Conceptional
and inter-Conceptional health. Collaboration with Healthy Families Broward is paramount to establishing
a localized continuum for maternal child health services.
The Florida statute 383.2162 created the Black Infant Health Practice Initiative (BIHPI) which targets
identifying the causes of racial disparity in infant mortality rates and finding possible solutions. The
Coalition will continue the work initiated through the BIHPI to include continued community engagement
and the dissemination of prevention and intervention messages.
There are some fluctuations in the infant mortality, fetal mortality, and low birth weight within the Hispanic
Population apparent trend within the past three years. The Coalition will monitor these rates to assess
progress or lack of with this population.
In order to increase prenatal screening and service rates as well as the postnatal service rates, the
Coalition has prioritized improving training and data collection practices. Trainings are prioritized for the
care provider communities as well as the funded providers. Trainings prioritized are in response to
changes in Healthy Start Standard and Guidelines, screening rates and service utilization rates as they
relate to childbirth education and breastfeeding.
RESOURCE INVENTORY AND SERVICE GAPS
The Coalition reviewed the existing resource inventory and developing geographic areas of the counties
to ascertain the availability of services. First Call for Help and the Parent Resource Directory and the
Children’s Services Council’s Resource Guide serve as efficient and consolidated resources. The Parent
Resource Directory and Children’s Services Council’s Resource Guides are updated and re-printed
frequently to ensure accuracy. These guides are distributed through community programs funded by the
Healthy Start Coalition and the Children’s Services Council respectively.
The Parent Resource Directory lists all the providers of Healthy Start services in Broward County.
A review of the Resource Inventory, in conjunction with community input, Needs Assessment data;
review of geographic areas reveals the following strengths and service gaps:
Resource Assets:
Page 61 of 126
1. Broward County has a supportive Family Resource Center to assist families with
rent, utilities, etc.
2. Clients are able to receive coordinated service information through
2-1-1/ First Call for Help
3. Several Resource Guides and Directories are available free of charge including a
comprehensive Family Resource Guide
4. Clinics for low-income clients are generally available and offer services on a sliding
fee scale as well as financial assistance based upon eligibility through tax assisted
hospital districts, including Broward Health and Memorial Healthcare
5. Teen Parent Centers funded by the school district provides services to teens and their
children to increase educational attainment and health outcomes
6. The Broward County Health Department serves as a resource for epidemiological
data and collaborator for nutrition and fitness including WIC
7. The Children’s Services Council of Broward County aims to establish and steer
coordinated efforts in improving maternal and child health services and funded a FIMR
evaluation to assess the current process.
Resource Gaps:
The gaps below were identified by the Broward County Maternal Child Health Systems Committee
Membership which includes consumers, providers and community stakeholders.
Lack of affordable health insurance for those without private insurance but are unable to
qualify for Medicaid, especially non documented residents
The Coalition has limited resources for psychosocial counseling, substance abuse services,
nutrition and staff that informs of Safe Baby practices
Limited funding for cribs and car seats for families without resources
Limited funding for social media campaigns that would support safe sleep practices,
breastfeeding, teen pregnancy and full term birth practices
Lack of a maternal and infant substance exposed treatments and programming
Page 62 of 126
COALITION ACCOMPLISHMENTS
Since submission of the previous Service Delivery Plan, many changes have occurred within the
administration of the Coalition, and with contracted service providers. The following serves to highlight
these accomplishments:
Significant changes to the MCH System of Care to increase efficiencies
Development of the Results Based Accountability process
The Broward Coalition has worked to decrease the variance between program providers
All service providers are trained and proficient in HMS
Through prenatal screening rates have continued to increase
Since 2007 postnatal screening rates have continued to increase
Services have been targeted in the 33311 and 33313 zip codes of Broward County to
address racial disparities related to birth outcomes, through the Coalition’s funding of the
WISH program.
The Coalition has continued to fund a Teen Parent Program, proven to have positive
graduation rates.
Staff turnover has been at a minimum both at the coalition and amongst its program
providers
WIC applicants have increased
Births without prenatal care have decreased
The smoking rates for pregnant women continue to be at a low rate
Repeat births to teen mothers have stabilized and are below the state rate
Infant deaths have decreased and are below the state rate
Preterm births have a decreasing rate and are below the state rate
Page 63 of 126
HEALTHY START SYSTEM
As is mandated and outlined by Florida Department of Health, in Broward County and statewide, pregnant
women and infants appear to be receiving screenings to determine those most likely to be at greatest risk for
poor pregnancy and birth outcomes, infant mortality and neonatal deaths.
Contracted services include risk screening, care coordination/case management, enhanced/wraparound
services, and fetal infant mortality review (FIMR). Pre and postnatal screening in selected high volume prenatal
and pediatric clinics as well as selected birthing hospitals complete the menu of Healthy Start services available
in Broward County.
A cursory overview of the current service system is as follows: The Broward Healthy Start Coalition currently
contracts with eight (8) entities locally to provide services and funds the Risk Screening Office at the local health
department. Prenatal medical care providers and birthing facilities offer risk screening to identify those most at
risk and the local Health Department serves as gatekeepers to the system through the processing and
dissemination of prenatal risk screens and referrals to the contracted entities for services. Based upon identified
risk factors and identified needs, case managers provide care coordination and enhanced/wraparound services
including childbirth education, breastfeeding education and support, and parenting education and support.
Additionally, case managers offer interconceptional counseling and smoking cessation education, and
supportive counseling as appropriate. Women identified as substance abusers, and/or substance exposed
newborns may also be referred to contracted entities to receive these same services specific to their identified
risks and needs. Case Managers also make referrals to other wraparound services with contracted entities for
nutrition and supportive counseling services; in addition to other available community resources.
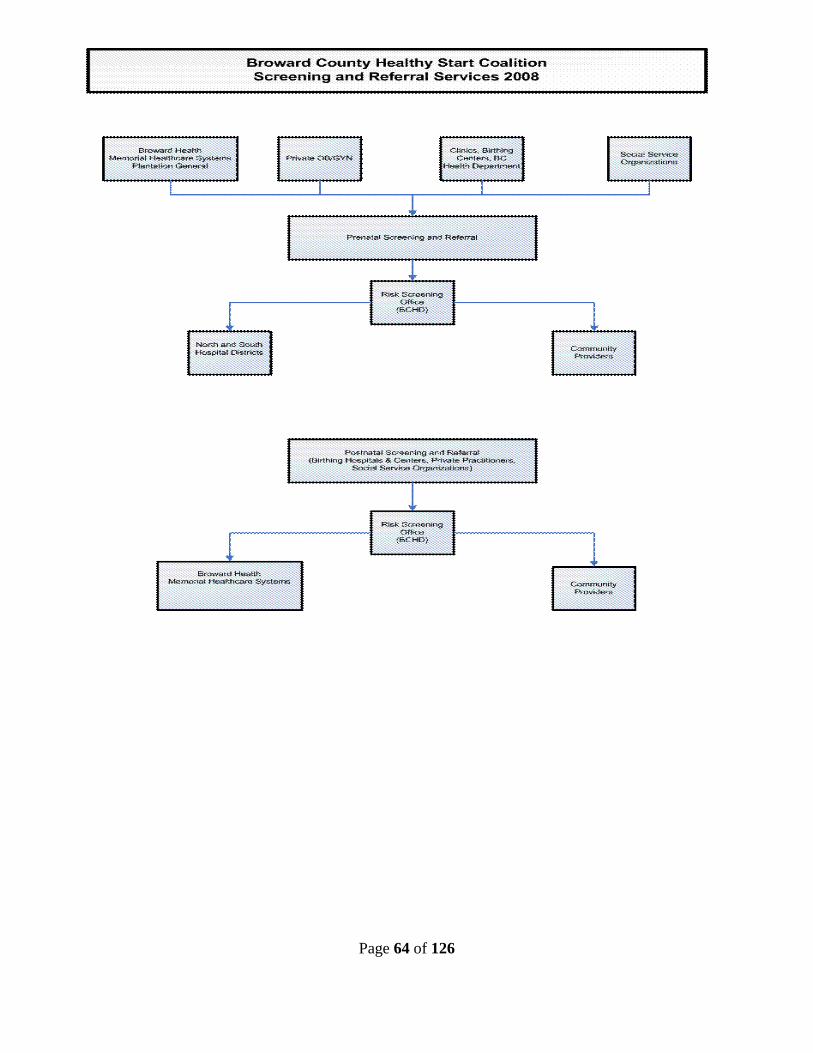
Page 64 of 126
Page 65 of 126
FUNDING ALLOCATION PROCESS
The Healthy Start Coalition of Broward County has enlisted contractors to provide Healthy Start services
to its clients. In 2005, the coalition announced a request for proposal. Community members and staff
convened to review the proposals received. As a result, eleven contractors were engaged to provide
Care Coordination and Enhanced Services for a period of up to three years.
Contracts are renewed annually according to performance and the availability of funds. Two contracts
have been eliminated for performance issues and others have been reduced due to a reduction in funding
received by the Coalition.
The coalition has moved to units of service reimbursement plan, which only pays a program provider
when they actually complete a service. This has tremendously increased the efficiencies of our coalition.
Page 66 of 126
COALITION PRIORITIES What particular priorities, target groups, or geographic areas are targeted in your Service Delivery Plan?
Entire Broward County- for screenings
The following have developed Turn The Curve reports:
• Incidence of Perinatal HIV Transmission
• Incidence of STD/STI Rates in Pregnant Women and Girls
• Rates of Late Preterm Births
• Disparities in Black Fetal and Infant Deaths
• Teen Births and Repeat Teen Births
• Unsafe Sleep Practices and Safe Infant Care
• Breastfeeding Rates
• Substance Exposed Newborns
The process for implementing these priorities is:
1. Data is provided by the FIMR CRT to the FIMR CAG
2. The FIMR CAG reviews the data and reports its findings to the BHSC Coalition
Membership Committee
3. The BHSC Coalition Membership Committee assigns workgroups (CAT) to create or
update a Results Based Accountability Turn the Curve Report, and a Wishbone Diagram
4. Action plans from each CAT are reviewed quarterly by the BHSC Coalition Membership
Committee for progress
5. BHSC reports its findings and Category B activities to the FDOH and the QA Committee
Each work group went through a process of developing action steps by identifying causality through a fishbone
analysis. BHSC staff assisted this process by:
Going through a brainstorming activity with each group
Returning the list from the above activity placed in to a Wishbone diagram
Working with each group to identify what activities could be reasonably pursued by each group.

Page 67 of 126
Each CAT utilizes the following form to assist in determining the feasibility of their work plan.
Project Selection Matrix – Rate from 1 to 10
Project Names
Team Control
Reasonable Time Frame
Resources Available
Is Data Available
Impact on Customer
Impact on Organization
Impact on Community
TOTAL
Each of the CAT’s TTC Reports and are below and are identified by CAT name. Fishbone, cause and
effect diagrams are an attachment to this document
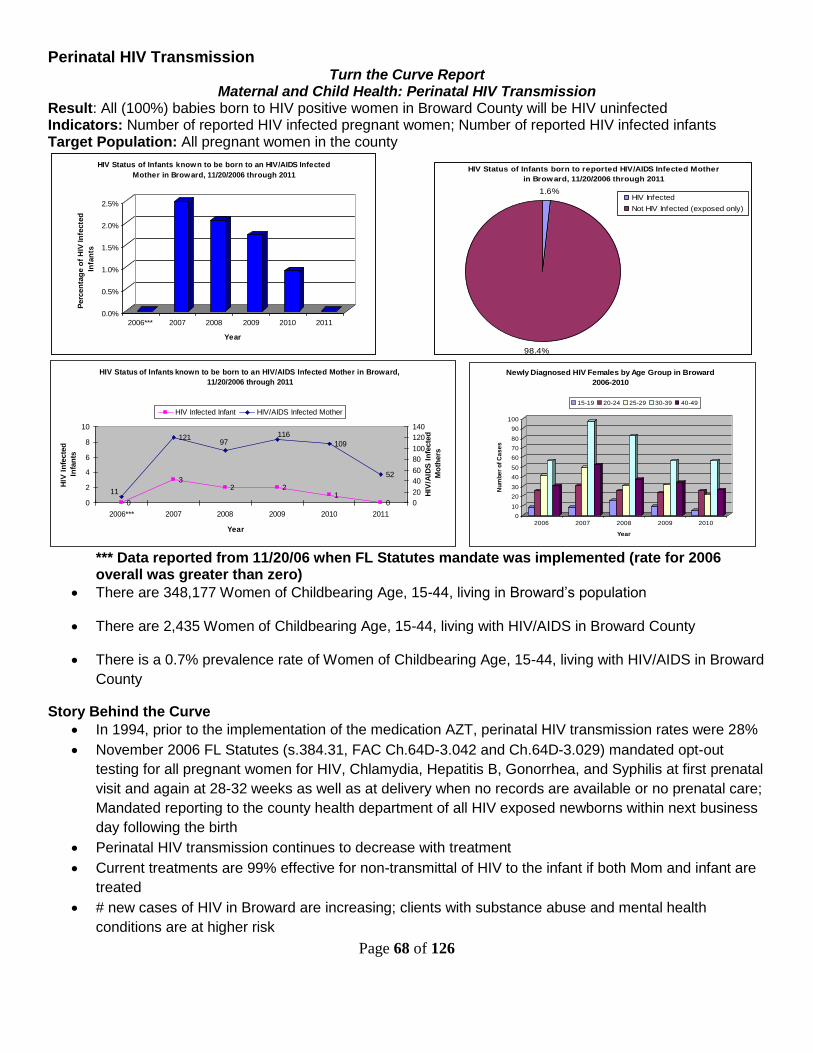
Page 68 of 126
Perinatal HIV Transmission Turn the Curve Report
Maternal and Child Health: Perinatal HIV Transmission Result: All (100%) babies born to HIV positive women in Broward County will be HIV uninfected Indicators: Number of reported HIV infected pregnant women; Number of reported HIV infected infants Target Population: All pregnant women in the county
*** Data reported from 11/20/06 when FL Statutes mandate was implemented (rate for 2006 overall was greater than zero)
There are 348,177 Women of Childbearing Age, 15-44, living in Broward’s population
There are 2,435 Women of Childbearing Age, 15-44, living with HIV/AIDS in Broward County
There is a 0.7% prevalence rate of Women of Childbearing Age, 15-44, living with HIV/AIDS in Broward
County
Story Behind the Curve
In 1994, prior to the implementation of the medication AZT, perinatal HIV transmission rates were 28%
November 2006 FL Statutes (s.384.31, FAC Ch.64D-3.042 and Ch.64D-3.029) mandated opt-out
testing for all pregnant women for HIV, Chlamydia, Hepatitis B, Gonorrhea, and Syphilis at first prenatal
visit and again at 28-32 weeks as well as at delivery when no records are available or no prenatal care;
Mandated reporting to the county health department of all HIV exposed newborns within next business
day following the birth
Perinatal HIV transmission continues to decrease with treatment
Current treatments are 99% effective for non-transmittal of HIV to the infant if both Mom and infant are
treated
# new cases of HIV in Broward are increasing; clients with substance abuse and mental health
conditions are at higher risk
0.0%
0.5%
1.0%
1.5%
2.0%
2.5%
Perc
en
tag
e o
f H
IV In
fecte
d
Infa
nts
2006*** 2007 2008 2009 2010 2011
Year
HIV Status of Infants known to be born to an HIV/AIDS Infected
Mother in Broward, 11/20/2006 through 2011HIV Status of Infants born to reported HIV/AIDS Infected Mother
in Broward, 11/20/2006 through 2011
1.6%
98.4%
HIV Infected
Not HIV Infected (exposed only)
HIV Status of Infants known to be born to an HIV/AIDS Infected Mother in Broward,
11/20/2006 through 2011
0
32 2
10
121109
52
97116
11
0
2
4
6
8
10
2006*** 2007 2008 2009 2010 2011
Year
HIV
In
fecte
d
Infa
nts
0
20
40
60
80
100
120
140H
IV/A
IDS
In
fecte
d
Mo
thers
HIV Infected Infant HIV/AIDS Infected Mother
0
10
20
30
40
50
60
70
80
90
100
Nu
mb
er
of
Ca
se
s
2006 2007 2008 2009 2010
Year
Newly Diagnosed HIV Females by Age Group in Broward
2006-2010
15-19 20-24 25-29 30-39 40-49
Page 69 of 126
The percent of pregnant women without prenatal care (no HIV testing) is increasing
The annual cost for just one infected child with the least expensive medication regime, without
healthcare visits or care, is $20,000. per year
Stigma related to HIV is still present
Not all delivery hospitals/birthing centers are following evidenced based protocols/FL Statutes
Not all Obstetricians (OB’s) following FL Statutes/Center for Disease Control (CDC)/The American
Congress of Obstetricians and Gynecologists (ACOG) recommendations for offering opt out prenatal
HIV testing and for reporting + results
Not all Pediatricians or all Emergency Department’s (ED’s) educated to be looking for symptoms of HIV
in infants/children
Not all medical providers are following CDC HIV testing guidelines
Partners
Perinatal HIV Provider Network; FL Department of Health (DOH);Broward County Health Department
(BCHD)
Delivery Hospitals/Birthing Centers
Children’s Diagnostic & Treatment Center (CDTC)
Walgreens Voucher Program
Broward Healthy Start Coalition; Healthy Start Providers
Targeted Outreach for Pregnant Women Act (TOPWA)
Obstetricians & staff; Pediatricians & staff
Community maternal child providers
AIDS Education and Training Center (AETC)
Best Ideas – What Works Action Steps
Align efforts of all Maternal Child Health providers to educate on HIV prevention and make referrals for
HIV care
Advocate for prenatal care for all women
Continue education to ensure all delivery hospitals/birthing centers follow FL Statutes/evidence based
standards for perinatal HIV care
Continue to promote Walgreens Voucher program
Education for OB’s on FL Statutes/CDC/ACOG recommendations
Educate all providers that interact with HIV + women on preconception health
Advocate for more intervention for substance abusing women and women with mental health conditions
Create better tracking of HIV exposed infants through 18 months of age who receive care through
community
physicians not affiliated with pediatric HIV care
Advocate for 100% of women to receive rapid HIV testing in labor & delivery
HIV education for pediatricians
Educate healthcare partners on cultural beliefs related to pregnancy, childbirth, and care of the
infant/child
Expand capabilities of Perinatal HIV Provider Network to provide education and resources for the
healthcare partners and community
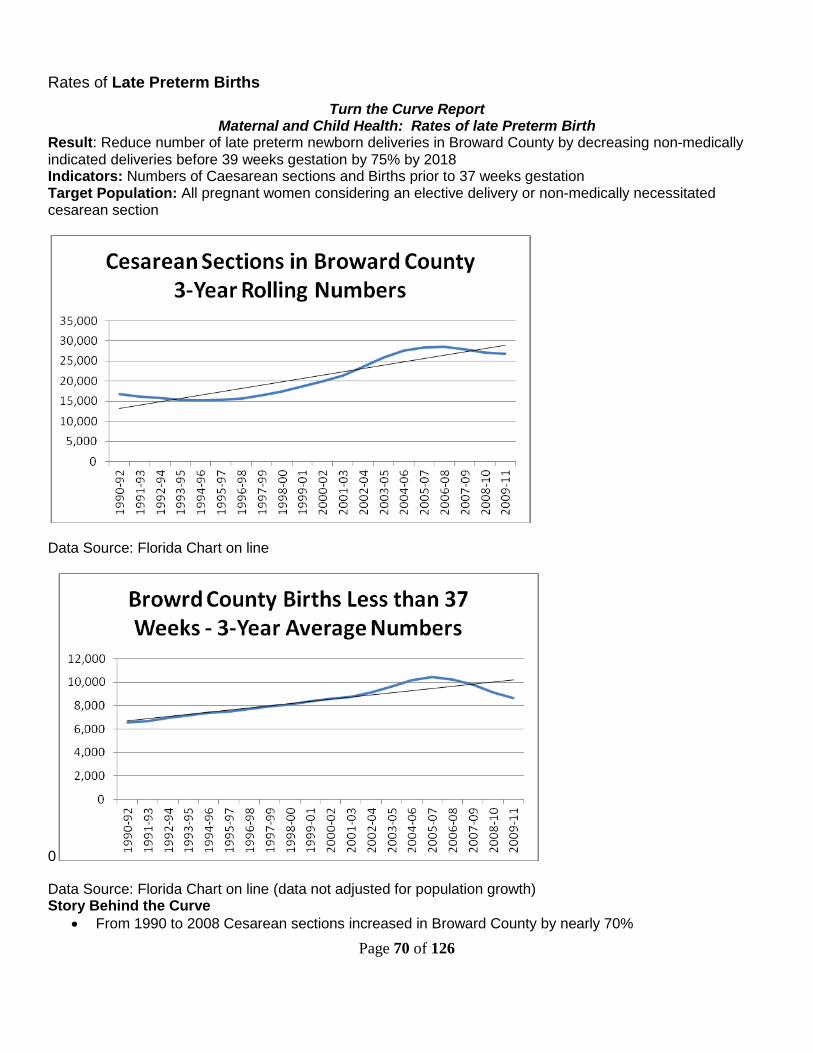
Page 70 of 126
Rates of Late Preterm Births
Turn the Curve Report Maternal and Child Health: Rates of late Preterm Birth
Result: Reduce number of late preterm newborn deliveries in Broward County by decreasing non-medically indicated deliveries before 39 weeks gestation by 75% by 2018 Indicators: Numbers of Caesarean sections and Births prior to 37 weeks gestation Target Population: All pregnant women considering an elective delivery or non-medically necessitated cesarean section
Data Source: Florida Chart on line
0
Data Source: Florida Chart on line (data not adjusted for population growth) Story Behind the Curve
From 1990 to 2008 Cesarean sections increased in Broward County by nearly 70%
Page 71 of 126
From 1990 to 2008 births before 37 weeks gestational age rose by 56%
Partners
March of Dimes
Broward Healthy Start Coalition
Hospitals, OB/GYN’s, Pediatricians, Healthcare professionals
Best Ideas – What Works
Awareness and Education
Action Steps
Provide educational campaigns for healthcare professionals (Physicians, Nurses, Treatment Providers,
etc.)
Utilize Healthy Start Community Liaisons to educate OB/GYN staff
Utilize Social Marketing messages
Provide substance abuse education at “Showers 2 Empower” events
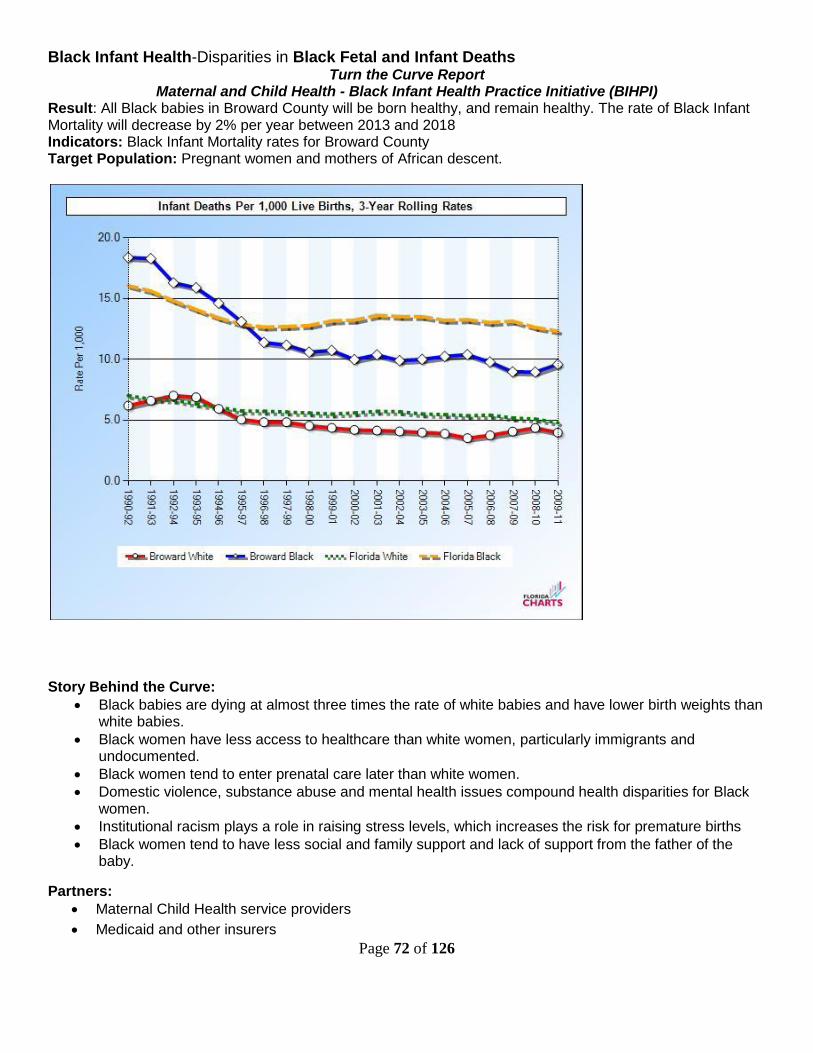
Page 72 of 126
Black Infant Health-Disparities in Black Fetal and Infant Deaths Turn the Curve Report
Maternal and Child Health - Black Infant Health Practice Initiative (BIHPI) Result: All Black babies in Broward County will be born healthy, and remain healthy. The rate of Black Infant Mortality will decrease by 2% per year between 2013 and 2018 Indicators: Black Infant Mortality rates for Broward County Target Population: Pregnant women and mothers of African descent.
Story Behind the Curve:
Black babies are dying at almost three times the rate of white babies and have lower birth weights than white babies.
Black women have less access to healthcare than white women, particularly immigrants and undocumented.
Black women tend to enter prenatal care later than white women.
Domestic violence, substance abuse and mental health issues compound health disparities for Black women.
Institutional racism plays a role in raising stress levels, which increases the risk for premature births
Black women tend to have less social and family support and lack of support from the father of the baby.
Partners:
Maternal Child Health service providers
Medicaid and other insurers
Page 73 of 126
Primary Healthcare providers
Faith-Based Organizations
Best Ideas – What Works:
Early entry into prenatal care
Interconceptional care
Mentoring
Action Steps:
Focus on “Life Course” Issues, increase Interconceptional Care Services
Coordinate efforts with the Urban League of Broward County’s Health Seminar Series
Educate Black women and families about the risks of infant mortality and provide available resources in
community (Empowerment Showers, Haitian TV, Island TV, Beacon, Daddy Boot Camps with 100
Black Men, etc.))
Promote prenatal care in the first trimester
Education on Safe Baby including safe sleep practices
Encourage and Promote breastfeeding through culturally sensitive education and support
Educate community on the importance of babies to stay in the mother’s womb for 39 weeks (MOD 39
week initiative)
Research “kid friendly” culturally sensitive elementary/ middle school programs that are evidenced
based and increase health outcomes
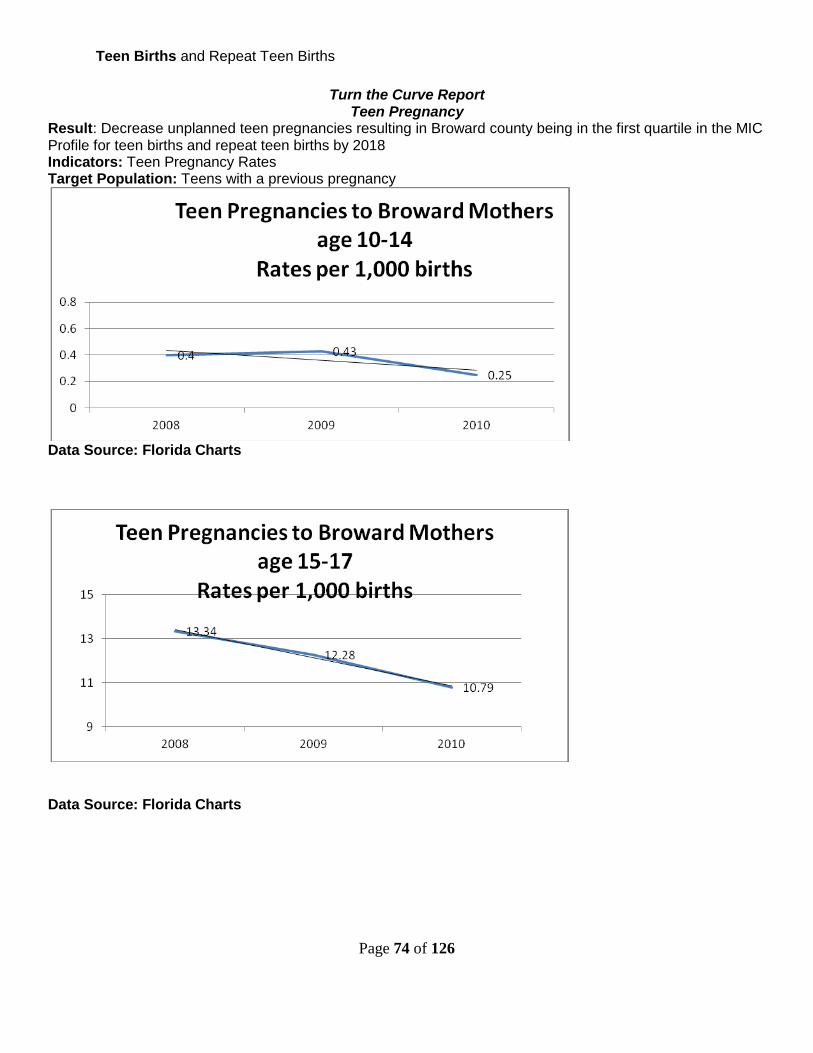
Page 74 of 126
Teen Births and Repeat Teen Births
Turn the Curve Report Teen Pregnancy
Result: Decrease unplanned teen pregnancies resulting in Broward county being in the first quartile in the MIC Profile for teen births and repeat teen births by 2018 Indicators: Teen Pregnancy Rates Target Population: Teens with a previous pregnancy
Data Source: Florida Charts
Data Source: Florida Charts
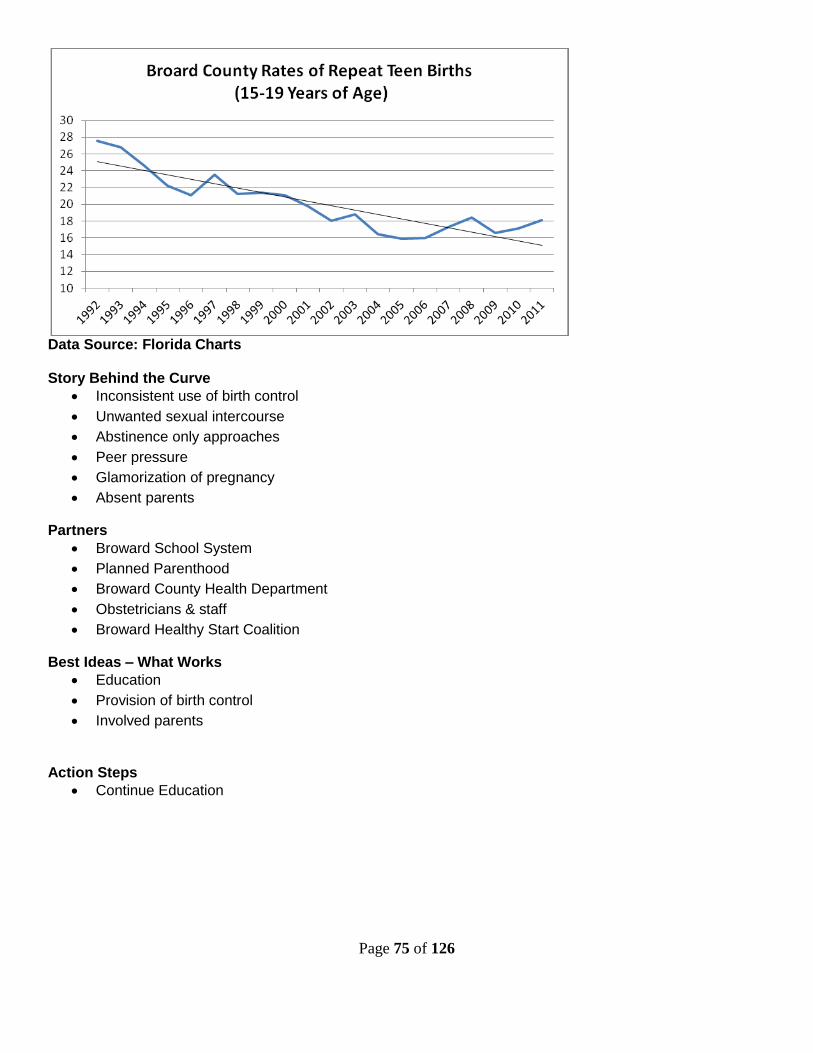
Page 75 of 126
Data Source: Florida Charts Story Behind the Curve
Inconsistent use of birth control
Unwanted sexual intercourse
Abstinence only approaches
Peer pressure
Glamorization of pregnancy
Absent parents
Partners
Broward School System
Planned Parenthood
Broward County Health Department
Obstetricians & staff
Broward Healthy Start Coalition
Best Ideas – What Works
Education
Provision of birth control
Involved parents
Action Steps
Continue Education
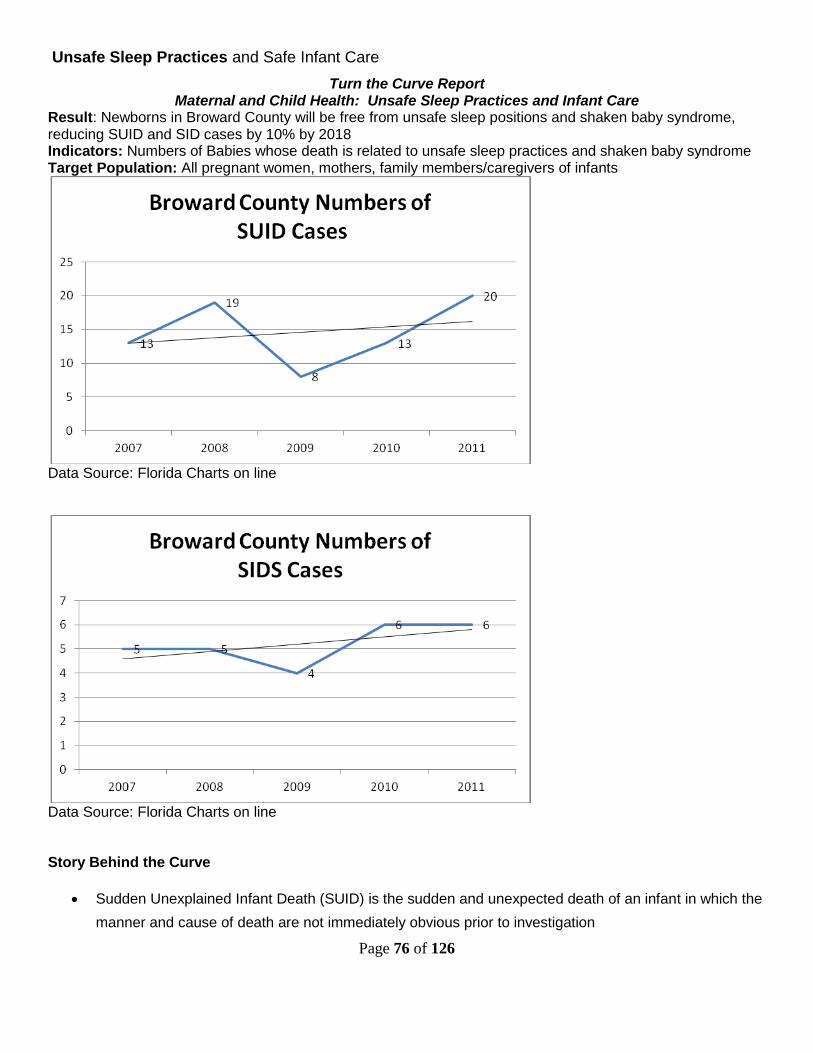
Page 76 of 126
Unsafe Sleep Practices and Safe Infant Care
Turn the Curve Report Maternal and Child Health: Unsafe Sleep Practices and Infant Care
Result: Newborns in Broward County will be free from unsafe sleep positions and shaken baby syndrome, reducing SUID and SID cases by 10% by 2018 Indicators: Numbers of Babies whose death is related to unsafe sleep practices and shaken baby syndrome Target Population: All pregnant women, mothers, family members/caregivers of infants
Data Source: Florida Charts on line
Data Source: Florida Charts on line Story Behind the Curve
Sudden Unexplained Infant Death (SUID) is the sudden and unexpected death of an infant in which the
manner and cause of death are not immediately obvious prior to investigation
Page 77 of 126
Sudden Infant Death syndrome (SIDS) is the sudden death of an infant under age 1 that cannot be
explained after a thorough investigation has been conducted, including a complete autopsy, an
examination of the death scene, and a review of the clinical history.
Not all of the SUIDS or SIDS cases are sleep related
Additional data is gathered through a perinatal periods of risk (PPOR) analysis by the FIMR CRT
There is minimal available data on shaken baby syndrome and the incidence is believed to be much
higher than currently reported
Partners
Healthy Mothers, Healthy Babies Coalition of Broward County
Broward Healthy Start Coalition
Children’s Services Council of Broward County
Broward County Medical Association
Broward County Health Department
Broward County Infant Mortality Case Review Team
Hospitals, OB/GYN’s, Pediatricians, Healthcare professionals
Best Ideas – What Works
Awareness and Education
Action Steps
Provide educational campaigns for healthcare professionals (Physicians, Nurses, Treatment Providers,
etc.)
Utilize Social Marketing messages
Cribs For Kids
Create a reliable data base for Shaken Baby syndrome
Provide substance abuse education at “Showers 2 Empower” events
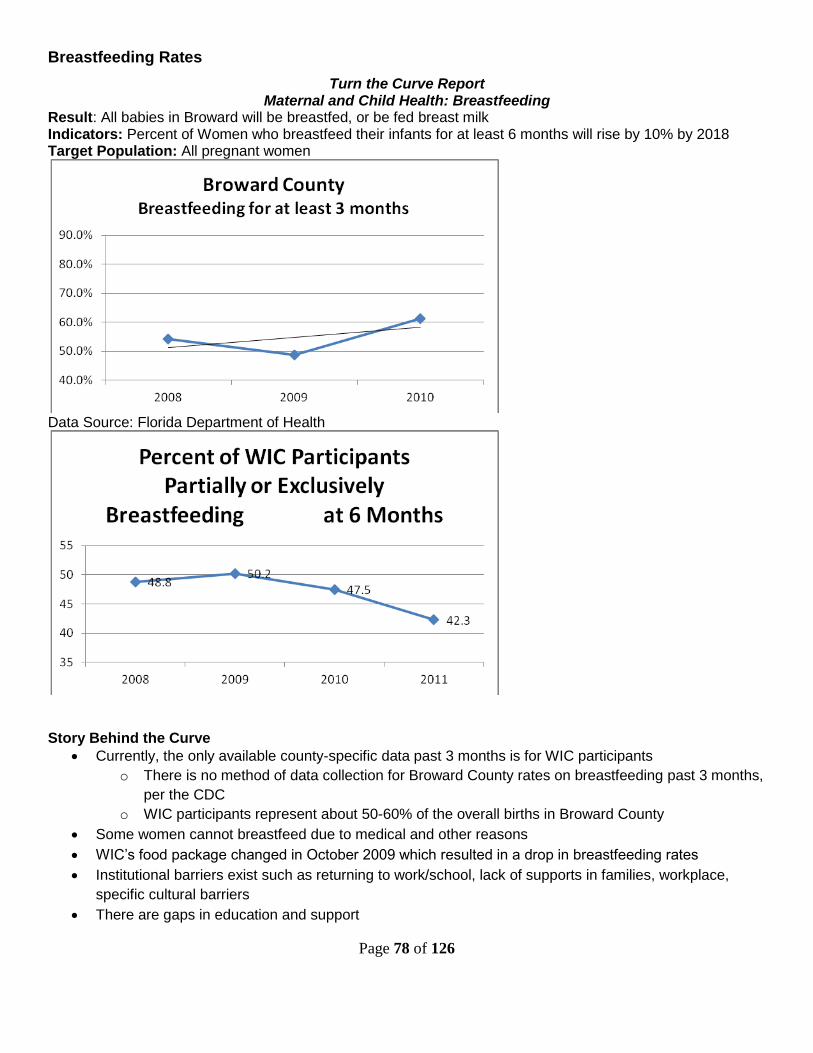
Page 78 of 126
Breastfeeding Rates
Turn the Curve Report Maternal and Child Health: Breastfeeding
Result: All babies in Broward will be breastfed, or be fed breast milk Indicators: Percent of Women who breastfeed their infants for at least 6 months will rise by 10% by 2018 Target Population: All pregnant women
Data Source: Florida Department of Health
Story Behind the Curve
Currently, the only available county-specific data past 3 months is for WIC participants
o There is no method of data collection for Broward County rates on breastfeeding past 3 months,
per the CDC
o WIC participants represent about 50-60% of the overall births in Broward County
Some women cannot breastfeed due to medical and other reasons
WIC’s food package changed in October 2009 which resulted in a drop in breastfeeding rates
Institutional barriers exist such as returning to work/school, lack of supports in families, workplace,
specific cultural barriers
There are gaps in education and support
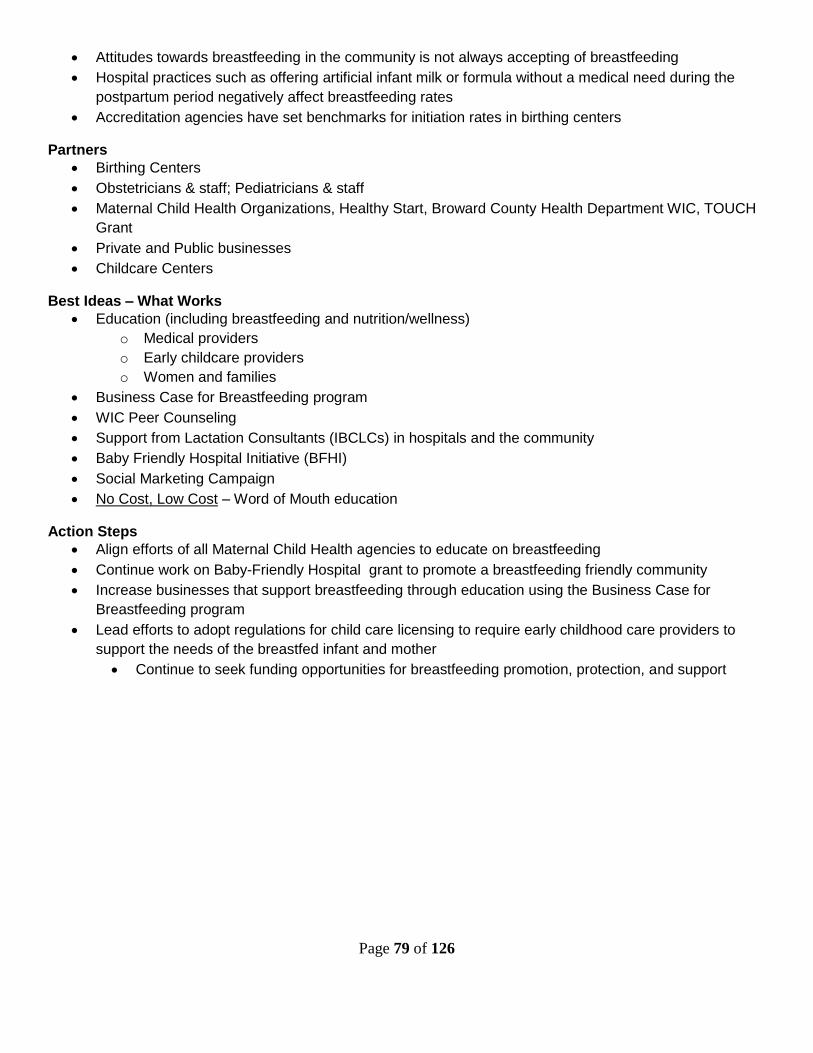
Page 79 of 126
Attitudes towards breastfeeding in the community is not always accepting of breastfeeding
Hospital practices such as offering artificial infant milk or formula without a medical need during the
postpartum period negatively affect breastfeeding rates
Accreditation agencies have set benchmarks for initiation rates in birthing centers
Partners
Birthing Centers
Obstetricians & staff; Pediatricians & staff
Maternal Child Health Organizations, Healthy Start, Broward County Health Department WIC, TOUCH
Grant
Private and Public businesses
Childcare Centers
Best Ideas – What Works
Education (including breastfeeding and nutrition/wellness)
o Medical providers
o Early childcare providers
o Women and families
Business Case for Breastfeeding program
WIC Peer Counseling
Support from Lactation Consultants (IBCLCs) in hospitals and the community
Baby Friendly Hospital Initiative (BFHI)
Social Marketing Campaign
No Cost, Low Cost – Word of Mouth education
Action Steps
Align efforts of all Maternal Child Health agencies to educate on breastfeeding
Continue work on Baby-Friendly Hospital grant to promote a breastfeeding friendly community
Increase businesses that support breastfeeding through education using the Business Case for
Breastfeeding program
Lead efforts to adopt regulations for child care licensing to require early childhood care providers to
support the needs of the breastfed infant and mother
Continue to seek funding opportunities for breastfeeding promotion, protection, and support
Page 80 of 126
Substance Exposed Newborns Turn the Curve Report
Maternal and Child Health: Substance Exposed Newborns Result: Newborns in Broward County will be drug free at birth, reducing the number to the 2005 rate Indicators: Numbers of hospital discharges of newborn infants with a diagnosis of drug withdrawal syndrome Target Population: Pregnant women, mothers and caregivers of infants who have screened positive for alcohol or harmful drugs
Source: AHCA
During this six year period Broward had an increase of 491% while the state average was 433% Story Behind the Curve
The data for the turn the curve report is limited to when physicians report a withdrawal symptom before
hospital discharge
Pain Clinics (Pill Mills) in Broward flourished during these years
Many moms are using these drugs “legally” through a doctor’s prescription
Medical protocols are restrictive for the detoxification of the mother while she is pregnant due to the
risks to the baby
Mom’s can be secretive with their healthcare providers about their legal and illegal drug use
The mother’s addiction may occur prior to the pregnancy
Many mothers do not understand the effects to their baby when they are using drugs, legal or illegal
Challenges related to access to the appropriate level of treatment and treatments are not always
effective
Fear of having the baby removed at birth (DCF) may prevent mothers from seeking drug treatment
Partners
Maternal Addiction Program (MAP) Staffing
BSO, DCF, ChildNet, KID, Healthy Families, Broward Healthy Start Coalition, 211
Treatment providers-Susan B Anthony, Plantation General Hospital, BARC, Spectrum, Family Central
Hospitals, OB/GYN’s, Pediatricians, Healthcare professionals, Methadone Clinics
Substance Abuse professionals
MCH service providers, Child Care Programs, Schools
Page 81 of 126
Best Ideas – What Works
Prevention, Awareness and Education
Effective Treatment with follow up
12 Step Groups
System of Care approaches
Legal oversight of doctors and clinics
Linkages between hospitals and organizations (DCF, etc.)
Abuse/Neglect reports from hotlines
Action Steps
Provide educational campaigns for healthcare professionals (Physicians, Nurses, Treatment Providers,
etc.)
Adopted as a strategy for the Broward Healthy Start Coalition Five Year Service Delivery Plan 2013 -
2018
Train MCH direct service staff on signs/symptoms and interventions for substance abusing clients
Utilize Healthy Start Community Liaisons to educate OB/GYN staff
Florida Alcohol and Drug Abuse Association (FADAA) has sent out a statewide survey to assess
service capacity and training needs to target this group
Utilize Social Marketing messages
Development of a “Getting a New Prescription Guide”
Increase access to effective treatments
Increase drug and alcohol screening by healthcare professionals
Investigate methods of increasing buy in by the entire MCH system for awareness, screening, referral
and treatment
Develop a dated base to track by zip code where the SEN reside
Provide substance abuse education at “Showers 2 Empower” events
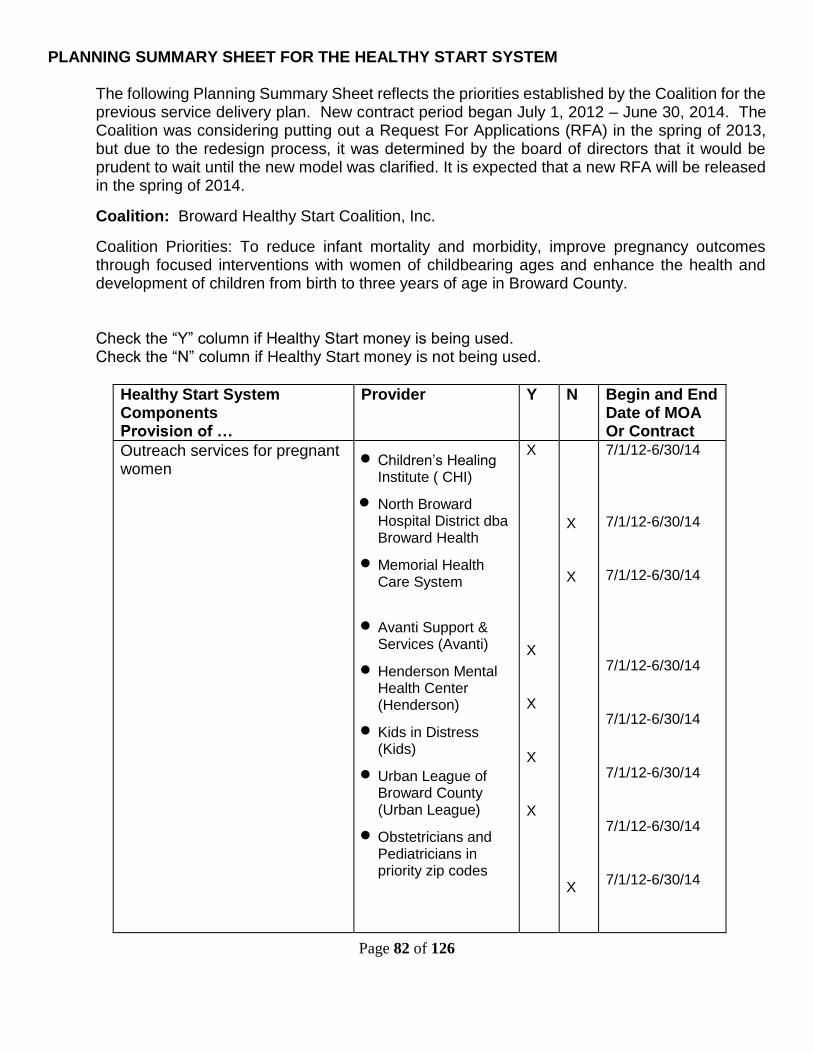
Page 82 of 126
PLANNING SUMMARY SHEET FOR THE HEALTHY START SYSTEM The following Planning Summary Sheet reflects the priorities established by the Coalition for the previous service delivery plan. New contract period began July 1, 2012 – June 30, 2014. The Coalition was considering putting out a Request For Applications (RFA) in the spring of 2013, but due to the redesign process, it was determined by the board of directors that it would be prudent to wait until the new model was clarified. It is expected that a new RFA will be released in the spring of 2014.
Coalition: Broward Healthy Start Coalition, Inc.
Coalition Priorities: To reduce infant mortality and morbidity, improve pregnancy outcomes through focused interventions with women of childbearing ages and enhance the health and development of children from birth to three years of age in Broward County.
Check the “Y” column if Healthy Start money is being used. Check the “N” column if Healthy Start money is not being used.
Healthy Start System Components Provision of …
Provider Y N Begin and End Date of MOA Or Contract
Outreach services for pregnant women
Children’s Healing Institute ( CHI)
North Broward Hospital District dba Broward Health
Memorial Health Care System
Avanti Support & Services (Avanti)
Henderson Mental Health Center (Henderson)
Kids in Distress (Kids)
Urban League of Broward County (Urban League)
Obstetricians and Pediatricians in priority zip codes
X X X X X
X X X
7/1/12-6/30/14 7/1/12-6/30/14 7/1/12-6/30/14 7/1/12-6/30/14 7/1/12-6/30/14 7/1/12-6/30/14 7/1/12-6/30/14 7/1/12-6/30/14
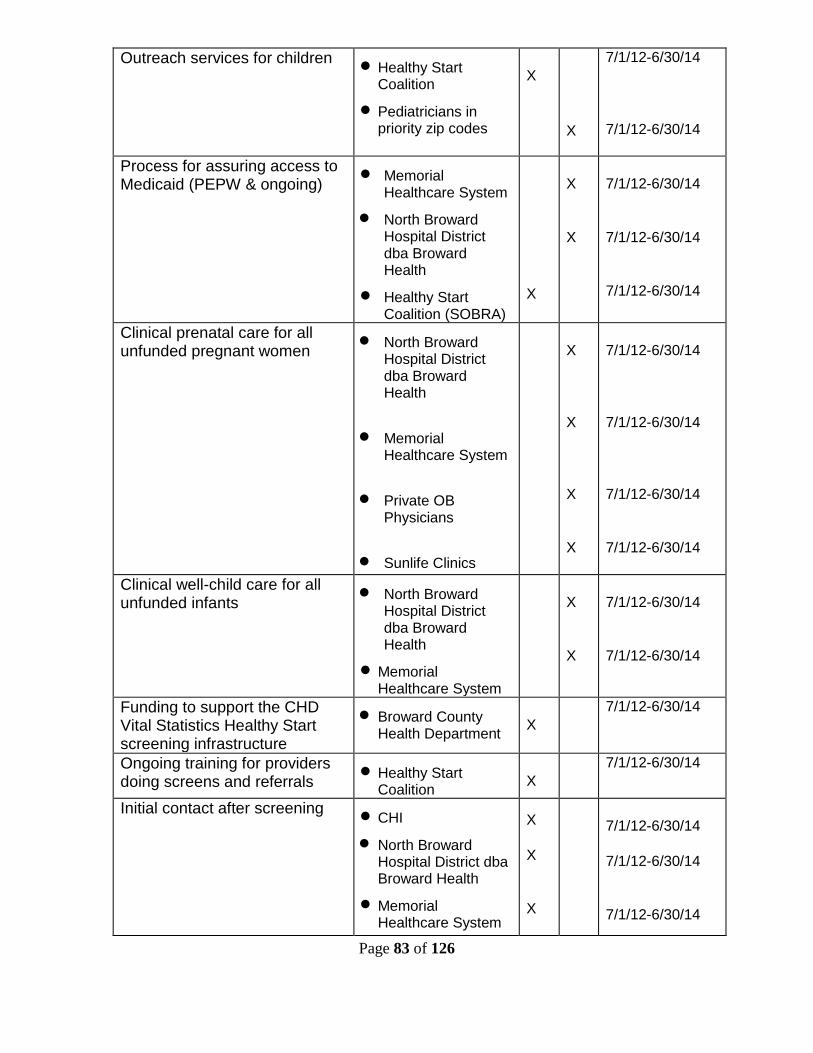
Page 83 of 126
Outreach services for children Healthy Start Coalition
Pediatricians in priority zip codes
X
X
7/1/12-6/30/14 7/1/12-6/30/14
Process for assuring access to Medicaid (PEPW & ongoing)
Memorial Healthcare System
North Broward Hospital District dba Broward Health
Healthy Start Coalition (SOBRA)
X
X X
7/1/12-6/30/14 7/1/12-6/30/14 7/1/12-6/30/14
Clinical prenatal care for all unfunded pregnant women
North Broward Hospital District dba Broward Health
Memorial Healthcare System
Private OB Physicians
Sunlife Clinics
X X X X
7/1/12-6/30/14 7/1/12-6/30/14 7/1/12-6/30/14 7/1/12-6/30/14
Clinical well-child care for all unfunded infants
North Broward Hospital District dba Broward Health
Memorial Healthcare System
X X
7/1/12-6/30/14 7/1/12-6/30/14
Funding to support the CHD Vital Statistics Healthy Start screening infrastructure
Broward County Health Department
X
7/1/12-6/30/14
Ongoing training for providers doing screens and referrals
Healthy Start Coalition
X
7/1/12-6/30/14
Initial contact after screening CHI
North Broward Hospital District dba Broward Health
Memorial Healthcare System
X X X
7/1/12-6/30/14 7/1/12-6/30/14 7/1/12-6/30/14
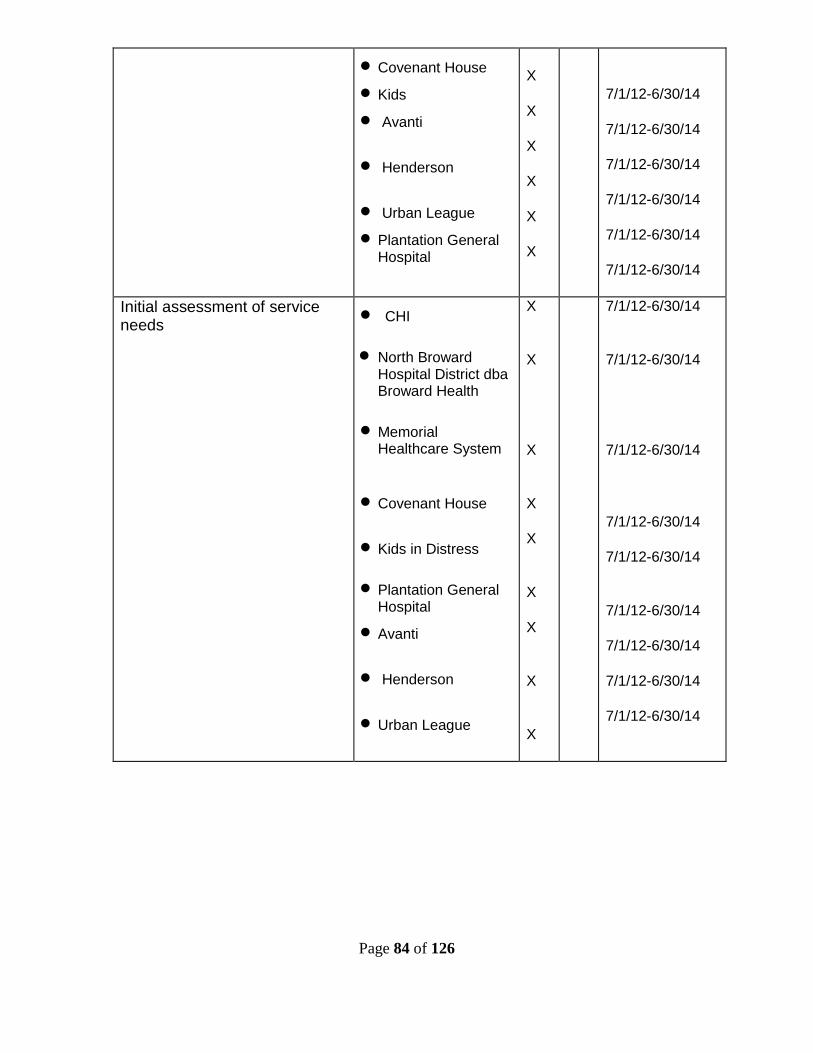
Page 84 of 126
Covenant House
Kids
Avanti
Henderson
Urban League
Plantation General Hospital
X X X X X X
7/1/12-6/30/14 7/1/12-6/30/14 7/1/12-6/30/14 7/1/12-6/30/14 7/1/12-6/30/14 7/1/12-6/30/14
Initial assessment of service needs
CHI
North Broward Hospital District dba Broward Health
Memorial Healthcare System
Covenant House
Kids in Distress
Plantation General Hospital
Avanti
Henderson
Urban League
X X X X X X X X X
7/1/12-6/30/14 7/1/12-6/30/14 7/1/12-6/30/14 7/1/12-6/30/14 7/1/12-6/30/14 7/1/12-6/30/14 7/1/12-6/30/14 7/1/12-6/30/14 7/1/12-6/30/14
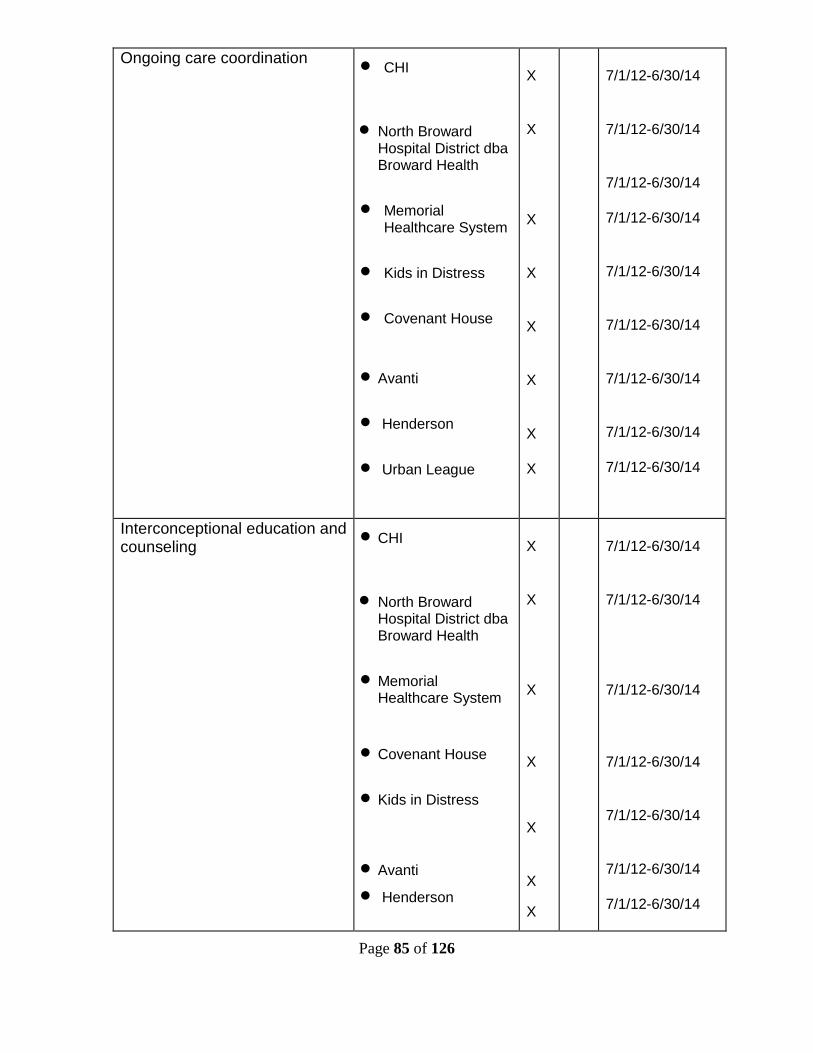
Page 85 of 126
Ongoing care coordination CHI
North Broward Hospital District dba Broward Health
Memorial Healthcare System
Kids in Distress
Covenant House
Avanti
Henderson
Urban League
X X X X X X X X
7/1/12-6/30/14 7/1/12-6/30/14 7/1/12-6/30/14 7/1/12-6/30/14 7/1/12-6/30/14 7/1/12-6/30/14 7/1/12-6/30/14 7/1/12-6/30/14 7/1/12-6/30/14
Interconceptional education and counseling
CHI
North Broward Hospital District dba Broward Health
Memorial Healthcare System
Covenant House
Kids in Distress
Avanti
Henderson
X X X X
X X
X
7/1/12-6/30/14 7/1/12-6/30/14 7/1/12-6/30/14 7/1/12-6/30/14 7/1/12-6/30/14 7/1/12-6/30/14 7/1/12-6/30/14
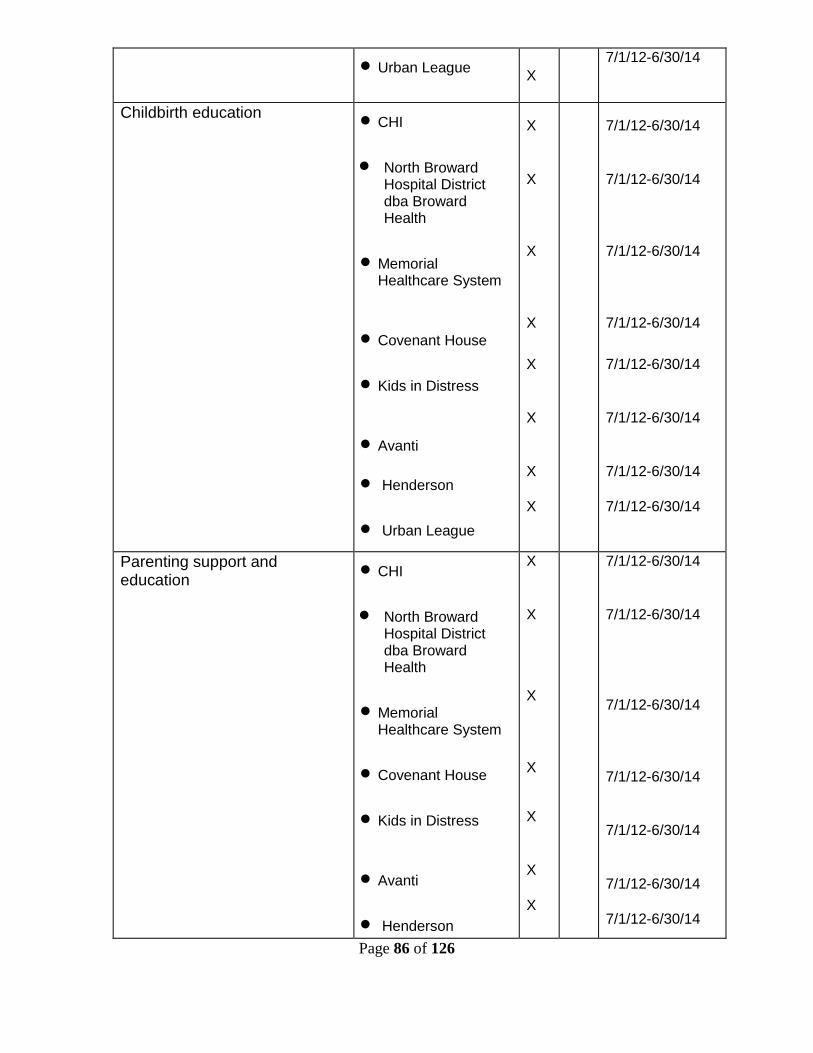
Page 86 of 126
Urban League X
7/1/12-6/30/14
Childbirth education CHI
North Broward Hospital District dba Broward Health
Memorial Healthcare System
Covenant House
Kids in Distress
Avanti
Henderson
Urban League
X X X X
X X X X
7/1/12-6/30/14 7/1/12-6/30/14 7/1/12-6/30/14 7/1/12-6/30/14
7/1/12-6/30/14 7/1/12-6/30/14 7/1/12-6/30/14 7/1/12-6/30/14
Parenting support and education
CHI
North Broward Hospital District dba Broward Health
Memorial Healthcare System
Covenant House
Kids in Distress
Avanti
Henderson
X X
X X
X X X
7/1/12-6/30/14 7/1/12-6/30/14 7/1/12-6/30/14 7/1/12-6/30/14 7/1/12-6/30/14 7/1/12-6/30/14 7/1/12-6/30/14
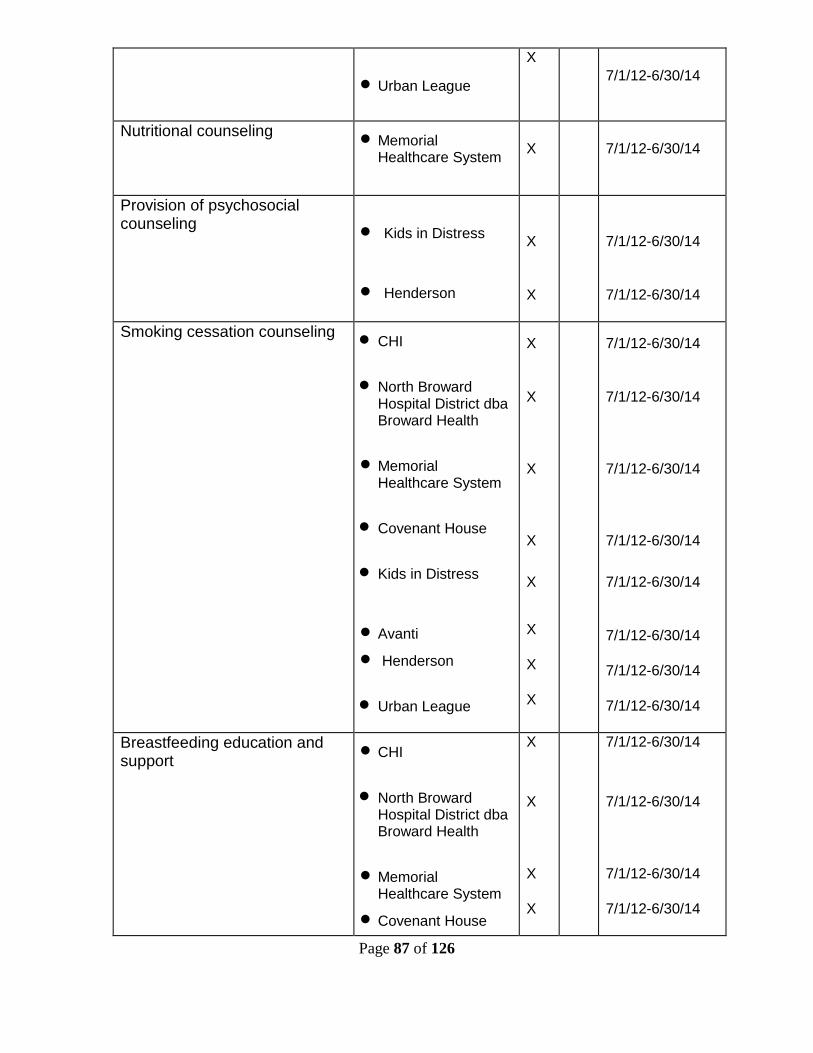
Page 87 of 126
Urban League
X
7/1/12-6/30/14
Nutritional counseling Memorial Healthcare System
X
7/1/12-6/30/14
Provision of psychosocial counseling
Kids in Distress
Henderson
X X
7/1/12-6/30/14 7/1/12-6/30/14
Smoking cessation counseling CHI
North Broward Hospital District dba Broward Health
Memorial Healthcare System
Covenant House
Kids in Distress
Avanti
Henderson
Urban League
X X X X
X
X X X
7/1/12-6/30/14 7/1/12-6/30/14 7/1/12-6/30/14 7/1/12-6/30/14
7/1/12-6/30/14 7/1/12-6/30/14 7/1/12-6/30/14 7/1/12-6/30/14
Breastfeeding education and support
CHI
North Broward Hospital District dba Broward Health
Memorial Healthcare System
Covenant House
X
X X X
7/1/12-6/30/14
7/1/12-6/30/14 7/1/12-6/30/14 7/1/12-6/30/14
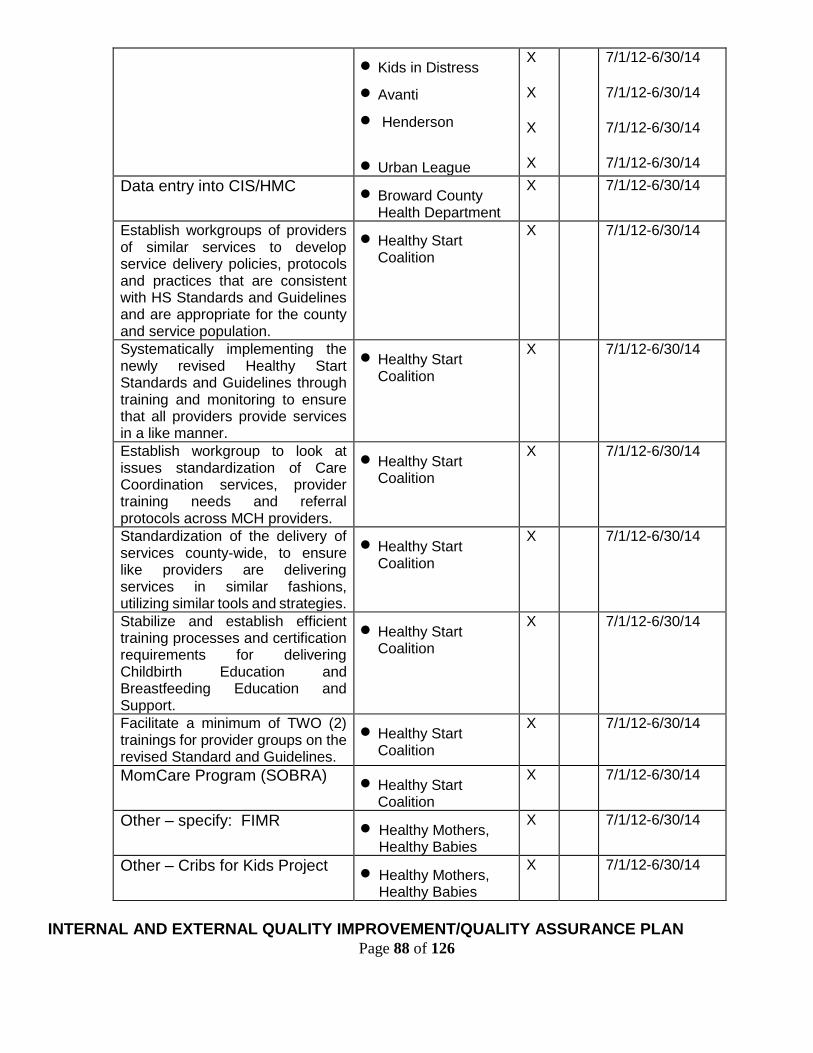
Page 88 of 126
Kids in Distress
Avanti
Henderson
Urban League
X X X X
7/1/12-6/30/14 7/1/12-6/30/14 7/1/12-6/30/14 7/1/12-6/30/14
Data entry into CIS/HMC Broward County Health Department
X 7/1/12-6/30/14
Establish workgroups of providers of similar services to develop service delivery policies, protocols and practices that are consistent with HS Standards and Guidelines and are appropriate for the county and service population.
Healthy Start Coalition
X 7/1/12-6/30/14
Systematically implementing the newly revised Healthy Start Standards and Guidelines through training and monitoring to ensure that all providers provide services in a like manner.
Healthy Start Coalition
X 7/1/12-6/30/14
Establish workgroup to look at issues standardization of Care Coordination services, provider training needs and referral protocols across MCH providers.
Healthy Start Coalition
X 7/1/12-6/30/14
Standardization of the delivery of services county-wide, to ensure like providers are delivering services in similar fashions, utilizing similar tools and strategies.
Healthy Start Coalition
X 7/1/12-6/30/14
Stabilize and establish efficient training processes and certification requirements for delivering Childbirth Education and Breastfeeding Education and Support.
Healthy Start Coalition
X 7/1/12-6/30/14
Facilitate a minimum of TWO (2) trainings for provider groups on the revised Standard and Guidelines.
Healthy Start Coalition
X 7/1/12-6/30/14
MomCare Program (SOBRA) Healthy Start Coalition
X 7/1/12-6/30/14
Other – specify: FIMR
Healthy Mothers, Healthy Babies
X 7/1/12-6/30/14
Other – Cribs for Kids Project Healthy Mothers, Healthy Babies
X 7/1/12-6/30/14
INTERNAL AND EXTERNAL QUALITY IMPROVEMENT/QUALITY ASSURANCE PLAN
Page 89 of 126
Since inception, Broward’s Coalition has remained committed to providing Screening, Assessment, Care
Coordination and Educational services to children, 0-3 years, and pregnant women, who are determined
to be at risk for poor birth, health and developmental outcomes based on risk screens.
To this end, the Coalition has sought to continuously improve the quality of its programs and services
and has designed and implemented a Quality Improvement and Quality Assurance plan (QI/QA). This
plan serves to monitor and guide the objectives of the Coalition and is used and amended regularly in
response to processes of service provision, client and stakeholder satisfaction, and community health
trends. The QI/QA plan drives continuous improvements through monitoring the achievement, outcomes
and performance measurements established by the Coalition. Additionally, it helps the Coalition to define
funding strategies, and allows for the identification of providers’ needs for technical assistance after funds
are disbursed. This plan has served to ensure that Healthy Start services are delivered in compliance
with Healthy Start Standards and Guidelines as developed by the State of Florida, Department of Health.
An updated and refined plan serves to outline compliance activities and establishes accountability for all
aspects of services funded by the Coalition.
BROWARD COALITION COMMITTEES
In accordance with Coalition by-laws and in response to the Coalition’s delivery of services committees
are convened and are charged with varying levels and types of responsibilities. Committees are
composed of community members, service providers and are supported by administrative staff, with the
overall expectations of improving the Healthy Start care coordination system, monitoring external
contracts and guiding internal processes. The following is a list of current committees charged with
managing the Healthy Start System:
A. Board of Directors
B. Executive/Finance Committee
C. Maternal Child Health Systems Committee (Membership)
D. Allocations Committee
E. By-Laws Committee
F. Continuous Quality Improvement (CQI) Committee
G. Fetal and Infant Mortality Review (FIMR) Community Action Group
H. Nominating Committee
I. Service Delivery Plan Committee

Page 90 of 126
REPORTING REQUIREMENTS
A. Monthly Reports
B. Quarterly Reports
C. Annual Reports
D. Financial Reports
PROGRAM AUDIT
The Coalition performs at least one annual audit of Healthy Start contracted providers. The audit may
include, but is not limited to:
1. Case Record Reviews
2. Site Visits and Observations
3. Review and Audits of Personnel Files
4. Financial Audits
5. Client Satisfaction Surveys
6. Meetings with Staff and Personnel
The annual audit consists of three parts:
1. An entrance interview with the provider staff responsible for managing Healthy Start
Services
2. Record review of randomly selected prenatal and postnatal records utilizing HMS
3. An exit interview with the program manager and other contracted provider staff to discuss
the strengths of the services provided, highlight concerns during the audit and to negotiate
strategies for improvement
The QA/QI Manager prepares a report of findings for the CQI committee for review and recommendations
for improving provider service quality. Upon review and acceptance by the CQI, the contracted provider
is provided a copy. Providers found to be non compliant with the contract are required to formulate a
corrective action plan which must be furnished to the Coalition no later than 10 days of receipt of the
audit report. The CQI committee reviews the corrective action plan and approves as is necessary.
PERFORMANCE BASED CONTRACTS
Page 91 of 126
In efforts to best meet the needs of the community and aid the Coalition and its committees in the
selection and funding of service providers, the Coalition has elected the Request for Proposal Process
(RFP). This process is believed to promote fairness, objectivity and impartiality. Currently, the process
allows for annual contract renewals with all services extended for bidding every third year and adheres
to the following processes:
Advertisement of the Coalition's intentions of RFP with goals, objectives and services
highlighted
Request Letters of Intent with deadline for submission develop RFP's and advertise
Pre-bid Conference within one week of RFP's
Establish object scoring committee and protocols
Receive Proposals
Ensure objective scoring
Contract Selection
Contract Negotiations
Transition Contracts
Service Implementation
Annual contract renewal has been determined based on provider performance with updates made by the CQI
Committee. The Board of Directors has made and will continue to make final decisions on all contracts.
Assuring Quality in the area of contract compliance is one of the primary goals of the QI/QA process. The
diagram below identifies how BHSC approaches this area, and how it deals with non-compliance.
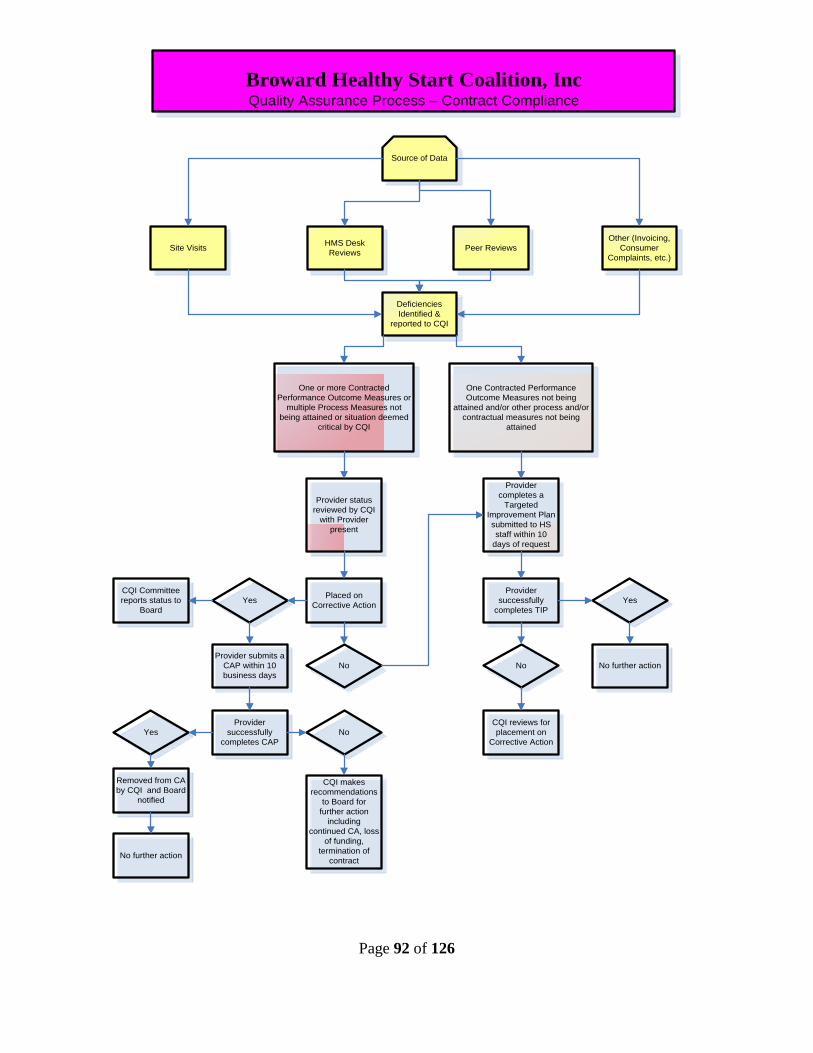
Page 92 of 126
Deficiencies
Identified &
reported to CQI
HMS Desk
ReviewsSite Visits Peer Reviews
Other (Invoicing,
Consumer
Complaints, etc.)
One or more Contracted
Performance Outcome Measures or
multiple Process Measures not
being attained or situation deemed
critical by CQI
One Contracted Performance
Outcome Measures not being
attained and/or other process and/or
contractual measures not being
attained
Source of Data
Provider
completes a
Targeted
Improvement Plan
submitted to HS
staff within 10
days of request
Placed on
Corrective ActionYes
No
CQI Committee
reports status to
Board
Provider submits a
CAP within 10
business days
Provider
successfully
completes CAP
Yes No
Removed from CA
by CQI and Board
notified
CQI makes
recommendations
to Board for
further action
including
continued CA, loss
of funding,
termination of
contract
Provider status
reviewed by CQI
with Provider
present
Yes
No
Provider
successfully
completes TIP
No further action
CQI reviews for
placement on
Corrective Action
Broward Healthy Start Coalition, IncQuality Assurance Process – Contract Compliance
No further action
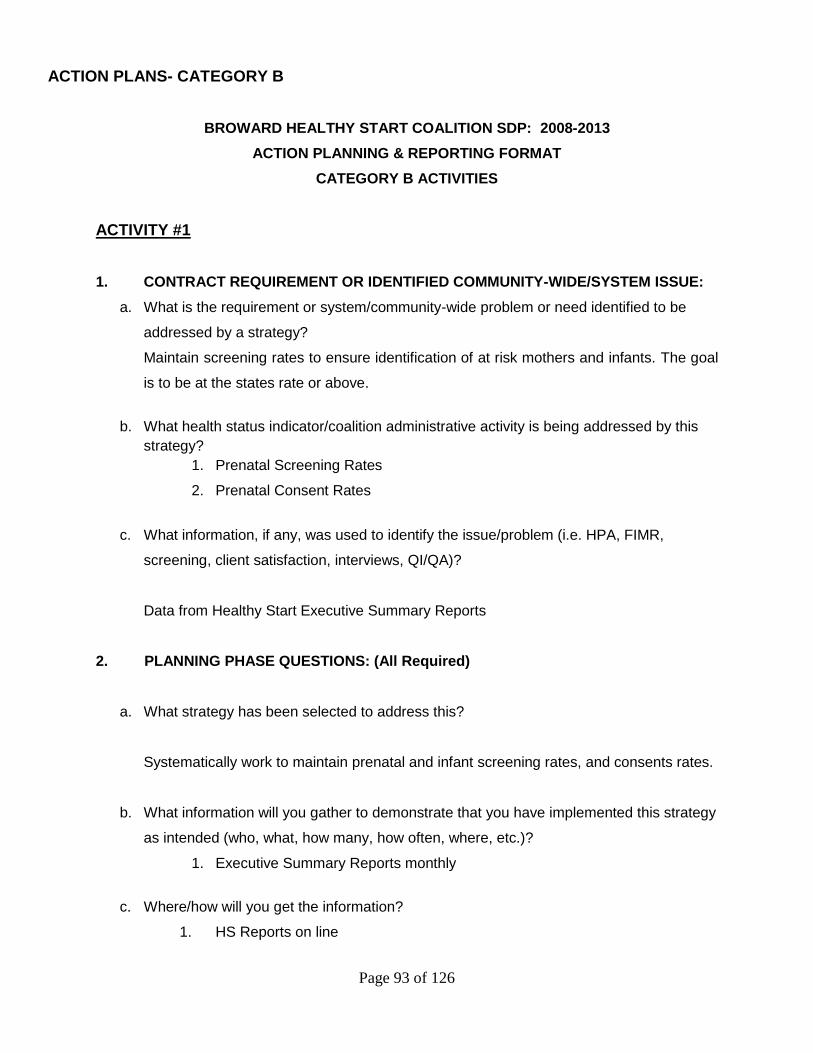
Page 93 of 126
ACTION PLANS- CATEGORY B
BROWARD HEALTHY START COALITION SDP: 2008-2013
ACTION PLANNING & REPORTING FORMAT
CATEGORY B ACTIVITIES
ACTIVITY #1
1. CONTRACT REQUIREMENT OR IDENTIFIED COMMUNITY-WIDE/SYSTEM ISSUE:
a. What is the requirement or system/community-wide problem or need identified to be
addressed by a strategy?
Maintain screening rates to ensure identification of at risk mothers and infants. The goal
is to be at the states rate or above.
b. What health status indicator/coalition administrative activity is being addressed by this
strategy?
1. Prenatal Screening Rates
2. Prenatal Consent Rates
c. What information, if any, was used to identify the issue/problem (i.e. HPA, FIMR,
screening, client satisfaction, interviews, QI/QA)?
Data from Healthy Start Executive Summary Reports
2. PLANNING PHASE QUESTIONS: (All Required)
a. What strategy has been selected to address this?
Systematically work to maintain prenatal and infant screening rates, and consents rates.
b. What information will you gather to demonstrate that you have implemented this strategy
as intended (who, what, how many, how often, where, etc.)?
1. Executive Summary Reports monthly
c. Where/how will you get the information?
1. HS Reports on line
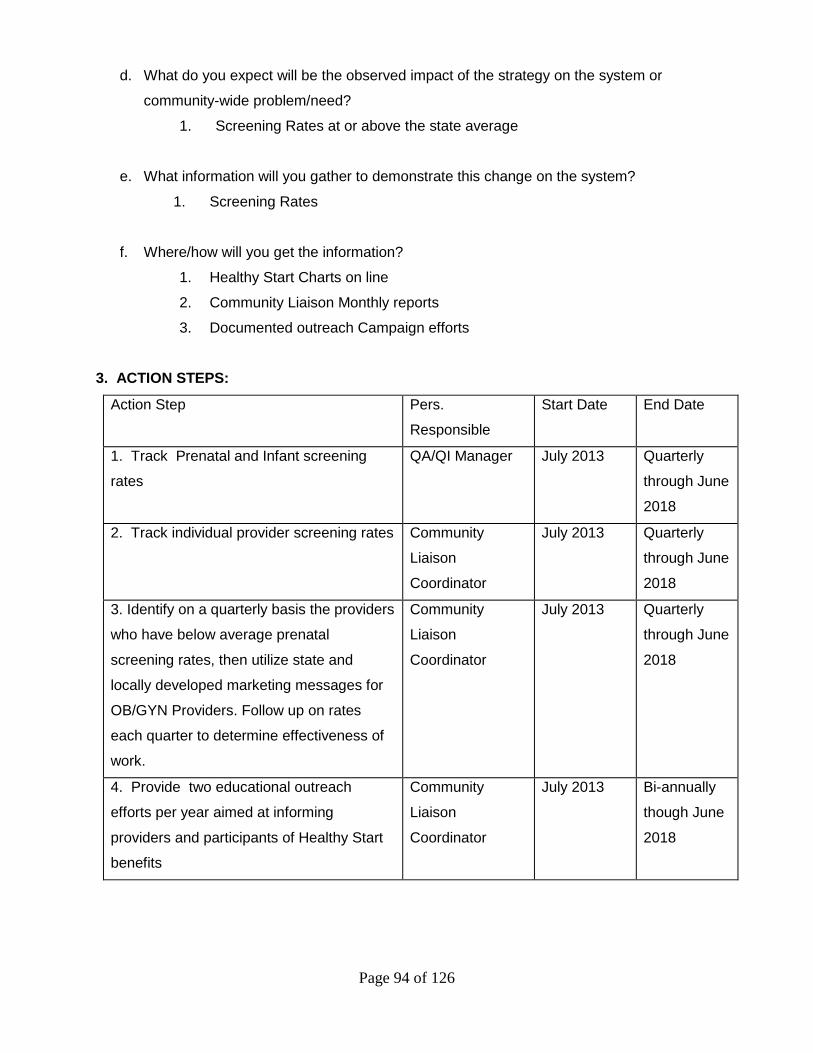
Page 94 of 126
d. What do you expect will be the observed impact of the strategy on the system or
community-wide problem/need?
1. Screening Rates at or above the state average
e. What information will you gather to demonstrate this change on the system?
1. Screening Rates
f. Where/how will you get the information?
1. Healthy Start Charts on line
2. Community Liaison Monthly reports
3. Documented outreach Campaign efforts
3. ACTION STEPS:
Action Step Pers.
Responsible
Start Date End Date
1. Track Prenatal and Infant screening
rates
QA/QI Manager July 2013 Quarterly
through June
2018
2. Track individual provider screening rates Community
Liaison
Coordinator
July 2013 Quarterly
through June
2018
3. Identify on a quarterly basis the providers
who have below average prenatal
screening rates, then utilize state and
locally developed marketing messages for
OB/GYN Providers. Follow up on rates
each quarter to determine effectiveness of
work.
Community
Liaison
Coordinator
July 2013 Quarterly
through June
2018
4. Provide two educational outreach
efforts per year aimed at informing
providers and participants of Healthy Start
benefits
Community
Liaison
Coordinator
July 2013 Bi-annually
though June
2018
Page 95 of 126
Quarterly Progress for __________________________
Quarterly Progress for ___________________________
Quarterly Progress for __________________________
Quarterly Progress for __________________________
4. REPORTING PHASE ANSWERS: (To be completed for the Annual Action Plan Update)
a. Demonstrate that you have implemented this strategy as planned (who, what, how
many, how often, where, etc.).
b. Demonstrate the changes in the system/community.
c. Will you drop/modify/expand/continue strategy next year?
Page 96 of 126
ACTIVITY #2
1. CONTRACT REQUIREMENT OR IDENTIFIED COMMUNITY-WIDE/SYSTEM ISSUE:
a. What is the requirement or system/community-wide problem or need identified to be
addressed by a strategy?
Increase the health of mothers and babies through educational efforts aimed at increasing breastfeeding rates
b. What health status indicator/coalition administrative activity is being addressed by this
strategy?
1. Breastfeeding Education Units of Service
2. System efforts to increase community knowledge of breastfeeding and its
benefits
c. What information, if any, was used to identify the issue/problem (i.e. HPA, FIMR,
screening, client satisfaction, interviews, QI/QA)?
1. Data from HS Reports online indicated a increase in breastfeeding service
units
2. Numbers of organizations in Broward that have a Business Case for
Breastfeeding policy
3. Training logs
2. PLANNING PHASE QUESTIONS: (All Required)
a. What strategy has been selected to address this?
1. Continual review of breastfeeding educational service units
2. Inform the community of the advantages of supporting breastfeeding at work
sites
3. Provide systematic trainings for providers with a special emphasis on
Breastfeeding

Page 97 of 126
b. What information will you gather to demonstrate that you have implemented this strategy
as intended (who, what, how many, how often, where, etc.)?
1. Data demonstrating maintaining of the service units of breastfeeding
2. Numbers of organizations that have a policy on breastfeeding meeting the
standards of the Business Case for Breastfeeding
c. Where/how will you get the information?
1. Service Units from HS Reports on line
2. Copies of policies
d. What do you expect will be the observed impact of the strategy on the system or
community-wide problem/need?
1. Breastfeeding initiation and sustainability rates will increase amongst
women receiving Healthy Start services
2. Increased numbers of women breastfeeding
e. What information will you gather to demonstrate this change on the system?
1. Units of Healthy Start Services
2. Breastfeeding sustainability rates
f. Where/how will you get the information?
1. Healthy Start Charts on line
2. Local health department WIC department
3. ACTION STEPS:
Action Step Pers.
Responsible
Start Date End Date
1. Maintain a pool of trainers for Breastfeeding education
QA/QI Manager July 2013 June 2018
5. 2. Develop a plan for increasing the number of organizations endorsing the Business Case for Breastfeeding
Associate
Director/QA/QI
Manager
July 2013 June 2014
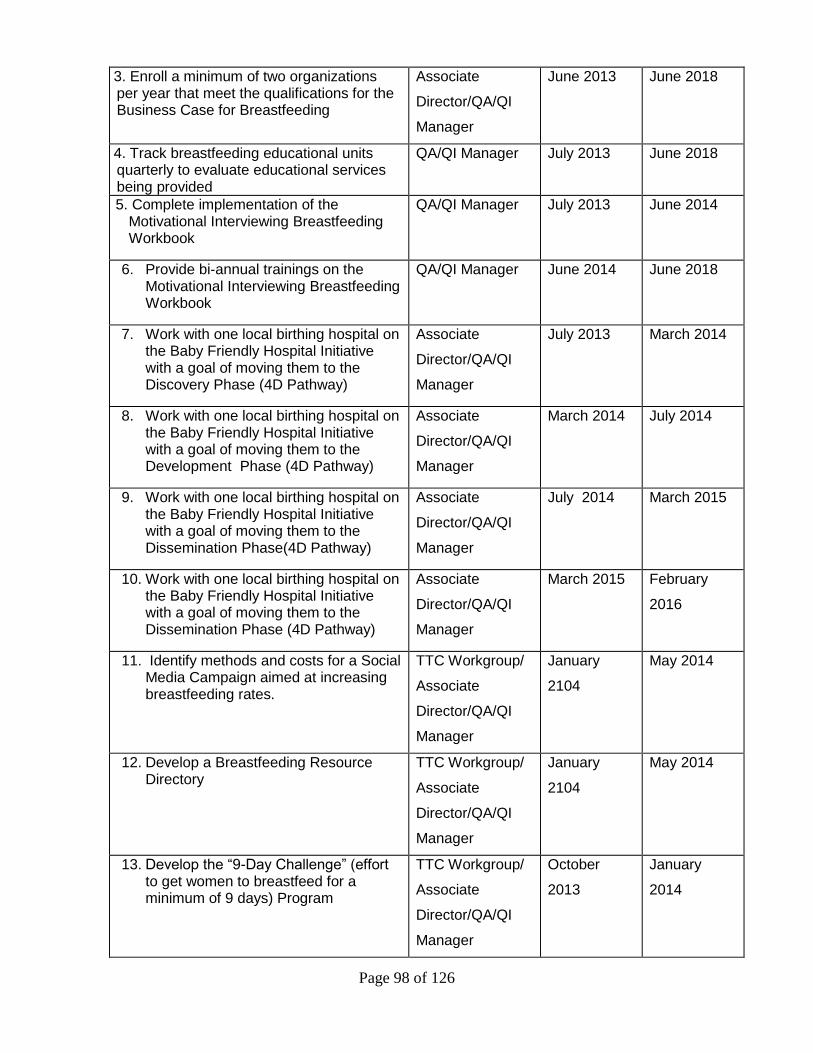
Page 98 of 126
6. 3. Enroll a minimum of two organizations per year that meet the qualifications for the Business Case for Breastfeeding
Associate
Director/QA/QI
Manager
June 2013 June 2018
7. 4. Track breastfeeding educational units quarterly to evaluate educational services being provided
QA/QI Manager July 2013 June 2018
5. Complete implementation of the Motivational Interviewing Breastfeeding Workbook
QA/QI Manager July 2013
June 2014
6. Provide bi-annual trainings on the Motivational Interviewing Breastfeeding Workbook
QA/QI Manager June 2014 June 2018
7. Work with one local birthing hospital on the Baby Friendly Hospital Initiative with a goal of moving them to the Discovery Phase (4D Pathway)
Associate
Director/QA/QI
Manager
July 2013 March 2014
8. Work with one local birthing hospital on the Baby Friendly Hospital Initiative with a goal of moving them to the Development Phase (4D Pathway)
Associate
Director/QA/QI
Manager
March 2014 July 2014
9. Work with one local birthing hospital on the Baby Friendly Hospital Initiative with a goal of moving them to the Dissemination Phase(4D Pathway)
Associate
Director/QA/QI
Manager
July 2014 March 2015
10. Work with one local birthing hospital on the Baby Friendly Hospital Initiative with a goal of moving them to the Dissemination Phase (4D Pathway)
Associate
Director/QA/QI
Manager
March 2015 February
2016
11. Identify methods and costs for a Social Media Campaign aimed at increasing breastfeeding rates.
TTC Workgroup/
Associate
Director/QA/QI
Manager
January
2104
May 2014
12. Develop a Breastfeeding Resource Directory
TTC Workgroup/
Associate
Director/QA/QI
Manager
January
2104
May 2014
13. Develop the “9-Day Challenge” (effort to get women to breastfeed for a minimum of 9 days) Program
TTC Workgroup/
Associate
Director/QA/QI
Manager
October
2013
January
2014
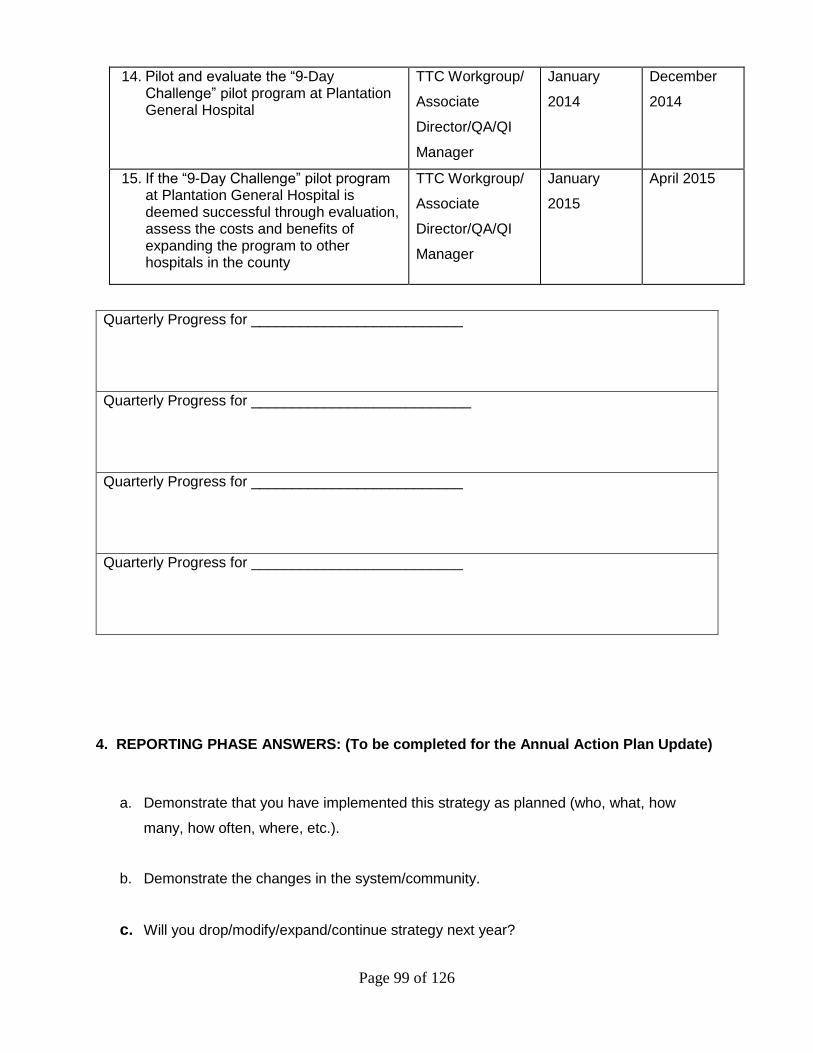
Page 99 of 126
14. Pilot and evaluate the “9-Day Challenge” pilot program at Plantation General Hospital
TTC Workgroup/
Associate
Director/QA/QI
Manager
January
2014
December
2014
15. If the “9-Day Challenge” pilot program at Plantation General Hospital is deemed successful through evaluation, assess the costs and benefits of expanding the program to other hospitals in the county
TTC Workgroup/
Associate
Director/QA/QI
Manager
January
2015
April 2015
Quarterly Progress for __________________________
Quarterly Progress for ___________________________
Quarterly Progress for __________________________
Quarterly Progress for __________________________
4. REPORTING PHASE ANSWERS: (To be completed for the Annual Action Plan Update)
a. Demonstrate that you have implemented this strategy as planned (who, what, how
many, how often, where, etc.).
b. Demonstrate the changes in the system/community.
c. Will you drop/modify/expand/continue strategy next year?

Page 100 of 126
ACTIVITY #3
1. CONTRACT REQUIREMENT OR IDENTIFIED COMMUNITY-WIDE/SYSTEM ISSUE:
a. What is the requirement or system/community-wide problem or need identified to be
addressed by a strategy?
The Black infant mortality rate is greater than two times that of White, 1.2% Black to .5%
White.
According to a recently conducted study using PPOR methodology, for every 1,000 babies born in Broward County, 12 Black babies die, compared to five White. Maternal Health and Infant care have been found to be positive contributing factors for the disparities found in infant mortality. Findings from BIHPI focus groups indicate a lack of maternal health care due to issues of access, perceived racism, income/insurance and legal residency. Zip codes that have been identified as high risk for Black infant mortality include 33004, 33020, 33023, 33060, 33064, 33068, 33069, 33311, 33312, and 33313.
b. What health status indicator/coalition administrative activity is being addressed by this
strategy?
1. Infant Mortality rates 2. Black Infant Mortality rates 3. Pregnant women receiving prenatal care in the first trimester
c. What information, if any, was used to identify the issue/problem (i.e. HPA, FIMR,
screening, client satisfaction, interviews, QI/QA)?
1. Fetal Infant Mortality Review (FIMR)
2. State Data
2. PLANNING PHASE QUESTIONS: (All Required)
a. What strategy has been selected to address this?
1. Implement research informed strategies to reduce black infant mortality rates
2. Provide educational outreach efforts aimed at informing high risk maternal
populations of health practices that will reduce their likelihood of a poor birth
outcome
b. What information will you gather to demonstrate that you have implemented this strategy
as intended (who, what, how many, how often, where, etc.)?

Page 101 of 126
1. Mortality rates of both White and Black infants analyzed on a annual basis
2. A minimum of 2% decrease in Black infant mortality rates by 2018.
c. Where/how will you get the information?
1. Florida Charts
d. What do you expect will be the observed impact of the strategy on the system or
community-wide problem/need?
1. Decreased rates of infant mortality
2. Decreased rates of Black infant mortality
3. Decreased rates of racial disparity in infant mortality
4. Increased community awareness
e. What information will you gather to demonstrate this change on the system?
1. Mortality rates
f. Where/how will you get the information?
1. Healthy Start Charts on line
3. ACTION STEPS:
Action Step Pers.
Responsible
Start Date End Date
1. Continual implementation of marketing messages for families of childbearing ages that emphasize the importance of folic acid, treating infections and oral health care during before, during and after pregnancy
Executive
Director and
QA/QI Manager
and Public
Relations
Committee
July 2013 June
2018
2. Develop and establish contractual language that requires contracted providers to recruit and retain multilingual staff to provide linguistically competent services
Executive Direct,
Contract Manager
and QA/QI
Manager
July 2013 June
2018
3. Implement action steps from the BIHPI Turn the Curve Plan
Executive
Director and
July 2013 June
2018
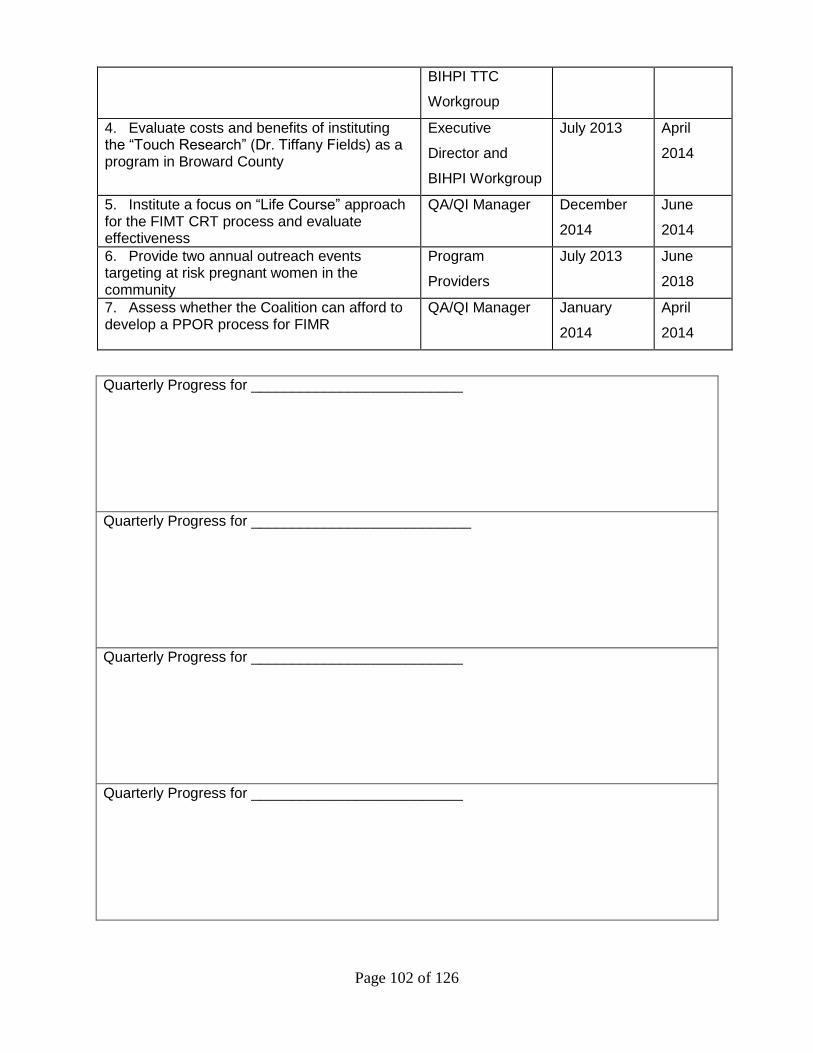
Page 102 of 126
BIHPI TTC
Workgroup
4. Evaluate costs and benefits of instituting the “Touch Research” (Dr. Tiffany Fields) as a program in Broward County
Executive
Director and
BIHPI Workgroup
July 2013 April
2014
5. Institute a focus on “Life Course” approach for the FIMT CRT process and evaluate effectiveness
QA/QI Manager December
2014
June
2014
6. Provide two annual outreach events targeting at risk pregnant women in the community
Program
Providers
July 2013 June
2018
7. Assess whether the Coalition can afford to develop a PPOR process for FIMR
QA/QI Manager January
2014
April
2014
Quarterly Progress for __________________________
Quarterly Progress for ___________________________
Quarterly Progress for __________________________
Quarterly Progress for __________________________

Page 103 of 126
4. REPORTING PHASE ANSWERS: (To be completed for the Annual Action Plan Update)
a. Demonstrate that you have implemented this strategy as planned (who, what, how
many, how often, where, etc.).
b. Demonstrate the changes in the system/community.
c. Will you drop/modify/expand/continue strategy next year?

Page 104 of 126
ACTIVITY #4
1. CONTRACT REQUIREMENT OR IDENTIFIED COMMUNITY-WIDE/SYSTEM ISSUE:
a. What is the requirement or system/community-wide problem or need identified to be
addressed by a strategy?
Increased rates of late preterm births
b. What health status indicator/coalition administrative activity is being addressed by this
strategy?
1. Birth weights
2. Rates of preterm births
c. What information, if any, was used to identify the issue/problem (i.e. HPA, FIMR,
screening, client satisfaction, interviews, QI/QA)?
1. Florida Charts data
2. PLANNING PHASE QUESTIONS: (All Required)
a. What strategy has been selected to address this?
1. Work with MCH healthcare staff to inform of the risks involved in late preterm
elective indications and cesarean sections
2. Develop and implement research informed strategies targeting pregnant
women with the goal of reducing the number of elective indications and
cesarean sections
b. What information will you gather to demonstrate that you have implemented this strategy
as intended (who, what, how many, how often, where, etc.)?
1. Rates of Late preterm births (<37 weeks)
c. Where/how will you get the information?
1. Florida Charts

Page 105 of 126
d. What do you expect will be the observed impact of the strategy on the system or
community-wide problem/need?
1. Increased birth weights
2. Longer gestational periods for women
3. Reduced stays in NICU’s
e. What information will you gather to demonstrate this change on the system?
1. Birth weights (Low and Very Low)
2. Rates of preterm births
f. Where/how will you get the information?
1. Healthy Start Charts online
3. ACTION STEPS:
Action Step Pers.
Responsible
Start Date End Date
1. Implement strategies on Turn the Curve Reports for Late Preterm births
TTC
Workgroup/QA/QI
Manager
January
2013
June 2018
2. Develop a workbook to use with pregnant women that uses Motivational Interviewing to persuade women to wait to not choose elective inductions and non medical necessitated cesarean sections.
QA/QI Manager January
2014
July 2014
3. Pilot a workbook to use with pregnant women that uses Motivational Interviewing to persuade women to wait to not choose elective inductions and non medical necessitated cesarean sections. with 15 Care Coordinators
QA/QI Manager July 2014 December
2014
4. Receive feedback on workbook, revise as needed
QA/QI Manager January
2015
March
2015
5. Implement workbook through training and distribution
QA/QI Manager April 2015 June 2018
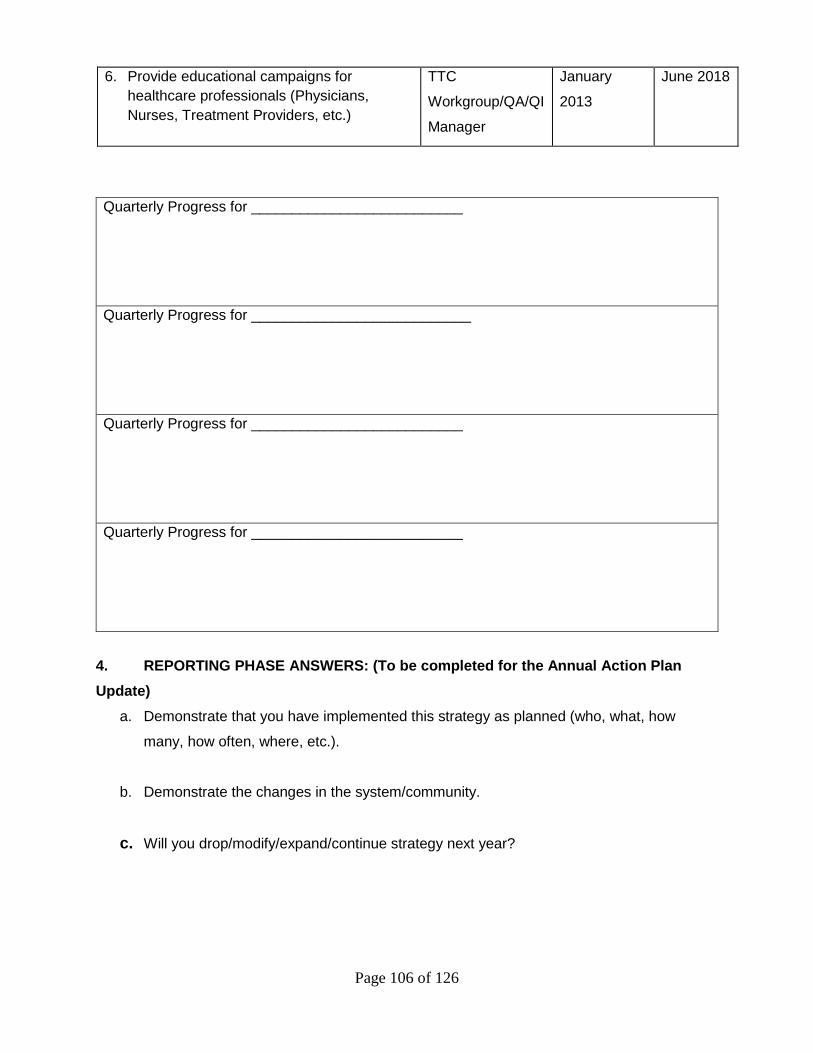
Page 106 of 126
6. Provide educational campaigns for
healthcare professionals (Physicians,
Nurses, Treatment Providers, etc.)
TTC
Workgroup/QA/QI
Manager
January
2013
June 2018
Quarterly Progress for __________________________
Quarterly Progress for ___________________________
Quarterly Progress for __________________________
Quarterly Progress for __________________________
4. REPORTING PHASE ANSWERS: (To be completed for the Annual Action Plan
Update)
a. Demonstrate that you have implemented this strategy as planned (who, what, how
many, how often, where, etc.).
b. Demonstrate the changes in the system/community.
c. Will you drop/modify/expand/continue strategy next year?
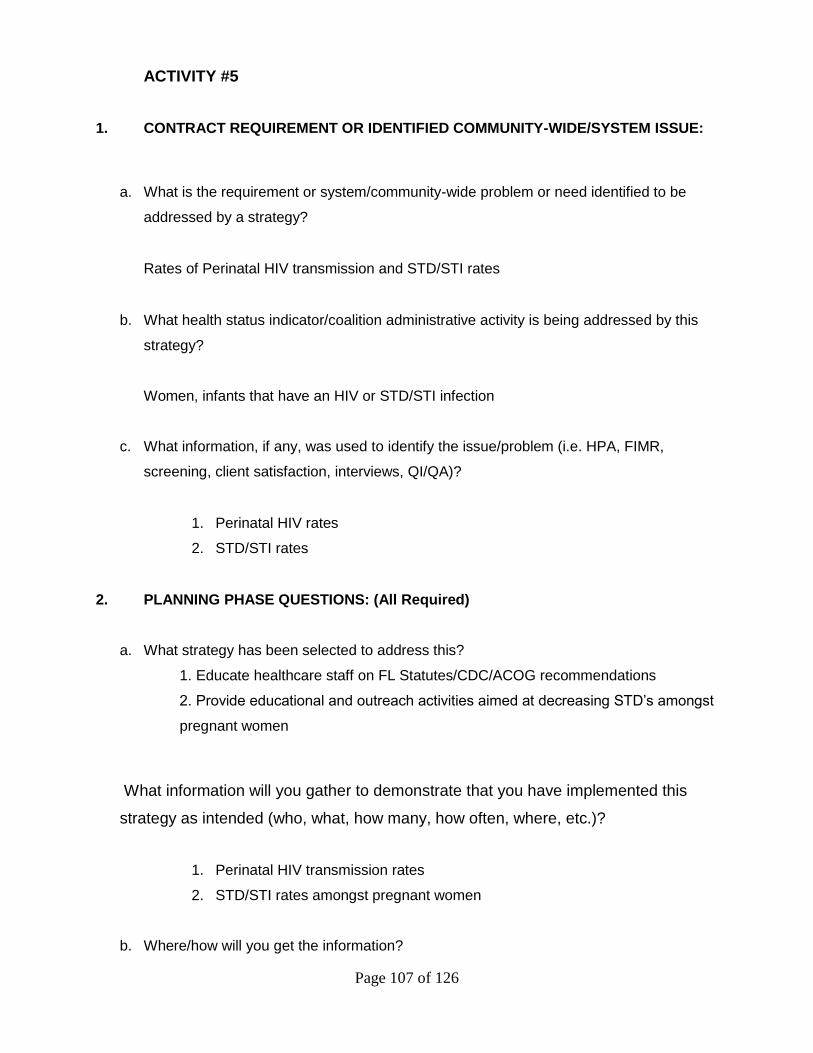
Page 107 of 126
ACTIVITY #5
1. CONTRACT REQUIREMENT OR IDENTIFIED COMMUNITY-WIDE/SYSTEM ISSUE:
a. What is the requirement or system/community-wide problem or need identified to be
addressed by a strategy?
Rates of Perinatal HIV transmission and STD/STI rates
b. What health status indicator/coalition administrative activity is being addressed by this
strategy?
Women, infants that have an HIV or STD/STI infection
c. What information, if any, was used to identify the issue/problem (i.e. HPA, FIMR,
screening, client satisfaction, interviews, QI/QA)?
1. Perinatal HIV rates
2. STD/STI rates
2. PLANNING PHASE QUESTIONS: (All Required)
a. What strategy has been selected to address this?
1. Educate healthcare staff on FL Statutes/CDC/ACOG recommendations
2. Provide educational and outreach activities aimed at decreasing STD’s amongst
pregnant women
What information will you gather to demonstrate that you have implemented this
strategy as intended (who, what, how many, how often, where, etc.)?
1. Perinatal HIV transmission rates
2. STD/STI rates amongst pregnant women
b. Where/how will you get the information?
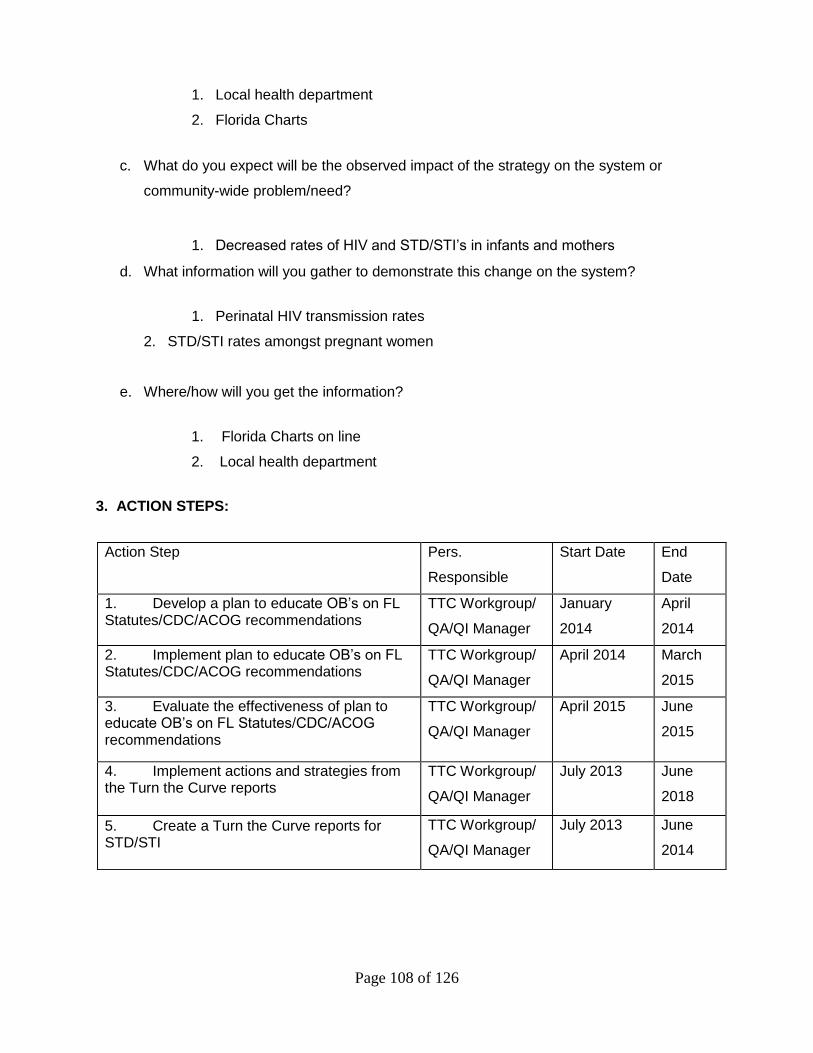
Page 108 of 126
1. Local health department
2. Florida Charts
c. What do you expect will be the observed impact of the strategy on the system or
community-wide problem/need?
1. Decreased rates of HIV and STD/STI’s in infants and mothers
d. What information will you gather to demonstrate this change on the system?
1. Perinatal HIV transmission rates
2. STD/STI rates amongst pregnant women
e. Where/how will you get the information?
1. Florida Charts on line
2. Local health department
3. ACTION STEPS:
Action Step Pers.
Responsible
Start Date End
Date
1. Develop a plan to educate OB’s on FL Statutes/CDC/ACOG recommendations
TTC Workgroup/
QA/QI Manager
January
2014
April
2014
2. Implement plan to educate OB’s on FL Statutes/CDC/ACOG recommendations
TTC Workgroup/
QA/QI Manager
April 2014 March
2015
3. Evaluate the effectiveness of plan to educate OB’s on FL Statutes/CDC/ACOG recommendations
TTC Workgroup/
QA/QI Manager
April 2015 June
2015
4. Implement actions and strategies from the Turn the Curve reports
TTC Workgroup/
QA/QI Manager
July 2013
June
2018
5. Create a Turn the Curve reports for STD/STI
TTC Workgroup/
QA/QI Manager
July 2013
June
2014
Page 109 of 126
Quarterly Progress for __________________________
Quarterly Progress for ___________________________
Quarterly Progress for __________________________
Quarterly Progress for __________________________
4. REPORTING PHASE ANSWERS: (To be completed for the Annual Action Plan Update)
a. Demonstrate that you have implemented this strategy as planned (who, what, how
many, how often, where, etc.).
b. Demonstrate the changes in the system/community.
c. Will you drop/modify/expand/continue strategy next year?

Page 110 of 126
ACTIVITY #6
1. CONTRACT REQUIREMENT OR IDENTIFIED COMMUNITY-WIDE/SYSTEM ISSUE:
a. What is the requirement or system/community-wide problem or need identified to be
addressed by a strategy?
1. Repeat teen births
b. What health status indicator/coalition administrative activity is being addressed by this
strategy?
1. Rates Repeat teen births
c. What information, if any, was used to identify the issue/problem (i.e. HPA, FIMR,
screening, client satisfaction, interviews, QI/QA)?
1. Numbers of teens experiencing a repeat birth
2. PLANNING PHASE QUESTIONS: (All Required)
a. What strategy has been selected to address this?
Provide educational outreach activities aimed at reducing repeat teen births
What information will you gather to demonstrate that you have implemented this
strategy as intended (who, what, how many, how often, where, etc.)?
1. Rates of Repeat teen births
2. Educational services at teen centers
3. Where/how will you get the information?
1. Florida Charts
2. HMS
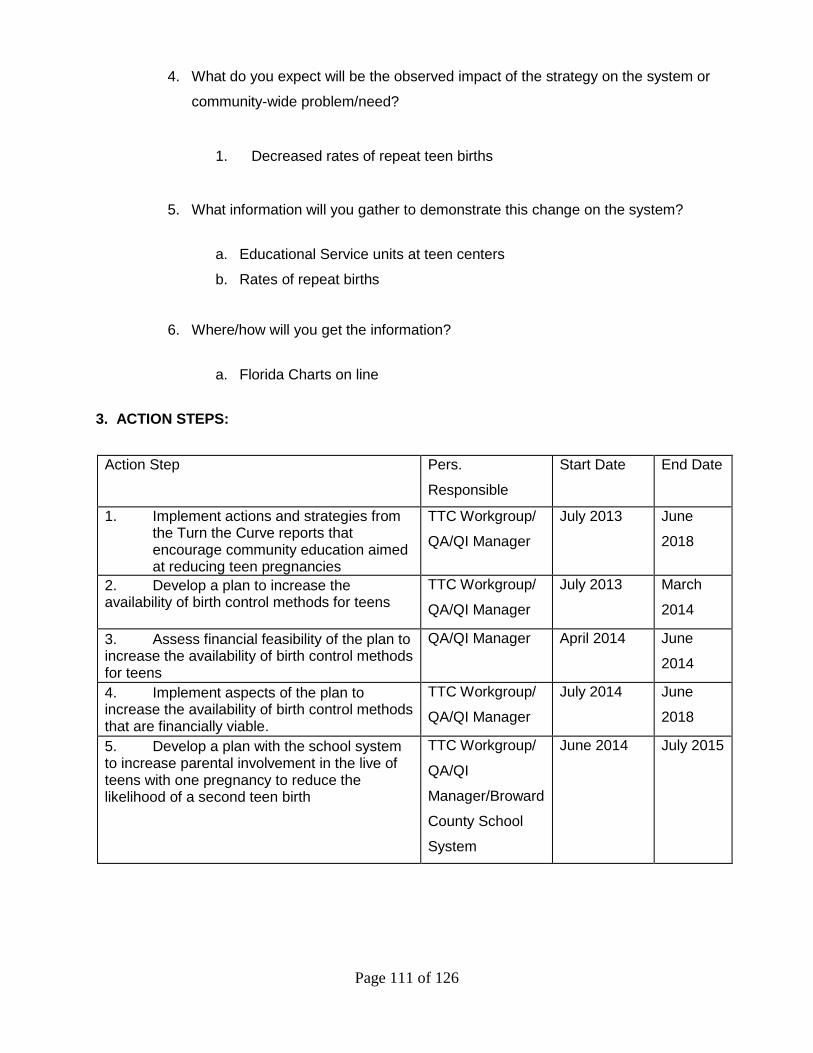
Page 111 of 126
4. What do you expect will be the observed impact of the strategy on the system or
community-wide problem/need?
1. Decreased rates of repeat teen births
5. What information will you gather to demonstrate this change on the system?
a. Educational Service units at teen centers
b. Rates of repeat births
6. Where/how will you get the information?
a. Florida Charts on line
3. ACTION STEPS:
Action Step Pers.
Responsible
Start Date End Date
1. Implement actions and strategies from the Turn the Curve reports that encourage community education aimed at reducing teen pregnancies
TTC Workgroup/
QA/QI Manager
July 2013
June
2018
2. Develop a plan to increase the availability of birth control methods for teens
TTC Workgroup/
QA/QI Manager
July 2013
March
2014
3. Assess financial feasibility of the plan to increase the availability of birth control methods for teens
QA/QI Manager April 2014 June
2014
4. Implement aspects of the plan to increase the availability of birth control methods that are financially viable.
TTC Workgroup/
QA/QI Manager
July 2014
June
2018
5. Develop a plan with the school system to increase parental involvement in the live of teens with one pregnancy to reduce the likelihood of a second teen birth
TTC Workgroup/
QA/QI
Manager/Broward
County School
System
June 2014 July 2015
Page 112 of 126
Quarterly Progress for __________________________
Quarterly Progress for ___________________________
Quarterly Progress for __________________________
Quarterly Progress for __________________________
4. REPORTING PHASE ANSWERS: (To be completed for the Annual Action Plan Update)
a. Demonstrate that you have implemented this strategy as planned (who, what, how
many, how often, where, etc.).
b. Demonstrate the changes in the system/community.
c. Will you drop/modify/expand/continue strategy next year?
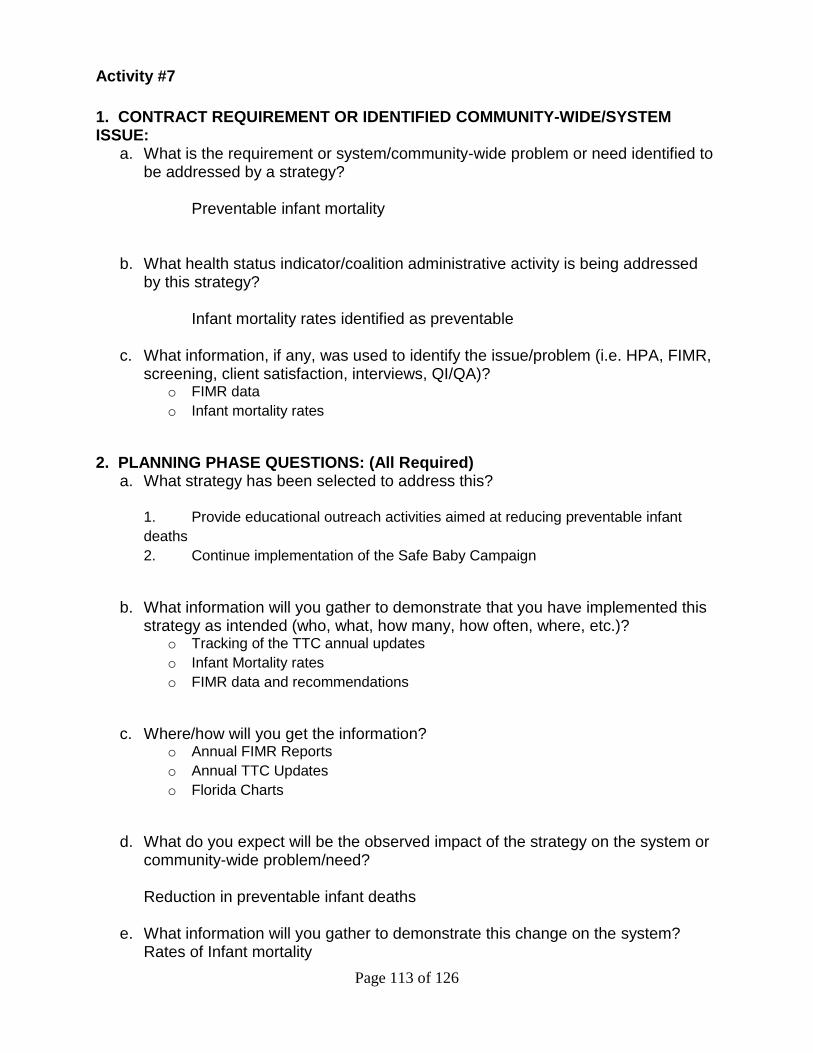
Page 113 of 126
Activity #7
1. CONTRACT REQUIREMENT OR IDENTIFIED COMMUNITY-WIDE/SYSTEM ISSUE:
a. What is the requirement or system/community-wide problem or need identified to be addressed by a strategy?
Preventable infant mortality
b. What health status indicator/coalition administrative activity is being addressed by this strategy?
Infant mortality rates identified as preventable
c. What information, if any, was used to identify the issue/problem (i.e. HPA, FIMR,
screening, client satisfaction, interviews, QI/QA)? o FIMR data
o Infant mortality rates
2. PLANNING PHASE QUESTIONS: (All Required)
a. What strategy has been selected to address this? 1. Provide educational outreach activities aimed at reducing preventable infant
deaths
2. Continue implementation of the Safe Baby Campaign
b. What information will you gather to demonstrate that you have implemented this
strategy as intended (who, what, how many, how often, where, etc.)? o Tracking of the TTC annual updates
o Infant Mortality rates
o FIMR data and recommendations
c. Where/how will you get the information?
o Annual FIMR Reports
o Annual TTC Updates
o Florida Charts
d. What do you expect will be the observed impact of the strategy on the system or
community-wide problem/need? Reduction in preventable infant deaths
e. What information will you gather to demonstrate this change on the system?
Rates of Infant mortality
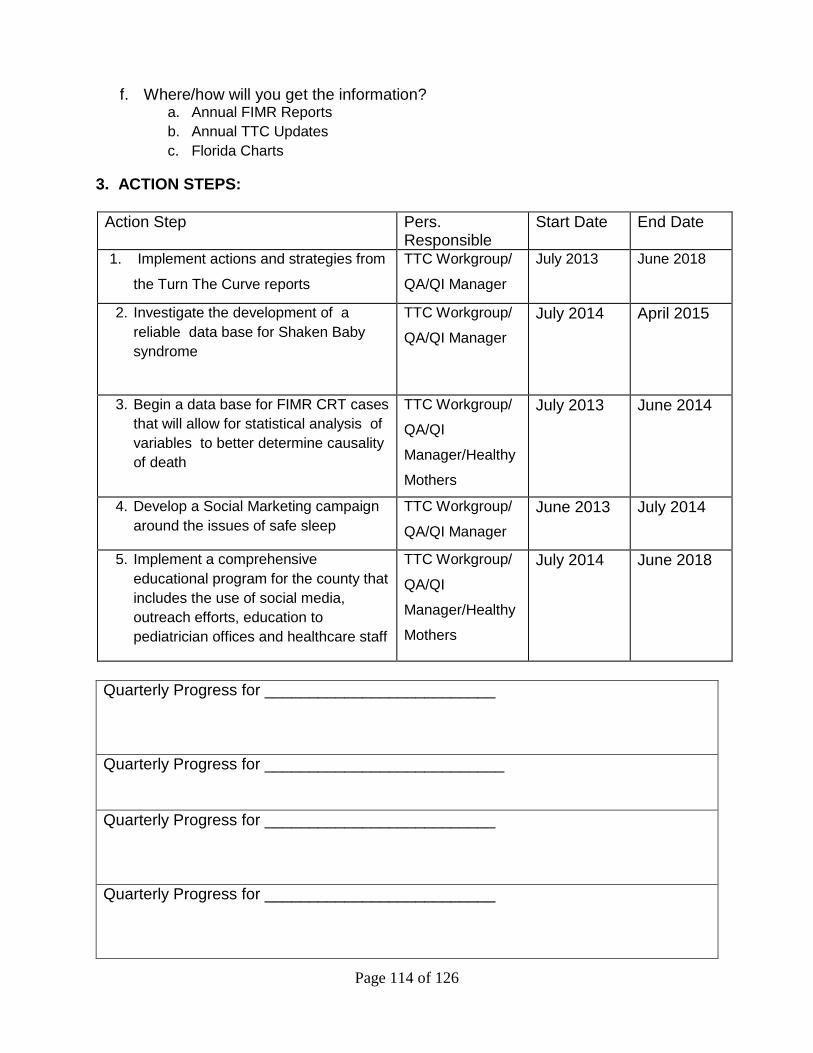
Page 114 of 126
f. Where/how will you get the information?
a. Annual FIMR Reports
b. Annual TTC Updates
c. Florida Charts
3. ACTION STEPS:
Action Step Pers. Responsible
Start Date End Date
1. Implement actions and strategies from
the Turn The Curve reports
TTC Workgroup/
QA/QI Manager
July 2013
June 2018
2. Investigate the development of a
reliable data base for Shaken Baby
syndrome
TTC Workgroup/
QA/QI Manager
July 2014 April 2015
3. Begin a data base for FIMR CRT cases
that will allow for statistical analysis of
variables to better determine causality
of death
TTC Workgroup/
QA/QI
Manager/Healthy
Mothers
July 2013 June 2014
4. Develop a Social Marketing campaign
around the issues of safe sleep
TTC Workgroup/
QA/QI Manager
June 2013 July 2014
5. Implement a comprehensive
educational program for the county that
includes the use of social media,
outreach efforts, education to
pediatrician offices and healthcare staff
TTC Workgroup/
QA/QI
Manager/Healthy
Mothers
July 2014 June 2018
Quarterly Progress for __________________________
Quarterly Progress for ___________________________
Quarterly Progress for __________________________
Quarterly Progress for __________________________

Page 115 of 126
4. REPORTING PHASE ANSWERS: (To be completed for the Annual Action Plan
Update)
a. Demonstrate the changes in the system/community.
b. Will you drop/modify/expand/continue strategy next year and explain why?
Revised 3/05/04, 4/2012
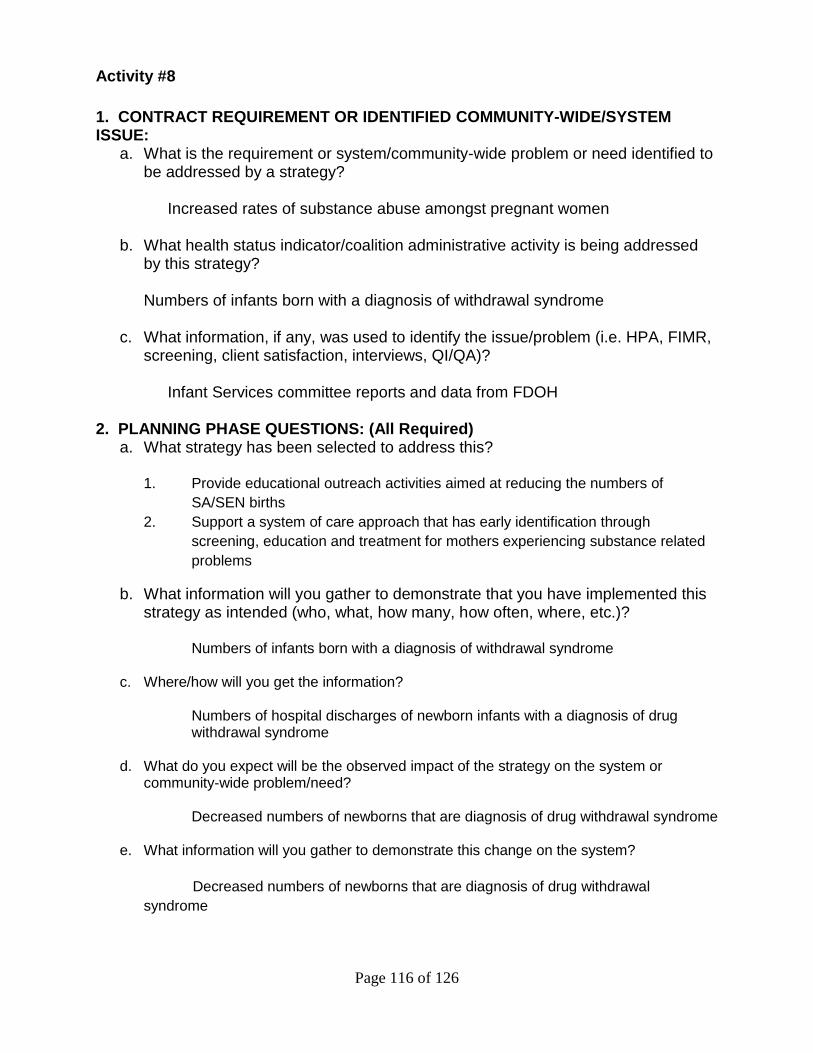
Page 116 of 126
Activity #8
1. CONTRACT REQUIREMENT OR IDENTIFIED COMMUNITY-WIDE/SYSTEM ISSUE:
a. What is the requirement or system/community-wide problem or need identified to be addressed by a strategy?
Increased rates of substance abuse amongst pregnant women
b. What health status indicator/coalition administrative activity is being addressed
by this strategy? Numbers of infants born with a diagnosis of withdrawal syndrome
c. What information, if any, was used to identify the issue/problem (i.e. HPA, FIMR,
screening, client satisfaction, interviews, QI/QA)? Infant Services committee reports and data from FDOH
2. PLANNING PHASE QUESTIONS: (All Required)
a. What strategy has been selected to address this?
1. Provide educational outreach activities aimed at reducing the numbers of
SA/SEN births
2. Support a system of care approach that has early identification through
screening, education and treatment for mothers experiencing substance related
problems
b. What information will you gather to demonstrate that you have implemented this strategy as intended (who, what, how many, how often, where, etc.)?
Numbers of infants born with a diagnosis of withdrawal syndrome
c. Where/how will you get the information? Numbers of hospital discharges of newborn infants with a diagnosis of drug withdrawal syndrome
d. What do you expect will be the observed impact of the strategy on the system or community-wide problem/need?
Decreased numbers of newborns that are diagnosis of drug withdrawal syndrome
e. What information will you gather to demonstrate this change on the system?
Decreased numbers of newborns that are diagnosis of drug withdrawal
syndrome
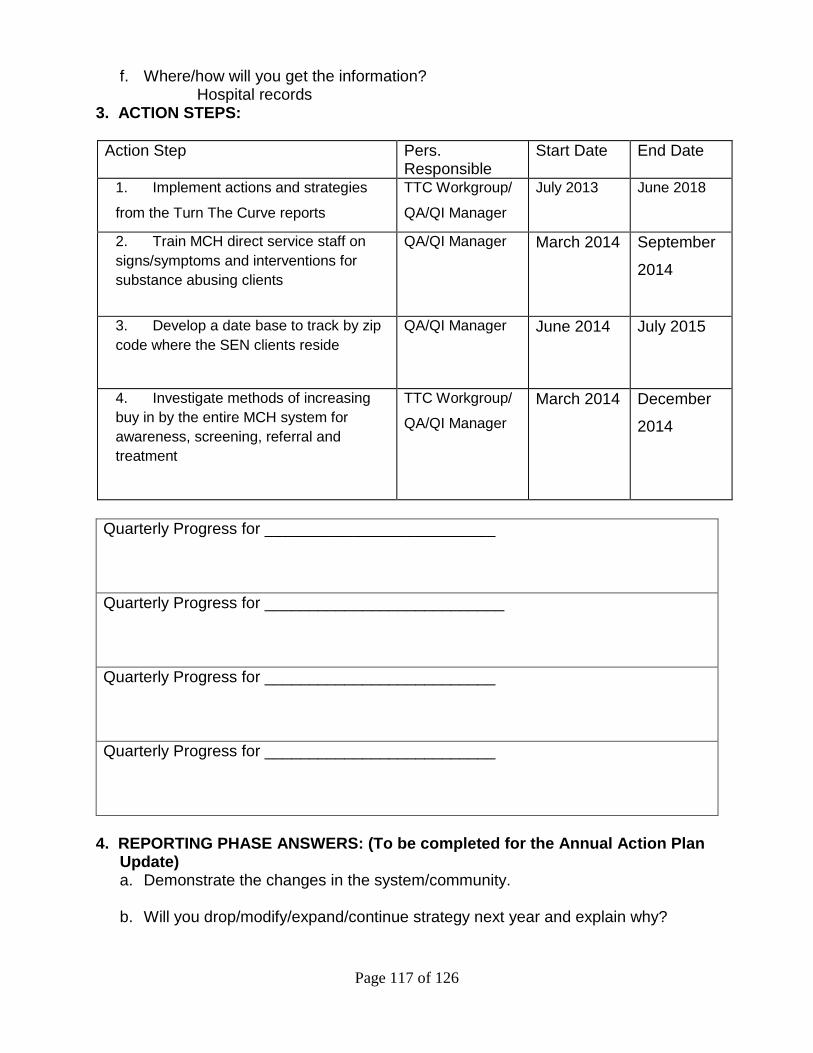
Page 117 of 126
f. Where/how will you get the information? Hospital records
3. ACTION STEPS:
Action Step Pers. Responsible
Start Date End Date
1. Implement actions and strategies
from the Turn The Curve reports
TTC Workgroup/
QA/QI Manager
July 2013
June 2018
2. Train MCH direct service staff on
signs/symptoms and interventions for
substance abusing clients
QA/QI Manager March 2014 September
2014
3. Develop a date base to track by zip
code where the SEN clients reside
QA/QI Manager June 2014 July 2015
4. Investigate methods of increasing
buy in by the entire MCH system for
awareness, screening, referral and
treatment
TTC Workgroup/
QA/QI Manager
March 2014 December
2014
Quarterly Progress for __________________________
Quarterly Progress for ___________________________
Quarterly Progress for __________________________
Quarterly Progress for __________________________
4. REPORTING PHASE ANSWERS: (To be completed for the Annual Action Plan
Update) a. Demonstrate the changes in the system/community.
b. Will you drop/modify/expand/continue strategy next year and explain why?
Page 118 of 126
APPENDIX
2103-2018 Service Delivery Plan Committee
Members
Chair - Marcia Bynoe, Broward County School System
Maria Juarez, Children’s Services Council of Broward County
Amanda Lopez, Memorial Healthcare Systems
Madeline Wares, Memorial Healthcare Systems
Evanise Cornwell, Children’s Healing Institute
Sandy Munoz, Children’s Healing Institute
Linda Welp, Broward Health
Donna Sogegian, Broward Healthy Start Coalition
David Duresky, Broward Healthy Start Coalition
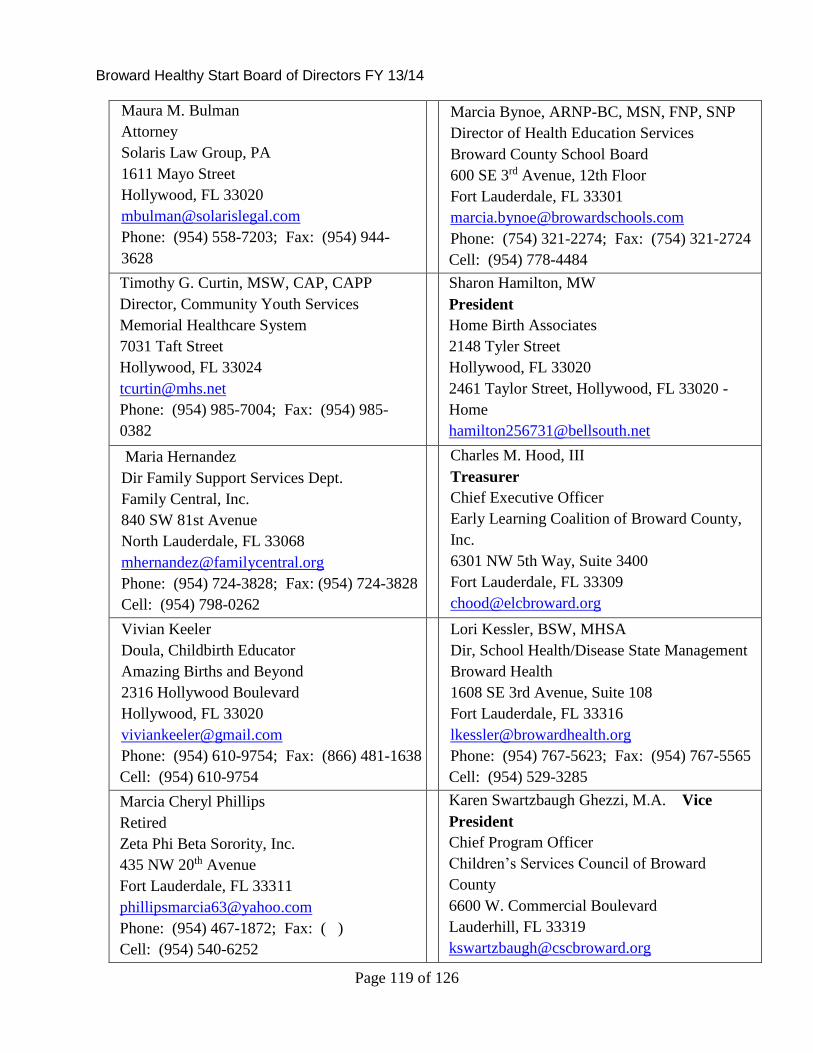
Page 119 of 126
Broward Healthy Start Board of Directors FY 13/14
Maura M. Bulman
Attorney
Solaris Law Group, PA
1611 Mayo Street
Hollywood, FL 33020
Phone: (954) 558-7203; Fax: (954) 944-
3628
Cell: (954) 558-7203
Marcia Bynoe, ARNP-BC, MSN, FNP, SNP
Director of Health Education Services
Broward County School Board
600 SE 3rd Avenue, 12th Floor
Fort Lauderdale, FL 33301
Phone: (754) 321-2274; Fax: (754) 321-2724
Cell: (954) 778-4484
Timothy G. Curtin, MSW, CAP, CAPP
Director, Community Youth Services
Memorial Healthcare System
7031 Taft Street
Hollywood, FL 33024
Phone: (954) 985-7004; Fax: (954) 985-
0382
Cell: (954) 471-6848
Sharon Hamilton, MW
President
Home Birth Associates
2148 Tyler Street
Hollywood, FL 33020
2461 Taylor Street, Hollywood, FL 33020 -
Home
Phone: (954) 581-8126; Fax: (954) 925-2756
Cell: (954) 581-8126 Maria Hernandez
Dir Family Support Services Dept.
Family Central, Inc.
840 SW 81st Avenue
North Lauderdale, FL 33068
Phone: (954) 724-3828; Fax: (954) 724-3828
Cell: (954) 798-0262
Charles M. Hood, III
Treasurer
Chief Executive Officer
Early Learning Coalition of Broward County,
Inc.
6301 NW 5th Way, Suite 3400
Fort Lauderdale, FL 33309
Phone: (954) 377-2188; Fax: (954) 377-2192
Cell: Vivian Keeler
Doula, Childbirth Educator
Amazing Births and Beyond
2316 Hollywood Boulevard
Hollywood, FL 33020
Phone: (954) 610-9754; Fax: (866) 481-1638
Cell: (954) 610-9754
Lori Kessler, BSW, MHSA
Dir, School Health/Disease State Management
Broward Health
1608 SE 3rd Avenue, Suite 108
Fort Lauderdale, FL 33316
Phone: (954) 767-5623; Fax: (954) 767-5565
Cell: (954) 529-3285
Marcia Cheryl Phillips
Retired
Zeta Phi Beta Sorority, Inc.
435 NW 20th Avenue
Fort Lauderdale, FL 33311
Phone: (954) 467-1872; Fax: ( )
Cell: (954) 540-6252
Karen Swartzbaugh Ghezzi, M.A. Vice
President
Chief Program Officer
Children’s Services Council of Broward
County
6600 W. Commercial Boulevard
Lauderhill, FL 33319
Phone: (954) 377-1670; Fax: (954) 377-1683
Cell:
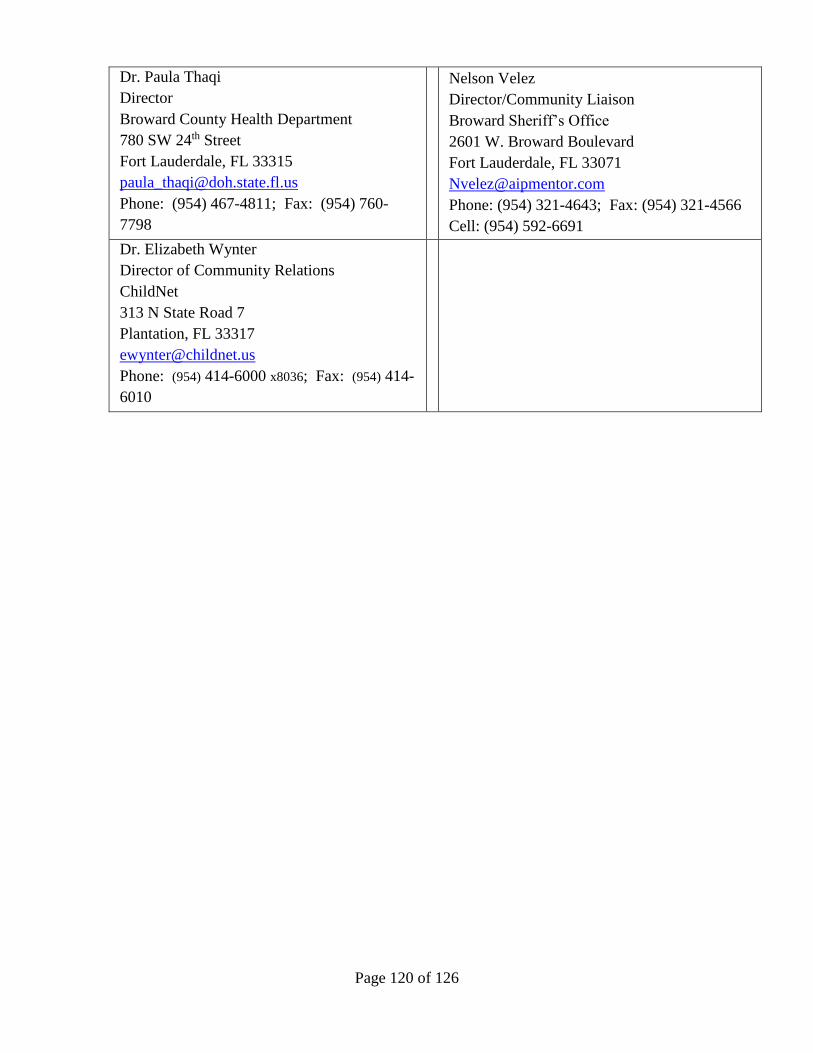
Page 120 of 126
Dr. Paula Thaqi
Director
Broward County Health Department
780 SW 24th Street
Fort Lauderdale, FL 33315
Phone: (954) 467-4811; Fax: (954) 760-
7798
Cell: (863) 221-6540
Nelson Velez
Director/Community Liaison
Broward Sheriff’s Office
2601 W. Broward Boulevard
Fort Lauderdale, FL 33071
Phone: (954) 321-4643; Fax: (954) 321-4566
Cell: (954) 592-6691
Dr. Elizabeth Wynter
Director of Community Relations
ChildNet
313 N State Road 7
Plantation, FL 33317
Phone: (954) 414-6000 x8036; Fax: (954) 414-
6010
Cell: (954) 325-4307
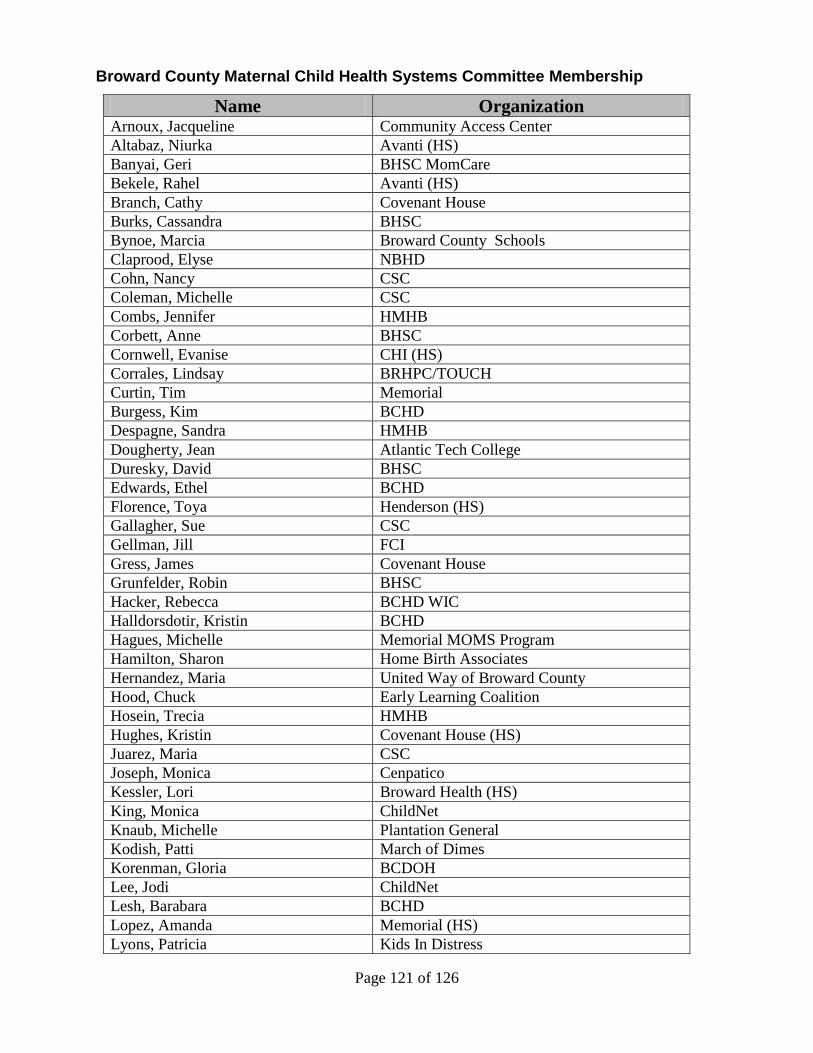
Page 121 of 126
Broward County Maternal Child Health Systems Committee Membership
Name Organization Arnoux, Jacqueline Community Access Center
Altabaz, Niurka Avanti (HS)
Banyai, Geri BHSC MomCare
Bekele, Rahel Avanti (HS)
Branch, Cathy Covenant House
Burks, Cassandra BHSC
Bynoe, Marcia Broward County Schools
Claprood, Elyse NBHD
Cohn, Nancy CSC
Coleman, Michelle CSC
Combs, Jennifer HMHB
Corbett, Anne BHSC
Cornwell, Evanise CHI (HS)
Corrales, Lindsay BRHPC/TOUCH
Curtin, Tim Memorial
Burgess, Kim BCHD
Despagne, Sandra HMHB
Dougherty, Jean Atlantic Tech College
Duresky, David BHSC
Edwards, Ethel BCHD
Florence, Toya Henderson (HS)
Gallagher, Sue CSC
Gellman, Jill FCI
Gress, James Covenant House
Grunfelder, Robin BHSC
Hacker, Rebecca BCHD WIC
Halldorsdotir, Kristin BCHD
Hagues, Michelle Memorial MOMS Program
Hamilton, Sharon Home Birth Associates
Hernandez, Maria United Way of Broward County
Hood, Chuck Early Learning Coalition
Hosein, Trecia HMHB
Hughes, Kristin Covenant House (HS)
Juarez, Maria CSC
Joseph, Monica Cenpatico
Kessler, Lori Broward Health (HS)
King, Monica ChildNet
Knaub, Michelle Plantation General
Kodish, Patti March of Dimes
Korenman, Gloria BCDOH
Lee, Jodi ChildNet
Lesh, Barabara BCHD
Lopez, Amanda Memorial (HS)
Lyons, Patricia Kids In Distress
Page 122 of 126
Mamula, Patti BCHD
Marcello, Suzanne BHSC
March Singleton, Esther BCHD WIC, BF Coalition
Markland, Donna BCHD
Matthews, Solia BCDOH
McDaniel, Augustine BHSC BOD
Mendoza, Deborah BHSC/MomCare
Miele, Rebbecca BCDOH
Millingen, Betty Hope Women Center
Mosley, Sandra BCHD
Mimnaugh, Betty Hope Women Center
Neal, Jessica BHCD
Ogunya, Jo Plantation General
Perez, Elba Ortiz Plantation General
Perez, Lourdes Urban League
Pinck, Marcia Mental Health Association
Radlauer, Julie Ronik Radlauer Group
Reese, Michelle HMHB
Rogers, Michelle Family Central
Romero, Ana HMHB MCNP
Ronik, Marci Ronik Radlauer Group
Thomas, Latrice Urban League (HS)
Scales, Sharon Plantation General
Schwartz, Susan Early Head Start
Sogegian, Donna BHSC
Wares, Madeline Memorial (HS)
Welp, Linda Broward Health (HS)
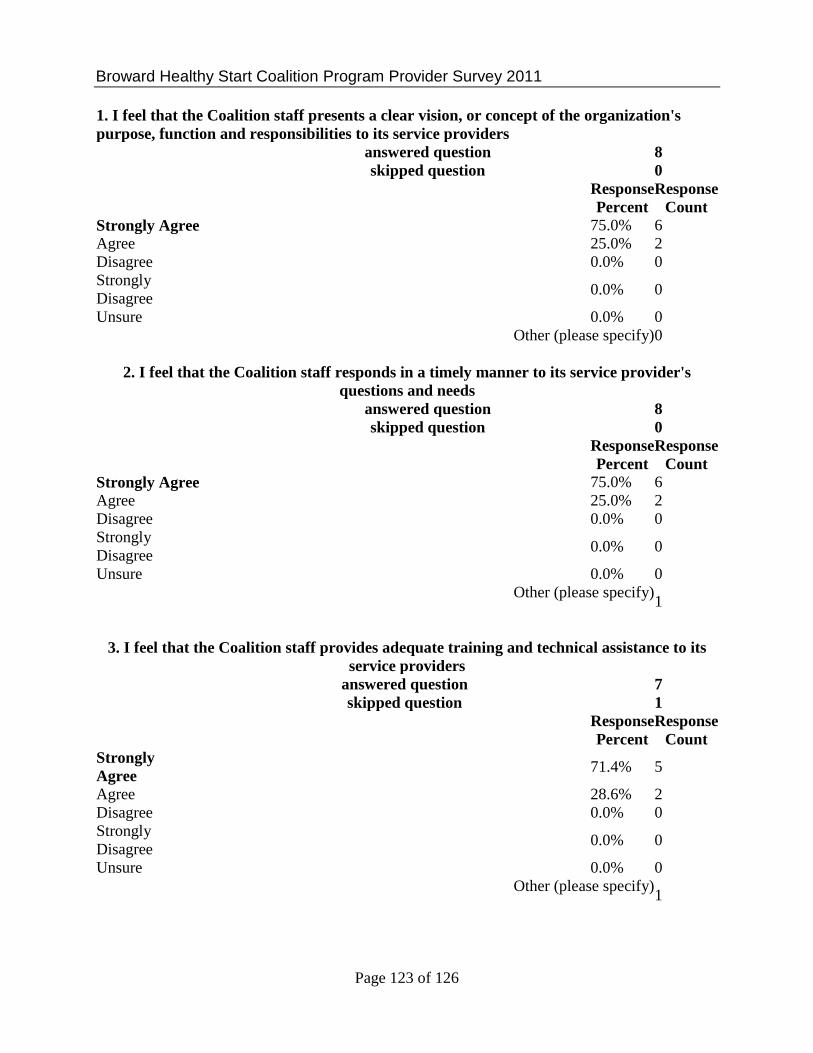
Page 123 of 126
Broward Healthy Start Coalition Program Provider Survey 2011
1. I feel that the Coalition staff presents a clear vision, or concept of the organization's
purpose, function and responsibilities to its service providers
answered question 8 skipped question 0
Response
Percent
Response
Count
Strongly Agree
75.0% 6
Agree
25.0% 2
Disagree 0.0% 0
Strongly
Disagree 0.0% 0
Unsure 0.0% 0
Other (please specify) 0
2. I feel that the Coalition staff responds in a timely manner to its service provider's
questions and needs
answered question 8 skipped question 0
Response
Percent
Response
Count
Strongly Agree
75.0% 6
Agree
25.0% 2
Disagree 0.0% 0
Strongly
Disagree 0.0% 0
Unsure 0.0% 0
Other (please specify)
1
3. I feel that the Coalition staff provides adequate training and technical assistance to its
service providers
answered question 7 skipped question 1
Response
Percent
Response
Count
Strongly
Agree
71.4% 5
Agree
28.6% 2
Disagree 0.0% 0
Strongly
Disagree 0.0% 0
Unsure 0.0% 0
Other (please specify)
1
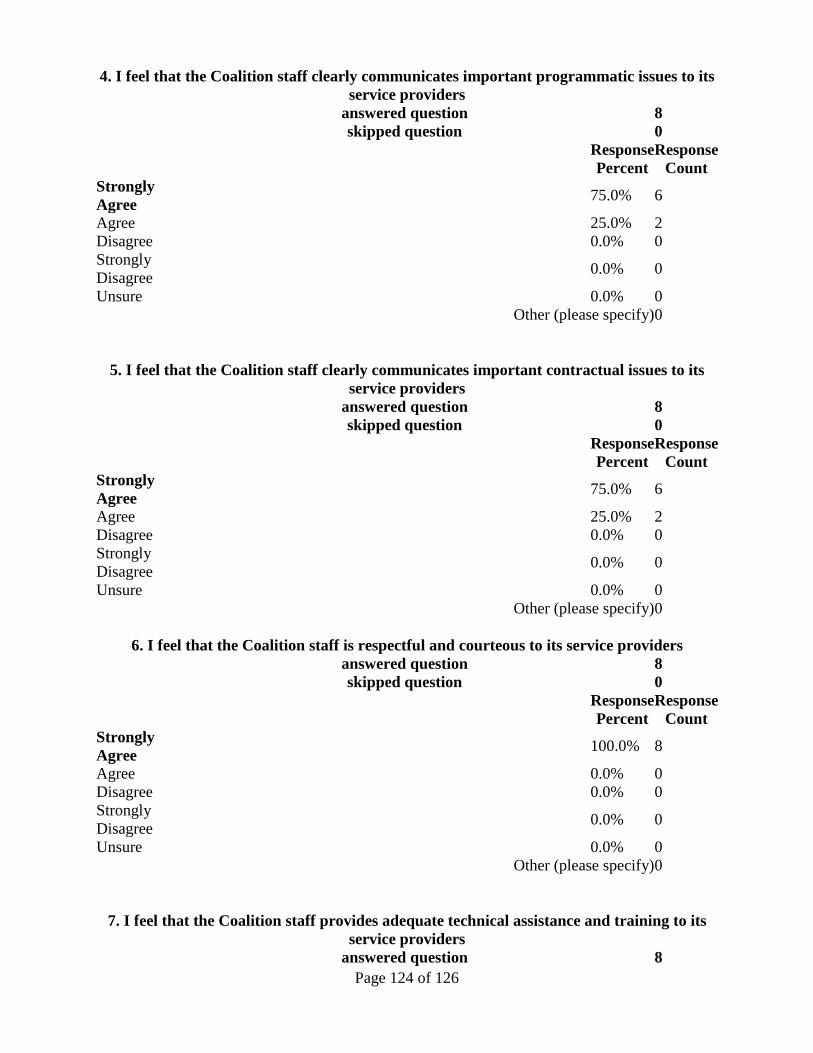
Page 124 of 126
4. I feel that the Coalition staff clearly communicates important programmatic issues to its
service providers
answered question 8 skipped question 0
Response
Percent
Response
Count
Strongly
Agree
75.0% 6
Agree
25.0% 2
Disagree 0.0% 0
Strongly
Disagree 0.0% 0
Unsure 0.0% 0
Other (please specify) 0
5. I feel that the Coalition staff clearly communicates important contractual issues to its
service providers
answered question 8 skipped question 0
Response
Percent
Response
Count
Strongly
Agree
75.0% 6
Agree
25.0% 2
Disagree 0.0% 0
Strongly
Disagree 0.0% 0
Unsure 0.0% 0
Other (please specify) 0
6. I feel that the Coalition staff is respectful and courteous to its service providers
answered question 8 skipped question 0
Response
Percent
Response
Count
Strongly
Agree
100.0% 8
Agree 0.0% 0
Disagree 0.0% 0
Strongly
Disagree 0.0% 0
Unsure 0.0% 0
Other (please specify) 0
7. I feel that the Coalition staff provides adequate technical assistance and training to its
service providers
answered question 8
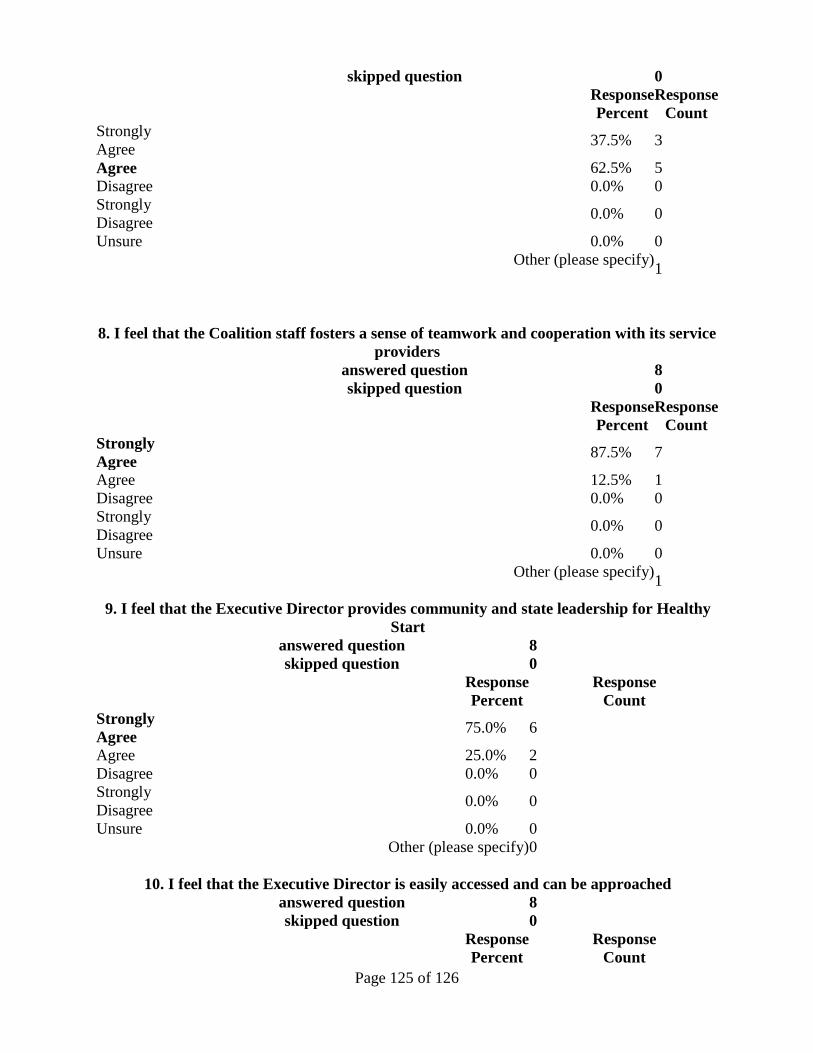
Page 125 of 126
skipped question 0
Response
Percent
Response
Count
Strongly
Agree
37.5% 3
Agree
62.5% 5
Disagree 0.0% 0
Strongly
Disagree 0.0% 0
Unsure 0.0% 0
Other (please specify)
1
8. I feel that the Coalition staff fosters a sense of teamwork and cooperation with its service
providers
answered question 8 skipped question 0
Response
Percent
Response
Count
Strongly
Agree
87.5% 7
Agree
12.5% 1
Disagree 0.0% 0
Strongly
Disagree 0.0% 0
Unsure 0.0% 0
Other (please specify)
1
9. I feel that the Executive Director provides community and state leadership for Healthy
Start
answered question 8 skipped question 0
Response
Percent
Response
Count
Strongly
Agree
75.0% 6
Agree
25.0% 2
Disagree 0.0% 0
Strongly
Disagree 0.0% 0
Unsure 0.0% 0
Other (please specify) 0
10. I feel that the Executive Director is easily accessed and can be approached
answered question 8 skipped question 0
Response
Percent
Response
Count

Page 126 of 126
Strongly
Agree
75.0% 6
Agree
25.0% 2
Disagree 0.0% 0
Strongly
Disagree 0.0% 0
Unsure 0.0% 0
Other (please specify)
0