Embed Size (px)
Citation preview

ChapterVIIHealthDataWarehouse
BrowardCountyHealthPlan
Rev: 5/2019
BROWARDREGIONALHEALTHPLANNINGCOUNCIL|CHAPTERVII:THEHEALTHDATAWAREHOUSE 2
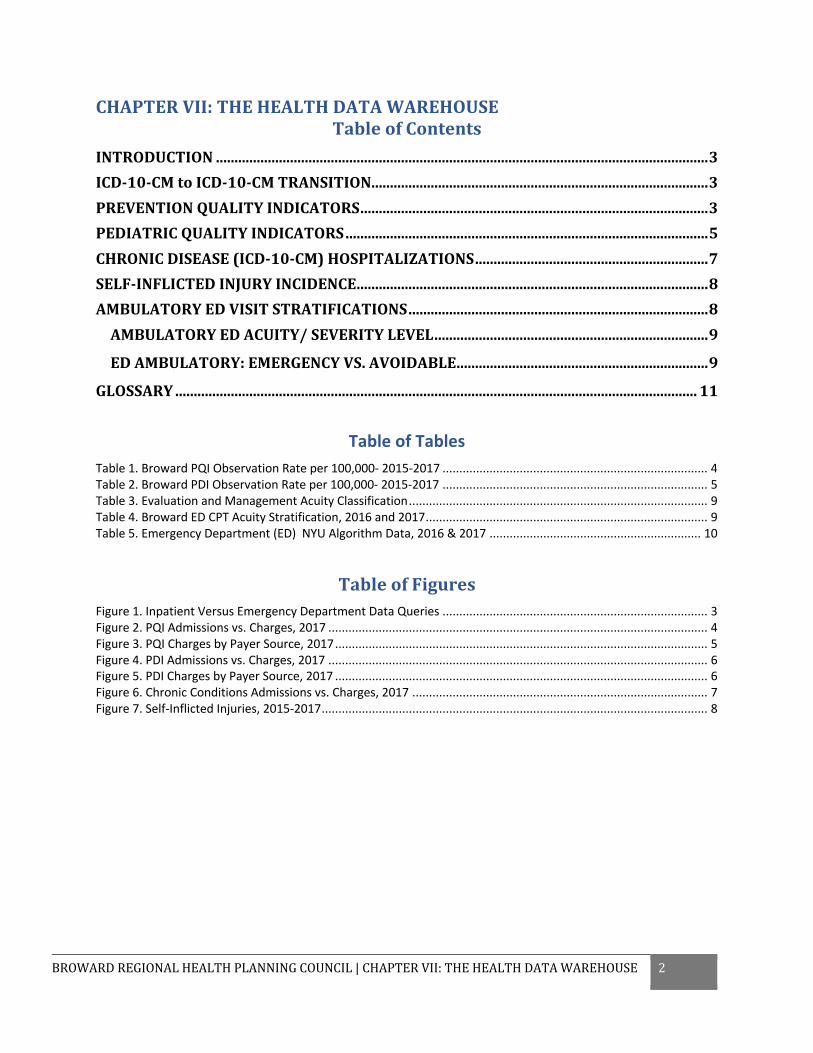
CHAPTERVII:THEHEALTHDATAWAREHOUSETableofContents
INTRODUCTION.....................................................................................................................................3ICD-10-CMtoICD-10-CMTRANSITION...........................................................................................3PREVENTIONQUALITYINDICATORS..............................................................................................3PEDIATRICQUALITYINDICATORS..................................................................................................5CHRONICDISEASE(ICD-10-CM)HOSPITALIZATIONS...............................................................7SELF-INFLICTEDINJURYINCIDENCE...............................................................................................8AMBULATORYEDVISITSTRATIFICATIONS.................................................................................8AMBULATORYEDACUITY/SEVERITYLEVEL..........................................................................9
EDAMBULATORY:EMERGENCYVS.AVOIDABLE....................................................................9
GLOSSARY.............................................................................................................................................11
Table of Tables Table 1. Broward PQI Observation Rate per 100,000- 2015-2017 ............................................................................... 4 Table 2. Broward PDI Observation Rate per 100,000- 2015-2017 ............................................................................... 5 Table 3. Evaluation and Management Acuity Classification ......................................................................................... 9 Table 4. Broward ED CPT Acuity Stratification, 2016 and 2017 .................................................................................... 9 Table 5. Emergency Department (ED) NYU Algorithm Data, 2016 & 2017 ............................................................... 10
TableofFiguresFigure 1. Inpatient Versus Emergency Department Data Queries ............................................................................... 3 Figure 2. PQI Admissions vs. Charges, 2017 ................................................................................................................. 4 Figure 3. PQI Charges by Payer Source, 2017 ............................................................................................................... 5 Figure 4. PDI Admissions vs. Charges, 2017 ................................................................................................................. 6 Figure 5. PDI Charges by Payer Source, 2017 ............................................................................................................... 6 Figure 6. Chronic Conditions Admissions vs. Charges, 2017 ........................................................................................ 7 Figure 7. Self-Inflicted Injuries, 2015-2017 ................................................................................................................... 8
BROWARDREGIONALHEALTHPLANNINGCOUNCIL|CHAPTERVII:THEHEALTHDATAWAREHOUSE 3
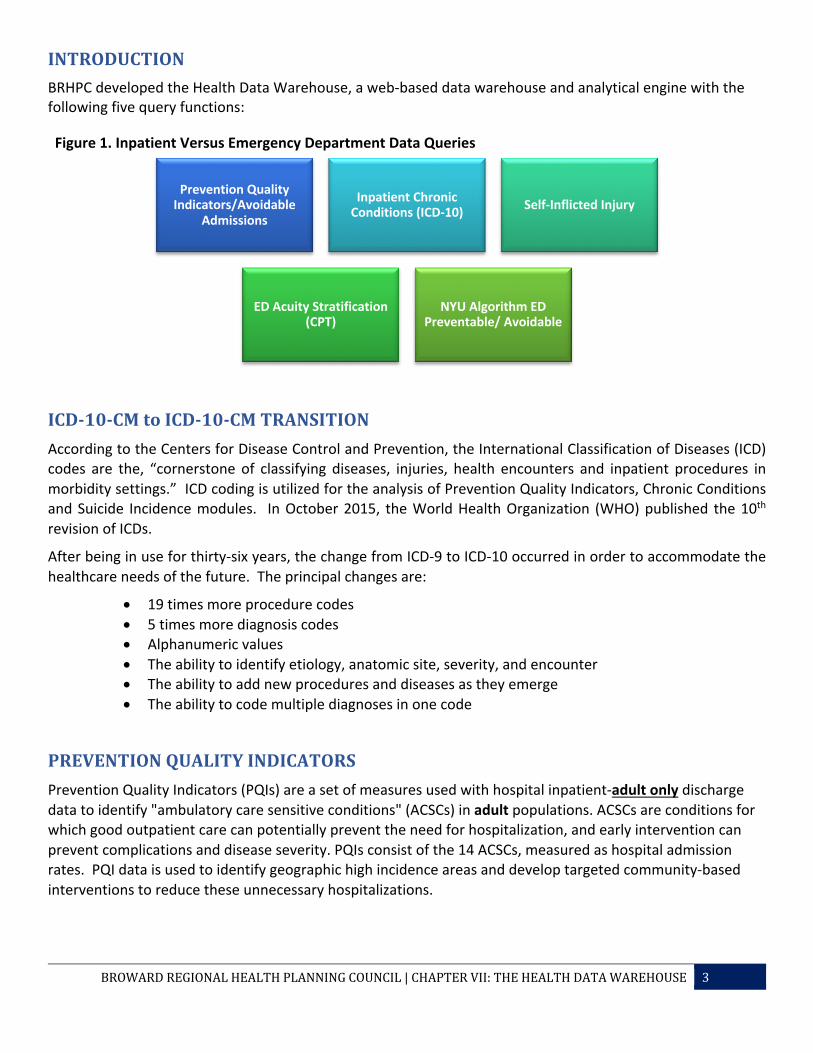
INTRODUCTIONBRHPC developed the Health Data Warehouse, a web-based data warehouse and analytical engine with the following five query functions: Figure 1. Inpatient Versus Emergency Department Data Queries
ICD-10-CMtoICD-10-CMTRANSITIONAccording to the Centers for Disease Control and Prevention, the International Classification of Diseases (ICD) codes are the, “cornerstone of classifying diseases, injuries, health encounters and inpatient procedures in morbidity settings.” ICD coding is utilized for the analysis of Prevention Quality Indicators, Chronic Conditions and Suicide Incidence modules. In October 2015, the World Health Organization (WHO) published the 10th revision of ICDs.
After being in use for thirty-six years, the change from ICD-9 to ICD-10 occurred in order to accommodate the healthcare needs of the future. The principal changes are:
• 19 times more procedure codes • 5 times more diagnosis codes • Alphanumeric values • The ability to identify etiology, anatomic site, severity, and encounter • The ability to add new procedures and diseases as they emerge • The ability to code multiple diagnoses in one code
PREVENTIONQUALITYINDICATORS Prevention Quality Indicators (PQIs) are a set of measures used with hospital inpatient-adult only discharge data to identify "ambulatory care sensitive conditions" (ACSCs) in adult populations. ACSCs are conditions for which good outpatient care can potentially prevent the need for hospitalization, and early intervention can prevent complications and disease severity. PQIs consist of the 14 ACSCs, measured as hospital admission rates. PQI data is used to identify geographic high incidence areas and develop targeted community-based interventions to reduce these unnecessary hospitalizations.
Prevention Quality Indicators/Avoidable
Admissions
Inpatient Chronic Conditions (ICD-10) Self-Inflicted Injury
ED Acuity Stratification (CPT)
NYU Algorithm ED Preventable/ Avoidable

BROWARDREGIONALHEALTHPLANNINGCOUNCIL|CHAPTERVII:THEHEALTHDATAWAREHOUSE 4
Broward County’s highest PQI observation rates have been for perforated appendicitis for the past 3 years (Table 1). When looking at the number of admissions, congestive heart failure was the highest (5,703) while hypertension was the lowest (364). Congestive Heart Failure also had the highest charges in 2017 at $342,450,900 (Figure 2).
Table 1. Broward PQI Observation Rate per 100,000- 2015-2017 2015 2016 2017
01-Diabetes/short-term 63.4 78.8 81.4 02-Perf. appendicitis 31,704.8 3,9834 4,4279.2 03-Diabetes/long-term 139.3 96.3 128.7 05-Chronic obstructive PD 214.7 347.3 350 07-Hypertension 89.8 84.1 24.0 08-Congestive HF 308.5 342.2 375.7 09-Low birth weight 6,848.9 7,202.3 7,356.3 10-Dehydration 61.6 164.7 154.6 11-Bacterial pneumonia 213.5 187.2 150 12-Urinary infections 196.6 197.5 180.2 *13-Angina w/o procedure 6.6 0.0 0.0 14-Uncontrolled diabetes 35.4 75.4 71 15-Adult asthma 109.7 59.8 58.0 16-Diabetes/LE amputations 33.5 19.3 24.2 Red = Increase from previous year *-PQI 13- Angina w/o procedure was retired in 2016 Source: Broward Regional Health Planning Council
Figure 2. PQI Admissions vs. Charges, 2017
5,703
$342,450,900
$0
$50,000,000
$100,000,000
$150,000,000
$200,000,000
$250,000,000
$300,000,000
$350,000,000
$400,000,000
-
1,000
2,000
3,000
4,000
5,000
6,000
01-Diab
etes/s
hort-ter
m
02- Perf.
Appendicit
is
03-Diab
etes/l
ong-term
05-Chronic obstr
uctive
PD
07-Hyp
ertensio
n
08-Congesti
ve HF
09- Low Birt
h Weigh
t
10-Deh
ydrat
ion
11-Bacteria
l pneumonia
12-Urin
ary in
fections
14-Unco
ntrolle
d diabetes
15-Adult asth
ma
16-Diab
etes/L
E amputat
ions
Cases Charges

BROWARDREGIONALHEALTHPLANNINGCOUNCIL|CHAPTERVII:THEHEALTHDATAWAREHOUSE 5
Of all payer sources, Medicare had the highest proportion of payments for the observed PQIs (Figure 3). Figure 3. PQI Charges by Payer Source, 2017
PEDIATRICQUALITYINDICATORSPediatric Quality Indicators (PDIs) are a set of measures used with hospital inpatient-pediatric only discharge data to identify "ambulatory care sensitive conditions" (ACSCs) in pediatric populations. PDIs consist of the five ACSCs, measured as hospital admission rates. They’re also a set of measure used with hospital inpatient discharge data, specific to pediatric patients.
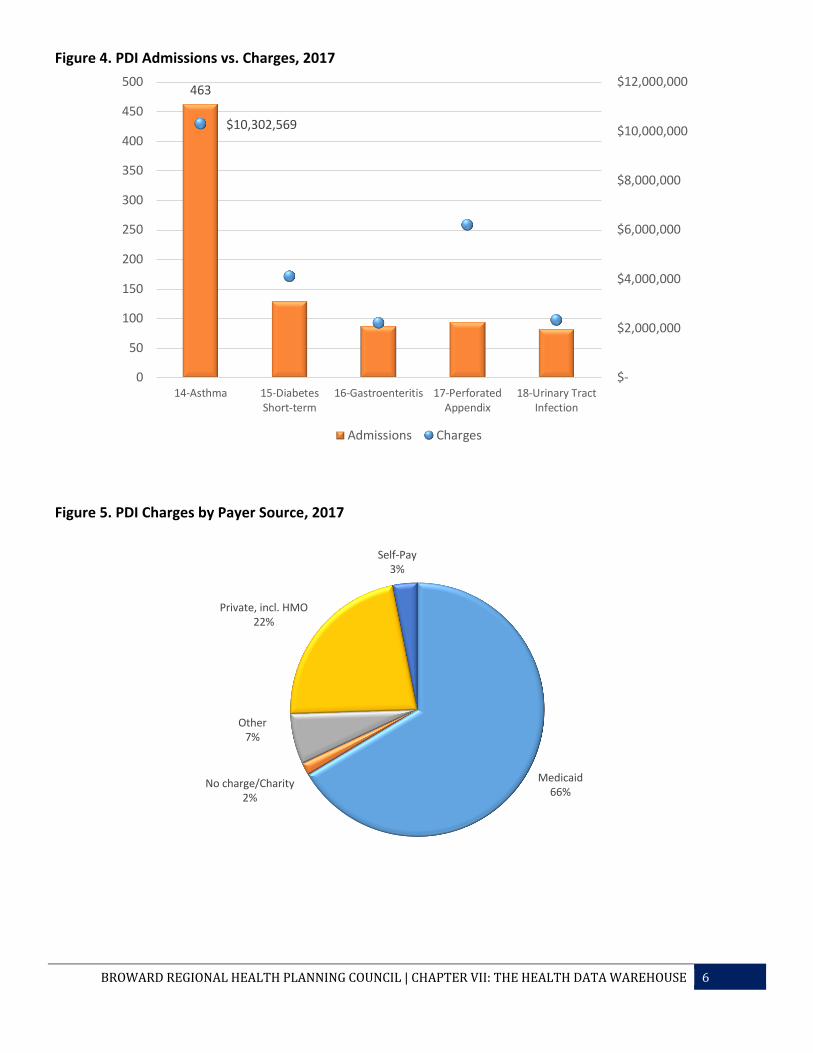
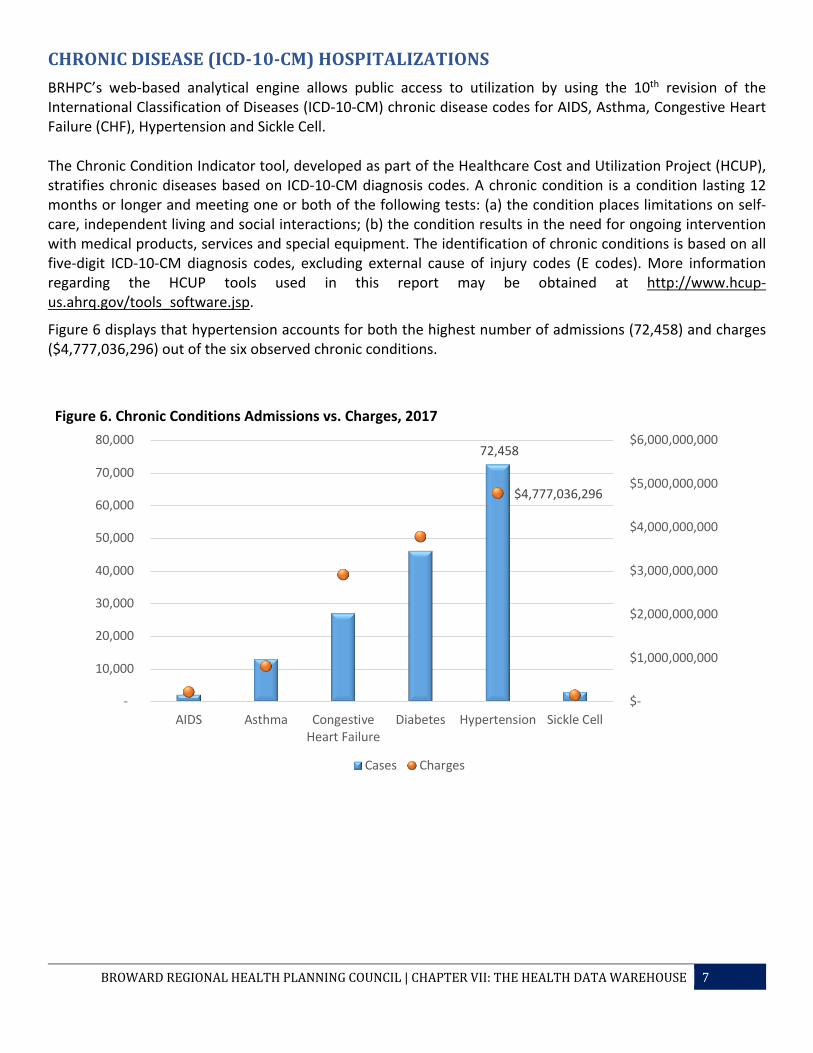
As with the PQIs among adults, perforated appendicitis had the highest PDI observation rate for the population between 1 to 17 years of age (Table 2). Asthma had the highest number of admissions and charges in 2017 (Figure 4). Medicaid had the largest proportion of payments of the different payer sources (Figure 5).
Table 2. Broward PDI Observation Rate per 100,000- 2015-2017 2015 2016 2017
14-Asthma 140.9 156.4 124.5 15-Diabetes Short-term 38.7 49.2 46.0 16-Gastroenteritis 43.1 31.6 21.3 17-Perforated Appendix 41,832.7 45,049.5 49,479.2 18-Urinary Tract Infection 22.1 24.2 20.1 Red = Increase from previous year Source: Broward Regional Health Planning Council
Medicaid23%
Medicare52%
No charge/Charity
2%
Other2%
Private, incl. HMO16%
Self-Pay5%
BROWARDREGIONALHEALTHPLANNINGCOUNCIL|CHAPTERVII:THEHEALTHDATAWAREHOUSE 6
Figure 4. PDI Admissions vs. Charges, 2017
Figure 5. PDI Charges by Payer Source, 2017
463
$10,302,569
$-
$2,000,000
$4,000,000
$6,000,000
$8,000,000
$10,000,000
$12,000,000
0
50
100
150
200
250
300
350
400
450
500
14-Asthma 15-DiabetesShort-term
16-Gastroenteritis 17-PerforatedAppendix
18-Urinary TractInfection
Admissions Charges
Medicaid66%
No charge/Charity2%
Other7%
Private, incl. HMO22%
Self-Pay3%
BROWARDREGIONALHEALTHPLANNINGCOUNCIL|CHAPTERVII:THEHEALTHDATAWAREHOUSE 7
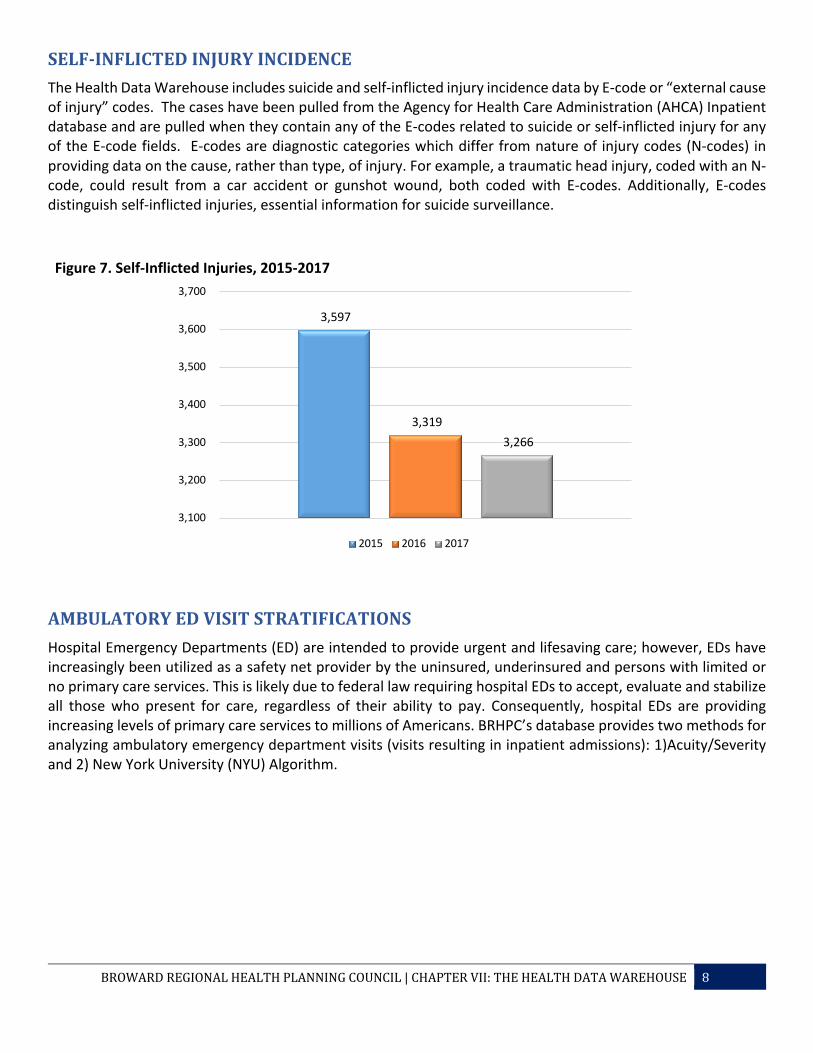
CHRONICDISEASE(ICD-10-CM)HOSPITALIZATIONSBRHPC’s web-based analytical engine allows public access to utilization by using the 10th revision of the International Classification of Diseases (ICD-10-CM) chronic disease codes for AIDS, Asthma, Congestive Heart Failure (CHF), Hypertension and Sickle Cell. The Chronic Condition Indicator tool, developed as part of the Healthcare Cost and Utilization Project (HCUP), stratifies chronic diseases based on ICD-10-CM diagnosis codes. A chronic condition is a condition lasting 12 months or longer and meeting one or both of the following tests: (a) the condition places limitations on self-care, independent living and social interactions; (b) the condition results in the need for ongoing intervention with medical products, services and special equipment. The identification of chronic conditions is based on all five-digit ICD-10-CM diagnosis codes, excluding external cause of injury codes (E codes). More information regarding the HCUP tools used in this report may be obtained at http://www.hcup-us.ahrq.gov/tools_software.jsp.
Figure 6 displays that hypertension accounts for both the highest number of admissions (72,458) and charges ($4,777,036,296) out of the six observed chronic conditions.
Figure 6. Chronic Conditions Admissions vs. Charges, 2017
72,458
$4,777,036,296
$-
$1,000,000,000
$2,000,000,000
$3,000,000,000
$4,000,000,000
$5,000,000,000
$6,000,000,000
-
10,000
20,000
30,000
40,000
50,000
60,000
70,000
80,000
AIDS Asthma CongestiveHeart Failure
Diabetes Hypertension Sickle Cell
Cases Charges
BROWARDREGIONALHEALTHPLANNINGCOUNCIL|CHAPTERVII:THEHEALTHDATAWAREHOUSE 8
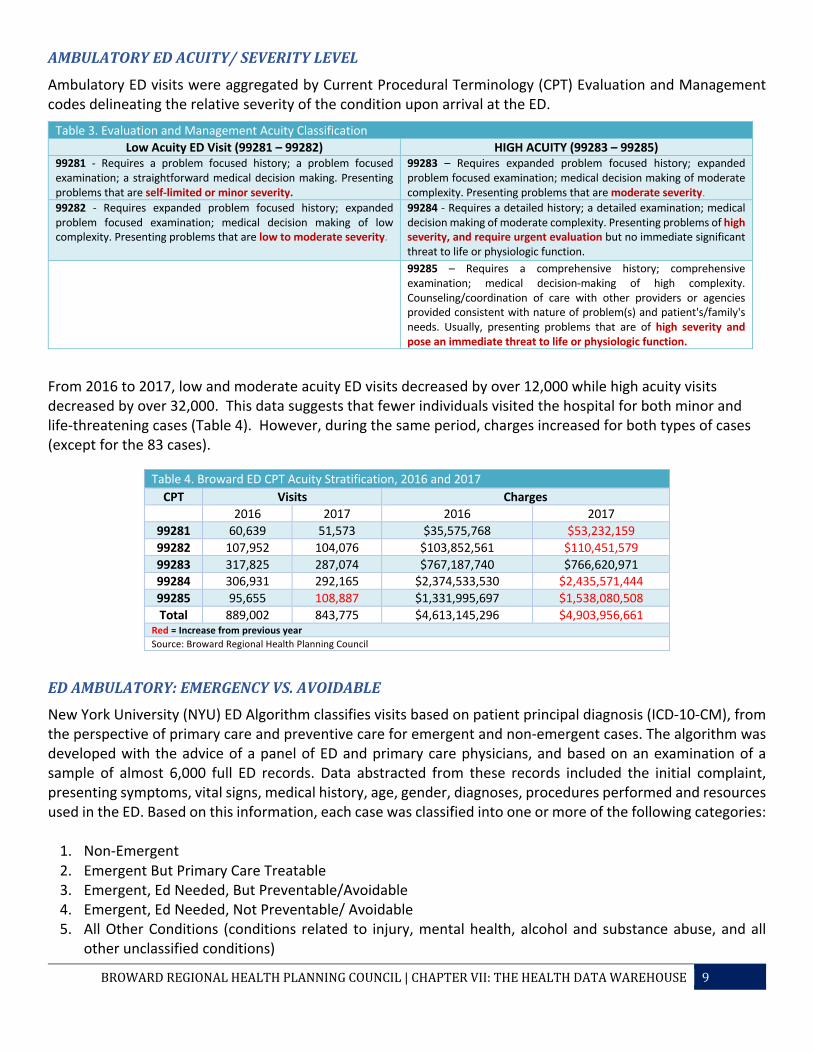
SELF-INFLICTEDINJURYINCIDENCEThe Health Data Warehouse includes suicide and self-inflicted injury incidence data by E-code or “external cause of injury” codes. The cases have been pulled from the Agency for Health Care Administration (AHCA) Inpatient database and are pulled when they contain any of the E-codes related to suicide or self-inflicted injury for any of the E-code fields. E-codes are diagnostic categories which differ from nature of injury codes (N-codes) in providing data on the cause, rather than type, of injury. For example, a traumatic head injury, coded with an N-code, could result from a car accident or gunshot wound, both coded with E-codes. Additionally, E-codes distinguish self-inflicted injuries, essential information for suicide surveillance. Figure 7. Self-Inflicted Injuries, 2015-2017
AMBULATORYEDVISITSTRATIFICATIONS Hospital Emergency Departments (ED) are intended to provide urgent and lifesaving care; however, EDs have increasingly been utilized as a safety net provider by the uninsured, underinsured and persons with limited or no primary care services. This is likely due to federal law requiring hospital EDs to accept, evaluate and stabilize all those who present for care, regardless of their ability to pay. Consequently, hospital EDs are providing increasing levels of primary care services to millions of Americans. BRHPC’s database provides two methods for analyzing ambulatory emergency department visits (visits resulting in inpatient admissions): 1)Acuity/Severity and 2) New York University (NYU) Algorithm.
3,597
3,319 3,266
3,100
3,200
3,300
3,400
3,500
3,600
3,700
2015 2016 2017
BROWARDREGIONALHEALTHPLANNINGCOUNCIL|CHAPTERVII:THEHEALTHDATAWAREHOUSE 9
AMBULATORYEDACUITY/SEVERITYLEVEL
Ambulatory ED visits were aggregated by Current Procedural Terminology (CPT) Evaluation and Management codes delineating the relative severity of the condition upon arrival at the ED.
Table 3. Evaluation and Management Acuity Classification Low Acuity ED Visit (99281 – 99282) HIGH ACUITY (99283 – 99285)
99281 - Requires a problem focused history; a problem focused examination; a straightforward medical decision making. Presenting problems that are self-limited or minor severity.
99283 – Requires expanded problem focused history; expanded problem focused examination; medical decision making of moderate complexity. Presenting problems that are moderate severity.
99282 - Requires expanded problem focused history; expanded problem focused examination; medical decision making of low complexity. Presenting problems that are low to moderate severity.
99284 - Requires a detailed history; a detailed examination; medical decision making of moderate complexity. Presenting problems of high severity, and require urgent evaluation but no immediate significant threat to life or physiologic function.
99285 – Requires a comprehensive history; comprehensive examination; medical decision-making of high complexity. Counseling/coordination of care with other providers or agencies provided consistent with nature of problem(s) and patient's/family's needs. Usually, presenting problems that are of high severity and pose an immediate threat to life or physiologic function.
From 2016 to 2017, low and moderate acuity ED visits decreased by over 12,000 while high acuity visits decreased by over 32,000. This data suggests that fewer individuals visited the hospital for both minor and life-threatening cases (Table 4). However, during the same period, charges increased for both types of cases (except for the 83 cases).
Table 4. Broward ED CPT Acuity Stratification, 2016 and 2017 CPT Visits Charges
2016 2017 2016 2017 99281 60,639 51,573 $35,575,768 $53,232,159 99282 107,952 104,076 $103,852,561 $110,451,579 99283 317,825 287,074 $767,187,740 $766,620,971 99284 306,931 292,165 $2,374,533,530 $2,435,571,444 99285 95,655 108,887 $1,331,995,697 $1,538,080,508 Total 889,002 843,775 $4,613,145,296 $4,903,956,661
Red = Increase from previous year Source: Broward Regional Health Planning Council
EDAMBULATORY:EMERGENCYVS.AVOIDABLENew York University (NYU) ED Algorithm classifies visits based on patient principal diagnosis (ICD-10-CM), from the perspective of primary care and preventive care for emergent and non-emergent cases. The algorithm was developed with the advice of a panel of ED and primary care physicians, and based on an examination of a sample of almost 6,000 full ED records. Data abstracted from these records included the initial complaint, presenting symptoms, vital signs, medical history, age, gender, diagnoses, procedures performed and resources used in the ED. Based on this information, each case was classified into one or more of the following categories:
1. Non-Emergent 2. Emergent But Primary Care Treatable 3. Emergent, Ed Needed, But Preventable/Avoidable 4. Emergent, Ed Needed, Not Preventable/ Avoidable 5. All Other Conditions (conditions related to injury, mental health, alcohol and substance abuse, and all
other unclassified conditions)
BROWARDREGIONALHEALTHPLANNINGCOUNCIL|CHAPTERVII:THEHEALTHDATAWAREHOUSE 10
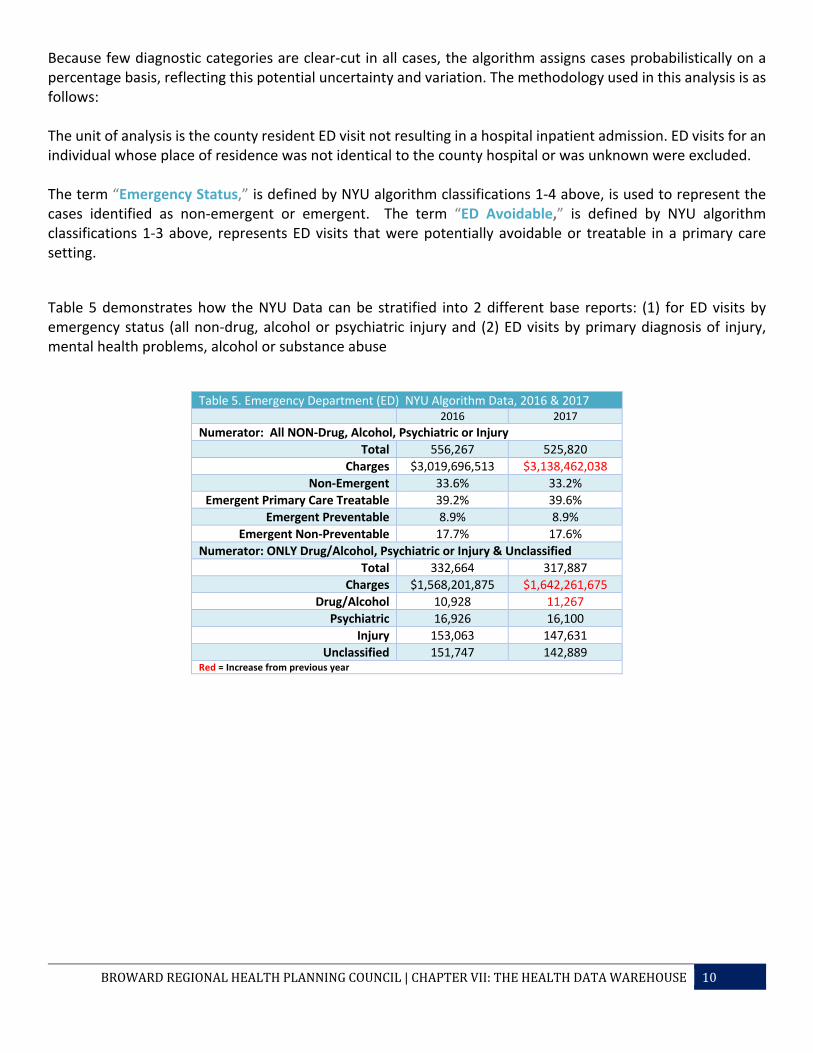
Because few diagnostic categories are clear-cut in all cases, the algorithm assigns cases probabilistically on a percentage basis, reflecting this potential uncertainty and variation. The methodology used in this analysis is as follows: The unit of analysis is the county resident ED visit not resulting in a hospital inpatient admission. ED visits for an individual whose place of residence was not identical to the county hospital or was unknown were excluded. The term “Emergency Status,” is defined by NYU algorithm classifications 1-4 above, is used to represent the cases identified as non-emergent or emergent. The term “ED Avoidable,” is defined by NYU algorithm classifications 1-3 above, represents ED visits that were potentially avoidable or treatable in a primary care setting.
Table 5 demonstrates how the NYU Data can be stratified into 2 different base reports: (1) for ED visits by emergency status (all non-drug, alcohol or psychiatric injury and (2) ED visits by primary diagnosis of injury, mental health problems, alcohol or substance abuse
Table 5. Emergency Department (ED) NYU Algorithm Data, 2016 & 2017 2016 2017
Numerator: All NON-Drug, Alcohol, Psychiatric or Injury Total 556,267 525,820
Charges $3,019,696,513 $3,138,462,038 Non-Emergent 33.6% 33.2%
Emergent Primary Care Treatable 39.2% 39.6% Emergent Preventable 8.9% 8.9%
Emergent Non-Preventable 17.7% 17.6% Numerator: ONLY Drug/Alcohol, Psychiatric or Injury & Unclassified
Total 332,664 317,887 Charges $1,568,201,875 $1,642,261,675
Drug/Alcohol 10,928 11,267 Psychiatric 16,926 16,100
Injury 153,063 147,631 Unclassified 151,747 142,889
Red = Increase from previous year
BROWARDREGIONALHEALTHPLANNINGCOUNCIL|CHAPTERVII:THEHEALTHDATAWAREHOUSE 11
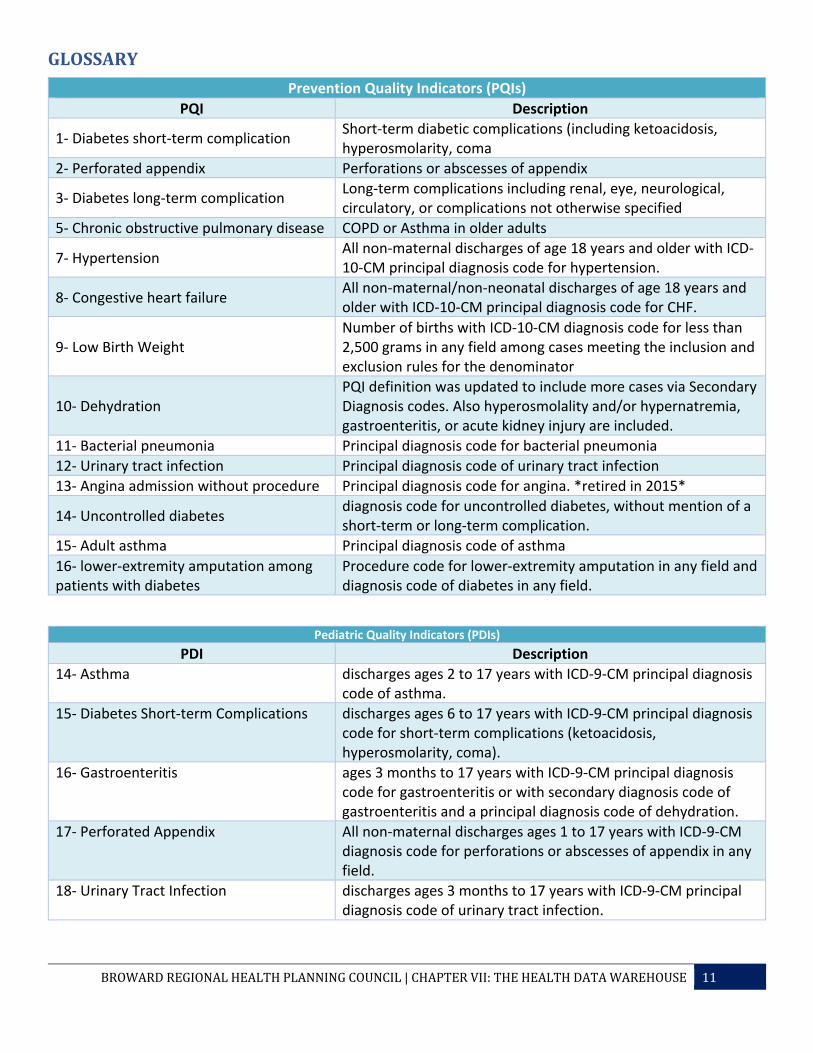
GLOSSARYPrevention Quality Indicators (PQIs)
PQI Description
1- Diabetes short-term complication Short-term diabetic complications (including ketoacidosis, hyperosmolarity, coma
2- Perforated appendix Perforations or abscesses of appendix
3- Diabetes long-term complication Long-term complications including renal, eye, neurological, circulatory, or complications not otherwise specified
5- Chronic obstructive pulmonary disease COPD or Asthma in older adults
7- Hypertension All non-maternal discharges of age 18 years and older with ICD-10-CM principal diagnosis code for hypertension.
8- Congestive heart failure All non-maternal/non-neonatal discharges of age 18 years and older with ICD-10-CM principal diagnosis code for CHF.
9- Low Birth Weight Number of births with ICD-10-CM diagnosis code for less than 2,500 grams in any field among cases meeting the inclusion and exclusion rules for the denominator
10- Dehydration PQI definition was updated to include more cases via Secondary Diagnosis codes. Also hyperosmolality and/or hypernatremia, gastroenteritis, or acute kidney injury are included.
11- Bacterial pneumonia Principal diagnosis code for bacterial pneumonia 12- Urinary tract infection Principal diagnosis code of urinary tract infection 13- Angina admission without procedure Principal diagnosis code for angina. *retired in 2015*
14- Uncontrolled diabetes diagnosis code for uncontrolled diabetes, without mention of a short-term or long-term complication.
15- Adult asthma Principal diagnosis code of asthma 16- lower-extremity amputation among patients with diabetes
Procedure code for lower-extremity amputation in any field and diagnosis code of diabetes in any field.
Pediatric Quality Indicators (PDIs) PDI Description
14- Asthma discharges ages 2 to 17 years with ICD-9-CM principal diagnosis code of asthma.
15- Diabetes Short-term Complications discharges ages 6 to 17 years with ICD-9-CM principal diagnosis code for short-term complications (ketoacidosis, hyperosmolarity, coma).
16- Gastroenteritis ages 3 months to 17 years with ICD-9-CM principal diagnosis code for gastroenteritis or with secondary diagnosis code of gastroenteritis and a principal diagnosis code of dehydration.
17- Perforated Appendix All non-maternal discharges ages 1 to 17 years with ICD-9-CM diagnosis code for perforations or abscesses of appendix in any field.
18- Urinary Tract Infection discharges ages 3 months to 17 years with ICD-9-CM principal diagnosis code of urinary tract infection.

BROWARDREGIONALHEALTHPLANNINGCOUNCIL|CHAPTERVII:THEHEALTHDATAWAREHOUSE 12
Acuity Admissions CPT Code Description
99281 Usually, the presenting problem(s) are self-limited or of minor severity.
99282 Usually, the presenting problem(s) are of low to moderate severity.
99283 Usually, the presenting problem(s) are of moderate severity.
99284 Usually, the presenting problem(s) are of high severity, and require urgent evaluation by the physician but do not pose an immediate significant threat to life or physiologic function.
99285 Usually, the presenting problem(s) are of high severity and pose an immediate significant threat to life or physiologic function.
Emergency Department NYU Algorithm All NON-Drug/Alcohol/Psychiatric/Injury • The NYU Ed Algorithm classifies the cases as:
o NonEm: Non-Emergent o EmPCT: Emergent/Primary Care Treatable o EmPrev: Emergent - ED Care Needed - Preventable/Avoidable o EmNonPrev: Emergent - ED Care Needed - NOT Preventable/Avoidable
ONLY Drug/Alcohol/Psychiatric/Injury/Unclassified • These cases are classified separately from the “ED Visits by Emergency Status”:
o Injury - Injury principal diagnoses o Psych - Mental health principal diagnoses o DrugAlc - Alcohol /Drug-related health principal diagnoses o Unclass - Not classified - not in one of the above categories