Embed Size (px)
Citation preview

Distributed Systems DesignServer Setup for The DynamicApplication Migration Project
Networks and Distributed SystemsGroup 800
Aalborg University, 2. semester Spring 2012


School of Information and Communication TechnologyNetworks and Distributed SystemsFrederik Bajers Vej 7Telefon +45 99 40 86 00http://www.sict.aau.dkE-mail [email protected]
Title:Server Setup for The Dynamic ApplicationMigration Project
Theme:Distributed Systems Design
Project Period:P8, Spring semester 2012
Project group:12gr800
Group members:Jacob Theilgaard MadsenChres Wiant SørensenThomas Sander KristensenDimitar MihaylovKonstantinos Papaefthimiou
Supervisor:Henrik SchiølerHans-Peter SchwefelThomas Paulin
Number of copies: 9
Number of pages: 104
Appended documents: 5 appendix + CD-ROM
Finished: 31-05-12
Abstract:
This project is concerned with the design of a dis-tributed server system for the DAM project. TheDAM project has been analyzed and compared tothe OPEN project, both of which concerns migra-tion of applications between devices, in order toget some inspiration on how to solve some of theproblems encountered in the DAM project. Otherways to distribute server systems have been ana-lyzed as well, one of them is the reliable serverpooling. This technology was deemed very promis-ing in countering many of the challenges found inthe DAM project, and it was decided to implementthis distributed server system on top of reliable ser-ver pooling. It was found that some synchroniza-tion between elements in the pool was needed, in-stead of mirroring all data on all servers. This led toreliable server pooling being modified, in order tofulfill better the desired needs, with focus of scala-bility, and lead to an implementation of a technol-ogy called rsync, which allows synchronization be-tween servers. A proof of concept system was im-plemented and tested.Several bottlenecks were considered, and pool ele-ments were chosen as the most critical bottlenecks.It was decided to analyze the pool elements whenthey were handling user to user communication inthe form of server-bouncing. The service time of apacket in a server-bounce was measured on the im-plemented system. Other parameters needed in themodel were chosen from an analysis of user behav-ior. This model is later on used to find informationregarding the queue on the pool element.
The content of this report is freely available, but may only (with source indication) be published after agreement with the au-
thors.


PrefaceThis report is made by a group of 2nd semester students of the Network and Distributed Systems mas-ters programme at Aalborg University.
This report consists of four parts: Preliminary Analysis, Design and Implementation, Conclusion andAssessment, and Appendices. The Preliminary Analysis will contain an analysis of the project, and theexisting technologies that has an influence on the project. The goal of this is to end up with a completedescription of what should be developed during the rest of the project. The Design and Implementationpart will contain the development and implementation of the system described in the Preliminary Anal-ysis. The Conclusion and Assessment is used to conclude on the entire project, as well as discussingwhat was done, and what should be done in the future for this project to be a success.
Throughout the report a matrix notation will be used, where matrix elements left blank is equal to zero.
Throughout the report external references will be displayed as numbers, an example of this is: [1]. Ifthe report is read digitally these references will be interactive, and they can be used to jump directly tothe reference in the reference list found on page 89.
The report also contains a glossary list where acronyms and abbreviations used in the report can befound. These glossaries will be interactive in the same manner as the references.
As a part of the project is a CD. This CD contains measurement data, the developed software and adigital copy of the report.
Jacob Theilgaard Madsen Chres Wiant Sørensen
Thomas Sander Kristensen Dimitar Mihaylov
Konstantinos Papaefthimiou


Table of contents
1 Introduction 7
I Pre-Analysis 9
2 Usecase analysis 102.1 Scenario . . . . . . . . . . . . . . . . . . . . . . . . . . . . . . . . . . . . . . . . . . 102.2 Usecase diagrams . . . . . . . . . . . . . . . . . . . . . . . . . . . . . . . . . . . . . 112.3 Challenges . . . . . . . . . . . . . . . . . . . . . . . . . . . . . . . . . . . . . . . . . 12
3 Server pool considerations 153.1 Synchronization and backup . . . . . . . . . . . . . . . . . . . . . . . . . . . . . . . 153.2 Resource management . . . . . . . . . . . . . . . . . . . . . . . . . . . . . . . . . . 16
4 Existing Technologies and Scenarios 184.1 OPEN project . . . . . . . . . . . . . . . . . . . . . . . . . . . . . . . . . . . . . . . 184.2 Rsync . . . . . . . . . . . . . . . . . . . . . . . . . . . . . . . . . . . . . . . . . . . 204.3 Reliable Server Pooling . . . . . . . . . . . . . . . . . . . . . . . . . . . . . . . . . . 214.4 Review . . . . . . . . . . . . . . . . . . . . . . . . . . . . . . . . . . . . . . . . . . 26
5 System Description 28
6 Requirement specification 31
7 Acceptance test specifications 337.1 Rsync acceptance test . . . . . . . . . . . . . . . . . . . . . . . . . . . . . . . . . . . 34
II Design and Implementation 35
8 Overview of design and implementation 36
9 Changes to RSerPool 389.1 Backup methods . . . . . . . . . . . . . . . . . . . . . . . . . . . . . . . . . . . . . . 389.2 Changes to the ASAP . . . . . . . . . . . . . . . . . . . . . . . . . . . . . . . . . . . 439.3 Changes to the ENRP . . . . . . . . . . . . . . . . . . . . . . . . . . . . . . . . . . . 44
1

TABLE OF CONTENTS
10 Server setup 4510.1 Threadpool . . . . . . . . . . . . . . . . . . . . . . . . . . . . . . . . . . . . . . . . 46
11 Implementation of the modified RSerPool 4811.1 Registrar implementation . . . . . . . . . . . . . . . . . . . . . . . . . . . . . . . . . 4811.2 Pool element . . . . . . . . . . . . . . . . . . . . . . . . . . . . . . . . . . . . . . . 5411.3 Rsync . . . . . . . . . . . . . . . . . . . . . . . . . . . . . . . . . . . . . . . . . . . 60
12 Acceptance test 6312.1 Modified RSerPool test . . . . . . . . . . . . . . . . . . . . . . . . . . . . . . . . . . 6312.2 Rsync acceptance test . . . . . . . . . . . . . . . . . . . . . . . . . . . . . . . . . . . 66
13 Performance analysis of the modified RSerPool 6813.1 Bottlenecks . . . . . . . . . . . . . . . . . . . . . . . . . . . . . . . . . . . . . . . . 6813.2 Queueing model for server bounce sessions . . . . . . . . . . . . . . . . . . . . . . . 6913.3 Service time measurements . . . . . . . . . . . . . . . . . . . . . . . . . . . . . . . . 7913.4 Conclusion . . . . . . . . . . . . . . . . . . . . . . . . . . . . . . . . . . . . . . . . 80
III Conclusion and Assessment 81
14 Conclusion 82
15 Assesment 8315.1 Achievements . . . . . . . . . . . . . . . . . . . . . . . . . . . . . . . . . . . . . . . 8315.2 Fault detection analysis . . . . . . . . . . . . . . . . . . . . . . . . . . . . . . . . . . 8415.3 Future work . . . . . . . . . . . . . . . . . . . . . . . . . . . . . . . . . . . . . . . . 86
IV Appendix 90
A Test of the RSerPool implementation 91
B Test of the rsync implementation 94
C Measurement of server bouncing service times 98
D Definitions of the added ASAP packets and parameter 101
E Definitions of the added ENRP packets 104
2

Glossary
Peer to Peer Connection directly between two devices without server influance. 2
Server bouncing A connection between two clients where the data is transferred from one client to theserver, and then forwarded from the server to the other client. 2
Server Pool A group of servers that share a common purpose. 2, 10–12
3

Glossary
4

Acronyms
ASAP Aggregate Server Access Protocol. 2, 22–24, 36, 38, 43, 44, 63, 64, 66, 82
BLA Best Link Algorithm. 2, 8, 14, 28, 86
CPU Central Processing Unit. 2
DAM Dynamic Application Migration. 2, 7, 8, 10, 21, 26, 28, 73, 82
ENRP Endpoint haNdlespace Redundancy Protocol. 2, 22–24, 38, 44, 82, 104
GUI Graphical user interface. 2, 10
ID Identifier. 2, 22
IP Internet Protocol. 2, 22, 24–26, 31, 65, 71, 79, 91, 92
J2EE Java 2 Enterprise Edition. 2
MD5 Message digest algorithm. 2
MMPP Markov Modulated Poisson Process. 2, 70, 71
OPEN Open Pervasive Environments for migratory iNteractive services. 2, 8, 18, 26–28
P2P Peer to Peer. 2, 11, 13, 14, 29, 86
PE Pool Elements. 2, 15–17, 22–24, 26–29, 31–33, 36–46, 48, 49, 51, 54–58, 60–66, 68–71, 78, 79,82, 83, 85–87, 91, 92, 94, 98
PR Registrar. 2, 22–25, 27, 31–34, 36, 37, 43–46, 48, 49, 51, 54, 58, 63–66, 68, 69, 82–87, 91, 92, 98
PU Pool User. 2, 15, 22–24, 26, 27, 29, 31–33, 36, 38–44, 48, 49, 51, 54–58, 60, 63–66, 68–71, 73,78, 79, 82, 83, 86, 87, 91, 92, 98
QoS Quality of Service. 2, 12, 13, 16, 17, 25, 29, 51, 86
5

Acronyms
RSerPool Reliable Server Pooling. 2, 21–26, 29, 31, 32, 36–38, 43, 44, 46, 48, 49, 60, 68–70, 73, 82,83, 85–87, 94
SCTP Stream Control Transmission Protocol. 2, 22–26, 54, 61, 91, 98
SPOF Single Point of Failure. 2, 22, 25
TCP Transmission Control Protocol. 2, 22, 23, 25, 26, 56, 61, 79, 98
UDP User Datagram Protocol. 2, 22, 23, 25, 61
UVN User Virtual Network. 2, 8, 28
6
Chapter 1Introduction
Mobile devices are getting more and more powerful, which opens the possibility to make more flexiblesoftware solutions which will make personal data available to the user wherever he goes. Nowadaysapplications let the user to check his email while he is on the bus or read the latest news online while heis on the train. The Dynamic Application Migration (DAM) project aims to extend this availability andmakes all the data that the user has available to him wherever he goes and allowing him to share it withother people if he desires so.
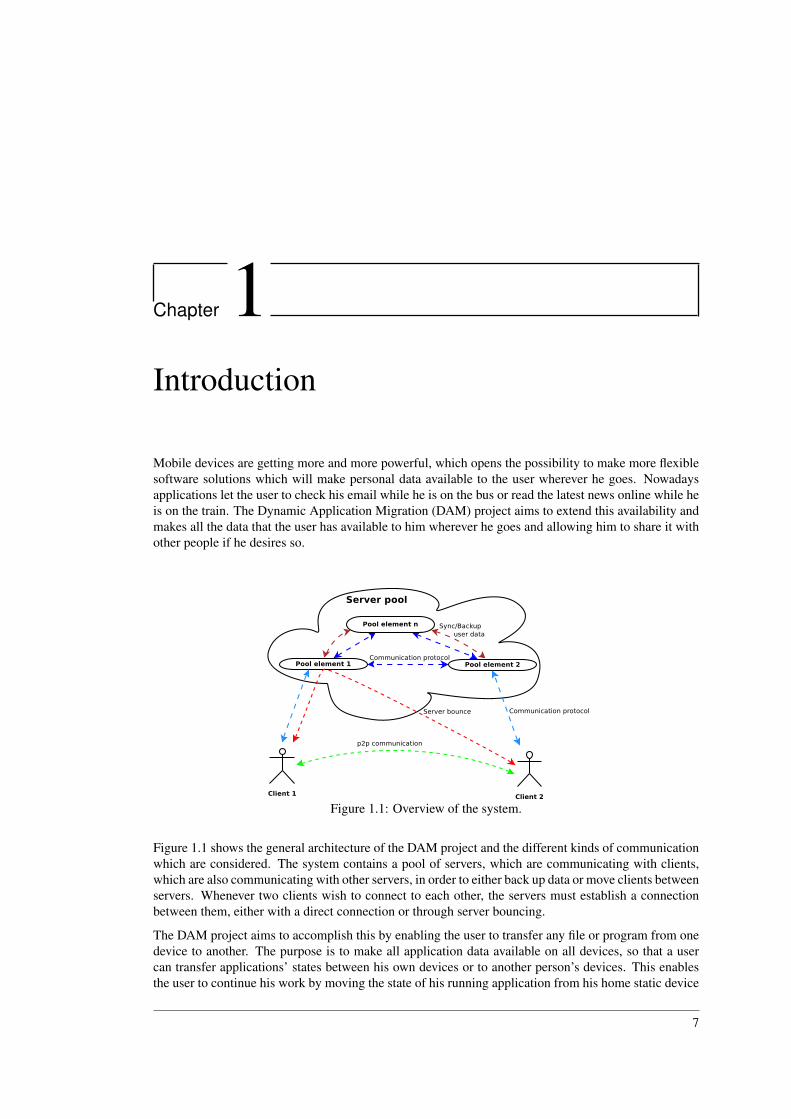
Figure 1.1: Overview of the system.
Figure 1.1 shows the general architecture of the DAM project and the different kinds of communicationwhich are considered. The system contains a pool of servers, which are communicating with clients,which are also communicating with other servers, in order to either back up data or move clients betweenservers. Whenever two clients wish to connect to each other, the servers must establish a connectionbetween them, either with a direct connection or through server bouncing.
The DAM project aims to accomplish this by enabling the user to transfer any file or program from onedevice to another. The purpose is to make all application data available on all devices, so that a usercan transfer applications’ states between his own devices or to another person’s devices. This enablesthe user to continue his work by moving the state of his running application from his home static device
7

CHAPTER 1. INTRODUCTION
to another mobility device. By using DAM the user can seamlessly share documents with his friends,continue working while traveling or access his music collection from his mobile device (smart phone,tablet, laptop, etc.). In order to accomplish this, a virtual network is setup for each user, so that all theusers’ devices can be seen as being on the same network even if they are connected to different servers.This User Virtual Network (UVN) maintains a connection between the devices and the server. If a con-nection to a device located on the UVN is requested, the server will initiate the connection using theBest Link Algorithm (BLA) as described in [2].
There is another project which attempts to accomplish a similar goal as the DAM project. The OpenPervasive Environments for migratory iNteractive services (OPEN) project deals with moving an appli-cation state, which is being streamed from a server, from one device to another without the streamingserver noticing it. It accomplishes this by having another server which can redirect the traffic from thestreaming server between devices. The OPEN project also aims to enable users to have several applica-tions streamed, and only moving one of them between devices. This requires a specific user interface,which easily displays the information needed to move applications to nearby devices. This raises thequestion of when a device is supposed to be able to move an application state. Is it in range? And in thatcase, how should devices determine when they are in range? And how do you make sure that you donot get devices in range which you are not interested or supposed to see? The OPEN project has beenintegrated and tested on a single server system, but neither, it has been tested with a high amount ofusers or a high load on the server, nor it has been tested how several servers are going to work together.[3]
Comparing the DAM project and the OPEN project, there are several similarities, but also differences.The OPEN project deals with migrating an application state which is being streamed by an applicationserver without the server noticing it, while the DAM project deals with moving application betweenusers’ devices. Both projects have to consider how multiple servers will interact to offer the best userexperience, but it is something that has not been described yet in either of the projects.
The two projects have similar needs considering server distribution. In both of them a considerationof the functionality should be done in order to proof that the functionality of the system will remain ifthe number of users and servers increases over time. If the system becomes popular, it would have toserve a considerably high amount of users. Therefore, it will be hard to achieve a reliable system. Thereliability of the system is required in order to insure that the system will fails rarely. If a componentof the system goes down due to some failure, the system should be able to replace this component byanother in order to prevent a failure in the whole system and to avoid potential data loss. A highlyreliable system would be able to serve users even if a part of the system is not functioning. Part of thiscan be achieved through synchronization between servers and by making the servers redundant.
This leads to the following problem statement:Is it possible to set up a system of servers which are able to ensure redundancy and synchroniza-tion, while supplying the functionality needed of either the DAM or the OPEN project?
8

Part I
Pre-Analysis
9

Chapter 2Usecase analysis
In this chapter, some usecases will be created in order to get a better understanding of the different typesof services the Server Pool should offer to its’ clients. In order to develop a usecases, a game scenariois created to show which services are needed.
2.1 Scenario
In this section a scenario, in which the DAM project can be used, will be described. This scenario shouldhelp clarify what the components of the system are supposed to do and what requirements they shouldfulfill. This scenario is chosen so that it covers as many requirements as possible, so if the componentsof the system are designed to handle this scenario it will also be able to handle as many other scenariosas possible. It is assumed that all devices are connected to the DAM server.
Scenario description
A user is playing a video game, but has to leave his computer to meet his friend. He would like tocontinue his game while going to his friend’s house, so he migrates the current state of the game to histablet. When he arrives at his friend’s house, he migrates the game to his friend’s computer and keepson playing.
Server requirements
When the user wants to migrate the game from his computer, the server must be able to initiate aconnection between the two devices that allows the transfer of the game state. However, since thereceiving device is a tablet, the game could require too many resources for the tablet to handle thegame. In this case, the game should be run on the computer and the tablet should work as a thin client.This means that the server must be able to cope with the high load of streaming the Graphical userinterface (GUI) of the game to the tablet. In case several users want to do this simultaneously, theserver must be able to distribute users from one servers to another if they have exceeded capacity. Theserver should also be able to deliver this service ”infinitely” fast in such way that the end user will notexperience any handover.
10
CHAPTER 2. USECASE ANALYSIS
When the user wants to transfer his game from his tablet to his friend’s computer, the computer couldbe connected to a different server (e.g. server 2) than the one that the tablet is connected to (e.g. server1). In this case, server 1, to which the tablet will request the migration, would need to be able to findthe computer on server 2 so as the connection can be initiated. The registrar should also be able torecognize that the tablet is running a thin client and the connection therefore will have to be establishedbetween the two computers, instead of the tablet and the friend’s computer.
2.2 Usecase diagrams
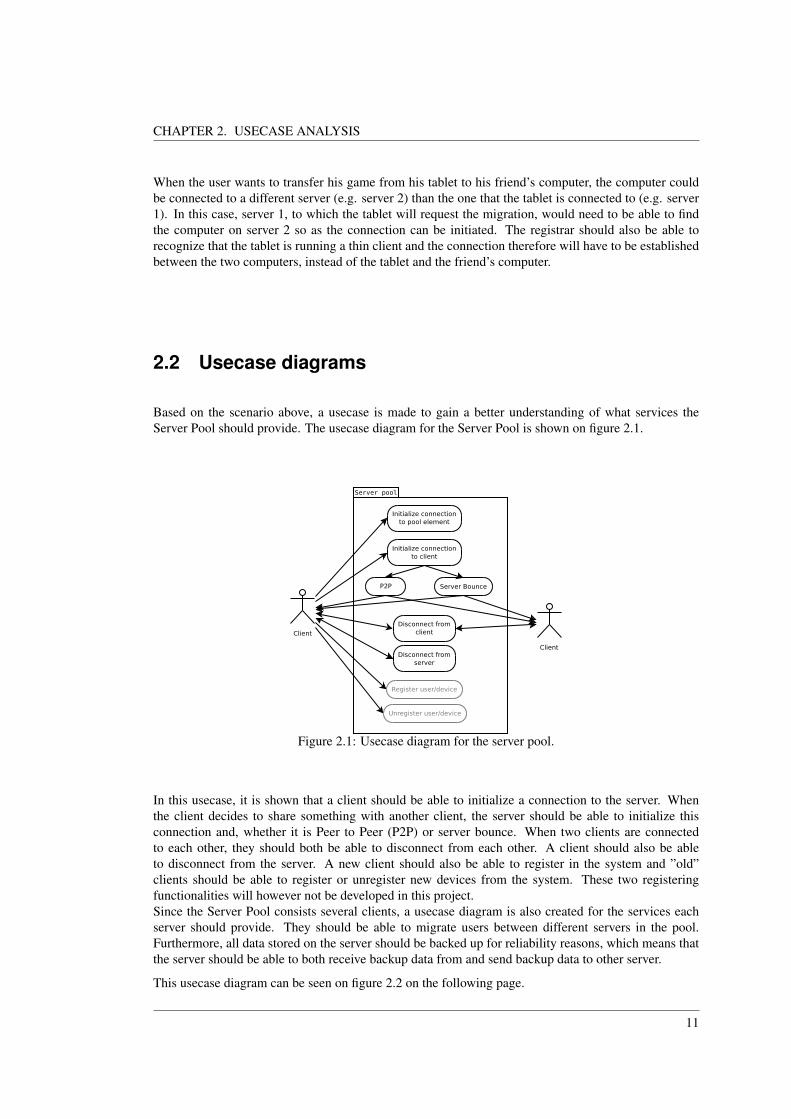
Based on the scenario above, a usecase is made to gain a better understanding of what services theServer Pool should provide. The usecase diagram for the Server Pool is shown on figure 2.1.
Figure 2.1: Usecase diagram for the server pool.
In this usecase, it is shown that a client should be able to initialize a connection to the server. Whenthe client decides to share something with another client, the server should be able to initialize thisconnection and, whether it is Peer to Peer (P2P) or server bounce. When two clients are connectedto each other, they should both be able to disconnect from each other. A client should also be ableto disconnect from the server. A new client should also be able to register in the system and ”old”clients should be able to register or unregister new devices from the system. These two registeringfunctionalities will however not be developed in this project.Since the Server Pool consists several clients, a usecase diagram is also created for the services eachserver should provide. They should be able to migrate users between different servers in the pool.Furthermore, all data stored on the server should be backed up for reliability reasons, which means thatthe server should be able to both receive backup data from and send backup data to other server.
This usecase diagram can be seen on figure 2.2 on the following page.
11

CHAPTER 2. USECASE ANALYSIS
Figure 2.2: Usecase diagram for a single server.
From these usecases it can be seen that if a reliable Server Pool has to be create and backing up data isrequired. This will be discussed further in the next chapter.
2.3 Challenges
The usecase presented in section 2.2 on the previous page for the system described in the introductionchapter, yields some challenges. These challenges, which has to be solved in this project, will bepresented and described in this section. The figures in this section will be based on figure 1.1 on page 7from chapter 1. Details from figure 1.1 will be omitted in the following figures in order to clarify thechallenges in focus.
A basic challenge when creating a server pool is how users connect and disconnect to the pool and whatshould happen during those events. This is illustrated on figure 2.3.
Figure 2.3: Usecase diagram for a connect/disconnect.
The first challenge when a client connects to the pool is to figure out which server it should establish aconnection with. This will have to be a weightning between the distance to the individual servers andthe servers’ current load in order to get the best Quality of Service (QoS), as will be described moredetailed in section 3.2 on page 16.To accomplish such weightning, it is expected that there should be some communication within the poolin order to share statistics like current load and more, which will be elaborated further in 3.1 on page 15,which will also contain a discussion of which data should be syncronized and which data should bebacked up. The reason for distinguising between the two, is because the system is expected to handlemillions of clients connected simuntaneously, so the size of their data is expected to grow beyond asingle server capacity. Because of that fact, servers cannot be completely mirrored, thus each of themwill have to store only a subset of all data.
12

CHAPTER 2. USECASE ANALYSIS
As servers are not completely mirrored, only a subset of all servers have all data belonging to a specificclient, so the weightning between distance and load will have to be of the servers storing the clients data.
Another challenge arises when a client seeks another client. This should be easy to lookup in a databaseif both clients where connected to the same server. Unfortunately, clients are not always connected tothe same server which is illustrated in figure 2.4.
Figure 2.4: Usecase diagram for a client communication.
In the case that clients are connected to different servers, one of the clients on figure 2.4 cannot justlookup the other client in the servers local database unless the servers either ask each other when arequest arrives or unless the servers have already syncronized information required for the first client toconnect to the other client.
When clients seek each other as illustrated in figure 2.4, it is most likely because they want to com-municate.They will then have to choose either P2P communication or server bouncing communication as it canbe seen on figure 2.5.
Figure 2.5: Usecase diagram for migrating.
On figure 2.5, it could be that the clients were able to establish a P2P connection. This gives the bestQoS for both clients, and also it does not put any strain to the server pool. Unfortunately, this is notalways the case. Some clients might be behind firewall or for various reasons unable to establish a P2Pconnection. In that case, they will establish a server bounce connection as shown by the orange line.Server bouncing is heavy on the servers, and in case too many clients are bouncing on a server or aserver is rather overloaded to deliver the best possible QoS, it might be that clients should be migrated
13

CHAPTER 2. USECASE ANALYSIS
to other servers in order to distribute the load on the pool.
Migrating clients communicating with each other should not affect clients communicating using P2P asseen on figure 2.5 on the previous page, but a server bounce that has to be migrated is definitely affectedunless the clients’ sessions are handled properly.
This session is handled by the BLA protocol and will therefore not be discussed in this project.
14

Chapter 3Server pool considerations
In this chapter the management of Pool User (PU)s’ data within the server pool will be discussed.This is done with focus on ensuring high reliability for the PUs and their data. The PUs should bedistributed within the server pool according some policies, to ensure that no Pool Elements (PE) will beoverloaded.
3.1 Synchronization and backup
In this project there will be a separation between two different types of user information. There is theuser login information, which contains a unique user id, a username and a password. This data is as-sumed to change rarely and only when a new user is created or a user changes password. Then thereis the PUs’ data, which consists things like security policies, often used hot spots, etc. This data isdynamic and it can be changed by the PUs offently.The user login information is needed when he wants to establish a connection with the registrar, whilethe user data is needed by the PE to which the user is connected to. If PU connects to a new PE, thatregistrar must have the login information of the PU from the start, although it does not need the userdata. To increase scalability and decrease the network traffic between PEs, it has been chosen not todistribute user data to every PE in the pool, but only to specific ones, picked based on a certain protocolwhich will be designed later on.
When using the term synchronization, we consider the login information of the user, which must beavailable on the registrar which the user attempts to log in to. In order to ensure that the login informa-tion is the same in every registrar which uses it, some kind of version control could be used and all theinformation that is stored on a registrar should be shared with every other registrar by using synchro-nization protocol.
When using the term backup, we consider the PUs’ data. This data will be available on the ”host” PE,however if that PE goes down due to overload, then there should be another backed up PE which shouldbe able to handle the dropped PU and provide him with his backed up data. This means that the backedup PE needs to have latest version of the PUs data. A trade off between how often the PUs’ data canbe backed up and how much bandwidth or processing power is available should be considered. If the
15

CHAPTER 3. SERVER POOL CONSIDERATIONS
PE goes down before it can backup data, then the system will experience data loss, which is a problem.However, if all data is backed up constantly, then the capacity of the connection between the PE mightbecome overloaded or the PE might not be able to handle users. This means that the reliability of thePE can be obtained as the probability of the servers not going down. This reliability can then be usedto deduce the reliability of the system, according the risk of losing data and the risk of all PEs with auser’s data to go down at the same time. This is of course dependent on how many PEs are used to backup that data.
3.2 Resource management
In a server pool, it is important to distribute the load on all servers in a way that individual servers arenot overloaded while other servers are idle.A way of distributing the load would be to migrate users so that an equal load on all servers is obtained.Unfortunately, users cannot just be migrated randomly to obtain equal load, because it is also desiredthat clients connect to the closest server possible in order to experience the best possible QoS.That is why there will have to be some weighting between server location and server resources in orderto obtain the best possible QoS.
Figure 3.1 shows a scenario, where a client wants to connect to a server in the server pool consisting ofthree servers. All servers in the server pool are already serving clients.
Figure 3.1: Resource Management
The two servers that are closest to the client connecting are heavy loaded and are not wishing newconnections, but the third server is available for new connections. Unfortunately, that server is too faraway from the client to provide an acceptable QoS, so there are three options:
• Option 1, is to ignore that the preferred server is heavy loaded and let the client connect. Thismight work, but could result in unacceptable QoS to the client connecting and all other clients onthe server. It could even put down the server if it runs out of resources.
• Option 2, is to let the client connect to the third server which is known not to give an acceptableQoS. In that way, the clients already connected will keep an acceptable QoS while the new clientwill get bad QoS.
16

CHAPTER 3. SERVER POOL CONSIDERATIONS
• Option 3, is to check if clients already connected to server 2 can be migrated, like it is illustratedon the figure. It could be that some clients already connected to Server 2 and at this specificmoment are idle, can be migrated to server 3 and still keep an acceptable QoS. In the worst casethat all clients connected to server 1 or 2 are currently using the server, there could be two possibleoptions offered to the connecting client: either wait for a predefined by a protocol period of timeand retry registering to a PE or connect to server3 until some of the clients of the two alternateservers are able to be migrated. In that way, the clients that are migrated might get a worse QoS,but all clients in the network will have an acceptable QoS and the new client can connect to server2.
The third option is definitely the optimal one, as it will ensure an acceptable QoS to all clients.
17

Chapter 4Existing Technologies and Scenarios
In this chapter, the existing technologies influencing this project will be described. This includes, ap-plication migration, synchronization, server pooling methods. When described, the methods will bediscussed with regards to their relevance for this project.
4.1 OPEN project
OPEN project is a European STREP (Specific Targeted Research Project), part of the European FP7research project which aims to provide an open migratory service platform, supporting application mi-gration between several interacting devices (mobile phones, desktop computers, laptops, notebooks,tablets, ipTV, etc.) while being in the middle of a running operation or task.[3]
Figure 4.1: Migration middle-ware deployment
The platform serves as a middle-ware in a migration infrastructure. The client-server infrastructure fol-lows a centralized pattern for collecting information and making decisions. It consists of a migrationserver, a mobility anchor point (server), an application server and migration clients. The migration ser-
18
CHAPTER 4. EXISTING TECHNOLOGIES AND SCENARIOS
ver is the central point of information, hence the place where most of the essential decisions regardingmigration of clients’ applications are made. More specifically, it is the place where context manage-ment, trigger management, state adaptation and mobility support take place[3]. The migration clientsare the end users of the system and interact with the migration server. Mobility of users in applica-tions is supported by the mobility anchor point, which functions as an intermediate between the clientapplication and the application server, making the migration seamless for the application server. Thedeployment of the migration middle-ware is presented on figure 4.1 on the preceding page.
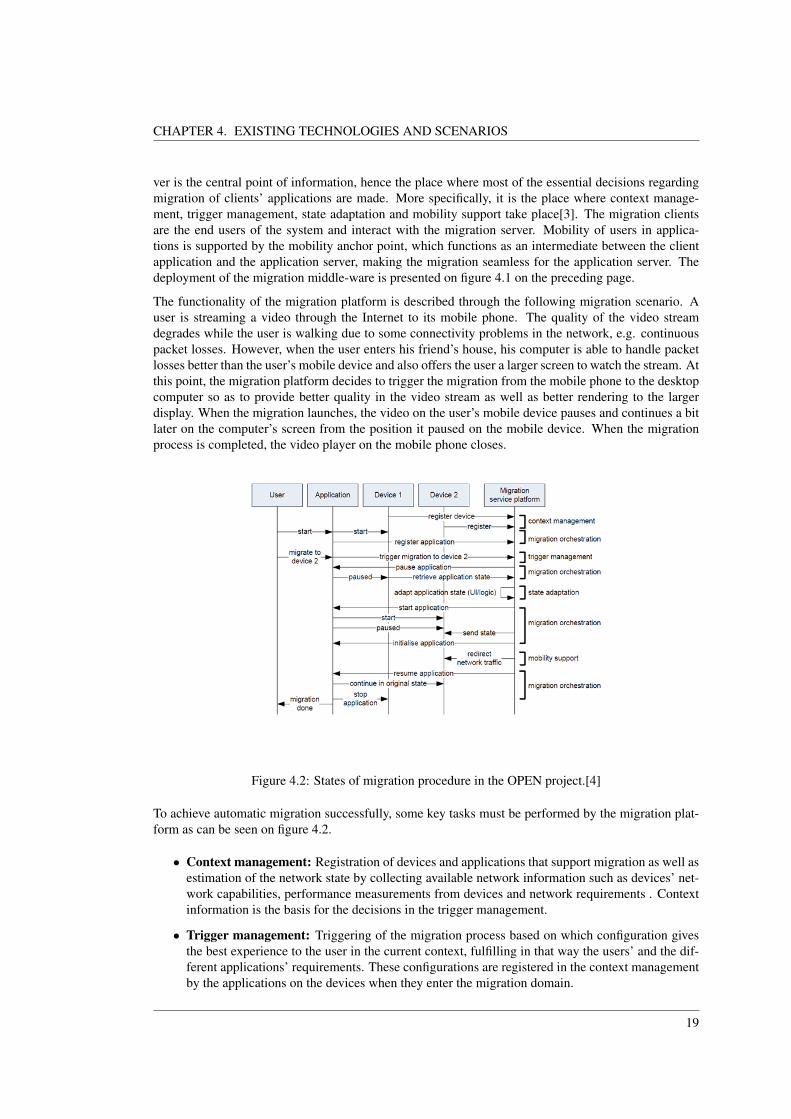
The functionality of the migration platform is described through the following migration scenario. Auser is streaming a video through the Internet to its mobile phone. The quality of the video streamdegrades while the user is walking due to some connectivity problems in the network, e.g. continuouspacket losses. However, when the user enters his friend’s house, his computer is able to handle packetlosses better than the user’s mobile device and also offers the user a larger screen to watch the stream. Atthis point, the migration platform decides to trigger the migration from the mobile phone to the desktopcomputer so as to provide better quality in the video stream as well as better rendering to the largerdisplay. When the migration launches, the video on the user’s mobile device pauses and continues a bitlater on the computer’s screen from the position it paused on the mobile device. When the migrationprocess is completed, the video player on the mobile phone closes.
Figure 4.2: States of migration procedure in the OPEN project.[4]
To achieve automatic migration successfully, some key tasks must be performed by the migration plat-form as can be seen on figure 4.2.
• Context management: Registration of devices and applications that support migration as well asestimation of the network state by collecting available network information such as devices’ net-work capabilities, performance measurements from devices and network requirements . Contextinformation is the basis for the decisions in the trigger management.
• Trigger management: Triggering of the migration process based on which configuration givesthe best experience to the user in the current context, fulfilling in that way the users’ and the dif-ferent applications’ requirements. These configurations are registered in the context managementby the applications on the devices when they enter the migration domain.
19

CHAPTER 4. EXISTING TECHNOLOGIES AND SCENARIOS
• Migration orchestration: Proper coordination for successful migration between the initial andthe target device. It is responsible for registration and deregistration of applications as well asreception of the migration trigger and performing the migration.
• Application state adaptation: Adaptation of application state from the point the applicationinstance is paused until migration is fulfilled.
• Mobility support: Redirection of network traffic from initial to target device so as to supportuser mobility while changing networks as well as possible changes in the state of the networksuch as congestion, affecting the application’s quality. Mobility support is achieved by using amobility anchor point in the deployment of the system’s architecture, playing the role of a proxyserver to redirect data during migration.
4.2 Rsync
Rsync is a file synchronization algorithm originally made to speed-up remote updating of files on lowspeed communication channels[5]. The algorithm assumes that the receiver already have a previouscopy of the file(s) being updated in order to speed-up the file transfer(s). Else, the whole file will justbe send.Figure 4.3 gives an example of the rsync algorithm.Assuming that computer A has a file containing the string ”ABCabDEF”, which should be updated tocomputer B, and that B already has a previous version of the file, containing the string ”ABCDEFG”.The idea of rsync is then to speed-up the updating process by only sending the blocks of the file whichhas changed.
Figure 4.3: Rsync example
If a file is changed on computer A, the first step in the algorithm is to split the file on computer B intoequal sized data blocks. With the exception of the last block, which will contain the remaining data. Thedata block size has been chosen to two bytes in this example, but would in a real scenario be much larger.
The next step is to calculate two checksum for each data block on computer B, one fast and weakchecksum (Adler-32), and one slow and strong checksum (MD5).[5]
The checksums are send to the computer A, which inserts the received checksums into a hash tableto improve search performance.
Then, for each byte offset, computer A calculates a fast and weak checksum for each data block inits own file. These data blocks should be of same size that computer B used, so that the fast checksum(Adler-32) can be compared with the checksums received from the computer B.
20

CHAPTER 4. EXISTING TECHNOLOGIES AND SCENARIOS
If a data block in computer A’s file has an Adler-32 checksum equal to one of the checksums receivedfrom computer B, a MD5 checksum is calculated for computer A’s file to also compare that checksumto computer B’s checksum. If they are equal, a token is send to computer B telling which block matchand where in the file it should be located.On the figure, this happens for the data block ”AB” and ”EF” which is both in computer A and B’s file.All other checksums should not match each other, and therefore the content of the data blocks are sendas they are.
The above example has way to small block sizes to make sense in a real implementation, but assumingthat the blocks had been larger, some data would not have needed to be transmitted.Also, it should be noted that the checksums used is not collision free, meaning that two different datablocks can turn out to give the same checksums. This is however extremely unlikely to happen for thestrong MD5 checksum, which is why it is used to confirm the weaker Adler-32 checksum.
4.3 Reliable Server Pooling
The server availability is an important part of the DAM project. High availability can be achievedusing different approaches, one of these approaches is the Reliable Server Pooling (RSerPool). It is astandardized protocol suite, mainly used to distribute workload across multiple servers of the same pool.The main goal of the RSerPool is to create an application framework (for management of service poolsand handling a session between the client and the pool) for availability-critical services which includesthree main factors:[6]
• Availability - the best way to achieve it is to use the so called server - replication method. Basicallyhaving duplicated servers instead of just one which could be a single point of failure.
• Load Balancing - factor become an issues by the fact that we have multiple servers which are usedto insure redundancy. The idea is to insure that the assignment will maintain a balance trough theprocessing elements.
• Fault Tolerance - it is a property of the system to continue operating properly even if a failureoccurs in some of its elements.
The access scheme is illustrated on figure 4.4.
Figure 4.4: Reliable Server Pooling.[7]
21

CHAPTER 4. EXISTING TECHNOLOGIES AND SCENARIOS
The PEs form the server pool. Each of these PEs have its own PE Identifier (ID) which was assignedat registration. Any client who wants to connect to one of the PEs sends a request not directly to oneof the PEs of the pool but to a different pool of servers called the Registrar (PR)s. The communicationbetween the user and the PRs are done using the Aggregate Server Access Protocol (ASAP). A clientwhich is being served by a PE is called a PU. Any server who wants to become a PE has to register itselfwithin the pool handle and the PRs that supervises this particular pool. The PRs are responsible formaintaining up-to-date information about the state of all the servers within the pool. Which means thatit should be able to inform a potential PU about the optimal connectivity option among all the serversof the pool (i.e. the least loaded server). Communication between the PRs and the PEs is handledagain through the ASAP. The protocol used by the PRs to exchange information between them selfsis the Endpoint haNdlespace Redundancy Protocol (ENRP). The ASAP and ENRP will be describedlater in this section. Having all the valuable information regarding the state of all the PEs, the PRsends a subset of all transport addresses which can be used to access the PEs to the PU (e.g. least-usedalgorithm, nearest, etc.). The PU then decides to which particular PE it will connect based on a specificalgorithm that characterizes the specific pool policy (i.e Round Robin). The ASAP and ENRP usuallyuses the Stream Control Transmission Protocol (SCTP) as the transport layer protocol (TransmissionControl Protocol (TCP) can also be used). In case there is a failure in a PE while serving a client,it is the client’s responsibility to inform the PRs about the PEs failure. The PU does not wait for anew subset of available users to connect to but can fail-over (session resumption is highly applicationdependable) automatically to a new PE. To insure self-automatically configuration of the components ofthe RSerPool the PRs can introduce them self via User Datagram Protocol (UDP) over Internet Protocol(IP) multicast. That can be detected by the PEs, PUs and other PRs allowing them to obtain a list of thecurrently available PRs.
4.3.1 Aggregate Server Access Protocol(ASAP)
The ASAP together with ENRP gives a high-availability data transfer over IP networks. The mentionedprotocols work together and they have many parameters in common. The ASAP protocol is used forcommunication between the PRs, PUs, PEs.
The main functions of the ASAP protocol are[8]:
• Registration, deregistration, re-registration and monitoring
• Handling (selections of a server) for the PEs
• Self configuration of PEs
• Failover protection
4.3.2 Pool Management
The ASAP provides an advanced (handle-based) addressing model. By blocking the logical commu-nication endpoint from its IP address a better fault tolerance is achieved (it removes the connectionsbetween the communication endpoint and its physical IP address, which could be a reason for a SinglePoint of Failure (SPOF))[8]. By sending the Handle Resolution message to a PR, the PE waits for acertain interval. If there is no response a new PR is chosen. The response from the server is in form ofASAP Handle Resolution Response messages. Also the ASAP protocol determines each communica-tion endpoint as a pool, which can benefit the RSerPool, the load balancing and the fault management.
In order to register a PE into the handlespace the following information should be provided[8]:
22

CHAPTER 4. EXISTING TECHNOLOGIES AND SCENARIOS
• Pool Handle - where the PEs want to register
• PE ID - 32bit random identification number is assigned
• Transport Addresses - a list of addresses to which PE can connect - it contains the NetworkLayer protocol (IPV4, IPV6) and the transport protocol (SCTP, TCP or UDP) and the TransportLayer protocol port number.
• Policy Information - Least Used, Round Robin, or another queuing method.
Pool Design and Monitoring
Every PU can add or remove itself from the pool by requesting a registration or deregistration fromthe PR at any time without affecting the system. This is also monitored by ASAP Endpoint Keep-Alive messages. The PE should acknowledge this monitoring procedure whitin a certain interval (If themessage flag is set to zero thats mean that the registration was successful). If does not respond (in thiscertain interval) it will be assumed that it is out of service and it will be removed from the handlespace.In case of rejection the additional Error Parameter may contain information about the reason of thatrejection (no authentication, policy issues). It also should re-register regularly. If for some reason thePR fails the PE can pick up another PR for the re-regestration. The system will not notice the changebecause the PE identification number will be the same and the system will observe the change as anupdate. The ASAP protocol can obtain the full network redundancy by using the SCTP. As it wasmentioned the high-availability of the RSerPool can be achieved by using the ASAP and ENRP. TheASAP massages exchange information between the PEs, the ENRP and the PR.
The ASAP protocol message types are[9]:
• reserved
• ASAP REGISTRATION Used for PEs to register to the PRs.
• ASAP DEREGISTRATION Used for the PEs to deregister from the PR.
• ASAP REGISTRATION RESPONSE Send by the PR as response to a registration.
• ASAP DEREGISTRATION RESPONSE Send by the PR as response to a deregistration.
• ASAP HANDLE RESOLUTION Is send to a PE to request the handle resolution of that PE.
• ASAP HANDLE RESOLUTION RESPONSE Is send from a PE as response to the handleresolution.
• ASAP ENDPOINT KEEP ALIVE Used as heart beat packet in case the SCTP heart beat isnot sufficient.
• ASAP ENDPOINT KEEP ALIVE ACK Used as acknowledgement of the heart beat.
• ASAP ENDPOINT UNREACHABLE Send by either a PE or a PU to inform a PR that a PEis unreachable.
• ASAP SERVER ANNOUNCE Is send to either a PE or a PU to inform about transport infor-mation necessary to connect to the PR.
• ASAP COOKIE Send from PE to PU to convey information it wishes to share.
23

CHAPTER 4. EXISTING TECHNOLOGIES AND SCENARIOS
• ASAP COOKIE ECHO Is send from a PU to a new PE in case the first PE becomes unreach-able.
• ASAP BUSINESS CARD Send by PU to a PE to provide failover information.
• ASAP ERROR Used to send error messages.
• reserved
The typical protocol frame of the ASAP protocol contain (type, flags and length). This structure allowsmodifications. New parameters can be add without changing the frame.
• Type 8 bits
• Flags 8 bits
• Length 16 bits. The length of the whole massage plus the header
• Data varies
4.3.3 Endpoint haNdlespace Redundancy Protocol(ENRP)
The ENRP is designed to handle the communication between the PRs of the RSerPool. The ENRP isan application layer protocol that uses the IP and the SCTP. The ENRP defines ten different messagesfor the communication between PRs.[10]
• PRESENCE - This message is used for the PRs to periodically announce their presence to otherPRs, or to send information about the status of the PR.
• HANDLE TABLE REQUEST This message is used by a registrar to request a copy of anotherPRs handle space.
• HANDLE TABLE RESPONSE This message is send as a response to the HANDLE TABLEREQUEST message, and contains the PRs handle space.
• HANDLE UPDATE This message is send from a PR handling a PE, when ever the the PEchanges the handle space. This is send to inform the whole PR pool of the changes in the handlespace.
• LIST REQUEST This message is used to request the list of PRs. This is typically necessarywhen a new PR joins the pool and needs to be initialized.
• LIST RESPONSE This message is used as a response for the LIST REQUEST.
• INIT TAKEOVER This is used when a PR wants to over take another PR. This message is sendto all other PRs to inform them of the take over.
• INIT TAKEOVER CK This is used to acknowledge the INIT TAKEOVER message.
• TAKEOVER SERVER This message is used to inform all PRs that the take over has beenacknowledged and will be enforced.
• ERROR This message is used for reporting an error to other PRs.
24

CHAPTER 4. EXISTING TECHNOLOGIES AND SCENARIOS
These messages can be sent using two types of communication, point-to-point communication or announcements[10].The point-to-point communication is used when one PR wants to communicate with another, and is in-dicated by the ID of the receiving PR being part of the message. The announcements are used to spreadinformation to all other PRs, and is indicated by the receiving PR ID part of the message being set tozero.The before mentioned PR ID is a 32 bit identifier and is chosen by the PR itself when it is connectedto the pool[10]. This ID should be unique in the pool, however as the PR needs the ID to communicatewithin the pool, this cannot always be achieved, however with a good random number generator thepossibility of two IDs coincidentally being the same is very small when using a 32 bit ID.
When sending the PRESENCE message periodically, a PR break down can be detected fast. This isdone by all PRs having a counter making sure the other PRs have checked in regularly. If a PR detectsanother PR failing to send the PRESENCE message on time, it will send PRESENCE message, to thefailing PR, with an indicator flag showing that it needs a response. If the PR fails to respond to themessage, the detecting PR will initiate the take over procedure by using the take over messages.
4.3.4 Stream Control Transmission Protocol
The primary function of the transportation layer is to provide end-to-end communication service. To in-sure better functionality the transport layer uses the so called SCTP. The transport protocol implementedin the RSerPool is the SCTP. The main features of this protocol are:[11]
• Message boundary preservation - it prevents the message boundary by placing the messageinside one or more SCTP structures called ”chunks”. A few messages can be gathered togetheras on big chunk or a single message can be divided into a few chunks. All messages are protectedagainst errors using 32bit CRC checksum.
• No ”head-of-line” blocking - in comparison with the TCP when the receiver is forced to redirectpackets which arrive out of order due to the packet loss.
• Multiple delivery - SCTP uses several different delivering models (strict transmission (TCP),partially transmission, and unordered transmission (similar to UDP)).
• Multihoming support - SCTP sends packets to the destination IP address but it can redirectedin case of failure of the current IP address. The effectiveness of this feature of course can bedisrupted due to a SPOF. The SCTP connection should be able to recover faster and providebetter QoS since the secondary destination is not affected.
– Stress Reduction - the ”stress” over the communication infrastructure can be reduced.
– Topology Diversity - this multihoming basically works when we have a separation of therouter path at some point. The fault tolerance depends on the diversity of this change. Thislevel of diversity depends on the scale of the system.
– Delivery Options - in this case we have two parameters: reliable delivery and ordereddelivery. In TCP both of these are achieved at once (the data is reliable delivered). TCP isusing a sequence number in the header of each packet to make this possible. While SCTPseparates the reliable and ordered delivery into to different functionality. Like in TCP thesequence number in each header insures that the data was reliable delivered but SCTP candecide how it will process the packets to the destination application. It can use the sequencenumber in the header to build up the whole massage or it can just directly send them to theapplication which will remove the mentioned above head-of-line delay.
25

CHAPTER 4. EXISTING TECHNOLOGIES AND SCENARIOS
– SCTP Initiation - In TCP in order to establish a connection we need two IP addresses andtwo port numbers. In SCTP we need a set of IP addresses at the source and the destinationand one port number at the source and the destination.
• Congestion control - it supports all the techniques that TCP uses including congestion avoidanceand fast retransmission.
• Selective acknowledgments - its supports all the techniques that TCP uses including a SCTPfeedback to the sender to acknowledge him which packets should be resend in case of packetloss.
• Heartbeat keep-alive messages - SCTP sends this keep-alive messages to a destination address.If the address does not response in a certain interval the IP address is considered to be down.
• DOS protection - it was achieved by adding this so called security ”cookies” during the initial-ization.
Figure 4.5: SCTP four way handshake
SCTP uses four way handshake to exchange information in comparison with the TCP that uses threeway handshake. The state cookie (in the INIT-ACK) contain the information that the receiver needs toestablish its state. Then the state of the cookie was send back to the receiver in form of this COOKIE-ECHO. When the receiver obtain this message it will configure its state and send back a COOKIE-ACKto the sender in order to inform him that the configuration is complete. Both of this message can containsome user data. The full description of the cookie can be find in RFC 2104.
4.4 Review
The RSerPool framework provides high availability, and is therefore interesting when developing theservers for the DAM project. When considering the RSerPool for the DAM project, the PEs becomes ascalability issue, as they will need to contain information about all PUs registered to the system. Thismeans that in order to use the RSerPool for the DAM project, some changes must be designed in orderto make the server pool more scalable.
Successful migration of an application state, for example migration of a game as described in chap-ter 2.1 on page 10, is vital. Many aspects of the OPEN migration procedure can be adopted. The states
26

CHAPTER 4. EXISTING TECHNOLOGIES AND SCENARIOS
of the migration process shown in figure 4.2 on page 19, especially migration orchestration and appli-cation state adaptation, can form the base of our system’s migration framework. However, the OPEN’scentralized client-server infrastructure where a migration server functions as an intermediate betweenthe end user and the application server, does not fit in the distributed manner of our server platform.
Synchronization and backup of client data within the server pool is also an important feature of our sys-tem. In chapter 3.1 on page 15, this data has been divided into two basic categories: user data and logininformation. Synchronization of user login information will be done in all PRs’ databases belonging tothe pool while backup of PUs data will be done in specific PEs. The backup will be performed usingthe rsync synchronization method to minimize network traffic for performing the backup.
27
Chapter 5System Description
In the introduction, chapter 1, the DAM and OPEN project was introduced. Those projects both neededa multi-server solution to handle a huge amount of users. This project will focus on the DAM project,and intents to design and implement a multi-server solution required for handling a huge amount ofusers in the DAM project.
In chapter 2.1, a scenario of how the DAM project could be used was given. The scenario was oneout of many scenarios that could have been given. Common for all scenarios is that the traffic generatedfrom the clients connecting to each other, moving applications, streaming content, and anything elsecan all be seen as the clients connecting to each other randomly and exchanging files of random sizebetween each other. This simplification will be used as it is intended to focus only on implementing aserver infrastructure to support many clients simultaneously.
The BLA algorithm was implemented in a previous project to handle client sessions and choose be-tween server bounce and p2p connections. This algorithm should not be in focus and will therefore notbe implemented, instead clients will perform server bounces every time they wish to migrate data, asthis scenario puts the highest strain on the system.Also, UVNs are not taken into account, as it is not intended to spend a lot of time designing databases.This means that each device can be seen as a unique client.
The user-data for all users is expected to be too extensive to store on every server, therefore it should bedistributed on the PEs. The user-data is therefore divided into two categories:
• User-data that should be synchronized to all PEs.
• User-data that should only be backed up on some PEs.
The user-data that should be synchronized should be kept as small as possible for scalability reasons.This data will therefore only consist of basic login information. The user data that should be backed up,will mostly consist of information about the users known devices, commonly used access points andsecurity policies. As this is not the focus of this report, this user data will be emulated as random data.
Figure 5.1 on the facing page gives an overview of the system that should be implemented.
28

CHAPTER 5. SYSTEM DESCRIPTION
Figure 5.1: System overview
The system should be based on the RSerPool. It differs from the RSerPool in the fact that PEs cannotbe completely mirrored. Therefore, when a PU requests a PE from the registrars, the registrars shallreturn a PE, that has the PU’s user data, based on the weighting between load and geographical positionof PEs in order to obtain the best possible QoS for all users. In order to support this, some changes willbe designed for the RSerPool.
A server protocol has to be designed that can synchronize and back up user data between PEs. Anapplication protocol should be implemented to allow clients to initialize server bounce connection witheach other.
Figure 5.2 on the next page shows in a general way how the game scenario that has been presented inchapter 2.1 works in the system. In our scenario we have a user playing a video game and he wantsto move the application state to his tablet. The migration of the application state can be done afterboth of the devices initialize a connection with a PE from the pool, then the pool according to somepolices decides that it will establish a P2P connection and the migration will take place directly betweenthem. After the movement of the application the user may also move to a different server. This serverswitching could happen for example if the user goes on a vacation in a different country, then he wants toestablish a connection between his tablet and his friends computer. Again both devices should initializea connection and a pool element should be assign by the pool. This time the server will establish aserver bounce connection (according to some polices). Both of the devices (the table and the User 2 PC)should be connected to the same PE, then the tablet will initialize migration to User 1 PC and User 1PC will start migrating the application state to User 2 PC. After the migration is done a message will besend to both User 1 PC and tablet that the migration was successful. An additional independent devicewas assign to the same PE which will increase the load on this PE. In real life case we could have manyof this devices. When the system initialize a server bounce connection the load on each server willaffect the communication between these different devices in our case the tablet and the users PCs. Thatis why some kind of optimization should be provided 3.2.
29

CHAPTER 5. SYSTEM DESCRIPTION
Figure 5.2: General system’s states
30

Chapter 6Requirement specification
The purpose is to customize the RSerPool implementation in a scalable way so that an extreme amountof users can have userdata stored on the pool elements and still be offered as good QoS as possiblewith respect to response times, meaning that users should be connected to PEs as close to their owngeographical position as possible. This will require queuing theory applied on the bottlenecks in theimplementation, which will also be covered partly as a secondary goal of implementing of the RSerPoolto make test in practice.
• A system consisting of a PR, several pool elements and several clients must be set up.
• Using this system, an estimation of the service rate of jobs in part of the pool must be found.
• By using this estimation, queue lengths and waiting times must be found from a model of thesystem.
In order to develop the proof of concept of the RSerPool implementation, some requirements to thesoftware are created:
Requirement 1: The PR and PEs should be able to handle communication with each other.This means that the PR should be able to decode packets sent from the PE, and vice versa.Requirement 2: A PU should be able to log in to a PR and PE.This means that a PR should be able to receive and decode a packet request sent from a PU and fromthe PU information find which PE the PU should be connected to. A response message containing theIP of the desired PE will be sent to the PU informing him that he can connect to this specific PE. ThePR will also send a message to the PE informing him that the PU will connect to it soon. The PE thenshould be able to handle the incoming connection from the PU.Requirement 3: A PU should be able to communicate with another PU on the same PE.This is implemented as a server bounce session between the two PUs, and means that the PE should beable to relay packets from one PU to the other.Requirement 4: If a PE goes down the PR should be able to assign clients to another PE, and PUsshould automatically reconnect to a PR.In case of a server breakdown the PUs will need to reconnect to the system, by sending a login requestto a PR. The PR should be informed that the PE is down, and not assign PUs to the same PE.Requirement 5: A PU should be able to disconnect from a PE.If a PU wishes to disconnect from the system, it should send a message to the PE to which is connected
31
CHAPTER 6. REQUIREMENT SPECIFICATION
to, which should then inform its PR that the user have logged off. The PR should then update thedatabase with this information.Requirement 6: It should be possible to use the system to find an estimation of the time that it takes toservice a single packet in a server bouncing scenario.
In order to test the RSerPool some analysis should be made.
The requirements for the analysis are:Requirement 1: A model for a pool element doing server bounce should be made.Which means that at least two PUs have to connect to a PE and establish a server bounce connection.Requirement 2: A numerical analysis of the model should be made.The minimum requirements for this model should include at least one PR, several PEs and several PUs.The purpose of the model is to see if the scalability and the reliability of the system are achievedRequirement 3: Using the numerical analysis the average queue length and the average waiting timewill be calculated.
32

Chapter 7Acceptance test specifications
In order to test if the system fulfills the requirements in the requirement specification, a series of testshave been made. The first one will test most of the system by itself. Additional tests will focus on thechanging of passwords on a PR and the rsync algorithm. The first test will go through the followingsteps:
• Start a PR.
• Register 4 PEs.
• Create 2 PUs.
• Login the 2 PUs.
• Start a server bounce session.
• Terminate the server bounce session.
• Terminate the PE that PUs are connected to.
• Disconnect PUs.
The first part will test that a PR is started and that four PEs are connected to it. It will be performed bystarting the servers and then observing the packets arriving at the PR. This will prove that the communi-cation is working and that the servers are up and running. Thereafter, two PUs will be created. This willbe confirmed by looking at the database with the PUs information. This test will show that the PR cancreate new PUs’ entries in the database and change the data of the PUs. Once this is done, the two PUswill log in to the system, which means they will first connect to the PR, and then they will be redirectedto a PE. By looking at the packets received at the PR and PE it can be confirmed that users are onlineand registered. Hence, there is a viable communication between the PUs, PEs and PR. After achievingthat every component is up and running, a server bounce session will be initiated between two PUs anda few packets will be send before the session closes down again. By looking at the packets received onthe PUs it will be verified that the PU to PU communication works. At last, the PE that the PUs areconnected to will be shut down and by looking at the packets received and sent by the PR, it will beconfirmed that the PUs are assigned to a new PE.
A test is made to see if it is possible to change the password of a PU. It will go through the followingsteps:
33

CHAPTER 7. ACCEPTANCE TEST SPECIFICATIONS
• Start a PR.
• Create a user on the PR.
• Send a request to change password.
This test will be verified by observing the database before and after the password change request hasbeen sent.
7.1 Rsync acceptance test
As rsync algorithm has not been integrated into PEs, the test can be done on two ethernet connectedcomputers. In the test, Computer A will synchronize to Computer B:
• Computer B: Start-up rsync as a server (rsync backend)
• Computer A: Create a local file with random data and use rsync to synchronize the file to Com-puter B.
• Computer B: Confirm that the file from computer A was created and synchronized properly.
• Computer A: Add, delete, and move data in the file and use rsync to synchronize the file toComputer B again in order to confirm that the file is updated properly no matter which changesare made.
The file created on computer A will contain the data: ”Abcd3fgh ijklmNop qrstu1 2000”. After sendingthe file to computer B, a comparison of the copy of the file will take place on both computers. Followingthe end of the comparison process, the file on computer A will be changed to: ”d3fgh NEWTEXT qrstu12000ijklmNop”, and will be sent once again and compared to the file on computer B. Then the rsyncalgorithm will see that the file on Computer B is different compared to the file on Computer A. Then itwill update the file from computer A to computer B and it will end up with identical copy of the file onboth computers, which will prove that the rsync works.
34

Part II
Design and Implementation
35

Chapter 8Overview of design and implementation
In this chapter, the different components that needs to be designed will be described. As stated in chap-ter 5 on page 28, this project will be based on the RSerPool and it will aim to achieve high reliabilitywhich means that the RSerPool will be modified in a way that the built up system should be able tohandle high communication load in order to prevent future bottleneck occurrences. Also, scalability isanother goal of this system to ensure proper functionality as the amount of clients grows. The commu-nication protocols between PEs, PUs and PR will be modified up to an extend. Detailed description ofthose changes is presented in chapter 9.2 on page 43. The implementation and the testing of the systemwill focus on the establishment of a server bounce connection between two PUs through the same PE.
Since the user might be connected to the server at all time, but will most likely not use the PE’s servicesat all time, keep alive messages will be necessary in order to know if a user goes offline without loggingout from the PE. As the ASAP already includes these keep alive messages, this protocol will be usedfor the communication between PUs and PEs.
When PU1 wants to establish a server bounce connection with PU2, initially he has to register in thePR by sending a registration request if he is new to the system. In case he is already registered, he willsend just a login request. The PR will process the request through the database and assign a PE for thatPU. It will send a response to the PU telling him to which IP address and which port it has to connect toand the PU will then establish a connection to the PE. PU2 will do the exact same procedure and whenboth clients are connected to the same PE, a server bounce session can be triggered. When the serverbounce is over, if information have been changed on the PE, rsync algorithm will be triggered. Allthe information that has been changed on the PE will be backed up on two more PEs, in case the hostPE breaks down due to overload or possible hardware or software malfunction. An activity diagramdepicting the server bounce can be seen on figure 8.1 on the facing page.
36

CHAPTER 8. OVERVIEW OF DESIGN AND IMPLEMENTATION
Figure 8.1: Activity diagram
The main components that have to be designed are:
• The PR should be designed.
• PEs should be designed.
• The communication between PEs is not defined in the RSerPool. In order to define it, a commu-nication protocol should be designed and implemented in the system.
• Rsync algorithm for backing up data will be implemented.
• Dummy clients should be implemented in the system in order to generate some load on it.
All the components in the system will be tested. A technical analysis will be made to model the serverbounce in the network by measuring specific parameters:
• average service times
• average waiting times
• average queue length
37

Chapter 9Changes to RSerPool
This chapter presents the changes that are made to the RSerPool in order to better conform it to thedesired system. During the chapter, it will be discussed how to back up information on servers in theRSerPool, part of this being how to synchronize the backed up data. Furthermore changes to the ENRPand ASAP will be described.
9.1 Backup methods
To limit the possibility of data loss, all data on the PEs has to be backed up to multiple PEs. Theproposed solution for this will be discussed in this section.
Pools:As described in the preanalysis, all data cannot be backed up on all PEs. Therefore, two methods thatcould be used to backup one PE’s data on multiple PEs are presented:
Method 1: Pools of n PEs with complete mirror of each other. (Pools are formed by whom they tomirror)
Method 2: Each PE mirrors parts of other PEs. (Pools are formed by PUs data)
In the first method, PEs are simply grouped in pools where all PEs in a pool are complete mirrors ofeach others, meaning that each PE in a pool backup the exact same files. This is shown as method 1on figure 9.1 on the next page, where the file colors indicates which PU the file belong to. All files ofthe same color is the exact copy of each other, and all red files belongs to PU1, all blue files belongsto PU2, and all white files belongs to PE3. A pool is then formed to backup all data belonging to PU1,PU2, and PU3. If there had been a PU4, PU5, and PU6, a new pool consisting of three other PEs couldhave been created to backup their files.
The second method is also shown on figure 9.1 on the facing page as method 2. Each pool of PEs arenow formed according to where a PU’s data is stored. As it can be seen, PU1’s data is stored on PE1,PE2, and PE3. PU2 and PU3 also has their data stored on PE1, but instead of also have their data storedon the same PEs’ as PU1, they have been assigned two other PEs that fits them best. That could be
38
CHAPTER 9. CHANGES TO RSERPOOL
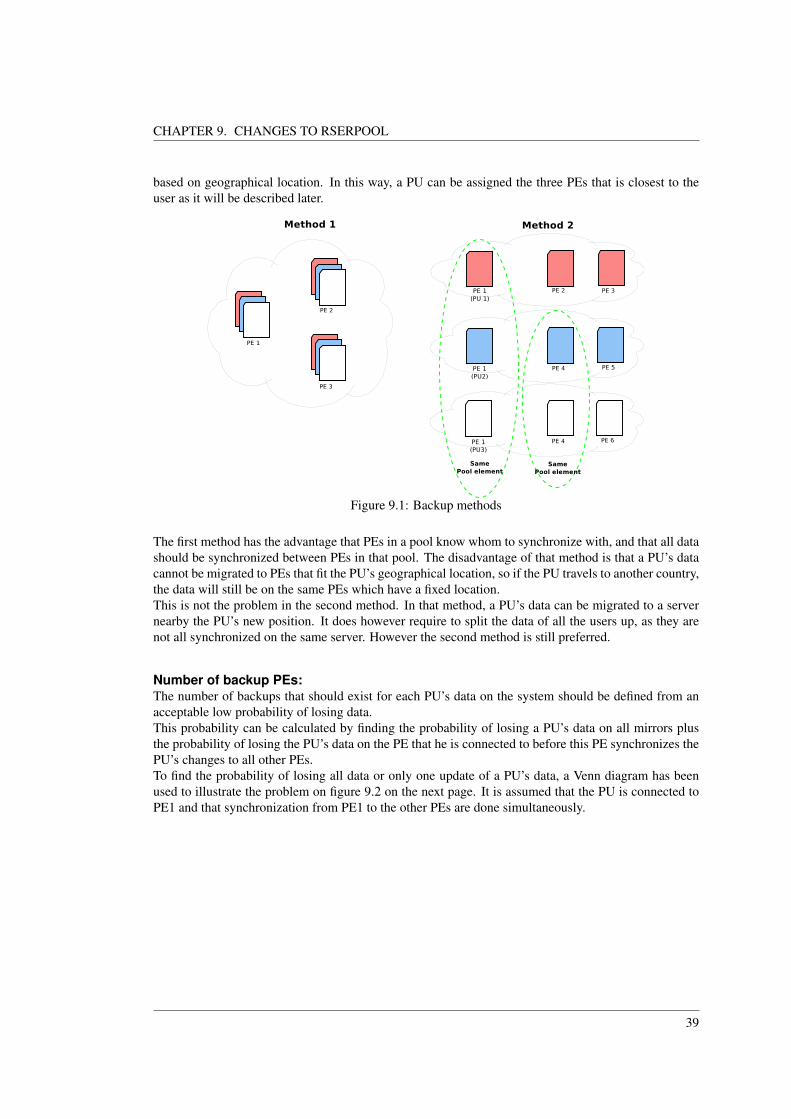
based on geographical location. In this way, a PU can be assigned the three PEs that is closest to theuser as it will be described later.
Figure 9.1: Backup methods
The first method has the advantage that PEs in a pool know whom to synchronize with, and that all datashould be synchronized between PEs in that pool. The disadvantage of that method is that a PU’s datacannot be migrated to PEs that fit the PU’s geographical location, so if the PU travels to another country,the data will still be on the same PEs which have a fixed location.This is not the problem in the second method. In that method, a PU’s data can be migrated to a servernearby the PU’s new position. It does however require to split the data of all the users up, as they arenot all synchronized on the same server. However the second method is still preferred.
Number of backup PEs:The number of backups that should exist for each PU’s data on the system should be defined from anacceptable low probability of losing data.This probability can be calculated by finding the probability of losing a PU’s data on all mirrors plusthe probability of losing the PU’s data on the PE that he is connected to before this PE synchronizes thePU’s changes to all other PEs.To find the probability of losing all data or only one update of a PU’s data, a Venn diagram has beenused to illustrate the problem on figure 9.2 on the next page. It is assumed that the PU is connected toPE1 and that synchronization from PE1 to the other PEs are done simultaneously.
39

CHAPTER 9. CHANGES TO RSERPOOL
Figure 9.2: A: Probability of losing data on PE 1 before it synchronize to PE 2 and PE 3, B: Probabilityof losing data on PE 1, C: Probability of losing data on PE 2, D: Probability of losing data on PE 3.
From the Venn diagram, the probability of losing all data will be the probability of all three PEs to losedata:
P [Losing all data] = BCD (9.1)
The probability of losing an update or all data can also be found from the Venn diagram. That is theprobability of either losing data on PE1 before it manage to synchronize or that all PEs lose data:
P [Losing data] = BCD +A−ABCD (9.2)
Clearly, the severity of losing all data that a PU has ever stored is much worse than losing only changesmade before synchronization occurs. Also, some of the data changes for each PU are not very critical,as it is only some policies which are stored on the PEs. Of course, losing everything is clearly muchworse because a client should not have to reenter every policy that he has ever created.That is why it should be nearly impossible to lose all data belonging to a PU, something that can beachieved by synchronizing this information to enough PEs. Therefore, it has been chosen to store aPU’s data on three extra PEs.A reduction in the number of such losses can be achieved by minimizing the synchronization intervals.Thus, synchronizations should be done rather fast after changes have been made. This will be describedbelow.
Backup interval:There are generally two approaches for doing the backup/synchronization of the user data.
Method 1: Scheduled backup/synchronization interval.
Method 2: Live backup/synchronization.
The first method defines a scheduled time interval between each backup/synchronization. This hasthe advantage of being able to use resources whenever they are available. It could be a fixed timefor example at night where less users are logged in the system, or it could be scheduled to be donewhenever some resources are available and paused when the PE load increases. The disadvantage isthat the probability of losing changes to the PU’s data grows and that more changes can be made andlost by a PU if synchronization intervals grow.Therefore the second method is preferred. Whenever changes are made, they should be synchronizedright away. This is unfortunately increasing the communication traffic between the PEs, but at least thesynchronization changes that have to be made will have much lower size compared to the ones that willbe made in case the first method is chosen.This leads to the question of which PEs should be chosen as the backup PEs of a PU’s data.
40

CHAPTER 9. CHANGES TO RSERPOOL
Choosing backup PEs:Choosing the PEs that a PU’s data should be mirrored to depends on the number of copies of the PU’sdata. These copies are made to three PEs. The backup/synchronization PEs should also be chosenaccording to each PU’s geographical location, in a way that a PU has his data stored as close to hisgeographical placement as possible, in order to obtain an acceptable QoS as described in section 3.2 onpage 16.
Two methods to obtain that goal with at least three backup/synchronization PEs are listed:
Method 1: Fixed number of backups.
Method 2: Variable number of backups.
The first method suggests that PUs data is stored on a fixed number of PEs. Consequently, if a PU’sdata should be migrated to a new PE, this data will have to be deleted on one of the PEs that already hasthe PU’s data.
The second method does not have a fixed amount of backups. When a PU is migrated to a new PE, thePU’s data should not be deleted from one of the other PEs. Instead, the PU’s data could be scheduledfor deletion after a week, month, or even a year of inactivity depending on the available resources.For each additional PE that stores a PU’s data, the availability and reliability of the data increases, butadditional backups also results in increasing the load on the system, due to the fact that changes madeto the PU’s data has to be synchronized to more PEs.Therefore, to make the second method viable, the extra cost from synchronization should not exceedthe resources being saved from having to perform less PUs migrations.This case applies more to the not so probable situation of a person traveling a lot between multiple geo-graphical destinations. In this specific scenario, it might be better to have this client’s data stored nearbythe locations that he visits regularly even though it might require more backups of his data than the fixedmethod. An algorithm could be implemented to minimize the cost of when and where to migrate a PU’sdata. The algorithm could even implement prediction of where clients are most likely to travel if theyare present in an airport so that their data could be migrated to the various PEs’ destination, before theyeven get there.
This algorithm is however not in the scope of this project, and instead a simpler proof of conceptstrategy will be used to decide when and to which PE a PU’s data should be migrated. The PU has hisdata stored on three PEs, which can all be used, but prioritized according to which is closest to the PUand how much the load is on every individual PE.
Figure 9.3 shows how PEs are chosen when a user in Aalborg registers for the first time. Figure 9.4shows what happens when the user travels to London, and finally figure 9.5 shows what happens whenthe user returns to Aalborg.
Figure 9.3: PE assignment whenregistering from Aalborg.
Figure 9.4: PE migrating whentraveling to London.
Figure 9.5: PE migrating whenuser returns to Aalborg.
41

CHAPTER 9. CHANGES TO RSERPOOL
The basic strategy that will be used in this project is to always have each PU’s data on the three closestPEs, one main PE and two backup PEs.On figure 9.3 on the preceding page when the PU registers in Aalborg, the three PEs picked to backuphis data will be the three closest to Aalborg. That ensures that the PU will always have good alternativesif the closest PE with his data is unavailable at one specific moment.When the PU travels to London on figure 9.4 on the previous page, he will have to use one of thePEs from the area around his previous position (Aalborg) until the two distant PEs (Aalborg) will havemigrated to PEs closer to the PU’s new position. The PU will most likely return to Aalborg, so a PEis left behind so that he can connect to that PE instantly when he returns to Aalborg on figure 9.5 onthe preceding page. Meanwhile, one of the PEs is again left on the PU’s previous position, in London,while the other is moved to the next closest PE available from Aalborg.
Synchronization propagation strategy:When changes are made to the PU’s data on a PE, the affected PE has to synchronize the changes to anyother PE that stores the particular PU’s data. How this synchronization propagates from the affected PEto the other PEs can be done in many different ways. Two methods are listed below:
Method 1: Transmit changes to other PEs in a sequence.
Method 2: Transmit changes to other PEs using a tree graph.
The first method is the simpler method which is illustrated on figure 9.6. Seven PEs are used to explainthe methods as only three PEs wouldn’t make much sense to explain these methods.Changes are made to a PU’s data on PE1 which then synchronizes the changes to the other PEs one byone, causing the last PE to wait for all the other PEs to be synchronized.
The second method, which is illustrated on figure 9.7, tries doing some of the synchronization processin parallel. Changes are made to a PU’s data on PE1 which immediately transmits the changes to PE2
and PE3. This is done in a sequence, but after PE1 has transmitted the changes to PE2, PE2 can starttransmitting the changes to PE4 as PE1 transmits the changes to PE3.
Figure 9.6: Method1. Figure 9.7: Method 2.
In method 2, figure 9.7, when PE1 is done transmitting to PE2 and PE3, PE3 still has to transmit thechanges to PE6 and PE7 while PE1 is remains idle. This is not a good solution, so a minor improvementof this tree can be seen on figure 9.8 on the facing page.
42

CHAPTER 9. CHANGES TO RSERPOOL
Figure 9.8: Method2 (extended).
Using the tree representation shown in figure 9.8, all PEs that have to transmit to other PEs seem to bedone at the same time stamp. There could even be added an additional PE to PE4 without adding anextra step to the steps shown for the seven PEs below:
Step 1: PE1 sync with PE2
Step 2: PE1 sync with PE3 while PE2 sync with PE4
Step 3: PE1 sync with PE5 while PE2 sync with PE6 and PE3 sync with PE7
In order to know which method to choose, a performance test should be run. This will not be done, thusa discussion of the two performance methods will be made instead.
In the first method where synchronization are done in a sequence, the synchronizations can be madesimultaneously assuming that the transmitter is on an multithreaded system. That can also be doneon the second method, but the PEs that are not directly connected to PE1 has to wait for the ”manin the middle” to synchronize before the synchronization can be started to the last PEs. The fact thatPEs are waiting for a synchronization to complete before they can receive the file will most likely takeway longer time then the first method. Therefore it has been chosen to use the first method as thesynchronization propagation strategy.
9.2 Changes to the ASAP
In an attempt to isolate the non-scalable parts of the RSerPool in the PR pool, some changes are made tothe ASAP. These changes are made so that the login of the PU is done on the PR, and thereby movingthe table that contains all registered PUs to the PRs. When the login of a PU should be done on thePR and the servicing of the PU should be done on the PE, some additional packets are required in theASAP. These packets are added to support basic user login, and to ensure that PEs are still able toreceive information about PU. The additional packets that the PR should be able to handle are:
• CREATE PU: Send by the PU to create itself on the PR
• LOGIN REQEST: Send by the PU to login.
• CHANGE PASSWORD: Send by the PU to change the password of the PU.
• PU RESPONSE: Send to the PU as response to received packets.
• DISCONNECT PU: Send by the PE when a PU has disconnected.
43

CHAPTER 9. CHANGES TO RSERPOOL
• REQUEST PE OF PU: Send by the PE to find a PU if another PU wants to communicate withthe first PU and they are not both connected to that PE.
• PE OF PU: Send to the PE as response to the REQUEST PE OF PU.
• PU JOINING: Send to the PE in order to inform it that a PU has logged in and is being referedto that PE.
• PU JOINING RESPONSE: Send by the PE as an acknowledgement that the PU did infactconnect.
• PU MIGRATION: Send by the PE if it has migrated a PU to another PE.
Like the original ASAP packets, these packets will also contain a header with a 8bit type field, a 8bitflags field, and a 16bit length field. They will adhere to the same parameter definitions as the originalASAP, with the addition of the USER_IDENTIFIER parameter which have been added to identifyPUs. The flag parameter, R, is set to either 0 or 1 indicating that a request is either accepted or rejected.The second flag parameter, T, is used to specify which packet the PU RESPONSE is responding to.The definitions of the packets and the parameter can be found in appendix D on page 101.
9.3 Changes to the ENRP
When using the existing RSerPool, if a PR fails, another PR should detect it and take over the failedPR PEs. This means that if the two PRs are more than 50% loaded(assuming same capacity), when onetakes over the other, this will become over loaded. To ensure that this does not happen, two additionalpackets are appended to the ENRP, a packet for requesting another PR to take over a PU, and a packetfor requesting to take over a PU from another PR. The packets added to the ENRP are:
• REQUEST PE: Send to request to takeover a PE if a PR is experiencing lower load then the restof the PR pool.
• REQUEST TAKE PE: Send to request a PR to take over a PE if the PR is experiencing higerload then the rest of the PR pool.
• PE TAKEOVER RESPONSE: Send as a response to the REQUEST PE and the REQUESTTAKE PE packets.
The packets will like the existing ENRP packets contain a 8bit type field, 8bit flag field, 16bit lengthfield, 32bit sending server ID field, and 32bit receiving server ID. The flag parameter, R, will like in theASAP signal if the request is accepted or rejected. The definitions of the added ENRP packets can befound in appendix E on page 104.
44
Chapter 10Server setup
In this chapter, the general server setup, which should be implemented on the PR and PEs, will bediscussed and designed. The purpose is to discuss the different methods of handling multiple concurrentclients and choosing a method from those available at the time.Some of the methods generally used to service concurrent clients are listed below:
• Polling
• Event loop
• Process per client
• Thread per client
Discussing them from top to bottom, Polling is the first method, which is most likely also the worstmethod. It simply keeps checking if something has happend on every socket again and again in anendless loop, wasting processing time and not fully exploiting I/O parallelism of the hardware[12].
As an improved version of the Polling method, an event loop like the Select-, poll-, epoll-system callcan be used[12]. When called, they are put into sleep until an event happens on one of the socketsmonitored, causing them to return. The Select- and poll-system call return all sockets monitored, givingthem O(N) complexity, whereas the epoll returns only the sockets that have actually changed, givingit a complexity of only O(1), thus rendering it as the best solution. That said, epoll’s O(1) has to beinterpreted right, because epoll returns every socket that has changed since last check[13]. That is, thenotation should rather be O(n) where n is the number of sockets changed, so in case n → N , the im-plementation of the different event loops start to be of significance in order to determine the best eventloop to use in a given implementation.A catch when using event loops is the fact that users are serviced in a single thread. That can be a pro-blem in siturations where heavy operations, file access, database access or other time consuming tasksblock all other clients.
The third and fourth methods are much alike because of the fact that processes and threads are gen-erally the same. Those methods create a process or thread for each client and service each client withinits scope. The main difference between the two is generally that processes are considered heavier thanthreads and are thereby not considered to be as good a solution as threads when having many instances
45

CHAPTER 10. SERVER SETUP
running at the same time, because threads are lighter and generally are created, destroyed and contextswitched faster. Creating a thread for each client offers a good concurrent enviroment because of thepreemptive scheduling that service clients by turn and even change to the next thread in case of a holdto access a file or something else.Unfortunately, using a preemptive scheduler for threads introduces context switches which results inoverhead and limits the number of theads that a system can run.Another overhead on using thread arises when creating and destroying threads. Fortunately, that over-head can be limited by creating a threadpool which simply creates a pool of worker threads which canbe woken whenever a threaded task is needed. Also, destroying threads in a threadpool only has tohappen once on termination, leaving only the context switches as a scalability issue.
So, choosing from the four methods: The Polling method was unpreferable, and the Processes perclient was out performed by threads which are basically lighter processes.The chooice is therefore between the event loop and one thread per client. The one thread per clientsuffers from not being scalable from the fact that there can be only a limited amount of threds runningsimultaneously, whereas the epoll event loop is very scaleable as it has O(1) complexity, only sufferingfrom the fact that epoll might not be the best event loop in cases where n → N and that tasks arehandled in a single thread. This can however be solved by combining epoll with a threadpool makingepoll monitor changes and schedule the actual tasks to a threadpool. Nevertheless, this is very contextdependent.If the service only consists of fast tasks done on the CPU threads might not even be needed, but inthis project where slower tasks like database access, file access, rsync synchronization are performed, athreadpool is most likely preferred in many cases.Therefore the best solution would in some cases be a single threaded event loop. In other cases it mightbe an event loop distributing tasks to a threadpool, and in other cases a thread per client using threadpoolto prevent create and destroy overhead.From the fact that methods are very context dependent, and the PR and PEs have many different tasks,it has been chosen to use the one thread per client threadpool to make a proof of concept RSerPool im-plementation, well knowing that different solutions should be applied to different task. One thread perclient threadpool seems to be an implementation method that is maybe not scaleable enough for a realimplementation, but is at least fitting everywhere and performing well up to some amount of concurrentclients.
10.1 Threadpool
In this section a threadpool will both be designed and implemented, as it should be used both on the PRand PEs. It should be designed in such a way that any kind of task can be executed by the threadpool.For example, a task could be to to service a client, and another task could be to run the rsync algorithmwhich can be a time consuming algorithm to run on bigger files. This could be implemented by havinga pool of threads executing runnable tasks. A runable task is an object that has implemented a runfunction that is called whenever a thread executes the task. An overview of how the treadpool couldwork can be seen on figure 10.1 on the facing page.
46

CHAPTER 10. SERVER SETUP
Figure 10.1: Threadpool.
Such a runnable task will be defined as in the struct on listing 10.1.
1 s t r u c t Runnable {2 void (∗ run ) ( void ∗ ) ; /* Function pointer to the function that should be run */3 void∗ params ; /* Parameters send to the run function */4 } ;
Kode 10.1: Runnable
Receiving a new client connection is given as an example. A runnable task could be created by settingthe run pointer in the runnable struct to point to the function which should handle clients and set theparams of the runnable to point to the socket that was created to the client. In that way, when the task isexecuted by a thread, the function which run points to will be executed, with the socket as a parameterto the function.
47

Chapter 11Implementation of the modifiedRSerPool
In this chapter, the whole communication scheme that has been implemented is presented:
• PUs to PR communication
• PEs to PR communication
• PEs to PUs communication
• server bounce
• rsync protocol
• database handling
Flowcharts and activity diagrams are presented to give a clear view of the designed/modified protocolsas well as how the communication between the basic components of the RSerPool is handled.
11.1 Registrar implementation
In this section, the design and implementation of the PR will be presented. The PR contains five parts,the communication with the PUs, the communication with the PEs, the communication with other PRs,the communication with the database and the initialization.
The initialization part is responsible for
• Joining the PR pool.
• Getting a complete handle resolution from existing PRs.
• Migrating PEs to itself to balance the load of the PR pool
48

CHAPTER 11. IMPLEMENTATION OF THE MODIFIED RSERPOOL
When the PR is updated and has joined the PR pool, a threadpool is started for the communication withthe PUs and another threadpool is started for the communication with the PEs.
Due to time limitations, the communication between PRs was not integrated with the rest of the software,which means that the implemented RSerPool is only able to have a single PR in the RSerPool. Thismeans that the initialization part will simply consist of starting the two threadpools to communicatewith PEs and PUs.
11.1.1 Handling of PUs
The communication with the PUs, will consist of several packet transactions. These transactions areshown in figure 11.1.
Figure 11.1: Activity diagram showing the communication that the thread for receiving packets fromthe PUs should support.
The implementation of these three functions is illustrated on figure 11.2 on the next page.
Before the communication with the PU starts, the PU has been queued within the threadpool until athread has been assigned the job of doing the actual communication with the PU. When assigned, thethread waits for the PU to send a packet. It will then handle that packet and start waiting for the nextpacket to arrive. This will continue until the PU closes the connection.
49

CHAPTER 11. IMPLEMENTATION OF THE MODIFIED RSERPOOL
Figure 11.2: Flowchart showing the implementation of the PRs communication with the PUs.
50

CHAPTER 11. IMPLEMENTATION OF THE MODIFIED RSERPOOL
As the PR to PR communication was not integrated into the system, as will be described later, thetriggers for PR synchronization is not implemented.
If the packet received is a ”create user” packet, the PR checks if the username is available. If this isthe case, it decides in which PEs the PU’s data should be stored on. This decision is based on the PU’slocation, so that the three PEs that should store the data, is the three PEs closest to the PU. This meansthat if one PE goes offline, the backup PE which the PU is redirected to will still be the PE that providesthe best QoS. When the PEs are assigned to a PU, it is created in the database. Then a reply is sent tothe PU. This reply can either be that the PU is accepted or rejected depending on whether the usernameis taken or not.
If the PU sends a ”change password” packet, the PU is verified with the username and password. If thePU is verified, the password is changed and a reply is sent.
If the PU sends a login packet, the PU is verified. If the password is correct, the PE closest to the PU’slocation that contains the PU’s data is found. If this PE is online and is not overloaded, the PU is referredto that PE.
11.1.2 Handling of PEs
The communication with the PEs is initiated in the same manner as the communication with the PUs,where the connections are managed by the threadpool. When the receive packet thread is started, itshould be able to handle the packet transactions shown in figure 11.3 on the following page. When apacket is received from a PE, it is decoded and handled according to the flowchart shown on figure 11.4on page 53. The triggers for synchronization with other PRs, is again not implemented.
If a registration packet is received from a PE, it is referred to the least loaded PR to ensure load balancingamong the PRs. If the load of the least loaded PR is within 5% of the load of the PR receiving the packet,the PR will however choose itself to handle the PE. This is done in case a PR does not have the newestdata from the PR pool.
11.1.3 Database handling
This section will describe how the database is structured, how one connects to it, and how changes aremade in it. The database used is a PostgreSQL database, and the commands for interacting with it arethe basic SQL commands. The database is used by the PRs to save information regarding PUs.
The database has been structured with a table for each PR which contains the information needed tomake decisions regarding the PUs. This table contains the following information:
• User ID.
• Username.
• Password.
• Current PE.
• Backup PE1.
• Backup PE2.
• Backup PE3.
51
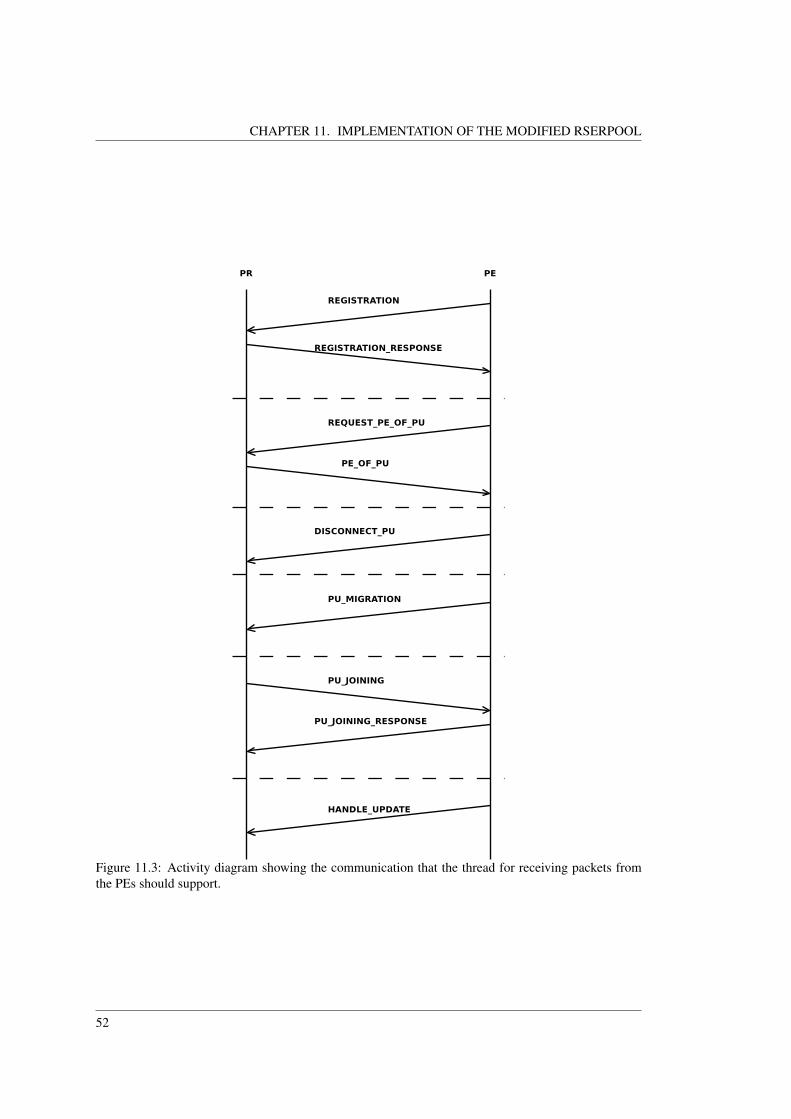
CHAPTER 11. IMPLEMENTATION OF THE MODIFIED RSERPOOL
Figure 11.3: Activity diagram showing the communication that the thread for receiving packets fromthe PEs should support.
52

CHAPTER 11. IMPLEMENTATION OF THE MODIFIED RSERPOOL
Figure 11.4: Flowchart illustrating the implementation of the communication with PEs.
53

CHAPTER 11. IMPLEMENTATION OF THE MODIFIED RSERPOOL
• location x-value.
• location y-value.
• location z-value.
Functions have been made to change the password, current PE, the backup PEs and the location. A userID is assigned when the PU first logs into the system, and the username is specified by the PU, and nei-ther can be changed after this. A function has been made where the username is supplied, and all otherinformation is returned, and another function where the user ID is supplied, and all other information isreturned.When wishing to use the database a connection must first be established. This is done using thePQconnectdb function which requires the hostname, database name, username and password asinput to establish the connection. This function returns a connection parameter defined in the Post-gresql documentation, which must be used for other database functions which wishes to manipulate thedatabase. In order to change the data in a table on the database or read from it, the PQexec function isused, which executes an SQL command. When reading data the command SELECT is used, and whenchanging data the command UPDATE is used. However, before either of these commands can be usedthe tables of the database must be set up. As mentioned earlier each PR has its own table it uses, and it isnamed accordingly in the format reg”regID” where ”regID” refers to the unique ID of the PR. To makethe table, the SQL function CREATE TABLE is used and the different rows are defined with defeaultvalues.
11.2 Pool element
This section will describe the communication between the PEs and PUs, and the server bounce com-munication between two PUs. The communication between a PE and a PU can be seen on the activitydiagram on figure 11.5 on the facing page. Most of the communication will be implemented from aprotocol designed by ourselves. However, the initialization of the PE to PU connection will be definedfrom the SCTP. As can be seen on the activity diagram, it will always be the PU initiating connectionand the PE will only react, not act. The init packet is the first part of the 4 way SCTP handshake, andit is followed by an acknowledgement of the init packet by the PE. The cookie-echo and cookie-ackare the last parts of the handshake. The cookie is used by the PE to make a transmission control block,which will contain all the information needed by the PE to maintain the connection to the PU.
54

CHAPTER 11. IMPLEMENTATION OF THE MODIFIED RSERPOOL
Figure 11.5: PE to PU activity diagram
For this communication to work, some packet types will need to be defined. As can be seen both aregistration and a deregistration packet is needed by the PU once the communication is established.It must also have a bounce request and a bounce responce, used when the PU wishes to initiate aconnection to another PU through the server. The PE will need to have a registration responce, and aderegistration responce packet defined. It will also need a bounce forward request packet and a bounceforward responce.
Figure 11.6: PU to PE packets
The packets defined in the protocol can be seen on figure 11.6. The registration only needs the ID ofthe PU as data and the deregistration needs no data. When requesting a server bounce session, the PEwill need the ID of the PU it is wished to communicate with. It will then generate a random bounce IDwhich will make sure the PE is associated with the communication channel.
55

CHAPTER 11. IMPLEMENTATION OF THE MODIFIED RSERPOOL
Figure 11.7: Bounce activity diagram
The activity diagram on figure 11.7 illustrates the packets sent between PE and PU. It is initiated by aTCP handshake, as the entire server bounce session is running on the TCP protocol. Each PU will senda bounce identification to the PE and when it has received both of them, it will send a packet to let thePUs know they can start sending data. Once this packet is sent, the PE’s only task is to forward datapackets sent between the PUs. The server bounce session is closed with the standard way of closing aTCP connection. The packets for this can be seen on figure 11.8 on the next page.
56

CHAPTER 11. IMPLEMENTATION OF THE MODIFIED RSERPOOL
Figure 11.8: Bounce packets
This protocol is not an optimal protocol, as some of the parameters in it are not used by the PE and PU,but they are still there in case they are needed in a future extension of the current implementation.
11.2.1 PE flow
Now that the protocol for the communication between PU and PE is defined, flowcharts of how thePE should work can be designed. All gray boxes indicate that the part has either not been designed orimplemented. First of all, a PE can be split into three modules:
• A module communicating with other PEs.
• A module communicating with PUs.
• A module for server bouncing.
That can be seen on figure 11.9 on the following page. Each module can then listen for incommingconnections from respectively PEs, PU communication and PU server bounces. When a new connectionis received, a runnable task, as described in section 10.1 on page 46, can be created and scheduled withina threadpool.
57
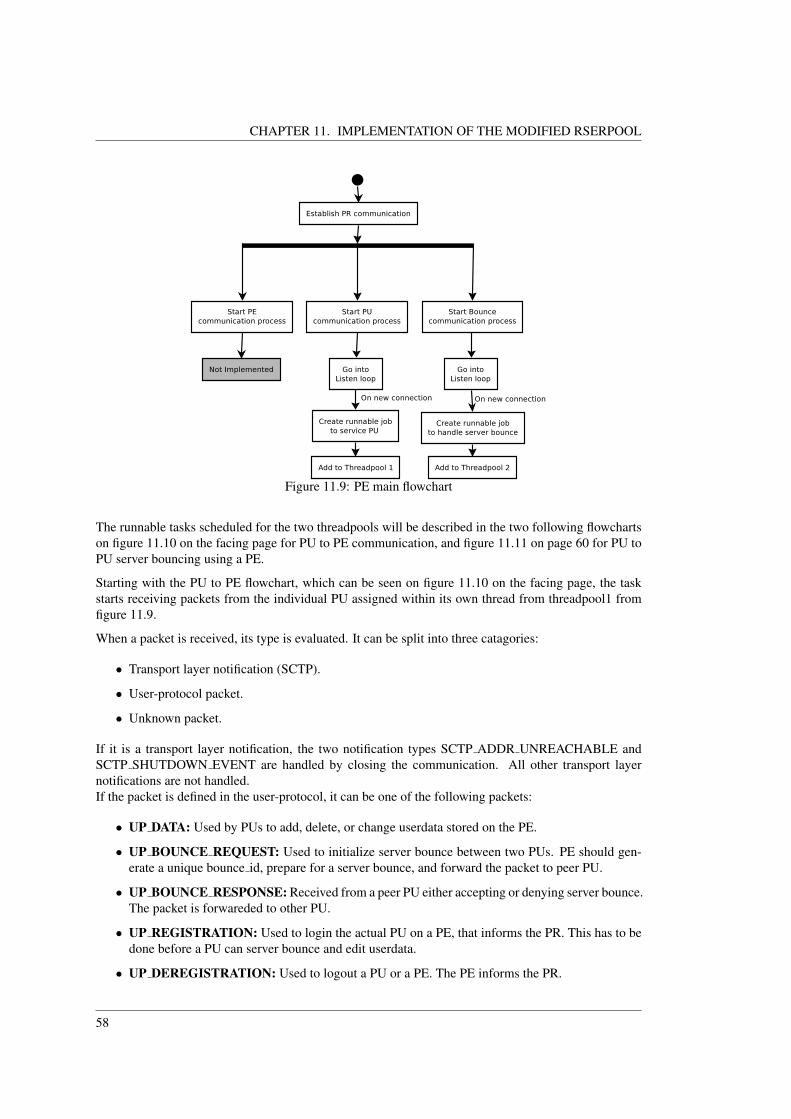
CHAPTER 11. IMPLEMENTATION OF THE MODIFIED RSERPOOL
Figure 11.9: PE main flowchart
The runnable tasks scheduled for the two threadpools will be described in the two following flowchartson figure 11.10 on the facing page for PU to PE communication, and figure 11.11 on page 60 for PU toPU server bouncing using a PE.
Starting with the PU to PE flowchart, which can be seen on figure 11.10 on the facing page, the taskstarts receiving packets from the individual PU assigned within its own thread from threadpool1 fromfigure 11.9.
When a packet is received, its type is evaluated. It can be split into three catagories:
• Transport layer notification (SCTP).
• User-protocol packet.
• Unknown packet.
If it is a transport layer notification, the two notification types SCTP ADDR UNREACHABLE andSCTP SHUTDOWN EVENT are handled by closing the communication. All other transport layernotifications are not handled.If the packet is defined in the user-protocol, it can be one of the following packets:
• UP DATA: Used by PUs to add, delete, or change userdata stored on the PE.
• UP BOUNCE REQUEST: Used to initialize server bounce between two PUs. PE should gen-erate a unique bounce id, prepare for a server bounce, and forward the packet to peer PU.
• UP BOUNCE RESPONSE: Received from a peer PU either accepting or denying server bounce.The packet is forwareded to other PU.
• UP REGISTRATION: Used to login the actual PU on a PE, that informs the PR. This has to bedone before a PU can server bounce and edit userdata.
• UP DEREGISTRATION: Used to logout a PU or a PE. The PE informs the PR.
58

CHAPTER 11. IMPLEMENTATION OF THE MODIFIED RSERPOOL
Figure 11.10: PU to PE flowchart
59

CHAPTER 11. IMPLEMENTATION OF THE MODIFIED RSERPOOL
The second runnable task, which is handling a bouncing PU, can be seen on figure 11.11. It expects aUP BOUNCE IDENTIFICATION packet that should match a bounce association already prepared onthe PE with the following informations:
• bounce id
• user id
• peer id
The connection is terminated if all information is not valid. If the information is correct, the connec-tion is marked as ready in case the peer is not identified. If the peer has been already identified, aUP BOUNCE STATUS is send to inform both PUs that their association is ready to communicate on.The PE is then going into a loop receiving packets and forwarding them between PUs until a PU termi-nates the connection.
Figure 11.11: PE bounce flowchart
Having designed the PE it is ready for implementation and integration in the system. It will be testedtogether with the rest of the software in the acceptance test in chapter 12 on page 63.
11.3 Rsync
In order to synchronize data between PEs, a synchronization mechanism will be created. It has beenchosen to use the rsync method as described in section 4.2 on page 20 for the purpose.In order to get it better integrated into RSerPool, it has been chosen to design and implement a basicproof of concept version of rsync. In that way, a protocol for exchanging data between two PEs canbe made to fit the rest of the software that will be created in this project. For simplicity, the hash tablethat the original rsync implementation uses on computer A to search for matching Adler-32 checksumsreceived from the outdated file on computer B will not be implemented. Instead, a simpler linear search
60
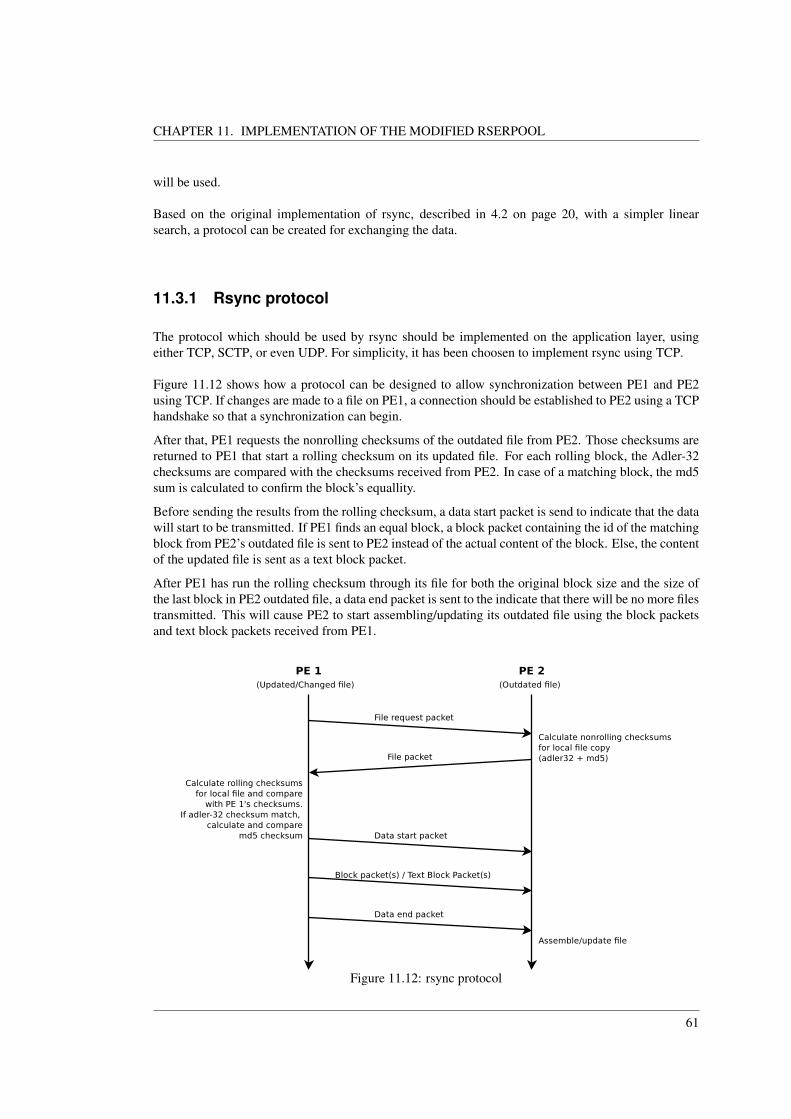
CHAPTER 11. IMPLEMENTATION OF THE MODIFIED RSERPOOL
will be used.
Based on the original implementation of rsync, described in 4.2 on page 20, with a simpler linearsearch, a protocol can be created for exchanging the data.
11.3.1 Rsync protocol
The protocol which should be used by rsync should be implemented on the application layer, usingeither TCP, SCTP, or even UDP. For simplicity, it has been choosen to implement rsync using TCP.
Figure 11.12 shows how a protocol can be designed to allow synchronization between PE1 and PE2using TCP. If changes are made to a file on PE1, a connection should be established to PE2 using a TCPhandshake so that a synchronization can begin.
After that, PE1 requests the nonrolling checksums of the outdated file from PE2. Those checksums arereturned to PE1 that start a rolling checksum on its updated file. For each rolling block, the Adler-32checksums are compared with the checksums received from PE2. In case of a matching block, the md5sum is calculated to confirm the block’s equallity.
Before sending the results from the rolling checksum, a data start packet is send to indicate that the datawill start to be transmitted. If PE1 finds an equal block, a block packet containing the id of the matchingblock from PE2’s outdated file is sent to PE2 instead of the actual content of the block. Else, the contentof the updated file is sent as a text block packet.
After PE1 has run the rolling checksum through its file for both the original block size and the size ofthe last block in PE2 outdated file, a data end packet is sent to the indicate that there will be no more filestransmitted. This will cause PE2 to start assembling/updating its outdated file using the block packetsand text block packets received from PE1.
Figure 11.12: rsync protocol
61

CHAPTER 11. IMPLEMENTATION OF THE MODIFIED RSERPOOL
Figure 11.13 shows the packets sent in the activity diagram on figure 11.12 on the preceding page. Thepackets are listed under the actual PE sending the packets and added from top to bottom in the orderthat they are transmitted during a synchronization.
Figure 11.13: rsync packets
On figure 11.13, the rsync file request pkt contains the rsync header which consists of a packet type,some flags which will not be used for this rsync implementation and at last the length of the actualpacket. As data, a filename can be written to the packet. This filename can be of any length if only thelength in the header is updated accordingly.
The rsync block pkt and rsync text block pkt also have the same header as all the other packets. Addi-tionally, they contain a position of where the data block starts in the updated file on PE1. This positionis only necessary when using a transport protocol that does guarantee that packets are received in theright sequence.Also, the rsync block pkt contains the id of the matching block and rsync text block pkt contains acharacter array.
On PE2, only a single packet is sent during the file exchange. That is, the packet containing infor-mation of the outdated file. For example, it contains the block size used on the file. It contains the filesize which is used with the block size to calculate in how many blocks PE2’s file was split into whencalculating checksums. This number will tell how many checksums are in the packet.
62

Chapter 12Acceptance test
Two measurement journals have been made for the test of the software. The test for the rsync can beseen in appendix B on page 94, and the test for the rest of the software can be seen in appendix A onpage 91. This acceptance test will be split into two parts, one for the server system, and one for thersync.
12.1 Modified RSerPool test
Two tests were made for this part, one where most of the system is tested, and one where the ability tochange password is tested. The first test has the following steps:
• Start a PR.
• Register 4 PEs.
• Create 2 PUs.
• Login the 2 PUs.
• Start a serverbounce session.
• Stop the serverbounce session.
• Terminate the PE the PUs are connected to.
• Disconnect PUs.
Start of PR and registration of PEs: When the PEs register on the PR, it will be expected to receive aASAP registration packet (type 1), containing the location of the PE and the IP.The PR will respond with a ASAP registration respomce packet (type 3).
The following ASAP packets arrived at the PR:
63
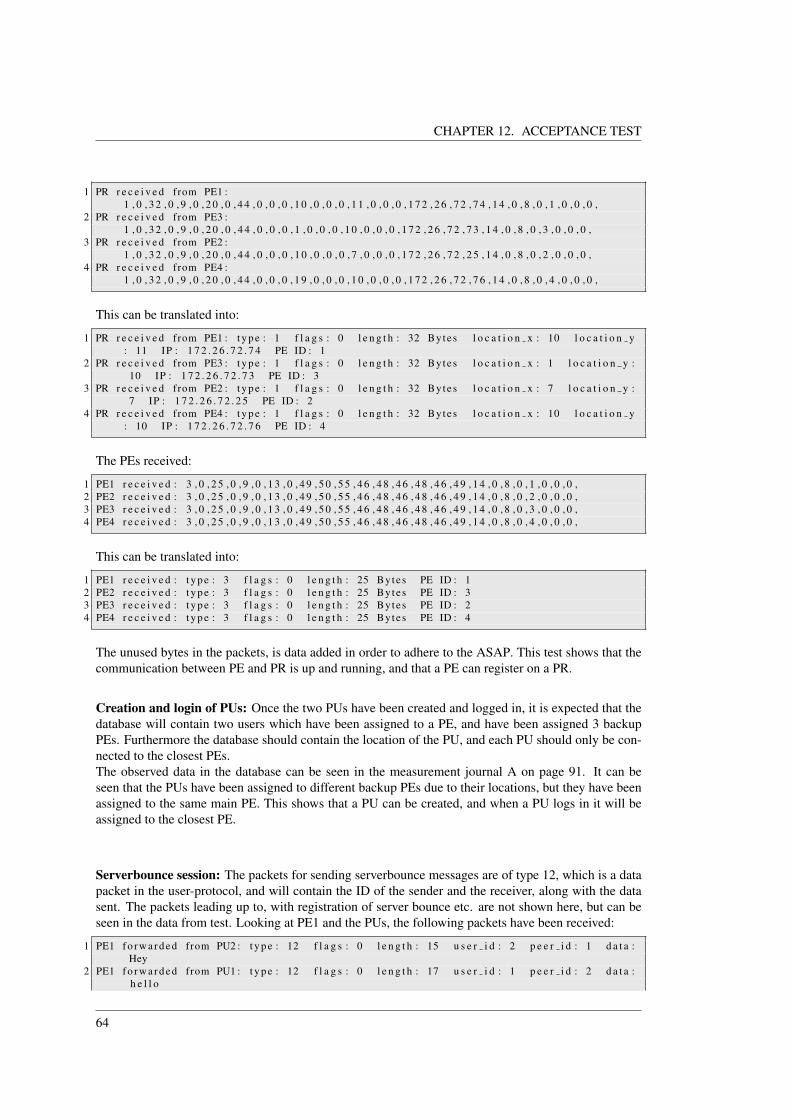
CHAPTER 12. ACCEPTANCE TEST
1 PR r e c e i v e d from PE1 :1 , 0 , 3 2 , 0 , 9 , 0 , 2 0 , 0 , 4 4 , 0 , 0 , 0 , 1 0 , 0 , 0 , 0 , 1 1 , 0 , 0 , 0 , 1 7 2 , 2 6 , 7 2 , 7 4 , 1 4 , 0 , 8 , 0 , 1 , 0 , 0 , 0 ,
2 PR r e c e i v e d from PE3 :1 , 0 , 3 2 , 0 , 9 , 0 , 2 0 , 0 , 4 4 , 0 , 0 , 0 , 1 , 0 , 0 , 0 , 1 0 , 0 , 0 , 0 , 1 7 2 , 2 6 , 7 2 , 7 3 , 1 4 , 0 , 8 , 0 , 3 , 0 , 0 , 0 ,
3 PR r e c e i v e d from PE2 :1 , 0 , 3 2 , 0 , 9 , 0 , 2 0 , 0 , 4 4 , 0 , 0 , 0 , 1 0 , 0 , 0 , 0 , 7 , 0 , 0 , 0 , 1 7 2 , 2 6 , 7 2 , 2 5 , 1 4 , 0 , 8 , 0 , 2 , 0 , 0 , 0 ,
4 PR r e c e i v e d from PE4 :1 , 0 , 3 2 , 0 , 9 , 0 , 2 0 , 0 , 4 4 , 0 , 0 , 0 , 1 9 , 0 , 0 , 0 , 1 0 , 0 , 0 , 0 , 1 7 2 , 2 6 , 7 2 , 7 6 , 1 4 , 0 , 8 , 0 , 4 , 0 , 0 , 0 ,
This can be translated into:
1 PR r e c e i v e d from PE1 : t y p e : 1 f l a g s : 0 l e n g t h : 32 Bytes l o c a t i o n x : 10 l o c a t i o n y: 11 IP : 1 7 2 . 2 6 . 7 2 . 7 4 PE ID : 1
2 PR r e c e i v e d from PE3 : t y p e : 1 f l a g s : 0 l e n g t h : 32 Bytes l o c a t i o n x : 1 l o c a t i o n y :10 IP : 1 7 2 . 2 6 . 7 2 . 7 3 PE ID : 3
3 PR r e c e i v e d from PE2 : t y p e : 1 f l a g s : 0 l e n g t h : 32 Bytes l o c a t i o n x : 7 l o c a t i o n y :7 IP : 1 7 2 . 2 6 . 7 2 . 2 5 PE ID : 2
4 PR r e c e i v e d from PE4 : t y p e : 1 f l a g s : 0 l e n g t h : 32 Bytes l o c a t i o n x : 10 l o c a t i o n y: 10 IP : 1 7 2 . 2 6 . 7 2 . 7 6 PE ID : 4
The PEs received:
1 PE1 r e c e i v e d : 3 , 0 , 2 5 , 0 , 9 , 0 , 1 3 , 0 , 4 9 , 5 0 , 5 5 , 4 6 , 4 8 , 4 6 , 4 8 , 4 6 , 4 9 , 1 4 , 0 , 8 , 0 , 1 , 0 , 0 , 0 ,2 PE2 r e c e i v e d : 3 , 0 , 2 5 , 0 , 9 , 0 , 1 3 , 0 , 4 9 , 5 0 , 5 5 , 4 6 , 4 8 , 4 6 , 4 8 , 4 6 , 4 9 , 1 4 , 0 , 8 , 0 , 2 , 0 , 0 , 0 ,3 PE3 r e c e i v e d : 3 , 0 , 2 5 , 0 , 9 , 0 , 1 3 , 0 , 4 9 , 5 0 , 5 5 , 4 6 , 4 8 , 4 6 , 4 8 , 4 6 , 4 9 , 1 4 , 0 , 8 , 0 , 3 , 0 , 0 , 0 ,4 PE4 r e c e i v e d : 3 , 0 , 2 5 , 0 , 9 , 0 , 1 3 , 0 , 4 9 , 5 0 , 5 5 , 4 6 , 4 8 , 4 6 , 4 8 , 4 6 , 4 9 , 1 4 , 0 , 8 , 0 , 4 , 0 , 0 , 0 ,
This can be translated into:
1 PE1 r e c e i v e d : t y p e : 3 f l a g s : 0 l e n g t h : 25 Bytes PE ID : 12 PE2 r e c e i v e d : t y p e : 3 f l a g s : 0 l e n g t h : 25 Bytes PE ID : 33 PE3 r e c e i v e d : t y p e : 3 f l a g s : 0 l e n g t h : 25 Bytes PE ID : 24 PE4 r e c e i v e d : t y p e : 3 f l a g s : 0 l e n g t h : 25 Bytes PE ID : 4
The unused bytes in the packets, is data added in order to adhere to the ASAP. This test shows that thecommunication between PE and PR is up and running, and that a PE can register on a PR.
Creation and login of PUs: Once the two PUs have been created and logged in, it is expected that thedatabase will contain two users which have been assigned to a PE, and have been assigned 3 backupPEs. Furthermore the database should contain the location of the PU, and each PU should only be con-nected to the closest PEs.The observed data in the database can be seen in the measurement journal A on page 91. It can beseen that the PUs have been assigned to different backup PEs due to their locations, but they have beenassigned to the same main PE. This shows that a PU can be created, and when a PU logs in it will beassigned to the closest PE.
Serverbounce session: The packets for sending serverbounce messages are of type 12, which is a datapacket in the user-protocol, and will contain the ID of the sender and the receiver, along with the datasent. The packets leading up to, with registration of server bounce etc. are not shown here, but can beseen in the data from test. Looking at PE1 and the PUs, the following packets have been received:
1 PE1 f o r w a r d e d from PU2 : t y p e : 12 f l a g s : 0 l e n g t h : 15 u s e r i d : 2 p e e r i d : 1 d a t a :Hey
2 PE1 f o r w a r d e d from PU1 : t y p e : 12 f l a g s : 0 l e n g t h : 17 u s e r i d : 1 p e e r i d : 2 d a t a :h e l l o
64

CHAPTER 12. ACCEPTANCE TEST
34 PU1 r e c e i v e d : t y p e : 12 f l a g s : 0 l e n g t h : 15 u s e r i d : 1 p e e r i d : 2 d a t a : Hey5 PU2 r e c e i v e d : t y p e : 12 f l a g s : 0 l e n g t h : 17 u s e r i d : 2 p e e r i d : 1 d a t a : h e l l o
This shows that a serverbounce session have been set up, and that it is possible to send data via server-bouncing. The PE was terminated after the sending of these two packets, thus stopping the serverbouncesession.
Termination of PE1: When a PE is terminated, the PUs on it will automatically connect to a PR andbe assigned a new PE as soon as they discover the old one is no longer responding. This means that onthe PR a user login packet is expected, which is a packet of type 26 containing location, username andpassword. The PR will then respond with a login responce message (type 27) detailing which PE IP thePU should connects to. The PE will then receive a registration packet (type 1) containing user ID. ThePR receives the following packets from the PU:
1 PR r e c e i v e from PU1 :2 6 , 0 , 2 8 , 0 , 9 , 0 , 1 6 , 0 , 9 , 0 , 0 , 0 , 1 0 , 0 , 0 , 0 , 1 0 9 , 1 0 1 , 1 0 1 , 0 , 9 , 0 , 8 , 0 , 1 0 9 , 1 0 1 , 0 , 0 ,
2 PR r e c e i v e from PU2 :2 6 , 0 , 2 8 , 0 , 9 , 0 , 1 6 , 0 , 1 1 , 0 , 0 , 0 , 1 0 , 0 , 0 , 0 , 1 1 7 , 5 0 , 0 , 4 9 , 9 , 0 , 8 , 0 , 4 9 , 5 0 , 0 , 0 ,
which can be translated into:
1 PR r e c e i v e from PU1 : t y p e : 26 f l a g s : 0 l e n g t h : 28 username : mee pw : me2 PR r e c e i v e from PU2 : t y p e : 26 f l a g s : 0 l e n g t h : 28 username : u2 pw : 12
The PR sends the following packets from the PU:
1 PR s e n d s t o PU1 : 2 7 , 0 , 1 2 , 0 , 1 , 0 , 8 , 0 , 1 7 2 , 2 6 , 7 2 , 2 5 ,2 PR s e n d s t o PU2 : 2 7 , 0 , 1 2 , 0 , 1 , 0 , 8 , 0 , 1 7 2 , 2 6 , 7 2 , 2 5 ,
Which can be translated into:
1 PR s e n d s t o PU1 : t y p e : 27 f l a g s : 0 l e n g t h : 12 PE IP : 1 7 2 . 2 6 . 7 2 . 2 52 PR s e n d s t o PU2 : t y p e : 27 f l a g s : 0 l e n g t h : 12 PE IP : 1 7 2 . 2 6 . 7 2 . 2 5
The PE receives the following packets from the PU:
1 PE2 r e c e i v e d from PU1 : t y p e : 1 f l a g s : 0 l e n g t h : 8 u s e r i d : 12 PE2 r e c e i v e d from PU2 : t y p e : 1 f l a g s : 0 l e n g t h : 8 u s e r i d : 2
This shows that the when a PE is terminated the PUs will reconnect to the PR and receive a new PE toconnect to.
Disconnecting the two PUs: When disconnecting from a PE a PU will send a deregistration packet(type 2), containing the ID of the PU. The PE will then send a packet to the PR to let it know a user isdisconnected. This is a packet of type 23, called a disconnect user packet. The following packets arereceived by PE2 and PR.
1 PE2 r e c e i v e d from PU1 : t y p e : 2 f l a g s : 0 l e n g t h : 8 u s e r i d : 12 PE2 r e c e i v e d from PU1 : t y p e : 2 f l a g s : 0 l e n g t h : 8 u s e r i d : 234 PR r e c e i v e d from PE2 : 2 3 , 0 , 1 2 , 0 , 1 6 , 0 , 8 , 0 , 1 , 0 , 0 , 0 ,5 PR r e c e i v e d from PE2 : 2 3 , 0 , 1 2 , 0 , 1 6 , 0 , 8 , 0 , 2 , 0 , 0 , 0 ,
65

CHAPTER 12. ACCEPTANCE TEST
this can be translated into the following packets that the PR receives:
1 PR r e c e i v e d from PE2 : t y p e : 23 f l a g : 0 l e n g t h : 16 u s e r i d : 12 PR r e c e i v e d from PE2 : t y p e : 23 f l a g : 0 l e n g t h : 16 u s e r i d : 2
As can be seen in the measurement journal in appendix A on page 91, when the users have been discon-nected the current PE in the database have been set to 0. This shows that the PR and PE can deregistera PU when it wants to disconnect.
Having done this test it can be concluded that the implementation can set up a PR and register severalPEs on it. PUs can then be registered to the PR and logged in to the PEs. While online on the PEs thePUs are able to communicate with each other using serverbounce, and if a server goes down, they canconnect to another PE. Finally the PUs are able to disconnect from the PE and PR if they do not wish tobe connected to the serverpool anymore.
Change password acceptance test
The test for changing the password of a user goes through the following steps:
• Start a PR.
• Create a PU on the PR.
• Send a request to change password.
When creating a PU on the PR the PU will send a packet type 24, called a create user packet in theASAP, containing location, username and password. Once this have been send it will send a packettype 25, called a change password packet in the ASAP,, which contains username, old password andnew password. The PR receives the following packets:
1 2 4 , 0 , 2 8 , 0 , 9 , 0 , 1 6 , 0 , 4 , 0 , 0 , 0 , 5 , 0 , 0 , 0 , 1 1 6 , 1 0 7 , 0 , 0 , 9 , 0 , 8 , 0 , 1 0 4 , 1 0 5 , 1 0 8 , 0 ,2 2 5 , 0 , 2 8 , 0 , 9 , 0 , 1 2 , 0 , 4 , 0 , 4 , 0 , 1 1 6 , 1 0 7 , 0 , 0 , 9 , 0 , 1 2 , 0 , 1 0 4 , 1 0 5 , 1 0 8 , 0 , 1 0 4 , 1 0 5 , 1 0 9 , 0 ,
Which can be translated into:
1 t y p e : 24 f l a g : 0 l e n g t h : 28 l o c a t i o n x : 4 l o c a t i o n y : 5 username : t k password :him
2 t y p e : 25 f l a g : 0 l e n g t h : 28 username : t k o l d p a s s w o r d : him newpassword : h i l
Observing the database in the measurement journal in appendix A on page 91 we can see that thepassword is changed from ”him” to ”hil”. It can therefore be concluded that the implementation is ableto change the password of a PU.
12.2 Rsync acceptance test
The test of rsync can be seen in appendix B on page 94. It can be seen that the myfile.txt does not existon computer B prior to running rsync, and it does exist after wards. The data in the files are as follows:
1 m y f i l e . t x t on computer A: Abcd3fgh i jk lmNop q r s t u 1 20002 m y f i l e . t x t on computer B : Abcd3fgh i jk lmNop q r s t u 1 2000
66

CHAPTER 12. ACCEPTANCE TEST
Having done this, it can be seen that the myfile.txt on computer A is changed, and underneath can beseen the files on both computers after running rsync again:
1 m y f i l e . t x t on computer A: d3fgh NEWTEXT q r s t u 1 2000 i jk lmNop2 m y f i l e . t x t on computer B : d3fgh NEWTEXT q r s t u 1 2000 i jk lmNop
From this test it can be seen that rsync is able to make a new file on another computer, if the file itattempts to synchronize is not present, and otherwise it will updated in a file that is all ready there.
67

Chapter 13Performance analysis of the modifiedRSerPool
In order to better understand how the implemented RSerPool performs, a performance analysis is cre-ated. This will be a discussion about the different bottlenecks of the system, and a single bottleneckwill be chosen for deeper performance analysis. This analysis will consist of an analytical which willbe supported by measurements conducted on the implemented RSerPool.
13.1 Bottlenecks
A bottleneck is an event where the performance or the capacity of the whole system is limited by asingle or number of components or resources. A bottleneck can occur in both the PEs or in the PR. Asa result of that the data flow slows down to the speed of the slowest point in the data path. If multiplePUs are attempting to connect to the same PR, it can overwhelm the PR causing performance problems.Another scenario is when the are too many PUs attempts server bouncing at the same PE. One way toprevent such kind of bottlenecks is track the network demands over time from the PRs, and then do loadbalancing on the PEs before the load becomes critical. Bottlenecks can be located by systematicallytesting the system performance at the PRs and the PEs.
In our system we may have two major types of bottlenecks:
• Network bottleneck: This is a bottleneck where the bandwidth of the connection to the server,is lower than the bandwidth needed to send all messages to the server.
• Processing bottleneck: This is a bottleneck where the server has so many jobs to process, that itcannot finish a job before a new one arrives.
The potential bottleneck points in this system are:
• Incoming connection to PR: In this case the bottleneck refers to the conditions in which theincoming data flow is limited by the PR or the network resources. Basically the PR may receivemany registration or login requests at the same time and it will not be able to process them due
68

CHAPTER 13. PERFORMANCE ANALYSIS OF THE MODIFIED RSERPOOL
to lack of processing speed, memory size or the network capacity. In this case a bottleneck willoccur. To avoid such kind of problem, the PR should be built in a way where the PR dropsconnections if it has to many requests. These requests would then have to be picked up by adifferent PR, and if there are no PRs to handle the requests more should be added.
• Server Bounce: In this case the bottleneck occurs when many server bounce connections takesplace on the same PE. This could be prevented beforehand by the PR who will know in advancethe load of this PE. According to the set up threshold the clients will be distributed among differentPEs. This threshold could be designed in a way that it will have certain amount of user that canestablish a server bounce connection at the same time and if more users wants to establish a serverbounce connection they should be stacked in the queue or migrated to another PE.
• PU service requests: In this case a PU will ask for a service from the pool. The PRs will assigna PE to this PU and the PU will connect. Lets say that 10 000 PUs ask for a service and the PRwill assign the same PE to most of these clients. A bottleneck may occur due to the limitation ofthe PE to handle this amount of PU and it will not be able to process all these incoming requestswhich may also lead to the PE going down. This problem could be avoided by load balancing. Ifthe PR knows the load of a certain PE, it will only assign the number of clients which the PE canhandle.
• Changing data on the PE (rsync): In this case many PUs are connected to the same PE anddoing server bounce. After the server bounce, all the data that was changed on this PE for eachclient should be backed up to their backup PEs while a multiple server bounce connection mayexist at the same time. A bottleneck may occur, due to the processing power of the ”host” PE. Toavoid such problem, a threshold should be set for how many PUs may exist on this PE.
While all these potential bottlenecks could exist in the final system, this analysis will only focus on oneof them. It has been chosen to focus on the bottlenecks at the server bounce between two clients. Thisis chosen as the server bounce will introduce a high amount of traffic, and is the main service providedby the PEs. As the RSerPool implementation only deals with the software part of the server pool, thefocus of the analysis be the performance of the server bounce from the packet is received from one PUuntil it is forwarded to the secon PU.
13.2 Queueing model for server bounce sessions
The PUs waiting to receive a request to start a server bounce, together with the PE that is receivingpackets, sent from one PU and forwards them to the other PE, can be seen as a ”waiting room”. Afterconnecting to a PE, a random number of PUs will request server bounce transactions with other PUswith random time intervals, generating traffic while such transactions are handled by the PEs. For everydifferent active PU doing server bounce, a queue can be used to model this ongoing session. Suchsessions will not produce traffic all the time but in specific time intervals. These periods of time can betreated as ON and OFF traffic states.
In man-in-the-middle cases, where servers are used to forward packets from one end PU to another, twoqueue phenomena are taking place:
• The number of simultaneous active sessions which cannot fall below zero.
• Network packets of these sessions created and forwarded through the server are treated as separateprocesses.
69
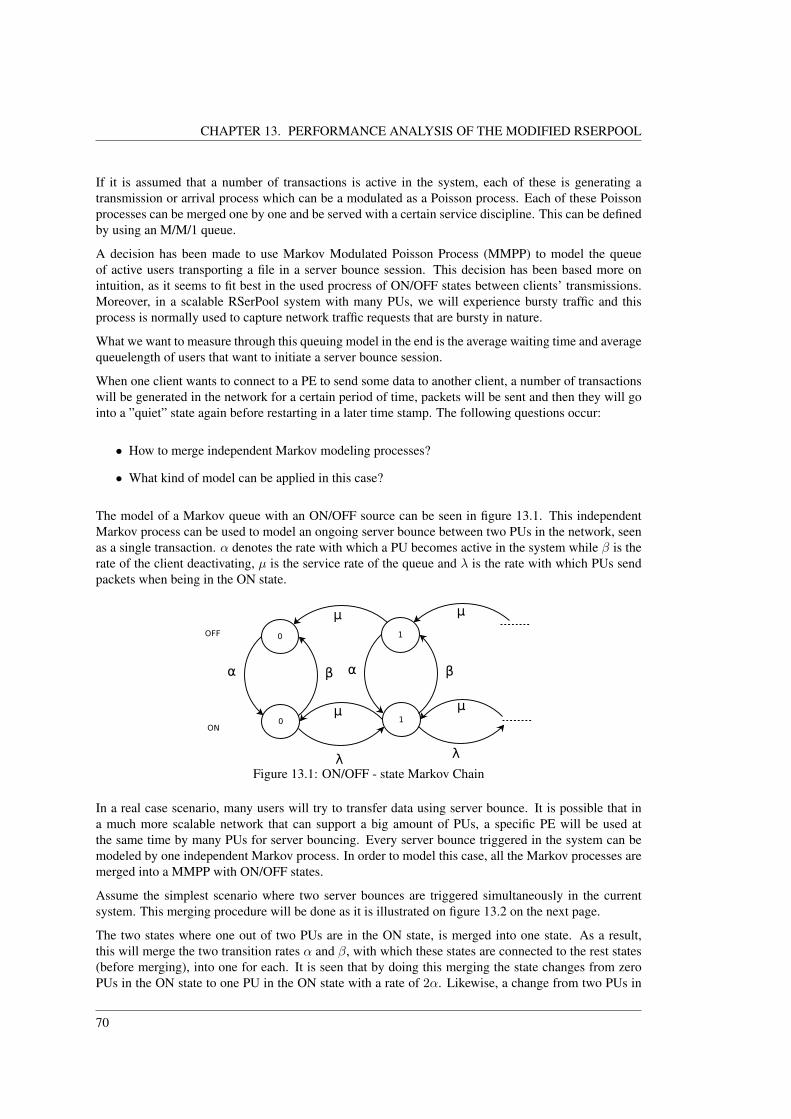
CHAPTER 13. PERFORMANCE ANALYSIS OF THE MODIFIED RSERPOOL
If it is assumed that a number of transactions is active in the system, each of these is generating atransmission or arrival process which can be a modulated as a Poisson process. Each of these Poissonprocesses can be merged one by one and be served with a certain service discipline. This can be definedby using an M/M/1 queue.
A decision has been made to use Markov Modulated Poisson Process (MMPP) to model the queueof active users transporting a file in a server bounce session. This decision has been based more onintuition, as it seems to fit best in the used procress of ON/OFF states between clients’ transmissions.Moreover, in a scalable RSerPool system with many PUs, we will experience bursty traffic and thisprocess is normally used to capture network traffic requests that are bursty in nature.
What we want to measure through this queuing model in the end is the average waiting time and averagequeuelength of users that want to initiate a server bounce session.
When one client wants to connect to a PE to send some data to another client, a number of transactionswill be generated in the network for a certain period of time, packets will be sent and then they will gointo a ”quiet” state again before restarting in a later time stamp. The following questions occur:
• How to merge independent Markov modeling processes?
• What kind of model can be applied in this case?
The model of a Markov queue with an ON/OFF source can be seen in figure 13.1. This independentMarkov process can be used to model an ongoing server bounce between two PUs in the network, seenas a single transaction. α denotes the rate with which a PU becomes active in the system while β is therate of the client deactivating, µ is the service rate of the queue and λ is the rate with which PUs sendpackets when being in the ON state.
Figure 13.1: ON/OFF - state Markov Chain
In a real case scenario, many users will try to transfer data using server bounce. It is possible that ina much more scalable network that can support a big amount of PUs, a specific PE will be used atthe same time by many PUs for server bouncing. Every server bounce triggered in the system can bemodeled by one independent Markov process. In order to model this case, all the Markov processes aremerged into a MMPP with ON/OFF states.
Assume the simplest scenario where two server bounces are triggered simultaneously in the currentsystem. This merging procedure will be done as it is illustrated on figure 13.2 on the next page.
The two states where one out of two PUs are in the ON state, is merged into one state. As a result,this will merge the two transition rates α and β, with which these states are connected to the rest states(before merging), into one for each. It is seen that by doing this merging the state changes from zeroPUs in the ON state to one PU in the ON state with a rate of 2α. Likewise, a change from two PUs in
70

CHAPTER 13. PERFORMANCE ANALYSIS OF THE MODIFIED RSERPOOL
Figure 13.2: ON/OFF states of the two PU Markovchain.
Figure 13.3: MMPP excluding the OFF states
the ON state to one PU in the ON state will happen with a rate of 2β. This results in the MMPP shownon figure 13.3.
Only active PUs taking part in a transaction in the network should be taken into consideration. Conse-quently, the queuing system inside the server bounce has meaning only for PUs in the ON state. Fromcalculations point of view, the gain compared to the merged states approach is quite big as for every inew server bounce triggered in the system, i+1 ON states will be generated and have to be inserted intothe model instead of 2i+1 states.
Figure 13.4 on the next page presents the model for the system in its generic form, where N serverbounces occur in the network. The packets sent by the users for every active transaction is a randomvariable and the upper limit has been set to infinity. The arrival of packets in the queue is assumed to bea Poisson process.
The variables in the final model denote:
• α - rate of a client going from the OFF state to the ON state and starts a server bounce.
• β - rate of a client going from the ON state to the OFF state after a server bounce is finished.
• λ - arrival rate of packets in the queue when a server bounce is running.
• µ - service rate of a packet sent from a client when a server bounce is triggered.
To determine the value of these parameters, their meaning is discussed and a value is estimated for eachof them.The λ rate is limited by the speed of which PUs can send packets to the PE. It is assumed that this speedis limited by the last-mile Internet connection of the PUs. As one of the PUs in a server bounce willalways have to upload so the other can download, and many Internet connections provide significantlylower upload speed than download speed, the assumed Internet connection is based on upload speeds.It is for these reasons chosen to use 10Mbit/s as the transfer speed. As can be seen in [14] there aretwo packet sizes of the IP packet that are dominat, one at 500 and one at 1500. We have chosen to usethe 1500 Byte packets.
λ =10000000/8
1500= 833, 333
[packets
s
](13.1)
71
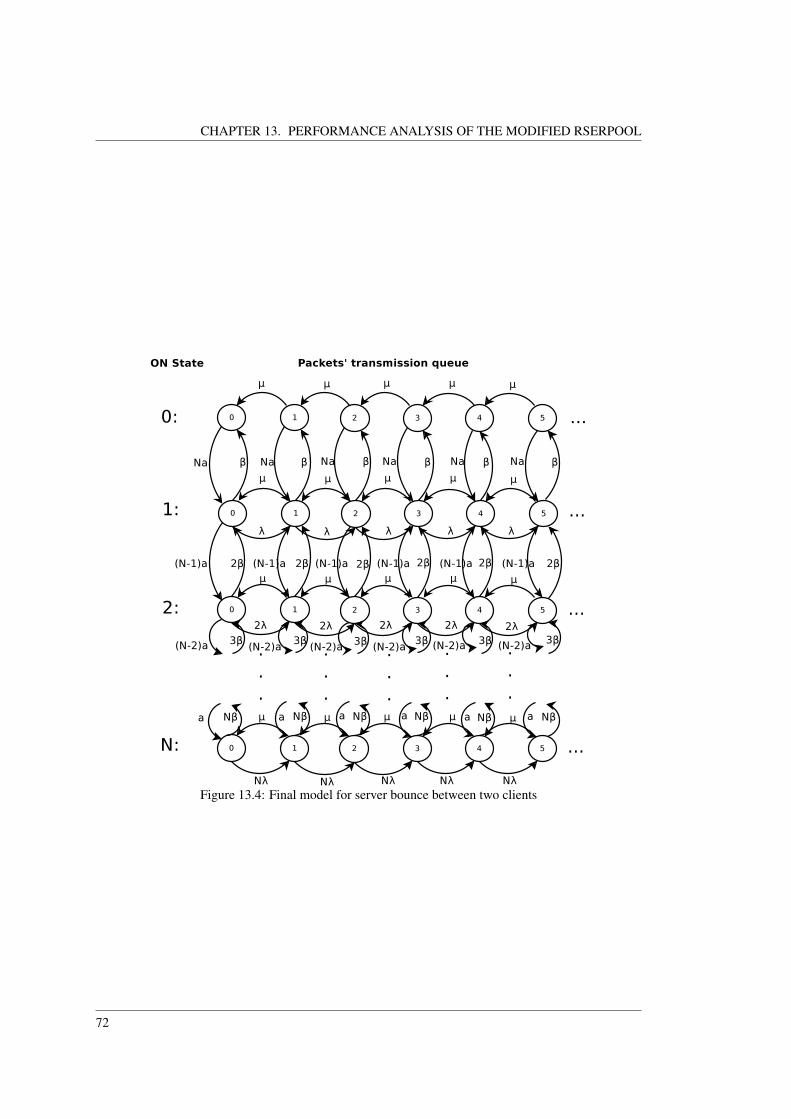
CHAPTER 13. PERFORMANCE ANALYSIS OF THE MODIFIED RSERPOOL
Figure 13.4: Final model for server bounce between two clients
72

CHAPTER 13. PERFORMANCE ANALYSIS OF THE MODIFIED RSERPOOL
The β value is the rate of which a PU changes from the ON state to the OFF state. This value cantherefore be calculated from the size of the file that is to be transmitted, and the rate with which thistransmission happens. This means that β can be calculated using equation 13.2.
1
β=
expected file sizeλ
(13.2)
The DAM project aims to be available to everyone, so it can be conceived that packets of all sizes willbe send, therefore a file size of 1 MB is chosen. this gives a beta of:
β =833.3333
1000000= 0, 0008333
[packets
s
]. (13.3)
Also, α has to be assumed. We know that:
1
α= mean time between requests (13.4)
It is arbitrarily chosen to set the time between server bounce requests to 7 hours, which makes α:
α =1
7 · 60 · 60= 0, 00004 (13.5)
The value for µ is found by measurements on the implemented RSerPool, which is done in section 13.3on page 79. These values are used to find the numerical results in order to calculate the average queuelength and waiting time.
The generator matrix, Q, is used in the final model to represent the transition rates. The matrix ispresented in equation 13.6 on the following page. What is more important is to define the pattern thatthe variables in this rates matrix follow. We can derive three main submatrices that keep on repeatingas long as the number of active states in the system increases and reaches N. These NxN dimensionsubmatrices are: A, B and C. A0 is the only submatrix that differentiates from the similar behavior ofsubmatrix A, as it represents the birth and death rates in the Markov queue of arriving packets in thesystem when no active users exist.[15]
A0 =
−Nα Nαβ −(β + λ+ (N − 1)α) (N − 1)α
2β −(2β + 2λ+ (N − 2)α) (N − 2)α3β −(3β + 3λ+ (N − 3)α)
...
A =
−(µ+Nα) Nα
β −(β + λ+ µ+ (N − 1)α) (N − 1)α2β −(2β + 2λ+ µ+ (N − 2)α) (N − 2)α
3β −(3β + 3λ+ µ+ (N − 3)α)...
73

CHAPTER 13. PERFORMANCE ANALYSIS OF THE MODIFIED RSERPOOL
B =
µ
µµ
µ...
µ
C =
0
λ2λ
3λ...
Nλ
The generator matrix can be presented based on the generated submatrices as:
Q =
A0 CB A C
B A C... ... ...
B A
(13.6)
By creating the probability vector
P =[P0 P1 P2 P3 ...
],
which contains the state probabilities, we can derive the following balance equations:
P0A0 + P1B = 0 (13.7)
P0C + P1A+ P2B = 0 (13.8)
PnC + Pn+1A+ Pn+2B = 0 (13.9)
We search for a matrix geometric solution of the below type:
P1 = P0R (13.10)
Pn = P0Rn (13.11)
Substituting equation 13.11 in equation 13.9, we get:
P0RnC + P0R
n+1A+ P0Rn+2B = 0
P0RnC + P0R
nRA+ P0RnR2B = 0
P0Rn(C +RA+R2B) = 0, for all Pn
(13.12)
In order to find the load matrix R ,the previous equation has to be solved. From Ricatti equation, it isknown that for equation 13.12 it is sufficient that:
74

CHAPTER 13. PERFORMANCE ANALYSIS OF THE MODIFIED RSERPOOL
C +RA+R2B = 0 (13.13)
Applying an iterative solution for the previous equation, we can calculate the load matrix R as:
R0 = 0 (13.14)
Rn+1 = −(C +R2nB)A−1 (13.15)
This R converges to a an upper limit.
The next step is to calculate P0. For the case of a 2-state ON/OFF Markov chain, as shown in figure 13.1on page 70, we can easily calculate the stationary probability vector:
Ps =
∞∑n=0
Pn =
[β
α+βα
α+β
](13.16)
In order to calculate the stationary probability vector of a user being in a state i in the general case, weneed to find the general form of this vector:
Ps =
∞∑n=0
Pn =
P (mode1)P (mode2)
...P (modeN )
(13.17)
where modei denotes a random queue length, q, in state i of the queue of active users in the system, asshown in figure 13.5. In the same figure, q represents the queue of the packets. It must be clarified thatthis figure is an abstract representation of figure 13.4 on page 72, with the difference that the queue ofactive clients lies on the horizontal axis(modei), while the queue of arrival packets lies on the verticalaxis(q). Pi,n = P (modei,queue n). The stationary probability P (modei) of being in state i, is actuallythe probability of being in state i and at the same time as being in one of the states of q, as shown by thesmall squares on figure 13.4 on page 72.
Figure 13.5: Stationary probability Pi,n
75

CHAPTER 13. PERFORMANCE ANALYSIS OF THE MODIFIED RSERPOOL
In order to calculate the Pns in the general case, as it is shown on figure 13.7, we will base it on thesimple case of 2 active states, as shown on figure 13.6.
Figure 13.6: Server bounce for 0, 1 and 2 activeusers in the queue
Figure 13.7: Generalized server bounce for n-1, nand n+1 active users in the queue
In the below calculations, Pns will be symbolized just as Pn. So, for the n state we get:
Pn = Pn−1(N − n+ 1)
n(α
β) (13.18)
Looking at equation 13.6, iteratively we can calculate the above Pn as follows:
P1 = P0N(α
β) (13.19a)
P2 = P1(N − 1
2)(α
β) = P0
N(N − 1)
2(α
β)2 (13.19b)
Pn = P0N(N − 1)(N − 2)...(N − (n− 1))
1 · 2 · 3 · ... · n(α
β)n (13.19c)
= P0N(N − 1)(N − 2)...(N − (n− 1))(N − n)(N − n− 1) · ... · 1
n!(N − n)!(α
β)n (13.19d)
= P0N !
n!(N − n)!(α
β)n (13.19e)
From equation 13.19e, we can derive that Pn is following a binomial distribution:
Pn = P0(α
β)n(N
n
)(13.20)
The sum of stationary probabilities at every possible state should equal 1:
N∑n=0
Pn = 1 (13.21)
Substituting equation 13.20 into equation 13.21, we get:
N∑n=0
P0(α
β)n(N
n
)= 1 (13.22)
=> P0 =1∑N
n=0(αβ )n(Nn
) (13.23)
76

CHAPTER 13. PERFORMANCE ANALYSIS OF THE MODIFIED RSERPOOL
By replacing P0 into equation 13.20 on the facing page, we finally take the formula for the stationaryprobability in any state at the queue:
Pn =(αβ )
n(Nn
)∑Nj=0(
αβ )j(Nj
) (13.24)
The next step, is to calculate P0. Returning back to the proposed geometric solution, if we apply thesum in both sides of equation 13.11 on page 74, we get:
∞∑n=0
Pn =
∞∑n=0
P0Rn (13.25)
Decomposing the load matrix R in eigenvalues and eigenvectors, we take:
∞∑n=0
P0Rn = P0
∞∑n=0
V TDnV = P0VT (
∞∑n=0
Dn)V (13.26)
The diagonal NxN diamension matrix Dn is of the form:
Dn =
dn1 · · · 0...
. . ....
0 · · · dnN
(13.27)
Puting this matrix in equation 13.26 we get:
∞∑n=0
P0Rn = P0V
T
∑∞n=0 d
n1 · · · 0
.... . .
...0 · · ·
∑∞n=0 d
nN
V (13.28)
From the geometrical series, we take:
∞∑n=0
dn =1
(1− d)(13.29)
Substituting this into the previous matrix will give:
∞∑n=0
P0Rn = P0V
T
1
1−d1 · · · 0...
. . ....
0 · · · 11−dN
V (13.30)
Substituting the stationary probability matrix Pn from equation 13.24 into the first part of the previousequation, will give:
(αβ )n(Nn
)∑Nj=0(
αβ )j(Nj
) = P0VT
1
1−d1 · · · 0...
. . ....
0 · · · 11−dN
V (13.31)
77

CHAPTER 13. PERFORMANCE ANALYSIS OF THE MODIFIED RSERPOOL
In this equation the only unknown variable is P0, which can be computed from:
P0 =(αβ )
n(Nn
)∑Nj=0(
αβ )j(Nj
)V −1
11−d1 · · · 0
.... . .
...0 · · · 1
1−dN
−1
(V T )−1 (13.32)
Now that we know P0, we can calculate the mean queue length by,
∞∑n=0
nPn =
∞∑n=0
nP0VTDnV = P0V
T (
∞∑n=0
nDn)V = E (13.33)
,where:
E =[E1 ... EN
]In order to calculate the expected mean length of the queue, we just have to sum the elements of the Evector:
E =
N∑i=1
Ei (13.34)
The only unknown term in equation 13.33 is
∞∑n=0
nDn =
∑∞n=0 nd
n1 · · · 0
.... . .
...0 · · ·
∑∞n=0 nd
nN
(13.35)
Applying the ”Z” transform on the diagonal elements of the previous matrix, will give:
D(z) =
∞∑n=0
zndn =
∞∑n=0
(zd)n =1
1− zd(13.36)
The derivative of D(Z) will be taken in order to calculate the first moment.
D′(z) =d
(1− zd)2=> D′(1) =
d
(1− d)2(13.37)
Now the expected queue length is calculated using MATLAB. Since it is expected that PUs only startsa server bounce session every three hours, it is also expected that the PE will be able to handle severalthousand PUs at a time. In the calculations it is however nessessary to calculate the factorial of theamount of PUs. It is therefore decided to make the amount of PUs between N = 5 and N = 25 withsteps of 5. Using the stability criterion, which is given by:
µ ≥ N · λ · α
α+ β(13.38)
it can be found that it is fullfilled when N = 10, where it is:
78

CHAPTER 13. PERFORMANCE ANALYSIS OF THE MODIFIED RSERPOOL
833, 333 ≥ 20 · 833, 333 · 0, 00004
0, 00004 + 0, 00004= 763, 3879 (13.39)
But not for 25, where it is:
833, 333 ≥ 25 · 833, 333 · 0, 00004
0, 00004 + 0, 00004= 954, 2349 (13.40)
This means that there will be results for both a stable and an unstable queue.
When doing the calculations the A, B and C matices are generated first, and the R matrix is then cal-culated using equation 13.15 on page 75. The stady state probability vector is then calculated usingequation 13.22 on page 76 and equation 13.19c on page 76. The eigen value decomposition of R is thendone, is used to calculate P0 using equation 13.32 on the facing page. The expected queue length is thencalculated using equation 13.33 on the preceding page and 13.34 on the facing page. The average queuelength is then calculated, the average waiting time is also calculated from the average queue length usingthe formula:
Tavg =E
µ
The resulting average queue length and average waiting times can be seen in table 13.1.
N Average queue length Average waiting time5 33387 40,067
10 160200 192,245615 400760 480,929920 780320 936,4225 1330400 1596,6
Table 13.1: Table of the results of the numerical analysis.
13.3 Service time measurements
This section will make an estimate of the service rate parameter µ used in the performance analysis.This will be done using measurements from the prototype implementation described in chapter 11 onpage 48.
The service rate of a server bounce PE is calculated from the service time. This time is chosen as thetime it will take from the PE receives the packet, until it has forwarded the packet to the other PU.This service time is thereby not the service time the PU will experience, as the delay of transmitting thepacket over the internet is not taken into account. This is chosen because the transmission delay is notinfluenced by the PE software design.
The measurement of the service times is done in appendix C on page 98. In this test the times thepackets are received, and the time that they are forwarded, is found using the program Wireshark. Thisprogram captures the packets at the MAC layer, and the calcuated service time will therefore be thetime it takes for the packet to get through all layers from MAC to application layer being processed, andgoing through the TCP/IP stack from application layer back to the MAC layer.
The service times are measured while the the network is under heavy load. This load is created bytransfering a large data file both ways between the two PCs used for the measurement. This is done inorder to find the worst case service time.
79

CHAPTER 13. PERFORMANCE ANALYSIS OF THE MODIFIED RSERPOOL
From the measurement results, the average service time is found to
T = 1.8791 · 10−4.
From the average service time, the average service rate can be found to
µ =1
1.8791 · 10−4.
13.4 Conclusion
The numerical results show that even for as few as 5 server bounce sessions it would take 40 seconds,on average, to service a single packet. This delay is unexpectedly high, and it was initially assumed itwould be below 1 second. If this is the true result, severe hardware and software upgrades would haveto be implemented on the servers for this system to be feaseable. It is however deemed more likely thatthere were unprecise measurements of the service rate. This fault could lie with the measurement tool,as it is not known exactly how wireshark timestamps its packets, nor how precise its time is.To look further into this, a more detailed analysis on how to choose the parameters for the queue morerealisticly could be made. A more detailed analysis of how to do service rate measurement could leadto more precise measurements of the service rate.
80

Part III
Conclusion and Assessment
81

Chapter 14Conclusion
From this project it can be concluded that the RSerPool would be suitable as server setup for the DAMproject. Several scalability issues was however identified in the RSerPool, which it was needed tochange for the RSerPool to fit the DAM project better. To fix the scalability issues, it was decided toisolate the unscalable parts of the RSerPool on the PRs. This was achieved by moving the PU loginfrom the PE to the PR, and by setting up a backup system so that all PEs should not be a completemirror of eachother, but data for specific users was mirrored on three PEs. This reduces the reliabilityof the system, but the reliability is still considered to be high enough for our purpose.
In order for the RSerPool to support the changes, additions was developed for the ASAP and the ENRP.In total ten packets and one parameter was added to the ASAP and three packets where added to theENRP. A prototype setup of the modified RSerPool was implemented, and a test bench was created withone PR, four PEs and two PUs. From the accepttest of the prototype it can be concluded that the PR isable to handle the PU logins, as well as several PEs. It was also concluded that in case a PE failed, thePR was able to detect this and refer PU to another PE instead. It was shown that the PEs chosen werealways the ones closests to the location of the PU.
The accepttest also proved that the PE was able to handle clients connecting, and performing a serverbounce. The PE was also able to inform the PRs of users logging out.
Another test was made on the rsync implementation, testing if a file could be synchronized between twoservers. While this service was not integrated on the PEs, it was implemented. The test showed that afile could be transfered to another server regardless of the file existing on the recipient or not. It wasshown that rsync could synchronize files regardless of text being deleted, changed or added.
Performance measurements was made on the prototype, and these measurements was used to make aperformance analysis of the setup. It can be concluded from this, that the average service time of serverbouncers is unexpectedly high. This could be the true results, it is however assumed that there is anuncertainty in the measurements of the service rate, aswell as in the choosing of the parameters for thequeue. Further investigation into these issues is called for.
82

Chapter 15Assesment
The assesment will be split into three sections. The first section will discuss the results found in thereport. The second part will discuss the subject of fault detection and analysis, as this is a large part notcovered in this report. The last part of the assesment will cover future work, and describe what shouldbe added to the project in the future.
15.1 Achievements
This section will consider the parts of the project that have been accomplished, and what effect theseaccomplishments have. Two main goals for this implementaion was reliability and scaleability, andthese will therefore be discussed.
While the modified RSerPool is only partly implemented, due to limitations in time and there are manyextra features we would like to add to it, it should be noted that the implementation so far is a runningand stable system. This means that it is possible to test some specific parameters within the RSerPool.The maximum and average service times for a single packet on a PE, maximum and avarage waitingtimes, maximum and avarage queue length.
The RSerPool does, as the name suggest, have a focus on reliability. In the modified version of RSer-Pool, it is however reduced as the data is not mirrored to all servers, but only three. This was done toincrease scaleability as will be discussed later. Measurements of the reliability have not been done dueto time limitations, as the system would either need run for a very long time, or it would have to besimulated which would require an extensive analysis of general server reliability. While the reliabilityof the implemented system is lower than the normal RSerPool, with a sufficiently high uptime for eachserver the reduced reliablity should not cause problems. With a server reliability of 95 %, the reliabilityof the system would be:
Reliability = 1− (1− 0.95)3 = 0.999875 (15.1)
Scalability is an aspect that is hard to quantify and measure. It has been attempted, as explained in thereport, to place all the unscaleable parts of the RSerPool on the PRs. This does however still mean thatto test the limits of the scaleability of the system, the entire modified RSerPool should be implementedand then PUs, PRs and PEs should be added untill it cannot handle any more PUs. This limit would
83

CHAPTER 15. ASSESMENT
however be mostly hardware dependant, and would require an extensive analysis, and for those reasonsit has not been tested. It is however believed that the limit to the PRs is a far way off with the currentaccesible hardware.
15.2 Fault detection analysis
In every system a fault may occur over time, which means that a fault detection mehanism should becreated. This fault detection mehanism consists of four steps:
• Fault prevention: prevent the occurrences of faults
• Fault tolerance: a service failure should be avoided
• Fault removal: reduce the number and the severity of faults
• Fault forecasting: create a probabilistic method to estimate the present number, the incidenceand what exactly my cause the fault
The table 15.1 presents the main failures that can occur in the system, the cause of them as well withthe possible effects to the system. It also shows the assumed values for the occurances of these faultsand their severity.
Item FailureModes
Cause of fail-ure
Possible effects Occurrences Severity
1 Pool elementgoes down
Overload,Phenomeno-logical causes
Serverbounce/backupterminated
2/10 3/10
2 Registrar goesdown
Overload,Phenomeno-logical causes
System col-lapses
1/10 10/10
3 Clientdropped
Bad con-nectivity,hardwaremalfunction
disconnection,server bounceterminated
5/10 1/10
4 Server bounceinterrupt
PE/PR goesdown/ clientdropped
Extra load onthe system
3/10 3/10
5 Backupfailure
PE goes down Loss of data 1/10 7/10
Table 15.1: Failure Mode and Effect Analysis
As it can be seen from 15.1 on the next page many different faults may occur in our system [16]. Theirclassification has been done as follows:
• Fault classes
• Fault types
– Operational faults: these faults could occur in our system while server bounce is in phaseof use.
84

CHAPTER 15. ASSESMENT
Figure 15.1: Which kind of faults classes refer to which kind of fault types.
– Internal faults: an internal fault can originate inside the system boundaries. In our systemsuch kind of error could be caused if a PE goes down, registrar goes down, etc.
– Natural faults: these faults could occur in our system due to some natural phenomenawithout human interaction and may lead to failure in the system. Such kind of fault couldbe a thunderstorm causing a power outage.
– Human-Made faults: these faults in our system could be caused by a user interaction andthey are closely connected with the later on mentioned accidental and incompetence faults
– Hardware faults: these faults in our system may occur when a component of our systembreaks down due to hardware failure.
– Software faults: such kind of fault should only occur in our system in the developmentstage. An example of this could be an error that causes the rsync algorithm to transmit thewrong data, or the data to a wrong server.
– Malicious faults: these faults in our system could be caused by client with malicious inten-tions. An example of this could be a client trying to steal information from our system bypretending that he is a pool element and the possible server bounce communication couldbe re-directed through him.
– Accidental and incompetence faults: these kind of faults could be caused by an accidentdue to the lack of professional competence or by accident ( When for example the adminis-trator of the system tries to update the firmware and by accident does a mistake).
– Transient faults: the presence of these faults is bounded in time. Such faults can affect anytype of server in our system (PE or PR). The severity is different, but in both cases it willtake a certain amount of time to be fixed and functional again in the RSerPool.
85

CHAPTER 15. ASSESMENT
15.3 Future work
The implementation and testing of the software presented in the Design and Implementation part of thereport, reached a certain limit. Before the system can be deployed on a large scale and be ready foruninitiated users to use it, the system should mature and several other aspects should be added. Someof these aspects can be seen below.
• Add more PRs in the system. As it has been stated previously, one PR has been setup and usedfor the testing part of the system. However a single PR would mean that there is a single point offailure in the system, which is of course not a good thing in a reliable system. The protocol forPR to PR communication have been implemented, however due to time limitations neither hasbeen tested, nor integrated into the system.
• Improve server bounce communication. In the current implementation of data exchange be-tween two PEs using server bounce, in case the PE that is used as the man in the middle in thistransaction goes down or one of the clients disconnects for some reason, the whole process ter-minates. The data packets that were already sent from the first client to the PE and forwarded tothe second client, are logged anywhere. This means that the PU does not know how many of thepackets were actually received before the PE went down, and would mean the PU would haveto start all over again with the server bounce. An improvement to this could be to log the stateof transactions between users, so that the server bounce can be started from the place where anelement failed. It could furthermore improve the system if two PUs were able to connect evenif they are on different PEs, which could be done by using more PEs for the bouncing, or byautomatically assigning them to the same PE.
• P2P communication. In certain cases, depending on the available communication channels, P2Pcommunication between two clients’ devices would be preferable compared to server bounce. Inthe integrated version of the RSerPool, the BLA algorithm could be appended to choose betweenserver bounce and P2P connections or a new application protocol could be designed for thatpurpose.
• PEs’ migration. In the current implementation of our system the geographical location of auser is taken into account to the extent where the closest PE is assigned to a PU according tohis geographical location. The extension of this method could include some other factors. Forexample, if a user goes on vacation in some other country, the closest PE will be assigned to him.After the end of his vacation, the user’s data will remain on the local server. A policy should becreated in order to keep track of this data. The data could be stored on this PE for a certain periodof time. If the data was inactive for this certain period of time, it will be erased. This is doneto ensure that, if the client is constantly on the move, the data does not have to be synchronizedevery time. A smart algorithm could also be implemented in order to predict when and where theclient is going to. For example, if the user connects with his device to the system from an airport,this algorithm will predict where the user is going to and sends all his data to that specific PEbefore even the user reaches that place.
• Load-Balancing. It is a very important aspect that has been mentioned but not tested in thecurrent project. Referring to a pool of servers with scalability being one of the goals of thedesigned system, high communication load is expected to be generated in the network. It isvital to be able to properly distribute the load on all PEs ensureing that network resources areoptimally utilized, and that high QoS is delivered to users of the system. Moreover, the appearanceprobability of a bottleneck caused from very high amount of PUs registering to the system ordoing server bounce using the same PE, can be minimized. A theoretical analysis on how load-balancing can be achieved is presented in section 3.2 on page 16.
86

CHAPTER 15. ASSESMENT
• Security. Security is fundamental aspect of the designed system. However, due to this being avery broad field, it has not been analyzed. As the PUs have to register to the PR in order to beassigned to a specific PE, authentication takes place. Login information data sent by the PUsto connect to the system must be highly protected to prevent potential malicious behavior byunauthorized users in the system. Such malicious behavior can take place while a server bouncecommunication between two users is in progress. A security protocol, like Secure Socket Layer(SSL) or Transport Layer Security (TLS) protocol has to be attached in the already implementedprotocols to fulfill the requirements of a secure RSerPool in the future.
• Simulations. Simulations can be made to verify the results that we have derived from the nu-merical calculations of the mean queue length and mean waiting time in chapter 13.2 on page 69.Also, simulations would be useful to calculate quantitative characteristics, such as maximumqueue length, maximum waiting time for PUs and packets’ blocking probability that would leadto a more detailed testing of the picked model for our system.
87

Bibliography
[1] Multithreaded C++: Part 1: Pthreads, 14-12-2010.http://blog.emptycrate.com/node/270.
[2] Hans-Jacob S. Enemark Steffen R. Christensen, Martin S. Dam and Lars M. Mikkelsen. HighLevel Link Adaption using Extended Network Knowledge and Prediction. SomCon AAU, 2011.
[3] What is open, 03-2011.http://www.ict-open.eu/.
[4] Anders Nickelsen. Service Migration in Dynamic and Resource-constrained networks. 14-01-2011.
[5] Andrew Tridgell. Efficient Algorithms for Sorting and Synchronization. 1999.
[6] Thomas Dreibholz and Erwin P. Rathgeb. Rserpool - providing highly available services usingunreliable servers. 31st IEEE EuroMirco Conference on Software Engineering and AdvancedApplications, 2005.
[7] Thomas Dreibholz and Erwin P. Rathgeb. Overview and evaluation of the server redundancy andsession failover mechanisms in the reliable server pooling framework. International Journal OnAdvances in Internet Technology, vol 2 no 1, 2009.
[8] Aggregate server access protocol (asap), 01-2009.http://tools.ietf.org/html/draft-ietf-rserpool-asap-21.
[9] Aggregate server access protocol (asap), 09-2008.http://www.networksorcery.com/enp/rfc/rfc5352.txt.
[10] Endpoint handlespace redundancy protocol (enrp), 09-2008.http://tools.ietf.org/html/rfc5353#section-2.1.
[11] Chris Metz (Cisco Systems) Randall Stewart (Cisco Systems). New transport protocol for tcp/ip,fall-2004.
[12] Asynchronous i/o, 28-05-2012.http://en.wikipedia.org/wiki/Asynchronous_I/O.
[13] Zed A. Shaw. poll, epoll, science, and superpoll, 28-06-2012.http://sheddingbikes.com/posts/1280829388.html.
88
BIBLIOGRAPHY
[14] The Cooperative Association for Internet Data Analysis. Packet length distributions, 02-2000.http://www.caida.org/research/traffic-analysis/AIX/plen_hist/.
[15] Henrik Schiøler & Hans-Peter Schwefel. Traffic theory and queueing systems, fall-2004.http://www.control.auc.dk/˜henrik/undervisning/trafik/oversigt.html.
[16] Dr Ph. Martin. (re-)presentation of the resist ontology in fl, 2008.http://www.webkb.org/kb/it/p_securing/d_resist.html.
89

Part IV
Appendix
90

Appendix ATest of the RSerPool implementation
Objective
The objective of the accepttest is to ensure that the developed software adheres to the requirementspecification. This test is performed as stated in the accepttest specification in chapter 7 on page 33.
Test Object
The test object is the developed software, this means that this test will be testing the PR as well as thePE.
Test bench
Four PCs all using linux as the operating system is put on the same local network. All PCs haveinstalled the SCTP protocol, and the one running the PR has installed the c++ development package forpostgreSQL.
Procedure
The procedure of this test is split in two parts for easier test code reuse.
Part 1:
• The PR is started on the PC with postgreSQL support(PC3).
• Four PEs is started, one on each PC. The PE is started with the arguments shown in table A.1on the next page. The coordinates of the PEs are chosen so it easily can be seen which PE a PUshould be refered to.
• PC3 is logged on to the postgreSQL servers web interface.
• The IP of the PC running the PR is typed into each PE.
91

APPENDIX A. TEST OF THE RSERPOOL IMPLEMENTATION
• Two PUs are started on PC1 and PC2. These are started with the arguments shown in table A.2.
• The content of the database is observed using the web interface.
• A server bounce session is initiated between the two PUs.
• The server bounce session is terminated.
• The PE started on PC1 is terminated, emulating the server failing.
• The PUs are terminated.
• The content of the database is observed using the web interface.
• The terminal output from each piece of software is saved as results.
PE IP x-coordinate y-coordinate PE IDPC1 IP of PC1 10 11 1PC2 IP of PC2 10 7 2PC3 IP of PC3 1 10 3PC4 IP of PC4 19 10 4
Table A.1: Table of the parameters used to start the PEs in part 1 of the test.
PR IP Desired user name Desired password x-coordinate y-coordinatePC1 IP of PC3 mee me 9 10PC2 IP of PC3 u2 12 11 10
Table A.2: Table of the parameters used to start the PUs in part 1 of the test.
Part 2:
• The PR is started on the PC with postgreSQL support(PC3).
• The PU test software newclient is started on PC3.
• PC3 is logged on to the postgreSQL servers web interface.
• A create user packet is send from the PU. This creates a user with the user name ”tk” and thepassword ”him”.
• Using the web interface the content of the database is observed.
• A change user packet is send from the PU. This changes the password from ”him” to ”hil”.
• Using the web interface the content of the database is observed.
• The PR and PU is terminated, and the terminal outputs are saved.
92
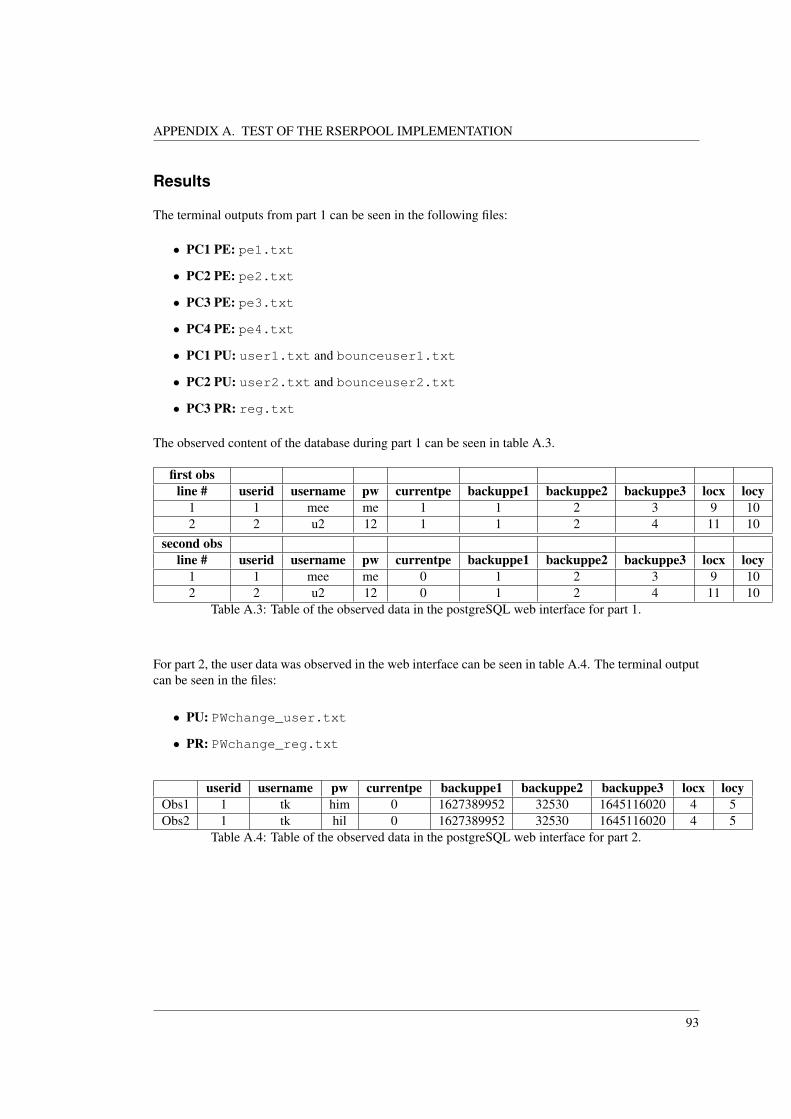
APPENDIX A. TEST OF THE RSERPOOL IMPLEMENTATION
Results
The terminal outputs from part 1 can be seen in the following files:
• PC1 PE: pe1.txt
• PC2 PE: pe2.txt
• PC3 PE: pe3.txt
• PC4 PE: pe4.txt
• PC1 PU: user1.txt and bounceuser1.txt
• PC2 PU: user2.txt and bounceuser2.txt
• PC3 PR: reg.txt
The observed content of the database during part 1 can be seen in table A.3.
first obsline # userid username pw currentpe backuppe1 backuppe2 backuppe3 locx locy
1 1 mee me 1 1 2 3 9 102 2 u2 12 1 1 2 4 11 10
second obsline # userid username pw currentpe backuppe1 backuppe2 backuppe3 locx locy
1 1 mee me 0 1 2 3 9 102 2 u2 12 0 1 2 4 11 10
Table A.3: Table of the observed data in the postgreSQL web interface for part 1.
For part 2, the user data was observed in the web interface can be seen in table A.4. The terminal outputcan be seen in the files:
• PU: PWchange_user.txt
• PR: PWchange_reg.txt
userid username pw currentpe backuppe1 backuppe2 backuppe3 locx locyObs1 1 tk him 0 1627389952 32530 1645116020 4 5Obs2 1 tk hil 0 1627389952 32530 1645116020 4 5
Table A.4: Table of the observed data in the postgreSQL web interface for part 2.
93

Appendix BTest of the rsync implementation
Objective
The objective of this test is to ensure that the rsync implementation is functioning as specified in therequirement specification. This test is performed as specified in the acceptance test specification inchapter 7 on page 33.
Test Object
The test object is the software developed for syncronizing two PEs. As this is not integrated into theRSerPool, this will be tested without any of the RSerPool software.
Test bench
Two PCs using linux as operating system is connected to the same local network. A file containing thedata ”Abcd3fgh ijklmNop qrstu1 2000” is placed on PC1.
procedure
The following is done using the terminal on each PC:
• Start the rsync server software on PC1.
• Run the rsync client from PC2 to syncronize the two computers.
• Observe if a file is created on PC2, and what it contains.
• Change the data in the file on PC1 to ”d3fgh NEWTEXT qrstu1 2000ijklmNop”.
• Run rsync again.
• observe the content of the two files.
94

APPENDIX B. TEST OF THE RSYNC IMPLEMENTATION
Results
The results for computer A and computer B can be seen below. Computer A
[chres@chres ComputerA]$ lsrsync
[chres@chres ComputerA]$ echo "Abcd3fgh ijklmNop qrstu1 2000" > myfile.txt
[chres@chres ComputerA]$ lsmyfile.txt rsync
[chres@chres ComputerA]$ ./rsync myfile.txt myfile.txt 192.168.0.134 2000data2[30]: Abcd3fgh ijklmNop qrstu1 2000
TYPE_FILE_INFO = type: 2 flags: 0 length: 8 block_size: 4 file_size: 0checksum[0]:
Interpret: Abcd3fgh ijklmNop qrstu1 2000
TYPE_TEXT_BLOCK = type: 6 flags: 0 length: 38 pos: 0data: Abcd3fgh ijklmNop qrstu1 2000
[chres@chres ComputerA]$ cat myfile.txtAbcd3fgh ijklmNop qrstu1 2000
[chres@chres ComputerA]$ gedit myfile.txt[chres@chres ComputerA]$ cat myfile.txtd3fgh NEWTEXT qrstu1 2000ijklmNop
[chres@chres ComputerA]$ ./rsync myfile.txt myfile.txt 192.168.0.134 2000data2[34]: d3fgh NEWTEXT qrstu1 2000ijklmNop
TYPE_FILE_INFO = type: 2 flags: 0 length: 168 block_size: 4 file_size: 30
checksum[8]:Adler: 56099179 MD5: 30f64f3171b1fa24a1698bdf0b435b19Adler: 54002025 MD5: db3b467638e9e78b8c2a55f449303ac1Adler: 50200927 MD5: cb3ce63da4676d95e4b18f43763b2631Adler: 67502487 MD5: cf9762517a68c1fe8a5e14aa58a4395eAdler: 58196340 MD5: b47e34390057d5aefe95954d64bce500Adler: 71762318 MD5: 1beb31cdcc5374b64ba3007821c46bccAdler: 27918515 MD5: ca2c90129ab3075ca640f93086f64289Adler: 7077947 MD5: 897316929176464ebc9ad085f31e7284
Interpret: d 1 NEWTEXT qr 5 6 0ijk 3 p
TYPE_TEXT_BLOCK = type: 6 flags: 0 length: 9 pos: 0 data: dTYPE_BLOCK = type: 5 flags: 0 length: 12 pos: 1 id: 1TYPE_TEXT_BLOCK = type: 6 flags: 0 length: 19 pos: 5 data: NEWTEXT qrTYPE_BLOCK = type: 5 flags: 0 length: 12 pos: 16 id: 5
95

APPENDIX B. TEST OF THE RSYNC IMPLEMENTATION
TYPE_BLOCK = type: 5 flags: 0 length: 12 pos: 20 id: 6TYPE_TEXT_BLOCK = type: 6 flags: 0 length: 12 pos: 24 data: 0ijkTYPE_BLOCK = type: 5 flags: 0 length: 12 pos: 28 id: 3TYPE_TEXT_BLOCK = type: 6 flags: 0 length: 10 pos: 32 data: p
[chres@chres ComputerA]$ cat myfile.txtd3fgh NEWTEXT qrstu1 2000ijklmNop
[chres@chres ComputerA]$ lsmyfile.txt myfile.txt˜ rsync
Computer B
[chres@chres ComputerB]$ lsrsync
[chres@chres ComputerB]$ ./rsync 2000FILE_REQUEST = type: 1 flags: 0 length: 14 file_name: myfile.txtThe file myfile.txt doesn’t exist
data[0]:TYPE_DATA_START = type: 3 flags: 0 length: 4TYPE_TEXT_BLOCK = type: 6 flags: 0 length: 38 pos: 0
data: Abcd3fgh ijklmNop qrstu1 2000TYPE_DATA_END = type: 4 flags: 0 length: 4
[chres@chres ComputerB]$ lsmyfile.txt rsync
[chres@chres ComputerB]$ cat myfile.txtAbcd3fgh ijklmNop qrstu1 2000
[chres@chres ComputerB]$ ./rsync 2000FILE_REQUEST = type: 1 flags: 0 length: 14 file_name: myfile.txt
data[30]: Abcd3fgh ijklmNop qrstu1 2000
TYPE_DATA_START = type: 3 flags: 0 length: 4TYPE_TEXT_BLOCK = type: 6 flags: 0 length: 9 pos: 0 data: dTYPE_BLOCK = type: 5 flags: 0 length: 12 pos: 1 id: 1TYPE_TEXT_BLOCK = type: 6 flags: 0 length: 19 pos: 5 data: NEWTEXT qrTYPE_BLOCK = type: 5 flags: 0 length: 12 pos: 16 id: 5TYPE_BLOCK = type: 5 flags: 0 length: 12 pos: 20 id: 6TYPE_TEXT_BLOCK = type: 6 flags: 0 length: 12 pos: 24 data: 0ijkTYPE_BLOCK = type: 5 flags: 0 length: 12 pos: 28 id: 3TYPE_TEXT_BLOCK = type: 6 flags: 0 length: 10 pos: 32 data: pTYPE_DATA_END = type: 4 flags: 0 length: 4
[chres@chres ComputerB]$ cat myfile.txtd3fgh NEWTEXT qrstu1 2000ijklmNop
96

APPENDIX B. TEST OF THE RSYNC IMPLEMENTATION
[chres@chres ComputerB]$ lsmyfile.txt rsync
97

Appendix CMeasurement of server bouncing servicetimes
Objective
The objective of this measurement is to measure the service times of server bouncing packets on a PEexperincing heavy network load.
Test Object
The test object is the PE during a server bounce session.
Test bench
Two PCs using Linux as operating system is connected to eachother using ethernet. Both PCs haveinstalled the SCTP. PC1 also has the c++ development package for postgreSQL installed.
Procedure
The procedure is as follows:
• A PR and a PE is started on PC1.
• Two PUs are started on PC2.
• Wireshark is started on PC1, and a live capture is set to capture TCP packets received on port9000 and started.
• The transfer of a large data file is started in from PC1 to PC2 and from PC2 to PC1.
• A server bounce session between the two PUs, that sends 100 data packets of 512 bytes each, isstarted.
98

APPENDIX C. MEASUREMENT OF SERVER BOUNCING SERVICE TIMES
• When the server bounce session is finnished, the Wireshark capture is saved as a CSV file.
• The MATLAB script sharkdump.m is used to calculate the service times of each of the 100packets, as well as the mean value of the service times.
Results
The results of the measurements can be seen on figure C.1 and figure C.2 on the next page. The meanvalue of the measurements was calculated to
T = 1.8791 · 10−4.
1 2 3 4
x 10−4
0
2
4
6
8
10
12
14
16
18
20Histogram of the measured service times
Time [s]
Figure C.1: Histogram of the service times calculated by the MATLAB script.
99

APPENDIX C. MEASUREMENT OF SERVER BOUNCING SERVICE TIMES
0 10 20 30 40 50 60 70 80 90 1001
2
3
x 10−4 Scatter plot of the measured service times
Sample [.]
Serv
ice tim
e [s]
Figure C.2: Scatter plot of the service times calculated by the MATLAB script.
100

Appendix DDefinitions of the added ASAP packetsand parameter
This appendix contains the packet definitions of the packets designed in section 9.2 on page 43, as wellas the definition of the USER_IDENTIFIER parameter.
0 1 2 30 1 2 3 4 5 6 7 8 9 0 1 2 3 4 5 6 7 8 9 0 1 2 3 4 5 6 7 8 9 0 1
+-+-+-+-+-+-+-+-+-+-+-+-+-+-+-+-+-+-+-+-+-+-+-+-+-+-+-+-+-+-+-+-+| Type = 16 | Length = 8 |+-+-+-+-+-+-+-+-+-+-+-+-+-+-+-+-+-+-+-+-+-+-+-+-+-+-+-+-+-+-+-+-+| Pool User ID |+-+-+-+-+-+-+-+-+-+-+-+-+-+-+-+-+-+-+-+-+-+-+-+-+-+-+-+-+-+-+-+-+
Figure D.1: USER IDENTIFIER parameter definition.
0 1 2 30 1 2 3 4 5 6 7 8 9 0 1 2 3 4 5 6 7 8 9 0 1 2 3 4 5 6 7 8 9 0 1
+-+-+-+-+-+-+-+-+-+-+-+-+-+-+-+-+-+-+-+-+-+-+-+-+-+-+-+-+-+-+-+-+| Type = 26 |0|0|0|0|0|0|0|0| Message Length |+-+-+-+-+-+-+-+-+-+-+-+-+-+-+-+-+-+-+-+-+-+-+-+-+-+-+-+-+-+-+-+-+: Pool Handle Parameter :+-+-+-+-+-+-+-+-+-+-+-+-+-+-+-+-+-+-+-+-+-+-+-+-+-+-+-+-+-+-+-+-+: Pool Handle Parameter :+-+-+-+-+-+-+-+-+-+-+-+-+-+-+-+-+-+-+-+-+-+-+-+-+-+-+-+-+-+-+-+-+
Figure D.2: LOGIN REQ packet definition.
101

APPENDIX D. DEFINITIONS OF THE ADDED ASAP PACKETS AND PARAMETER
0 1 2 30 1 2 3 4 5 6 7 8 9 0 1 2 3 4 5 6 7 8 9 0 1 2 3 4 5 6 7 8 9 0 1
+-+-+-+-+-+-+-+-+-+-+-+-+-+-+-+-+-+-+-+-+-+-+-+-+-+-+-+-+-+-+-+-+| Type = 27 |0|0|0|0|0| T |R| Message Length = 12 |+-+-+-+-+-+-+-+-+-+-+-+-+-+-+-+-+-+-+-+-+-+-+-+-+-+-+-+-+-+-+-+-+: IPV4 Address :+-+-+-+-+-+-+-+-+-+-+-+-+-+-+-+-+-+-+-+-+-+-+-+-+-+-+-+-+-+-+-+-+
Figure D.3: USR RES packet definition. T takes the values 0,1 or 2 defining if the packet is a responseto a LOGIN REQ, a CHANGE PW or a CREATE USR packet.
0 1 2 30 1 2 3 4 5 6 7 8 9 0 1 2 3 4 5 6 7 8 9 0 1 2 3 4 5 6 7 8 9 0 1
+-+-+-+-+-+-+-+-+-+-+-+-+-+-+-+-+-+-+-+-+-+-+-+-+-+-+-+-+-+-+-+-+| Type = 23 |0|0|0|0|0|0|0|0| Message Length = 12 |+-+-+-+-+-+-+-+-+-+-+-+-+-+-+-+-+-+-+-+-+-+-+-+-+-+-+-+-+-+-+-+-+: User Identifier Parameter :+-+-+-+-+-+-+-+-+-+-+-+-+-+-+-+-+-+-+-+-+-+-+-+-+-+-+-+-+-+-+-+-+
Figure D.4: DISCONN USR packet definition.
0 1 2 30 1 2 3 4 5 6 7 8 9 0 1 2 3 4 5 6 7 8 9 0 1 2 3 4 5 6 7 8 9 0 1
+-+-+-+-+-+-+-+-+-+-+-+-+-+-+-+-+-+-+-+-+-+-+-+-+-+-+-+-+-+-+-+-+| Type = 25 |0|0|0|0|0|0|0|0| Message Length |+-+-+-+-+-+-+-+-+-+-+-+-+-+-+-+-+-+-+-+-+-+-+-+-+-+-+-+-+-+-+-+-+: Pool Handle Parameter :+-+-+-+-+-+-+-+-+-+-+-+-+-+-+-+-+-+-+-+-+-+-+-+-+-+-+-+-+-+-+-+-+: Pool Handle Parameter :+-+-+-+-+-+-+-+-+-+-+-+-+-+-+-+-+-+-+-+-+-+-+-+-+-+-+-+-+-+-+-+-+
Figure D.5: CHANGE PW packet definition.
0 1 2 30 1 2 3 4 5 6 7 8 9 0 1 2 3 4 5 6 7 8 9 0 1 2 3 4 5 6 7 8 9 0 1
+-+-+-+-+-+-+-+-+-+-+-+-+-+-+-+-+-+-+-+-+-+-+-+-+-+-+-+-+-+-+-+-+| Type = 20 |0|0|0|0|0|0|0|0| Message Length = 12 |+-+-+-+-+-+-+-+-+-+-+-+-+-+-+-+-+-+-+-+-+-+-+-+-+-+-+-+-+-+-+-+-+: User Identifier Parameter :+-+-+-+-+-+-+-+-+-+-+-+-+-+-+-+-+-+-+-+-+-+-+-+-+-+-+-+-+-+-+-+-+
Figure D.6: REQ USR PE packet definition.
0 1 2 30 1 2 3 4 5 6 7 8 9 0 1 2 3 4 5 6 7 8 9 0 1 2 3 4 5 6 7 8 9 0 1
+-+-+-+-+-+-+-+-+-+-+-+-+-+-+-+-+-+-+-+-+-+-+-+-+-+-+-+-+-+-+-+-+| Type = 21 |0|0|0|0|0|0|0|R| Message Length = 12 |+-+-+-+-+-+-+-+-+-+-+-+-+-+-+-+-+-+-+-+-+-+-+-+-+-+-+-+-+-+-+-+-+: IPV4 Address :+-+-+-+-+-+-+-+-+-+-+-+-+-+-+-+-+-+-+-+-+-+-+-+-+-+-+-+-+-+-+-+-+
Figure D.7: USR PE packet definition.
102

APPENDIX D. DEFINITIONS OF THE ADDED ASAP PACKETS AND PARAMETER
0 1 2 30 1 2 3 4 5 6 7 8 9 0 1 2 3 4 5 6 7 8 9 0 1 2 3 4 5 6 7 8 9 0 1
+-+-+-+-+-+-+-+-+-+-+-+-+-+-+-+-+-+-+-+-+-+-+-+-+-+-+-+-+-+-+-+-+| Type = 24 |0|0|0|0|0|0|0|0| Message Length |+-+-+-+-+-+-+-+-+-+-+-+-+-+-+-+-+-+-+-+-+-+-+-+-+-+-+-+-+-+-+-+-+: Pool Handle Parameter :+-+-+-+-+-+-+-+-+-+-+-+-+-+-+-+-+-+-+-+-+-+-+-+-+-+-+-+-+-+-+-+-+: Pool Handle Parameter :+-+-+-+-+-+-+-+-+-+-+-+-+-+-+-+-+-+-+-+-+-+-+-+-+-+-+-+-+-+-+-+-+
Figure D.8: CREATE USR packet definition.
0 1 2 30 1 2 3 4 5 6 7 8 9 0 1 2 3 4 5 6 7 8 9 0 1 2 3 4 5 6 7 8 9 0 1
+-+-+-+-+-+-+-+-+-+-+-+-+-+-+-+-+-+-+-+-+-+-+-+-+-+-+-+-+-+-+-+-+| Type = 18 |0|0|0|0|0|0|0|0| Message Length = 12 |+-+-+-+-+-+-+-+-+-+-+-+-+-+-+-+-+-+-+-+-+-+-+-+-+-+-+-+-+-+-+-+-+: User Identifier Parameter :+-+-+-+-+-+-+-+-+-+-+-+-+-+-+-+-+-+-+-+-+-+-+-+-+-+-+-+-+-+-+-+-+
Figure D.9: USR JOINING packet definition.
0 1 2 30 1 2 3 4 5 6 7 8 9 0 1 2 3 4 5 6 7 8 9 0 1 2 3 4 5 6 7 8 9 0 1
+-+-+-+-+-+-+-+-+-+-+-+-+-+-+-+-+-+-+-+-+-+-+-+-+-+-+-+-+-+-+-+-+| Type = 19 |0|0|0|0|0|0|0|R| Message Length = 12 |+-+-+-+-+-+-+-+-+-+-+-+-+-+-+-+-+-+-+-+-+-+-+-+-+-+-+-+-+-+-+-+-+: User Identifier Parameter :+-+-+-+-+-+-+-+-+-+-+-+-+-+-+-+-+-+-+-+-+-+-+-+-+-+-+-+-+-+-+-+-+
Figure D.10: USR JOINING RES packet definition.
0 1 2 30 1 2 3 4 5 6 7 8 9 0 1 2 3 4 5 6 7 8 9 0 1 2 3 4 5 6 7 8 9 0 1
+-+-+-+-+-+-+-+-+-+-+-+-+-+-+-+-+-+-+-+-+-+-+-+-+-+-+-+-+-+-+-+-+| Type = 22 |0|0|0|0|0|0|0|0| Message Length = 20 |+-+-+-+-+-+-+-+-+-+-+-+-+-+-+-+-+-+-+-+-+-+-+-+-+-+-+-+-+-+-+-+-+: PE Identifier Parameter :+-+-+-+-+-+-+-+-+-+-+-+-+-+-+-+-+-+-+-+-+-+-+-+-+-+-+-+-+-+-+-+-+: User Identifier Parameter :+-+-+-+-+-+-+-+-+-+-+-+-+-+-+-+-+-+-+-+-+-+-+-+-+-+-+-+-+-+-+-+-+
Figure D.11: USR MIG packet definition.
103

Appendix EDefinitions of the added ENRP packets
This chapter will define the three added packets to the ENRP, discussed in section 9.3 on page 44.
0 1 2 30 1 2 3 4 5 6 7 8 9 0 1 2 3 4 5 6 7 8 9 0 1 2 3 4 5 6 7 8 9 0 1
+-+-+-+-+-+-+-+-+-+-+-+-+-+-+-+-+-+-+-+-+-+-+-+-+-+-+-+-+-+-+-+-+| Type = 11 |0|0|0|0|0|0|0|0| Message Length = 16 |+-+-+-+-+-+-+-+-+-+-+-+-+-+-+-+-+-+-+-+-+-+-+-+-+-+-+-+-+-+-+-+-+| Sending Server’s ID |+-+-+-+-+-+-+-+-+-+-+-+-+-+-+-+-+-+-+-+-+-+-+-+-+-+-+-+-+-+-+-+-+| Receiving Server’s ID |+-+-+-+-+-+-+-+-+-+-+-+-+-+-+-+-+-+-+-+-+-+-+-+-+-+-+-+-+-+-+-+-+
Figure E.1: REQUEST PE packet definition.
0 1 2 30 1 2 3 4 5 6 7 8 9 0 1 2 3 4 5 6 7 8 9 0 1 2 3 4 5 6 7 8 9 0 1
+-+-+-+-+-+-+-+-+-+-+-+-+-+-+-+-+-+-+-+-+-+-+-+-+-+-+-+-+-+-+-+-+| Type = 12 |0|0|0|0|0|0|0|0| Message Length = 20 |+-+-+-+-+-+-+-+-+-+-+-+-+-+-+-+-+-+-+-+-+-+-+-+-+-+-+-+-+-+-+-+-+| Sending Server’s ID |+-+-+-+-+-+-+-+-+-+-+-+-+-+-+-+-+-+-+-+-+-+-+-+-+-+-+-+-+-+-+-+-+| Receiving Server’s ID |+-+-+-+-+-+-+-+-+-+-+-+-+-+-+-+-+-+-+-+-+-+-+-+-+-+-+-+-+-+-+-+-+| Pool Element’s ID |+-+-+-+-+-+-+-+-+-+-+-+-+-+-+-+-+-+-+-+-+-+-+-+-+-+-+-+-+-+-+-+-+
Figure E.2: REQUEST TAKE PE packet definition.
104

APPENDIX E. DEFINITIONS OF THE ADDED ENRP PACKETS
0 1 2 30 1 2 3 4 5 6 7 8 9 0 1 2 3 4 5 6 7 8 9 0 1 2 3 4 5 6 7 8 9 0 1
+-+-+-+-+-+-+-+-+-+-+-+-+-+-+-+-+-+-+-+-+-+-+-+-+-+-+-+-+-+-+-+-+| Type = 13 |0|0|0|0|0|0|0|R| Message Length = 20 |+-+-+-+-+-+-+-+-+-+-+-+-+-+-+-+-+-+-+-+-+-+-+-+-+-+-+-+-+-+-+-+-+| Sending Server’s ID |+-+-+-+-+-+-+-+-+-+-+-+-+-+-+-+-+-+-+-+-+-+-+-+-+-+-+-+-+-+-+-+-+| Receiving Server’s ID |+-+-+-+-+-+-+-+-+-+-+-+-+-+-+-+-+-+-+-+-+-+-+-+-+-+-+-+-+-+-+-+-+| Pool Element’s ID |+-+-+-+-+-+-+-+-+-+-+-+-+-+-+-+-+-+-+-+-+-+-+-+-+-+-+-+-+-+-+-+-+
Figure E.3: PE TAKEOVER RESPONSE packet definition.
105