Embed Size (px)
Citation preview
SERUM IMMUNOGLOBULIN LEVELS IN TYPE 2 DIABETIC
PATIENTS IN KORLE-BU TEACHING HOSPITAL, GHANA
COLLINS PAA KWESI BOTCHEY
(10362582)
THIS THESIS IS SUBMITTED TO THE SCHOOL OF GRADUATE STUDIES,
UNIVERSITY OF GHANA, IN PARTIAL FULFILMENT OF THE
REQUIREMENT FOR THE AWARD OF MASTER OF PHILOSOPHY (M.PHIL)
DEGREE IN CHEMICAL PATHOLOGY
JULY 2014
University of Ghana http://ugspace.ug.edu.ghUniversity of Ghana http://ugspace.ug.edu.gh

ii
DECLARATION
I, Collins Paa Kwesi Botchey, do hereby declare that this thesis, which is being submitted
in fulfillment of the requirements for an M.Phil. Degree in Chemical Pathology is the
result of my own research conducted at the National Diabetic Research and Management
Centre (Korle-Bu) and the Central Laboratory unit of the Korle-Bu Teaching Hospital
(KBTH) under the supervision of Dr. Henry Asare - Anane and Dr. Kwadwo Asamoah
Kusi. References to other people’s work have been duly acknowledged. This thesis
presents results of original research undertaken by me and neither all nor part of this
thesis has been presented for another degree in this institution or elsewhere.
………………………………………… Date:………………
COLLINS PAA KWESI BOTCHEY
(STUDENT)
……………………………………… Date:…………….
DR. HENRY ASARE – ANANE
(SUPERVISOR)
……………………………………………. Date:…………….
DR. KWADWO ASAMOAH KUSI
(SUPERVISOR)
University of Ghana http://ugspace.ug.edu.ghUniversity of Ghana http://ugspace.ug.edu.gh

iii
DEDICATION
To my dear parents Symonds and Mary.
University of Ghana http://ugspace.ug.edu.ghUniversity of Ghana http://ugspace.ug.edu.gh

iv
ACKNOWLEDGEMENT
This work owes its existence to the assistance received from many people. I therefore
wish to register my heartfelt gratitude to all those, who in diverse ways contributed to the
success of this project work.
First and foremost, I would like to thank my supervisors, Dr. Henry Asare - Anane
(Department of Chemical Pathology, University of Ghana Medical School, Korle-Bu)
and Dr. Kwadwo Asamoah Kusi (Department of Immunology, Noguchi Memorial
Institute for Medical Research, University of Ghana), whose earnest supervision,
suggestions and constructive criticism have brought me this far. I am so grateful to them.
I am thankful to the authors and publishers whose works were extremely useful in
carrying out this project.
My special thanks go to the staff of the National Diabetic Management and Research
Center in Korle – Bu who were extremely helpful during collection of samples for the
work. I am also grateful to the staff of the Department of Chemical Pathology, Central
Laboratory and Virology Laboratory (SAHS), Korle – Bu especially Mr. George
Kpentey, Mr. Isaac Boamah and Mr. Bernard Squire for allowing me to run my assays
using their laboratory facilities.
I appreciate the contribution made by the University of Cape Coast, particularly Prof.
Johnson Nyarko Boampong, the head of Biomedical and Forensic Science Department.
To my friends: Kingsley, Anthony, Grace, Catherine, Nannie, Henrietta, Prince, Rachel
and Patrick who have supported me in diverse ways, I say “Merci” and may God bless
you all.
University of Ghana http://ugspace.ug.edu.ghUniversity of Ghana http://ugspace.ug.edu.gh
v
ABSTRACT
The incidence of type 2 diabetes is on the increase and on-going research suggests that
the increased concentrations of some circulating immunoglobulins among type 2 diabetic
patients may be non-specific signs of the development of diabetic complications.
Immunoglobulins, of which the most abundant are IgA, IgG and IgM, play an essential
role in the body’s immune system by assisting in destroying foreign substances when
they invade the body. Elevated immunoglobulin levels have however been strongly
linked to the development and progression of diabetic complications. The aim of this
study was to investigate serum levels of immunoglobulins (IgA, IgG and IgM) in
Ghanaian type 2 diabetics, and to identify factors that may be associated with the
variation in immunoglobulin levels that may lead to diabetic complications. One hundred
and ninety two (96 type 2 diabetic and 96 non-diabetic) subjects were recruited for the
study. Diabetic subjects were contacted during outpatient clinic appointments at the
National Diabetes Research and Management Centre, Korle-Bu Teaching Hospital.
Matched non-diabetic controls were recruited from the catchment area. The
immunoglobulins (IgA, IgG and IgM) and interleukin 6 (IL-6) concentrations were
measured in subjects sera using commercially available ELISA assays performed
according to manufacturer’s instructions. Blood chemistry, blood pressure, body mass
index and waist circumference of subjects were assessed. Serum IgA (g/L) was higher in
the diabetic than in the non-diabetic subjects (0.89 vs 0.74, p=0.043). Serum IgG (g/L)
was also significantly higher in the diabetic compared with the non-diabetic subjects
(7.58 vs 7.29, p<0.001). The difference in serum IgM between diabetics and the non-
diabetics was not significant. Serum IL-6 (pg/mL) was higher (1.70) in Type 2 diabetic
University of Ghana http://ugspace.ug.edu.ghUniversity of Ghana http://ugspace.ug.edu.gh
vi
subjects than in the non-diabetics (0.99) (p<0.001). The results showed that waist
circumference (WC) and body mass index (BMI) were significantly higher in the
diabetics than in the non-diabetic subjects (p<0.001 in both cases). However, there were
no relationships between the WC and the immunoglobulin levels; and BMI and the
immunoglobulin levels. There was no significant correlation between BMI and IL-6
(p=0.337). Albumin, Low Density Lipoprotein (LDL), Very Low Density Lipoprotein,
and cardiovascular risk (Total Cholesterol / HDL) did not show any significant
association with the immunoglobulin levels. There was association between fasting blood
glucose (FBG) and IgA (p=0.001). FBG was also associated with IL-6 (p=0.025). Serum
IgG levels inversely correlated with glycated haemoglobin (HbA1c) (p=0.036). Serum IL-
6 showed significant correlation with both IgA (p=0.001) and IgM (p=0.003). It can be
concluded that the serum immunoglobulin levels were elevated in the Type 2 diabetic
subjects.
University of Ghana http://ugspace.ug.edu.ghUniversity of Ghana http://ugspace.ug.edu.gh

vii
TABLE OF CONTENTS
DECLARATION ................................................................................................................ ii
DEDICATION ................................................................................................................... iii
ACKNOWLEDGEMENT ................................................................................................. iv
ABSTRACT ........................................................................................................................ v
LIST OF FIGURES ............................................................................................................ x
LIST OF TABLES ............................................................................................................. xi
LIST OF ABBREVIATIONS ........................................................................................... xii
CHAPTER ONE ................................................................................................................. 1
INTRODUCTION .............................................................................................................. 1
1.1. Background .............................................................................................................. 1
1.2. Problem Statement ................................................................................................... 3
1.3. Justification .............................................................................................................. 4
1.4. Hypotheses ............................................................................................................... 5
1.5. Aim of the Study ...................................................................................................... 5
1.6. Specific Objectives ................................................................................................... 5
CHAPTER TWO ................................................................................................................ 6
LITERATURE REVIEW ................................................................................................... 6
2.1. Definition of Diabetes Mellitus ................................................................................ 6
2.2. Classification of Diabetes Mellitus .......................................................................... 7
2.2.1. Type 1 Diabetes Mellitus ................................................................................. 12
2.2.2. Type 2 Diabetes Mellitus ................................................................................. 14
2.2.3. Gestational Diabetes Mellitus .......................................................................... 16
2.3. Prevalence of Diabetes ........................................................................................... 17
2.4. Risk Factors of Type 1 Diabetes ............................................................................ 17
2.5. Risk Factors of Type 2 Diabetes ............................................................................ 18
2.6. Complications of Diabetes ..................................................................................... 18
2.6.1. Microvascular Complications .......................................................................... 19
2.6.2. Macrovascular Disease .................................................................................... 20
2.7. Immunoglobulins ................................................................................................... 20
2.7.1. Immunoglobulin A .......................................................................................... 22
University of Ghana http://ugspace.ug.edu.ghUniversity of Ghana http://ugspace.ug.edu.gh

viii
2.7.2. Immunoglobulin G .......................................................................................... 22
2.7.3. Immunoglobulin M .......................................................................................... 23
2.8. Immunoglobulins Associated with Diabetes Mellitus ........................................... 23
2.9. Interleukin 6 and Diabetes Mellitus ....................................................................... 24
CHAPTER THREE .......................................................................................................... 25
MATERIALS AND METHODS ...................................................................................... 25
3.1. Study Area and Population ..................................................................................... 25
3.2. Target Population ............................................................................................... 25
3.3. Study Design .......................................................................................................... 26
3.4. Sample Size Determination .................................................................................... 26
3.5. Inclusion and Exclusion Criteria ............................................................................ 27
3.5.1. Inclusion Criteria ............................................................................................. 27
3.5.2. Exclusion Criteria ............................................................................................ 27
3.6. Ethical Issues .......................................................................................................... 28
3.7. Sampling and Sample Collection ........................................................................... 28
3.7.1. Specimen Collection, Transport and Storage .................................................. 28
3.7.2. Anthropometric Measurements ....................................................................... 28
3.7.3. Blood Pressure ................................................................................................. 29
3.8. Biochemical Analysis ............................................................................................. 29
3.8.1. Measurement of Immunoglobulin A ............................................................... 29
3.8.2. Measurement of Immunoglobulin G ............................................................... 31
3.8.3. Measurement of Immunoglobulin M ............................................................... 33
3.8.4. Measurement of Interleukin 6 .......................................................................... 34
3.8.5. Measurement of Glucose ................................................................................. 36
3.8.6. Measurement of Total Cholestral (T. CHOL) ................................................. 37
3.8.7. Measurement of Triglyceride (TRIG) ............................................................. 38
3.8.8. Measurement of High Density Lipoprotein (HDL) ......................................... 39
3.8.9. Measurement of Serum Albumin (ALB) ......................................................... 40
3.8.10. Measurement of Total Protein (TP) ............................................................ 41
3.8.11. Measurement of Glycated Haemoglobin (HbA1c) ...................................... 42
3.8.12. Determination of Total Haemoglobin ............................................................ 42
University of Ghana http://ugspace.ug.edu.ghUniversity of Ghana http://ugspace.ug.edu.gh
ix
3.8. Data Handling ........................................................................................................ 43
3.8. Statistical Analysis ................................................................................................. 44
CHAPTER FOUR ............................................................................................................. 45
RESULTS ......................................................................................................................... 45
4.1. General Characteristics and Clinical Parameters of the Study Population ............ 45
4.2. Biochemical Parameters of the Study Population .................................................. 47
4.3. Distribution of Serum Immunoglobulin Levels in Type 2 Diabetic Subjects ........ 49
4.4. Immunoglobulin and Interleukin 6 Levels in Diabetic and Non- diabetic Subjects.
....................................................................................................................................... 50
4.5. Association of Immunoglobulin and Interleukin 6 Levels with General
Characteristics and Clinical Parameters of Type 2 Diabetic Subjects .......................... 52
4.6. Association of Immunoglobulin and Interleukin 6 Levels with Biochemical Indices
of the Diabetic Subjects................................................................................................. 54
CHAPTER FIVE .............................................................................................................. 57
DISCUSSION ................................................................................................................... 57
5.1. Conclusion .............................................................................................................. 61
5.2. Recommendations .................................................................................................. 62
5.3. Limitations ............................................................................................................. 62
REFERENCES ................................................................................................................. 63
APPENDICES .................................................................................................................. 88
APPENDIX A: ETHICAL APPROVAL.......................................................................... 88
APPENDIX B: INFORMED CONSENT FORM ............................................................ 89
APPENDIX C: STUDY QUESTIONNAIRE – DATA SHEET ...................................... 92
APPENDIX D: MANN-WHITNEY U-TEST FOR MEDIAN COMPARISON ............. 96
APPENDIX E: DRUGS TAKEN BY SUBJECTS WHO ARE HYPERTENSIVE ........ 97
University of Ghana http://ugspace.ug.edu.ghUniversity of Ghana http://ugspace.ug.edu.gh
x
LIST OF FIGURES
Page
Fig. 1: Frequency distribution of type 2 diabetic subjects at various
duration of diabetes 47
Fig. 2: Proportion of type 2 diabetic subjects at various categorized
serum immunoglobulin levels 50
University of Ghana http://ugspace.ug.edu.ghUniversity of Ghana http://ugspace.ug.edu.gh
xi
LIST OF TABLES
Page
TABLE 1: Demographic information and clinical parameters of the study
population 46
TABLE 2: Biochemical parameters of the study population 48
TABLE 3: Immunoglobulin and IL-6 levels in type 2 diabetic subjects
compared with non-diabetic controls 51
TABLE 4: Correlation of immunoglobulins and interleukin-6 levels
with general characteristics and clinical parameters of diabetic
subjects 53
TABLE 5: Correlation of immunoglobulins and interleukin-6 levels
with biochemical parameters of diabetic subjects 55
TABLE 6: Correlation between interleukin-6 and immunoglobulin levels of
diabetic subjects 56
University of Ghana http://ugspace.ug.edu.ghUniversity of Ghana http://ugspace.ug.edu.gh
xii
LIST OF ABBREVIATIONS
ADA……………………………………………………...American Diabetes Association
ALB…………………………………………………………..…….………....…Albumin
β-cell……………………………………………………………………….………beta cell
BCG…………………………………………………………………....Bromocresol Green
BMI…………………………………………………………….………Body Mass Index
BP…………………………………………………………………………..Blood Pressure
cm………………………………………………………………………………..centimeter
CDC……………………………………………………………Centre for Disease Control
DBP………………………………………………………………Diastolic Blood Pressure
DHT………………………………………………………….……..…Dihydrotestosterone
DM………………………………………………………………………Diabetes Mellitus
EDTA………………………………………………….Ethylene diamine tetra-acetic acid
FBG……………………………………………………………..…Fasting Blood Glucose
FDA………………………………………………………..Food and Drug Administration
Fig…………………………………………………………………………………..Figure
GDM………………………………………………………..Gestational Diabetes Mellitus
g/L……………………………………………………………………… Gram per liter
University of Ghana http://ugspace.ug.edu.ghUniversity of Ghana http://ugspace.ug.edu.gh

xiii
GLU…………………………………………………..………………………….Glucose
GMP…………………………………………………..……….Guanosine monophosphate
HbA1c……………………………………………………………...Glycated haemoglobin
HDL……………………………………………………………..High Density Lipoprotein
HRP………………………………………………………………..Horseradish Peroxidase
IDA…………………………………………………….International Diabetes Association
IgA……………………………………………………………………Immunoglobulin A
IgG……………………………………………………………………Immunoglobulin G
IgM……………………………………………………………………Immunoglobulin M
IL-6…………………………………………..………………………………..Interleukin 6
Kg/m2………………………………………………………….Kilogram per meter square
LDL…………………………………………………………...…Low Density Lipoprotein
MetS………………………………………………………………….Metabolic Syndrome
mL......…………………………………………………………………………...Milliliters
mmol/L…………………………………………………………………Millimole per liter
NDMRC……………………………National Diabetes Management and Research Center
oC………………………………………………………………………..…Degree Celsius
University of Ghana http://ugspace.ug.edu.ghUniversity of Ghana http://ugspace.ug.edu.gh
xiv
%...........................................................................................................................Percentage
OD………………………………………………………………………….Optical Density
PBS……………………………………………………………Phosphate Buffered Saline
SD…………………………………………………………………….Standard Deviation
SBP……………………………………………………………….Systolic Blood Pressure
TBS………………………………………………………………….Tris-Buffered Saline
T.Chol……………………………………………………….…...………Total Cholesterol
TG………………………………………………………......………….…….Triglyceride
TMB…………………………………………………..3, 3’, 5, 5’, - tetramethyl benzidine
T.Prot……………………………………………………….……………….Total Protein
UK…………………………………………………………………….….United Kingdom
VLDL-C…………………………………………………..Very Low Density Lipoprotein
Vs…………………………………………………………...……………………….Versus
WC…………………………………………………………….……Waist Circumference
WHO……………………………………………………..……World Health Organization
µL……………………………………………………………………………....Microliters
>……………………………………………………………………….……..Greater Than
<............................................................................................................................ Less Than
University of Ghana http://ugspace.ug.edu.ghUniversity of Ghana http://ugspace.ug.edu.gh
1
CHAPTER ONE
INTRODUCTION
1.1. Background
Diabetes mellitus is a complex metabolic disorder marked by persistent hyperglycaemia,
resulting from defects in insulin secretion, insulin action or both (WHO, 1999). Majority
of the cases of diabetes fall into two broad categories. Type 1 diabetes which is caused by
an absolute deficiency of insulin secretion and type 2 diabetes mellitus (T2DM), which is
much more prevalent, and is caused by a combination of resistance to insulin action and
inadequate compensatory insulin response.
The changes in human activities and lifestyle over the past century have resulted in a
dramatic rise in the incidence of diabetes throughout the world. According to Dobson
(2000), the incidence of type 2 diabetes has doubled globally over the past three decades.
In the 1950s and 1960s, diabetes prevalence in Ghana was estimated at between 0.2 and
0.4 percent in adults (Amoah, 2002). However, analysis of admissions to the Korle-Bu
Teaching Hospital reveals that diabetes accounts for 6.8 percent of all adult admissions
(Amoah, 2002). With increasing numbers of patients suffering from type 2 diabetes, the
consequent prevalence of complications resulting from chronic inflammation is also
rising. Heart disease and stroke are the leading causes of death in these patients. Patients
with type 2 diabetes are also at risk of nerve damage (neuropathy) and abnormalities in
blood vessels (vascular injuries). Though the causes of type 2 diabetes are unknown, risk
factors such as family history of diabetes, adults over 45 years, being overweight, history
University of Ghana http://ugspace.ug.edu.ghUniversity of Ghana http://ugspace.ug.edu.gh
2
of gestational diabetes, hypertension, stroke and metabolic syndrome are believed to
predispose to the disease (Heather, 2008).
Serum immunoglobulins play a significant role in the body’s defense against pathogens
and their levels are determined routinely in clinical practice to provide key information
on the humoral immune status of patients. There are five classes of immunoglobulins:
immunoglobulins A (IgA), G (IgG), M (IgM), D (IgD) and E (IgE). The major
immunoglobulins based on their abundance and sizes are the IgA, IgG and IgM while the
minor ones are IgD and IgE. IgA protects mucosal surfaces because of its presence in
body secretions. It provides immunity to infant digestive tract because of its presence in
the colostrums. IgG enhances phagocytosis, neutralizing toxins and viruses. It also
protects foetus and new born babies because it crosses the placenta. IgM is the first
antibody produced during an infection and it is effective against microbes and
agglutinating antigens. Determining immunoglobulin levels of populations with
specific disease conditions is important for assessing the extent to which these levels
have changed. Generally, serum immunoglobulin concentrations tend to increase with
age (Gonzalez-Quintela et al., 2008) or exposure to pathogens (antigens) (Shetty, 1993).
Earlier studies have also reported increase in serum immunoglobulin A levels in type 2
diabetics (Gonzalez-Quintela et al., 2008; Ardawi et al., 1994) However, the variations
and relationships between the major immunoglobulin (IgA, IgG and IgM) levels in type 2
diabetics, the most prevalent form of diabetes, are not completely understood.
Interleukin 6 (IL-6) is a cytokine produced by many different cell types such as immune
cells and adipose tissue. It plays an important role in the mediation of inflammatory
University of Ghana http://ugspace.ug.edu.ghUniversity of Ghana http://ugspace.ug.edu.gh
3
responses (Orban et al., 1999). It is also involved in the development and acceleration of
microvascular complications in patients with diabetes (Wegner et al., 2013).
Many other pro-inflammatory cytokines such as IL-12 and TNF-α are linked with
inflammatory reaction and were shown to increase the risk of T2DM (Hu et al., 2004;
Schmidt et al., 1999). These pro-inflammatory cytokines can enhance insulin resistance
directly in adipocytes, muscle and hepatic cells, leading to systemic disruption of insulin
sensitivity and impaired glucose homeostasis (Pickup and Crook, 1998; Hu et al., 2004;
Schmidt et al., 1999). Inflammation is considered a key regulator of pathogenesis of
T2DM especially in the development of complications as a result of physiological and
cellular activities, but what triggers this inflammation is still unknown (Pickup and
Crook, 1998). An experiment performed using rats showed that IL-6 induced a dose-
dependent inhibition of glucose–stimulated insulin release from rat pancreatic islets of
Langerhans (Southern et al., 1990). If diabetes which is a disorder of insulin deficiency
or impaired effectiveness of insulin action, and interleukin 6 is known to inhibit glucose
stimulated insulin release, then interleukin 6 is an important cytokine that needs to be
thoroughly investigated.
1.2. Problem Statement
The incidence of type 2 diabetes in Ghana is increasing at an alarming rate (Amoah,
2002). The high prevalence of type 2 diabetes among Ghanaian adults leads to high
morbidity and low socio-economic activities. This has been a high health-burden to the
nation in terms of health care management.
University of Ghana http://ugspace.ug.edu.ghUniversity of Ghana http://ugspace.ug.edu.gh

4
It is known that diabetes increases susceptibility to various infections (Heather, 2008).
Therefore, people with type 2 diabetes are more susceptible to developing infections than
non-diabetics since their immune system is likely to become weakened.
Changes in immunoglobulin levels may be implicated in diabetic complications and this
further reduces productivity and may even increase mortality rates (Rodriguez-Segade et
al., 1996).
1.3. Justification
Changes in immunoglobulin levels may be implicated in the susceptibility to infection
and diabetic complications. However, changes in immunoglobulin and cytokine levels in
type 2 diabetes mellitus are not fully understood. Studies in Spain have shown that
increased concentrations of some circulating immunoglobulins may be nonspecific signs
of the development of diabetic complications (Rodriguez-Segade et al., 1991; and
Rodriguez-Segade et al., 1996). Elevated levels of some immunoglobulins which may
serve as early signs in the aetiogenesis of diabetic complications have however not been
demonstrated in Ghana. Considering the important role immunoglobulins play in the
body’s immune system, there is the need to elucidate the serum immunoglobulin levels in
type 2 diabetics and their association with diabetic complications such as nephropathy
and hypertension so as to improve the management of the disease. There is lack of data
regarding changes in immunoglobulin concentrations in patients with diabetes mellitus in
Ghana. This work therefore sought to determine the serum immunoglobulins (IgA, IgG
and IgM) levels in type 2 diabetic patients and compare with non-diabetic individuals.
University of Ghana http://ugspace.ug.edu.ghUniversity of Ghana http://ugspace.ug.edu.gh

5
The economic and social costs of diabetes and its management will be lessened for health
care services if these clinical complications can be identified early enough and prevented
or managed.
1.4. Hypotheses
Type 2 diabetes mellitus does not influence levels of serum immunoglobulins IgA, IgG
and IgM as well as Interleukin 6
1.5. Aim of the Study
The aim of this study was to investigate serum levels of immunoglobulins (IgA, IgG and
IgM) and interleukin 6 in Ghanaians with type 2 diabetes.
1.6. Specific Objectives
1. To investigate the associations between immunoglobulins (IgA, IgG and IgM)
and interleukin 6 levels and the general (demographic and clinical) characteristics
of the study population.
2. To assess the relationship between biochemical indices (fasting blood glucose,
fasting lipids, total proteins and albumin) and serum immunoglobulin levels in the
study population.
3. To investigate the association between serum immunoglobulin levels and
interleukin 6 in the study population.
University of Ghana http://ugspace.ug.edu.ghUniversity of Ghana http://ugspace.ug.edu.gh
6
CHAPTER TWO
LITERATURE REVIEW
2.1. Definition of Diabetes Mellitus
Diabetes mellitus is a complex metabolic disorder caused by defects in insulin secretion,
or action or both (WHO, 1999). It is characterized by hyperglycemia which is often
accompanied by excessive thirst, polyuria and polyphagia (Celik and Zimmet, 2001). A
range of biochemical aberrations are present in diabetes mellitus, but the fundamental
defects to which most of the abnormalities can be traced are reduced entry of glucose into
various “peripherial” tissues (insulin resistance) and increased release of glucose into the
general circulation from the liver (gluconeogenesis and glycogenolysis) (Knop et al.,
2007). These events culminate in high level of plasma glucose (hyperglycaemia) with the
cells “starving” due to low level of intracellular glucose. In diabetes therefore, the body
tissues have to metabolize protein and fat reserve for energy (Rizza, 2010).
Besides carbohydrate dysmetabolism, diabetes is also associated with aberration in
protein and lipid metabolism. In diabetes, amino acids catabolism increases, with the
liver converting amino acids into glucose under stimulation of glucagon (Knop et al.,
2007). The principal abnormalities of fat metabolism in diabetes are acceleration of lipid
catabolism, with increased formation of ketone bodies, and decreased synthesis of fatty
acids and triglycerides (Mazzone et al., 2008).
University of Ghana http://ugspace.ug.edu.ghUniversity of Ghana http://ugspace.ug.edu.gh
7
2.2. Classification of Diabetes Mellitus
There are three main types of diabetes mellitus. These are type 1 (T1DM), type 2
(T2DM) and gestational diabetes mellitus (GDM). Prior to the late 1970s, there was no
consensus on the diagnostic criteria for diabetes. This led to much confusion and
precluded any meaningful comparison of the prevalence of diabetes within or between
populations. As noted by West (West, 1975), diabetologists classified as normal more
than half of the one and two-hour values of glucose tolerance test considered to be
abnormal by other well-qualified diabetologists. The first expert report on the criteria for
the diagnosis of diabetes presented by the WHO in 1965, were subsequently modified
and simplified by the WHO and the National Diabetes Group in the United States in
1979, 1980 and 1985 (World Health Organisation, 1980, 1985). The 1980 WHO Expert
Committee proposed two major classes of diabetes mellitus, referred to as insulin-
dependent diabetes mellitus (IDDM) or type 1 and non-insulin-dependent diabetes
mellitus (NIDDM) or type 2. In the 1985 Study Group Report, the terms type 1 and type
2 were omitted but the classes IDDM and NIDDM were retained, and a class,
Malnutrition Related Diabetes Mellitus (MRDM) was introduced. In both the 1980 and
1985 reports, other classes of diabetes mellitus included “other types” and impaired
glucose tolerance (IGT) as well as gestational diabetes mellitus (GDM) (Alberti and
Zimmet, 1998; World Health Organization, 1980, 1985).
An amendment of classification of diabetes based on both clinical stages and
aetiopathogenesis of diabetes mellitus and other categories of hyperglycaemia was
proposed (Kuzuya and Matsuda, 1997). It was argued that the terms “insulin-dependent
diabetes mellitus” and “non-insulin-dependent diabetes mellitus” and their acronyms
University of Ghana http://ugspace.ug.edu.ghUniversity of Ghana http://ugspace.ug.edu.gh
8
“IDDM” and “NIDDM”, should no longer be used; these terms were confusing and often
resulted in patients being classified based on treatment rather than on pathogenesis.
Therefore, terms type 1 and type 2 were reintroduced. The diabetes class named type 1
encompasses those cases attributable to an autoimmune process, as well as those with
beta-cell destruction and who are prone to ketoacidosis for which neither the aetiology
nor pathogenesis is known (idiopathic). It does not include those forms of beta-cell
destruction of failure to which specific causes can be assigned such as cystic fibrosis,
mitochondrial defects, etc. The type named type 2 includes the common major form of
diabetes mellitus which results from defect(s) in insulin secretion, almost always with a
major contribution from insulin resistance (Kuzuya & Matsuda, 1997).
The evidence for, and characteristics of, diabetes mellitus seen in undernourished
populations was reviewed in a subsequent international workshop (Hoet et al., 1997;
Tripathy and Samal, 1997). Whilst it appeared that malnutrition may influence the
expression of several types of diabetes, the evidence that diabetes mellitus can be caused
by malnutrition or protein deficiency per se was not convincing. Therefore it was
recommended that the class, “malnutrition-related diabetes mellitus” (MRDM) be
removed. The former subtype of MRDM, protein-deficient pancreatic diabetes, may be
considered as malnutrition modulated or modified form of diabetes mellitus for which
more studies were needed. The other former subtype of MRDM, fibrocalculous
pancreatic diabetes, is now classified as a disease of the exocrine pancrease,
fibrocalculous pancreatopathy, which may lead to diabetes mellitus (The Committee of
the Japan Diabetes Society on the Diagnostic Criteria of Diabetes, 2010). The class
“impaired glucose tolerance (IGT)” is now classified as a stage of impaired glucose
University of Ghana http://ugspace.ug.edu.ghUniversity of Ghana http://ugspace.ug.edu.gh
9
regulation, since it can be observed in any hyperglycaemic disorder and is itself not
diabetes. A clinical stage of impaired fasting glycaemia (IFG) was introduced to classify
individuals whose fasting glucose values were above the normal range but below those
diagnostic of diabetes mellitus.
GDM was retained but now encompasses the group formerly classified as gestational
impaired glucose tolerance and gestational diabetes mellitus. Thus the new classification
system identifies four major types of diabetes mellitus; type 1, type 2, “other specific
types” and GDM (Alberti & Zimmet, 1998).
GDM is carbohydrate intolerance resulting in hyperglycaemia of variable severity with
onset or first recognition during pregnancy. It does not exclude the possibility that the
glucose intolerance may occur before pregnancy, but has been previously unrecognized.
The definition applies irrespective of whether or not insulin is used for treatment or the
condition persists after pregnancy (Reece et al., 2010). Individuals at high risk for
gestational diabetes include older women, those with previous history of glucose
intolerance, those with history of large for gestational age babies, women from certain
high risk ethnic group, and any pregnant woman who has elevated fasting or casual blood
glucose levels (Xiang et al., 2010). It may be appropriate to screen pregnant women
belonging to high–risk populations during the first trimester of pregnancy in order to
detect previously undiagnosed diabetes mellitus. Formal systematic testing for gestational
diabetes is usually done between 24 and 28 weeks of gestation (Reece et al., 2010).
The aetiological classification of diabetes mellitus refers to physiological processes,
defects or disorders which often result in chronic hyperglycaemia. The main aetiological
University of Ghana http://ugspace.ug.edu.ghUniversity of Ghana http://ugspace.ug.edu.gh
10
classes of diabetes mellitus are type 1 idiopathic diabetes mellitus, type 2 diabetes
mellitus (T2DM) and “other types” diabetes mellitus. However the major classes of
diabetes mellitus are the type 1 and type 2. Type 2 diabetes comprises approximately 90-
95% of all cases of diagnosed diabetes mellitus, whilst type 1 comprises about 5-10%
(Alberti and Zimmet, 1998; American Diabetes Association, 2012). In both sub-classes of
type 1 diabetes mellitus there is absolute deficiency of insulin. The onset of symptoms is
abrupt. Insulin is often required for survival to prevent the development of ketoacidosis,
coma and death (The Committee of the Japan Diabetes Society on the Diagnostic Criteria
of Diabetes, 2010).
Autoimmune TIDM results from an inflammatory autoimmune and T-cell-mediated
destruction of the insulin-producing beta cells of the pancreas, usually leading to absolute
insulin deficiency. Insulin resistance does not play a major role in its pathogenesis
(American Diabetes Association, 2012). Majority of these individuals are lean, young and
with autoimmune markers associated with diabetes mellitus and most of them have
susceptibility. The human leukocyte antigen (HLA) haplotypes with linkage to the Major
Histocompatibility Complex (MHC) Class II genes DQA, DQB and DRB (Pociot et al.,
2010) are responsible for regulation of immune system in humans. Individuals with this
subclass of diabetes mellitus often become dependent on insulin for survival eventually
and are at risk for ketoacidosis (Polychronakos and Li, 2011). At this stage of the disease
there is little or no insulin secretion as manifested by low or undetectable levels of
plasma C-peptide. The rate of destruction of beta-cells is quite variable, being rapid in
some individuals and slow in others (Alberti and Zimmet, 1998). The rapidly progressive
form is commonly observed in children, but also may occur in adults (American Diabetes
University of Ghana http://ugspace.ug.edu.ghUniversity of Ghana http://ugspace.ug.edu.gh
11
Association, 2012). The slowly progressive form generally occurs in adults and is
sometimes referred to as latent autoimmune diabetes in adults (LADA). A number of
patients, particularly children and adolescents, may present with unprovoked ketoacidosis
as the first manifestation of the disease (The Committee of the Japan Diabetes Society on
the Diagnostic Criteria of Diabetes, 2010). Others have modest fasting hyperglycaemia
that can rapidly change to severe hyperglycaemia and/or ketoacidosis in the presence of
infection or other stress. Still others, particularly adults, may retain residual beta-call
function, sufficient to prevent ketoacidosis, for many years (Alberti & Zimmet, 1998).
Idiopathic TIDM is a subclass of TIDM with an unknown aetiology, but it is likely
related to insulin resistance and transient B-cell dysfunction, perhaps because of glucose
desensitization (Giugliano et al., 2008). Patients with idiopathic T1DM have permanent
insulinopenia, and they are prone to ketoacidosis, but have no evidence of autoimmunity
and it is not HLA associated (Polychronakos and Li, 2011). Idiopathic T1DM has been
described mostly in African-Americans and Asians as well as other ethnic groups (Pociot
et al., 2010). In most patients with idiopathic T1DM, insulin therapy is better in terms of
glycaemic control than either oral hypoglycaemic agents or diet therapy alone and that
long-term glycaemic control is better maintained with insulin treatment (American
Diabetes Association, 2012).
T2DM refers to a condition of chronic hyperglycaemia as a result of insulin resistance
with a background of gradual beta-cell destruction. Insulin levels may be normal,
decreased or increased. There are two identifiable defects in T2DM. There is
predominantly insulin resistance, which is decreased ability of insulin to act on peripheral
tissues (McFarlane et al., 2001). Thus initially, and usually throughout their lifetime,
University of Ghana http://ugspace.ug.edu.ghUniversity of Ghana http://ugspace.ug.edu.gh
12
these individuals may not need insulin treatment for survival. There may also be
predominantly impaired insulin secretion due to B-cell dysfunction. However insulin
resistance is the primary defect, preceding the derangement in insulin secretion and
clinical diabetes by about 20 years (Giugliano et al., 2008). The specific aetiologies of
this class of diabetes mellitus are unknown, however autoimmune destruction B-cells of
the pancreas does not occur and patients do not have other known specific causes of
diabetes mellitus listed under “other specific types” diabetes mellitus.
2.2.1. Type 1 Diabetes Mellitus
Type 1 diabetes is caused by an absolute deficiency of insulin and develops when the
body’s immune system destroys the insulin-producing pancreatic beta cells. In Africa, the
presence of atypical forms of diabetes makes it difficult to classify patients, based on
usual clinical criteria, as having T1DM and T2DM (Perret et al., 1996; Perret and
Nguemby-Mbina, 1991). This typical form of diabetes has been suggested by the
‘accelerator hypothesis’ to be overlay, rather than overlap, between TIDM and T2DM;
implying that T1DM and T2DM may share some common aetiologies (Wilkin, 2001).
The difficulty in classifying and diagnosing some forms of diabetes in Africa may
explain why approximately half (42-64%) of Africa patients initially treated with insulin
do not have classical T1DM and may enter prolonged remission (Li et al., 2004;
McFarlane et al., 2001). It is widely believed that classical T1DM is less common in
Africa than in Europe or North America, and this is certainly common clinical
experience. However, early out-of-hospital mortality may confound this impression, and
the question remains open (Gill et al., 2009).
University of Ghana http://ugspace.ug.edu.ghUniversity of Ghana http://ugspace.ug.edu.gh

13
Epidemiology studies of T1DM in sub-Saharan Africa are difficult to conduct because of
problems in finding cases as well as enumeration of the background population; few
reports are available in literature (Motala et al., 2008). In published studies, prevalence of
T1DM is low: 0.33 per 1000 in Nigerian and 0.95 per 1000 in Sudanese school children
(Majaliwa et al., 2008). Incidence of T1DM has been reported to be as low as 1.5 per
100,000 per year in Tanzania and high as 10.1 per 100,000 per year Sudan (Motala,
2002). This large difference could be attributable to methodological discrepancies
between studies, or true ethnic dissimilarities, because Tanzanian people are
predominantly of Africa origin, whereas Sudanese populations are of mixed Arab and
African heritage. However, the prevalence of T1DM is lower than that of western
countries (Mbanya et al., 2010).
Finding of clinical studies from South Africa, Tanzania and Ethiopia suggest that the
characteristics of T1DM in people from sub-Saharan Africa differ from typical European
populations (Mbanya et. al., 2010). Unsurprisingly, insulinopenia is a prominent feature
(Motala et al., 2008). However, the age at onset in African communities (age 22-29
years) is about 10 years later than in populations from Europe, with peak age at onset of
15-19 years in Tanzania, 22-23 years or 21-30 years in South Africa, and 20-25 years in
Ethiopia (Motala et al., 2008). A female preponderance was reported in affected people
from South Africa, Ehiopia, Sudan, Nigeria, and Libya (Majaliwa et al., 2008).
University of Ghana http://ugspace.ug.edu.ghUniversity of Ghana http://ugspace.ug.edu.gh
14
2.2.2. Type 2 Diabetes Mellitus
Insulin resistance is a primary pathological feature of type 2 diabetes and predates the
onset of this diabetes. Insulin resistance and/or impaired glucose tolerance are also part of
the metabolic syndrome which comprises of abnormal serum lipid profile, central obesity
and hypertension (WHO, 1999). The authors indicated that type 2 diabetes is a
heterogeneous disorder that results from an interaction between a genetic predisposition
and environmental factors and accounts for around 90% of all cases of diabetes. Most
patients with this form of diabetes are obese and in most cases the disease is diagnosed in
those over 40 years old (Jonsson, 2002). Obesity itself causes some degree of insulin
resistance. However, the demographics of this disease are changing, and it is now
becoming increasingly common in children and young adults (American Diabetes
Association, 2000). Type 2 diabetes has a gradual and insidious onset, with nearly a third
of the cases being identified as an incidental finding or in the coronary care unit
(Melmberg et al., 1995). This form of diabetes frequently goes undiagnosed for many
years because the hyperglycemia develops gradually and at earlier stages it is often not
severe enough for the patient to notice any of the classic symptoms of diabetes (American
Diabetes Association, 2011). The incidence of type 2 diabetes increases with age, with
most cases diagnosed after the age of 40 years (Centers for Disease Control and
Prevention, 2011). The prevalence of diabetes is increasing rapidly. The World Health
Organization (2003) has predicted that by 2030 the number of adults with diabetes will
have almost doubted worldwide, from 177 million in 2000 to 370 million. It was also
projected that 221 million people will be diabetic in 2010 and 324 million by 2025
(Zimmet et al., 2001). According to Pratley and Weyer (2001), abnormalities in beta cell
function are found early in the natural history of type 2 diabetes and in first degree
University of Ghana http://ugspace.ug.edu.ghUniversity of Ghana http://ugspace.ug.edu.gh
15
relatives of people with type 2 diabetes, suggesting that they are an integral component of
pathogenesis of type 2 diabetes.
Most of the studies done between 1960s and early 1980s reported the prevalence of
T2DM, using urine analysis in localized settings in countries such as Ethiopia, Ghana,
Lesotho, Uganda and Malawi, to be lower than 1%; except the prevalence in South Africa
(0.6 – 3.6%) and Cote d’Ivoire (5.7%) (McLarty et al.,1990). However, T2DM is
presently the most common form of diabetes in sub-Saharan Africa, similar to other
regions of the world. Most of the available, albeit still scarce, data for diabetes prevalence
in sub-Saharan Africa are based on standardized 1985 WHO criteria (World Health
Organization, 1985), with several reports from west, east and northeast Africa, and South
Africa (Mbanya et al., 2010; McLarty et al., 1990). These published data show that,
contrary to previous notion, diabetes is not rare in sub-Saharan Africa. Although rates of
less than 3% have been recorded in rural and urban communities in west and east Africa,
frequencies of 3-10% are noted in urban and peri-urban populations in South Africa and
in Sudanese communities of Africa origin, comparable with rates in developed countries
(Motala, 2002; Motala et al., 2008).
Few epidemiological studies in sub-Saharan Africa have been published in which
1998/2003 American Diabetes Association (American Diabetes Association, 2012) and
1998 WHO (Alberti and Zimmet, 1998) criteria were used to determine the prevalence of
diabetes. The prevalence of diabetes ranges from 3.9% in rural South Africa to 6.7% in
urban Guinea (Mbanya et al., 2010). Although low diabetes prevalence has been noted in
some rural and urban populations. The high prevalence reported in people from urban
University of Ghana http://ugspace.ug.edu.ghUniversity of Ghana http://ugspace.ug.edu.gh
16
areas of Kenya (Christensen et al., 2009) could be attributable to non-probability
sampling in that study, so these results should be interpreted with caution.
The WHO Stepwise chronic disease risk factor surveillance programme (STEPS)
undertaken in many Africa countries aims to clarify the burden of diabetes in sub-
Saharan Africa. Reported prevalence varies widely (Benin 3%; Mauritania 6%;
Cameroon 6.1%; Congo 7.1%; Zimbabwe 10.2%; Democratic Republic of Congo 14.5%)
(Motala et al., 2008). In most of these studies, diagnosis is based on fasting blood glucose
concentration, measured in either capillary whole blood or venous plasma. The high rates
noted in some studies are inconsistent with other reports in indigenous African people.
Whether this inconsistency is an indication of a sudden upsurge of diabetes in sub-
Saharan Africa or is related to study methods (sampling strategy, true fasting blood
samples) needs further assessment (Mbanya et al., 2010).
2.2.3. Gestational Diabetes Mellitus
Gestational diabetes mellitus (GDM) is defined as any degree of glucose intolerance with
onset or first recognition during pregnancy (Ross, 2006). Risk factors for developing
GDM are: a previous diagnosis of gestational or prediabetes, impaired fasting glycaemia,
a family history revealing a first degree relative with Type 2 diabetes, maternal age,
ethnic background, being overweight and a history of previous pregnancy which resulted
in a child with a high birth weight >4kg (Ross, 2006). Maternal obesity increases the risk
of a number of other pregnancy complications, including preeclampsia and Caesarean
delivery (Leddy et al., 2008).
University of Ghana http://ugspace.ug.edu.ghUniversity of Ghana http://ugspace.ug.edu.gh
17
2.3. Prevalence of Diabetes
According to estimates of diabetes mellitus in Africa, the 2010 diabetes mellitus national
prevalence for Ghana was 3.6 % (International Diabetes Federation, 2010). However, in
an independent community-based diabetes prevalence study in Greater Accra-Ghana,
Amoah et al. (2002) determined the crude prevalence of diabetes to be 6.3 %. Their
findings indicated that diabetes was more common in males (7.7 %) than females (5.5%)
and increased with age. In the United States, 11.3 % of people aged 20 years and above
have diabetes (Center for Disease Control and Prevention, 2011). The incidence of type 1
diabetes as well as the prevalence of type 2 diabetes is increasing in the developed and
developing world. In adults, type 1 diabetes accounts for approximately 5 % of all
diagnosed cases of diabetes according to Center for Disease Control and Prevention
(2011). Gestational diabetes mellitus occurs in about 2 - 5 % of all pregnancies and may
improve or disappear after delivery.
2.4. Risk Factors of Type 1 Diabetes
The etiology of type 1 diabetes remains poorly understood, but it is likely that an
environmental factor triggers an autoimmune process in a predisposed individual. Thus,
the risk factors for type 1 diabetes may include genetic susceptibility, autoimmunity or
environmental factors. The genetic risk factors are passed on from generation to
generation (inherited). With autoimmune mechanism as a risk factor, the T lymphocytes
(CD4+ and CD8
+) infiltrate the islets of Langerhans in the pancreas and destroy the
insulin-producing beta cell population (Akerblom et al., 2002) and hence are implicated
in the pathogenesis and etiology of the insulin-dependent diabetes mellitus (Nerup and
University of Ghana http://ugspace.ug.edu.ghUniversity of Ghana http://ugspace.ug.edu.gh
18
Lernmark, 1981). Although genetic susceptibility to type 1 diabetes is inherited, only 12-
15 % of type 1 diabetes occurs in families (Akerblom et al., 2002).
2.5. Risk Factors of Type 2 Diabetes
The risk factors in type 2 diabetes are; genetic predisposition, age, obesity, alcohol
intake, history of gestational diabetes and life style. The life style which may pre-dispose
people to type 2 diabetes include; intake of high carbohydrate and fatty foods, alcohol
intake, and lack of physical exercise. Researchers have demonstrated a strong link
between having a large waist circumference (greater than 88 cm for women and greater
than 102 cm for men) and an increased risk of developing Type 2 diabetes, independent
of a person’s body mass index (World Health Organization, 2011; The InterAct
Consortium, 2012). They found out that waist circumference is a simple measure that can
be used to diagnose abdominal obesity and identify individuals at increased risk of Type
2 Diabetes Mellitus (The InterAct Consortium, 2012). Interaction between genetic
predisposition and environmental factors is believed to account for 90.95 % of diabetes
cases (Center for Disease Control and Prevention, 2011).
2.6. Complications of Diabetes
The formation of advanced glycation end products (AGEs) and inflammation are
important biochemical abnormalities that accompany diabetes mellitus. Studies by Basta
et al.(2004) indicate that the effects of AGEs on vessel wall homeostasis may account for
the rapidly progressive atherosclerosis and other complications associated with diabetes
University of Ghana http://ugspace.ug.edu.ghUniversity of Ghana http://ugspace.ug.edu.gh
19
mellitus. Severe long term abnormalities such as eye complications, heart disease, kidney
and foot problems can result if blood glucose levels are poorly controlled in diabetics
(Brophy et al., 2007). With the introduction of treatments that allow patients with
diabetes to live through the acute metabolic consequences of the disease, it has become
evident that diabetes is associated with a number of chronic complications. These
complications are usually of two kinds: microvascular complications - that include
retinopathy, nephropathy, neuropathy and peripheral vascular disorders; and
macrovascular complications that include cardiovascular, cerebrovascular, renal and
nervous disorders (Polidori, 2001; Daneman, 2006). According to Ardawi et al. (1994),
changes in IgA and other immunoglobulins may be implicated in the pathogenesis of
diabetic complications, such as susceptibility to infection. High levels of serum IgA may
affect kidney function. Immunoglobulin IgA nephropathy is the most common
glomerulonephritis and is characterized by deposition of the IgA antibody in glomerulus
(D’Amico, 1987).
2.6.1. Microvascular Complications
Microvascular complications are mostly present ay the diagnosis of patients with type 2
diabetes. Retinopathy and cataracts affect around 15% of individuals with type 2
diabetes and are frequently present at diagnosis (UK Prospective Diabetes Study Group,
1988; American Diabetes Association, 2001). The risk of developing nephropathy is
lower in type 2 diabetes than in type 1 diabetes because of the generally later onset of the
former disorder. The prevalence of microalbuminuria, a higher than normal albumin
excretion that cannot be detected by standard urine reagent strips and a sign of early
University of Ghana http://ugspace.ug.edu.ghUniversity of Ghana http://ugspace.ug.edu.gh
20
diabetic nephropathy is around 25-30%. Approximately, 5-13% of patients with type 2
diabetes have frank proteinuria (American Diabetes Association, 2001). Although, the
individual risk of developing end-stage renal failure is lower in type 2 diabetes, patients
with type 2 diabetes requiring renal replacement therapy outnumber patients with type 1
diabetes because of the much greater prevalence of type 2 diabetes. Neuropathy affects
20-50% of patients with type 2 diabetes, and its sequelae, such as foot ulceration and
amputation, cause consideration morbidity and mortality (Boulton and Malik, 1998).
2.6.2. Macrovascular Disease
Patients with diabetes have a two-fold to four-fold increased risk of having myocardial
infarction and stroke in men and up to a ten-fold increased risk in pre-menopausal women
(American Diabetes Association, 2001) and 60 – 75% of all people with diabetes die
from cardiovascular disease (Neaton et al., 1993). It is thought that increased prevalence
of metabolic syndrome features in people with diabetes largely explains the excess
cardiovascular disease in these patients (Stratton et al., 2000). In the Prospective
Cardiovascular Munster Study, for example, 49% of individuals with diabetes had
hypertension, 24% had a low level of high-density lipoprotein cholesterol and 37% had
hypertrigylceridaemia, compared with values of 31%, 16% and 21% respectively, in
people without diabetes (Assmann and Schulte, 1988).
2.7. Immunoglobulins
Immunoglobulins are glycoprotein molecules that are produced by plasma cells and
plasmablasts in response to immunogens and play essential role in the body's immune
University of Ghana http://ugspace.ug.edu.ghUniversity of Ghana http://ugspace.ug.edu.gh

21
system. They function by attaching themselves to foreign substances, such as bacteria,
and destroy them. There are five classes of immunoglobulins: immunoglobulins A, G, M,
D and E known as IgA, IgG, IgM, IgD and IgE respectively. However, for the purpose of
this study, IgA, IgG and IgM will be considered in the reviewed literature.
The U.S. National Library of Medicine (2012) gives the U.S. ranges of IgA, IgG and IgM
to be 0.76 to 3.90 g/L, 6.50 to 15.00 g/L and 0.40 to 3.45 g/L respectively. However, a
study conducted in Northern Nigeria to determine the levels of circulating immune
complexes, immunoglobulins A, G and M among apparently healthy individuals had
ranges of IgA, IgG and IgM as 0 to 1.91 g/L, 6.58 to 11.63 g/L and 0.18 to 2.37 g/L
respectively (Tanyigna et al., 2004). According to Gonzalez-Quintela et al. (2008), serum
IgA levels are usually higher in males than in females. However, serum IgG and serum
IgM levels are higher in females than in males and Serum IgA and IgG levels tended to
increase with age, whilst serum IgM showed no significant variation with age.
Deficiencies in the levels of immunoglobulins result in reduction in the humoral defense
system in the body. Immunoglobulin deficiencies are the result of congenital defects
affecting the development and function of B lymphocytes (B-cells). This can happen
when B-cells fail to develop into antibody-producing cells. Since antibodies are essential
in fighting infectious diseases, people with immunoglobulin deficiency syndromes
become sick more often as they are prone to invading microbes such as Streptococci,
Meningococci, Haemophilus influenzae, enterovirus and the hepatitis B virus.
Deficiencies of IgA are found in hypogammaglobulinemia (Young et al., 2008), X-linked
agammaglobulinemia and Selective IgA deficiency syndrome (Morimoto, 2008). Levels
University of Ghana http://ugspace.ug.edu.ghUniversity of Ghana http://ugspace.ug.edu.gh

22
of IgG are decreased in hypogammaglobulinemia (Young et al., 2008), X-linked
agammaglobulinemia (Morimoto, 2008) and HIV.
Deficiencies of IgA are found in Selective IgM deficiency syndrome (Belgemen et al.,
2009) and X-linked agammaglobulinemia.
2.7.1. Immunoglobulin A
Immunoglobulin A (IgA), according to Shetty (1993) is actively secreted by mucosal
associated lymphoid tissue (MALT). IgA appears selectively in sero-mucus secretions
such as saliva, tears, nasal fluids, colostrums, blood, and in secretions of the lung, genito-
urinary and gastro-intestinal tracts. It is also synthesized locally by plasma cells.
The immunoglobulin IgA is most abundant in body and performs the role of defending
the exposed external surfaces of the body against attack by micro organisms. It functions
by inhibiting the adherence of coated microorganisms to the surface of the mucosal cells,
thereby preventing entry into the body tissues. It contributes to the protection of the
newborn babies by being in abundance in colostrums.
2.7.2. Immunoglobulin G
Immunoglobulin G (IgG) constitutes 75 percent of the total serum immunoglobulins in
humans (Shetty, 1993). Throughout the secondary immune response, IgG is the major
immunoglobulin to be synthesized. It plays a vital role in the defense against infection.
IgG is responsible for the protection of the embryo during the first few months of life
since it is the only immunoglobulin that crosses the placenta. IgG enhances phagocytosis
by attracting macrophages as well as polymorphonuclear phagocytic cells.
University of Ghana http://ugspace.ug.edu.ghUniversity of Ghana http://ugspace.ug.edu.gh
23
2.7.3. Immunoglobulin M
Immunoglobulin M (IgM) is the largest immunoglobulin in size. The IgM antibodies
appear early in response to infection and because of their size, are largely confined to the
blood stream. They are an important defense mechanism against bacteria. The size and
valency of IgM makes it a very effective agglutinating and cytolytic agent as well as the
most efficient complement fixing immunoglobulin. According to Shetty (1993), IgM
predominates in certain antibody responses such as response to the typhoid ‘O’ antigen.
Immunoglobulin M response is short lived, hence its presence may be helpful in
establishing an acute infection.
2.8. Immunoglobulins Associated with Diabetes Mellitus
Studies showed that serum IgA levels increased in diabetic patients (Singh and Kulig,
1992; Gonzalez-Quintela et al., 2008). Handwerger et al. (1980) reported mildly
elevated levels of IgA and mildly decreased IgG levels in insulin-dependent diabetics.
Significant increases in serum IgA and IgG concentrations were observed whereas the
concentration of IgM was significantly decreased in diabetic patients compared with non-
diabetic subjects (Ardawi et al., 1994). They found out that serum IgA concentrations of
diabetic patients were influenced by the degree of glycaemic control. Also Rodriguez-
Segade et al. (1996) confirmed increased concentration of circulating IgA among type 1
and type 2 diabetic patients, with the levels higher in males than in females. They
concluded that serum IgA levels were a non-specific sign of the development of diabetic
complications such as retinopathy, neuropathy, nephropathy, macrovascular disease and
hypertension.
University of Ghana http://ugspace.ug.edu.ghUniversity of Ghana http://ugspace.ug.edu.gh
24
2.9. Interleukin 6 and Diabetes Mellitus
Interleukins are cytokines (secreted proteins and signaling molecules) which largely
affect the function of the immune system. Yudkin et al. (2000) posed this question:
Inflammation, obesity, stress and coronary heart disease: is interleukin the link?
Interleukin 6 (IL-6) plays a central role in inflammation and tissue injury (Ridker et al.,
2000) and acts as both a pro-inflammatory and anti-inflammatory cytokine. It has been
observed that in vitro IL-6 induced a dose-dependent inhibition of the glucose-stimulated
insulin release from rat pancreatic islets of Langerhans (Southern et al., 1990). Sandler et
al. (1990) also found out that IL-6 affects insulin secretion and glucose metabolism of
rats’ pancreatic islets in vitro. Mediators of inflammation such as the IL-6 family of
cytokines have been proposed to be involved in the events causing both type 1 and type 2
diabetes (Kristiansen and Mandrup-Poulsen, 2005). According to Kristiansen and
Mandrup-Poulsen (2005), individuals who develop type 2 diabetes display features of
low-grade inflammation years in advance of disease onset. IL-6 has in addition to its
immunoregulatory actions been proposed to affect glucose homeostasis and metabolism
directly and indirectly by action on skeletal muscle cells, adipocytes, hepatocytes,
pancreatic β-cells, and neuroendocrine cells (Kristiansen and Mandrup-Poulsen, 2005).
According to Harris et al. (1999) stated that elevated IL-6 levels are associated with
mortality in the elderly.
University of Ghana http://ugspace.ug.edu.ghUniversity of Ghana http://ugspace.ug.edu.gh
25
CHAPTER THREE
MATERIALS AND METHODS
3.1. Study Area and Population
The study site was the National Diabetes Management and Research Centre (NDMRC),
Korle-Bu Teaching Hospital. The Korle-Bu Teaching Hospital is a leading tertiary
referral hospital in Accra with 1,600 bed capacity and 3,000 members of staff. The
hospital serves the city of Accra (with a population of about three million) and the whole
of the southern sector of Ghana. At Korle-Bu Teaching Hospital, there is an average daily
out-patient attendance of 1,000 and 100 admissions daily (Personal Communication and
Hospital Records). The Diabetic Clinic of the NDMRC, however, holds over 80,000
patient records, and each day, approximately 160 patients attend the clinic from in and
around the catchment area (NDMRC Records). The clinic manages both type 1 and type
2 diabetic cases, nonetheless, majority of the patients seen are type 2 diabetics reporting
for routine check-up.
3.2. Target Population
The study was carried out on patients diagnosed with type 2 diabetes according to WHO
(1999) criteria undergoing management of their conditions in the out-patient’s clinic at
NDMRC between April to November 2013. A total of 192 subjects including controls
were recruited (96 type 2 diabetic subjects and 96 controls). Subjects who served as
controls were screened to make sure that they were non-diabetic. The selection criteria
for the subjects was based on response to the questionnaire, which were intended to
University of Ghana http://ugspace.ug.edu.ghUniversity of Ghana http://ugspace.ug.edu.gh
26
obtain information on subject’s age, duration of the type 2 diabetes disease and drug
usage.
3.3. Study Design
This was a hospital-based cross-sectional study with matched controls. The study was
intended primarily to investigate immunological alterations associated with type 2
diabetes.
3.4. Sample Size Determination
The minimum sample size was determined by the formula;
N = Z2
(p * q) /e2
(Spiegl & Stephens, 2008)
N = (1.96)2 (0.063) (1-0.063)/(0.05)
2
N = 91
Where Z, 1.96 is the standard score for the confidence interval of 95%;
P, 0.063 is the sample proportion of the 6.3% prevalence of diabetics in Ghana
(International Diabetes Federation, 2010);
e is the minimum allowable error (5% or 0.05).
University of Ghana http://ugspace.ug.edu.ghUniversity of Ghana http://ugspace.ug.edu.gh

27
Based on the formula above, a sample size of 192 was estimated for the study,
comprising 96 subjects with type 2 diabetes and 96 subjects without diabetes allowing for
drop outs.
3.5. Inclusion and Exclusion Criteria
3.5.1. Inclusion Criteria
The subjects recruited for the study were between the ages 35 to 60 years. They included
Diagnosed type 2 diabetic patients on management at the NDMRC. The controls
consisted of non-diabetics within the same age brackets.
3.5.2. Exclusion Criteria
Subjects above 60 and below 35 years as well as smokers and heavy drinkers were
excluded from the study. Patients who were immunosuppressed such as those with
immunoglobulin deficiency syndrome, HIV and Hepatitis B were excluded from the
study. Also those who tested positive for the urine nitrite test or had bacterial and
parasitic infections were excluded from the study. The above have been proven to affect
immunoglobulin levels in subjects (Shetty, 1993; van den Berg et al., 2009; Schmiemann
et al., 2010).
University of Ghana http://ugspace.ug.edu.ghUniversity of Ghana http://ugspace.ug.edu.gh
28
3.6. Ethical Issues
Approval was obtained from Research and Ethical Review Committee of the University
of Ghana Medical School, College of Health Sciences.
3.7. Sampling and Sample Collection
3.7.1. Specimen Collection, Transport and Storage
Fasting venous blood samples (10 mL) were obtained from the subjects between 07:00
and 09:00 hours each day, according to Helsinki protocol declaration (2008). Two
milliliters (2 mL) of whole blood was transferred into sodium fluoride containing tube
and the plasma separated for the estimation of glucose. Three milliliters (3 mL) of whole
blood was transferred into ethylene diamine tetra-acetic acid (EDTA) containing tubes
for the estimation of glycated haemoglobin (HbA1c). The remaining five milliliters (5
mL) of whole blood was then placed into serum separator tubes for processing. Serum
samples were then aliquoted in 1 mL portions into 5 sterile eppendorf tubes and stored at
-20oC until they were required for use.
3.7.2. Anthropometric Measurements
Weight and height of participants were measured using a standardized weighing scale and
a standardized stadiometer respectively after subjects had taken off their footwear. Body
mass index (BMI) was then calculated from body weight (in kilograms) divided by
square of the height (in meters). Waist circumference of subjects were measured at the
navel region, parallel to the hip bone according to WHO (2003) protocol for waist
circumference measurements.
University of Ghana http://ugspace.ug.edu.ghUniversity of Ghana http://ugspace.ug.edu.gh
29
3.7.3. Blood Pressure
Blood pressure (diastolic and systolic) measurements was taken by a qualified nurse from
the left upper arm of subjects in the sitting position (after sitting for at least five minutes)
with the aid of a mercury sphygmomanometer and stethoscope using the auscultation
method.
3.8. Biochemical Analysis
Collected blood samples from each recruited subject according to standardized
venipuncture procedure was transferred into serum separator, EDTA and fluoride tubes
respectively. The blood collected in serum separator tubes were allowed to clot and
serum separated by centrifugation. Enzyme-Linked Immunosorbent assay (ELISA)
technique for the immunoglobulins (IgA, IgG and IgM) and Interleukin 6 using specific
and high affinity antibodies were used to determine their serum levels in the subjects.
Fasting blood glucose, lipid profile, total protein and albumin of the subjects were
analysed using VITROS system auto analyser (version 950). Glycated hemoglobin
(HbA1c) was measured using Randox Daytona auto analyzer. The determination of HbA1c
was based on a latex agglutination inhibition assay.
3.8.1. Measurement of Immunoglobulin A
Principle of the Procedure
The test uses a sandwich ELISA technique and the ELISA kit. The wells contain a pre-
coated human IgA monoclonal antibody and the detecting antibody is polyclonal
University of Ghana http://ugspace.ug.edu.ghUniversity of Ghana http://ugspace.ug.edu.gh
30
antibody with biotin a label. Samples and biotin labeled antibody were added into
ELISA plate wells and washed out with (phosphate buffered saline) PBS or (tris-buffered
saline) TBS. Then Avidin-peroxidase conjugates are added to the ELISA wells. For
coloring, 3, 3’, 5, 5’, - tetramethyl benzidine (TMB) substrate is used after reactant is
thoroughly washed out wit PBS. TMB turns into blue in catalytic peroxidase and finally
turns into yellow under the action of acid. The intensity of colour formed was measured
at 450 nm and the concentration estimated.
Experimental Procedure
Serum samples stored in eppendorf tubes at -20oC were taken out of the refrigerator to
thaw after which each sample was vortexed for 10 seconds. ELISA Kit (MyBiosource –
USA) which was previously stored at 4 o
C in the refrigerator was brought to room
temperature. Hundred microliters (100 µL) of serum test samples and controls, as well as
different concentrations of human IgA pre-prepared standard samples were added to
corresponding wells . A blank well was filled with standard diluent provided. The
reaction wells were sealed with adhesive tapes and incubated in an incubator at 37oC for
90 minutes. The ELISA plates were taken out of the incubator and washed three times in
wash buffer. A volume of 100 µL of Biotinylated human IgA antibody liquid prepared 30
minutes before use, was add to each well. The reaction wells were again sealed with
adhesive tapes and incubated at 37oC for 60 minutes. The ELISA plates were aspirated
three times.
Hundred microliters (100 µL) of enzyme-conjugate liquid prepared 30 minutes before
being used was added to each well except the blank well. The reaction wells were sealed
University of Ghana http://ugspace.ug.edu.ghUniversity of Ghana http://ugspace.ug.edu.gh
31
with adhesive tapes and incubated at 37oC for 30 minutes. The ELISA plate was then
aspirated five times with wash buffer. A volume of 100 µL Colour Reagent liquid was
then added to the individual wells (including the blank well) and incubated in the dark at
370C. Incubation was done for 30 minutes by which colour for high concentration of
standard curve wells had become darker and colour gradient appeared. Hundred
microliters (100 µL) of stop solution was added to all wells to stop the reaction and then
mixed well. The Optical Density (OD) was measured with MULTISKAN MS
Microplate reader vesion 1.5 (USA) at 450nm after 10 minutes.
With the aid of standard curve Serum IgA concentrations of samples were determined
employing Curve Expert 1.3 to analyze and compute the OD results.
3.8.2. Measurement of Immunoglobulin G
Principle of the Procedure
The IgG present in the sample reacts with the anti-IgG antibodies which have been
adsorbed to the surface of polystyrene microtitre wells. After the removal of unbound
proteins by washing in wash buffer, anti-IgG antibodies conjugated with horseradish
peroxidase (HRP), are added. These enzyme-labelled antibodies form complexes with
the previously bound IgG. Following another washing step, the enzyme bound to the
immunosorbent is assayed by the addition of a chromogenic substrate, 3, 3’, 5, 5’ –
tetramethylbenzidine (TMB). The quantity of bound enzyme varies directly with the
concentration of IgG in the sample tested; thus, the absorbance, at 450 nm, is a measure
University of Ghana http://ugspace.ug.edu.ghUniversity of Ghana http://ugspace.ug.edu.gh
32
of the concentration of IgG in the test sample and can be interpolated from the standard
curve constructed from the standards, and corrected for sample dilution.
Experimental Procedure
Serum samples stored at -20oC to be used for IgG determinations were brought to room
temperature and vortexed for 10 seconds. All ELISA reagents to be used were also
brought to room temperature before use. Standard samples of concentrations: 15.6
ng/mL, 31.25 ng/mL, 62.5 ng/mL, 125 ng/mL, 250 ng/mL and 500 ng/mL were prepared
in duplicates according to protocol provided. A 1/80,000 dilution of each test sample and
control sample were prepared according to protocol provided. Hundred microliters (100
µL) of the standards and diluted samples were pipetted into predesignated wells of micro
titre ELISA plates and then incubated at room temperature for sixty minutes. After
incubation the contents were then aspirated.
The wells were then washed in diluted wash solution and aspirated. This was repeated
three times, for a total of four washes. Residual buffer was removed by the use of the
aspirator. A volume of 100 µL of diluted Enzyme-Antibody Conjugate was pipetted and
added to each well. This was followed by incubation at room temperature in the dark for
twenty minutes. The plate was washed four times and 100 µL of TMB substrate solution
was then added to each well. The plate was incubated in the dark at room temperature for
ten 10 minutes. Stop solution (100 µL) was then added to each well.
The absorbance at 450 nm of the contents of each well was determined with
MULTISKAN MS Microplate reader version 1.5 (USA). Serum IgG concentrations of
the samples were determined employing Curve Expert 1.3 to analyze and compute the
University of Ghana http://ugspace.ug.edu.ghUniversity of Ghana http://ugspace.ug.edu.gh
33
OD results. Concentrations obtained were multiplied by the dilution factor of 80,000 to
obtain true serum IgG levels in samples.
3.8.3. Measurement of Immunoglobulin M
Principle of the Procedure
This test follows the same procedure used for measuring IgA. The test employs a
sandwich Elisa technique and the ELISA kit. The wells contain a pre-coated human IgM
monoclonal antibody and the detecting antibody is polyclonal antibody with biotin
labeled. Samples and biotin labeling antibody are added into ELISA plate wells and
washed in PBS. Then Avidin-peroxidase conjugates are added to ELISA wells in order;
TMB substrate is used for coloring after reactant is thoroughly washed in PBS. TMB
turns into blue in the presence of peroxidase catalytic and finally turns yellow in the
presence of acid. The color depths in samples at 450 nm are positively correlated to the
concentrations of IgM.
Experimental Procedure
Serum samples stored at -20oC were brought to room temperature and vortexed for 10
seconds. The ELISA Kit was also brought to room temperature. Hundred microliters (100
µL) each of serum test samples and controls, as well as different concentrations of human
IgA pre-prepared standard samples were added to corresponding wells . A blank well was
filled with standard diluent provided. The reaction wells were sealed with adhesive tapes
and then incubated at 37oC for 90 minutes. The Elisa plates were then taken out of the
incubator and washed three times in wash buffer. A volume of 100 µL of Biotinylated
University of Ghana http://ugspace.ug.edu.ghUniversity of Ghana http://ugspace.ug.edu.gh

34
human IgM antibody liquid prepared 30 minutes before use, was add to each well. The
reaction wells were again sealed with adhesive tapes and incubated in the incubator at
37oC for 60 minutes. The Elisa plates were washed three times.
Hundred microliters (100 µL) of enzyme-conjugate liquid prepared 30 minutes before
being used was added to each well except the blank well. The reaction wells were sealed
with adhesive tapes and incubated in the incubator at 37oC for 30 minutes. The Elisa
plate was then washed five times with wash buffer. A volume of 100 µL Colour Reagent
liquid was then added to the individual wells (including the blank well) and incubated in
a dark incubator at 37oC. Incubation was done for 30minutes by which colour for high
concentration of standard curve wells had become darker and colour gradient appeared.
Hundred microliters (100 µL) stop solution was then added to individual wells (including
the blank well) and then mixed well. The Optical Density (OD) was measured with
MULTISKAN MS Microplate reader vesion 1.5 at 450 nm after 10 minutes.
With the aid of standard curve Serum IgM concentrations of diabetic samples and
controls were determined employing Curve Expert 1.3 to analyze and compute the OD
results.
3.8.4. Measurement of Interleukin 6
Principle of the Procedure
The human IL-6 ELISA test is based on standard sandwich enzyme-linked immune-
sorbent assay technology. Human IL-6 specific –specific monoclonal antibodies are
precoated onto the well plates. The human specific detection polyclonal antibodies are
University of Ghana http://ugspace.ug.edu.ghUniversity of Ghana http://ugspace.ug.edu.gh
35
biotinylated. The test samples and biotinylated detection antibodies are added to the
wells subsequently and followed by washing with prepared wash buffer. Avidin-Biotin-
Peroxidase Complex is added and unbound conjugates are washed away with prepared
wash buffer. HRP substrate TMB is used to visualize HRP enzymatic reaction. TMB is
catalyzed by HRP to produce a blue color product that changes into yellow after adding
acidic stop solution. The intensity of yellow colour is proportional to the human IL-6
amount present in test sample captured in plate.
Experimental Procedure
The serum samples stored in eppendorf tubes at -20oC to be used for IL-6 determinations
were taken out of the refrigerator to thaw after which each sample was vortexed for 10
seconds. All reagents to be used were also brought to room temperature before use.
Standard samples of concentrations: 300 pg/mL, 150 pg/mL, 75 pg/mL, 37.5 pg/mL,
18.75 pg/mL, 9.38 pg/mL and 4.69 pg/mL were prepared in duplicates according to
protocol provided. A 1/10 dilution of each test sample and control sample was prepared
according to protocol provided. Hundred microliters (100 µL) of the 300 pg/mL, 150
pg/mL, 75 pg/mL, 37.5 pg/mL, 18.75 pg/mL, 9.38 pg/mL, 4.69 pg/mL human IL-6
standard calibrator solutions prepared were pipetted into the precoated 96-well plates in
dublicates. Hundred microliters (100 µL) of the sample diluent buffer was placed into a
control well (zero well). A volume of 100 µL of each diluted test samples were placed
into empty wells in duplicates. The plates were sealed with adhesive cover and incubated
at 37oC for 90minutes.
After incubation, the plate contents were discarded and the plate aspirated.
University of Ghana http://ugspace.ug.edu.ghUniversity of Ghana http://ugspace.ug.edu.gh

36
Hundred microliters (100 µL) of biotintylated anti-human IL-6 antibody working solution
was then placed into each well and the plate incubated at 37oC for 60 minutes. The plate
was washed three times with prepared wash buffer in an aspirator.
Prepared working solution (100 µL) was then added into each well and the plate
incubated at 37oC for 30 minutes. After incubation, the plate was washed five times with
prepared wash buffer in an aspirator. Ninety microliters (90 µl) of prepared TMB
Colour developing reagent was added into each well and the plate incubated at 37oC for
30 minutes. Hundred microliters (100 µL) of prepared TMB stop solution was then added
into each well the O.D absorbance read at 450 nm in the MULTISKAN MS Microplate
reader vesion 1.5 within 30 minutes after adding the TMB stop solution. Concentrations
obtained were multiplied by dilution factor of 10 to obtain true serum IL-6 levels in the
samples.
3.8.5. Measurement of Glucose
Principles of the Procedure
The VITROS Glucose (GLU) slide method was performed using the VITROS GLU
slides and Calibrator kit on VITROS Chemistry System (Johnson & Johnson, New
Jersey, USA). Six microliters (6µ1) of sample was deposited on the slide and was
eventually distributed by the spreading layer to the underlying layers. The oxidation of
glucose is catalyzed by glucose oxidase to form hydrogen peroxide and gluconate. The
reaction is followed by an oxidative coupling catalyzed peroxidase in the presence of dye
precursors to produce a dye. The intensity of the dye is measured by reflected light at a
University of Ghana http://ugspace.ug.edu.ghUniversity of Ghana http://ugspace.ug.edu.gh

37
wavelength of 540 nm. The Chemistry of glucose slides used in this study is as described
by Curme et al., (1978). The incubation time and reaction condition for the entire
reaction were 5 minutes and 37oC respectively.
Reaction Sequence
β-D-glucose + O2 + H2O glucose oxidase D – gluconic acid + H2O2
2H2O2 + 4 – aminoantipyrine + 1, 7 – dihydroxynaphthalene peroxidase red dye
3.8.6. Measurement of Total Cholestral (T. CHOL)
Principles of the Procedure
The VITROS Cholesterol (CHOL) slide method was performed using the VITROS
CHOL slides and Calibrator kit on VITROS Chemistry System (Johnson & Johnson,
New Jersey, USA). The method used in this study is based on an enzymatic method
proposed by Allain et al., (1974). Six microliter (6 µL) sample is deposited on the slide
and is eventually distributed by the spreading layer to the underlying layers. The Triton
X-100 (TX 100) surfactant in the spreading layer aids in dissociating the cholesterol and
cholesterol esters from lipoprotein complexes present in the sample. Hydrolysis of the
cholesterol is catalyzed by cholesterol ester hydrolase. Free cholesterol is then oxidized
in the presence of cholesterol oxidase to form cholestenone and hydrogen peroside.
Finally, hydrogen peroxide oxidizes a leuco dye in the presence of peroxides to generate
a colored dye. The density of the dye formed is proportional to the cholesterol
concentration present in the sample and is measured by reflectance spectrophotometry at
University of Ghana http://ugspace.ug.edu.ghUniversity of Ghana http://ugspace.ug.edu.gh
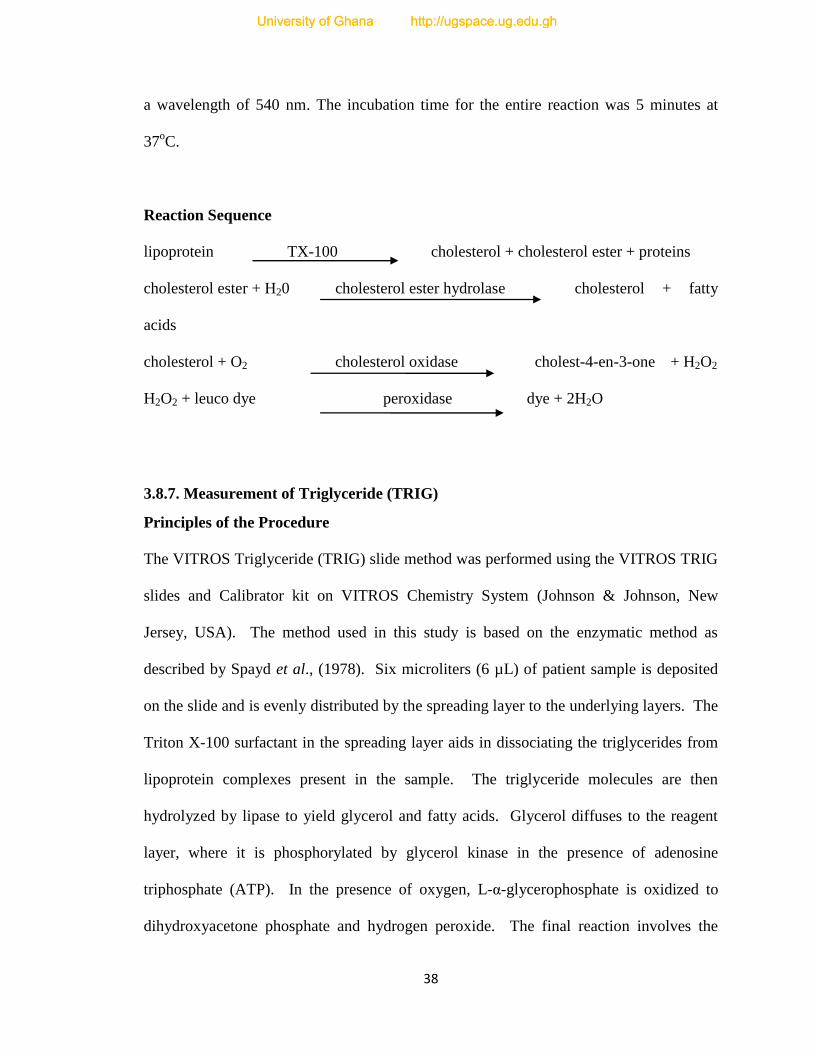
38
a wavelength of 540 nm. The incubation time for the entire reaction was 5 minutes at
37oC.
Reaction Sequence
lipoprotein TX-100 cholesterol + cholesterol ester + proteins
cholesterol ester + H20 cholesterol ester hydrolase cholesterol + fatty
acids
cholesterol + O2 cholesterol oxidase cholest-4-en-3-one + H2O2
H2O2 + leuco dye peroxidase dye + 2H2O
3.8.7. Measurement of Triglyceride (TRIG)
Principles of the Procedure
The VITROS Triglyceride (TRIG) slide method was performed using the VITROS TRIG
slides and Calibrator kit on VITROS Chemistry System (Johnson & Johnson, New
Jersey, USA). The method used in this study is based on the enzymatic method as
described by Spayd et al., (1978). Six microliters (6 µL) of patient sample is deposited
on the slide and is evenly distributed by the spreading layer to the underlying layers. The
Triton X-100 surfactant in the spreading layer aids in dissociating the triglycerides from
lipoprotein complexes present in the sample. The triglyceride molecules are then
hydrolyzed by lipase to yield glycerol and fatty acids. Glycerol diffuses to the reagent
layer, where it is phosphorylated by glycerol kinase in the presence of adenosine
triphosphate (ATP). In the presence of oxygen, L-α-glycerophosphate is oxidized to
dihydroxyacetone phosphate and hydrogen peroxide. The final reaction involves the
University of Ghana http://ugspace.ug.edu.ghUniversity of Ghana http://ugspace.ug.edu.gh

39
oxidation of a leuco dye by hydrogen peroxide, catalyzed by peroxidase, to produce a
dye. The density of the dye formed is proportional to the triglyceride concentration
present in the sample and is measured at a wavelength of 540nm by reflectance
spectrophotometry. The incubation time for the entire reaction was 5 minutes at 37oC.
Reaction Sequence
lipoprotein surfactant triglycerides + proteins
triglycerides + H2O lipase glycerol + fatty acids
glycerol + ATP glycerol kinase L-α-glycerophosphate + ADP
L-α-glycerophosphate + O2 oxidase dihydroxyacetone phosphate + H2O2
H2O2 + leuco dye peroxidase dye + H2O
3.8.8. Measurement of High Density Lipoprotein (HDL)
Principles of the Procedure
The VITROS HDL cholesterol slide method was performed using the VITROS HDL
cholesterol slides and Calibrator kit on VITROS Chemistry System (Johnson & Johnson,
New Jersey, USA). The method is based on a non-HDL cholesterol precipitation method
similar to one described by Burstein et al., (1970). This is followed by an enzymatic
detection similar to that proposed by Allain et al., (1974). Ten microliters (10 µL) of
patient sample is deposited on the slide and is eventually distributed by the spreading
layer to the underlying layers. HDL cholesterol is separated by the precipitation of non-
high density lipoproteins (non-HDL) using phosphotungstic acid (PTA) and magnesium
chloride (MgCl2) in the spreading layer. The Emulgen B-66 surfactant in the spreading
University of Ghana http://ugspace.ug.edu.ghUniversity of Ghana http://ugspace.ug.edu.gh
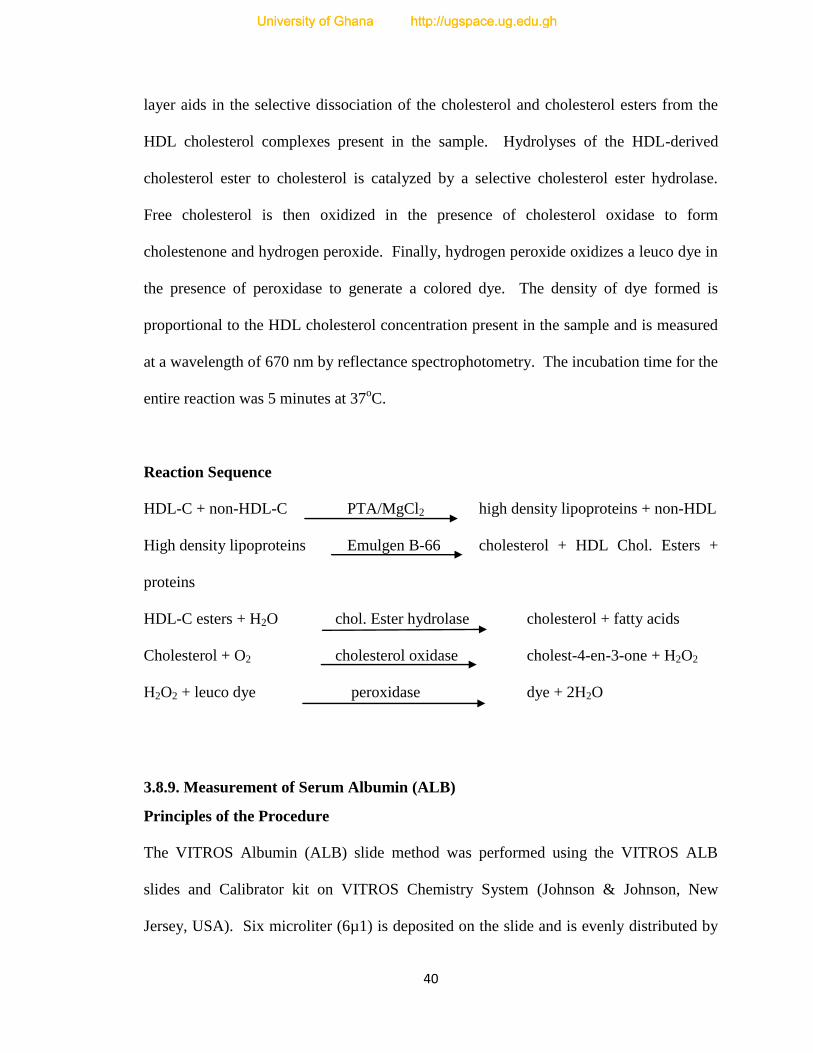
40
layer aids in the selective dissociation of the cholesterol and cholesterol esters from the
HDL cholesterol complexes present in the sample. Hydrolyses of the HDL-derived
cholesterol ester to cholesterol is catalyzed by a selective cholesterol ester hydrolase.
Free cholesterol is then oxidized in the presence of cholesterol oxidase to form
cholestenone and hydrogen peroxide. Finally, hydrogen peroxide oxidizes a leuco dye in
the presence of peroxidase to generate a colored dye. The density of dye formed is
proportional to the HDL cholesterol concentration present in the sample and is measured
at a wavelength of 670 nm by reflectance spectrophotometry. The incubation time for the
entire reaction was 5 minutes at 37oC.
Reaction Sequence
HDL-C + non-HDL-C PTA/MgCl2 high density lipoproteins + non-HDL
High density lipoproteins Emulgen B-66 cholesterol + HDL Chol. Esters +
proteins
HDL-C esters + H2O chol. Ester hydrolase cholesterol + fatty acids
Cholesterol + O2 cholesterol oxidase cholest-4-en-3-one + H2O2
H2O2 + leuco dye peroxidase dye + 2H2O
3.8.9. Measurement of Serum Albumin (ALB)
Principles of the Procedure
The VITROS Albumin (ALB) slide method was performed using the VITROS ALB
slides and Calibrator kit on VITROS Chemistry System (Johnson & Johnson, New
Jersey, USA). Six microliter (6µ1) is deposited on the slide and is evenly distributed by
University of Ghana http://ugspace.ug.edu.ghUniversity of Ghana http://ugspace.ug.edu.gh
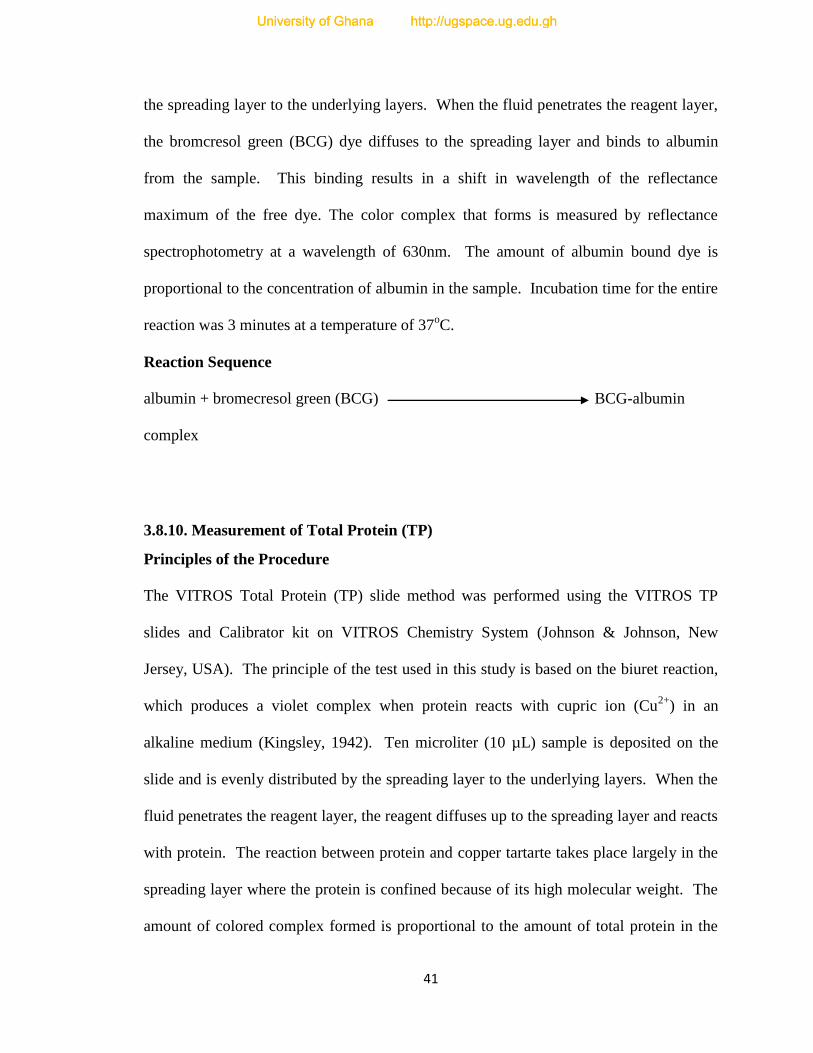
41
the spreading layer to the underlying layers. When the fluid penetrates the reagent layer,
the bromcresol green (BCG) dye diffuses to the spreading layer and binds to albumin
from the sample. This binding results in a shift in wavelength of the reflectance
maximum of the free dye. The color complex that forms is measured by reflectance
spectrophotometry at a wavelength of 630nm. The amount of albumin bound dye is
proportional to the concentration of albumin in the sample. Incubation time for the entire
reaction was 3 minutes at a temperature of 37oC.
Reaction Sequence
albumin + bromecresol green (BCG) BCG-albumin
complex
3.8.10. Measurement of Total Protein (TP)
Principles of the Procedure
The VITROS Total Protein (TP) slide method was performed using the VITROS TP
slides and Calibrator kit on VITROS Chemistry System (Johnson & Johnson, New
Jersey, USA). The principle of the test used in this study is based on the biuret reaction,
which produces a violet complex when protein reacts with cupric ion (Cu2+
) in an
alkaline medium (Kingsley, 1942). Ten microliter (10 µL) sample is deposited on the
slide and is evenly distributed by the spreading layer to the underlying layers. When the
fluid penetrates the reagent layer, the reagent diffuses up to the spreading layer and reacts
with protein. The reaction between protein and copper tartarte takes place largely in the
spreading layer where the protein is confined because of its high molecular weight. The
amount of colored complex formed is proportional to the amount of total protein in the
University of Ghana http://ugspace.ug.edu.ghUniversity of Ghana http://ugspace.ug.edu.gh

42
sample and is measured at a wavelength of 540 nm by reflectance spectrophotometry.
The incubation time for the entire reaction was 5 minutes at 37oC.
Reaction Sequence
Protein + copper tartarte LiOH colored complex
3.8.11. Measurement of Glycated Haemoglobin (HbA1c)
Principles of the Procedure
The measuremnt of glycated haemoglobin (HbA1c) involved the following steps.
Sample Pre-treatment
The first step of the procedure involved the pre-treatment of the whole blood sample.
This was done by adding 10 µL of whole blood to 400 µL haemoglobin denaturant
reagent (1:41 dilution). This lysed red blood cells and caused hydrolysis of the
haemoglobin by the action of a protease enzymes in the haemoglobin denaturant reagent.
3.8.12. Determination of Total Haemoglobin
The total haemoglobin reagent was used to determine the concentration of total
haemoglobin. The method invovled the conversion of all the haemoglobin derivatives
into haematin in an alkaline solution of a non-oinic detergent as described by Wolf et al.,
(1984). The reaction was initiated by the addition of the pre-treated sample to the total
haemoglobin reagent, resulting in a green solution. The conversion of different
University of Ghana http://ugspace.ug.edu.ghUniversity of Ghana http://ugspace.ug.edu.gh

43
haemoglobin species into alkaline haematin with one defined absorption spectrum allows
the endpoint measurement of total haemoglobin at 600 nm.
3.7.12.1. Determination of HbA1c
The determination of HbA1c was based on a latex agglutination inhibition assay. The
agglutinator, which consists of a synthetic polymer containing multiple copies of the
immunoreactive portion of HbA1c, causes agglutination of latex coated with HbA1c
specific mouse monoclonal antibodies. In the absence of HbA1c in the sample, the
agglutinator in the HbA1c R2 Reagent and the antibody coated micro particles in the
HbA1c R1 Reagent will agglutinate, resulting in an increase in absorbance. The presence
of HbA1c in the sample will slow the rate of agglutination as it competes with the HbA1c
agglutinator for antibody binding sites on the latex. Hence, the increase in absorbance is
inversely proportional to the concentration of HbA1c in the sample. An increase in
absorbance due to agglutination was measured at a wavelenght of 700nm and the extent
of agglutination was used to calculate the concentration of HbA1c from a calibration
curve. The percentage (%) of HbA1c was then calculated using the g/dl HbA1c and total
haemoglobin values.
3.8. Data Handling
All data were entered into Microsoft excel spreadsheet for storage and subsequent
analysis. Data was handled confidentially. Unique identifiers were used for computer
based data entry. The supervisors and Investigator ensured that all study forms together
with all identification code lists were kept safe and confidential.
University of Ghana http://ugspace.ug.edu.ghUniversity of Ghana http://ugspace.ug.edu.gh
44
3.8. Statistical Analysis
Data gathered was analyzed in accordance with the requirements of the research
objectives. The Statistical Package for the Social Sciences (SPSS) version 20.0 was used.
The Mann-Whitney U-test for median comparison was used to test the differences in
immunoglobulin and IL-6 levels between diabetic and non-diabetic subjects. The median,
minimum and maximum values were given as measures of dispersion. For comparison of
demographic, clinical and biochemical parameters, quantitative data was presented as
mean ± SD. The statistical significance between means was estimated by student’s t–test
when appropriate. Spearman’s correlation coefficient (r) was used to measure the strength
of the association between the variables. Differences were considered statistically
significant at p<0.05.
University of Ghana http://ugspace.ug.edu.ghUniversity of Ghana http://ugspace.ug.edu.gh
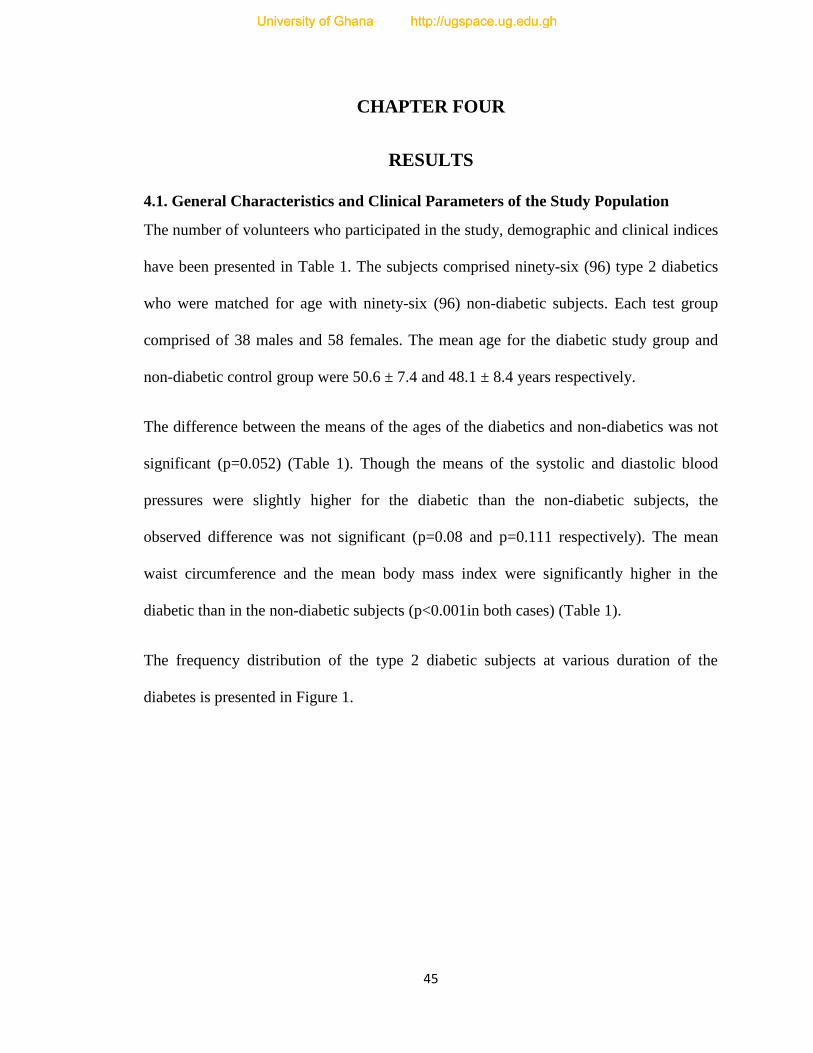
45
CHAPTER FOUR
RESULTS
4.1. General Characteristics and Clinical Parameters of the Study Population
The number of volunteers who participated in the study, demographic and clinical indices
have been presented in Table 1. The subjects comprised ninety-six (96) type 2 diabetics
who were matched for age with ninety-six (96) non-diabetic subjects. Each test group
comprised of 38 males and 58 females. The mean age for the diabetic study group and
non-diabetic control group were 50.6 ± 7.4 and 48.1 ± 8.4 years respectively.
The difference between the means of the ages of the diabetics and non-diabetics was not
significant (p=0.052) (Table 1). Though the means of the systolic and diastolic blood
pressures were slightly higher for the diabetic than the non-diabetic subjects, the
observed difference was not significant (p=0.08 and p=0.111 respectively). The mean
waist circumference and the mean body mass index were significantly higher in the
diabetic than in the non-diabetic subjects (p<0.001in both cases) (Table 1).
The frequency distribution of the type 2 diabetic subjects at various duration of the
diabetes is presented in Figure 1.
University of Ghana http://ugspace.ug.edu.ghUniversity of Ghana http://ugspace.ug.edu.gh
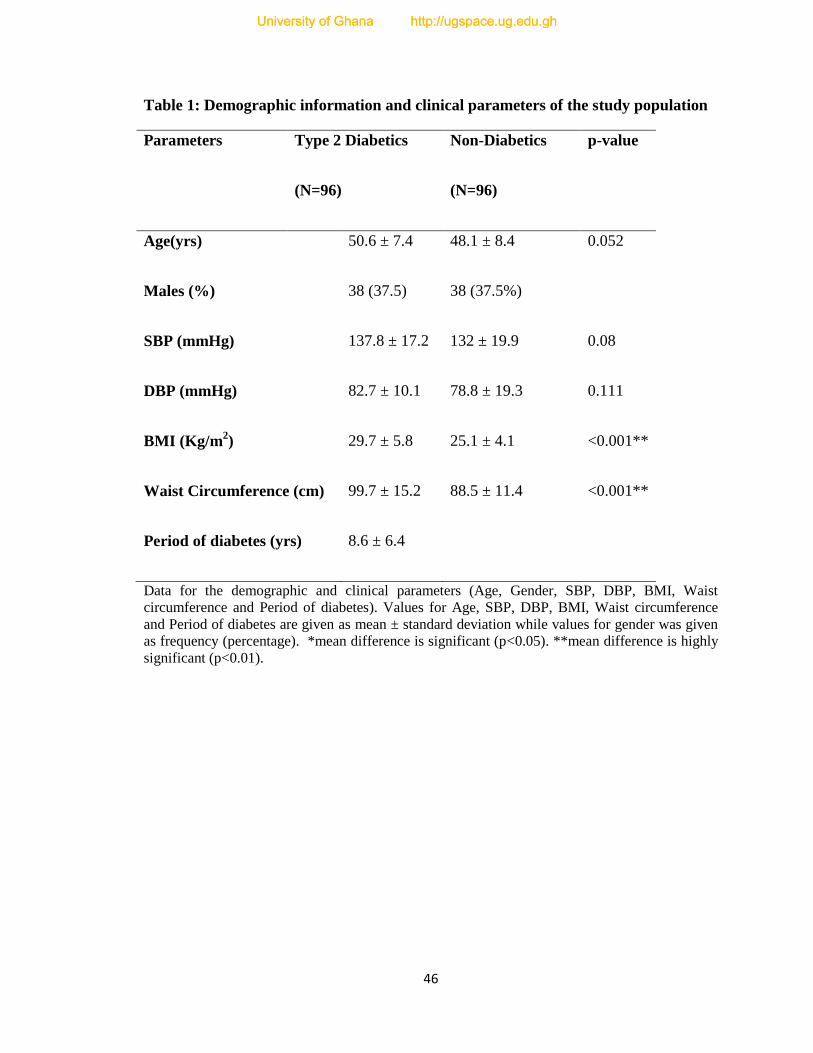
46
Table 1: Demographic information and clinical parameters of the study population
Parameters Type 2 Diabetics
(N=96)
Non-Diabetics
(N=96)
p-value
Age(yrs) 50.6 ± 7.4 48.1 ± 8.4 0.052
Males (%) 38 (37.5) 38 (37.5%)
SBP (mmHg) 137.8 ± 17.2 132 ± 19.9 0.08
DBP (mmHg) 82.7 ± 10.1 78.8 ± 19.3 0.111
BMI (Kg/m2) 29.7 ± 5.8 25.1 ± 4.1 <0.001**
Waist Circumference (cm) 99.7 ± 15.2 88.5 ± 11.4 <0.001**
Period of diabetes (yrs) 8.6 ± 6.4
Data for the demographic and clinical parameters (Age, Gender, SBP, DBP, BMI, Waist
circumference and Period of diabetes). Values for Age, SBP, DBP, BMI, Waist circumference
and Period of diabetes are given as mean ± standard deviation while values for gender was given
as frequency (percentage). *mean difference is significant (p<0.05). **mean difference is highly
significant (p<0.01).
University of Ghana http://ugspace.ug.edu.ghUniversity of Ghana http://ugspace.ug.edu.gh
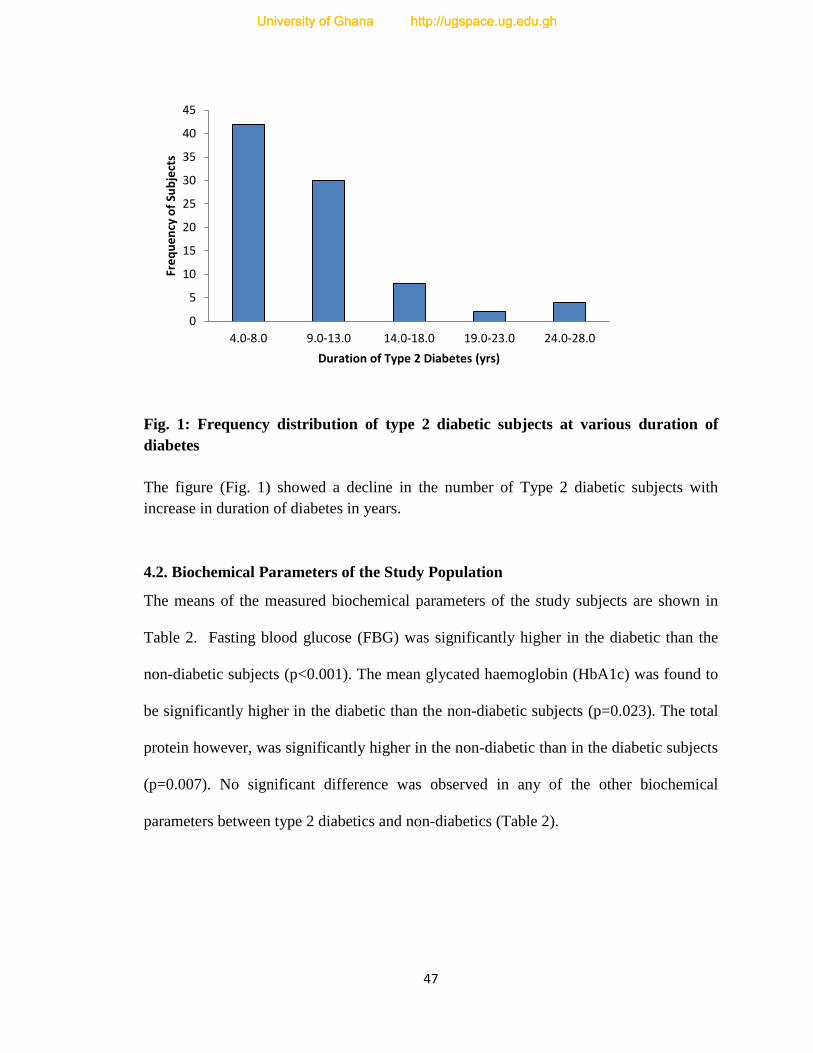
47
Fig. 1: Frequency distribution of type 2 diabetic subjects at various duration of
diabetes
The figure (Fig. 1) showed a decline in the number of Type 2 diabetic subjects with
increase in duration of diabetes in years.
4.2. Biochemical Parameters of the Study Population
The means of the measured biochemical parameters of the study subjects are shown in
Table 2. Fasting blood glucose (FBG) was significantly higher in the diabetic than the
non-diabetic subjects (p<0.001). The mean glycated haemoglobin (HbA1c) was found to
be significantly higher in the diabetic than the non-diabetic subjects (p=0.023). The total
protein however, was significantly higher in the non-diabetic than in the diabetic subjects
(p=0.007). No significant difference was observed in any of the other biochemical
parameters between type 2 diabetics and non-diabetics (Table 2).
0
5
10
15
20
25
30
35
40
45
4.0-8.0 9.0-13.0 14.0-18.0 19.0-23.0 24.0-28.0
Fre
qu
en
cy o
f Su
bje
cts
Duration of Type 2 Diabetes (yrs)
University of Ghana http://ugspace.ug.edu.ghUniversity of Ghana http://ugspace.ug.edu.gh
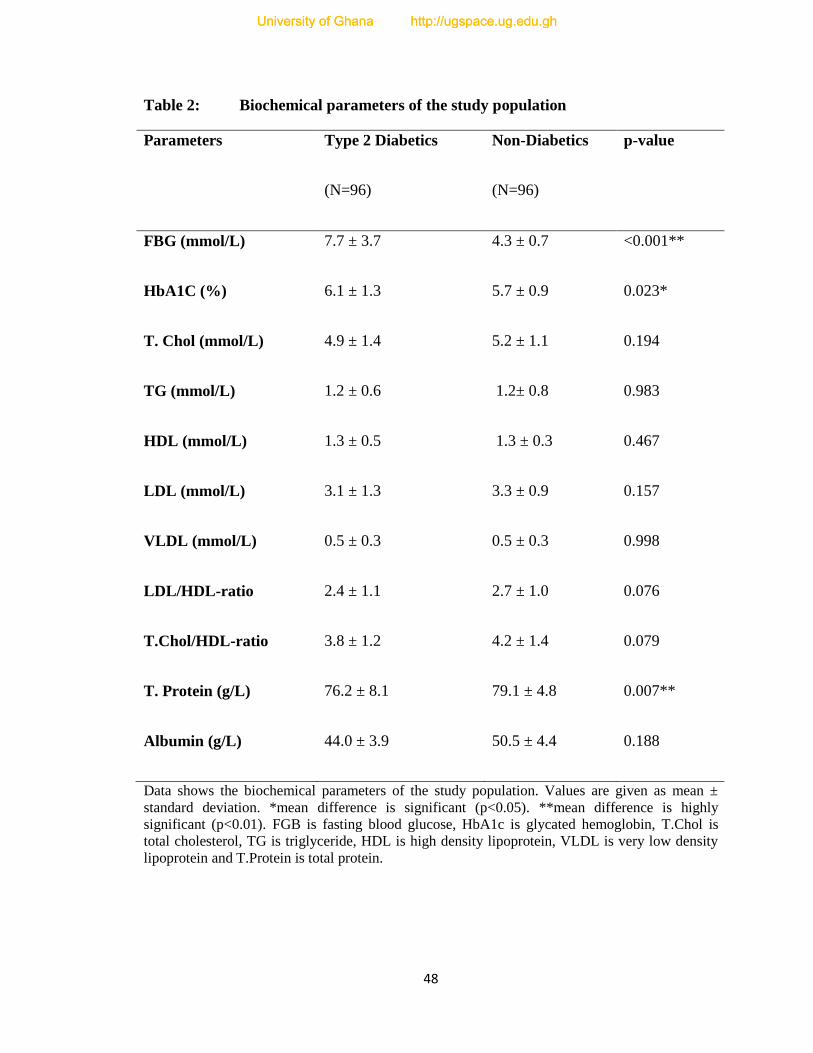
48
Table 2: Biochemical parameters of the study population
Parameters Type 2 Diabetics
(N=96)
Non-Diabetics
(N=96)
p-value
FBG (mmol/L) 7.7 ± 3.7 4.3 ± 0.7 <0.001**
HbA1C (%) 6.1 ± 1.3 5.7 ± 0.9 0.023*
T. Chol (mmol/L) 4.9 ± 1.4 5.2 ± 1.1 0.194
TG (mmol/L) 1.2 ± 0.6 1.2± 0.8 0.983
HDL (mmol/L) 1.3 ± 0.5 1.3 ± 0.3 0.467
LDL (mmol/L) 3.1 ± 1.3 3.3 ± 0.9 0.157
VLDL (mmol/L) 0.5 ± 0.3 0.5 ± 0.3 0.998
LDL/HDL-ratio 2.4 ± 1.1 2.7 ± 1.0 0.076
T.Chol/HDL-ratio 3.8 ± 1.2 4.2 ± 1.4 0.079
T. Protein (g/L) 76.2 ± 8.1 79.1 ± 4.8 0.007**
Albumin (g/L) 44.0 ± 3.9 50.5 ± 4.4 0.188
Data shows the biochemical parameters of the study population. Values are given as mean ±
standard deviation. *mean difference is significant (p<0.05). **mean difference is highly
significant (p<0.01). FGB is fasting blood glucose, HbA1c is glycated hemoglobin, T.Chol is
total cholesterol, TG is triglyceride, HDL is high density lipoprotein, VLDL is very low density
lipoprotein and T.Protein is total protein.
University of Ghana http://ugspace.ug.edu.ghUniversity of Ghana http://ugspace.ug.edu.gh
49
4.3. Distribution of Serum Immunoglobulin Levels in Type 2 Diabetic Subjects
The levels of all the three immunoglobulins IgA, IgG and IgM did not follow normal
distribution, (Fig. 2a, 2b & 2c). Majority of the Type 2 diabetic subjects (65%) presented
IgA levels ranging from 0.5 - 1.4 g/L. The subjects who showed IgA ranging from 1.5 -
3.4 g/L constituted 21%, while 1% of the subjects showed IgA concentration of 4.5 – 4.9
g/L. (Table 3). The 25th
percentile and 75th
percentile of IgA level in the diabetic subjects
were found to be 0.63 and 1.33 respectively (Fig 2a).
The values of IgG were higher than IgA and IgM, ranging from 6.4 – 8.4 g/L (Table 3).
Majority of the Type 2 diabetics fell into the range between 7.5-7.9 g/L (66%). The 25th
percentile and 75th
percentile of IgG were 7.44 and 7.77 respectively (Fig 2b).
Majority of the diabetic subjects showed IgM levels ranging between 0.08-8.35 g/L
(Table 3). The median, 25th
and 75th
percentile were 0.73, 0.33 and 2.12 respectively (Fig
2c).
University of Ghana http://ugspace.ug.edu.ghUniversity of Ghana http://ugspace.ug.edu.gh
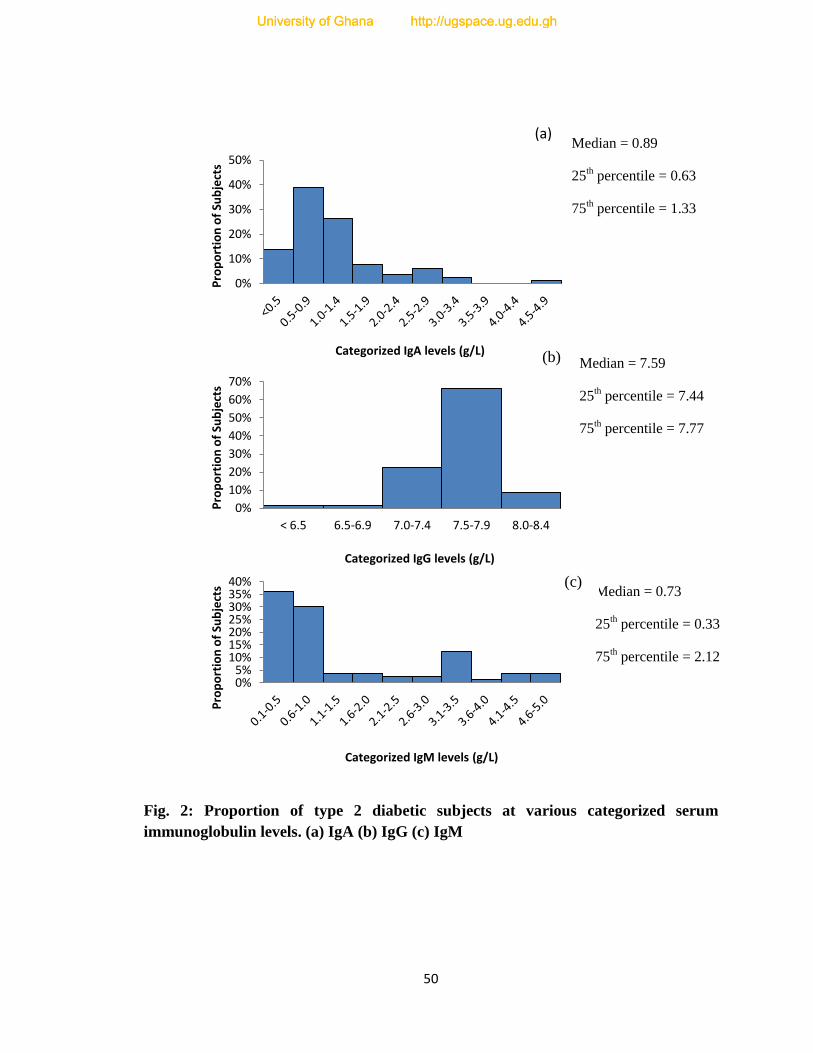
50
Fig. 2: Proportion of type 2 diabetic subjects at various categorized serum
immunoglobulin levels. (a) IgA (b) IgG (c) IgM
0%
10%
20%
30%
40%
50%
Pro
po
rtio
n o
f Su
bje
cts
Categorized IgA levels (g/L)
0%
10%
20%
30%
40%
50%
60%
70%
< 6.5 6.5-6.9 7.0-7.4 7.5-7.9 8.0-8.4
Pro
po
rtio
n o
f Su
bje
cts
Categorized IgG levels (g/L)
0% 5%
10% 15% 20% 25% 30% 35% 40%
Pro
po
rtio
n o
f Su
bje
cts
Categorized IgM levels (g/L)
Median = 0.73
25th percentile = 0.33
75th percentile = 2.12
Median = 0.89
25th percentile = 0.63
75th percentile = 1.33
Median = 7.59
25th percentile = 7.44
75th percentile = 7.77
(a)
(b)
(c)
University of Ghana http://ugspace.ug.edu.ghUniversity of Ghana http://ugspace.ug.edu.gh
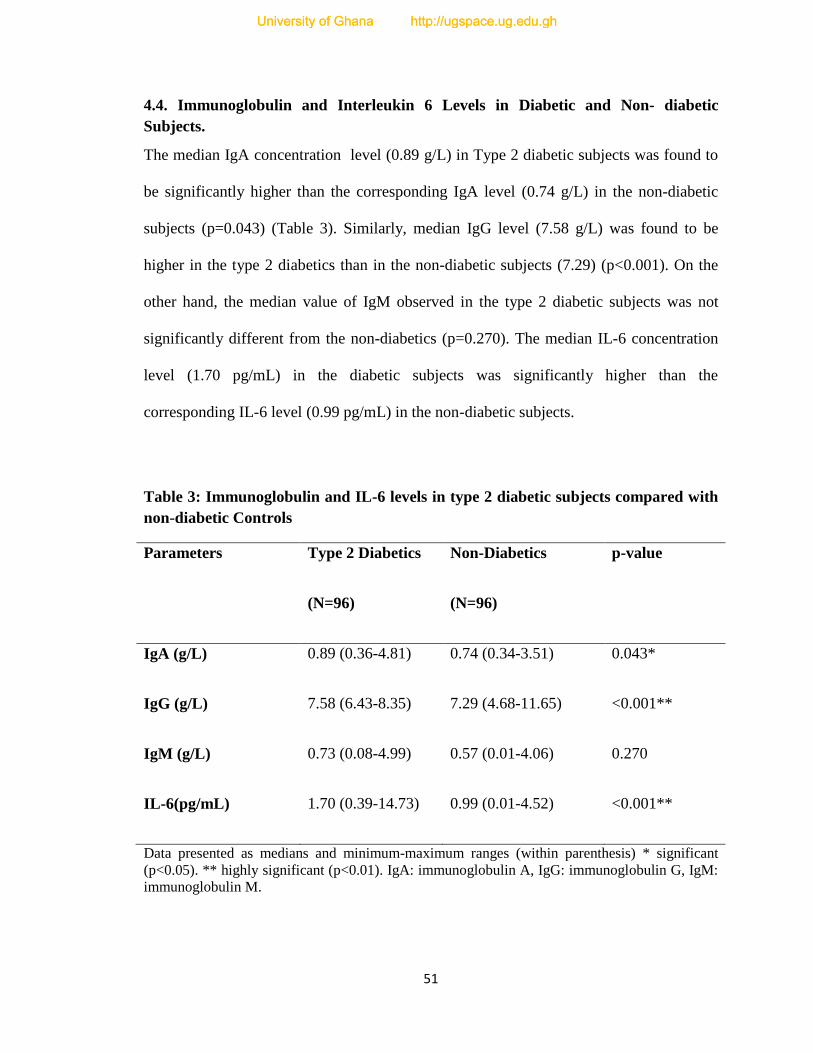
51
4.4. Immunoglobulin and Interleukin 6 Levels in Diabetic and Non- diabetic
Subjects.
The median IgA concentration level (0.89 g/L) in Type 2 diabetic subjects was found to
be significantly higher than the corresponding IgA level (0.74 g/L) in the non-diabetic
subjects (p=0.043) (Table 3). Similarly, median IgG level (7.58 g/L) was found to be
higher in the type 2 diabetics than in the non-diabetic subjects (7.29) (p<0.001). On the
other hand, the median value of IgM observed in the type 2 diabetic subjects was not
significantly different from the non-diabetics (p=0.270). The median IL-6 concentration
level (1.70 pg/mL) in the diabetic subjects was significantly higher than the
corresponding IL-6 level (0.99 pg/mL) in the non-diabetic subjects.
Table 3: Immunoglobulin and IL-6 levels in type 2 diabetic subjects compared with
non-diabetic Controls
Parameters Type 2 Diabetics
(N=96)
Non-Diabetics
(N=96)
p-value
IgA (g/L) 0.89 (0.36-4.81) 0.74 (0.34-3.51) 0.043*
IgG (g/L) 7.58 (6.43-8.35) 7.29 (4.68-11.65) <0.001**
IgM (g/L) 0.73 (0.08-4.99) 0.57 (0.01-4.06) 0.270
IL-6(pg/mL) 1.70 (0.39-14.73) 0.99 (0.01-4.52) <0.001**
Data presented as medians and minimum-maximum ranges (within parenthesis) * significant
(p<0.05). ** highly significant (p<0.01). IgA: immunoglobulin A, IgG: immunoglobulin G, IgM:
immunoglobulin M.
University of Ghana http://ugspace.ug.edu.ghUniversity of Ghana http://ugspace.ug.edu.gh
52
4.5. Association of Immunoglobulin and Interleukin 6 Levels with General
Characteristics and Clinical Parameters of Type 2 Diabetic Subjects
The results obtained showed that there was significant association between age and
immunoglobulin A in diabetic subjects. However there was no association between age
on one hand, and IgG, IgM and IL-6 (Table 4).
There was no significant relationship between waist circumference of the diabetic
subjects and their immunoglobulin as well as interleukin 6 levels (Table 4).
The results as presented in Table 4 did not show any significant association between
systolic and diastolic blood pressure of the diabetic subjects and their immunoglobulin
and interleukin 6 levels.
However, Body Mass Index (BMI) was found to correlate positively with IgG (p<0.05).
No significant association was observed between BMI and IgA, IgM and IL-6 levels in
the diabetic subjects (Table 4).
University of Ghana http://ugspace.ug.edu.ghUniversity of Ghana http://ugspace.ug.edu.gh

53
Table 4: Correlation of immunoglobulins and interleukin-6 levels with general
characteristics and clinical parameters of diabetic subjects
IgA IgG IgM IL-6
Age R 0.159* -0.036 0.047 0.114
P 0.047 0.065 0.558 0.154
BMI R 0.025 0.161* 0.069 0.077
P 0.751 0.043 0.388 0.337
Waist
circumference
R -0.013 0.049 0.073 0.025
P 0.872 0.541 0.364 0.759
SBP R 0.018 -0.042 0.023 0.054
P 0.824 0.600 0.775 0.502
DBP R 0.016 0.071 0.023 0.016
P 0.838 0.374 0.779 0.841
Data presented as Spearman’s correlation coefficient, r. *Correlation is significant at p<0.05;
**Correlation is highly significant at p<0.01
BMI: body mass index, SBP: systolic blood pressure, DBP: diastolic blood pressure
University of Ghana http://ugspace.ug.edu.ghUniversity of Ghana http://ugspace.ug.edu.gh
54
4.6. Association of Immunoglobulin and Interleukin 6 Levels with Biochemical
Indices of the Diabetic Subjects
The results of the various associations of immunoglobulin and IL-6 levels with
biochemical indices of the diabetic study population are presented in Table 5.
Low Density Lipoprotein (LDL), Very Low Density Lipoprotein, the ratio: LDL/High
Density Lipoprotein (HDL) as well as the ratio: Total Cholesterol (T.Chol)/HDL did not
show any significant association with the immunoglobulin and IL-6 of the study
population. Albumin correlates significantly and inversely with IL-6 (p<0.05). Similarly,
HDL correlates positively with IL-6 (p<0.05). Total protein showed positive correlation
with IgA (Table 5).
Fasting blood glucose (FBG) correlated significantly and positively with IgA (p=0.033)
IgG (p=0.001) and IL-6 (p<0.001) (Table 5). As the fasting blood glucose level
increased, IgA, IgG and IL-6 levels also increased in the diabetic study subjects. Glycated
haemoglobin (HbA1c) correlated significantly, positively with IL-6 (p<0.05) but
inversely with IgG (p<0.05) (Table 5).
Serum IgA and IgM (but not IgG) tended to increase significantly with IL-6 levels.
(p=0.001, 0.031 and 0.500 respectively) (Table 6).
University of Ghana http://ugspace.ug.edu.ghUniversity of Ghana http://ugspace.ug.edu.gh
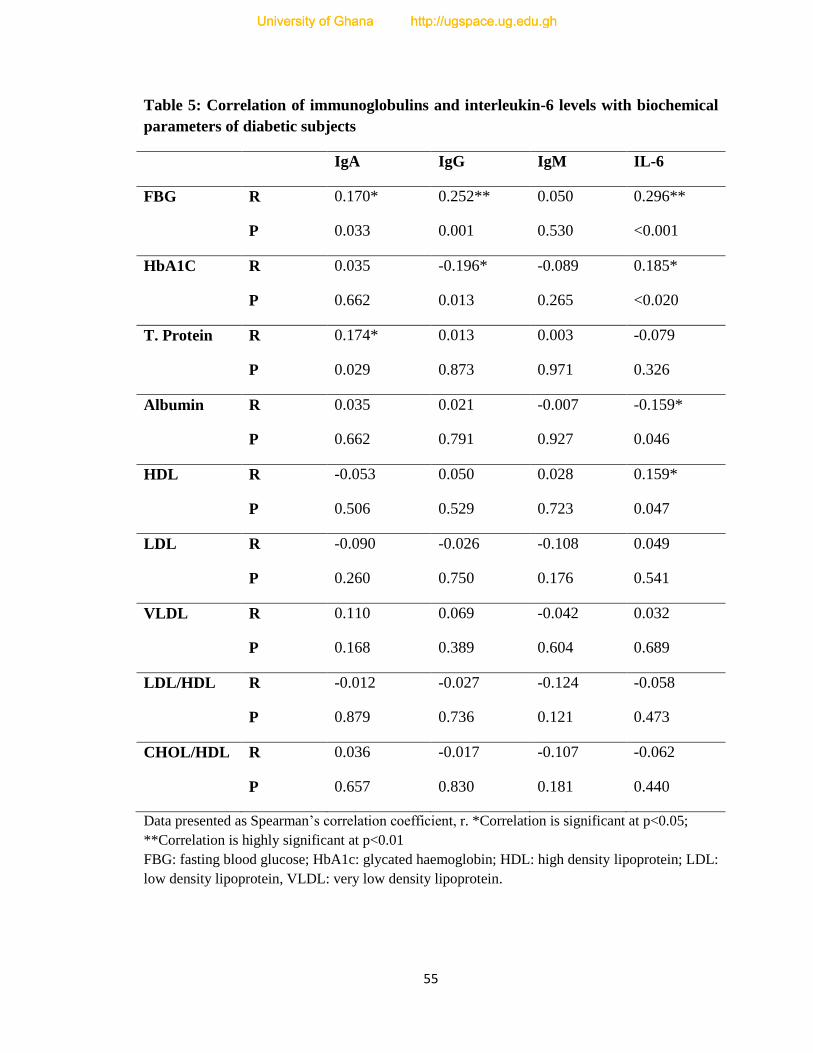
55
Table 5: Correlation of immunoglobulins and interleukin-6 levels with biochemical
parameters of diabetic subjects
IgA IgG IgM IL-6
FBG R 0.170* 0.252** 0.050 0.296**
P 0.033 0.001 0.530 <0.001
HbA1C R 0.035 -0.196* -0.089 0.185*
P 0.662 0.013 0.265 <0.020
T. Protein R 0.174* 0.013 0.003 -0.079
P 0.029 0.873 0.971 0.326
Albumin R 0.035 0.021 -0.007 -0.159*
P 0.662 0.791 0.927 0.046
HDL R -0.053 0.050 0.028 0.159*
P 0.506 0.529 0.723 0.047
LDL R -0.090 -0.026 -0.108 0.049
P 0.260 0.750 0.176 0.541
VLDL R 0.110 0.069 -0.042 0.032
P 0.168 0.389 0.604 0.689
LDL/HDL R -0.012 -0.027 -0.124 -0.058
P 0.879 0.736 0.121 0.473
CHOL/HDL R 0.036 -0.017 -0.107 -0.062
P 0.657 0.830 0.181 0.440
Data presented as Spearman’s correlation coefficient, r. *Correlation is significant at p<0.05;
**Correlation is highly significant at p<0.01
FBG: fasting blood glucose; HbA1c: glycated haemoglobin; HDL: high density lipoprotein; LDL:
low density lipoprotein, VLDL: very low density lipoprotein.
University of Ghana http://ugspace.ug.edu.ghUniversity of Ghana http://ugspace.ug.edu.gh

56
Table 6: Correlation between interleukin-6 and immunoglobulin levels of diabetic
subjects
IgA IgG IgM
IL-6 R 0.326** 0.054 0.172*
P 0.001 0.500 0.031
Data presented as Spearman’s correlation coefficient, r. *Correlation is significant at p<0.05;
**Correlation is highly significant at p<0.01
IL-6: interleukin-6, IgA: immunoglobulin A, IgG: immunoglobulin G, IgM: immunoglobulin M.
University of Ghana http://ugspace.ug.edu.ghUniversity of Ghana http://ugspace.ug.edu.gh
57
CHAPTER FIVE
DISCUSSION
Results of the study on 96 Type 2 diabetic and 96 non-diabetic individuals showed a
higher waist circumference (WC) in the diabetic than the non-diabetic subjects (Table 1).
This observation supports the findings of The InterAct Consortium (2012) which
indicated that high WC is an indicator of high adiposity which has the potential for
diabetes development. The risk of type 2 diabetes in adults increases continuously with
increasing obesity, and decreases with weight loss (World Health Organization, 2011;
The InterAct Consortium, 2012). Increased abdominal fat surrounding the liver and other
abdominal organs releases metabolically active fatty acids, inflammatory agents and
hormones that ultimately lead to higher LDL cholesterol, triglycerides, blood glucose and
blood pressure. A careful analysis of the relationship between obesity and adult‐onset
diabetes, according to World Health Organization (2011), confirms that abdominal
obesity is an important risk factor, even after controlling for age, smoking and family
history. However, the usefulness of waist circumference measurement as a first‐step
diagnostic tool when assessing an individual’s risk of diabetes is still unclear. This may
be because most published studies are cross ‐ sectional, so the interpretation of results is
likely to be confounded by other concurrent conditions such as hypertension and
dyslipidaemia (World Health Organization, 2011). Indeed the subjects in this study with
significantly high WC had already developed Type 2 diabetes. Early identification of
increasing WC, and managed before the onset of type 2 diabetes could have prevented
the condition. Therefore WC measurements should be carried out routinely on
University of Ghana http://ugspace.ug.edu.ghUniversity of Ghana http://ugspace.ug.edu.gh
58
particularly obese individuals to identify high risk individuals for preventive action or for
early lifestyle intervention.
In the study, body mass index (BMI) was also found to be significantly higher in the
diabetic subjects than the non- diabetics. This result confirmed findings by researchers
(Wang et al., 2005; Knowler et al., 2002 ) indicating that BMI is high in diabetic patients.
Actually, BMI was identified as a pre-disposing factor in diabetic development (The
InterAct Consortium, 2012). Risk is particularly high in individuals with large amount of
abdominal (visceral) fat (Kannel et al., 1991), which is a source of bioactive mediators
that directly contributes to insulin resistance (Xu et al., 2003). These findings also
provide solid genetic support indicating that a higher BMI causes a raised risk of type 2
diabetes and high blood pressure.
Systolic and diastolic blood pressures were not significantly different in diabetic and non-
diabetic subjects. According to Amoah et al. (2002), worsening glycaemic status tended
to be associated with increase in body mass index as well as systolic and diastolic blood
pressures. It was therefore expected that the diabetics in the study would present higher
diastolic and systolic pressures compared to the non-diabetics. The diabetics in this study
were on medication. Those who had developed hypertension were on anti-hypertensive
drugs (Appendix E). These management practices could be responsible for the systolic
and diastolic pressures which were not significantly different from the non-diabetics.
In this study, the distribution of the three immunoglobulins did not follow normal
distribution (Fig 2). They were skewed because they are non-parametric measures . The
results did not agree with the findings of Rodriguez-Segade et al., (1996) and Gonzalez-
Quintela et al. (2008) who indicated that the immunoglobulin levels follow a normal
University of Ghana http://ugspace.ug.edu.ghUniversity of Ghana http://ugspace.ug.edu.gh
59
distribution but slightly skewed. The observed distribution of this study informed the
choice of statistical analysis of the results for inferences to be made.
Analysis of the results revealed that the concentration of IgG was greater than the other
immunoglobulins in both the Type 2 diabetics and non-diabetic subjects (Table 3). This
result confirms the existing information that IgG is the most abundant of the total serum
immunoglobulins in humans (Shetty, 1993). The immunoglobulin ranges of the non-
diabetics measured in the study were consistent with established ranges from the U.S.
National Library of Medicine (2012) for healthy individuals.
The concentrations of IgA and IgG were significantly higher in the diabetics than in the
non-diabetic controls. It is known from literature that IgA concentration are elevated in
the serum of diabetics. The significantly high IgA level observed in the diabetic subjects
compared with the non-diabetic controls may reflect the possible accumulation of
inflammatory conditions with the diabetes (Gonzalez-Quintela et al., 2008). According to
Rodriguez-Segade et al. (1996), IgA is a non-specific sign of the development of diabetic
complications. This is possible considering the fact that most of the subjects had lived
with the diabetic condition for between 4 and 28 years. Also, IgA correlated highly with
the serum concentration of interleukin 6, which according to Gonzalez-Quintela et al.
(2008) is a marker of inflammation and a co-factor for immunoglobulin synthesis. It was
also observed by Rodriguez-Segade et al. (1996) that people with micro- or
macrovascular diabetic complication had higher serum IgA concentrations than the
diabetics without complications. Therefore monitoring IgA may provide early warning of
possible presence of complications. The observed significantly higher IgG in the diabetic
subjects than the non-diabetic subjects could be associated with probable infection in the
University of Ghana http://ugspace.ug.edu.ghUniversity of Ghana http://ugspace.ug.edu.gh
60
diabetic patients.. In this study, serum IgM showed no significant difference in both type
2 diabetes and nondiabetics This finding agrees with those of Gonzalez-Quintela et al.
(2008). Glycation of immunoglobulin occurs in patients with diabetes in proportion with
the increase in HbA1c, and this may have harmed the biological function of the IgA and
IgG antibodies (Peleg et al., 2007), hence, their elevation in the diabetics.
The serum IL-6 level in Type 2 diabetic subjects was significantly higher in the diabetics
than in the non-diabetic controls. This finding is in agreement with the observation made
by Kado et al. (1999) and Marques-Vidal et al. (2013). However, this observation
contradicts the findings of Al-Shukaili et al. (2013) who stated that the mean value of IL-
6 was significantly lower in Type 2 diabetes mellitus cases, compared to control subjects.
It has been reported that normal individuals with elevated levels of IL-6 had an
independently increased risk to develop Type 2 diabetes. High levels of IL-6 and other
inflammatory cytokines appear in early stages of Type 2 diabetes and are capable of
promoting Type 2 diabetes through diminishing insulin sensitivity (Schmidt et al., 1999;
Festa et al., 2002). Based on this information, occasionally, the inflammatory cytokine
levels should be checked in the general population to screen for early signs of diabetic
development.
There was no observed association between BMI and IL-6. This cytokine is known to be
associated with obesity. It was expected that people with diabetes would have a higher
BMI and WC than the non-diabetics. Glycated haemoglobin (HbA1c) in the study
subjects was found to be significantly higher in the Type 2 diabetics than in the non-
diabetic subjects. It was also positively correlated with IL-6. This observation agrees with
previous findings (Predhan et al., 2001; Spranger et al., 2003).
University of Ghana http://ugspace.ug.edu.ghUniversity of Ghana http://ugspace.ug.edu.gh
61
5.1. Conclusion
The findings of the study showed that serum IgA and IgG were significantly higher in
type 2 diabetics than in the non-diabetics but there was no significant difference in IgM
between the two groups. The work revealed association between age and IgA levels.
Body mass index is associated with IgG. Fasting blood glucose (FBG), glycated
haemoglobin (HbA1c) and IL-6 are associated with alterations in immunoglobulin levels
which are responsible for humoral immune response in Type 2 diabetic subjects. Body
mass index correlated positively with IL-6.
Humoral immune responses were markedly altered with poorly controlled FBG and
HbA1c which is likely to be one of the reasons why Type 2 diabetics have increased
susceptibility to infections. The study supports the importance of controlling glycated
haemoglobin levels, general sugar levels as well as BMI in Type 2 diabetics.
Type 2 diabetes is not associated with serum IgM but associated with serum IgA and IgG
as well as interleukin-6. Thus the hypothesis that Type 2 diabetes mellitus does not
influence levels of serum immunoglobulins IgA, IgG, IgM and interleukin 6 is accepted
for IgM because the levels of IgM observed in the type 2 diabetic subjects were not
significantly different from the non-diabetics. The hypothesis is, however, rejected for
IgA, IgG and interleukin 6 whose levels were significantly higher in the diabetics
compared to their levels in the non-diabetics.
University of Ghana http://ugspace.ug.edu.ghUniversity of Ghana http://ugspace.ug.edu.gh
62
5.2. Recommendations
Further research should be done to relate immunoglobulin levels to diabetic
complications. Future work should consider the association between immunoglobulin
levels and pathogenic infections in type 2 diabetic patients. Further studies should be
done on larger sample size and different age categories with narrow range of duration of
the diabetes.
Further investigations based on well‐designed prospective studies with incident type 2
diabetes as the outcome would be needed to make recommendations on the usefulness of
the waist circumference measurement as a first ‐ step diagnostic tool when assessing an
individual’s risk of diabetes.
Further work should also be done to be able to establish whether elevated
immunoglobulin leads to higher levels of interleukin 6 levels or vice versa.
5.3. Limitations
One difficulty encountered in the study was the lack reference range for immunoglobulin
levels of apparently normal Ghanaians. The range of duration of diabetes of the subjects
was large (4 to 28 years). The highly variable duration of the disease of the study subjects
could have played an essential role in varied immunoglobulin and cytokine production
among these two study groups.
University of Ghana http://ugspace.ug.edu.ghUniversity of Ghana http://ugspace.ug.edu.gh

63
REFERENCES
Akerblom, H. K., Vaarala, O., Hyoty, H., Ilonen, J. and Knip, M., (2002).
Environmental factors in the etiology of type 1 diabetes. American Journal of Medical
Genetics. 115(1): 18-29.
Alberti, K. G. M. M. and Zimmet, P. Z., (1998). Definition, diagnosis and classification
of diabetes mellitus and its complications. Part1: diagnosis and classification of diabetes
mellitus and its complications. Part 1: diagnosis and classification of diabetes mellitus.
Provisional report of WHO Consultation. Diabetic Medicine, 15(7), 539-553.
Allain, C.C., Poon, L. S., Chan S.G., Richmond, W. and Fu, P.C., (1974). Enzymatic
Determination of Total Cholesterol in Serum. Clin Chem; 20:470-475.
Al-Shukaili, A., Al-Ghafri, S. M. Al-Marhoobi, S., Al-Abri, S., Al-Lawati, J. and Al-
Maskari, M., (2013). Analysis of Inflammatory Mediators in Type 2 Diabetes Patients. 1-
5.
American Diabetes Association, (2000). Type 2 diabetes in children and adolescents.
Diabetes Care;23:381-389.
University of Ghana http://ugspace.ug.edu.ghUniversity of Ghana http://ugspace.ug.edu.gh
64
American Diabetes Association, (2001). Diabetes 2001 Vital Statistics. Alexandra, VA:
ADA.
American Diabetes Association, (2011). Diagnosis and Classification of Diabetes
Mellitus. Diabetic Care; 34 (Suppl 1): S62-S69.
American Diabetes Association, (2012). Standards of Medical Care in Diabetes – 2012.
Diabetic Care; 35 (Suppl 1): S11-S63. Doi: 10. 2337/dc12-s011.
Amoah, A. G. B., (2002), Comprehensive care in low-income country: The Ghana
Experience Diabetes Voice. 47 (2).
Amoah, A. G., Owusu, S. K., and Adjei, S., (2002), Diabetes in Ghana : a community
based prevalence study in Greater Accra. Diabetes Res Clin Pract. 56 (3):197-205.
Ardawi, M. S. M., Nasrat, H.A.N. and Bahnassy, A.A., (1994). Serum Immunoglobulin
Concentrations in Diabetic Patients, Diabetic Medicine. 11(4):384-387.
University of Ghana http://ugspace.ug.edu.ghUniversity of Ghana http://ugspace.ug.edu.gh

65
Assman, G., Schulte, H., (1988). The Prospective Cardiovascular Munster (PROCAM)
study: prevalence of hyperlipidemia in person with hypertension and/ or diabetes mellitus
and the relationship to coronary heart disease. American Heart Journal; 116:1713-1724
Barnett, A. H., Eff,. C., Leslie R. D., Pyke D. A., (1981) Diabetes in identical twins. A
study of 200 pairs. Diabetologia; 20:87-93.
Basta, G., Schmidt, A.M. and De Caterina., (2004). Advanced glycation end products
and ascular inflammation: implications for accelerated atherosclerosis in diabetes.
J.cadiores. 106(1):582-592.
Belgemen, T., Suskan, E., Dogu, F. and Ikinciogullari, A., (2009). Selective
Immunoglobulin M Deficiency Presenting with Recurrent Impetigo: A Case Report and
Review of the Literature. Int Arch Allergy Immunol. 149 (3):283-288.
Bennett, N., Dodd, T., Flatley, J., Freeth, S., Bolling K., (1995). Health Survey for
England 1993. London: HMSO.
Boulton, A. J. and Malik, R. A., (1998). Diabetic neuropathy.
Med Clin North Am; 82 (4): 9090-929.
University of Ghana http://ugspace.ug.edu.ghUniversity of Ghana http://ugspace.ug.edu.gh
66
Brophy, W. A., Sazon and T., Forson, R., (2007). Role of oxidative stress in diabetes
complications. Diabetes 50: 309-410.
Burstein, M., Scholnic, H. R., Morfin, R., (1970). Rapid Method for the Isolation of
Lipoproteins from Human Serum by Precipitation with Polyanions. J. Lipid Research;
11(6): 583-595.
Carey, V. J., Walters, E.E., Colditz, G. A., Solomon, C. G., Willett, W. C., Rosener, B.
A., Speizer, F. E., Manson, J. E., (1997) Body fat distribution and risk of non –
insulindependent diabetes mellitus in women. The Nurses’ Health Study. American
Journal of Epidemiology: 145(7): 61
Celik, J. and Zimmet P., (2001). The Epidemiology of Diabetes Mellitus. An
International Perspective. 1-57.
Center for Disease Control and Prevention, (2011). U.S. Department of Health and
Human Services, National diabetes fact sheet: national estimates and general information
on diabetes and pre-diabetes in the United States.
http://www.cdc.gov/diabetes/pubs/pdf/ndfs_20011.pdf.
University of Ghana http://ugspace.ug.edu.ghUniversity of Ghana http://ugspace.ug.edu.gh
67
Centers for Disease Control and Prevention, U. S. Department of Health and
Human Services, (2011) National diabetes fact sheet: national estimates and general
information on diabetes and pre-diabetes in the United States.
http//www.cdc.gov/diabetes/pubs/pdf/ndfs_2011.pdf.
Christensen, D., Friis, H., Mwaniki, D., Kilonzo, B., Tetens, I., Boit, M., … Borch-
Johson, K., (2009). Prevalence of glucose intolerance and associated risk factors in rural
and urban populations of different ethnic groups in Kenya. Diabetes Res Clin Pract,
84(3), 303-310.
Colditz, G. A., Willett, W. C., Rotnitzky, A., Manson, J. E., (1995). Weight gain as a risk
factor for clinical diabetes mellitus in women. Annals of internal Medicine; 122(7): 481-
486.
Curme, H. G., Columbus, R. L., Dappen, G. M., Eder T. W., Fellows, W. D., Figueras,
J., Glover, C. P., Goffe, C. A., Hill, D. E., Lawton, W. H., Muka, E J., Rand, R. N.,
Sandford, K. J., Wu, T. W., (1978). Multilayer Film Elements for Clinical Analysis.
Clinical Chemistry: 24:1335-1342.
University of Ghana http://ugspace.ug.edu.ghUniversity of Ghana http://ugspace.ug.edu.gh

68
D’Amico, G., (1987). The commonest glomerulonephritis in the world: IgA nephropathy.
Q J Med. 64 (245): 709-727.
Daneman, A., (2006). Pathogenesis of type 2 diabetes: metabolic and molecular
implications for identifying diabetes genes. Diabetes Rev 5:177-269.
DeFronzo, R. A., (1988). Lilly lecture 1987. The triumvirate: beta-cell, muscle, liver. A
collusion responsible for Non Insulin Dependent Diabetes Mellitus.
Diabetes: 37(6):667-687.
Dobson, R., (2000). Number of U.K. diabetic patients set to double by 2010. BJM 320:
1029.
Dodu, S., (1958). The incidence of diabetes mellitus in Accra (Ghana); a study of 4,000
patients. The West African medical journal, 7(3), 129.
Dodu, S. and De Heer, N., (1964). A diabetes case-findind survey in Ho, Ghana. Ghana
Med J, 3, 75-80.
Festa, A., D'Agostino, R. Jr, racy R.P. and Haffner, S.M., (2002). Elevated levels of
acute-phase proteins and plasminogen activator inhibitor-1 predict the
University of Ghana http://ugspace.ug.edu.ghUniversity of Ghana http://ugspace.ug.edu.gh
69
development of type 2 diabetes: The insulin resistance atherosceloris study.
Diabetes. 51:1131-1137.
Gill, G.V., Mbanya, J. C., Ramaiya, K.L. and Tesfaye, S., (2009). A Sub-Saharan
African perspective of diabetes, Diabetologia. 52:8-16.
Gonzalez –Quintela, A., Alende, R. Gude, F., Campos, J., Rey, J., Meilide, L.M.
Fernande-Merino, C and Vidal, C., (2008). Serum levels of Immunoglobulin (IgG, IgA,
IgM) in a general adult population and their relationship with alcohol consumption,
smoking and common metabolic abnormalities. Clinical and Experimental Immunology
151 (1): 42-50. Doi:10.IIII/j. 1365-2249.2007.03545.x
Giugliano, D., Ceriello, A. and Esposito, K., (2008). Glucose metabolism and
hyperglycemia. The American journal of clinical nutrition, 87(1), 217S-222S.
Haffner, S. M., Ronnemaa, T., Lehtos, S., Pyorala, K., Laakso, M., (1998). Mortlity
from coronary heart disease in subjects with type 2 diabetes and in nondiabetic subjects
with and without prior myocardial infarction. New England Journal of medicine;
339:229-234.
University of Ghana http://ugspace.ug.edu.ghUniversity of Ghana http://ugspace.ug.edu.gh
70
Hales, C. N., Barker, D. J., Clark P. M., Cox, L. J., Fall, C., Osmand, C., Winters, P. D.,
(1991). Fetal and infant growth and impaired glucose at age 64. British Medical Journal.
303:1019-1022.
Handwerger, B.S., Fernandes, G. and Brown, D. M., (1980). Immune and autoimmune
aspects of diabetes mellitus. Human Pathology. 11(4):338-352.
Hansen, T., (2002). Genetics of Type 2 diabetes, Current Science, 83(12):1477-1478.
Harris, T.B., Ferrucci, L., Tracy, R.P. (1999). Associations of elevated interleukin-6 and
C-reactive protein levels with mortality in the elderly. Am J Med. 106:506-512.
Heather, S.L. (2008). Diabetes mellitus publication patterns, 1984-2005. J Med Libr
Assoc. 96(2):155-158.
Helsinki Protocol Declaration (2008), Ethical Principles for Medical Research, 59th
World Medical Association General Report.
www.en.wikipedia.org/wiki/Declaration_of_Helsinki
University of Ghana http://ugspace.ug.edu.ghUniversity of Ghana http://ugspace.ug.edu.gh
71
Hoet, J., Reusens, B., Dahri, S., El-Hajjaji, H. and Remacle, C., (1997). Protein
malnutrition during pregnancy in the rat has an intergenerational effect on the endocrine
pancreas. Proceedings of 16th
Int Cong Nutrition, Montreal, Canada, 11(4), 70.
Holman, R. R., (1998). Assessing the potential for alpha-glucosidase inhibitors in
prediabetic states. Diabetes Research and Clinical Practice: 40 (supp 1): S21-S25.
Hu, F. B., Sigal, R. J., Rich – Edwards, J. W., Colditz, G. A., Solomon, C. G., Willet, W.
C., Speizer, F. C., Manson, J. E., (1999). Walking compared with vigorous physical
activity and risk of type 2 diabetes in women: a prospective study. JAMA: 282: 1433-
1439.
Hu, S., Martella, A., Anderson, W.R. and Chao, C.C., (2004). Role of cytokines in
lipopolysaccharide- induced functional and structural abnormalities of astrocytes. GLIA.
10(3): 227-234.
International Diabetes Federation, (2010). Prevalence Estimates of Diabetes Mellitus
(DM), 2010-AFR http://www.idf.org/content/afr-data
University of Ghana http://ugspace.ug.edu.ghUniversity of Ghana http://ugspace.ug.edu.gh

72
Jonsson, B., (2002). Revealing the cost of type II diabetes inEurope.
Diabetologia; 45:S5-S12.
Kado, S., Nagase. T., and Nagata, N., (1999). Circulatin levels of interleukin-6, its
soluble interleukin-6/interleukin-6 receptor complexes in patients with type 2 diabetes
mellitus. Acta Diabetol. 36(1-2):67-72.
Kannel, W.B., Cupples, L.A., Ramaswami, R. and Stokes, J., (1991). Regional obesity
and risk of cardiovascular disease; the Framingham study. J Clin Epidemiol. 44:183-190.
Kingsley, G.R., (1942). The direct Biuret method for determination of serum proteins as
applied to photoelectric and visual colorimetry. J.Lab.Clin.Med; 27:840-845.
Knowler, W. C., Barrett Connor, E., Fowler, S. E., Hamman, R. F., Lachin J. M.,
Walker, E. A., Nahan, D. M., (2002). Reduction in the incidence of type 2 diabetes with
lifestyle intervention or metformin. Diabetes Prevention Program Research Group. New
England Journal of Medicine: 346(6):393-403.
University of Ghana http://ugspace.ug.edu.ghUniversity of Ghana http://ugspace.ug.edu.gh

73
Kristiansen, O. P. and Mandrup-Poulsen, T., (2005). Interleukin-6 and diabetes: the
good, the bad, or the indifferent? Diabetes. 54 (2):S114-24.
Knop, F., Vilsbol, T., Madsbad, S., Holst, J., and Krarup, T., (2007). Inappropriate
suppression of glucagon during OGTT but not during isoglycaemic IV glucose infusion
contributes to the reduced incretin effect in type 2 diabetes mellitus. Diabetologia, 50(4),
797-805.
Kuzuya, T. and Matsuda, A., (1997). Classification of diabetes on the basis of ethiology
versus degree of insulin deficiency. Diabetes Care, 20(2), 219-220.
Lean, M. E., (2000). Obesity: burdens of illness and strategies for prevention or
management. Drug Today; 36(11): 773-784.
Leddy, M.A., Power, M.L., and Schulkin, J., (2008). The impact of maternal obesity on
maternal and fetal health. Obstet Gynecol; 1(4)170-178.
Li, Y., Xu, W., Liao, Z., Yao, B., Chen, X., Huang, Z.,… Weng, J., (2004). Induction of
Long-term Glycemic Control in Newly Diagnosed Type 2 Diabetic Patients Is Associated
with Improvement of β-Cell Function. Diabetes Care, 27(11), 2597-2602.
University of Ghana http://ugspace.ug.edu.ghUniversity of Ghana http://ugspace.ug.edu.gh
74
Liu, D. P., Molyneaux, L., Chua E., Wang, Y. Z., Wu, C. R., Jing, H., Hu, L. N., Liu,
Y.J., Xu Z. R., Yue, D.K., (2002). Retinopathy in a Chinese population with type 2
diabetes: facors affecting the presence of this complication at diagonosis of diabetes.
Diabetes Research and Clinic Practice; 56:125-131.
Majaliwa, E. S., Elusiyan, B. E., Adesiyun, O.O., Laigong, P., Adeniran, A. K., Kandi,
C. M.,… Iughetti, L., (2008). Type 1 diabetes mellitus in the African population:
epidemiology and management challenges. Acta Biomed, 79(3), 255-259.
Marques-Vidal, P., Bastardot, F., von Kanel, R., Paccaud, F., Preisig, M., Waeber, G.
and Vollenweider, P., (2013). Association between circulating cytokine levels, diabetes
and insulin resistance in a population-based sample (CoLaus study). Clinical
Endocrinology, 78(2):232-242.
Mazzone, T., Chait, A., and Plutzky, J., (2008). Cardiovascular disease risk in type 2
diabetes mellitus: insights from mechanistic studies. The Lancet, 371(9626), 1800-1809.
McFarlane, S. I., Chaiken, R. L., Hirsch, S., Harrington, P., Lebovitz, H. E. and Banerji,
M. A., (2001). Near-normoglycaemic remission in African-Americans with Type 2
University of Ghana http://ugspace.ug.edu.ghUniversity of Ghana http://ugspace.ug.edu.gh
75
diabetes mellitus is associated with recovery of beta cell function. Diabetic Medicine.
18(1), 10-16.
Mbanya, J. C. N., Motala, A. A., Sobngwi, E., Assah, F.K. and Enoru, S. T., (2010).
Diabetes in sub-Saharan Africa. The Lancet, 375(9733), 2254-2266.
McLartey, D. G., Pollitt, C. and Sawai, A. B. M., (1990). Diabetes in Africa. Diabetic
Medicine, 7(8), 670-684.
Melmberg, K., Ryden, L., Efendic, S., Herlitz, J., Nicol, P., Waldenstrom, A., Wedel, H.,
Welin, L., (1995). Randomized trial of insulin-glucose infusion followed by
subcutaneous inslin treatment in diabetic patients with acute myocardial infarction
(DIGAMI study); effects on mortality at 1 year. Journal of the American College of
Cardology; 26(1): 57-65.
Morimoto, Y., (2008). Immunodeficiency overview. Prim Care 35 (1):159-157. National
Task Force on the Prevention and Treatment of Obesity (2000) Overweight, obesity, and
health risk. Archives of internal medicine: 160(7):898-904.
University of Ghana http://ugspace.ug.edu.ghUniversity of Ghana http://ugspace.ug.edu.gh

76
Motola, A. A., (2002).Diabetes trends in Africa. Diabetes Metab Res Rev, 18(S3), S14-
S20.
Motola, A. A., Omar, M. A. K. and Pirie, F. J., (2008). Epidemiology of diabetes in
Africa. The epidemiology of diabetes mellitus (2nd
edn). Chichester: Wiley, 133-146.
Neaton, J. D., Wentworth, D. N., Cutler, J., Stamler, J., Kuller, L., (1993). Risk factors
for death from different types of stroke: multiple risk factor intervention trial research
group. Ann Epidemiol; 3(5): 493-499.
Nerup, J. and Lernmark, A., (1981). Autoimmunity in insulin-dependent diabetes
mellitus, The American journal of medicine. 70 (1): 135-141.
Orban Z., Remaley, A.T., Sampson, M., Trajanoski, Z. and Chrousos, G.P., (1999). The
differential effect of food intake and beta-adrenergic stimulation on adipose-derived
hormones and cytokines in man. Journal of Clinical Endocrinology and Metabolism.
84:2126-2133.
Pan, X. P., Li, G. W., Hu, Y. H., Wang, J.X., Yang, W.Y., An Z.X., Hu, Z.X., Liu, J.,
Xiao, J.Z., Cao, H. B., Liu, P. A., Jiang, X. G., Jiang, Y. Y., Wang, J. P., Zheng, H.,
University of Ghana http://ugspace.ug.edu.ghUniversity of Ghana http://ugspace.ug.edu.gh
77
Zhang, H., Bennett, P. H., Howard, B. V., (1997). Effects of diet and exercise in
preventing NIDDM in people with impaired glucose tolerane. The Da Qing IGT and
Diabetes Study. Diabetes Care: 20(4) 537-544.
Perret, J. L., Bifane, E., Ngou-Milama, E., Moussavou-Kombila, J. B. and Nguemby-
Mbina, C., (1996). Types of sugar diabetes encountered in internal medicine in Gabon.
Med Trop (Mars), 56(1), 55-58.
Perret, J. L. and Nguemby-Mbina, C., (1991). Characteristics of the development of
insulin need in primary diabetes of adults in Gabon. Ann Soc Belg Med Trop, 71(3), 243-
249.
Peleg, A.Y., Weerarathna, T., McCarthy, J.S. and Davis, T.M., (2007). Common
infections in diabetes: Pathogenesis management and relationship to glycaemic control.
Diabetes Metab Res Rev. 23:3-13.
Pettitt, D. J., Nelson, R.G., Saad M. F., Bennett, P. H., Knowler, W. C., (1993). Diabetes
and obesity in the offspring of Pima Indian women with diabetes during pregnancy.
Diabetes care; 16(1):310-314.
University of Ghana http://ugspace.ug.edu.ghUniversity of Ghana http://ugspace.ug.edu.gh
78
Pickup, J.C. and Crook, M.A., (1998). Is type II diabetes mellitus a disease or the innate
immune system? Diabetologia. 41(10):1241-1248.
Pociot, F., Akolkar, B., Concannon, P., Erlich, H. A., Julier, C., Morahan, G, … Nerup,
J., (2010). Genetics of type 1 diabetes: what’s next? Diabets, 59(7), 1561-1571.
Polidori, D., (2001), Kahn SE. ß-Cell dysfuntion and failure in type 2 diabetes: Potential
Mechanisms. Diabetes 50: S160-S163.
Polychronakos, C. and Li, Q., (2011). Understanding type 1 diabetes through genetics:
advances and prospects. Nature Reviews Genetics, 12(11), 781-792.
Pratley, R. E. and Weyer, C., (2001). The role of impaired early insulin secretion in the
pathogenesis of type II diabetes mellitus. Diabetologia; 44 (8):929-945.
Predham, A.D., Manson, J.E., Rifai, N., Buring, J.E. and Ridker, P.M., (2001). C-
reactive protein, interleukin 6 and risk of developin type 2 diabetes mellitus. JAMA.
286:327-334.
University of Ghana http://ugspace.ug.edu.ghUniversity of Ghana http://ugspace.ug.edu.gh
79
Prentki, M., Joly, E., E1 Assaad, W., Rodnit, R., (2002). Malonyl-CoA signalling, lipids
partitioning, and glucolipotoxicity: role in beta-cell adaptation and failure in the etiology
of diabetes. Diabetes; 51 (suppl.3): S405-S413.
Reece, E. A., Leguizamon, G. and Wiznitzer, A., (2010). Gestational diabetes: the need
for a common ground. Obstetric Anesthesia Digest, 30(2), 84.
Ridker, P. M., Rifai, N., Stampfer, M. J. and Hennekens, C. H., (2000). Plasma
Concentration of Interleukin-6 and the Risk of Future Myocardial Infarction Among
Apparently Healthy Men. Circulation. 101: 1737-1772.
Rizza, R.A., (2010). Pathogenesis of fasting and postprandial hyperglycemia in type 2
diabetes: implications for therapy. Diabetes, 59(11), 2697-2707.
Rodriguez-Segade, S., Camina, M. F., Paz, J. M. and Del Rio, R., (1991). Abnormal
serum immunoglobulin concentrations in patients with diabetes mellitus clin chim Acta.
203: 135-142.
Rodriguez-Segade, S., Camina, M. F., Carnero, A., Lorenzo, M. J., Alban, A., Quinteiro,
C., and Lojo, S., (1996). High Serum IgA concentrations in patients with diabetes
University of Ghana http://ugspace.ug.edu.ghUniversity of Ghana http://ugspace.ug.edu.gh

80
mellitus: agewise distribution and relation to chromic complications clinicalchemistry. 42
(7): 1064-1067.
Ross, G., (2006). Gestational diabetes. Aust Fam Physician 35(6):392-6.
Saad, M.F., Knowler, W.C., Pettitt, D. J., Nelson R. G., Mott, D.M., Bennett, P. H.,
(1988). The natural history of impaired glucose tolerance in the pima Indians. New
England Journal of Medicine; 319 (23):1500-1506.
Schmidt, M.I., Duncan, B.B., Sharrett, A.R., Lindberg, G., Savage, P., Offenbacher, S.,
Azambuja, M.,Tracy, R., Heiss, G., (1999). Markers of inflammation and prediction of
diabetes mellitus in adults (Atherosclerosis Risk in Communities Study): Acohort study.
Lancert. 353:1649-1652.
Schmiemann, G., Kniehl, E., Gebhardt, K., Matejczyk, M.M. and Hummers-Pradier, E.,
(2010). The diagnosis of urinary tract infection. Dtsch Arztebl Int. 107(21):361-367.
Shetty, N., (1993). Immunology: Introductory textbook, 1st edition, Wiley Eastern
Limited. New Delhi. 20-37.
University of Ghana http://ugspace.ug.edu.ghUniversity of Ghana http://ugspace.ug.edu.gh
81
Singh, J. and Kulig, A., (1992) Effect of albumin and immunoglobulin A on
fructosamine assay. Clin Chem. 38:824-30.
Spranger, J., Kroke, A., Mohlig, M., Hoffmann, K., Bergmann, M.M., Ristow, M.,
Boeing, H. and Pfeiffer, A.F.H., (2003). Inflammatory cytokines and the risk to develop
type 2 diabetes: Results of the prospetive population-based European prospective
investigation into cancer and nutrition (EPIC) - Potsdam study.Diabetes. 52(3):812-817.
Spayed, R. W., Bruschi, B., Burdick, B. A., Dappen, G. M. and Eikenberg, J. N., (1978).
Multilayer Film Elements for Clinical Analysis. Clin Chem; 24:1348-1350.
Sandler, S., Bendtzen, K., Eizirik, D., Welsh, M., (1990). Interleukin-6 affects insulin
secretion and glucose metabolism of rat pancreatic islets in vitro. Endocrinology.
126:1288-1294.
Southern, C., Schulster, D., Green, I.C., (1990). Inhibition of insulin secretion from rat
islets of Langerhans by interleukin-6. Biochem J. 272:243-245.
University of Ghana http://ugspace.ug.edu.ghUniversity of Ghana http://ugspace.ug.edu.gh
82
Stratton, I. M., Adler A.I., Neil, H. A., Matthews, D.R., Manley, S. E., Cull, C. A.,
Hadden, D., Turner, R. C., Holman, R.R., (2000). Association of glycaemia with
macrovascular complications of type 2 diabetes (UKPDS 35), prospective observational
study. British Medical Journal; 321: 405-412.
Tanyigna, K. B., Onah J. A. and Bello, C. S. S., (2004). Serum Immunoglobulins and
circulating immune complexes in Nigerians on the Jos plateau. Ghana Medical Journal.
38 (1): 28-31.
The Committee of the Japan Diabetes Society on the Diagnostic Criteria of Diabetes,
Seino, Y., Nanjo, K., Tajima, N., Kadowaki, T., Kashiwagi, A., …Ueki, K., (2010).
Report of the Committee on the Classification and Diagnostic Criteria of Diabetes
Mellitus. Journal of Diabetes Investigation, 1(5), 212-228.
The InterAct Consortium, (2012). Long-Term Risk of Incident Type 2 Diabetes and
Measures of Overall and Regional Obesity: The EPIC-InterAct Case-Cohort Study. PLoS
Med, 9(6):1-16.
The U.S. National Library of Medicine, (2012). Quantitative Nephelometry. NIH
http://www.nlm.nih.gov/medlineplus/ency/article/003545.htm.
University of Ghana http://ugspace.ug.edu.ghUniversity of Ghana http://ugspace.ug.edu.gh

83
Thomas, F., Balkau, B., Vauzella Kervoedan, F., papoz, L., (1994). Maternal effect and
familial aggregation in NIDDM. The CODIAB Study. CODIAB-INSERM-ZENECA
Study Group. Diabetes; 43:63-67.
Tripathy, B. B. and Samal, K. C., (1997). Overview and Consensus Statement on
Diabetes in Tropical Areas. Diabetes/Metabolism Reviews, 13(1), 63-76
Tuomilehto, J., Lindstrom, J., Eriksson J., Boldrin, J. G., Keinanen-Kinkaanniemi, S.,
Louheranta, A., Rastas, M., Salminen, V., Uusitupa, M., Valle, T.T., Hamalainen, H.,
Llanne-Parikka, P., Laakso M., (2001). Prevention of type 2 diabetes mellitus by change
in lifestyle among subjects with impaired glucose tolerance. New England Journal of
Medicine; 344(18)1343-1350.
UK Prospective Diabetes Study Group, (1988). Prospective Diabetes Study IV.
Characteristics of newly presenting type 2 diabetic patients: male preponderance and
obesity at different ages. Multi-center study. Diabetic Medicine; 5:154-159.
University of Ghana http://ugspace.ug.edu.ghUniversity of Ghana http://ugspace.ug.edu.gh

84
UK Prospective Diabetes Study Group, (1995). UK Prospective Diabetes Study Group
16. Overview of 6 years ‘therapy of type II diabetes: a progressive disease. Diabetes;
44(11): 1249-1258.
van den Berg, R., van Hoogstraten, I, and van Agtmael, M., (2009). Non-responsiveness
to hepatis B vaccination in HIV seropositive patients: Possible causes and solutions.
AIDS. 11:157-164.
Wang, Y., Rimm, E.B., Stampfer, M.J., Willett, W.C. and Hu, F.B., (2005). Comparison
of abdominal adiposity and overall obesity in predicting risk of type 2 diabetes among
men. Am J Clin Nutr. 81:555-563.
Wegner, M., Araszkiewicz, A., Piorunska-Stolzmann, M., Wierusz-Wysocka, B. and
Zozulinska-Ziolkiewicz, D., (2013). Association Between IL-6 Concentration and
Diabetes-Related Variables in DM1 Patients with and without Microvascular
Complications. Inflammation. 36 (3): 723-728.
West, K. M., (1975). Substantial Differences in the Diagnostic Criteria Used by Diabetes
Experts. Diabetes, 24(7), 641-644. Doi: 10.2337/diad.24.7641.
Wilkin, T. J., (2001). The accelerator hypothesis: weight gain as the missing link
between Type I and Type II diabetes. Diabetologia, 44(7), 914-922.
University of Ghana http://ugspace.ug.edu.ghUniversity of Ghana http://ugspace.ug.edu.gh
85
Williams, D. R., Wareham, N. J., Brown, D.C., Byrne, C.D., Clark, P. M., Cox, L.J.,
Day, N.E., Hales, C.N., Palmer, C.R., (1995). Undiagnosed glucose intolerance in the
community; the isle of Ely Diabetes Project. Diabetic Medicine; 12(1): 30-35.
Wolf, H. U., Lang, W., Zander, R., (1984). Alkaline hematin D-575, a new tool for the
determination of haemoglobin as an alternaive to the Cyanhemoglobin method. Clin.
Chem. Acta; 136;83-104.
World Health Organization, (1980). WHO Expert Committee on Diabetes Mellitus:
second report. World Health Organ Tech Rep Ser, 646, 1-80.
World Health Organization, (1985). Diabetes mellitus. Report of a WHO Study Group.
World Health Organ Tech Rep Ser, 727, 1-113.
World Health Organization, (1999). Definition, Diagnosis and classification of
Diabetes Mellitus and Its complications: Report of WHO Consultation.
WHO/NCD/NCS/99.2. Geneva: WHO.
University of Ghana http://ugspace.ug.edu.ghUniversity of Ghana http://ugspace.ug.edu.gh
86
World Health Organization, (2003) Diabetes. Geneva: WHO. http: //
www.who.int/ncd/dia/databases.4htm.
World Health Organization, (2011). Waist circumference and waist-hip ratio: report of
a WHO expert consultation, Geneva, 8-11 December 2008. 1-31.
Xiang. A. H., Kjos, S. L., Takayanagi, M., Trigo, E. and Buchanan, T. A., (2010).
Detailed physiology characterization of the development of type 2 diabetes in Hispanic
women with prior gestational diabetes mellitus. Diabetes, 59(10), 2625-2630.
Xu, H., Barnes, G.T., Yang, Q., Tan, G., Yang, D., Chou, C.J., Sole, J., Nicholas, A.,
Ross, J.s., Tartaglia, L.A. and Chen, H., (2003). Chronic inflammation in fat plays a
crucial role in the development of obesity-related insulin resistance. J Clin Invest.
112:1821-1830.
Young, P. F., Chee, R. and Grimbacher, B., (2008). Hypogammaglobulinaemia.
Immunol Allergy Clin North Am., 28 (4):691-713.
Yudkin, J.S., Kumari, M., Humphries, S.E., Mohammed-Ali, V., (2000).
Inflammation, obesity, stress and coronary heart disease: is interleukin the link?
Atherosclerosis. 148:209-214.
University of Ghana http://ugspace.ug.edu.ghUniversity of Ghana http://ugspace.ug.edu.gh
87
Zimmet, P., Alberti, K. G., shaw, J., (2001). Global and societal implication of the
diabetes epidemic. Nature; 414:782-787.
Zimmet, P., Shaw, J. & Alberti, K. G., (2003). Preventing type 2 diabetes and the
dysmetabolic syndrome int he real world: a realistic view. Diabetic Medicine; 20(9):63-
702.
University of Ghana http://ugspace.ug.edu.ghUniversity of Ghana http://ugspace.ug.edu.gh
88
APPENDICES
APPENDIX A: ETHICAL APPROVAL
University of Ghana http://ugspace.ug.edu.ghUniversity of Ghana http://ugspace.ug.edu.gh

89
APPENDIX B: INFORMED CONSENT FORM
TITLE OF STUDY: ‘Serum Immunoglobulin Levels in Type 2 Diabetic Patients in
Korle-Bu Teaching Hospital, Ghana
Serum immunoglobulin levels are determined routinely in clinical practice because they
provide key information on the humoral immune status. Determining the distribution of
immunoglobulin levels in general populations is important for interpreting reference
values.
The major contributor to the increasing number of diabetic patients is type 2 diabetes.
Diabetes is believed to be associated with changes in serum immunoglobulin level
causing these levels to rise or fall. These immunoglobulins play important roles in the
body’s immune system. Studies have shown that increased concentrations of some
circulating immunoglobulins may be non-specific signs of the development of diabetic
complications. Furthermore, immunoglobulin levels which may serve as signs in the
aetiogenesis of diabetic complications have not been studied in Ghana. It is the
researcher’s belief that the elevated immunoglobulin levels in diabetes may be an early
warning sign for the development of diabetic complications and by taking part in this
research; you will help address some of these issues.
I………………………………………………have been asked to volunteer as a
participant in the research study “Immunoglobulin levels in diabetic patients in Ghana”.
I have been informed of the purpose of the study and how it will help in the management
of the disease to reduce morbidity and mortality.
I have also been told that the procedure of the study is that:
I will have my name, age and sex taken and where I come from will be noted and
everything recorded on a questionnaire. However, though the field collection will bear
my name I will be referred to only by a unique identification number. High
confidentiality will be maintained at all time on my information and personality.
University of Ghana http://ugspace.ug.edu.ghUniversity of Ghana http://ugspace.ug.edu.gh

90
I will be asked to provide blood sample. A trained technician will take venous blood from
my arm using a syringe and needle. This may cause minor pain, discomfort, and bruising
at the site of needle insertion.
The risk and discomfort are:
By participating in this research, I am likely to have some discomfort. This includes the
discomfort of questioning and the pain of collection of blood. This team will try and
reduce the chances of those risks happening, but in case it happens, they will provide me
with free medical care in hospital.
Benefit:
There is no personal benefit that I will derive by participating in this study except my
results could be released to my doctor upon my request.
Confidentiality:
The information that is collected for this research project will be kept confidential.
Information about me that will be collected for the study will be stored in a file which
will not have my name on it, but a number assigned to it. The number assigned will not
be disclosed to anyone except the principal investigator. The findings of this study may
be reported at meetings or in medical journals, but my name will not be used in the
report.
My right to refuse or withdraw:
I have the right to take part in this research or not without losing any benefits that I would
normally have. I may stop participating in this research anytime I wish.
The alternatives to participating:
I have been told that this study does not involve the administration of investigational
drugs or use of new curative procedures.
University of Ghana http://ugspace.ug.edu.ghUniversity of Ghana http://ugspace.ug.edu.gh
91
Contact information:
If I have any questions, I may ask them now or later, I may contact:
COLLINS P. K. BOTCHEY, Department of Chemical Pathology, UGMS Korle-Bu
(Principal Investigator)
Mobile: 0540980640
OR
DR. H. ASARE-ANANE, Department of Chemical Pathology, UGMS Korle-Bu
(Principal Supervisor)
Mobile: 0246024002
Consent
I have read (or have had someone interpret to me) the entire explanation about this study
and have been given the opportunity to discuss any questions. I understand the nature,
risks and benefits of the study and that I may withdraw at any time. I hereby consent to
take part in this study.
…………………………………. Date………………...
Signature of participant
………………………………….. Date………………...
Signature of Witness
…………………………………. Date………………...
Signature of Investigator
University of Ghana http://ugspace.ug.edu.ghUniversity of Ghana http://ugspace.ug.edu.gh

92
APPENDIX C: STUDY QUESTIONNAIRE – DATA SHEET
Name (Surname in blocks): ……………………………………
Date: ……………………………………… Serial Number: ……………………..
Contact Tel. Number: ………………………
Email: …………………………………………………………….
Address: ………………………………………………………….
Demographics and Anthropometric Characteristics
1. Age: ……………………………. (35-60 years)
2. Height (m): ………………….. 3. Weight (kg): …………...... 4. BMI: ………………
5. BP: …………………… 6. Pulse: …………… 7. Waist Circumference
(Pleases tick [ √ ] the appropriate box where applicable)
7. Sex: [ ] Male
[ ] Female
8. Marital status: [ ] Single
[ ] Married
[ ] Divorced
[ ] Widowed
9. Number of children: [ ] None
[ ] 1 – 2
[ ] 3 – 4
[ ] 5 or more
University of Ghana http://ugspace.ug.edu.ghUniversity of Ghana http://ugspace.ug.edu.gh

93
10. Level of education: [ ] None
[ ] Primary
[ ] Secondary
[ ] Tertiary
11. Occupation: [ ] Unemployed
[ ] Government worker
[ ] Trader
[ ] Others
Lifestyle
12. What type of food do you mostly eat?
[ ] More carbohydrates
[ ] Less carbohydrates
[ ] More meat or fish
[ ] Less meat or fish
[ ] More fruits
[ ] Less fruits
[ ] More vegetables
[ ] Less vegetables
13. How many times do you eat in a day?
[ ] Two
[ ] Three
University of Ghana http://ugspace.ug.edu.ghUniversity of Ghana http://ugspace.ug.edu.gh

94
[ ] Four
[ ] Five
14. Do you Exercise? [ ] Yes
[ ] No
15. If yes to question 19, how many times a week do you exercise?
[ ] Once a week
[ ] Twice a week
[ ] 3-5 times a week
[ ] Everyday of the week
Medical History /Assessment of diabetic complications:
16. Are you diabetic? [ ] Yes If yes, how long have you had it?............
[ ] No
17. Are you hypertensive? [ ] Yes If yes, how long have you had it?............
[ ] No
17. Have you had any infections such as malaria, typhoid or hepatitis B in the past week?
[ ] Yes If yes, how long have you had it?............
[ ] No
University of Ghana http://ugspace.ug.edu.ghUniversity of Ghana http://ugspace.ug.edu.gh

95
Any other information/Remarks:
……………………………………………………………………..………………………………
………………………………………………………………………………………………………
University of Ghana http://ugspace.ug.edu.ghUniversity of Ghana http://ugspace.ug.edu.gh
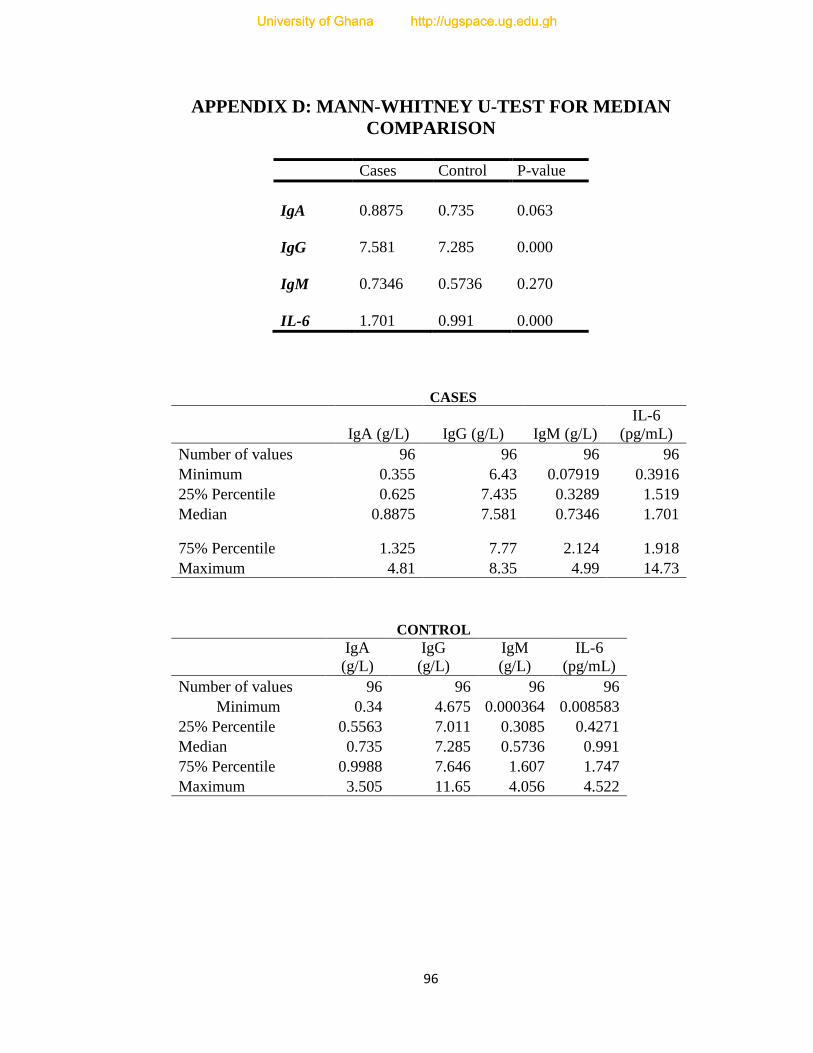
96
APPENDIX D: MANN-WHITNEY U-TEST FOR MEDIAN
COMPARISON
Cases Control P-value
IgA 0.8875 0.735 0.063
IgG 7.581 7.285 0.000
IgM 0.7346 0.5736 0.270
IL-6 1.701 0.991 0.000
CASES
IgA (g/L) IgG (g/L) IgM (g/L)
IL-6
(pg/mL)
Number of values 96 96 96 96
Minimum 0.355 6.43 0.07919 0.3916
25% Percentile 0.625 7.435 0.3289 1.519
Median 0.8875 7.581 0.7346 1.701
75% Percentile 1.325 7.77 2.124 1.918
Maximum 4.81 8.35 4.99 14.73
CONTROL
IgA
(g/L)
IgG
(g/L)
IgM
(g/L)
IL-6
(pg/mL)
Number of values 96 96 96 96
Minimum 0.34 4.675 0.000364 0.008583
25% Percentile 0.5563 7.011 0.3085 0.4271
Median 0.735 7.285 0.5736 0.991
75% Percentile 0.9988 7.646 1.607 1.747
Maximum 3.505 11.65 4.056 4.522
University of Ghana http://ugspace.ug.edu.ghUniversity of Ghana http://ugspace.ug.edu.gh
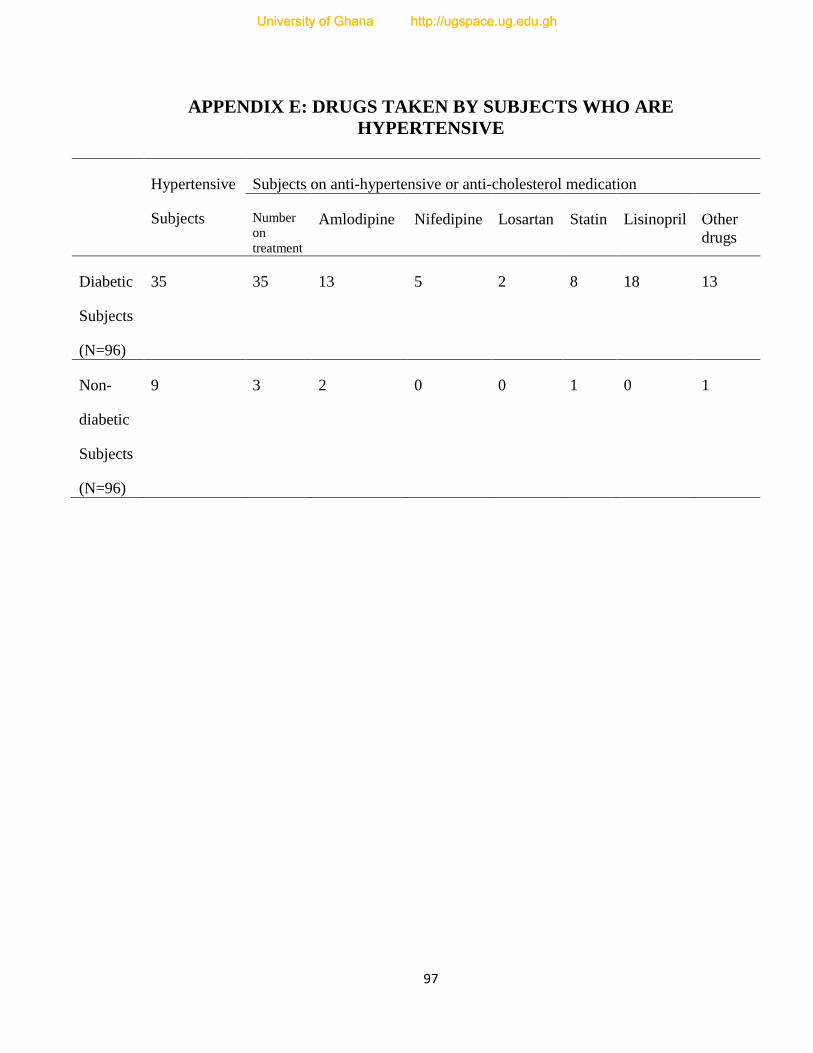
97
APPENDIX E: DRUGS TAKEN BY SUBJECTS WHO ARE
HYPERTENSIVE
Hypertensive
Subjects
Subjects on anti-hypertensive or anti-cholesterol medication
Number
on
treatment
Amlodipine Nifedipine Losartan Statin Lisinopril Other
drugs
Diabetic
Subjects
(N=96)
35 35 13 5 2 8 18 13
Non-
diabetic
Subjects
(N=96)
9 3 2 0 0 1 0 1
University of Ghana http://ugspace.ug.edu.ghUniversity of Ghana http://ugspace.ug.edu.gh