Embed Size (px)
Citation preview

Faculty of Physical ScienceUniversity of Iceland
2019
Faculty of Physical ScienceUniversity of Iceland
2019
Immunoglobulin G in calf serumand bovine colostrum in Icelandic
cattle
Rannveig Ósk Jónsdóttir

IMMUNOGLOBULIN G IN CALF SERUM ANDBOVINE COLOSTRUM IN ICELANDIC CATTLE
Rannveig Ósk Jónsdóttir
15 ECTS thesis submitted in partial fulfillment of aBaccalaureus Scientiarum degree in Biochemistry
AdvisorsCharlotta Oddsdóttir
Jóna Freysdóttir
Faculty of Physical ScienceSchool of Engineering and Natural Sciences
University of IcelandReykjavik, May 2019
Immunoglobulin G in calf serum and bovine colostrum in Icelandic cattleMeasured immunoglobulin G concentration in calf serum and bovine colostrum in Ice-landic cattle15 ECTS thesis submitted in partial fulfillment of a B.Sc. degree in Biochemistry
Copyright c© 2019 Rannveig Ósk JónsdóttirAll rights reserved
Faculty of Physical ScienceSchool of Engineering and Natural SciencesUniversity of IcelandDunhagi 5107, Reykjavik, ReykjavikIceland
Telephone: 525 4000
Bibliographic information:Rannveig Ósk Jónsdóttir, 2019, Immunoglobulin G in calf serum and bovine colostrumin Icelandic cattle, B.Sc. thesis, Faculty of Physical Science, University of Iceland.
Printing: Háskólaprent, Fálkagata 2, 107 ReykjavíkReykjavik, Iceland, May 2019

Abstract
Calves do not receive immunoglobulins (Igs) across the placenta from the motherand therefore it is important that they receive it from the colostrum. They need toreceive enough colostrum within 24 hours after birth as the intestine uptake ceasesafter that. Unpublished analysis of colostrum from Icelandic cattle has shown IgGconcentration to be lower compared with other breeds. Therefore, it is importantto check whether the calves receive sufficient quantities of Igs from the colostrumuntil their immune system begin to produce Igs. Blood samples were taken from11 calves, at birth and 24 hours later, and corresponding 11 colostrum sampleswere taken from their mothers and the concentration of IgG measured by ELISAmethod. Measurements showed that the concentration of IgG in serum 24 hourspostpartum was 8.02 mg/mL and 11.54 mg/mL in colostrum at birth. Correlationbetween IgG concentration in colostrum and IgG concentration in serum at 24 hourswas found. Although the IgG concentration is lower than in other types of cattle,Icelandic calves are at good health so presumably they do get enough IgG for theenvironment they live in. These results need to be repeated with a larger samplegroup.
Útdráttur
Kálfar fá ónæmisglóbúlín ekki yfir fylgju frá móður og því er mikilvægt að þeir fáiþað með broddi. Nauðsynlegt er að þeir fái það fyrstu 24 tímana frá burði þarsem meltingarfæri þeirra hætta eftir það að taka upp ónæmisglóbúlínin. Óbirtarmælingar á íslenskum kúabroddi hafa sýnt að ónæmisglóbúlín G sé í lægri kantinumog því er mikilvægt að athuga hvort að kálfarnir fái nægilegt magn ónæmisglóbúlínaúr broddinum þar til þeir byrja að framleiða ónæmisglóbúlín sjálfir. Mælingar vorugerðar á blóðsýnum 11 kálfa, strax eftir burð og 24 tímum seinna, og samsvarandi 11broddsýnum úr mæðrum þeirra með ELISA mælingu. Mælingar sýndu að styrkurónæmisglóbúlíns G var 8,02 mg/mL í sermi kálfa 24 tímum eftir burð og 11,54mg/mL í broddi. Þá sýndu mælingar samband á milli IgG styrks í broddi og IgGstyrks í blóði við 24 tíma samsvarandi kálfs. Þrátt fyrir að styrkur ónæmisglóbúlínsG sé lægri en hjá öðrum nautgripategundum þá eru íslenskir kálfar heilsuhraustirog að öllum líkindum fá þeir því nóg magn miðað við það umhverfi sem þeir lifa í.Þessar niðurstöður þarf að endurtaka í stærri rannsókn með fleiri sýnum.
v


Contents
List of Figures ix
List of Tables xi
Acknowledgments xiii
1. Introduction 11.1. Immunuglobulins . . . . . . . . . . . . . . . . . . . . . . . . . . . . . 11.2. ELISA . . . . . . . . . . . . . . . . . . . . . . . . . . . . . . . . . . . 31.3. Cattle breeds . . . . . . . . . . . . . . . . . . . . . . . . . . . . . . . 51.4. Colostrum and passive transfer immunity . . . . . . . . . . . . . . . . 61.5. Aim of the project . . . . . . . . . . . . . . . . . . . . . . . . . . . . 7
2. Materials and Methods 92.1. Samples . . . . . . . . . . . . . . . . . . . . . . . . . . . . . . . . . . 9
2.1.1. Serum samples . . . . . . . . . . . . . . . . . . . . . . . . . . 92.1.2. Colostrum samples . . . . . . . . . . . . . . . . . . . . . . . . 9
2.2. ELISA . . . . . . . . . . . . . . . . . . . . . . . . . . . . . . . . . . . 102.2.1. Calculations . . . . . . . . . . . . . . . . . . . . . . . . . . . . 13
2.3. Refractometry . . . . . . . . . . . . . . . . . . . . . . . . . . . . . . . 142.4. AEA . . . . . . . . . . . . . . . . . . . . . . . . . . . . . . . . . . . . 152.5. Statistic and processing . . . . . . . . . . . . . . . . . . . . . . . . . . 15
3. Results 173.1. Calves and cows . . . . . . . . . . . . . . . . . . . . . . . . . . . . . . 173.2. IgG concentration . . . . . . . . . . . . . . . . . . . . . . . . . . . . . 19
3.2.1. ELISA measurements . . . . . . . . . . . . . . . . . . . . . . . 193.2.2. Refractometry . . . . . . . . . . . . . . . . . . . . . . . . . . . 20
3.3. AEA . . . . . . . . . . . . . . . . . . . . . . . . . . . . . . . . . . . . 213.4. Comparison . . . . . . . . . . . . . . . . . . . . . . . . . . . . . . . . 22
4. Discussion 254.1. ELISA . . . . . . . . . . . . . . . . . . . . . . . . . . . . . . . . . . . 25
4.1.1. Dilutions . . . . . . . . . . . . . . . . . . . . . . . . . . . . . . 264.2. Refraction measurement . . . . . . . . . . . . . . . . . . . . . . . . . 264.3. Sample herd . . . . . . . . . . . . . . . . . . . . . . . . . . . . . . . . 27
vii
Contents
4.4. AEA . . . . . . . . . . . . . . . . . . . . . . . . . . . . . . . . . . . . 284.5. Next steps . . . . . . . . . . . . . . . . . . . . . . . . . . . . . . . . . 284.6. Conclusion . . . . . . . . . . . . . . . . . . . . . . . . . . . . . . . . . 29
Bibliography 31
A. Appendix 35A.1. Feeding . . . . . . . . . . . . . . . . . . . . . . . . . . . . . . . . . . 35A.2. Serum samples . . . . . . . . . . . . . . . . . . . . . . . . . . . . . . 36A.3. ELISA; Setup and OD . . . . . . . . . . . . . . . . . . . . . . . . . . 37
viii
List of Figures
1.1. Basic structure of Ig, showing Fc and Fab regions of the protein, aswell as the monomer, dimer and pentamer form (Thermo Fisher Sci-entific, nd). . . . . . . . . . . . . . . . . . . . . . . . . . . . . . . . . 2
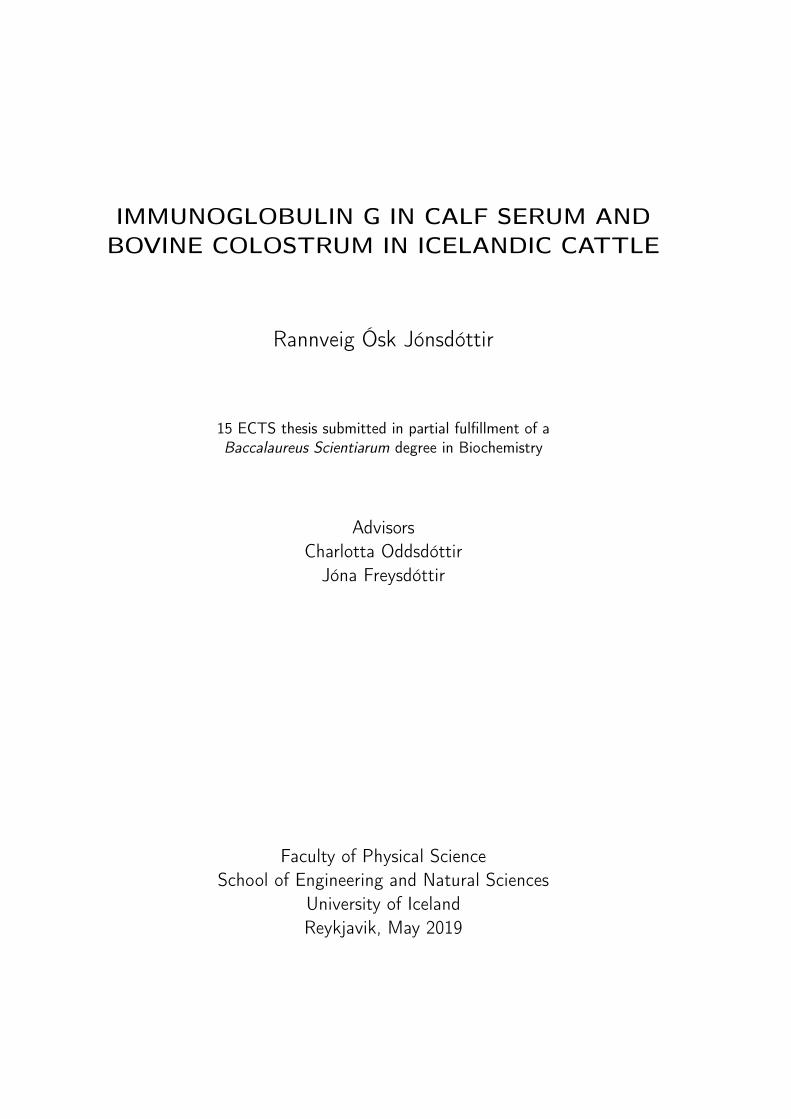
1.2. Schematic figure of sandwich ELISA, showing how the antibody isbound to the surface, which then binds to bovine IgG. Another an-tibody (detection antibody), conjugated with biotin, binds to thebovine IgG. Finally streptavidin, conjugated with an enzyme, bindto the biotin. The enzyme catalyzes a reaction of a substrate, whichresults in a coloured product, changing the colour of the solution. . . 4
2.1. Standard curve for IgG concentration, by refractometer measurments.The equation for best fit is y = 11.563x− 207.54, R2 = 1. . . . . . . . 14
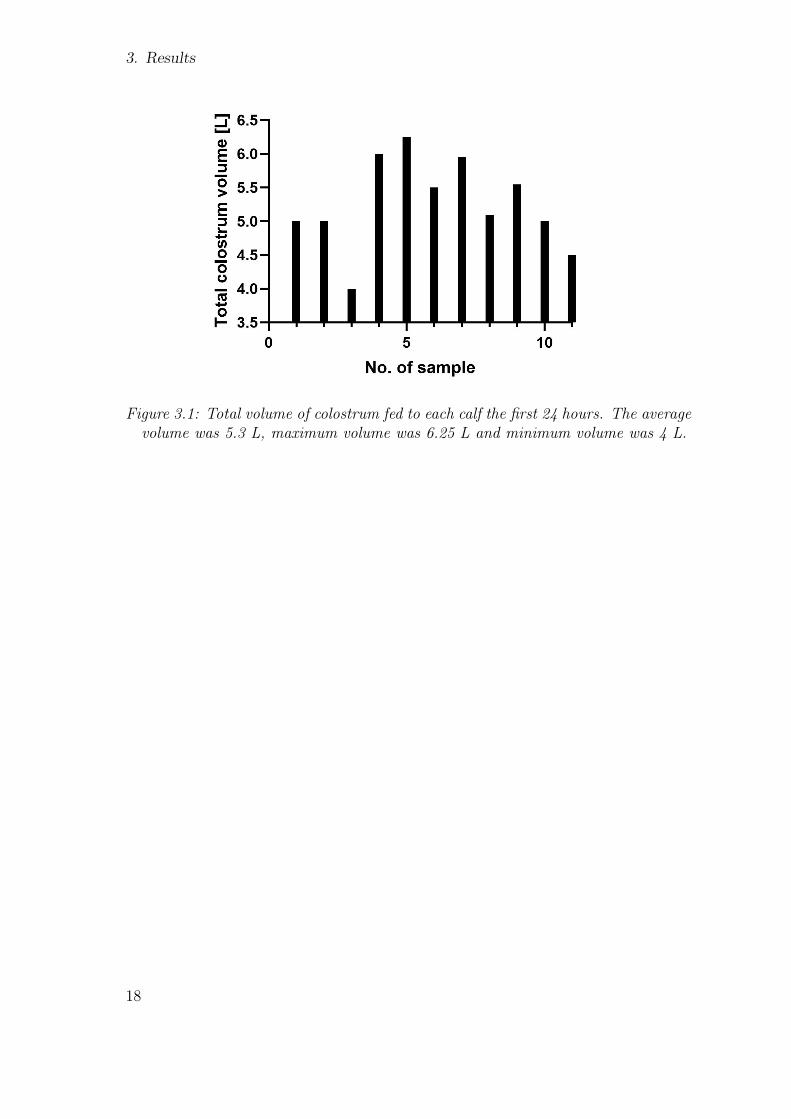
3.1. Total volume of colostrum fed to each calf the first 24 hours. Theaverage volume was 5.3 L, maximum volume was 6.25 L and minimumvolume was 4 L. . . . . . . . . . . . . . . . . . . . . . . . . . . . . . . 18
3.2. AEA for calves weighed at birth (See Table 3.1). Blue circles areAEA calculated from IgG concentration in colostrum measured withELISA and red squares are AEA calculated from IgG concentrationestimated with refraction. . . . . . . . . . . . . . . . . . . . . . . . . 21
3.3. Distribution of IgG concentration in all samples shown in columngraphs. a) shows IgG concentration measured in A, B and colostrumsamples with ELISA and b) shows the IgG concentration measured inB and colostrum samples with refractometer and in colostrum sampleswith ELISA as comparison. . . . . . . . . . . . . . . . . . . . . . . . 22
ix
LIST OF FIGURES
3.4. Correlation between different groups. a) Shows no correlation be-tween IgG concentration in samples A and samples B measured withELISA. b) Shows correlation between IgG concentration in samplesB and colostrum measured with ELISA. c) Shows the IgG concentra-tion in colostrum measured with both ELISA (blue) and refraction(red) compared to IgG concentration in serum samples after 24 hours.Made in GraphPad. . . . . . . . . . . . . . . . . . . . . . . . . . . . . 23
3.5. Matrix showing correlation between all groups, measured and doc-umented. Data from Tables 3.1, 3.2 and 3.3 as well as Fig. 3.1.Blue shows positive correlation and red shows negative correlation.All slopes were not significant (P ≥ 0.05), except between colostrum[mg/mL] and sample B [mg/mL] (P = 0.039), both measured withELISA. Made in GraphPad. . . . . . . . . . . . . . . . . . . . . . . . 24
x
List of Tables
2.1. Showing how dilutions for each type of samples were prepared, firstnumber shows volume (µL) of Tween-Elisabuffer in a vial, and secondnumber of volume (µL) of sample taken and diluted. In the 2. and4. vial, the second number corresponds to the volume taken from aprevious vial, then containing a diluted sample. . . . . . . . . . . . . 11
2.2. Schematic set-up for Bovine IgG ELISA. . . . . . . . . . . . . . . . . 12
3.1. Basic information about calves and their mothers, used in this study. 17
3.2. Concentration of IgG in serum samples A, B, C (only for 005) and incolostrum samples measured with Bovine IgG ELISA. . . . . . . . . 19
3.3. IgG concentration in colostrummeasured with refractometer, for smalland big samples. . . . . . . . . . . . . . . . . . . . . . . . . . . . . . 20
3.4. AEA calculated for all calves weighed at birth. Both AEA calcu-lated from IgG concentration estimated with ELISA (IgGELISA) andrefraction (IgGBrix) can be seen. . . . . . . . . . . . . . . . . . . . . . 21
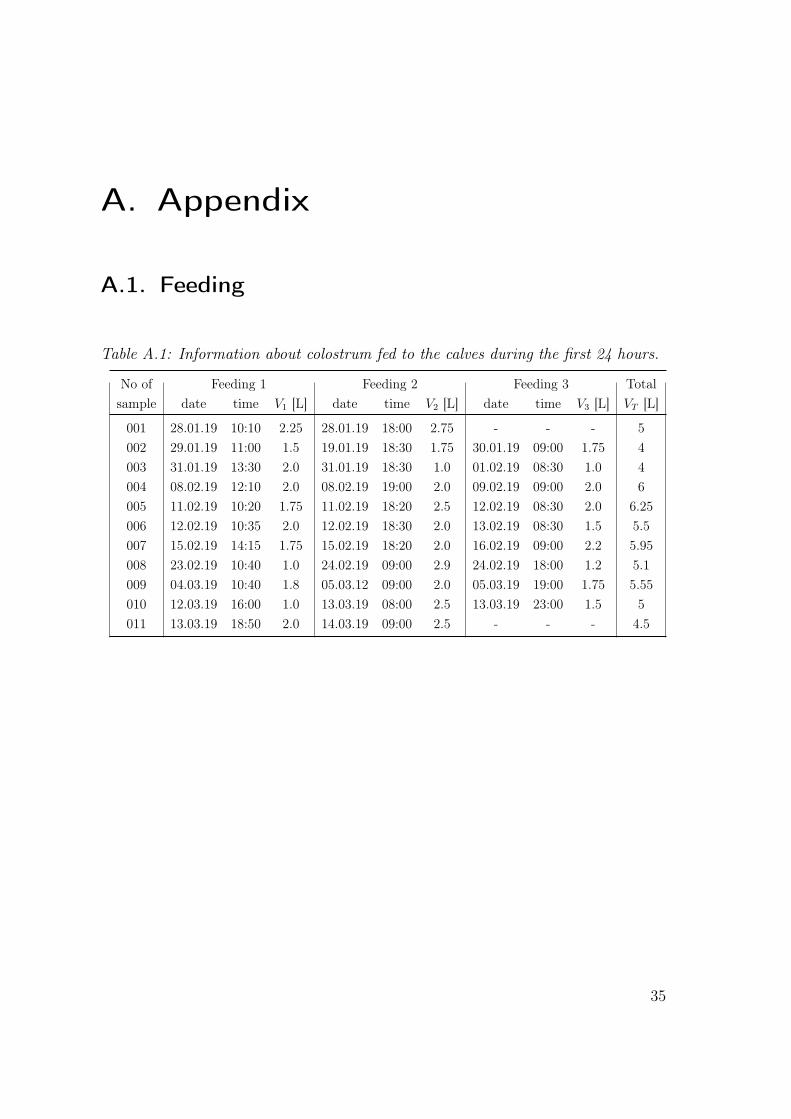
A.1. Information about colostrum fed to the calves during the first 24hours. . . . . . . . . . . . . . . . . . . . . . . . . . . . . . . . . . . . 35
A.2. Information about calf serum samples, when they were taken andwhen they were spun. . . . . . . . . . . . . . . . . . . . . . . . . . . . 36
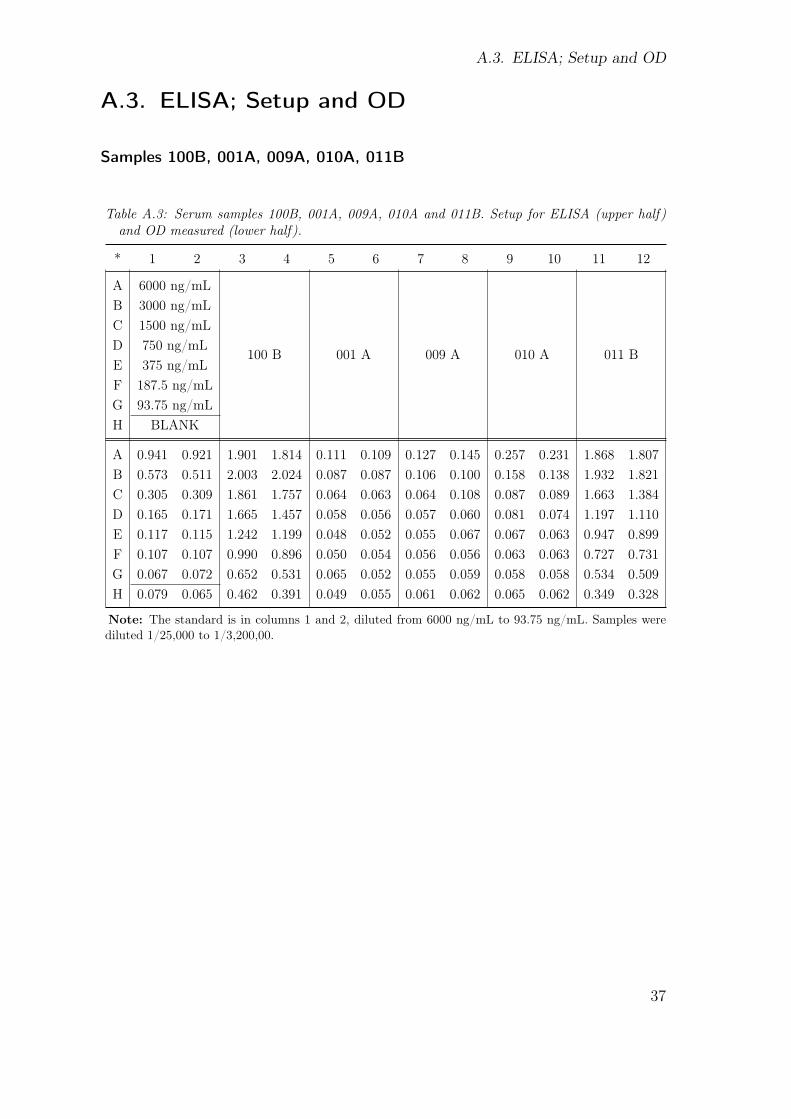
A.3. Serum samples 100B, 001A, 009A, 010A and 011B. Setup for ELISA(upper half) and OD measured (lower half). . . . . . . . . . . . . . . 37
A.4. Colostrum samples C 100, C 001, C 002, C 003, C 005. Setup forELISA (upper half) and OD measured (lower half). . . . . . . . . . 38
xi
LIST OF TABLES
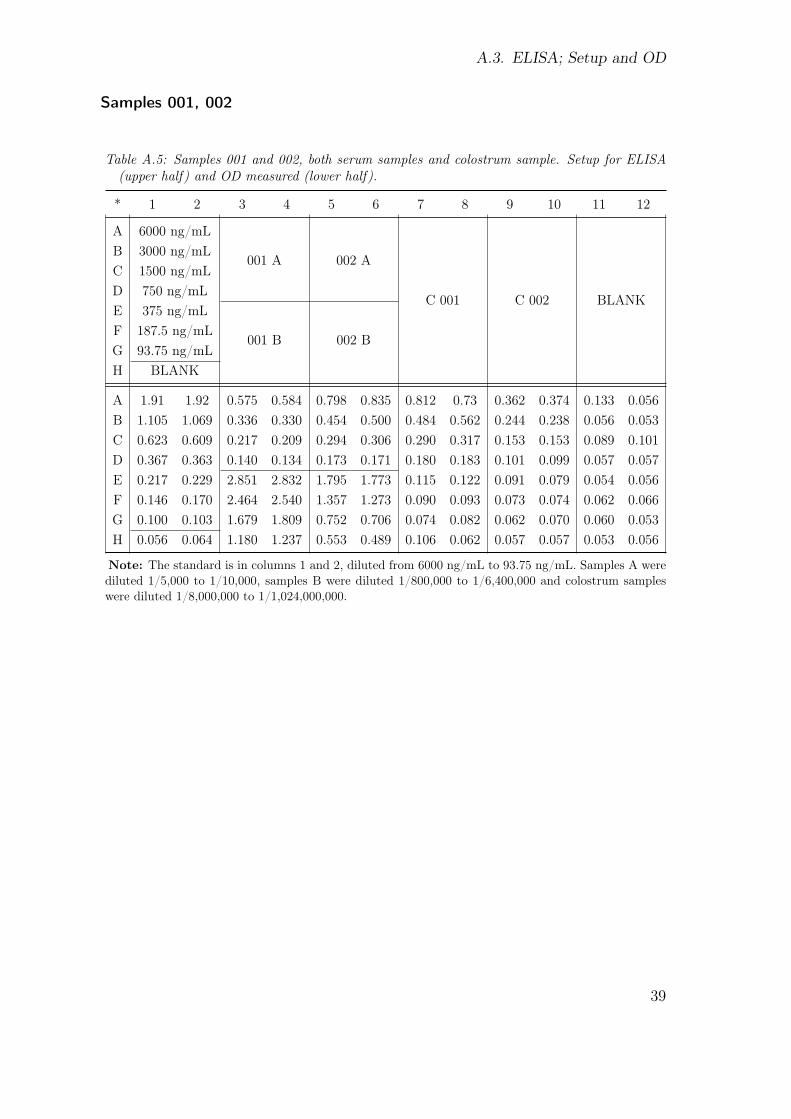
A.5. Samples 001 and 002, both serum samples and colostrum sample.Setup for ELISA (upper half) and OD measured (lower half). . . . . 39
A.6. Samples 001 and 002, both serum samples and colostrum sample.Setup for ELISA (upper half) and OD measured (lower half). . . . . 40
A.7. Samples 001 and 002, both serum samples and colostrum sample.Setup for ELISA (upper half) and OD measured (lower half). . . . . 41
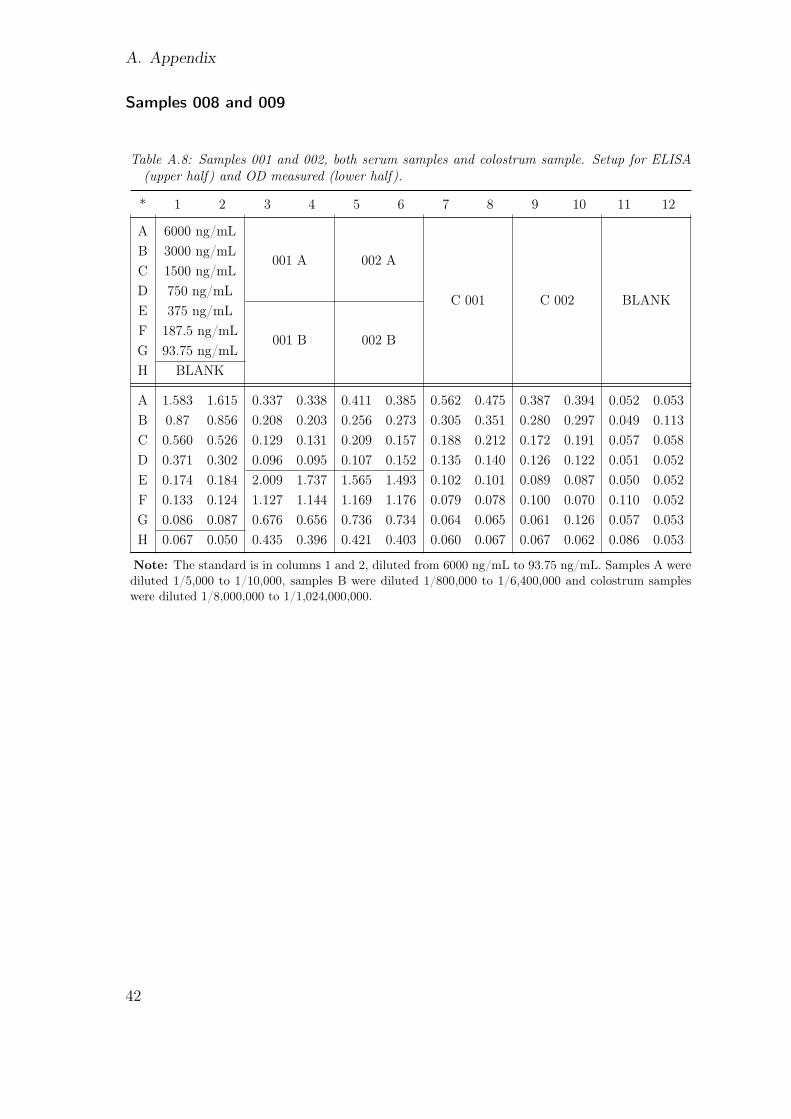
A.8. Samples 001 and 002, both serum samples and colostrum sample.Setup for ELISA (upper half) and OD measured (lower half). . . . . 42
A.9. Samples 010 and 011, both serum samples and colostrum sample.Setup for ELISA (upper half) and OD measured (lower half). . . . . 43
A.10.Sample 5, all three serum samples and colostrum sample. Setup forELISA (upper half) and OD measured (lower half). . . . . . . . . . 44
xii

Acknowledgments
I want to thank everyone at Department of Immunology for being so helpful andwelcoming, the staff at The Agricultural University of Iceland who helped withsampling and taking good care of the cattle. I want to thank Michelle Milnik forreading over and giving good advice.
I also want to thank both my advisors, Charlotta Oddsdóttir for allowing me to takepart in this project and Jóna Freysdóttir for all her valuable input.
And special thanks to Sara Rós Guðmundsdóttir, Agnes Gísladóttir and SólbjörtMaría Jónsdóttir for always being there and always having fun stories to tell.
xiii

1. Introduction
1.1. Immunuglobulins
The immune system is the body’s defence against parasitical, bacterial or viralinfections. It is essential for the existence of multicellular organisms. It is composedof many organs and tissues, as well as many types of immune cells in the blood. Theimmune cells can be divided into myeloid cells (that are all part of the innate immunesystem) and the lymphoid cells, where the main group is the lymphocytes. The bonemarrow produces the lymphocytes, which either complete their maturation there asB lymphocytes (B cells) or moves to the thymus and complete their maturationthere and leave as T lymphocytes (T cells). Both of them play an important partof the immune system, both to recognize a threat and to remember it (Murphy andWeaver, 2017).
The main function of the B cells is the production of immunoglobulins (Igs). Igsare one of the most abundant proteins in the blood, around 20% of total plasmaproteins by weight. When B cells mature in the bone marrow they start expressingantigen-specific receptors, called B-cells receptors (BCRs). Naive B cells expressmonomeric IgM and IgD on their surface but following activation and class switch,B-cells express IgG, IgA or IgE on their surface. When antigens binds to the antigenbinding sites on BCRs they stimulate B cells, leading to their differentation intoplasma cells. The plasma cells start to secrete the BCR which are then calledantibodies with the same specificity as the BCR. The binding site is made of closelylinked gene segments that by recombination link in an unique way, resulting in anenormous size of BCR repertoire (Pross and Grattendick, 2007). The structureof Igs is well known and is one the most common structural motif in multicellularorganisms, mediating specific protein-protein interactions (Zaccai and Yvonne Jones,2010).
Ig classes and functions
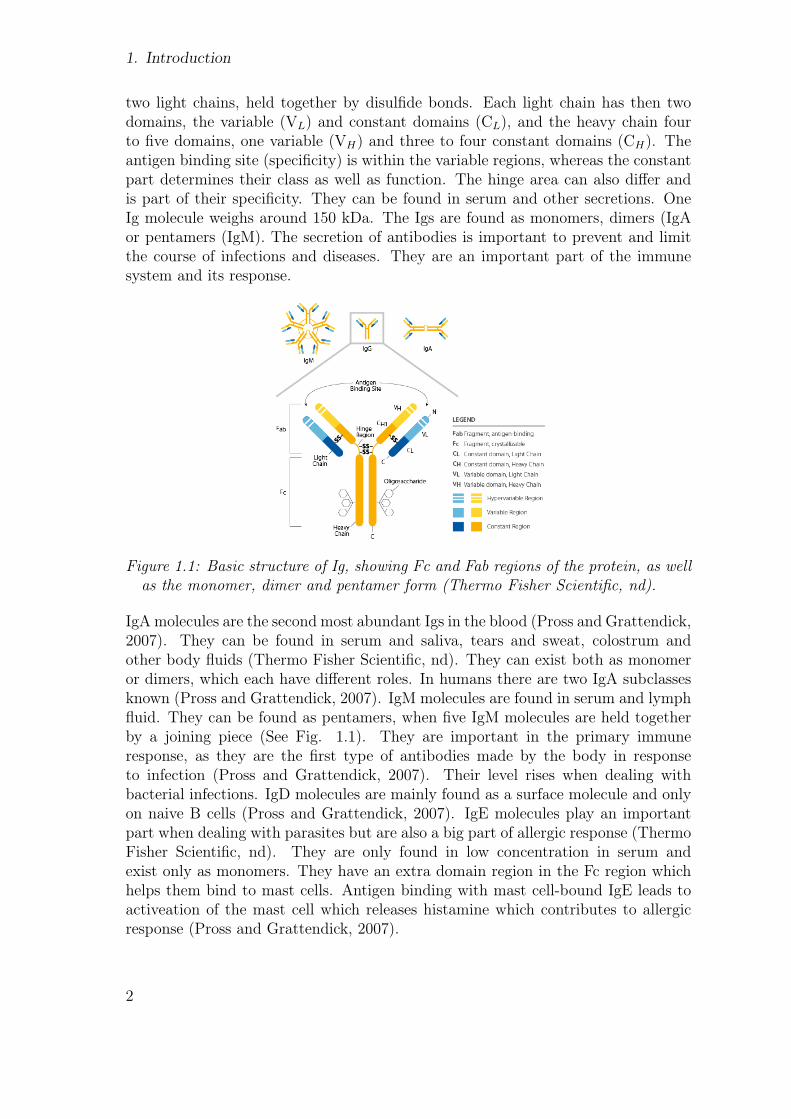
There are five classes of Igs, IgG, IgA, IgD, IgM and IgE and they share the samebasic structure (See Fig. 1.1). The Ig molecule is made of two heavy chains and
1
1. Introduction
two light chains, held together by disulfide bonds. Each light chain has then twodomains, the variable (VL) and constant domains (CL), and the heavy chain fourto five domains, one variable (VH) and three to four constant domains (CH). Theantigen binding site (specificity) is within the variable regions, whereas the constantpart determines their class as well as function. The hinge area can also differ andis part of their specificity. They can be found in serum and other secretions. OneIg molecule weighs around 150 kDa. The Igs are found as monomers, dimers (IgAor pentamers (IgM). The secretion of antibodies is important to prevent and limitthe course of infections and diseases. They are an important part of the immunesystem and its response.
Figure 1.1: Basic structure of Ig, showing Fc and Fab regions of the protein, as wellas the monomer, dimer and pentamer form (Thermo Fisher Scientific, nd).
IgA molecules are the second most abundant Igs in the blood (Pross and Grattendick,2007). They can be found in serum and saliva, tears and sweat, colostrum andother body fluids (Thermo Fisher Scientific, nd). They can exist both as monomeror dimers, which each have different roles. In humans there are two IgA subclassesknown (Pross and Grattendick, 2007). IgM molecules are found in serum and lymphfluid. They can be found as pentamers, when five IgM molecules are held togetherby a joining piece (See Fig. 1.1). They are important in the primary immuneresponse, as they are the first type of antibodies made by the body in responseto infection (Pross and Grattendick, 2007). Their level rises when dealing withbacterial infections. IgD molecules are mainly found as a surface molecule and onlyon naive B cells (Pross and Grattendick, 2007). IgE molecules play an importantpart when dealing with parasites but are also a big part of allergic response (ThermoFisher Scientific, nd). They are only found in low concentration in serum andexist only as monomers. They have an extra domain region in the Fc region whichhelps them bind to mast cells. Antigen binding with mast cell-bound IgE leads toactiveation of the mast cell which releases histamine which contributes to allergicresponse (Pross and Grattendick, 2007).
2
1.2. ELISA
Immunoglobulin G
IgG can be found in most body fluids and are the most abundant Ig in the body.They are only found as monomers (see Fig.1.1). They are important when fightingbacterial or viral infections since they help both B cells and T cells. IgG antibodiesare the only type of antibodies that can cross the placenta, going from mother tobaby and giving it the first protection. There are however, few subclasses of IgGand not all of them can cross the placenta (Simister, 2003). It also differs betweenspecies, e.g. both bovine and ovine species cannot transfer IgG through placenta,providing only protection by IgG in the colostrum (Pross and Grattendick, 2007).
The structure for IgG is well known. IgG can be divided into several subclasses,but how many depends on the species, e.g. in humans and mice, four subclasses areknown but only two in bovine species. The hinge region on the structure is whatprovides the major differences between subclasses and their different biological ac-tivities (Burton, 1985). The subclasses have different roles and physical properties.Some subclasses are better at being passed from mother to foetus, whereas somesubclasses are preferable when it comes to activating the complement system or op-sonisation for phagocytosis. As IgM is critical for the primary immune response, IgGis critical for the secondary immune response. IgG is produced after repeated expo-sure to antigen. There is also an increasing antibody affinity after repeated antigenexposure. IgG level is enhanced during infections, but also in autoimmune diseases,e.g. rheumatoid arthritis. In certain cancers (leukemia), IgG level is decreased. Itis therefore important to regulate the level of IgG, both to diagnose disorders andto observe the status of diseases. IgG levels, and other immunoglobulin levels, canbe determined using ELISA assay (Pross and Grattendick, 2007).
1.2. ELISA
Enzyme-linked immunosorbent assay (ELISA) is commonly used to measure an-tibodies, proteins and glycoproteins in biological samples (Horlock, nd). ELISAis classified as a heterogeneous enzyme immunoassay (Engvall, 1980). It is a com-monly used method in immunology, molecular biology, biochemistry and other stud-ies, where antigens and antibodies are common or need to be measured. The mostsensitive ELISA is the competitive ELISA, however, it is also the most expensiveas it requires large quantities of pure enzyme-labelled antigen. Sandwich ELISAand indirect ELISA, both non-competitive ELISAs, are easy and accurate methodto measure antigens and antibodies. They do not require special purification andspecific enzyme-labelled antigens like the competitive ELISA. They can also provideamplification of the enzyme response, but only if the ultimate sensitivity has not
3
1. Introduction
been attained.
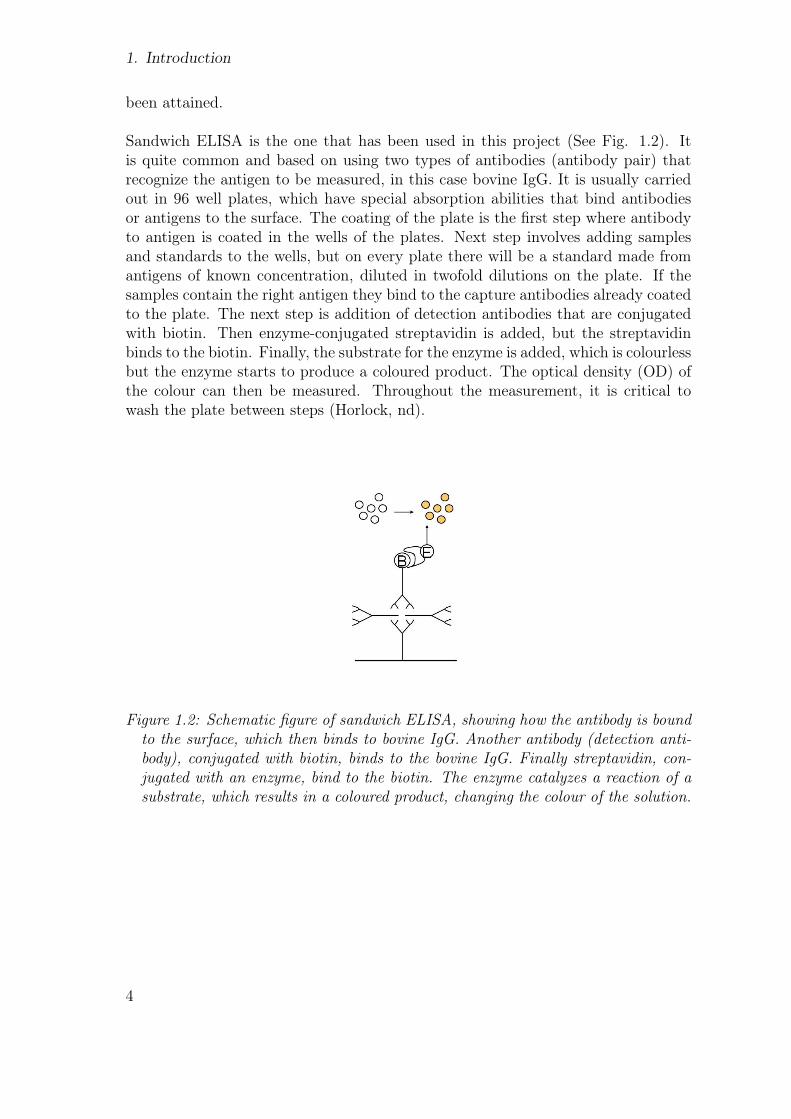
Sandwich ELISA is the one that has been used in this project (See Fig. 1.2). Itis quite common and based on using two types of antibodies (antibody pair) thatrecognize the antigen to be measured, in this case bovine IgG. It is usually carriedout in 96 well plates, which have special absorption abilities that bind antibodiesor antigens to the surface. The coating of the plate is the first step where antibodyto antigen is coated in the wells of the plates. Next step involves adding samplesand standards to the wells, but on every plate there will be a standard made fromantigens of known concentration, diluted in twofold dilutions on the plate. If thesamples contain the right antigen they bind to the capture antibodies already coatedto the plate. The next step is addition of detection antibodies that are conjugatedwith biotin. Then enzyme-conjugated streptavidin is added, but the streptavidinbinds to the biotin. Finally, the substrate for the enzyme is added, which is colourlessbut the enzyme starts to produce a coloured product. The optical density (OD) ofthe colour can then be measured. Throughout the measurement, it is critical towash the plate between steps (Horlock, nd).
Figure 1.2: Schematic figure of sandwich ELISA, showing how the antibody is boundto the surface, which then binds to bovine IgG. Another antibody (detection anti-body), conjugated with biotin, binds to the bovine IgG. Finally streptavidin, con-jugated with an enzyme, bind to the biotin. The enzyme catalyzes a reaction of asubstrate, which results in a coloured product, changing the colour of the solution.
4
1.3. Cattle breeds
1.3. Cattle breeds
Types
There are many types of cattle worldwide belonging to the subspecies Bos taurustaurus. They are bred for their meat, dairy products or offspring by farmers. Oneof these breeds is the Icelandic cattle, which also is the only dairy breed in Iceland.The Icelandic breed is mostly related to Scandinavian breeds (Lien et al., 1999).The Icelandic cattle is quite small compared to other breeds, dual-purpose andmostly polled. The composition of the Icelandic milk is different from the onein Scandinavia, having higher albumin and immunoglobulins (Birgisdottir et al.,2002). A connection has been made between β-casein in the Icelandic dairy andlower incidents of type 1 diabetes (Thorsdottir et al., 2000).
There are two main types of cattle breeds favoured by farmers for dairy products,Holstein and Jersey. Holstein cattle are larger, black and white piebald, sometimeswith white or black patches. They originally come from the Netherlands and arewidely known for their great dairy production. Jersey cattle are smaller with reddishcolour. Their origin is the Channel Islands, outside the coast of France, and they arenamed after the island where they were bred. The milk of the Jersey is more butterythan the Holsteins, but Holstein can produce more of it during their lifetime.
These breeds do not live in the same environment and do not share the same ge-netic background as the Icelandic cattle. They encounter different pathogens, i.e.viruses, bacteria and parasites. Considering the Icelandic cattle has lived in isola-tion for over 1000 years, and have, most likely, evolved differently from the cattlein mainland Europe. In a study comparing five different types of dairy cows, itwas shown how different concentration of immunoglobulins varied between breeds(Muller and Ellinger, 1981) suggesting the Icelandic cattle could also have a differentIgs concentration.
Calves
In 1892 it was noted by Ehrlich how transfer of maternal antibodies to newbornoffspring was through the colostrum (Ehrlich, 1892). This transfer is called passiveimmunity and gives the offspring protection against diseases while its own immunesystem is being developed. Without the maternal antibodies, the offsprings are ingreat danger of getting sick and dying. It was discovered later, that the offspringsof some species (including bovine, ovine, equine and sometimes porcine species)were born largely without antibodies (Smith and Little, 1922) unlike human, whichget IgG transported over the placenta (Simister, 2003). Calves that fail to attain
5

1. Introduction
adequate passive immunity are more susceptible to diseases and mortality than arethose with higher levels of immunoglobulins in serum (Rajala and Castrén, 1995).
In Iceland young calves are prone to get diarrhea, most likely caused by E. coli.Another pathogen is the protozoan Eimeria spp. which causes bloody diarrheawhich can also been found in young calves. However respiratory disease are morecommon in other breeds around Europe and in the States (Virtala et al., 1999).Hygiene, feeding practices and air conditioning as well as housing condition are alsocritical when it comes to disease transmission (Marcé et al., 2010a).
The first 24 hours after birth are vital when it comes to passive immunity in calves.Research has shown that it also depends on when the calves start drinking thecolostrum. The closure of intestinal permeability to colostral immunoglobulins de-pends on when the calf starts drinking colostrum or other dairy substances. If,however, the calf is fed few hours postpartum, this closure gap shortens (Stottet al., 1979). After few weeks, around 20 days (Senogles et al., 1978), the B-cellnumbers reach adult levels and they start making their own immunoglobulins (God-den, 2008). Until then their mother’s immunuglobulin from the colostrum has to beenough to keep them protected from infections.
1.4. Colostrum and passive transfer immunity
The bovine neonate relies on the milk from its mother, which provides them with acomplete diet of all essential nutrients, as well as growth factors. The first milk pro-duced by the cow after birth is called colostrum. It also contains immunoglobulins,crucial for the calf’s immune system (Stelwagen et al., 2009) and has been shownto play an important part in the calf’s mortality. At least two subclasses of IgG,IgG1 and IgG2, have been found in bovine species and both of them in colostrum.IgG1 is more abundant. In pre-colostral serum, both of them consist at only lowlevel (Amon et al., 1999). Bovine colostrum contains high level of IgG, 2 to 13 timesmore concentrated than in serum. In humans and mice, the most abundant Ig incolostrum or milk is IgA (Butler, 1969).
Adequate passive transfer is considered when the IgG level in serum is higher than10 mg/mL after the first 24 hours (Weaver et al., 2000). Even though passiveimmunity is important for the calf and its survival, calves with low concentrationshave survived infections and diseases, indicating there are other factors that are alsoinvolved for protection against some diseases (Hurvell and Fey, 1970). No correlationhas been found between the high level of IgG in the colostrum and the actual calfserum IgG level (Amon et al., 1999). Another research showed low levels of globulinsin serum being more common in calves with lower birth weight (Hurvell and Fey,
6
1.5. Aim of the project
1970). In a comparison between bovine colostrum, commercial milk derived IgGsupplements and bovine serum product, having different IgG masses, showed noneof the supplements provided the calves with sufficient IgG concentration in the bloodafter 24 hours (>10 g/L of IgG) as the colostrum did (Arthington et al., 2010). Thissuggests that, the colostrum is still the best way for the calf to gain passive immunitytransfer.
There are many ways to measure Igs in colostrum or blood samples (Gapper et al.,2007). It is common for farmers to have a refractometer on the farm to measure ifthe colostrum contains enough IgG and other substances for the calf, or if they needto feed it with excess colostrum for them to gain high enough level of IgG. Thiscannot be done for blood samples because it is not specific enough for the serumbut immunoassays can be used instead (Chigerwe and Hagey, 2014).
1.5. Aim of the project
It has already been observed that the IgG level in colostrum of Icelandic cattleis lower than in other countries although it has never been tested or measuredscientifically. The low death rate and good health of the calves suggest that despitethe low level of IgG in the colostrum they get enough IgG for the environment theylive in. These observations have not been scientifically analysed, but have beenmade by many farmers around Iceland.
The aim of this project was to measure the concentration of IgG in calf serum atbirth and at 24 hours postpartum, to be able to determine whether the calves haveenough IgG for the first few weeks in their life. The aim is also to measure the IgGin the colostrum of the mothers in order to be able to determine whether there is acorrelation between the level of IgG in colostrum and serum.
7


2. Materials and Methods
2.1. Samples
All samples were collected from Icelandic cattle at the Agricultural University ofIceland, 12 serum samples from newborn calves and approximately 24 hours later.In addition, 12 colostrum samples from their mothers were collected, though only11 were used. The samples were taken from all calves born in from January 28thuntil March 13th, except one because of unforeseen circumstances.
2.1.1. Serum samples
Calves were taken away from the dam at birth. They were in a pen, around 43m2 (ca 8,5m x 5m), with other calves on dry hay. They were given 1.5-2.9 L ofcolostrum from their mother, 2-3 times for the first 24 hours. Some of the calveswere weighed at birth (8 calves) and again after 5 weeks (4 calves). Blood sampleswere taken at birth, 0 hours (A samples), and again 24 hours later (B samples).Three samples were taken from one calf, a C sample taken few hours later than theB sample. The blood samples were 9 mL and taken with a BD Vacutainer, ClotActivator, tilted few times and kept in a fridge until they were spun (See Table A.2for how long they were kept in a fridge). They were centrifuged at 3000 rpm for 10minutes at 4◦C, 1.5 mL of serum taken from the top and kept frozen at -20◦C untilthey were analyzed. When moved to the lab at the Department of Immunology theywere stored in a freezer at -70◦C.
2.1.2. Colostrum samples
Colostrum samples from the first milking postpartum were sampled. Samples were45-50 mL and stored in falcon tubes at -20◦C until they were moved to the laboratoryof Institute For Experimental Pathology, University of Iceland, KELDUR, werethey were kept at -80◦C. They were then thawed in a heatbox, at Department of
9
2. Materials and Methods
Immunology, University of Iceland. They were measured with ELISA for the rightdilution and two small samples (1.9 mL) were stored at -70◦C, while the originalsamples were kept at -20◦C until they were moved back to Institute For ExperimentalPathology, University of Iceland, KELDUR. The small samples were used for allELISA measurements as well as refraction but the bigger ones were only used forrefraction.
2.2. ELISA
ELISA was the method of chose because of its high specificity regarding IgG. Byusing ELISA for the measurements were likely to give more accurate results than arefractometer since the refraction only gives the whole concentration in the sample,including proteins, fatty acids, salts, etc. One of the problems using ELISA as amain method for this project is the dense nature of the colostrum, which makes itdifficult to dilute accurately. Samples A and B and of colostrum for each calf andmother were measured on the same plate.
Coating
Bovine IgG DuoSet (DY59030-05), purchased from R&D Systems R©, a Bio-Technebrand, was used for all ELISA measurements. Capture antibody (Part 843467),lyophilized goat anti-bovine IgG, 50 µg, was dissolved in 0.5 mL sterile PBS (Phos-phate Buffered Saline, pH 7.4) (becomes 100 µg/mL). The capture antibody wasaliquoted into tubes, 64 µL per tube and stored at -70◦C until used. When used, 64µL were taken from the vial and diluted in 16 mL of PBS. 150 µL were pipetted intoall wells of a 96 well Multisorp plate from Nunc and incubated overnight at roomtemperature. After incubation, coating solution was discarded and the plate waswashed 4 times with washing solution (PBS with 0.05% Tween 20), using BioTekELx405 washer and BioTek BioStack BIOSTACK2WR Microplate Stacker Unit2,from BioTek Instruments, Inc.
Blocking
After washing the plate, 300 µL (2 x 150 µL) of Tween-Elisabuffer (5% Tween-20 in PBS, stored in fridge) was put in all the wells and incubated for 1 hour atroom temperature. After incubation, Tween-Elisabuffer was discarded and the platewashed 4 times with washing solution as before.
10

2.2. ELISA
Samples and standard
Standard (Part 8434698) was prepared by dissolving 130 ng of recombinant bovineIgG in 0.5 mL of Tween-Elisabuffer (becomes 260 ng/mL). It was then aliquoted intubes, 25 µL, and stored at –70◦C until used. One vial or 25 µL was used each time,and diluted in 517 µL (500 + 17 µL) of Tween-Elisabuffer (becomes 12 ng/mL)before use. The standard was used in the range of 93.8 to 6000 pg/ml.
The standard and blank (buffer only) were in columns 1 and 2. First, 50 µL ofTween-Elisabuffer were pipetted in all wells for the standard and blank (columns1-2, rows A-H). Then 50 µL of bovine IgG standard were pipetted in the top row(A) and diluted by twofold serial dilutions (mix 8 times and then transfer 50 µLinto next row, etc. throw away the last 50 µL from row G). The last row (H) wasthe blank and contained only buffer (no standard, no sample).
Each sample was measured in four or eight dilutions. The samples were diluteddifferently, A samples were diluted 1/5,000; B samples were diluted 1/800,000 andmeasured in four dilutions; colostrum samples were diluted 1/8,000,000 nd measuredin eight dilutions, all in Tween-Elisabuffer. Fifty µL of Tween-Elisabuffer werepipette in all wells into columns 3-12, except rows A and E (only row E in columns7-12 contained buffer). Then 100 µL of each sample (appropriately diluted) waspipetted into either row A or E and diluted by twofold dilutions in the next threerows (mix 8 times and then transfer 50 µL into the next row). This step was followedimmediately by next step, detection.
Table 2.1: Showing how dilutions for each type of samples were prepared, first numbershows volume (µL) of Tween-Elisabuffer in a vial, and second number of volume(µL) of sample taken and diluted. In the 2. and 4. vial, the second numbercorresponds to the volume taken from a previous vial, then containing a dilutedsample.
* A sample (µL) B sample (µL) Colostrum (µL)
1 vial 990 + 10 990 + 10 990 + 102 vial 490 + 10 990 + 10 990 + 103 vial - 790 + 10 990 + 104 vial - - 700 + 100
11

2. Materials and Methods
Table 2.2: Schematic set-up for Bovine IgG ELISA.
* 1 2 3 4 5 6 7 8 9 10 11 12
A Standard 1 Serum A1 Serum A2 Colostrum 1 Colostrum 2 Blank6000 ng/mL 1:5000 1:5000 1:8,000,000 1:8,000,000
B Standard 2 1:10,000 1:10,000 1:16,000,000 1:16,000,000 Blank3000 ng/mL
C Standard 3 1:20,000 1:20,000 1:32,000,000 1:32,000,000 Blank1500 ng/mL
D Standard 4 1:40,000 1:40,000 1:64,000,000 1:64,000,000 Blank750 ng/mL
E Standard 5 Serum B1 Serum B1 1:128,000,000 1:128,000,000 Blank375 ng/mL 1:800,000 1:800,000
F Standard 6 1:1,600,000 1:1,600,000 1:256,000,000 1:256,000,000 Blank187.5 ng/mL
G Standard 7 1:3,200,000 1:3,200,000 1:512,000,000 1:512,000,000 Blank98.75 ng/mLH Blank 1:6,400,000 1:6,400,000 1:1,024,000,000 1:1,024,000,000 Blank
Detection
Detection antibody (Part 843468) was stored in the fridge as 0.100 mL of biotinylatedgoat anti-bovine IgG. It was used diluted 1:2000, 5.5 µL of detection antibodydiluted in 11 mL of Tween-Elisabuffer. Immediately after the standard and sampleshad been added and diluted onto the plate, 100 µL of detection antibody werepipetted into all wells and the plate put on shaker at 50 rpm for 2 hours at roomtemperature. After incubation time, all solutions were discarded and the platewashed with washing solution 4 times as before.
Streptavidin-HRP
Streptavidin-HRP (DY998) was diluted 1:40 (i.e. 400 µl into 16 ml per plate) inTween-Elisabuffer and 150 µL added into all wells and incubated for 20 minutes inthe dark (in the cupboard) at room temperature. After incubation, solution wasdiscarded and washed 4 times with washing solution as before.
12
2.2. ELISA
Substrate
Substrate (TMB One, from Kem-En-Tec, Denmark), 150 µL was added into allwells and incubated in the dark at room temperature until a dark blue colour haddeveloped in the highest standard. This took around 40-50 minutes.
Stop
Stop solution (0.18 mM H2SO4 was added when the blue colour was well visiblein the highest standard. Fifty µL of the solution were added into all wells, makingthe blue solution become yellow. The absorbance (OD) of the yellow colour wasthen read at 450 nm with Orignial Multiskan EX, purchased from Thermo Electroncorporation.
2.2.1. Calculations
A standard curve was constructed and the value of the samples read there from.
1. BLANK: All wells with buffer only were declared as blanks and the averageOD from these wells calculated. The blank value was subtracted from the ODvalues of standards and samples.
2. Standard: Then the OD for the standard was determined by calculating theaverage absorbance for each dilution minus the blank. Then a standard curvewas made using scatter plot in excel with concentration on the standard onx-asis and the absorbance on y-axis and the programme used to determine thebest fit line and equation of that line. Two lines were usually tested:
• A straight line and an equation of best fit line for that, or
• A power line, with the x-axis set to log 10, and an equation of best fitline for that.
3. Samples: The OD for the samples was determined the same way as the stan-dard. The concentration of IgG in the samples could be calculated, using thebest fit line equations. Finally the read value was multiplied by the appropriatedilution.
13
2. Materials and Methods
2.3. Refractometry
ColoQuick Refractometer was used to measure the refraction of the colostrum sam-ples. They had been previously warmed to 37·C in a warm closet, a Gallenkamp,Hotbox Oven with fan, size 1. Three to five drops were put on the glass for measure-ments. Each sample was measured 3 times, the lens rinsed with alcohol (70% VOLof ethanol/isopropanol, Iceland) between measurements. The temperature of thesamples was measured both before and after measurements with the refractometer.
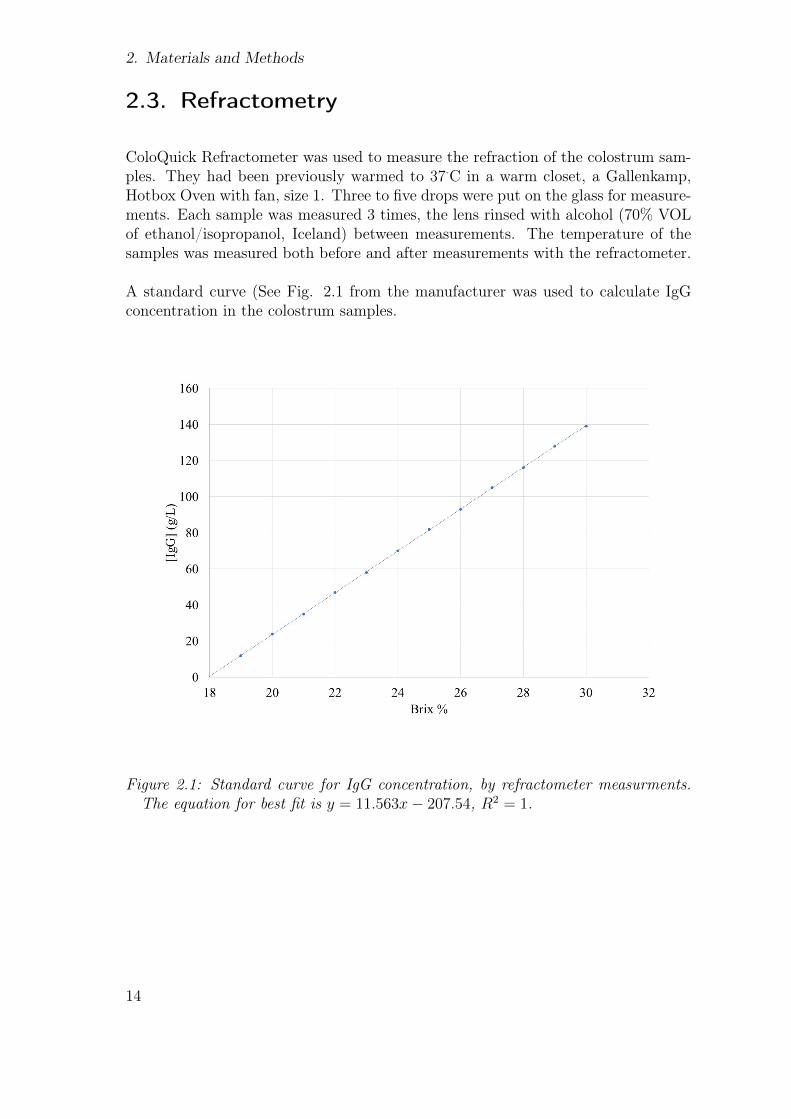
A standard curve (See Fig. 2.1 from the manufacturer was used to calculate IgGconcentration in the colostrum samples.
Figure 2.1: Standard curve for IgG concentration, by refractometer measurments.The equation for best fit is y = 11.563x− 207.54, R2 = 1.
14
2.4. AEA
2.4. AEA
Common way to measure passive immunity is apparent efficiency of absorption(AEA). AEA for IgG can be determined using the following formula (Quigley et al.,1998; Berry et al., 2014):
AEA = (Serum IgG (g/L) ∗ Plasma volume (L)/IgG intake (g)) ∗ 100 (2.1)
It does require the knowledge of the plasma volume of the calf, which is not knownfor Icelandic calves. The plasma volume of Jersey and Holstein calves is known(Quigley et al., 1998), making up around 9-10% of the birth weight of the calf. Inthis study 9% of birth weight was used.
2.5. Statistic and processing
Statistics and graphs were made with GraphPad Prism 2019 c© GraphPad Software,Inc.
15


3. Results
3.1. Calves and cows
Basic information about calves and their mother (See Table 3.1) were documented bythe farmers from the Agriculture University of Iceland and Charlotta (instructor), aswell as information about colostrum feeding (See Table A.1) and samples (See TableA.2). Information about systematic number of calves and mother were documentedas well as date of birth and gender, weight at birth (only for 8 calves) and weightafter 5 weeks (only for 4 calves). The number of mother and mother’s lactationperiod (corresponding to her age) was also documented. Information about howmuch colostrum the calves were fed during the first 24 hours can be seen in Fig. 3.1.
Table 3.1: Basic information about calves and their mothers, used in this study.
No. ofsample
Date ofbirth No. Calf Gender Weight at
birth (kg)
Weight at5 weeks(kg)
No. ofmother
No. oflactationperiod
100 23.01.19 2015 male - - 1832 1001 28.01.19 2016 male - - 1769 2002 29.01.19 2017 female 37 51 1711 3003 31.01.19 2018 male - - 1849 1004 08.02.19 2019 female 31 55.5 1847 1005 11.02.19 2020 male 42 - 1774 2006 12.02.19 2021 female 26 45.5 1837 1007 15.02.19 2022 male 32 - 1701 3008 23.02.19 2023 female 39 62 1480 6009 04.03.19 2024 male - - 1571 5010 12.03.19 2026 male 35.5 - 1567 5011 13.03.19 2027 male 36 - 1860 1
17
3. Results
Figure 3.1: Total volume of colostrum fed to each calf the first 24 hours. The averagevolume was 5.3 L, maximum volume was 6.25 L and minimum volume was 4 L.
18

3.2. IgG concentration
3.2. IgG concentration
3.2.1. ELISA measurements
IgG concentration in serum and colostrum samples was measured using Bovine IgGELISA. All results are shown in Table 3.2, showing IgG concentration for individualsamples and the mean and standard deviation.
Table 3.2: Concentration of IgG in serum samples A, B, C (only for 005) and incolostrum samples measured with Bovine IgG ELISA.
No. of sampleSerum samples
Colostrum [mg/mL]A [mg/mL] B [mg/mL] C [mg/mL]
001 0.008 15.351 - 19.273002 0.012 6.452 - 7.201003 0.006 4.765 - 11.822004 0.012 2.598 - 8.149005 0.009 7.185 6.743 8.259006 0.007 14.634 - 18.670007 0.012 7.594 - 4.651008 0.005 7.215 - 13.640009 0.006 6.874 - 10.857010 0.014 5.268 - 8.860011 0.007 5.463 - 12.832
Mean 0.009 7.560 - 11.292Std 0.003 3.949 - 4.608
19

3. Results
3.2.2. Refractometry
IgG concentration in colostrum was also measured using a refractometer (Colo-Quick). Both samples used in ELISA analyzes (small) and the whole sample of thecolostrum (big) were measured (See Table 3.3), as well as the temperature in thewhole colostrum samples.
Table 3.3: IgG concentration in colostrum measured with refractometer, for smalland big samples.
No. of sample Small BigBrixS (%) IgG [g/L] BrixB (%) T [◦C] IgG [g/L]
C 001 21.2 37.6 21.1 37 36.1C 002 20.1 24.9 20.4 37 27.6C 003 24 70.0 23.9 37 68.4C 004 19 12.2 18.9 37 11.4C 005 20.8 33.0 20.3 37.5 33.0C 006 18.6 7.5 18.7 37 9.1C 007 18.2 2.9 18.7 37.5 8.3C 008 23 58.4 23.4 37.5 63.0C 009 24.6 76.9 24.9 37 80.8C 010 19 12.2 19.0 37.5 12.2C 011 24 70.0 24.3 37.5 73.1
Mean 21.1 36.9 21.2 - 37.9Std. 2.4 27.7 2.4 - 28.2
20
3.3. AEA
3.3. AEA
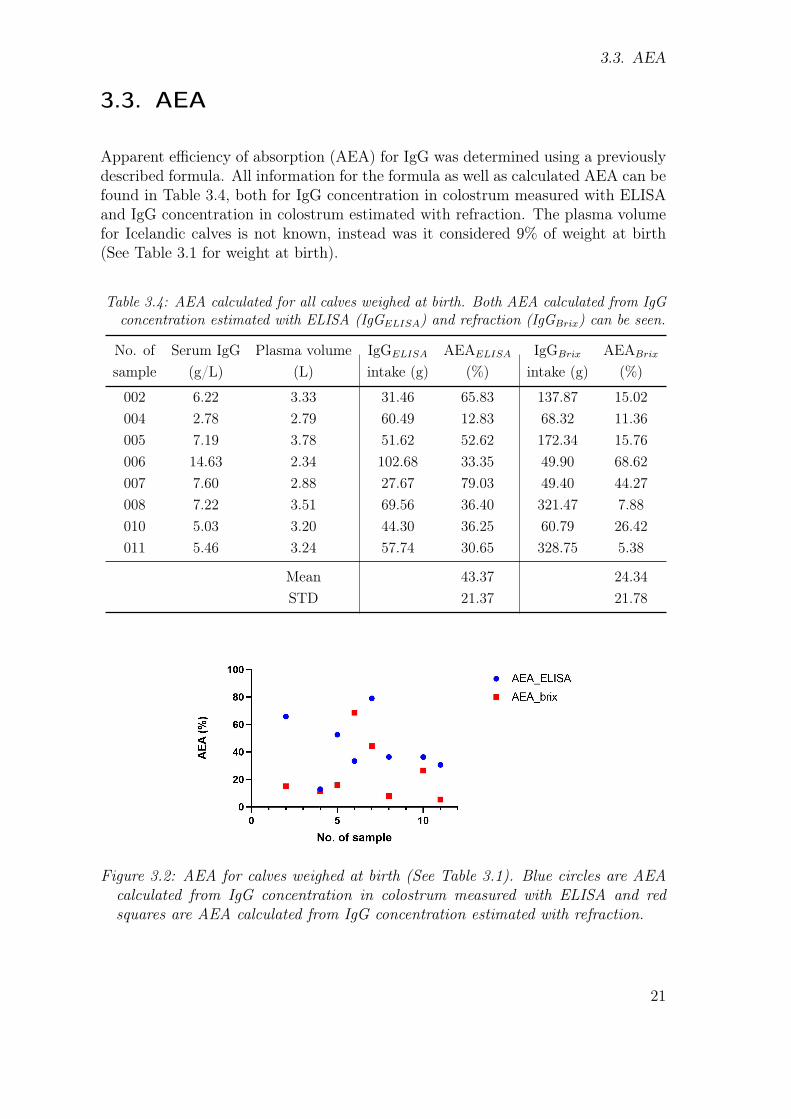
Apparent efficiency of absorption (AEA) for IgG was determined using a previouslydescribed formula. All information for the formula as well as calculated AEA can befound in Table 3.4, both for IgG concentration in colostrum measured with ELISAand IgG concentration in colostrum estimated with refraction. The plasma volumefor Icelandic calves is not known, instead was it considered 9% of weight at birth(See Table 3.1 for weight at birth).
Table 3.4: AEA calculated for all calves weighed at birth. Both AEA calculated from IgGconcentration estimated with ELISA (IgGELISA) and refraction (IgGBrix) can be seen.
No. ofsample
Serum IgG(g/L)
Plasma volume(L)
IgGELISA
intake (g)AEAELISA
(%)IgGBrix
intake (g)AEABrix
(%)
002 6.22 3.33 31.46 65.83 137.87 15.02004 2.78 2.79 60.49 12.83 68.32 11.36005 7.19 3.78 51.62 52.62 172.34 15.76006 14.63 2.34 102.68 33.35 49.90 68.62007 7.60 2.88 27.67 79.03 49.40 44.27008 7.22 3.51 69.56 36.40 321.47 7.88010 5.03 3.20 44.30 36.25 60.79 26.42011 5.46 3.24 57.74 30.65 328.75 5.38
Mean 43.37 24.34STD 21.37 21.78
Figure 3.2: AEA for calves weighed at birth (See Table 3.1). Blue circles are AEAcalculated from IgG concentration in colostrum measured with ELISA and redsquares are AEA calculated from IgG concentration estimated with refraction.
21

3. Results
3.4. Comparison
In Fig. 3.3 the results from both ELISA and refractometer can be viewed in acolumn graph, made in Graph Pad. It shows average value and variance of the data.In Fig. 3.4 correlation between groups can be viewed. Most Data groups, measuredand observed, were analyzed, using a correlation matrix (See Fig. 3.5). Thosegroups include IgG concentration in sample B, IgG concentration in the colostrum,weight, both at birth and after 5 weeks postpartum, difference in weight betweenmeasurements, parity (no. of lactation period), total colostrum volume fed to thecalves in the first 24 hours and refraction of the colostrum measured in Brix. Inthat matrix, each group of information was compared to all other groups, includingitself (Pearson r = 1.00). The correlation between all groups can therefore be seen,blue as positive correlation, red as negative correlation and white as no correlation.
Figure 3.3: Distribution of IgG concentration in all samples shown in column graphs.a) shows IgG concentration measured in A, B and colostrum samples with ELISAand b) shows the IgG concentration measured in B and colostrum samples withrefractometer and in colostrum samples with ELISA as comparison.
22

3.4. Comparison
Figure 3.4: Correlation between different groups. a) Shows no correlation betweenIgG concentration in samples A and samples B measured with ELISA. b) Showscorrelation between IgG concentration in samples B and colostrum measured withELISA. c) Shows the IgG concentration in colostrum measured with both ELISA(blue) and refraction (red) compared to IgG concentration in serum samples after24 hours. Made in GraphPad.
23

3. Results
Figure 3.5: Matrix showing correlation between all groups, measured and docu-mented. Data from Tables 3.1, 3.2 and 3.3 as well as Fig. 3.1. Blue showspositive correlation and red shows negative correlation. All slopes were not signif-icant (P ≥ 0.05), except between colostrum [mg/mL] and sample B [mg/mL] (P= 0.039), both measured with ELISA. Made in GraphPad.
24
4. Discussion
4.1. ELISA
This is the first study in Iceland that scientifically compares concentration of IgGin the serum of calves at 24 hours postpartum after being fed colostrum and theconcentration of IgG in the colostrum of Icelandic cattle. The average IgG concen-tration in the serum samples taken at birth was 9 ng/mL with STD of 3 ng/mL. Thelowest measured IgG concentration was 5 ng/mL and the highest was 14 ng/mL.This is not surprising, traces of IgG can be found in newborn calves ranging toconcentration of 1 mg/mL (Berry et al., 2014). Even so, this level of IgG does notprovide enough protection for the calf, though at birth it can provide itself withsome protection (Barrington and Parish, 2001). The average IgG concentration ofthe serum samples at 24 hours postpartum in Icelandic calves was measured 8.02mg/mL, with STD 5.0 mg/mL. The highest IgG concentration was measured 20.20mg/mL and lowest was 2.78 mg/mL. In comparison with other research done onHolstein calves both in Europe and United States (Furman-Fratczak et al., 2011;Russell Sakai et al., 2012), the IgG level in Icelandic calves seems comparable. Nocorrelation (P ≥ 0.05) was found between the IgG concentration of the zero sample(sample A) and the IgG concentration of serum sample at 24 hours (See Fig. 3.4a).
The average IgG concentration in the colostrum samples of Icelandic cattle waslower compared with IgG concentration in colostrum of other breeds (Weaver et al.,2000; Furman-Fratczak et al., 2011), but more similar to a breed in Germany (Amonet al., 1999). This raised concerns whether the ELISA method measured total IgGconcentration in the samples or if it was specific only for IgG1. As IgG1 is moreabundant in the colostrum (McGrath et al., 2016) it would have given a good indica-tion of the total IgG levels. The highest IgG concentration in the colostrum sampleswas measured 18.7 mg/mL and the lowest was 2.8 mg/mL. Figure 3.5 shows thatthere is a correlation between the IgG concentration in the colostrum and the IgGconcentration in serum after 24 hours postpartum. According to Amon, et.al. thereis not always correlation between IgG concentration in the colostrum of the motherand the concentration in the serum samples of the calves. This raises the questionif there truly is a correlation between the IgG levels in colostrum and serum in Ice-landic cattle or whether the small sample size is affecting the statistical analysis.
25
4. Discussion
Of course the small sample size is a big factor here, only showing measurementsfor a specific group within the population. To get a better understanding of thissituation would be to have the sample size bigger. No correlation between the IgGconcentration of the colostrum measured with ELISA and parity (no. of lactationperiod) or weight of calves at 5 weeks were found, or any other data group (See Fig.3.5).
4.1.1. Dilutions
Dilutions are an important factor of ELISA. Making sure the sample has the rightdilution so the concentration of the sample can be measured, is the first step whensetting up ELISA. Both A samples and B samples were measured on the first ELISAplate (See Table A.3), with recommended dilutions from the kit. It was clear fromthe start that two types of dilutions were required for the serum samples, one forthe A samples and one for the B samples. The B samples measured around 300times stronger than the A samples. The A samples contained a small amount ofIgG, measured in all A samples and ruling out the suggestion the small amount ofIgG could be contaminants from another well.
Colostrum samples needed more dilutions than B samples, considering colostrumsamples should have IgG concentration around 50 mg/mL and serum samples around10 mg/mL. They seemed to be around 10 times more dense (See Table A.4) andneeded therefore 10 times more dilution. The multiple dilutions of the colostrum forELISA as well as the dense nature of the colostrum made it hard to be certain if thefinal dilution was indeed correct. Few drops clung to the pipette tip which couldaffect measurements, making the sample less diluted than it was supposed to be.It was therefore important to shake the samples when in the sample preparation.Even so, few drops on the pipette’s tip could wield inaccurate results.
4.2. Refraction measurement
Refractometer is an easy instrument to use. Temperature plays a big part in itsaccuracy. Therefore, colostrum samples were measured at 37◦C to mimic the cir-cumstances at which the colostrum samples were taken and fed to the calves. Bymeasuring both the whole sample of the colostrum as well as the small sampleused for the ELISA measurements the two methods could be compared. The re-fractometer provided different results than ELISA measurements, with average IgGconcentration in the colostrum being 37.9 mg/mL, highest concentration of 80.8mg/mL and lowest of 8.3 mg/mL. The lowest measured colostrum sample had the
26
4.3. Sample herd
highest IgG concentration measured by ELISA. This brings up the question, whydo they differ so much. This could not be answered in this project.
Since the ELISA and refraction measurements were so different it becomes clear,more thoroughly study needs to be performed in order to gives more reliable results.ELISA is a specific method, measuring only IgG in the samples, while the refrac-tometer measures the concentration of all compounds in the colostrum, proteins,fatty acids and carbohydrates, only giving an estimation of the IgG concentration.A third alternative method could maybe shed more light on the situation, since manyother methods have been used to analyse the IgG concentration in dairy products.Even so, the values can vary between methods (Gapper et al., 2007). Another optionwould be to analyze the complete concentration of molecules and substances in thecolostrum, e.g. with liquid chromotography (LC), to compare with the refractionmeasurements. It could lead to a conclusion were other factors correlates to themeasured refraction. In Table 3.5 there is high correlation between the measuredrefraction of the colostrum and weight of the calf at 5 weeks. This suggests therefraction can measure how good the colostrum is, no matter how well it measuresthe IgG concentration. Of course, as there were only 4 measurements of the weightof the calves at 5 weeks, it can only suggest further research in that area is needed.
4.3. Sample herd
The sample herd came from one farm in Iceland, making suggestions and assump-tions hard to make for the whole population of the Icelandic breed. Even so, someinformation can be gathered from this study. The age of the mother, measuredin numbers of lactation periods, was quite distributed, having one to six lacta-tion periods. Most commonly was one lactation period, meaning this was her firstcalf. To make more accurate assumptions, more mothers for each period is neededand preferable more than six periods to see how age affects IgG production in thecolostrum.
The sex ratio of the calves was 3 to 2, 8 males and 4 females. It would have beendifficult to have equal distribution of gender because of the small and limited samplesize. However, this shows a fair distribution for each gender. More measurementsis needed to determine if the serum IgG concentration is dependant on gender. Itwould have been best if all the calves were weighed at birth as well as after 5 weeks.Then it might have been possible to say more about whether the refraction of thecolostrum (Brix % in Fig. 3.5) is indeed in correlation with the calves weight at 5weeks. If so, more analyzes should be done on the colostrum, to determine whatmakes the connection. Is it IgG or is it growth factors? Is it a bit of both? Manygrowth factors can be found in colostrum (Gauthier et al., 2006) which could suggests
27

4. Discussion
that if there is indeed a correlation between these two factors, the refraction of thecolostrum and weight of the calf after 5 weeks, the amount of growth factor couldbe what links them together.
4.4. AEA
The AEA calculated with IgG intake measured by ELISA was widely distributed,ranging from 12.83 % to 79.03 %. On average the AEA was 43.37 % with STDof 21.37. The AEA calculated with IgG intake estimated with refraction was onaverage 24.34 % with STD of 21.78. The minimum AEA was 5.38 % and maximum68.62 %. These two AEA calculated were not similar to each other for each sample,except for sample 004, which had 12.82 % and 11.36 % for IgG estimated withELISA and refraction respectively. A wide range of AEA values has also been seenin Holstein calves (Halleran et al., 2017), suggesting increasing volume and geneticselection could increase IgG concentration in serum.
4.5. Next steps
As mentioned before, the colostrum samples contained IgG concentrations lowerthan 50 mg/mL, suggesting that the colostrum from Icelandic cattle might not beable to provide calves with enough passive transfer immunity. However with lowmortality of Icelandic calves, this low IgG concentration seems not to have a majoreffect on their health and rather suggest the clean environment and low risk ofinfections demands lower IgG concentration (Bush and Staley, 2010). Other factorscould also play a part in their protection (Marcé et al., 2010b) and measuring IgMand IgA in calf’s serum could also be interesting. Research on which pathogens livein their environment could also give a good insight why the IgG concentration inthe colostrum is so low. It could even be a genetic trait, meaning Icelandic cattlecannot produce high amount of IgG in their colostrum.
The B serum samples contain a little less than expected but correlates with foals(Tyler-McGowan et al., 1997). Even though the samples give some informationabout IgG concentration in Icelandic cattle colostrum and calf’s serum, a biggersample group is needed for better understanding of the situation. The sample groupcame from one farm, making it hard to make any conclusion for the whole populationof the Icelandic cattle. Both bigger sample group and from a wider area as well asrefiner methods could give better understanding. If the calves only receive minimumamount of IgG, they could suffer greatly if exposed to a new pathogen. Therefore
28

4.6. Conclusion
it is crucial to study the situation further.
4.6. Conclusion
IgG concentration was measured in serum samples from 11 calves at birth and 24hours postpartum and in colostrum from their mother. According to these mea-surements the average concentration of the serum samples was 9 ng/mL at birthand 8.02 mg/mL 24 hours later. The colostrum samples contained on average 11.5mg/mL measured with ELISA and 37.9 mg/mL estimated with refraction. Thisshows lower IgG concentration in the colostrum samples compared to other bovinebreeds. The B serum samples contain also a little less compared to other breeds andwide distribution of AEA. Even though the samples give some information aboutIgG concentration in Icelandic cattle colostrum and calf’s serum, a bigger samplegroup is needed for better understanding of the whole population of the Icelandiccattle.
29


Bibliography
Amon, P., Z. Ali, M. Erhard, M. Stangassinger, and M. Younan1999. Absorption and Synthesis of Immunoglobulins G in Newborn Calves. Re-production in Domestic Animals, 34(3-4):173–175.
Arthington, J., M. Cattell, and J. Quigley2010. Effect of Dietary IgG Source (Colostrum, Serum, or Milk-Derived Supple-ment) on the Efficiency of Ig Absorption in Newborn Holstein Calves. Journal ofDairy Science, 83(7):1463–1467.
Barrington, G. M. and S. M. Parish2001. Bovine Neonatal Immunology. Veterinary Clinics of North America: FoodAnimal Practice, 17(3):463–476.
Berry, D., M. Doherty, J. Murphy, M. Conneely, E. Kennedy, and I. Lorenz2014. Effect of feeding colostrum at different volumes and subsequent number oftransition milk feeds on the serum immunoglobulin G concentration and healthstatus of dairy calves. Journal of Dairy Science, 97(11):6991–7000.
Birgisdottir, B. E., J. P. Hill, D. P. Harris, and I. Thorsdottir2002. Variation in consumption of cow milk proteins and lower incidence of Type1 diabetes in Iceland vs the other 4 Nordic countries. Diabetes, nutrition &metabolism, 15(4):240–5.
Burton, D. R.1985. Immunoglobulin G: Functional sites. Molecular Immunology, 22(3):161–206.
Bush, L. and T. Staley2010. Absorption of Colostral Immunoglobulins in Newborn Calves. Journal ofDairy Science, 63(4):672–680.
Butler, J. E.1969. Bovine Immunoglobulins: A Review. Journal of Dairy Science, 52(12):1895–1909.
Chigerwe, M. and J. V. Hagey2014. Refractometer assessment of colostral and serum IgG and milk total solidsconcentrations in dairy cattle. BMC Veterinary Research, 10(1):1–6.
31

BIBLIOGRAPHY
Ehrlich, P.1892. Ueber Immunität durch Vererbung und Säugung. Zeitschrift für Hygieneund Infectionskrankheiten, 12(1):183–203.
Engvall, E.1980. Enzyme Immunoassay ELISA and EMIT. Methods in Enzymelogy, 70:419–439.
Furman-Fratczak, K., A. Rzasa, and T. Stefaniak2011. The influence of colostral immunoglobulin concentration in heifer calves’serum on their health and growth. Journal of Dairy Science, 94(11):5536–5543.
Gapper, L. W., D. E. J. Copestake, D. E. Otter, and H. E. Indyk2007. Analysis of bovine immunoglobulin G in milk, colostrum and dietary sup-plements: a review. Analytical and Bioanalytical Chemistry, 389(1):93–109.
Gauthier, S. F., Y. Pouliot, and J.-L. Maubois2006. Growth factors from bovine milk and colostrum: composition, extractionand biological activities. Lait, 86:99–125.
Godden, S.2008. Colostrum Management for Dairy Calves. Veterinary Clinics of NorthAmerica: Food Animal Practice, 24(1):19–39.
Halleran, J., H. J. Sylvester, and D. M. Foster2017. Short communication: Apparent efficiency of colostral immunoglobulin Gabsorption in Holstein heifers. Journal of Dairy Science, 100(4):3282–3286.
Horlock, C.n.d. Enzyme-linked immunosorbent assay (ELISA). British Society for Immunol-ogy.
Hurvell, B. and H. Fey1970. Comparative studies on the gammaglobulin level in sera of market calvesin relation to their health. Acta Veterinaria Scandinavica, 11:341–360.
Lien, S., J. Kantanen, I. Olsaker, L.-E. Holm, E. Eythorsdottir, K. Sandberg,B. Dalsgard, and S. Adalsteinsson1999. Comparison of milk protein allele frequencies in Nordic cattle breeds. Ani-mal Genetics, 30(2):85–91.
Marcé, C., R. Guatteo, N. Bareille, and C. Fourichon2010a. Dairy calf housing systems across Europe and risk for calf infectious dis-eases. animal, 4(09):1588–1596.
Marcé, C., R. Guatteo, N. Bareille, and C. Fourichon2010b. Dairy calf housing systems across Europe and risk for calf infectious dis-eases. animal, 4(09):1588–1596.
32

BIBLIOGRAPHY
McGrath, B. A., P. F. Fox, P. L. McSweeney, and A. L. Kelly2016. Composition and properties of bovine colostrum: a review. Dairy Scienceand Technology, 96(2):133–158.
Muller, L. and D. Ellinger1981. Colostral Immunoglobulin Concentrations Among Breeds of Dairy Cattle.Journal of Dairy Science, 64(8):1727–1730.
Murphy, K. and C. Weaver2017. Janeway’s Immunobiology, 9th edition. New York: Garland Science.
Pross, S. and K. Grattendick2007. Immunoglobulins. Elsevier Inc.
Quigley, J., J. Drewry, and K. Martin1998. Estimation of Plasma Volume in Holstein and Jersey Calves. Journal ofDairy Science, 81(5):1308–1312.
Rajala, P. and H. Castrén1995. Serum Immunoglobulin Concentrations and Health of Dairy Calves in TwoManagement Systems from Birth to 12 Weeks of Age. Journal of Dairy Science,78(12):2737–2744.
Russell Sakai, R., D. M. Coons, and M. Chigerwe2012. Effect of single oroesophageal feeding of 3 L versus 4 L of colostrum onabsorption of colostral IgG in Holstein bull calves. Livestock Science, 148(3):296–299.
Senogles, D., C. Muscoplat, P. Paul, and D. Johnson1978. Ontogeny of circulating B lymphocytes in neonatal calves. Research inVeterinary Science, 25(1):34–36.
Simister, N. E.2003. Placental transport of immunoglobulin G. Vaccine, 21(24):3365–3369.
Smith, T. and R. B. Little1922. THE SIGNIFICANCE OF COLOSTRUM TO THE NEW-BORN CALF.Technical report.
Stelwagen, K., E. Carpenter, B. Haigh, A. Hodgkinson, and T. T. Wheeler2009. Immune components of bovine colostrum and milk1. Journal of AnimalScience, 87(suppl_13):3–9.
Stott, G., D. Marx, B. Menefee, and G. Nightengale1979. 1979 IgG transfer in calves.pdf, department edition.
Thermo Fisher Scientific, I.n.d. Immunoglobulin Structure and Classes.
33
BIBLIOGRAPHY
Thorsdottir, I., B. E. Birgisdottir, I. M. Johannsdottir, D. P. Harris, J. Hill, L. Ste-ingrimsdottir, and A. V. Thorsson2000. Explain Low Incidence of Insulin-Dependent Diabetes Mellitus in Iceland.Pediatrics, 106(4):719–724.
Tyler-McGowan, C., J. Hodgson, and D. Hodgson1997. Failure of passive transfer in foals: incidence and outcome on four studs inNew South Wales. Australian Vet Journal, 75(1):56–59.
Virtala, A. M., Y. T. Gröhn, G. D. Mechor, and H. N. Erb1999. The effect of maternally derived immunoglobulin G on the risk of respiratorydisease in heifers during the first 3 months of life. Preventive veterinary medicine,39(1):25–37.
Weaver, D. M., J. W. Tyler, D. C. Vanmetre, D. E. Hostetler, and G. M. Barrington2000. Passive Transfer of Colostral Immunoglobulins in Calves. Technical report.
Zaccai, N. R. and E. Yvonne Jones2010. Ig-Superfold and its Variable Uses in Molecular Recognition. Handbook ofCell Signaling, Pp. 49–54.
34
A. Appendix
A.1. Feeding
Table A.1: Information about colostrum fed to the calves during the first 24 hours.
No ofsample
Feeding 1 Feeding 2 Feeding 3 Totaldate time V1 [L] date time V2 [L] date time V3 [L] VT [L]
001 28.01.19 10:10 2.25 28.01.19 18:00 2.75 - - - 5002 29.01.19 11:00 1.5 19.01.19 18:30 1.75 30.01.19 09:00 1.75 4003 31.01.19 13:30 2.0 31.01.19 18:30 1.0 01.02.19 08:30 1.0 4004 08.02.19 12:10 2.0 08.02.19 19:00 2.0 09.02.19 09:00 2.0 6005 11.02.19 10:20 1.75 11.02.19 18:20 2.5 12.02.19 08:30 2.0 6.25006 12.02.19 10:35 2.0 12.02.19 18:30 2.0 13.02.19 08:30 1.5 5.5007 15.02.19 14:15 1.75 15.02.19 18:20 2.0 16.02.19 09:00 2.2 5.95008 23.02.19 10:40 1.0 24.02.19 09:00 2.9 24.02.19 18:00 1.2 5.1009 04.03.19 10:40 1.8 05.03.12 09:00 2.0 05.03.19 19:00 1.75 5.55010 12.03.19 16:00 1.0 13.03.19 08:00 2.5 13.03.19 23:00 1.5 5011 13.03.19 18:50 2.0 14.03.19 09:00 2.5 - - - 4.5
35

A. Appendix
A.2. Serum samples
Table A.2: Information about calf serum samples, when they were taken and whenthey were spun.
No ofsample
A sample B sample C sampledate time date spun date time date spun date time date spun
001 28.01.19 09:30 29.01.19 29.01.19 10:30 29.01.19 - - -002 29.01.19 10:30 31.01.19 30.01.19 10:40 31.01.19 - - -003 31.01.19 13:10 31.01.19 01.02.19 12.20 01.02.19 - - -004 08.02.19 12:00 08.02.19 09.02.19 11:00 11.02.19 - - -005 11.02.19 09:30 12.02.19 12.02.19 10:30 12.02.19 12.02.19 13:00 12.02.19006 12.02.19 10:20 12.02.19 13.02.19 11:10 13.02.19 - - -007 15.02.19 13:30 20.02.19 16.02.19 10:50 20.02.19 - - -008 23.02.19 10:20 26.02.19 24.02.19 11:00 26.02.19 - - -009 04.03.19 10:30 06.03.19 05.03.12 10:00 06.03.19 - - -010 12.03.19 15:00 14.03.19 13.03.19 18:25 14.03.19 - - -011 13.03.19 18:30 15.03.19 14.03.19 17:25 18:03.19 - - -
36
A.3. ELISA; Setup and OD
A.3. ELISA; Setup and OD
Samples 100B, 001A, 009A, 010A, 011B
Table A.3: Serum samples 100B, 001A, 009A, 010A and 011B. Setup for ELISA (upper half)and OD measured (lower half).
* 1 2 3 4 5 6 7 8 9 10 11 12
A 6000 ng/mL
100 B 001 A 009 A 010 A 011 B
B 3000 ng/mLC 1500 ng/mLD 750 ng/mLE 375 ng/mLF 187.5 ng/mLG 93.75 ng/mLH BLANK
A 0.941 0.921 1.901 1.814 0.111 0.109 0.127 0.145 0.257 0.231 1.868 1.807B 0.573 0.511 2.003 2.024 0.087 0.087 0.106 0.100 0.158 0.138 1.932 1.821C 0.305 0.309 1.861 1.757 0.064 0.063 0.064 0.108 0.087 0.089 1.663 1.384D 0.165 0.171 1.665 1.457 0.058 0.056 0.057 0.060 0.081 0.074 1.197 1.110E 0.117 0.115 1.242 1.199 0.048 0.052 0.055 0.067 0.067 0.063 0.947 0.899F 0.107 0.107 0.990 0.896 0.050 0.054 0.056 0.056 0.063 0.063 0.727 0.731G 0.067 0.072 0.652 0.531 0.065 0.052 0.055 0.059 0.058 0.058 0.534 0.509H 0.079 0.065 0.462 0.391 0.049 0.055 0.061 0.062 0.065 0.062 0.349 0.328
Note: The standard is in columns 1 and 2, diluted from 6000 ng/mL to 93.75 ng/mL. Samples werediluted 1/25,000 to 1/3,200,00.
37

A. Appendix
Samples C 100, C 001, C 002, C 003, C 005
Table A.4: Colostrum samples C 100, C 001, C 002, C 003, C 005. Setup for ELISA (upper half) andOD measured (lower half).
* 1 2 3 4 5 6 7 8 9 10 11 12
A 8000 & 6000 ng/mL
C 100 C 001 C 002 C 003 C 005
B 3000 ng/mLC 1500 ng/mLD 750 ng/mLE 375 ng/mLF 187.5 ng/mLG 93.75 ng/mLH BLANK
A 1.88 1.307 2.099 2.26 2.707 2.658 2.134 1.98 1.857 1.939 2.088 1.978B 0.651 0.554 2.484 2.559 2.356 2.629 2.489 2.321 2.232 2.157 1.822 1.705C 0.407 0.337 2.695 2.704 1.979 2.464 2.608 2.547 2.493 2.237 1.316 1.251D 0.255 0.214 2.400 2.537 1.364 2.097 2.562 2.497 2.340 2.145 0.905 0.871E 0.171 0.167 2.390 2.625 0.873 1.836 2.341 2.203 2.269 2.175 0.608 0.524F 0.130 0.120 2.078 2.321 0.916 1.261 2.144 1.840 2.092 1.911 0.395 0.343G 0.102 0.099 1.774 2.012 0.197 0.919 1.633 1.502 1.751 1.748 0.241 0.188H 0.077 0.073 1.427 1.766 0.111 0.603 1.293 1.142 1.477 1.363 0.196 0.136
Note: The standard is in columns 1 and 2, diluted from 8000 ng/mL to 93.75 ng/mL. In A1 the concentrationof the standard is 8000 ng/mL while in A2 the concentration the concentration of the standard is 6000 ng/mLColostrum samples were diluted 1/500,000 to 1/64,000,000.
38
A.3. ELISA; Setup and OD
Samples 001, 002
Table A.5: Samples 001 and 002, both serum samples and colostrum sample. Setup for ELISA(upper half) and OD measured (lower half).
* 1 2 3 4 5 6 7 8 9 10 11 12
A 6000 ng/mL
001 A 002 A
C 001 C 002 BLANK
B 3000 ng/mLC 1500 ng/mLD 750 ng/mLE 375 ng/mL
001 B 002 BF 187.5 ng/mLG 93.75 ng/mLH BLANK
A 1.91 1.92 0.575 0.584 0.798 0.835 0.812 0.73 0.362 0.374 0.133 0.056B 1.105 1.069 0.336 0.330 0.454 0.500 0.484 0.562 0.244 0.238 0.056 0.053C 0.623 0.609 0.217 0.209 0.294 0.306 0.290 0.317 0.153 0.153 0.089 0.101D 0.367 0.363 0.140 0.134 0.173 0.171 0.180 0.183 0.101 0.099 0.057 0.057E 0.217 0.229 2.851 2.832 1.795 1.773 0.115 0.122 0.091 0.079 0.054 0.056F 0.146 0.170 2.464 2.540 1.357 1.273 0.090 0.093 0.073 0.074 0.062 0.066G 0.100 0.103 1.679 1.809 0.752 0.706 0.074 0.082 0.062 0.070 0.060 0.053H 0.056 0.064 1.180 1.237 0.553 0.489 0.106 0.062 0.057 0.057 0.053 0.056
Note: The standard is in columns 1 and 2, diluted from 6000 ng/mL to 93.75 ng/mL. Samples A werediluted 1/5,000 to 1/10,000, samples B were diluted 1/800,000 to 1/6,400,000 and colostrum sampleswere diluted 1/8,000,000 to 1/1,024,000,000.
39

A. Appendix
Samples 003 and 004
Table A.6: Samples 001 and 002, both serum samples and colostrum sample. Setup for ELISA(upper half) and OD measured (lower half).
* 1 2 3 4 5 6 7 8 9 10 11 12
A 6000 ng/mL
001 A 002 A
C 001 C 002 BLANK
B 3000 ng/mLC 1500 ng/mLD 750 ng/mLE 375 ng/mL
001 B 002 BF 187.5 ng/mLG 93.75 ng/mLH BLANK
A 1.81 1.689 0.580 0.539 0.796 0.870 0.592 0.516 0.404 0.432 0.064 0.062B 1.109 0.978 0.308 0.323 0.438 0.467 0.353 0.362 0.271 0.278 0.057 0.054C 0.640 0.535 0.195 0.239 0.314 0.363 0.249 0.308 0.187 0.231 0.094 0.074D 0.374 0.316 0.112 0.124 0.19 0.204 0.138 0.144 0.134 0.122 0.055 0.064E 0.217 0.181 1.575 1.605 1.070 1.045 0.102 0.099 0.09 0.087 0.058 0.055F 0.163 0.136 1.013 1.038 0.626 0.667 0.088 0.092 0.079 0.084 0.062 0.056G 0.111 0.093 0.588 0.602 0.370 0.348 0.066 0.068 0.063 0.067 0.056 0.055H 0.052 0.050 0.373 0.371 0.245 0.219 0.063 0.064 0.065 0.056 0.048 0.055
Note: The standard is in columns 1 and 2, diluted from 6000 ng/mL to 93.75 ng/mL. Samples A werediluted 1/5,000 to 1/10,000, samples B were diluted 1/800,000 to 1/6,400,000 and colostrum sampleswere diluted 1/8,000,000 to 1/1,024,000,000.
40

A.3. ELISA; Setup and OD
Samples 006 and 007
Table A.7: Samples 001 and 002, both serum samples and colostrum sample. Setup for ELISA(upper half) and OD measured (lower half).
* 1 2 3 4 5 6 7 8 9 10 11 12
A 6000 ng/mL
001 A 002 A
C 001 C 002 BLANK
B 3000 ng/mLC 1500 ng/mLD 750 ng/mLE 375 ng/mL
001 B 002 BF 187.5 ng/mLG 93.75 ng/mLH BLANK
A 1.466 1.466 0.474 0.447 0.571 0.633 0.389 0.459 0.213 0.203 0.050 0.056B 0.873 0.809 0.295 0.293 0.372 0.406 0.242 0.232 0.152 0.138 0.052 0.062C 0.485 0.437 0.157 0.162 0.205 0.200 0.406 0.219 0.107 0.102 0.053 0.216D 0.248 0.248 0.116 0.109 0.138 0.129 0.098 0.093 0.076 0.072 0.059 0.050E 0.206 0.159 2.009 2.256 1.408 1.309 0.071 0.069 0.066 0.060 0.050 0.051F 0.105 0.101 1.468 1.647 1.032 1.064 0.067 0.066 0.062 0.058 0.073 0.056G 0.088 0.078 1.094 1.107 0.649 0.665 0.063 0.056 0.055 0.054 0.049 0.050H 0.066 0.090 0.695 0.636 0.428 0.420 0.074 0.056 0.054 0.070 0.049 0.058
Note: The standard is in columns 1 and 2, diluted from 6000 ng/mL to 93.75 ng/mL. Samples A werediluted 1/5,000 to 1/10,000, samples B were diluted 1/800,000 to 1/6,400,000 and colostrum sampleswere diluted 1/8,000,000 to 1/1,024,000,000.
41
A. Appendix
Samples 008 and 009
Table A.8: Samples 001 and 002, both serum samples and colostrum sample. Setup for ELISA(upper half) and OD measured (lower half).
* 1 2 3 4 5 6 7 8 9 10 11 12
A 6000 ng/mL
001 A 002 A
C 001 C 002 BLANK
B 3000 ng/mLC 1500 ng/mLD 750 ng/mLE 375 ng/mL
001 B 002 BF 187.5 ng/mLG 93.75 ng/mLH BLANK
A 1.583 1.615 0.337 0.338 0.411 0.385 0.562 0.475 0.387 0.394 0.052 0.053B 0.87 0.856 0.208 0.203 0.256 0.273 0.305 0.351 0.280 0.297 0.049 0.113C 0.560 0.526 0.129 0.131 0.209 0.157 0.188 0.212 0.172 0.191 0.057 0.058D 0.371 0.302 0.096 0.095 0.107 0.152 0.135 0.140 0.126 0.122 0.051 0.052E 0.174 0.184 2.009 1.737 1.565 1.493 0.102 0.101 0.089 0.087 0.050 0.052F 0.133 0.124 1.127 1.144 1.169 1.176 0.079 0.078 0.100 0.070 0.110 0.052G 0.086 0.087 0.676 0.656 0.736 0.734 0.064 0.065 0.061 0.126 0.057 0.053H 0.067 0.050 0.435 0.396 0.421 0.403 0.060 0.067 0.067 0.062 0.086 0.053
Note: The standard is in columns 1 and 2, diluted from 6000 ng/mL to 93.75 ng/mL. Samples A werediluted 1/5,000 to 1/10,000, samples B were diluted 1/800,000 to 1/6,400,000 and colostrum sampleswere diluted 1/8,000,000 to 1/1,024,000,000.
42

A.3. ELISA; Setup and OD
Samples 010 and 011
Table A.9: Samples 010 and 011, both serum samples and colostrum sample. Setup for ELISA(upper half) and OD measured (lower half).
* 1 2 3 4 5 6 7 8 9 10 11 12
A 6000 ng/mL
001 A 002 A
C 001 C 002 BLANK
B 3000 ng/mLC 1500 ng/mLD 750 ng/mLE 375 ng/mL
001 B 002 BF 187.5 ng/mLG 93.75 ng/mLH BLANK
A 1.090 1.159 0.575 0.585 0.409 0.411 0.351 0.310 0.278 0.278 0.057 0.057B 0.676 0.716 0.388 0.392 0.241 0.274 0.228 0.213 0.194 0.202 0.053 0.053C 0.401 0.402 0.262 0.223 0.193 0.156 0.129 0.133 0.119 0.171 0.053 0.053D 0.207 0.231 0.158 0.160 0.100 0.103 0.097 0.095 0.087 0.246 0.055 0.054E 0.150 0.151 1.125 1.100 1.053 1.096 0.076 0.080 0.075 0.075 0.056 0.056F 0.113 0.113 0.778 0.722 0.843 0.839 0.074 0.070 0.073 0.069 0.067 0.061G 0.082 0.081 0.480 0.457 0.534 0.525 0.063 0.064 0.063 0.061 0.058 0.058H 0.056 0.059 0.293 0.258 0.281 0.287 0.056 0.054 0.054 0.060 0.053 0.062
Note: The standard is in columns 1 and 2, diluted from 6000 ng/mL to 93.75 ng/mL. Samples A werediluted 1/5,000 to 1/10,000, samples B were diluted 1/800,000 to 1/6,400,000 and colostrum sampleswere diluted 1/8,000,000 to 1/1,024,000,000.
43

A. Appendix
Sample 005
Table A.10: Sample 5, all three serum samples and colostrum sample. Setup for ELISA (upperhalf) and OD measured (lower half).
* 1 2 3 4 5 6 7 8 9 10 11 12
A 6000 ng/mL
005 A 005 B 005 C
C 005 BLANK
B 3000 ng/mLC 1500 ng/mLD 750 ng/mLE 375 ng/mL
BLAnK BLANK BLANKF 187.5 ng/mLG 93.75 ng/mLH BLANK
A 0.891 0.934 0.414 0.419 1.097 1.008 0.995 1.000 0.246 0.243 0.064 0.059B 0.527 0.523 0.251 0.254 0.765 0.765 0.721 0.729 0.181 0.177 0.058 0.056C 0.309 0.303 0.157 0.157 0.454 0.440 0.443 0.431 0.116 0.118 0.062 0.056D 0.217 0.198 0.109 0.103 0.283 0.286 0.274 0.260 0.084 0.083 0.050 0.052E 0.131 0.131 0.055 0.057 0.055 0.057 0.059 0.053 0.068 0.068 0.054 0.053F 0.105 0.100 0.064 0.064 0.067 0.062 0.064 0.060 0.067 0.070 0.059 0.060G 0.082 0.077 0.056 0.059 0.059 0.057 0.058 0.056 0.059 0.058 0.054 0.055H 0.051 0.072 0.052 0.052 0.057 0.051 0.053 0.053 0.053 0.055 0.051 0.05
Note: The standard is in columns 1 and 2, diluted from 6000 ng/mL to 93.75 ng/mL. Sample Awas diluted 1/5,000 to 1/10,000, sample B and C were diluted 1/800,000 to 1/6,400,000 and colostrumsample was diluted 1/8,000,000 to 1/1,024,000,000.
44