Embed Size (px)
Citation preview

Faculteit der Economische Wetenschappen en Econometric
SERlE RESEARCH MEMORANDA
Predicting online purchase behavior:
replications and tests of competing models
Hans van der HeijdenTibert VerhagenMarcel Creemers
R e s e a r c h M e m o r a n d u m 2000- 1 6 J u n e 2 0 0 0
wije Universiteit amsterdam
PREDICTING ONLINE PURCHASE BEHAVIOR:
REPLICATIONS AND TESTS OF COMPETING MODELS
Hans van der Heijden
Tibert Verhagen
Marcel Creemers
Vrije Universiteit Amsterdam
Faculty of Economics and Management
Department of Information Systems, Marketing, and Logistics
De Boelelaan 1105
1081 HV Amsterdam, The Netherlands
Tel. +3120 444 6050 - Fax +3120 444 6005
E-mail: [email protected]
Abstract
Online purchase behavior is definitely an interesting and relevant issue for marketeers today. In
this paper, we report on a study into the antecedents of online purchase intention for B2C
websites. In particular, this research juxtaposes two competing models that explain online
purchase intention. The first model is trust-oriented and argues that online purchase intention is
primarily predicted by trust in the company. The second model is website-oriented and argues
that purchase intention is primarily predicted by usefulness and ease-of-use of the e-commerce
website. In order to test to what extent each of these orientations has merit, a replication was
carried out of the trust-oriented study by Jarvenpaa, Tractinsky, and Vitale (2000). The model
was extended with the website-oriented constructs from by Chau, Au, and Tam (2000), first
developed by Davis (1989).
The replication study involved 227 undergraduate students. 64.4% of them had never bought
online; 8.8% had bought on the intemet at least four times. Consequently, the results of the study
are somewhat biased towards initiaZ purchase intention as opposed to repeat purchase intention.
The research has a number of important findings. First, online purchase intention at the website is
strongly determined by attitude towards online shopping at the website, providing support for the
Theory of Reasoned Action in a website context. Second, perceived risk of shopping strongly
influences attitude towards shopping. Trust in the company does not influence attitude directly,
but indirectly through a significant impact on perceived risk. Third, perceived reputation
influences trust, whereas perceived size does not, at least not in the case of low-value products.
Fourth, website ease-of-use strongly and positively influences website usefulness. Finally,
website usefulness does not significantly influence attitude towards shopping and online purchase
intention. We conclude that trust-oriented models appear to be more appropriate to explain online
purchase intention than website-oriented models.
2
Introduction
The research reported in this paper is concerned with purchase behavior on the World Wide Web.
Studying purchase behavior on the web is clearly relevant for marketeers today. Many marketeers
seek to improve the quantity and quality of their online customer base. A deeper insight into the
ways consumer behave on the web and purchase online may lead to practical recommendations
for e-commerce and marketing strategists.
Online purchase behavior is also interesting to study from a research perspective. Consumer
behavior is a relatively well researched area in marketing (for overviews see Engel et al., 1995;
Schiffman & Kanuk, 2000). Textbooks on intemet marketing and online consumer behavior are
also beginning to appear (e.g. Hanson, 2000, Turban et al., 2000). However, comparatively little
is known about how web purchase behavior differs from traditional purchase behavior, and
whether there are any specific web-based factors that should be taken into account.
Online purchase behavior is a broad topic, and this paper is concerned with only one specific
element: online purchase intention, defined as the degree to which a consumer is inclined to
purchase a product or service at a specific website. In this paper, we report on a study into the
antecedents of online purchase intention for Business to Consumer (B2C) websites. Specifically,
we replicate and test two competing models for online purchase intention: one that is more “trust”
oriented, and one that is more “website” oriented. The first one gives greater attention to trust in
the company, the second one argues that well-designed websites matter most.
The outline of this paper is as follows. First, we discuss the theoretical determinants of online
purchase behavior, paying attention to the trust oriented model and the website oriented model.
This results in a number of rival hypotheses relating trust and website antecedents to online
purchase behavior. Subsequently, we discuss the research design in more detail and present an
overview of the results. A discussion of the findings and the conclusions complete the paper.
Theoretical foundations
Studies on online purchase intention have only recently begun to appear (see Lohse & Spiller,
1998; Li et al., 1999 for examples). In this paper, we juxtapose two theoretical models that
explain and predict online purchase intention: one that is oriented towards trust in the company
presenting the website, and the other which is oriented towards characteristics about the website.
It should be acknowledged at this point that we recognise that neither trust nor website
characteristics are sufficient indicators for purchase intention. Indeed, powerful indicators such as
product value for money, and need fulfilment at the moment of value are excluded from both
models. What matters to us here is whether trust determinants and website determinants have
non-significant influences on purchase intention. If so, then both are valid model s and both would
contribute to our existing body of knowledge.
The two perspectives will now be discussed in more detail.
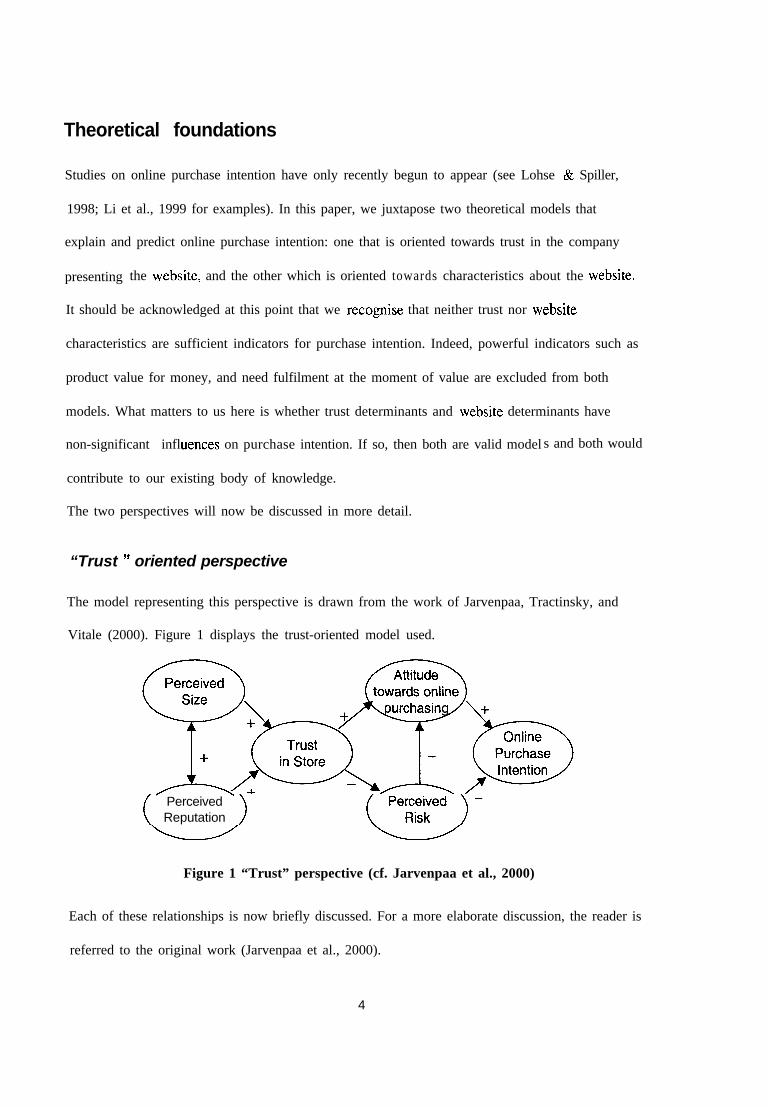
“Trust ” oriented perspective
The model representing this perspective is drawn from the work of Jarvenpaa, Tractinsky, and
Vitale (2000). Figure 1 displays the trust-oriented model used.
PerceivedReputation
Figure 1 “Trust” perspective (cf. Jarvenpaa et al., 2000)
Each of these relationships is now briefly discussed. For a more elaborate discussion, the reader is
referred to the original work (Jarvenpaa et al., 2000).
4
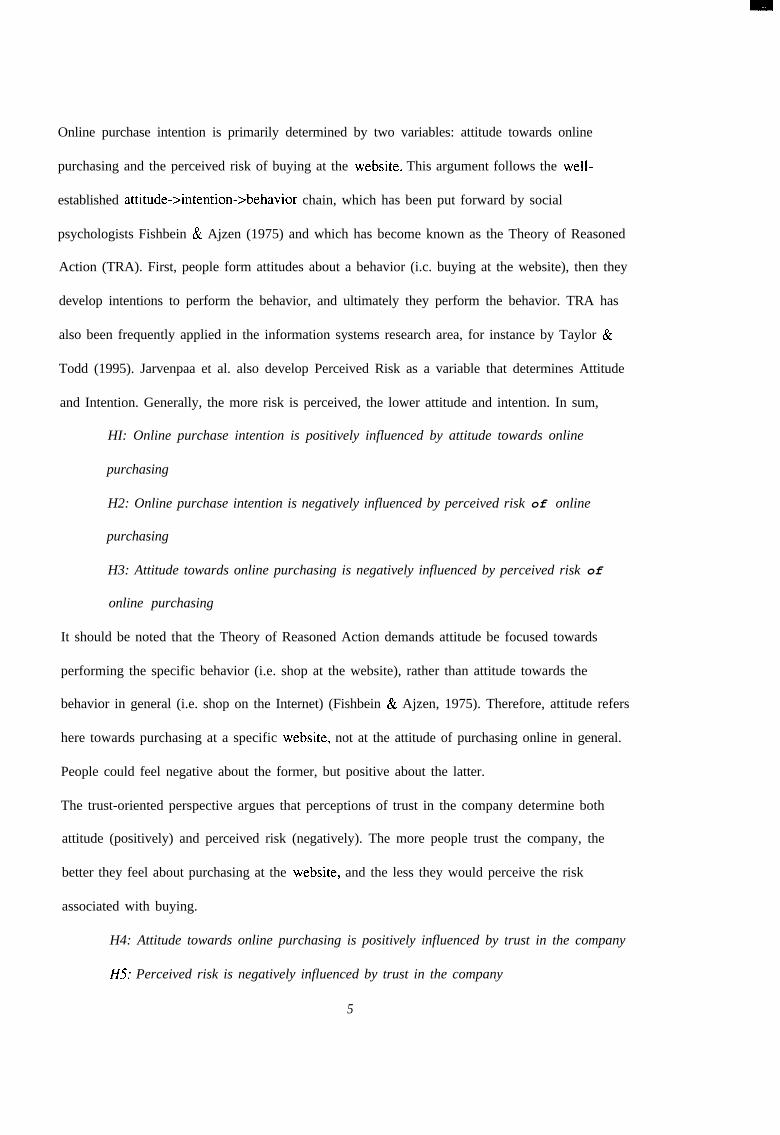
Online purchase intention is primarily determined by two variables: attitude towards online
purchasing and the perceived risk of buying at the website. This argument follows the well-
established attitude-Sntention->behavior chain, which has been put forward by social
psychologists Fishbein & Ajzen (1975) and which has become known as the Theory of Reasoned
Action (TRA). First, people form attitudes about a behavior (i.c. buying at the website), then they
develop intentions to perform the behavior, and ultimately they perform the behavior. TRA has
also been frequently applied in the information systems research area, for instance by Taylor &
Todd (1995). Jarvenpaa et al. also develop Perceived Risk as a variable that determines Attitude
and Intention. Generally, the more risk is perceived, the lower attitude and intention. In sum,
HI: Online purchase intention is positively influenced by attitude towards online
purchasing
H2: Online purchase intention is negatively influenced by perceived risk of online
purchasing
H3: Attitude towards online purchasing is negatively influenced by perceived risk of
online purchasing
It should be noted that the Theory of Reasoned Action demands attitude be focused towards
performing the specific behavior (i.e. shop at the website), rather than attitude towards the
behavior in general (i.e. shop on the Internet) (Fishbein & Ajzen, 1975). Therefore, attitude refers
here towards purchasing at a specific website, not at the attitude of purchasing online in general.
People could feel negative about the former, but positive about the latter.
The trust-oriented perspective argues that perceptions of trust in the company determine both
attitude (positively) and perceived risk (negatively). The more people trust the company, the
better they feel about purchasing at the website, and the less they would perceive the risk
associated with buying.
H4: Attitude towards online purchasing is positively influenced by trust in the company
H.5: Perceived risk is negatively influenced by trust in the company
5
People develop trust by at least two factors: the perceived size of the company (not the actual
size), and their perceived reputation. The larger the perceived size and the perceived reputation,
the greater the trust in the company. Perceived size and perceived reputation are also believed to
be positively associated with each other’.
H6: Trust in the company is positively influenced by perceived size of the company
H7: Trust in the company is positively influenced by perceived reputation of the company
H8: Perceived size is positively associated with perceived reputation of the company
“ Website” oriented perspective
Presence or absence of these website features can be linked to dependent variables such as online
sales, with significant relationships uncovered (see Lohse & Spiller, 1998 for an example). The
argument underlying the orientation of this type of research is that perceived purchase facilitation
increases purchase intention. Facilitating online purchasing is achieved through website features,
which is why this type of research can be classified as the “website” perspective. The website
perspective argues that all other things being equal, better websites matter.
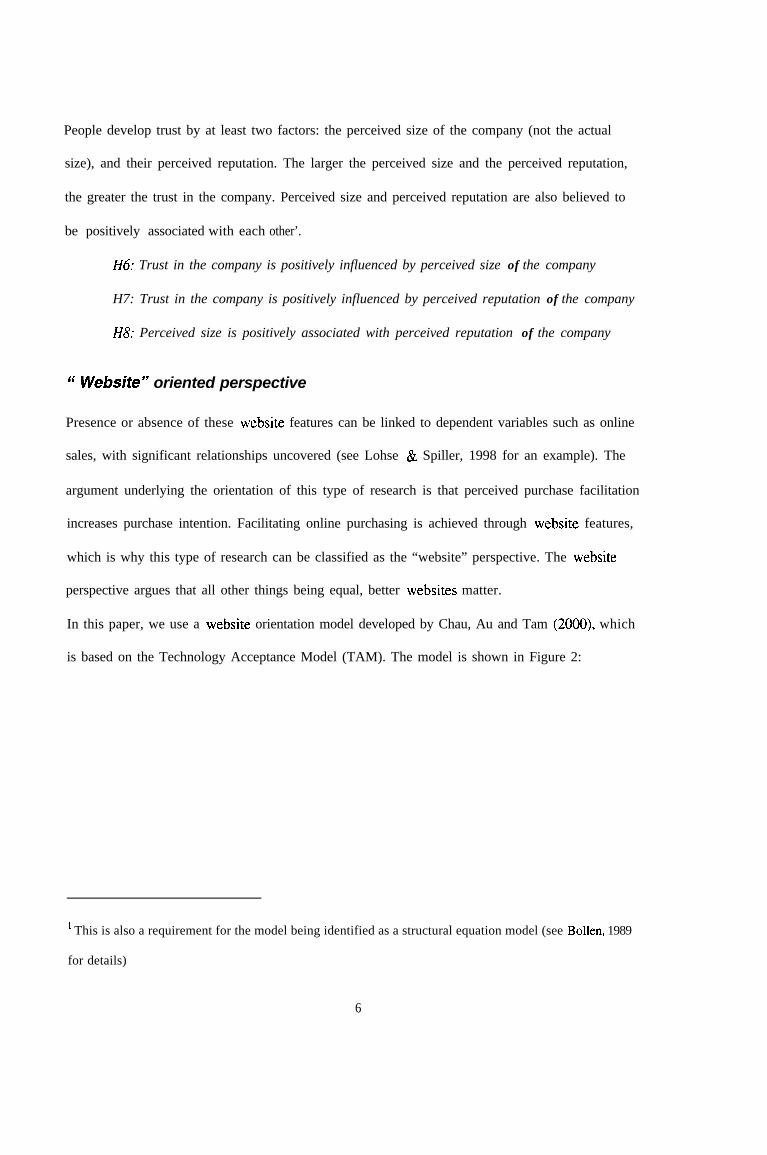
In this paper, we use a website orientation model developed by Chau, Au and Tam (2000), which
is based on the Technology Acceptance Model (TAM). The model is shown in Figure 2:
’ This is also a requirement for the model being identified as a structural equation model (see Bollen, 1989
for details)
6
Figure 2 “Website” perspective (adapted from Chau et al., 2000; based upon Davis, 1989)
Chau et al. (2000) focused on information presentation in e-commerce websites - they did not
empirically validate the full TAM model in this context, but used it as a theoretical vehicle to
illustrate the way information presentation could be linked to online purchase intention. As can be
seen from the model, Attitude and Online Purchase Intention are again taken from the Theory of
Reasoned Action. Therefore, these variables will not be discussed in this section.
The Technology Acceptance Model (first developed by Davis, 1989 and recently extended by
Venkatesh & Davis, 2000) highlights two factors: usefulness of an information system and ease
of use of the system. More useful systems and those that are easier to use are associated with
higher acceptance of the information system.
Adapting TAM to an e-commerce context implies that the more useful a website is, the more
positive the attitude about purchasing at the website. Chau et al. have operationalised usefulness
in terms of “purchase speed” and “convenience”: in general, websites that offer greater
purchasing speed and convenience are more useful than those that are not.
H9: Online purchase intention is positively associated with perceived website usefulness
HI 0: Attitude towards online purchasing is positively influenced by perceived website
usefilness
A second component of the TAM model is “ease of use”. In terms of websites, ease-of-use is
typically associated with the navigational properties of the website. The better the navigation
7
around the site, the more easy the site is to use. The easier to use a website, the more positive the
attitude about purchasing at the website. Also, the easier to use a website, the greater the
perceived usefulness (see also Taylor & Todd, 1995).
HI I: Attitude towards online purchasing is positively influenced by perceived website
ease of use
H12: Perceived website usefilness is positively influenced by perceived website ease of
use
Research design
Measurement instrument
To test the hypotheses derived in the previous section we designed two surveys based on prior
research. The first questionnaire contained demographic variables such as age, sex, intemet
experience, and experience in online purchasing. The second questionnaire contained question
items about one specific website.
In order to increase reliability, each construct was operationalised with multiple items. The
operationalisations for the constructs were taken directly from Jarvenpaa et al. (2000) and Chau et
al. (2000). The latter are based on Davis (1989). We did make some modifications. Most of these
were adaptations to make the items more suitable in a Dutch context, others were substantial. In
particular, we replaced the word “Internet” with “This website” in the Attitude construct to reflect
the Theory of Reasoned Action better. Also, in the Online Purchase Intention construct, we
changed the specific time horizons (“three months” and “the next year”) to broader terms (“short
term” and “the longer term”) since the former is an arbitrary operationalisation of the latter.
Finally, we changed the wording of the Ease of Use and Usefulness items to make them more
suitable for e-commerce websites. The resulting items can be found in the appendix.
Sample
Our sample consisted of a group of undergraduate students who took the course “Information
systems” at the Vrije Universiteit Amsterdam during Spring 2000. As an incentive to participate,
we offered them a bonus grade after succesfully taking part in the research. We programmed the
surveys with JavaScript, VBScript and ASP and published them on the Internet, cf. Dillman
(2000). Each student was notified in class of the URL to the web-based questionnaires, so they
could complete them both at home or on campus. It was also possible to print out the survey and
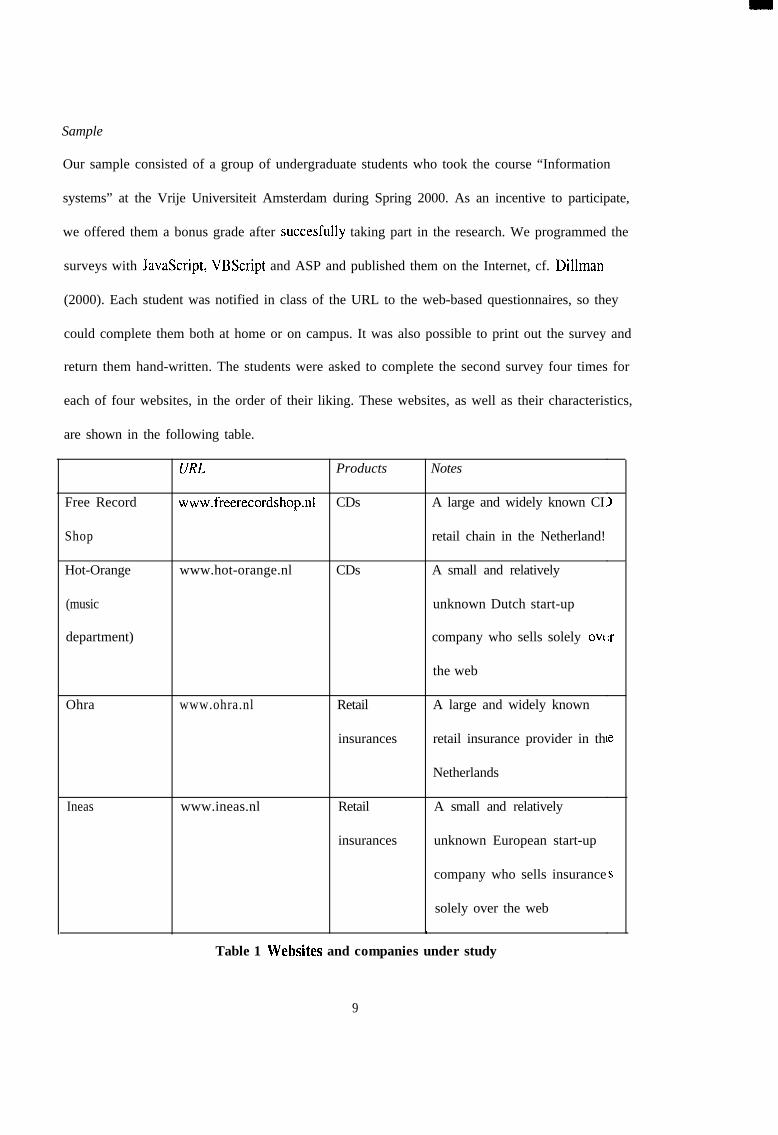
return them hand-written. The students were asked to complete the second survey four times for
each of four websites, in the order of their liking. These websites, as well as their characteristics,
are shown in the following table.
Free Record
Shop
Hot-Orange
(music
department)
Ohra
Ineas
URL Products Notes
www.freerecordshop.nl CDs A large and widely known CI
retail chain in the Netherland!
www.hot-orange.nl CDs A small and relatively
unknown Dutch start-up
company who sells solely ovf
the web
www.ohra.nl Retail A large and widely known
insurances retail insurance provider in th
Netherlands
www.ineas.nl Retail A small and relatively
insurances unknown European start-up
company who sells insurance
solely over the webt
Table 1 Websites and companies under study
9
Sample
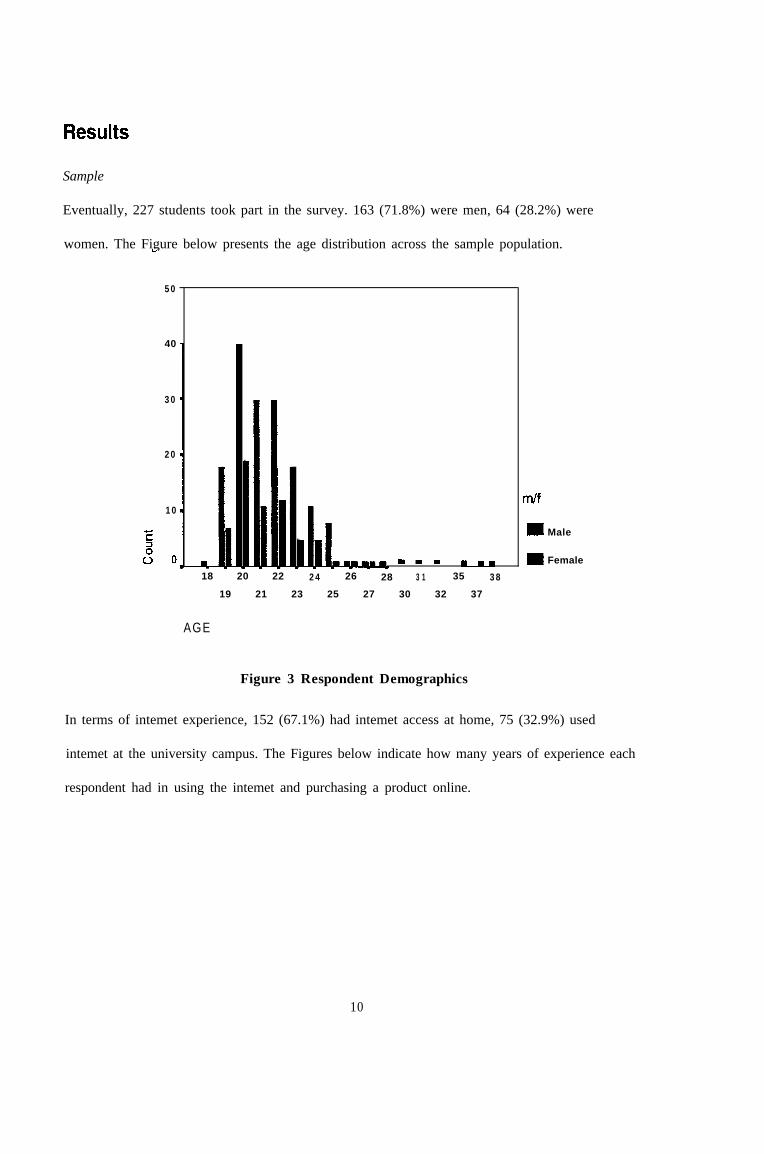
Eventually, 227 students took part in the survey. 163 (71.8%) were men, 64 (28.2%) were
women. The Figure below presents the age distribution across the sample population.”
5 0
40
3 0
2 0
1 0
zs0 0 -mm mu
2 4 26 28 3 1 35 3 8
m/f
m Male
m Female
18 20 22
19 21 23 25 27 30 32 37
AGE
Figure 3 Respondent Demographics
In terms of intemet experience, 152 (67.1%) had intemet access at home, 75 (32.9%) used
intemet at the university campus. The Figures below indicate how many years of experience each
respondent had in using the intemet and purchasing a product online.
10
E
20 0.
1 year 2 years 3 years 4 years or more
Experience with internet
160
80
60
co 20u n t
0Never Twice Four times or more
Once Three times
Online purchasing experience
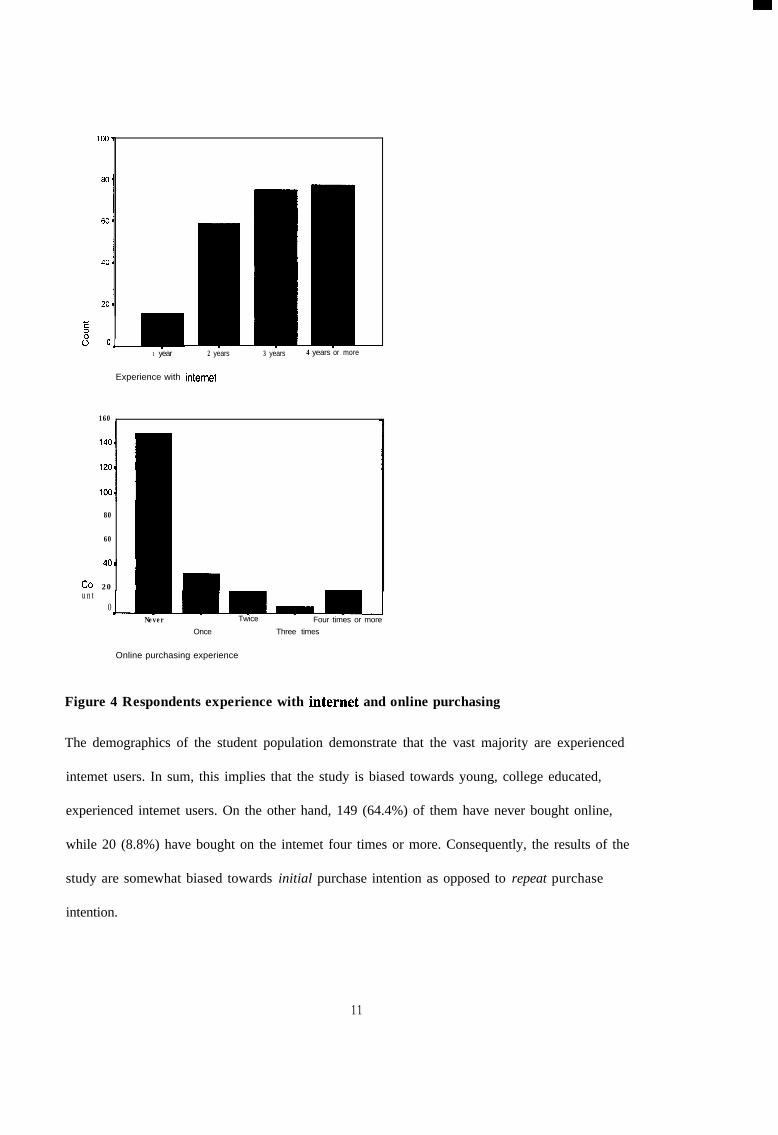
Figure 4 Respondents experience with internet and online purchasing
The demographics of the student population demonstrate that the vast majority are experienced
intemet users. In sum, this implies that the study is biased towards young, college educated,
experienced intemet users. On the other hand, 149 (64.4%) of them have never bought online,
while 20 (8.8%) have bought on the intemet four times or more. Consequently, the results of the
study are somewhat biased towards initial purchase intention as opposed to repeat purchase
intention.
11
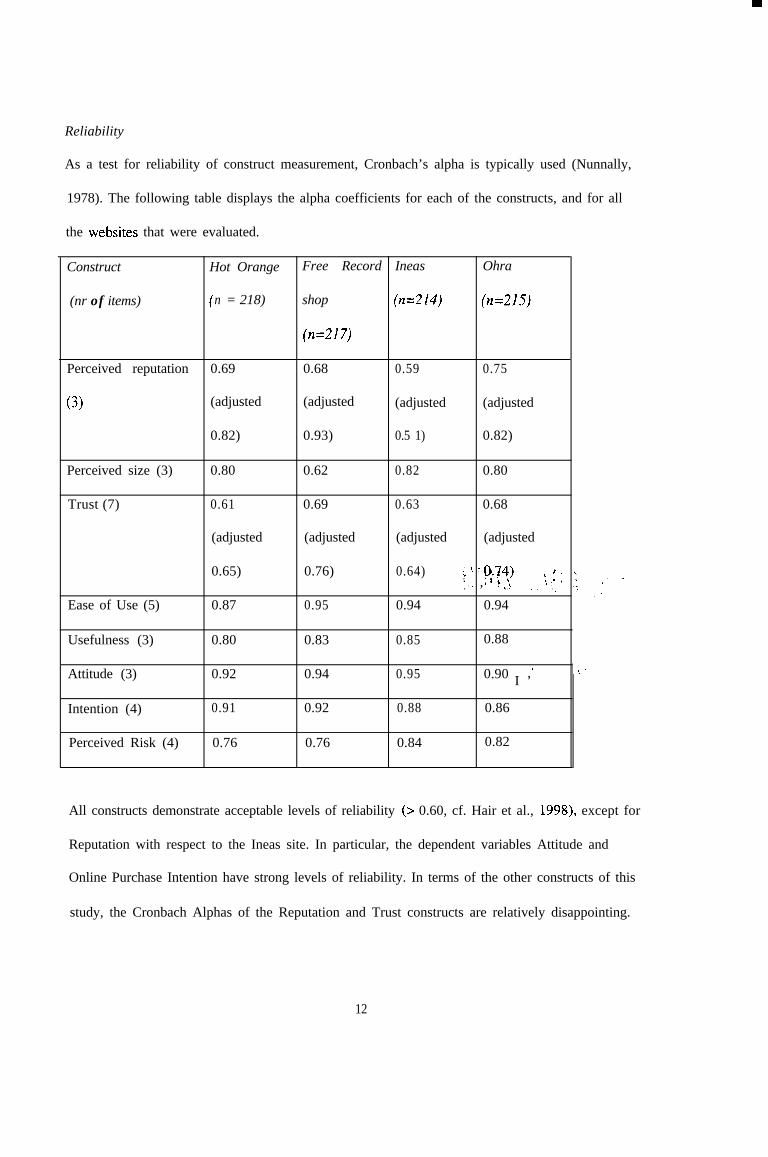
Reliability
As a test for reliability of construct measurement, Cronbach’s alpha is typically used (Nunnally,
1978). The following table displays the alpha coefficients for each of the constructs, and for all
the websites that were evaluated.
Construct
(nr of items)
Hot Orange Free Record Ineas Ohra
( n = 218) shop (n=214) (n=215)
(n=217)
Perceived reputation 0.69 0.68 0.59 0.75
(3) (adjusted (adjusted (adjusted (adjusted
0.82) 0.93) 0.5 1) 0.82)
Perceived size (3) 0.80 0.62 0.82 0.80
Trust (7) 0.61 0.69 0.63 0.68
(adjusted (adjusted (adjusted (adjusted
0.65) 0.76) 0.64) :i y : p;.ya ‘-: ;? !4. -. - , . p 9 i1\>’ L. .*”Ease of Use (5) 0.87 0.95 0.94 0.94
Usefulness (3) 0.80 0.83 0.85 0.88
Attitude (3) 0.92 0.94 0.95 0.90 *I ’
Intention (4) 0.91 0.92 0.88 0.86
Perceived Risk (4) 0.76 0.76 0.84 0.82
All constructs demonstrate acceptable levels of reliability (> 0.60, cf. Hair et al., 1998), except for
Reputation with respect to the Ineas site. In particular, the dependent variables Attitude and
Online Purchase Intention have strong levels of reliability. In terms of the other constructs of this
study, the Cronbach Alphas of the Reputation and Trust constructs are relatively disappointing.
12
The exclusion of some indicators (in line with Jarvenpaa et al., 2000) does improve the reliability
somewhat.
Validity
To examine the validity of the models against the data, we applied structural equation modelling
techniques (for a comprehensive overview see Bollen, 1989). For our analyses we used Amos
4.01 with maximum likelihood estimation (Arbuckle & Wothke, 1999). We tested three
competing models and examined their measures of fit with the data.
The first model we estimated was the “trust” model, as put forward by Jarvenpaa et al. The
second model was the “website” model, an extension of the Technology Acceptance Model
(Davis, 1989). Finally, we estimated a complete model, one that included both the trust variables
as well as the website variables. Because we could not aggregate the data across websites (the
case observations would be interdependent), we analysed each website separately. For the sake of
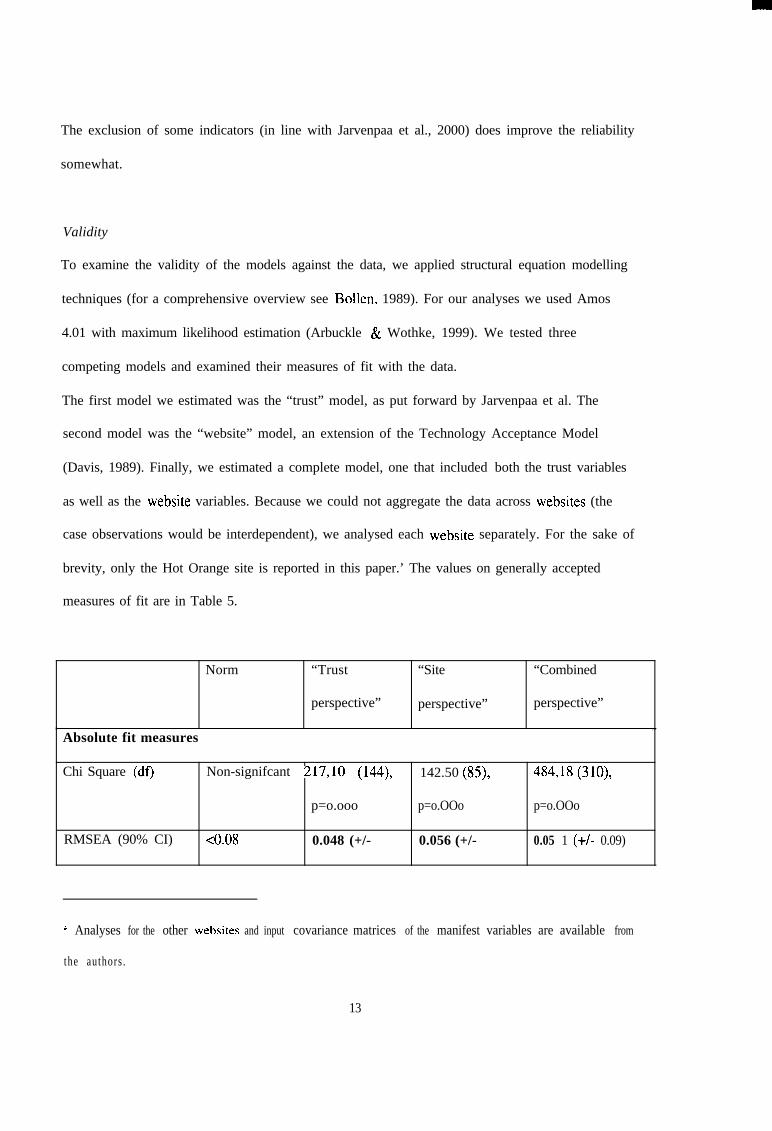
brevity, only the Hot Orange site is reported in this paper.’ The values on generally accepted
measures of fit are in Table 5.
Norm “Trust “Site
perspective” perspective”
“Combined
perspective”
,Absolute fit measures
Chi Square (df) Non-signifcant 217,lO (144), 142.50 (85), 484,18 (310),
p=o.ooo p=o.OOo p=o.OOo
RMSEA (90% CI) co.08 0.048 (+/- 0.056 (+/- 0.05 1 (+/- 0.09)
L Analyses for the other websites and input covariance matrices of the manifest variables are available from
the authors .
13
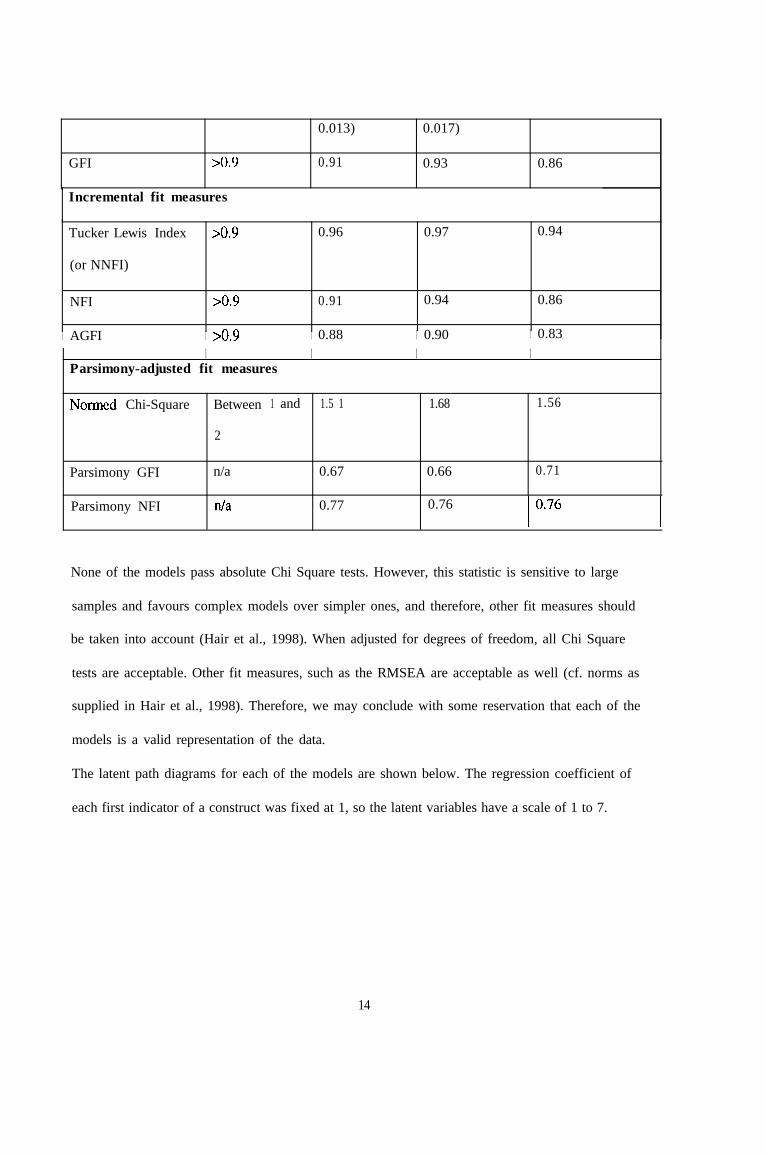
0.013) 0.017)
GFI >0.9 0.91 0.93 0.86
Incremental fit measures
Tucker Lewis Index >0.9 0.96 0.97 0.94
(or NNFI)
NFI >0.9 0.91 0.94 0.86
I AGFI I >0.9 I 0.88 I 0.90 I 0.83I
Parsimony-adjusted fit measuresI I I
Normed Chi-Square Between 1 and 1.5 1 1.68 1.56
2
Parsimony GFI n/a 0.67 0.66 0.71
Parsimony NFI n/a 0.77 0.76
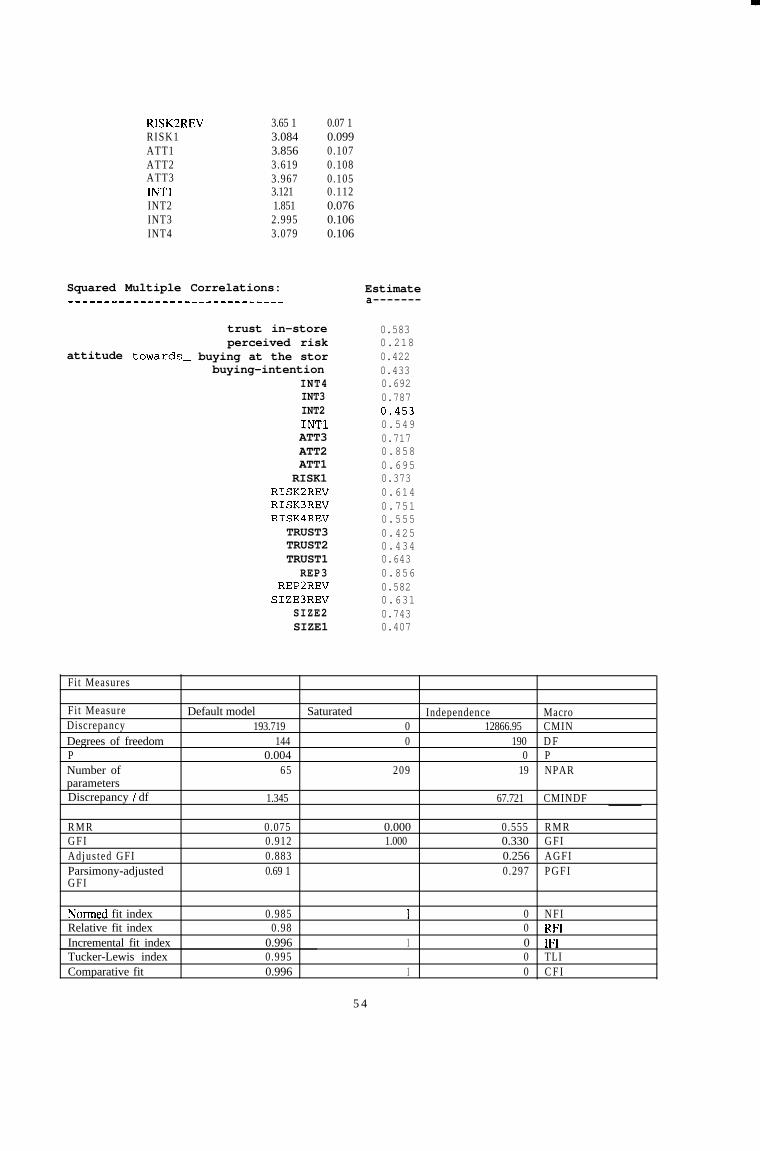
None of the models pass absolute Chi Square tests. However, this statistic is sensitive to large
samples and favours complex models over simpler ones, and therefore, other fit measures should
be taken into account (Hair et al., 1998). When adjusted for degrees of freedom, all Chi Square
tests are acceptable. Other fit measures, such as the RMSEA are acceptable as well (cf. norms as
supplied in Hair et al., 1998). Therefore, we may conclude with some reservation that each of the
models is a valid representation of the data.
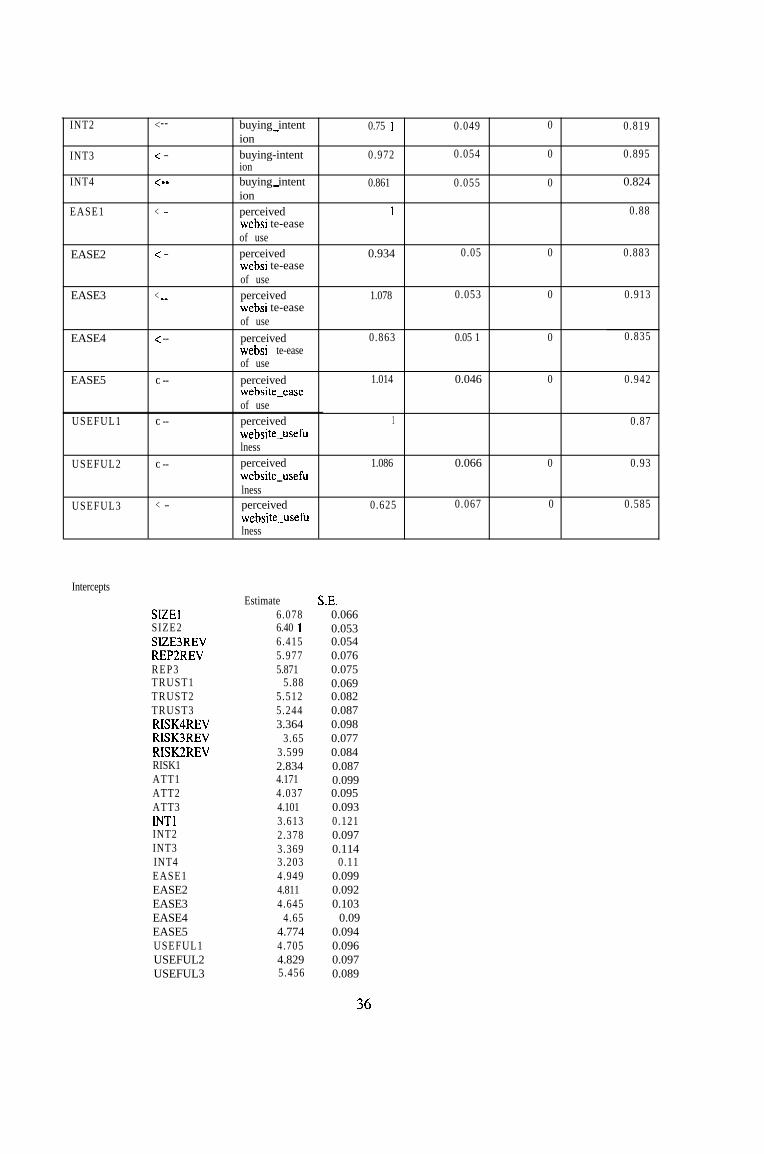
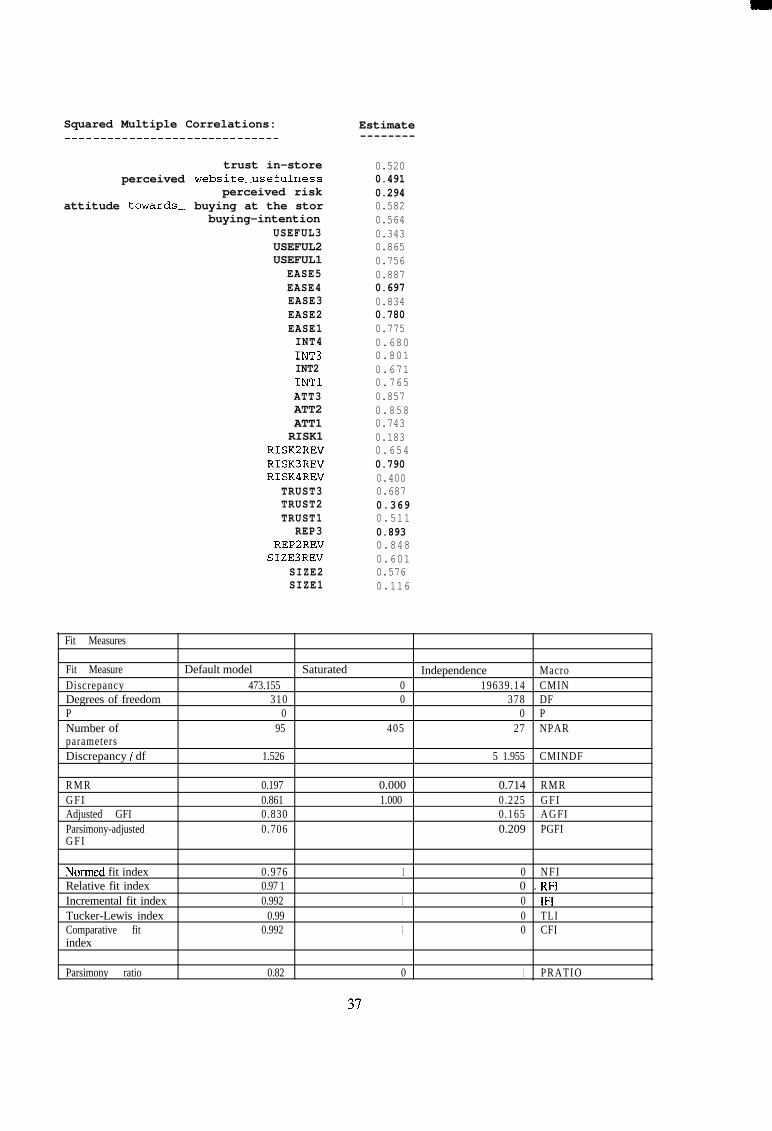
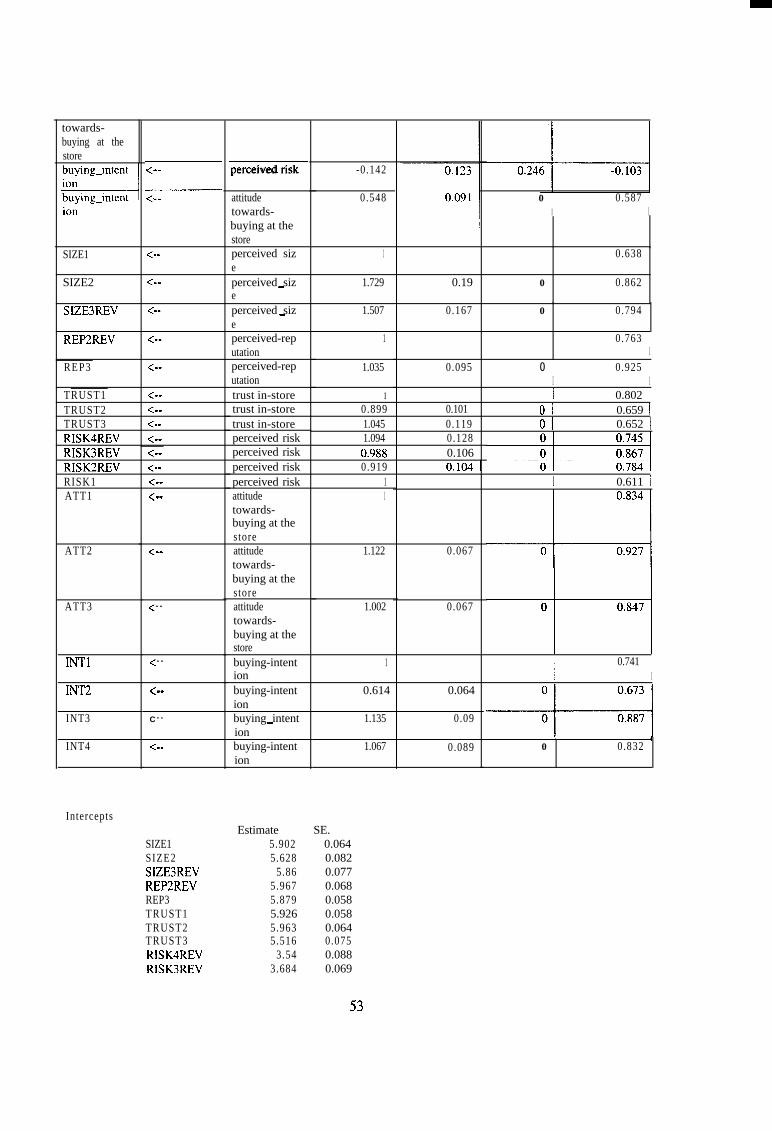
The latent path diagrams for each of the models are shown below. The regression coefficient of
each first indicator of a construct was fixed at 1, so the latent variables have a scale of 1 to 7.
14
n n n 0 . 5 9
0.56
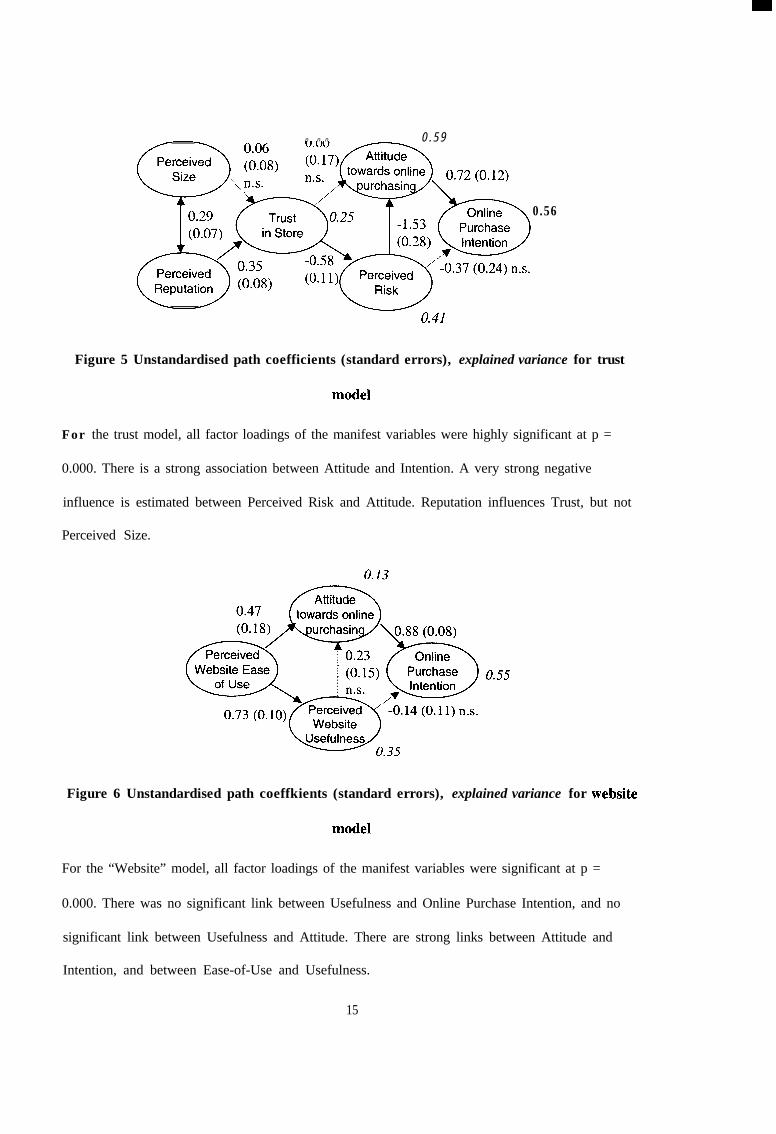
Figure 5 Unstandardised path coefficients (standard errors), explained variance for trust
For the trust model, all factor loadings of the manifest variables were highly significant at p =
0.000. There is a strong association between Attitude and Intention. A very strong negative
influence is estimated between Perceived Risk and Attitude. Reputation influences Trust, but not
Perceived Size.
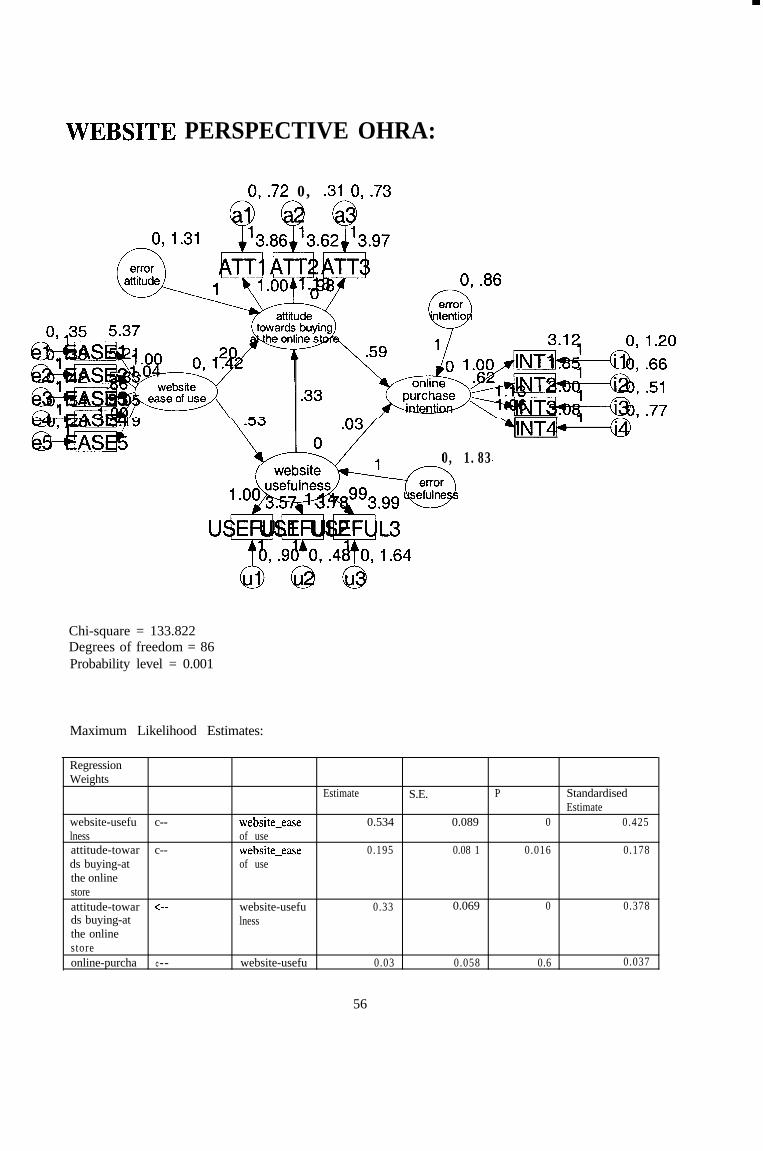
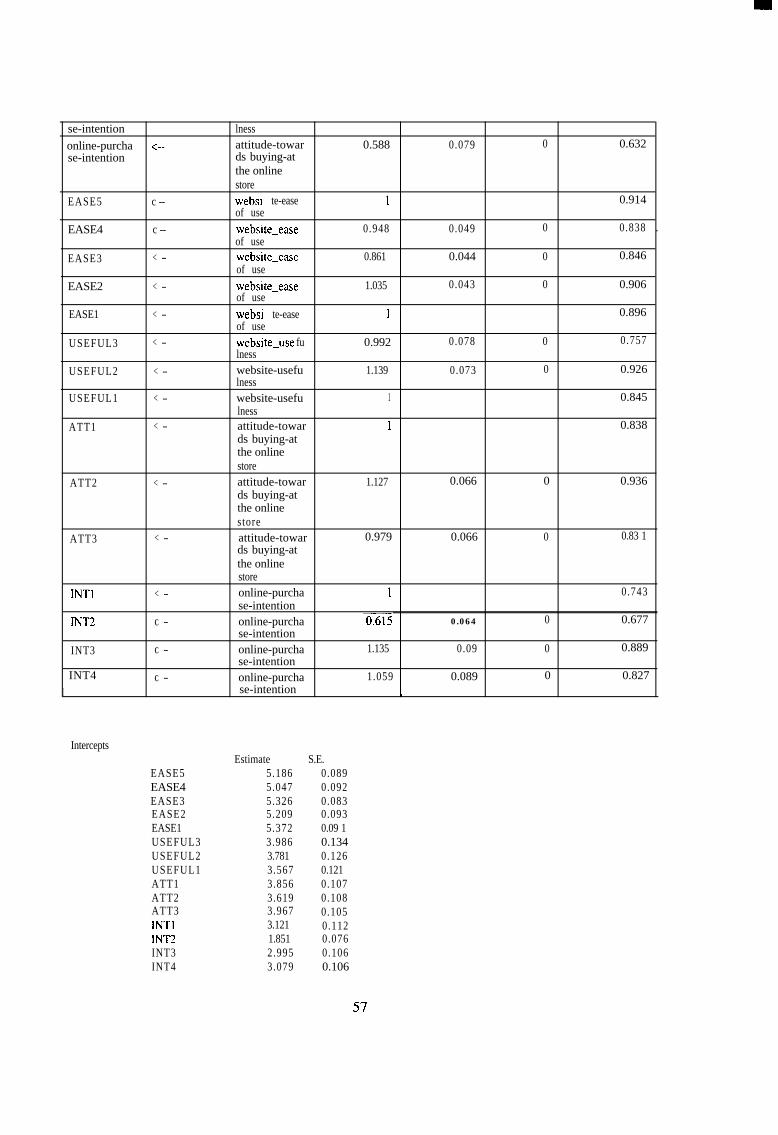
Figure 6 Unstandardised path coeffkients (standard errors), explained variance for website
For the “Website” model, all factor loadings of the manifest variables were significant at p =
0.000. There was no significant link between Usefulness and Online Purchase Intention, and no
significant link between Usefulness and Attitude. There are strong links between Attitude and
Intention, and between Ease-of-Use and Usefulness.
15
I 0.29 T r u s t 0.26//\ AA\ .m- fir,.., 1 - 1 . 5 4 ( PyrFL&
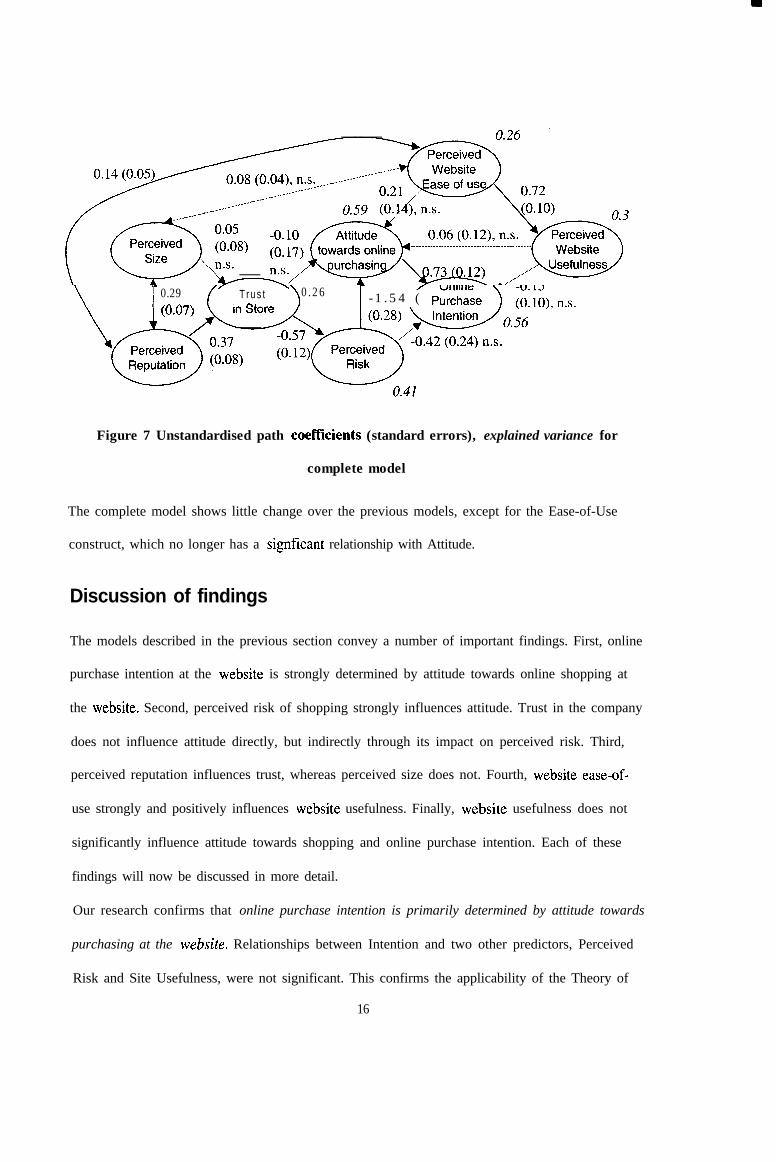
Figure 7 Unstandardised path coeffkients (standard errors), explained variance for
complete model
The complete model shows little change over the previous models, except for the Ease-of-Use
construct, which no longer has a signficant relationship with Attitude.
Discussion of findings
The models described in the previous section convey a number of important findings. First, online
purchase intention at the website is strongly determined by attitude towards online shopping at
the website. Second, perceived risk of shopping strongly influences attitude. Trust in the company
does not influence attitude directly, but indirectly through its impact on perceived risk. Third,
perceived reputation influences trust, whereas perceived size does not. Fourth, website ease-of-
use strongly and positively influences website usefulness. Finally, website usefulness does not
significantly influence attitude towards shopping and online purchase intention. Each of these
findings will now be discussed in more detail.
Our research confirms that online purchase intention is primarily determined by attitude towards
purchasing at the website. Relationships between Intention and two other predictors, Perceived
Risk and Site Usefulness, were not significant. This confirms the applicability of the Theory of
16
Reasoned Action in the context of e-commerce websites. We were able to explain-S% of the
variance in online purchase intention with the model. The Jarvenpaa et al. study achieved 43%.
Room for improvement of these findings may lie in the applicability of more advanced models of
TRA, in particular the Theory of Planned Behavior (TPB) (Ajzen, 1991; see also Taylor & Todd,
1995). TPB argues that besides attitude, subjective norms (what important others think of the
behavior) and perceived behavioral control are important predictors. Also, we suggest an
“Efficiency” perspective with Perceived Value for Money be studied in more detail. Researchers
are encouraged to pursue research on online purchase intention in these directions.
Our second finding is that Perceived Risk strongly influences Attitude, and that Trust in a
Company does not. Trust influences Attitude indirectly through Perceived Risk. In other words,
respondents form their attitude towards online shopping primarily by considering the perceived
risk of shopping at the website. This, in turn, is determined by their perceptions of trust in the
company.
This finding is in contrast with the Jarvenpaa et al. study, which did find a significant relationship
(0.59) between Trust and Attitude, and a less strong relationship (-0.37) between Perceived Risk
and Attitude. There is the possibility that our adaptations of the items of the Attitude construct
may have led to differences. Jarvenpaa et al. questioned attitude regarding online shopping in
general, and perceived risk regarding online shoppingfor a specific website. It is well
conceivable that the general Attitude construct is less vulnerable to changes in the Perceived Risk
and Trust constructs, because high risk at an untrusted site may not influence a person’s overall
attitude about online shopping.
With respect to the variables impacting trust, our findings demonstrate that Perceived Reputation
does influence Trust, whereas Company Size does not. In other words, whether the respondents
trusted the company or not was not dependent on their perceptions of size of the company. The
Jarvenpaa et al. study found a similar, insignificant relationship in the case of books, but they did
found a significant influence of Size on Trust in the case of flight tickets. An explanation for this
17
result could be that respondents intuitively seek out multiple “drivers” of trust when the product
or service bought requires higher levels of trust. Small, low-value goods such as books or CDs
require less trust in the company than high-value goods and services such as intercontinental
flights. Therefore, reputation alone may be a sufficient trust driver for books and CDs, but not for
flights. Consumers may demand extra guarantees for flights, and therefore consider the size of the
company as well. If this explanation is correct, an interesting area for further research would be
the investigation of different trust drivers such as size and reputation, and the degree to which
they help build trust. Products and services could be classified according to their trust
requirements, and matched against the available trust drivers. We suggest positive, previous
experiences with an online company, not necessarily purchase-related ones, as an additional trust
driver (cf. Doney & Cannon, 1997). These experiences might be operationalised conform the
ServQual drivers Tangibles, Reliability, Responsiveness, Assurance, and Empathy (cf.
Parasuraman et al., 1991).
In terms of website features, our model confirms that Ease of Use is a strong influencer of
Usefulness. This is in line with the newer versions of the Technology Acceptance Model (Taylor
& Todd, 1995; Venkatesh & Davis, 2000). In earlier versions (Davis, 1989), Ease of Use was not
directly linked to Usefulness. Our research suggests that these TAM constructs are also valid in a
website context.
A last finding is that Ease of Use and Usefulness are not signijicantly related to Attitude towards
online shopping and Online Purchase Intention. In other words, whether the respondents found
the website useful or not had little to do with their attitude and intention to shop at the website.
This disconjirms theoretical models as proposed by Chau et al., 2000 and others.
There may be several explanations for this finding. In the first place, the dependent variables of
our study are to a certain extent dissimilar to the ones commonly found in TAM models. TAM
models typically focus on Usage Intention of the technology (see e.g. Delone & McLain, 1993,
as opposed to Online Purchase Intention. In an e-commerce context, Usage Intention is both
18
smaller and broader in scope than Online Purchase Intention. It is smaller in scope- because
Shopping invokes other non-technological drivers. It is also broader in scope because a person
may use an e-commerce website not only to purchase, but also to learn about products and
services. So, for the TAM model to work in an e-commerce context, we suggest Ease-Of-Use and
Usefulness be linked to Atttitude towards Visiting a Website and Intention to Visit.
A second, related explanation may be that Website Usefulness is inadequately operationalised.
Although “speed” and “convenience” are included in the items, “price” is not. However, an
important usefulness characteristic of e-commerce website is that it allows for cheaper products.
A more detailed assessment of the usefulness of e-commerce sites may reveal more advantages.
The Relative Advantage construct as put forward by Rogers (1995) may be helpful to structure
such an assessment.
A third explanation of our finding may be that we did not a priori select websites where Ease of
Use and Usefulness would be controversial topics. Clearly, all websites were well designed and
offered efficient online purchasing facilities. For instance, for the Hot Orange website mentioned
above, the mean and standard deviation of the first Ease of Use item (“Learning to use the
website is easy”) were 6.21 and 0.88. The other items showed equally high scores. It is
conceivable that Ease of Use and Usefulness are “hygiene factors” in the sense that they only
influence shopping behavior when they are absent from a website. Therefore, as an area for
further research we would suggest researchers experiment with “bad” websites and see what the
effects are on Purchase Intention.
Conclusions
This research has juxtaposed two competing models that explain online purchase intention. The
first model is trust-oriented and argues that online purchase intention is primarily predicted by
trust in the company. The second model is website-oriented and argues that purchase intention is
19

primarily predicted by usefulness and ease-of-use of the e-commerce website. We have tested
each model empirically, and discussed a number of findings.
We believe our research has made a number of contributions for the IS and marketing bodies of
research. First of all, we have replicated previous research in a different context and demonstrated
that some, but not all of the previously identified relationships hold. In particular, we challenge
the direct relationship between trust and attitude towards purchasing, and argue that it is to be
replaced by an indirect relationship through the mediating variable Perceived Risk. A second
contribution is that we have not found support for an impact of e-commerce website features on
attitude and intention. We do not believe that websites do not matter altogether, but submit that
their impact IS more subtle than as positioned in the existing models. A third contribution is that
we have applied portions of Theory of Reasoned Action and the Technology Acceptance Model
and demonstrated that they work in replicated e-commerce settings. These are strong theories and
we encourage researchers to build their improved theories based on these constructs.
Our work is also subject to a number of limitations. First of all, the bias of the sample impacts the
credibility with respect to broad applicability of our findings. Future research will have to
demonstrate that our findings hold in other contexts, with other samples. Second, our work may
have suffered from measurement problems pertaining to Website Usefulness, as discussed earlier.
Finally, the choice of four specific websites may impact the generalisablity of the findings to
other websites.
Despite these limitations, we believe our work has value for both researchers and practitioners.
Although replications are relatively uncommon in the IS field, it is through accurate replications
in other contexts and detailed discussions of findings that we are able to make progress and move
beyond theoretical claims with little empirical basis. With our research, we hope to have
contributed a small step in the right direction.
20
References
Ajzen, I., The theory of planned behaviour, Organisational behaviour and human decision
processes, 50, 199 1, pp. 179-211
Arbuckle, J.L, & W. Wothke, AMOS 4.0 User’s Guide, SmallWaters Corporation, 1999
Bollen, K.A., Structural equations with latent variables, John Wiley dz Sons, New York, 1989
Chau, P.Y.K., G. Au & K.Y. Tam, Impact of information presentation modes on online shopping:
an empirical evaluation of a broadband interactive shopping service, Journal of
Organisational Computing and Electronic Commerce, 10, 1,2000, pp. l-22
Davis, F.D., Perceived usefulness, perceived ease of use and user acceptance of information
technology, MIS Quarterly, September 1989, pp. 319-340
DeLone, W.H. & E. R. McLean, Information system success: the quest for the dependent
variable, Information Systems Research, 3, 1, 1992, pp. 60-95
Dillman, D.A., Mail and inter-net surveys: the tailored design method, 2nd edition, John Wiley &
Sons, New York, 2000
Doney, P.M. & J.P. Cannon, An examination of the nature of trust in buyer-seller relationships,
Journal of Marketing, 61, April 1997, pp. 35-51
Engel, J.F., R.D. Blackwell & P.W. Miniard, Consumer behavior, 8* edition, Dryden, Forth
Worth, 1995
Fishbein, M. & I. Ajzen, Belief attitude, intention and behaviour: an introduction to theory and
research, Addison-Wesley, Reading, MA, 1975
Hair, J.F., R.E. Anderson, R.L. Tatham, W.C. Black, Multivariate data analysis, 5* edition,
Prentice-Hall, Upper Saddle River, NJ, 1998
Hanson, W., Principles of internet marketing, South-Western College Publishing, Cincinnati,
2000
21
Jarvenpaa, S.L., N. Tractinsky & M. Vitale, Consumer trust in an intemet store, Information
Technology and Management, 1,2000, pp. 45-7 1
Li, H., C. Kuo & M.G. Russel, The impact of perceived channel utilities, shopping orientations,
and demographics on the consumer’s online buying behaviour, JoumaZ of Computer-
mediated Communication, 5,2, December 1999
Lohse, G.L. & P. Spiller, Electronic shopping: the effect of customer interfaces on traffic and
sales, Communications of the ACM, 41,7, 1998, pp. 81-87
Nunnally, J.C., Psychometric Theory, 2nd edition, McGraw-Hill, New York, 1978
Parasuraman, A., V.A. Zeithaml, & L.L. Berry, Servqual: a multiple-item scale for measuring
consumer perceptions of service quality, Journal of Retailing, 64, 1, Spring 1988, pp. 12-
40
Rogers, E.M., Difision of innovations, 4ti edition, Free Press, New York, 1995
Schiffman, L.G. & L.L. Kanuk, Consumer behavior, 7* edition, Prentice Hall, Upper Saddle
River, 2000
Taylor, S. & P.A. Todd, Understanding IT usage: a test of competing models, Information
Systems Research, 6,2, 1995, pp. 144-176
Turban, E., J. Lee, D. King & H.M. Chung, Electronic commerce: a managerial perspective,
Prentice Hall, Upper Saddle River, 2000
Venkatesh, V. & F.D. Davis, A theoretical extension of the Technology Acceptance Model: Four
longitudinal field studies, Management Science, 46,2, February 2000, pp. 186-204’
22
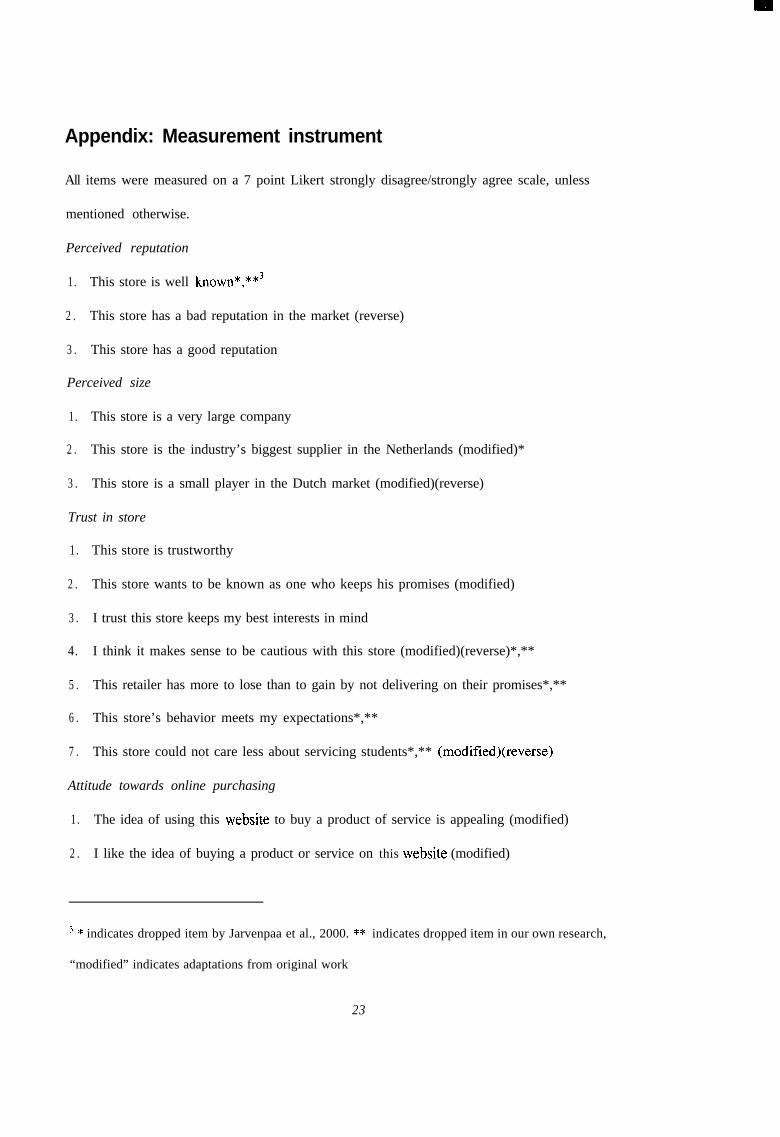
Appendix: Measurement instrument
All items were measured on a 7 point Likert strongly disagree/strongly agree scale, unless
mentioned otherwise.
Perceived reputation
1 . This store is well known*,**3
2 . This store has a bad reputation in the market (reverse)
3 . This store has a good reputation
Perceived size
1 . This store is a very large company
2 . This store is the industry’s biggest supplier in the Netherlands (modified)*
3 . This store is a small player in the Dutch market (modified)(reverse)
Trust in store
1 . This store is trustworthy
2 . This store wants to be known as one who keeps his promises (modified)
3 . I trust this store keeps my best interests in mind
4. I think it makes sense to be cautious with this store (modified)(reverse)*,**
5 . This retailer has more to lose than to gain by not delivering on their promises*,**
6 . This store’s behavior meets my expectations*,**
7 . This store could not care less about servicing students*,** (modified)(reverse)
Attitude towards online purchasing
1 . The idea of using this website to buy a product of service is appealing (modified)
2 . I like the idea of buying a product or service on this website (modified)
3 * indicates dropped item by Jarvenpaa et al., 2000. ** indicates dropped item in our own research,
“modified” indicates adaptations from original work
23

3 . Using the website to buy a product or service at this store would be a good idea (modified)
Online purchase intention
1 . How likely is it that you would return to this store’s website?
2 . How likely is it that you would consider purchasing from this website in the short term?
(modified)
3 . How likely is it that you would consider purchasing from this website in the longer term?
(modified)
4. For this purchase, how likely is it that you would buy from this store?*
Risk perception
1 . How would you characterise the decision to buy a product through this website? (a very small
risk - a very big risk)
2 . How would you characterise the decision to buy a product through this website? (high
potential for loss - high potential for gain)(Reverse)
3 . How would you characterise the decision to buy a product through this website? (a very
negative situation - a very positive sitation)(Reverse)
4. What is the likelihood of your making a good bargain by buying from this store through the
Internet? (very unlikely - very likely) (Reverse)
Ease of use
1 . Learning to use the website is easy
2 . It is easy to get the website to do what I want
3 . The interactions with the website are clear and understandable
4. The website is flexible to interact with
5 . The website is easy to use
Usefulness
1 . The online purchasing process on this website is fast
2 . It is easy to purchase online on this website
24

3 . This website is useful to buy the products or services they sell
25
. 0
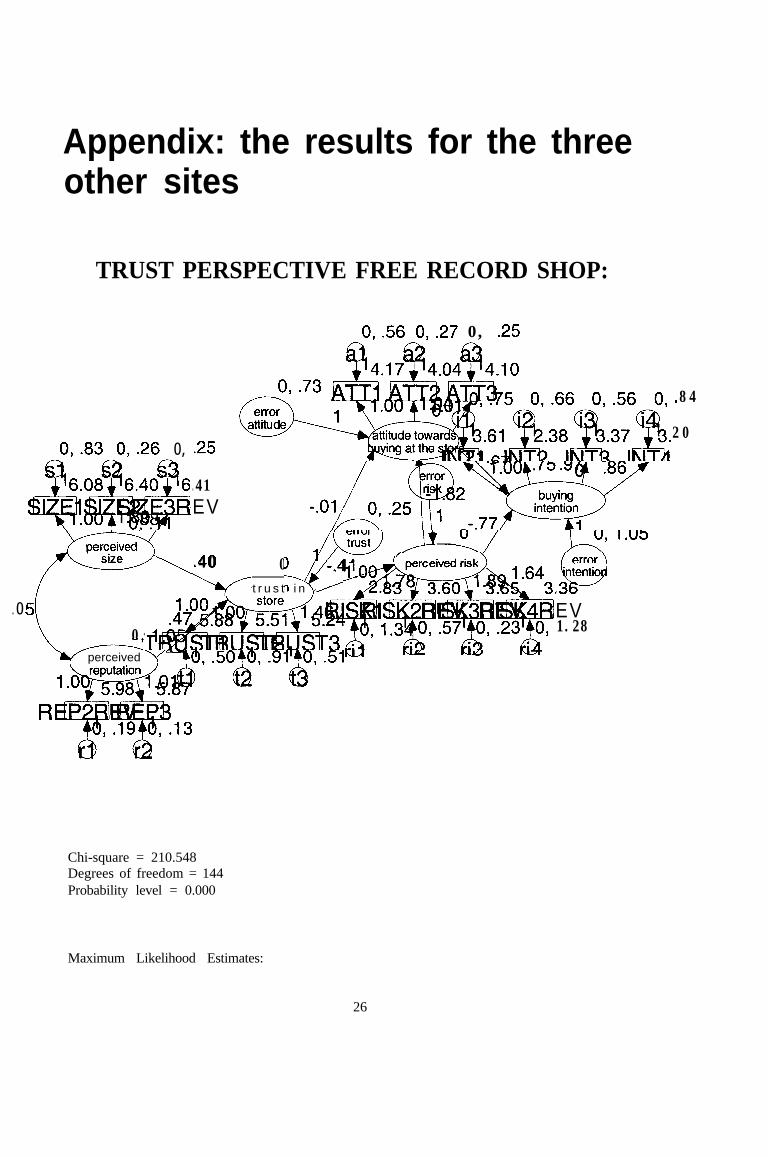
Appendix: the results for the threeother sites
TRUST PERSPECTIVE FREE RECORD SHOP:
0,.56 0,.27 0, .25
0,.83 0,.26 0, 25
.41EV
r
perce ived
33
errur
t r u s ts i z e . 40 0\ )*
-*LA A (
t r u s t i n 1
0 .k
.
EV1.28
v perceived y 1
Chi-square = 210.548Degrees of freedom = 144Probability level = 0.000
Maximum Likelihood Estimates:
.84
20
26
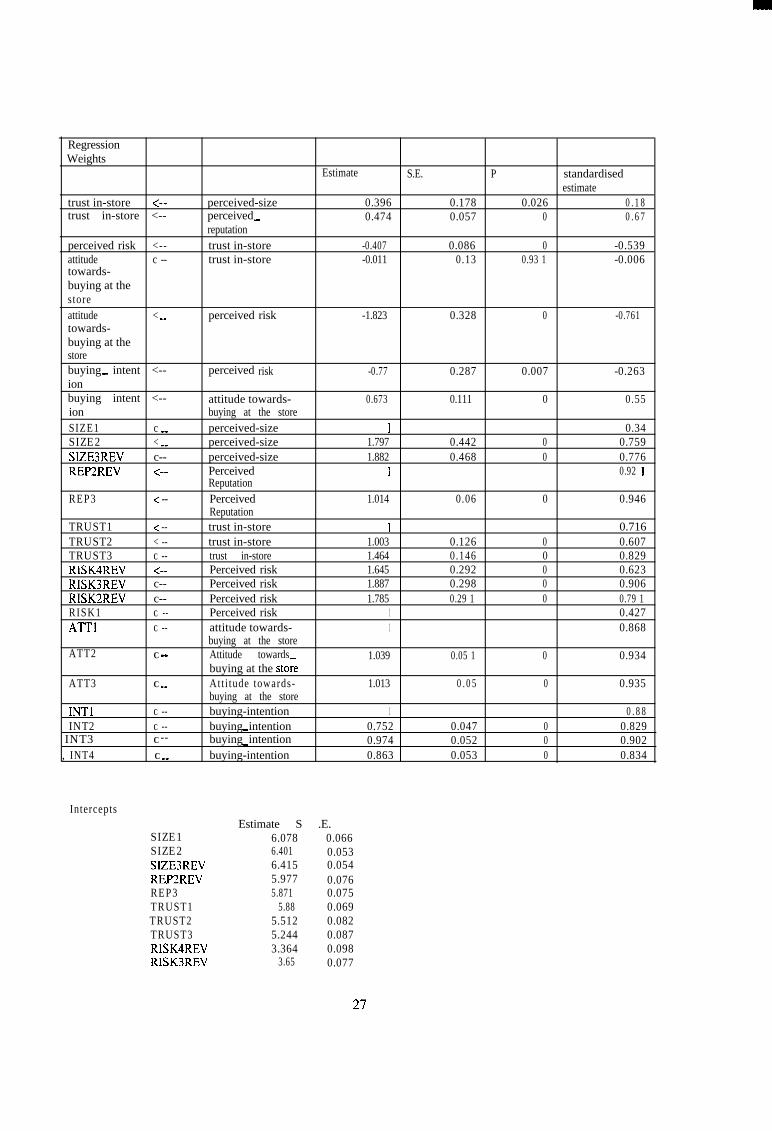
RegressionWeights
trust in-store <--trust in-store <--
perceived risk <--attitude c --towards-buying at thestoreattitude < Betowards-buying at thestorebuying intent <---ionbuying intent <---ionSIZE1 c SWSIZE2 < WVSIZE3REV c--REP2REV <--
REP3 < --
TRUST1 < --TRUST2 < --TRUST3 C --RISK4REV <--RISK3REV c--RISK2REV c--RISK1 C --ATT1 C --
ATT2 C -a
perceived-sizeperceived-reputationtrust in-storetrust in-store
perceived risk
perceived risk
attitude towards-buying at the storeperceived-sizeperceived-sizeperceived-sizePerceivedReputationPerceivedReputationtrust in-storetrust in-storetrust in-storePerceived riskPerceived riskPerceived riskPerceived riskattitude towards-buying at the storeAttitude towardsbuying at the storeAtt i tude towards-buying at the storebuying-intentionbuying intention-buying intention-buying-intention
Estimate S.E. P standardisedestimate
0.396 0.178 0.026 0.180.474 0.057 0 0.67
-0.407 0.086 0 -0.539-0.011 0.13 0.93 1 -0.006
-1.823 0.328 0 -0.761
-0.77 0.287 0.007 -0.263
0.673 0.111 0 0.55
1 0.341.797 0.442 0 0.7591.882 0.468 0 0.776
1 0.92 1
1.014 0.06 0 0.946
1 0.7161.003 0.126 0 0.6071.464 0.146 0 0.8291.645 0.292 0 0.6231.887 0.298 0 0.9061.785 0.29 1 0 0.79 1
1 0.4271 0.868
1.039 0.05 1 0 0.934
ATT3 C se
INTl C --1INT2 C --~ INT3 C --, INT4 C Mm
1.013 0.05 0 0.935
1 0.880.752 0.047 0 0.8290.974 0.052 0 0.9020.863 0.053 0 0.834
Intercepts
SIZE1SIZE2SIZE3REVREP2REVREP3TRUST1TRUST2TRUST3RISK4REVRISK3REV
Estimate S .E.6.078 0.0666.401 0.0536.415 0.0545.977 0.0765.871 0.075
5.88 0.0695.512 0.0825.244 0.0873.364 0.098
3.65 0.077
27
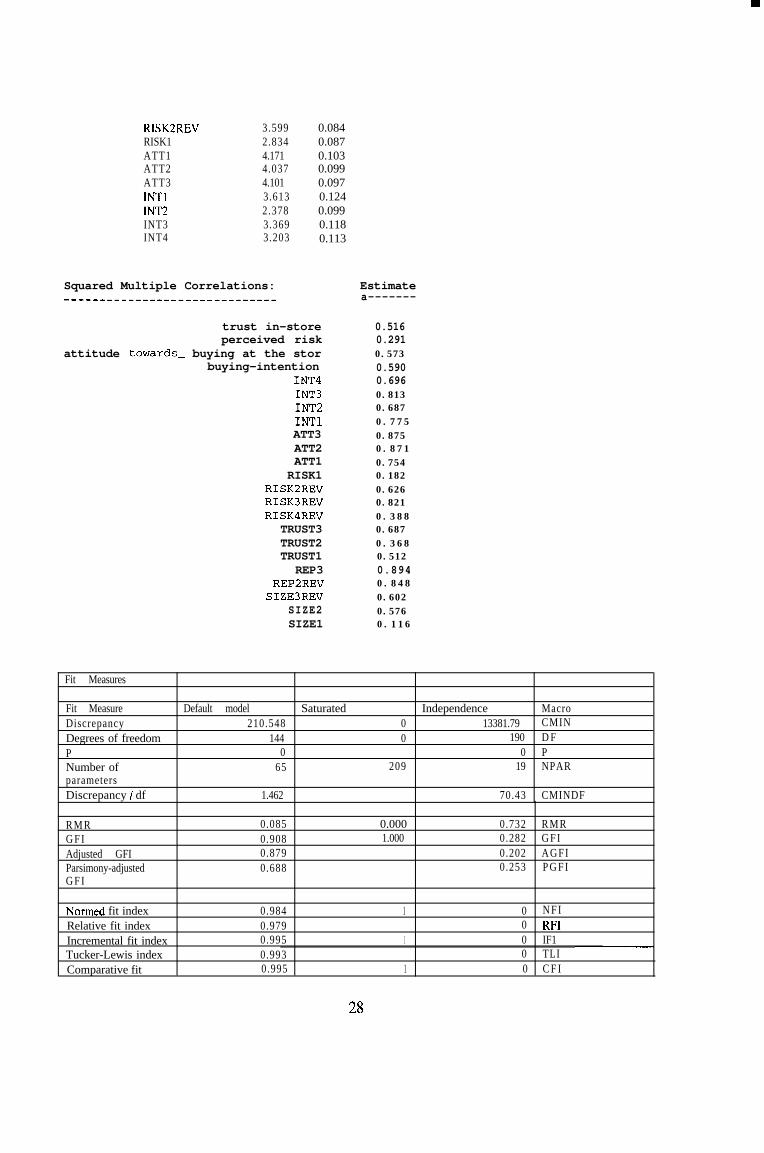
RISK2REV 3.599 0.084RISK1 2.834 0.087ATT1 4.171 0.103ATT2 4.037 0.099ATT3 4.101 0.097INTl 3.613 0.124INT2 2.378 0.099INT3 3.369 0.118INT4 3.203 0.113
Squared Multiple Correlations:--emmm------------------------
Estimatea-------
trust in-store 0.516perceived risk 0.291
attitude towards- buying at the stor 0.573buying-intention 0.590
INT4 0.696INT3 0.813INT2 0.687INTl 0.775ATT3 0.875ATT2 0.871ATT1 0.754RISK1 0.182
RISK2REV 0.626RISK3REV 0.821RISK4REV 0.388
TRUST3 0.687TRUST2 0.368TRUST1 0.512
REP3 0.894REP2REV 0.848
SIZE3REV 0.602SIZE2 0.576SIZE1 0.116
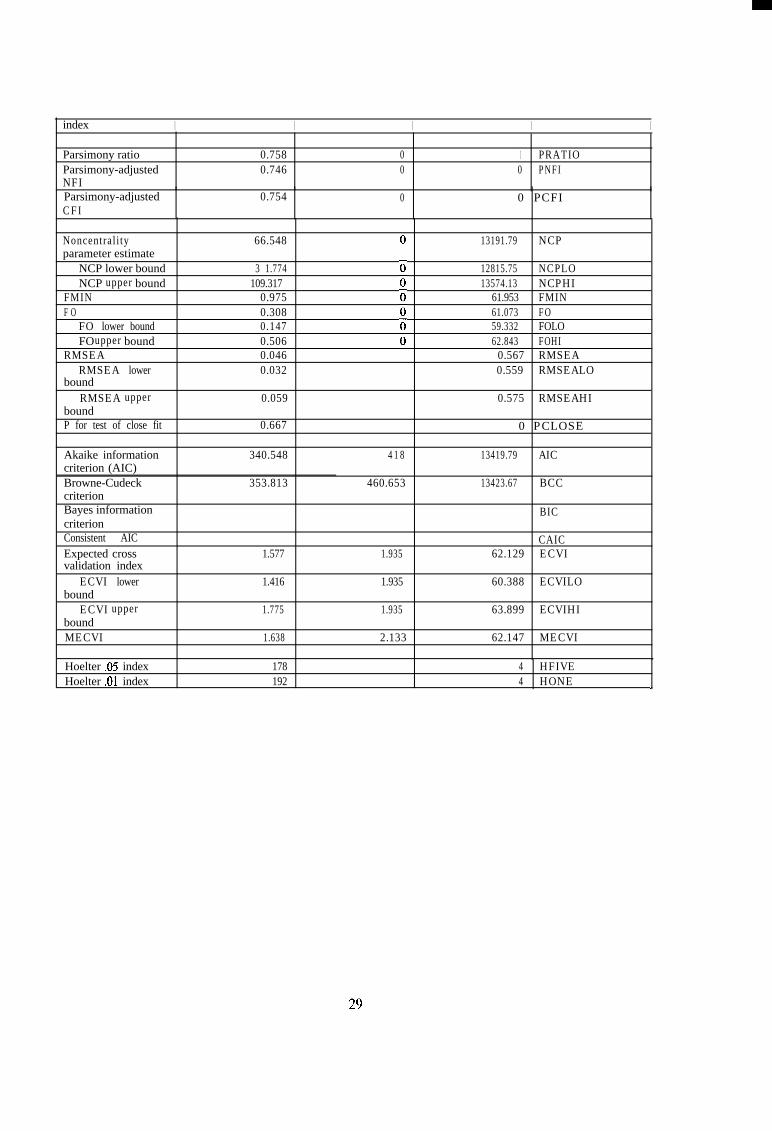
Fit Measures
Fit Measure Default model Saturated Independence MacroDiscrepancy 210.548 0 13381.79 CMINDegrees of freedom 144 0 190 D FP 0 0 PNumber of 65 209 19 NPARparametersDiscrepancy / df 1.462 70.43 CMINDF
R M RG F IAdjusted GFIParsimony-adjustedG F I
0.0850.9080.8790.688
0.0001.000
0.732 R M R0.282 G F I0.202 AGFI0.253 P G F I
Normed fit index 0.984 1 0 N F IRelative fit index 0.979 0 RF1Incremental fit index 0.995 1 0 IF1Tucker-Lewis index 0.993 0 TLIComparative fit 0.995 1 0 C F I
28
index I I I I I
Parsimony ratioParsimony-adjustedNFIParsimony-adjustedC F I
0.758 0 1 PRATIO0.746 0 0 PNFI
0.754 0 0 PCFI
Noncentral i typarameter estimate
NCP lower boundNCP boundupper
FMINF O
FO lower boundFO boundupper
RMSEARMSEA lower
boundRMSEA upper
boundP for test of close fit
66.548
3 1.774109.317
0.9750.3080.1470.5060.0460.032
0.059
0.667
13191.79 NCP
12815.75 NCPLO13574.13 NCPHI
61.953 FMIN61.073 FO59.332 FOLO62.843 FOHI
0.567 RMSEA0.559 RMSEALO
0.575 RMSEAHI
0 PCLOSE
Akaike informationcriterion (AIC)Browne-CudeckcriterionBayes informationcriterionConsistent AICExpected crossvalidation index
ECVI lowerbound
ECVI upperboundMECVI
340.548 4 1 8 13419.79 AIC
353.813 460.653 13423.67 BCC
BIC
CAIC1.577 1.935 62.129 ECVI
1.416 1.935 60.388 ECVILO
1.775 1.935 63.899 ECVIHI
1.638 2.133 62.147 MECVI
Hoelter .05 index 178 4 HFIVEHoelter .Ol index 192 4 HONE 4
29
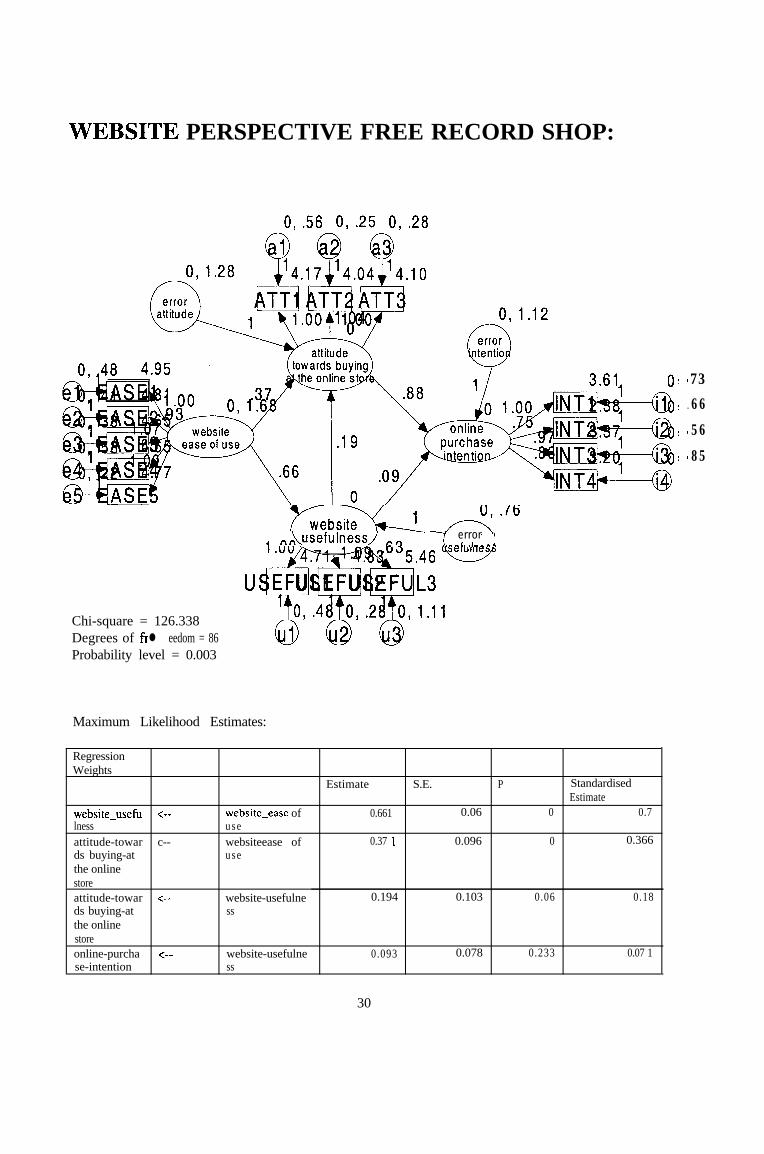
WEBSITE PERSPECTIVE FREE RECORD SHOP:
0,.56 0,.25 0,.28
4 ,,\usefuIness/ 7 error..- a t. .I,, A 1
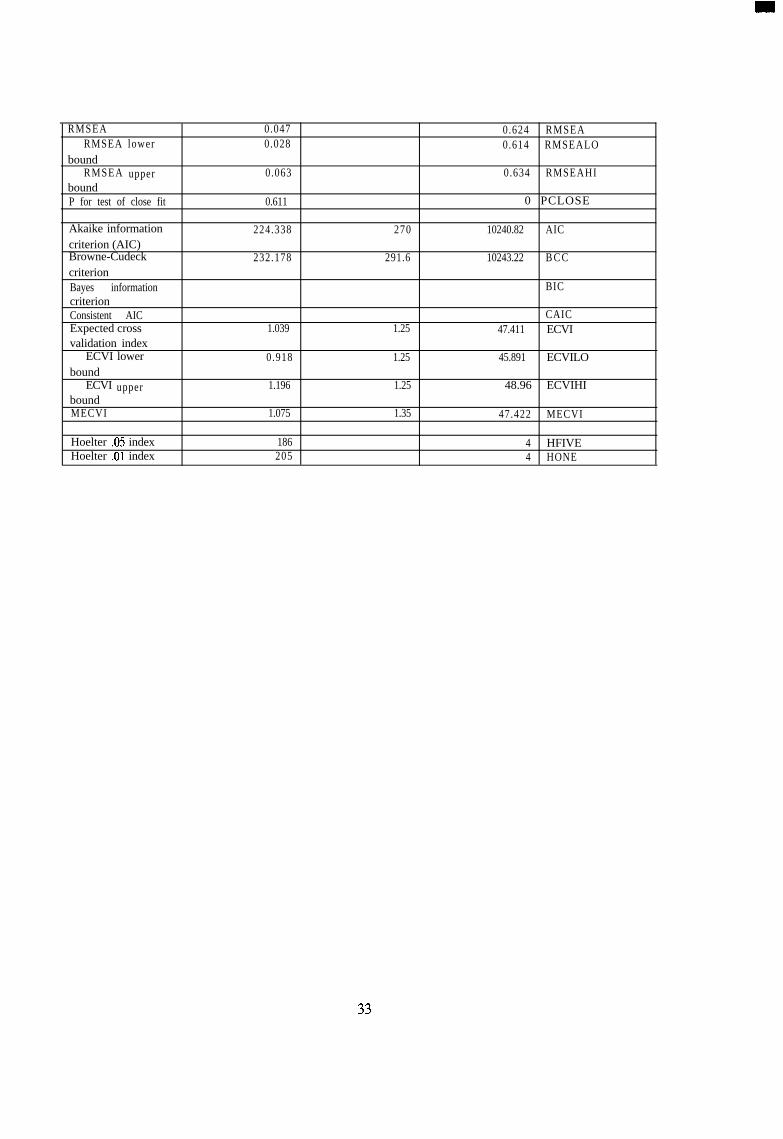
Chi-square = 126.338Degrees of fr l eedom = 86Probability level = 0.003
Maximum Likelihood Estimates:
RegressionWeights
Estimate S.E. P StandardisedEstimate
website-usefu <-- website-ease of 0.661 0.06 0 0.7lness useattitude-towar c-- websiteease of 0.37 1 0.096 0 0.366ds buying-at usethe onlinestoreattitude-towar <-- website-usefulne 0.194 0.103 0.06 0.18ds buying-at ssthe onlinestoreonline-purcha <-- website-usefulne 0.093 0.078 0.233 0.07 1se-intention ss
9 .73
1 l 66
9 ' 56
) ' 85
30
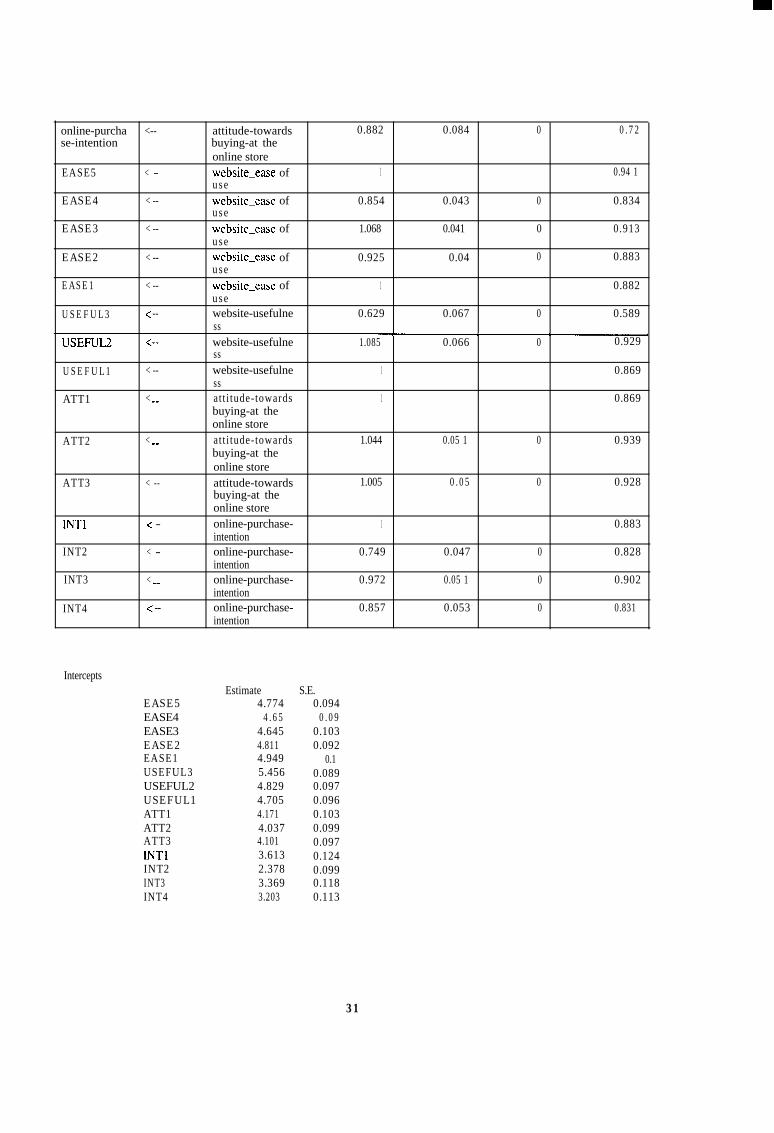
online-purcha <-- attitude-towards 0.882 0.084 0 0.72se-intention buying-at the
online storeEASE5 < -- website-ease of 1 0.94 1
useEASE4 < -- website-ease of 0.854 0.043 0 0.834
useEASE3 < -- website-ease of 1.068 0.041 0 0.913
useEASE2 < -- website-ease of 0.925 0.04 0 0.883
useEASE1 < -- website-ease of 1 0.882
useUSEFUL3 < -- website-usefulne 0.629 0.067 0 0.589
ssUSEFT <-- website-usefulne 1.085 0.066 0 0.929
ssUSEFUL1 < -- website-usefulne 1 0.869
ssATT1 < SW att i tude-towards 1 0.869
buying-at theonline store
ATT2 < em at t i tude-towards 1.044 0.05 1 0 0.939buying-at theonline store
ATT3 < -- attitude-towards 1.005 0.05 0 0.928buying-at theonline store
INTl < -- online-purchase- 1 0.883intention
INT2 < -- online-purchase- 0.749 0.047 0 0.828intention
INT3 < mm online-purchase- 0.972 0.05 1 0 0.902intention
INT4 < -- online-purchase- 0.857 0.053 0 0.831intention
Intercepts
EASE5EASE4EASE3EASE2EASE1USEFUL3USEFUL2USEFUL1ATT1ATT2ATT3INTlINT2INT3INT4
Estimate S.E.4.774 0.094
4.65 0.094.645 0.1034.811 0.0924.949 0.15.456 0.0894.829 0.0974.705 0.0964.171 0.1034.037 0.0994.101 0.0973.613 0.1242.378 0.0993.369 0.1183.203 0.113
3 1
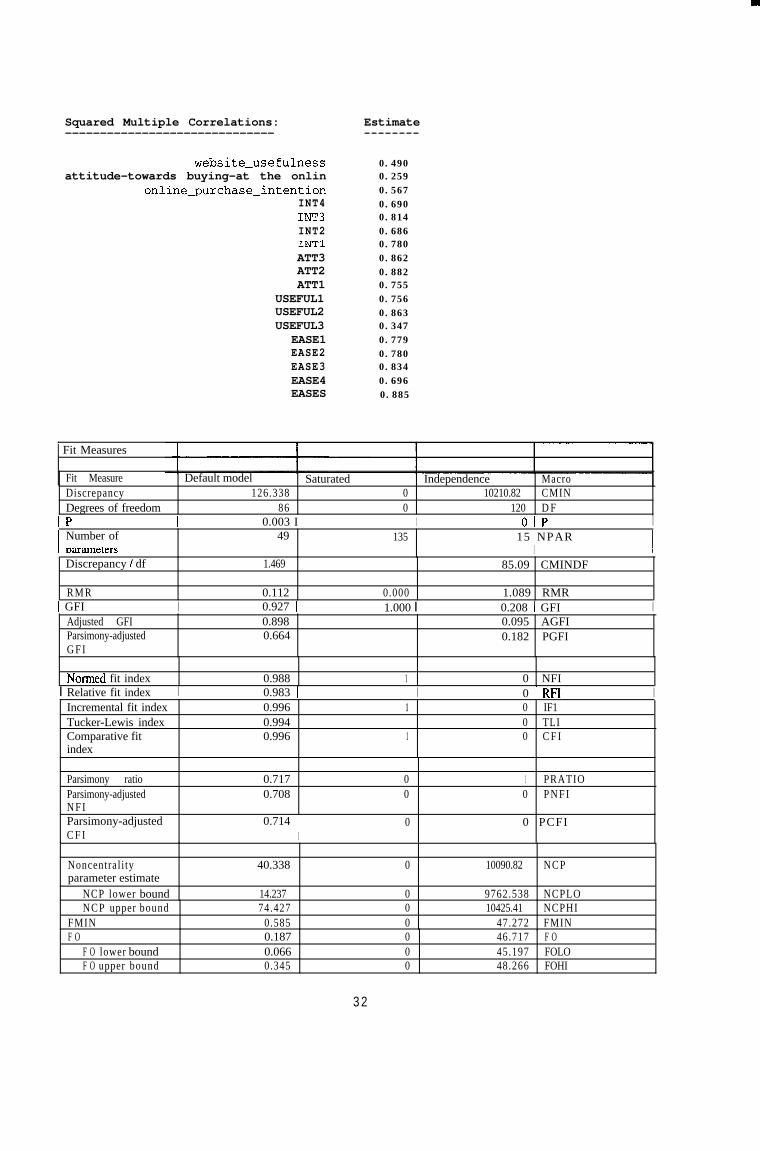
Squared Multiple Correlations: Estimate------------------------------ --------
website-usefulness 0.490attitude-towards buying-at the onlin 0.259
online_purchase-intention 0.567INT4 0.690INT3 0.814INT2 0.686INTl 0.780ATT3 0.862ATT2 0.882ATT1 0.755
USEFUL1 0.756USEFUL2 0.863USEFUL3 0.347
EASE1 0.779EASE2 0.780EASE3 0.834EASE4 0.696EASES 0.885
1 Fit Measures
Fit MeasureDiscrepancyDegrees of freedom
Default model Saturated Independence Macro126.338 0 10210.82 CMIN
86 0 120 D FIP 0.003 I I OIP I
I Number of 49 135 15 NPARDarameters I IDiscrepancy I df
R M R
1.469 85.09 CMINDF
0.112 0.000 1.089 RMR1 GFI I 0.927 1 1.000 I 0.208 1 GFI I
Adjusted GFIParsimony-adjustedG F I
0.898 0.095 AGFI0.664 0.182 PGFI
Normed fit index 0.988 1 0 NFII Relative fit index I 0.983 1 I 0 1 RF1 I
Incremental fit indexTucker-Lewis indexComparative fitindex
0.996 1 0 IF10.994 0 TLI0.996 1 0 C F I
Parsimony ratioParsimony-adjustedN F IParsimony-adjustedC F I
0.717 0 1 PRATIO0.708 0 0 P N F I
0.714I
0 0 PCFI
Noncentral i typarameter estimate
NCP lower bound
40.338 0 10090.82 NCP
14.237 0 9762.538 NCPLONCP upper bound 74.427 0 10425.41 NCPHI
FMIN 0.585 0 47.272 FMINF O 0.187 0 46.717 F O
F O lower bound 0.066 0 45.197 FOLOF O upper bound 0.345 0 48.266 FOHI
3 2
RMSEARMSEA lower
boundRMSEA upper
boundP for test of close fit
0.047 0.624 RMSEA0.028 0.614 RMSEALO
0.063 0.634 RMSEAHI
0.611 0 PCLOSE
Akaike informationcriterion (AIC)Browne-CudeckcriterionBayes informationcriterionConsistent AICExpected crossvalidation index
ECVI lowerbound
ECVI upperboundMECVI
224.338 270 10240.82 AIC
232.178 291.6 10243.22 B C C
BIC
CAIC1.039 1.25 47.411 ECVI
0.918 1.25 45.891 ECVILO
1.196 1.25 48.96 ECVIHI
1.075 1.35 47.422 MECVI
Hoelter .05 index 186 4 HFIVEHoelter .Ol index 205 4 HONE
33
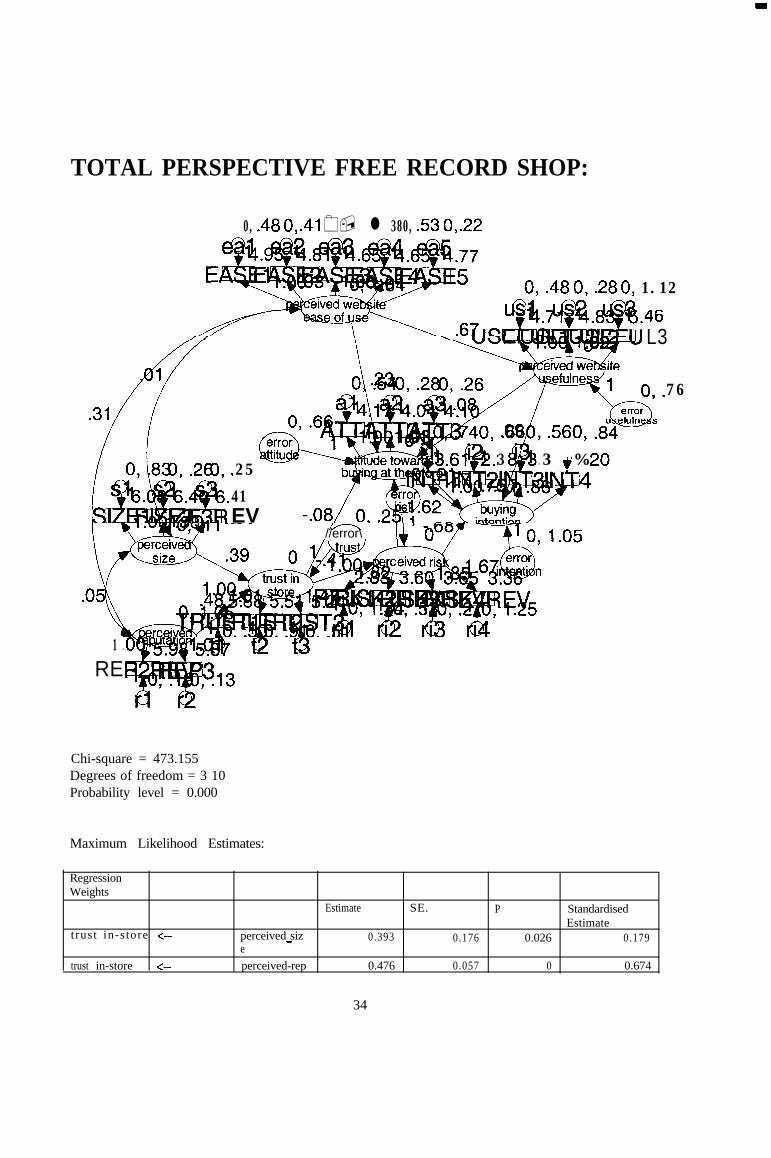
TOTAL PERSPECTIVE FREE RECORD SHOP:
0, .480, .41 0, l 380, 530, .22
0,.480, .280, 1.12__
.25
41EV
//error\
1 .RE
Chi-square = 473.155Degrees of freedom = 3 10Probability level = 0.000
Maximum Likelihood Estimates:
RegressionWeights
trust in-store <--
trust in-store <--
Estimate SE. P StandardisedEstimate
perceived siz- 0.393 0.176 0.026 0.179eperceived-rep 0.476 0.057 0 0.674
76
46
\
L3
,88 , 560,
3c.3 %f .
34
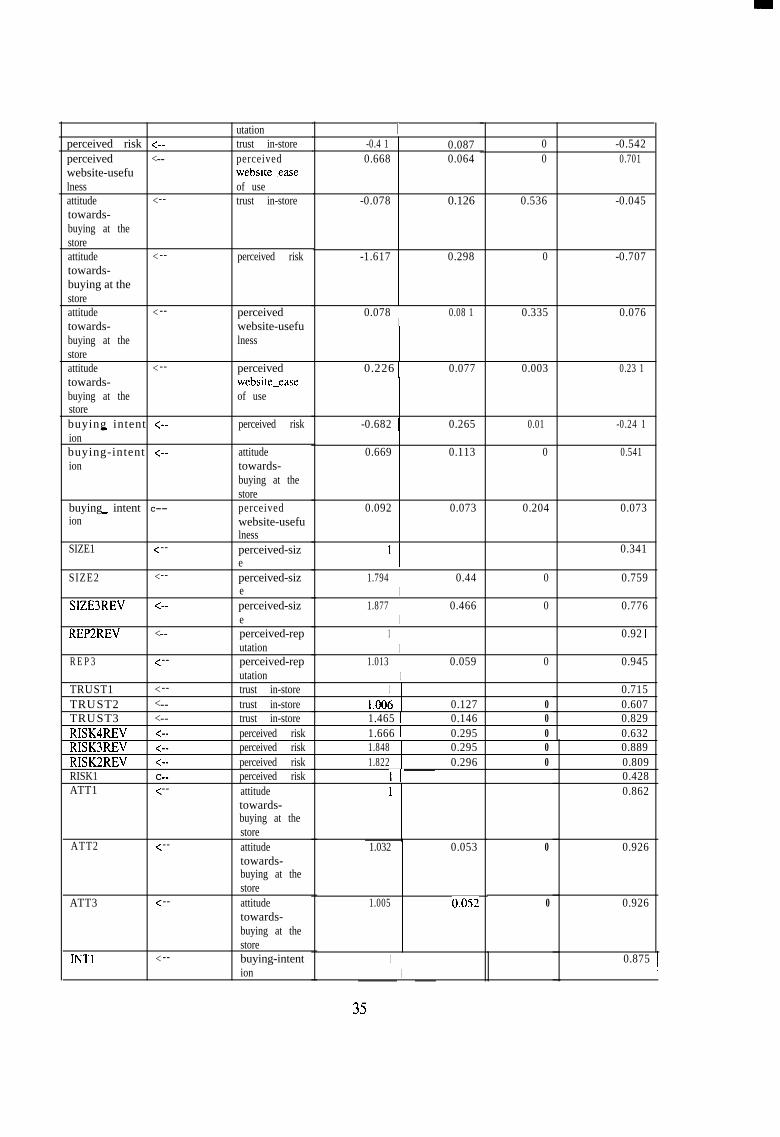
perceived risk <--perceived --<website-usefulnessattitude <--towards-buying at thestoreattitude < --towards-buying at thestoreattitude < --towards-buying at thestoreattitude < --towards-buying at thestorebuying intent c---ionbuying-intent c--ion
buying intent C---ion
SIZE1 < --
SIZE2 <--
SIZE3REV <--
REPIZREV --<
REP3 <--
TRUST1 <--TRUST2 --<TRUST3 --<RISK4REV <--RISK3REV <--RISK2REV <--RISK1 CweATT1 <--
ATT2 < --
ATT3 <--
INTl < --
utationtrust in-storeperceivedwebsite-easeof usetrust in-store
perceived risk
perceivedwebsite-usefulness
perceivedwebsite-easeof use
perceived risk
attitudetowards-buying at thestoreperceivedwebsite-usefulnessperceived-sizeperceived-sizeperceived-sizeperceived-reputationperceived-reputationtrust in-storetrust in-storetrust in-storeperceived riskperceived riskperceived riskperceived riskattitudetowards-buying at thestoreattitudetowards-buying at thestoreattitudetowards-buying at thestorebuying-intention
0 -0.542-0.4 1 0.0870.668 0.064 0 0.701
-0.078 0.126 0.536 -0.045
-1.617 0.298 0 -0.707
0.078I
0.08 1 0.335 0.076
0.226 1 0.077 0.003 0.23 1
-0.682 1 0.265 0.01 -0.24 1
0.669 0.113 0 0.541
0.092 0.073 0.204 0.073
0.3411I
0 0.7591.794I
0.44
0 0.7761.877I
0.466
0.92 11I
0 0.9451.013I
0.059
0.71511 .OO6 0.127 0.607
0.8290.6320.8890.809
00000
0
0
I
1.465 1 0.1461.666 I 0.2951.848 0.2951.822 0.296
1r 0.4280.8621
~ ~~0.053 0.9261.032
1.005 01052 0.926
1I
0.875I
35
INT2
INT3
INT4
EASE1
EASE2
EASE3
EASE4
EASE5
USEFUL1
USEFUL2
USEFUL3
<--
< --
< SW
< --
< --
< we
< --
C --
C --
C --
< --
buying intent-ionbuying-intentionbuying intent-ionperceivedwebsi te-easeof useperceivedwebsi te-easeof useperceivedwebsi te-easeof useperceivedwebsi te-easeof useperceivedwebsite-easeof useperceivedwebsi te-usefulnessperceivedwebsite-usefulnessperceivedwebsi te-usehlness
0.75 1 0.049 0 0.819
0.972 0.054 0 0.895
0.861 0.055 0 0.824
1 0.88
0.934 0.05 0 0.883
1.078 0.053 0 0.913
0.863 0.05 1 0 0.835
1.014 0.046 0 0.942
1 0.87
1.086 0.066 0 0.93
0.625 0.067 0 0.585
Intercepts
SIZE1SIZE2SIZE3REVREP2REVREP3TRUST1TRUST2TRUST3RISK4REVRISK3REVRISK2REVRISK1ATT1ATT2ATT3INTlINT2INT3INT4EASE1EASE2EASE3EASE4EASE5USEFUL1USEFUL2USEFUL3
Estimate SE.6.078 0.0666.40 1 0.0536.415 0.0545.977 0.0765.871 0.075
5.88 0.0695.512 0.0825.244 0.0873.364 0.098
3.65 0.0773.599 0.0842.834 0.0874.171 0.0994.037 0.0954.101 0.0933.613 0.1212.378 0.0973.369 0.1143.203 0.114.949 0.0994.811 0.0924.645 0.103
4.65 0.094.774 0.0944.705 0.0964.829 0.0975.456 0.089
36
Squared Multiple Correlations:------------------_-----------
Estimate--------
trust in-store 0.520perceived website-usefulness 0.491
perceived risk 0.294attitude towards- buying at the stor 0.582
buying-intention 0.564USEFUL3 0.343USEFUL2 0.865USEFUL1 0.756
EASE5 0.887EASE4 0.697EASE3 0.834EASE2 0.780EASE1 0.775INT4 0.680INT3 0.801INT2 0.671INTl 0.765ATT3 0.857ATT2 0.858ATT1 0.743RISK1 0.183
RISK2REV 0.654RISK3REV 0.790RISK4REV 0.400
TRUST3 0.687TRUST2 0.369TRUST1 0.511
REP3 0.893REP2REV 0.848
SIZE3REV 0.601SIZE2 0.576SIZE1 0.116
Fit Measures
Fit Measure Default model Saturated Independence MacroDiscrepancy 473.155 0 19639.14 CMINDegrees of freedom 310 0 378 DFP 0 0 PNumber of 95 405 27 NPARparametersDiscrepancy / df 1.526 5 1.955 CMINDF
R M RG F IAdjusted GFIParsimony-adjustedG F I
0.1970.8610.8300.706
0.0001.000
0.714 R M R0.225 G F I0.165 AGFI0.209 PGFI
Normed fit indexRelative fit indexIncremental fit indexTucker-Lewis indexComparative fitindex
0.976 1 0 N F I0.97 1 0 RF1.0.992 1 0 IF1
0.99 0 TLI0.992 1 0 CFI
Parsimony ratio 0.82 0 1 PRATIO
37
Parsimony-adjustedN F IParsimony-adjustedC F I
0.8 0 0 P N F I
0.813 0 0 P C F I
Noncentrali typarameter estimate
NCP lower boundNCP boundupper
FMINF O
FO lower boundFO boundupper
RMSEARMSEA lower
boundRMSEA upper
bound
163.155
108.421225.847
2.1910.7550.5021.0460.049
0.04
0.058
19261.14 NCP
18805.51 NCPLO19723.09 NCPHI
90.922 FMIN89.172 F O87.063 FOLO91.311 FOHI
0.486 RMSEA0.48 RMSEALO
0.49 1 RMSEAHI
I P for test of close fit I 0.538 1 I 0 I PCLOSE I
Akaike information 663.155 8 1 0 19693.14 AICcriterion (AIC)Browne-CudeckcriterionBayes informationcriterionConsistent AICExpected crossvalidation index
ECVI lower
69 1.453 930.638 19701.18 B C C
BIC
C A I C3.07 3 .75 91.172 ECVI
2.817 3.75 89.063 ECVILObound
ECVI upper 3.36 3 .75 93.311 ECVIHIboundMECVI 3.201 4.309 91.209 MECVI
Hoelter .05 index 161 5 HFIVEHoelter .Ol index 1 7 0 5 H O N E
38
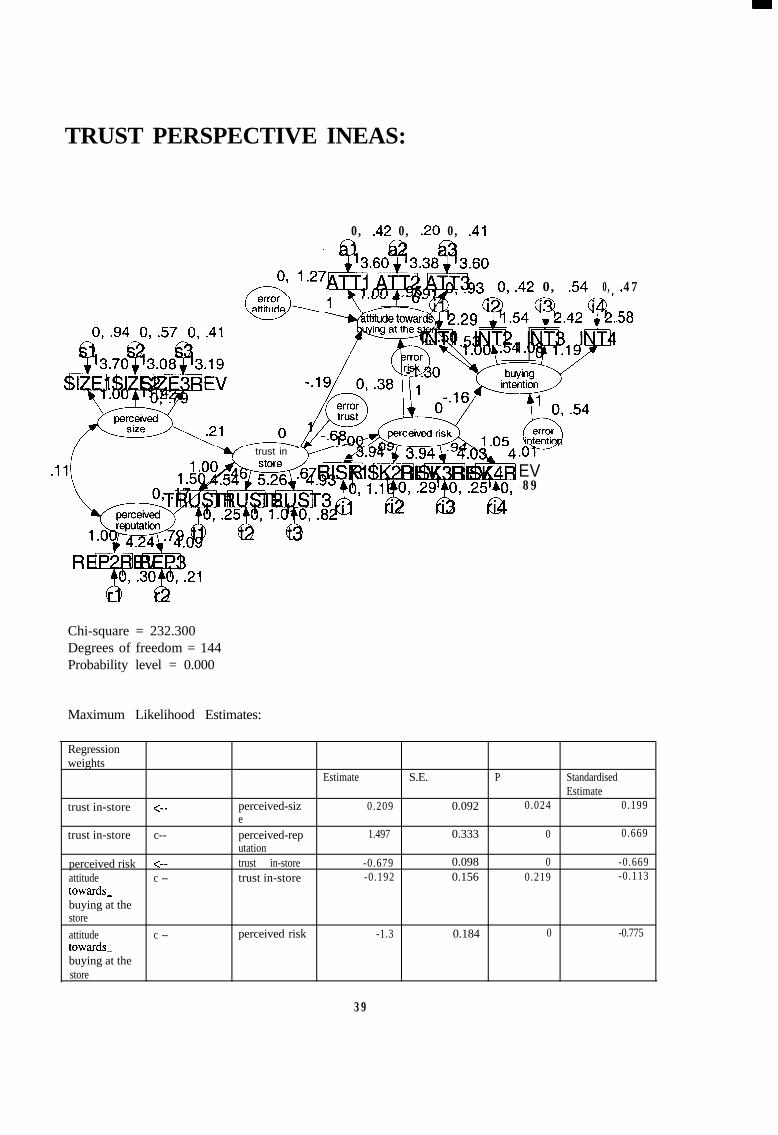
TRUST PERSPECTIVE INEAS:
0, .42 0, .20 0, .41
Oy 1-27&-;$;&: 0,.42 0, .54 0, .47
'589.54 -&k42 42.
trust in - 7 d.g@% .oYEV. 89
Chi-square = 232.300Degrees of freedom = 144Probability level = 0.000
Maximum Likelihood Estimates:
Regressionweights
Estimate S.E. P StandardisedEstimate
trust in-store <-- perceived-siz 0.209 0.092 0.024 0.199e
trust in-store c-- perceived-rep 1.497 0.333 0 0.669utation
perceived risk <-- trust in-store -0.679 0.098 0 -0.669attitude c -- trust in-store -0.192 0.156 0.219 -0.113towards-buying at thestoreattitude c -- perceived risk -1.3 0.184 0 -0.775towards-buying at thestore
39
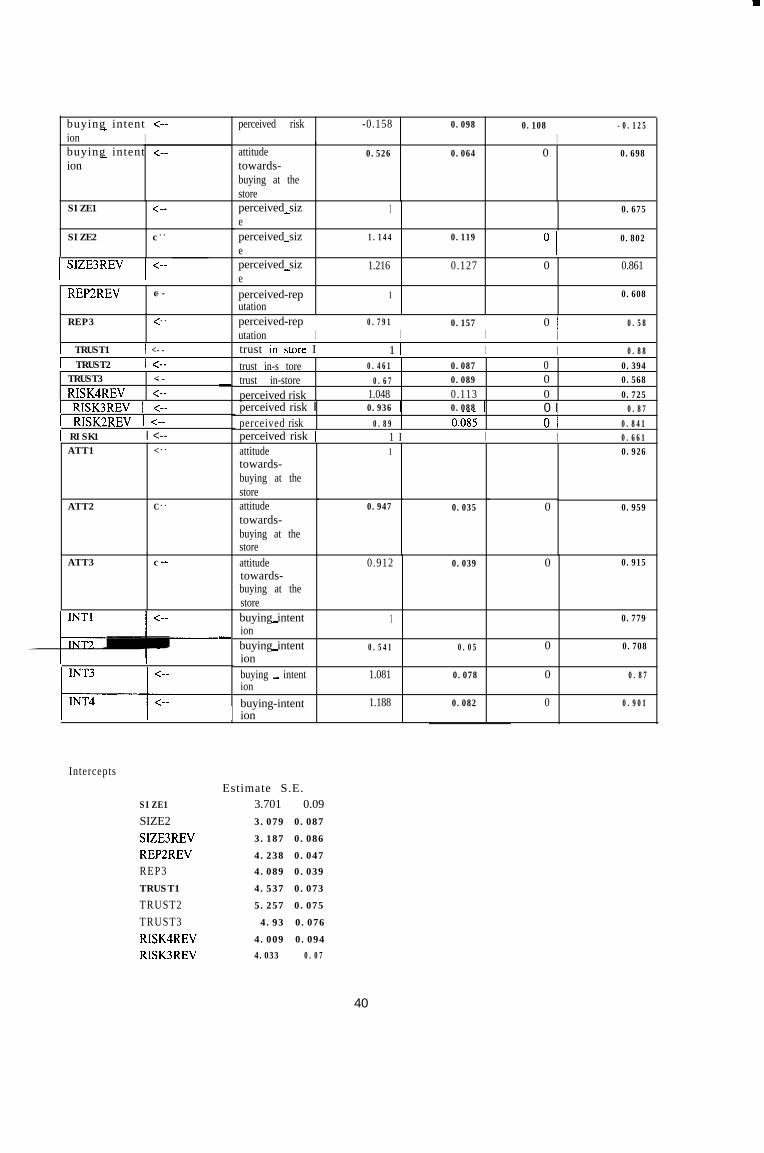
buying intent <---ion I
perceived risk -0.158 0.098 0.108 -I
-0.125
attitudetowards-buying at thestore
buying intent <---ion
0.526 0.064 0 0.698
SIZE1 <me perceived siz-e
1 0.675
SIZE2 c-- 0.802perceived siz-e
1.144 0.119
perceived siz- 1.216 0.127 0 0.861eperceived-rep 1 0.608utationperceived-reputation I
0.791I
0.157I
0I
0.58
REP2REV --c
REP3 <--
1 TRUST1 1 <-- trust instore I 1 I I I 0.881 TRUST2 1 <--TRUST3 --<RISK4REV <--
trust in-s tore 0.461 0.087 0 0.394trust in-store 0.67 0.089 0 0.568
perceived risk 1.048 0.113 0 0.7251 RISK3REV 1 <-- perceived risk I --- I
perceived risk 0.89 0.085 0 1 0.841
0.936 1 0.088 1 0 I 0.871 RISK2REV I-- ~-~I RISK1 I <-- perceived risk I 1 I I I 0.661
attitudetowards-buying at thestoreattitudetowards-buying at thestore
ATT1 <-- 0.9261
0.947ATT2 C - - 0.9590.035 0
ATT3 cmm attitude 0.912 0.039 0 0.915towards-buying at thestorebuying intent- 1 0.779ionbuying intent- 0.541 0.05 0 0.708ionbuying - intent 1.081 0.078 0 0.87ionbuying-intent 1.188 0.082 0 0.901ion
InterceptsEstimate S.E.
3.701 0.093.079 0.087
3.187 0.086
4.238 0.047
4.089 0.039
4.537 0.073
5.257 0.075
4.93 0.076
4.009 0.094
4.033 0.07
SIZE1
SIZE2SIZE3REVREP2REVREP3TRUST1
TRUST2TRUST3RISK4REV
RISK3REV
40
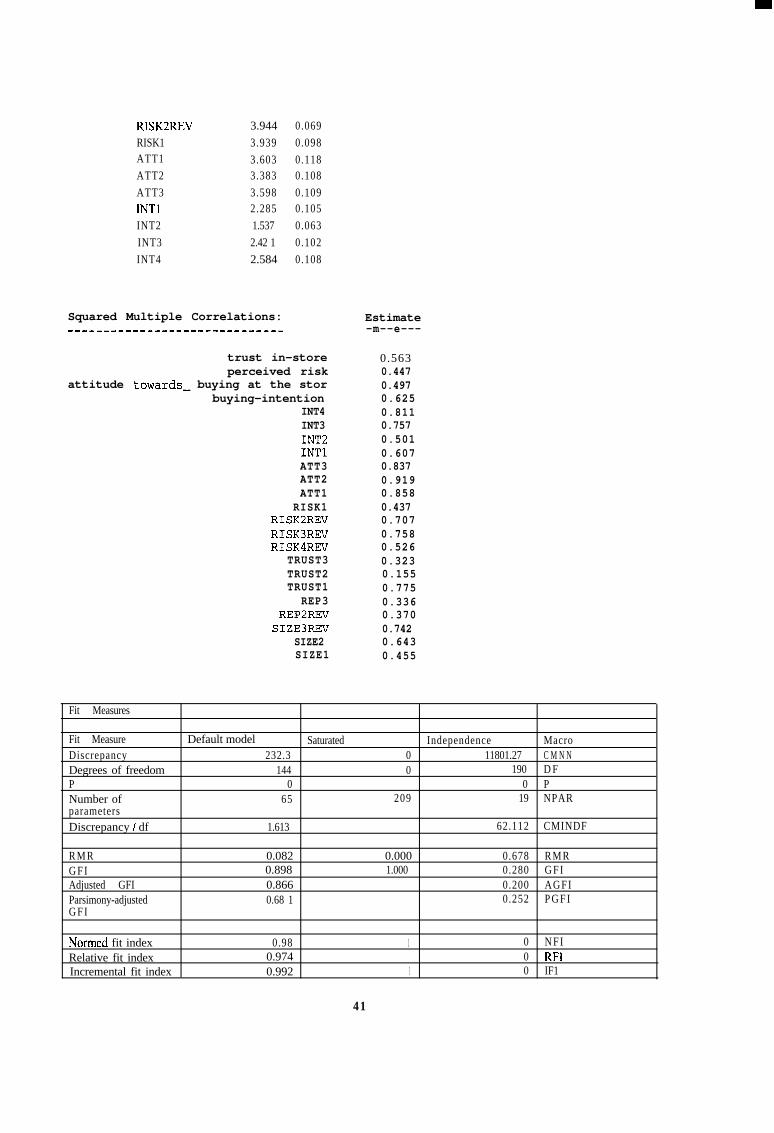
RISK2REV 3.944 0.069RISK1 3.939 0.098ATT1 3.603 0.118ATT2 3.383 0.108ATT3 3.598 0.109INTl 2.285 0.105INT2 1.537 0.063INT3 2.42 1 0.102INT4 2.584 0.108
Squared Multiple Correlations:a-----------------e-w---------
Estimate-m--e---
trust in-store 0.563perceived risk 0.447
attitude towards- buying at the stor 0.497buying-intention 0.625
INT4 0.811INT3 0.757INT2 0.501INTl 0.607ATT3 0.837ATT2 0.919ATT1 0.858
RISK1 0.437RISK2REV 0.707RISK3REV 0.758RISK4REV 0.526
TRUST3 0.323TRUST2 0.155TRUST1 0.775
REP3 0.336REP2REV 0.370
SIZE3REV 0.742SIZE2 0.643SIZE1 0.455
Fit Measures
Fit Measure Default model Saturated Independence MacroDiscrepancy 232.3 0 11801.27 C M N NDegrees of freedom 144 0 190 D FP 0 0 PNumber of 65 209 19 NPARparametersDiscrepancy / df 1.613 62.112 CMINDF
R M RG F IAdjusted GFIParsimony-adjustedG F I
0.0820.8980.8660.68 1
0.0001.000
0.678 R M R0.280 G F I0.200 AGFI0.252 P G F I
Normed fit index 0.98 1 0 N F IRelative fit index 0.974 0 RF1Incremental fit index 0.992 1 0 IF1
41
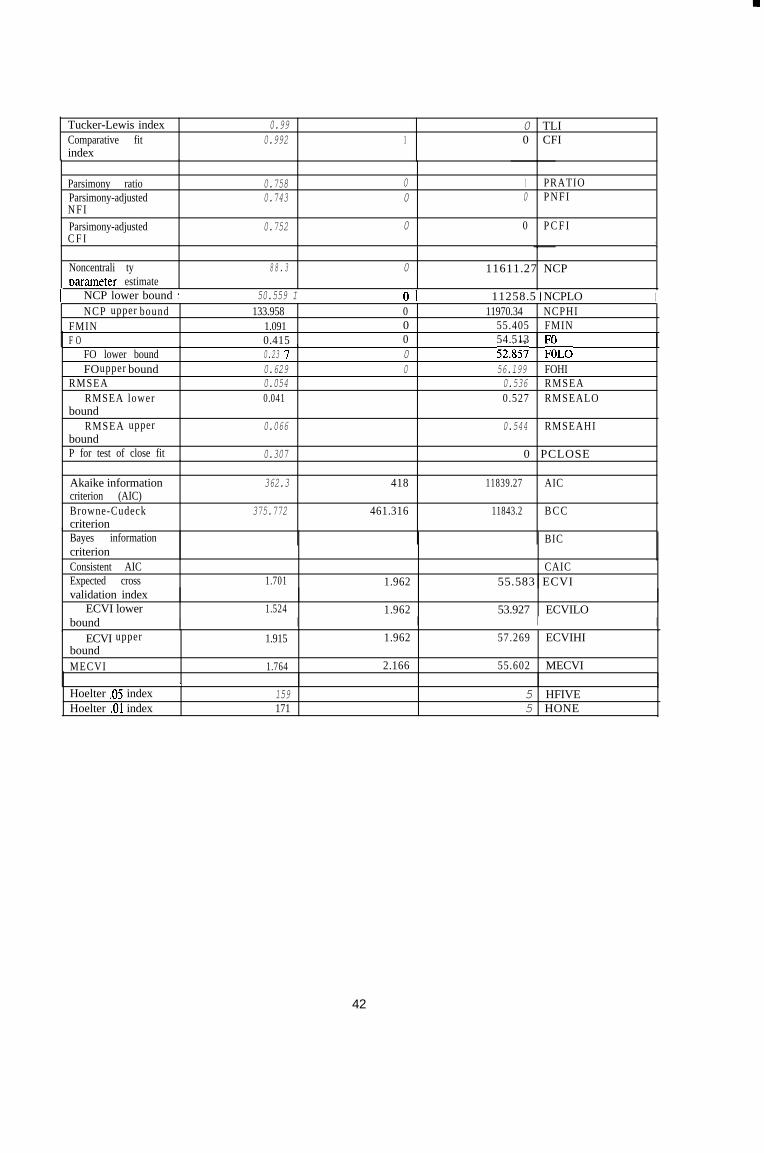
Tucker-Lewis indexComparative fitindex
0.99 0 TLI0.992 1 0 CFI
Parsimony ratioParsimony-adjustedN F IParsimony-adjustedC F I
0.758 00.743 0
0.752 0
1 PRATIO0 P N F I
0 P C F I.
Noncentrali tyDarameter estimate
88.3 0 11611.27 NCP
1 NCP lower bound 1 50.559 I 01 11258.5 1 NCPLO INCP upper bound 133.958 0 11970.34 NCPHI
FMIN 1.091 0 55.405 FMINF O 0.415 0 54.513 FO
FO lower boundFO boundupper
RMSEARMSEA lower
boundRMSEA upper
boundP for test of close fit
I - --0.23 7 0 52.857 &LO0.629 0 56.199 FOHI0.054 0.536 RMSEA0.041 0.527 RMSEALO
0.066 0.544 RMSEAHI
0.307 0 PCLOSE
Akaike informationcriterion (AIC)Browne-CudeckcriterionBayes informationcriterionConsistent AICExpected crossvalidation index
ECVI lower
362.3 418 11839.27 AIC
375.772 461.316 11843.2 B C C
BIC
CAIC1.701 1.962 55.583 ECVI
1.524 1.962 53.927 ECVILObound I I I I I
ECVI upper 1.915 1.962 57.269 ECVIHIboundMECVI 1.764 2.166 55.602 MECVI
Hoelter .05 indexHoelter .Ol index
I
159 5 HFIVE171 5 HONE
42
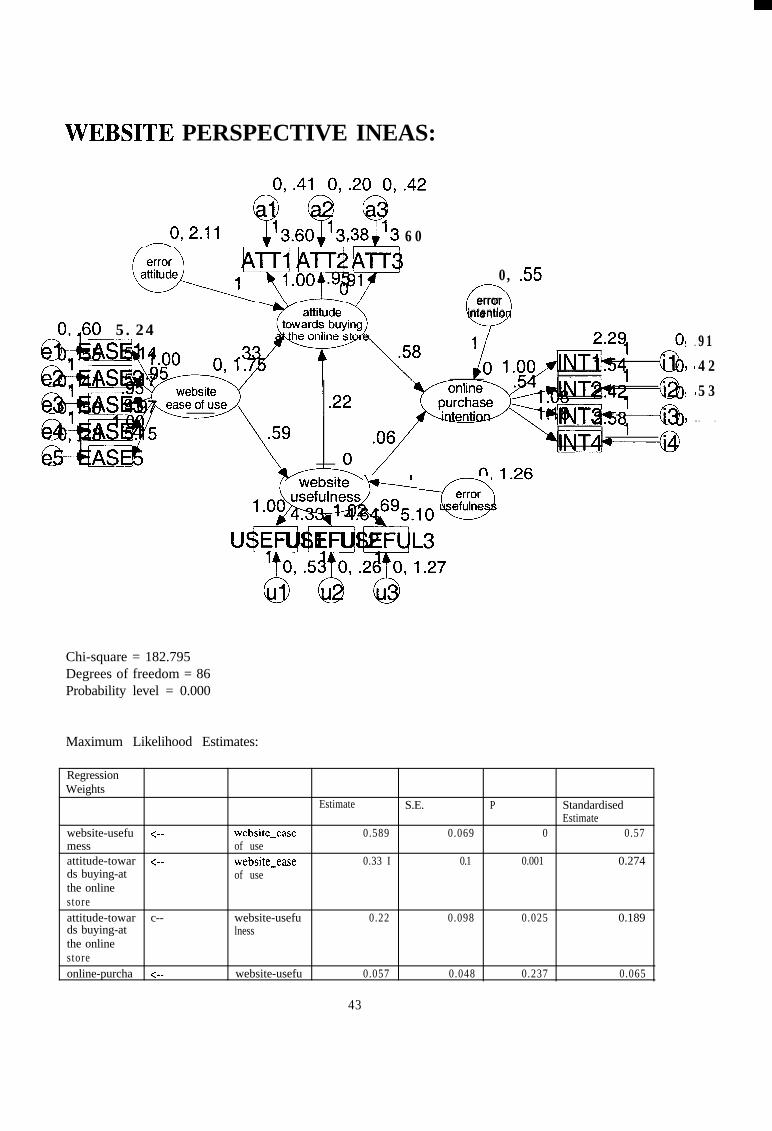
WEBSITE PERSPECTIVE INEAS:
0,460 5.24
.38 '3.2fL 60
0, .55
nerror
‘n ten t io
f website c n
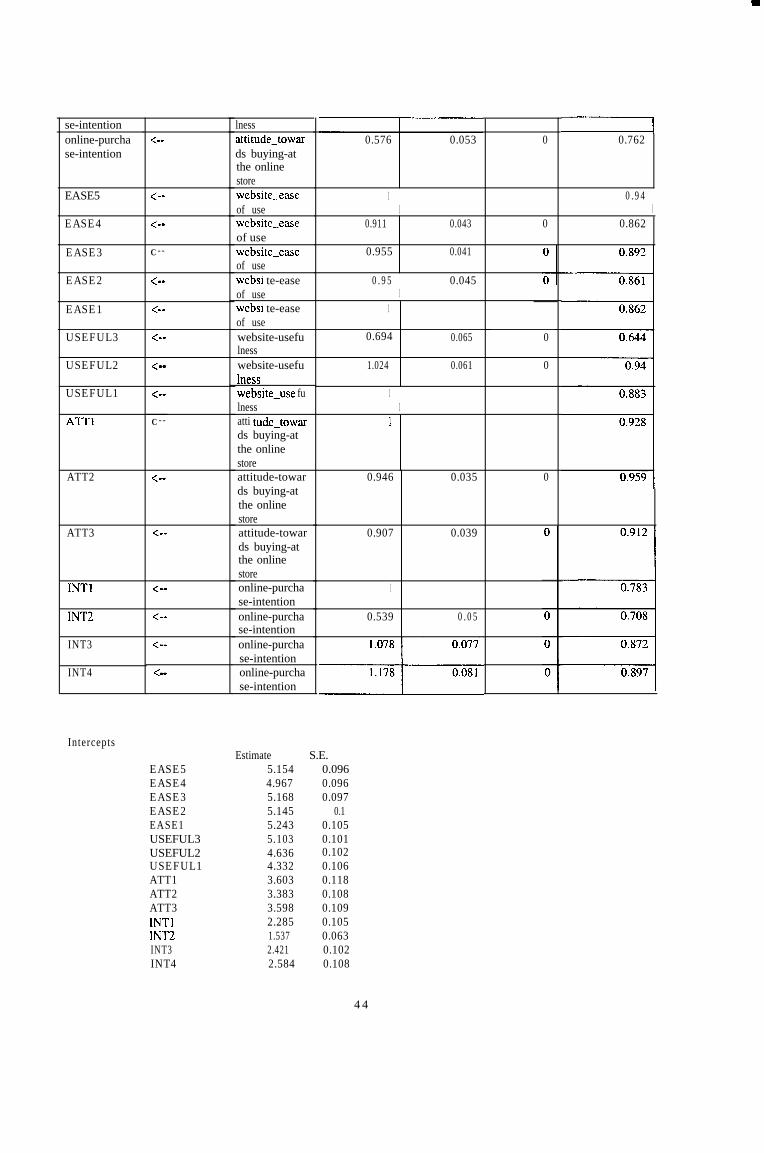
Chi-square = 182.795Degrees of freedom = 86Probability level = 0.000
Maximum Likelihood Estimates:
RegressionWeights
Estimate S.E. P StandardisedEstimate
website-usefu c-- website-ease 0.589 0.069 0 0.57mess of useattitude-towar <-- websi te-ease 0.33 I 0.1 0.001 0.274ds buying-at of usethe onlinestoreattitude-towar c-- website-usefu 0.22 0.098 0.025 0.189ds buying-at lnessthe onlinestoreonline-purcha <-- website-usefu 0.057 0.048 0.237 0.065
9 l 91
F ' 42
9 ' 5 3
9 l 4 9
43
se-intention lnessattitude-towards buying-atthe onlinestorewebsite-easeof usewebsite-easeof usewebsite-easeof usewebsi te-easeof usewebsi te-easeof usewebsite-usefulnesswebsite-usefumesswebsi te-use fulnessatti tude-towards buying-atthe onlinestoreattitude-towards buying-atthe onlinestoreattitude-towards buying-atthe onlinestoreonline-purchase-intentiononline-purchase-intentiononline-purchase-intentiononline-purchase-intention
online-purchase-intention
<-- 0.576 0.053 0 0.762
EASE5 < -- 1I
0.94I
EASE4 < -- 0.911 0.043 0 0.862
EASE3 C -- 0.955 0.041
EASE2 < -- 0.95I
0.045
EASE1 <se 1
USEFUL3 < -- 0.694 0.065 0
USEFUL2 < -- 1.024 0.061 0
USEFUL1 <
S W 1I
l IC --
ATT2 <-a 0.946 0.035 0
ATT3 < -- 0.907 0.039
INTI < -- 1
INT2 <
B e 0.539 0.05
INT3
INT4
< --
<--
InterceptsEstimate S.E.
5.154 0.0964.967 0.0965.168 0.0975.145 0.15.243 0.1055.103 0.1014.636 0.1024.332 0.1063.603 0.1183.383 0.1083.598 0.1092.285 0.1051.537 0.0632.421 0.1022.584 0.108
44
EASE5EASE4EASE3EASE2EASE1USEFUL3USEFUL2USEFUL1ATT1ATT2ATT3INTlINT2INT3INT4
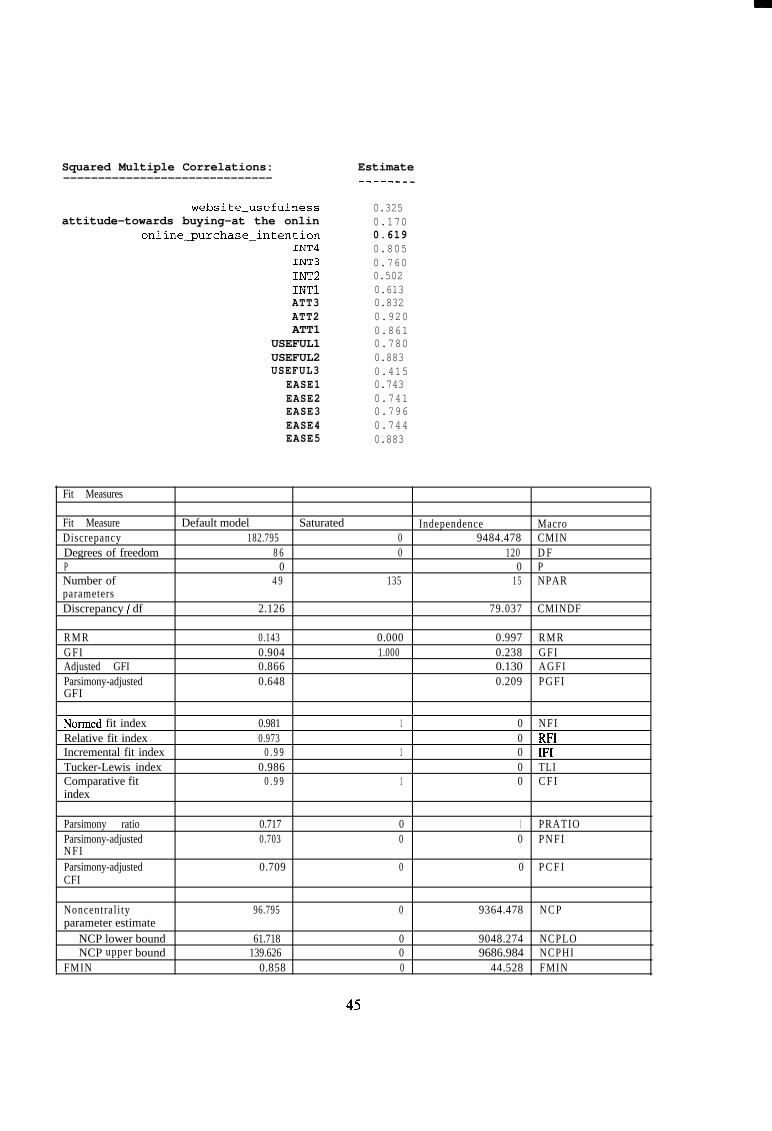
Squared Multiple Correlations:------------------------------
Estimate
website-usefulness 0.325attitude-towards buying-at the onlin 0.170
online_purchase-intention 0.619INT4 0.805INT3 0.760INT2 0.502INTl 0.613ATT3 0.832ATT2 0.920ATT1 0.861
USEFUL1 0.780USEFUL2 0.883USEFUL3 0.415
EASE1 0.743EASE2 0.741EASE3 0.796EASE4 0.744EASE5 0.883
Fit Measures
Fit Measure Default model Saturated Independence MacroDiscrepancy 182.795 0 9484.478 CMINDegrees of freedom 8 6 0 120 D FP 0 0 PNumber of 4 9 135 1 5 NPARparametersDiscrepancy / df 2.126 79.037 CMINDF
R M RG F IAdjusted GFIParsimony-adjustedGFI
0.1430.9040.8660.648
0.0001.000
0.997 R M R0.238 G F I0.130 AGFI0.209 P G F I
Normed fit indexRelative fit indexIncremental fit indexTucker-Lewis indexComparative fitindex
0.981 1 0 N F I0.973 0 RF1
0.99 1 0 IF10.986 0 TLI
0.99 1 0 C F I
Parsimony ratioParsimony-adjustedN F IParsimony-adjustedCFI
0.717 0 1 PRATIO0.703 0 0 P N F I
0.709 0 0 P C F I
Noncentral i typarameter estimate
NCP lower boundNCP boundupper
FMIN
96.795 0 9364.478 NCP
61.718 0 9048.274 NCPLO139.626 0 9686.984 NCPHI
0.858 0 44.528 FMIN
45
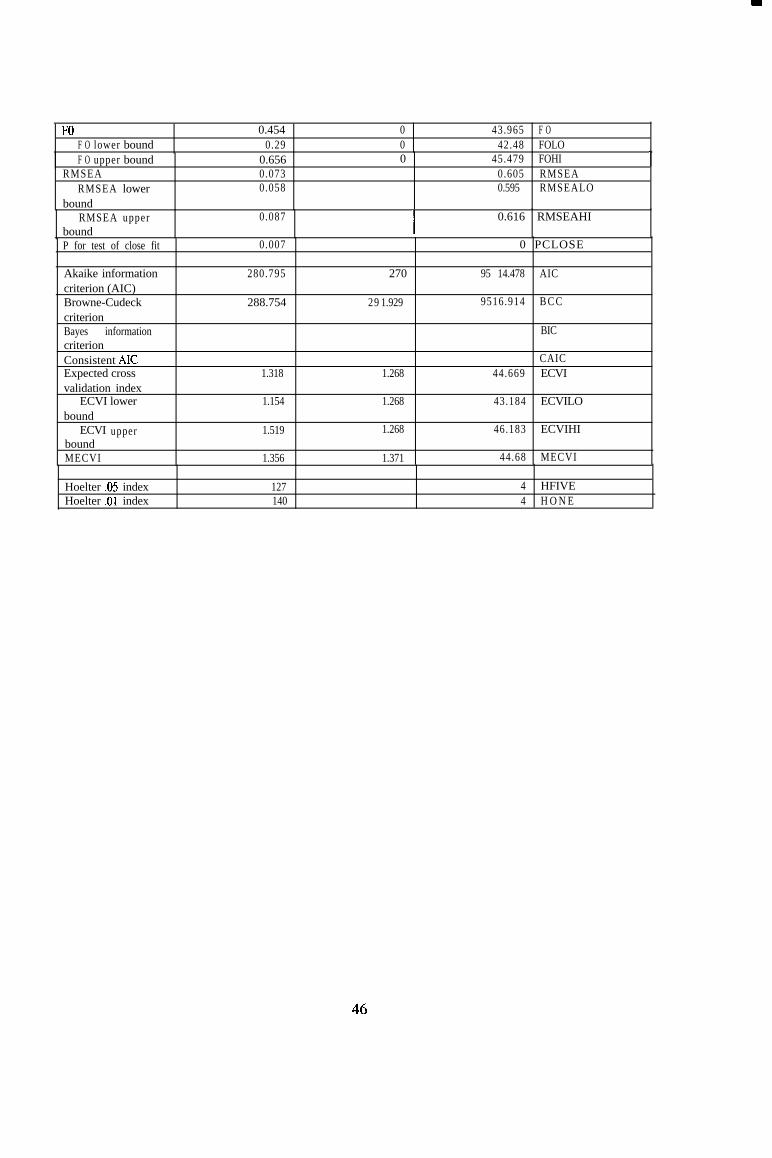
FO 0.454 0 43.965 F OF O lower bound 0.29 0 42.48 FOLO 4F O upper bound
RMSEARMSEA lower
bound
0.656 0 45.479 FOHI0.073 0.605 RMSEA0.058 0.595 RMSEALO
RMSEA upperboundP for test of close fit
0.087
0.007
0.616 RMSEAHI
0 PCLOSE
Akaike informationcriterion (AIC)Browne-CudeckcriterionBayes informationcriterionConsistent AKExpected crossvalidation index
ECVI lowerbound
ECVI upperboundMECVI
280.795 270 95 14.478 AIC
288.754 29 1.929 9516.914 B C C
BIC
CAIC1.318 1.268 44.669 ECVI
1.154 1.268 43.184 ECVILO
1.519 1.268 46.183 ECVIHI
1.356 1.371 44.68 MECVI
Hoelter .05 index 127 4 HFIVEHoelter -01 index 140 4 H O N E
46
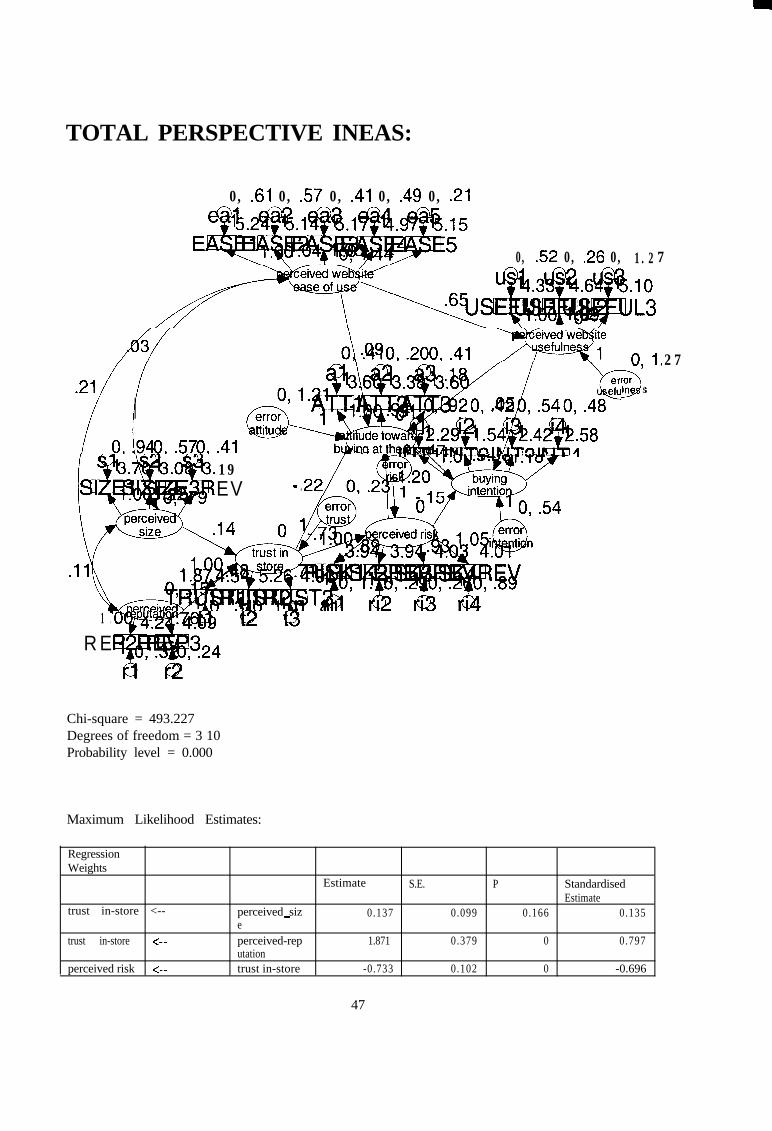
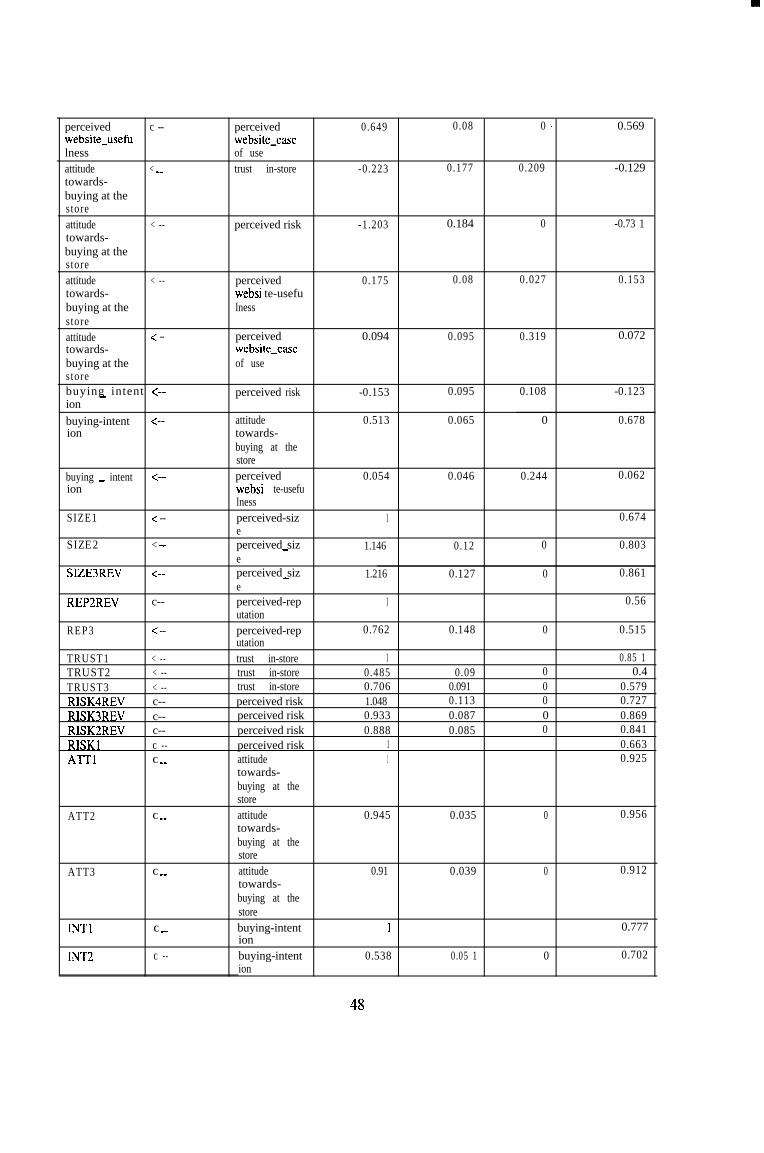
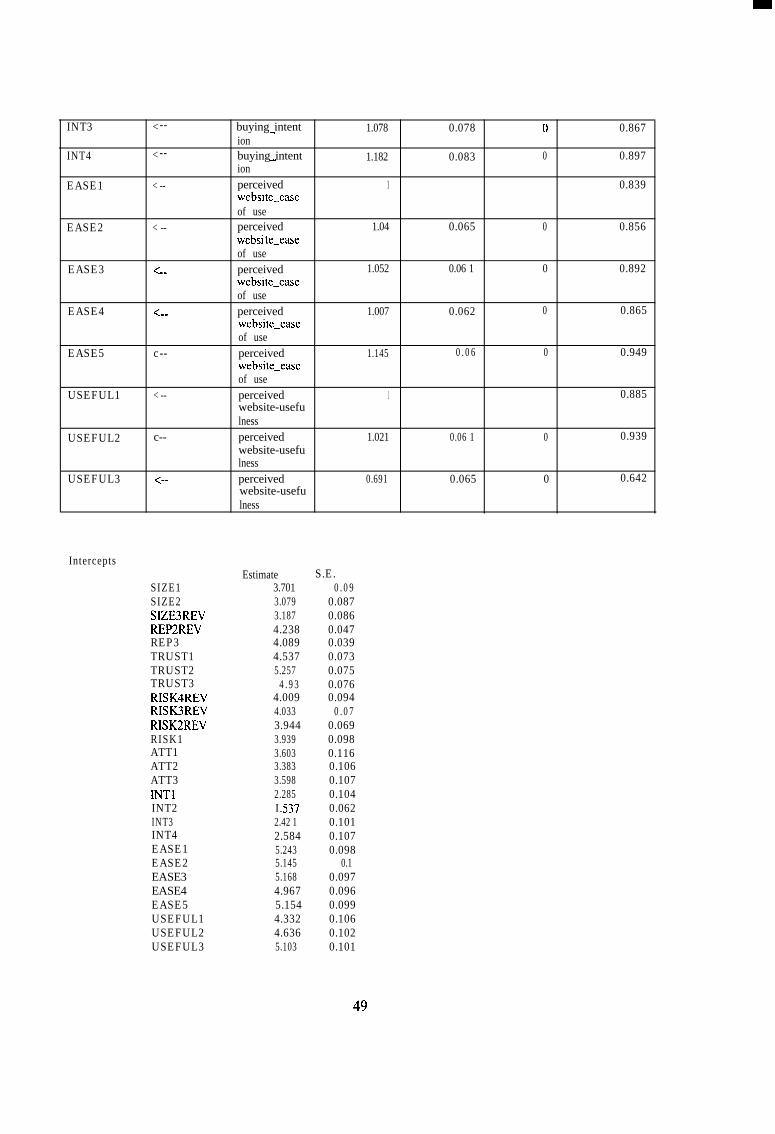
TOTAL PERSPECTIVE INEAS:
0, .61 0, .57 0, .41 0, .49 0, .21
0, .52 0, .26 0, 1.2 7
wived weB$ite
19EV I .
1 .
R E
Chi-square = 493.227Degrees of freedom = 3 10Probability level = 0.000
Maximum Likelihood Estimates:
“9TOT3he s
RegressionWeights
trust in-store <--
trust in-store c--
perceived risk c--
Estimate S.E. P StandardisedEstimate
perceived siz- 0.137 0.099 0.166 0.135eperceived-rep 1.871 0.379 0 0.797utationtrust in-store -0.733 0.102 0 -0.696
. 27
47
perceived c --website-usefulnessattitude < SWtowards-buying at thestoreattitude < --towards-buying at thestoreattitude < --towards-buying at thestoreattitude < --towards-buying at thestorebuying intent <---ionbuying-intent <--ion
buying - intent G-ion
SIZE1 < --
SIZE2 < Be
SIZE3REV <--
REP2REV c--
REP3 < --
TRUST1 < --TRUST2 < --TRUST3 < --RISK4REV c--RISK3REV c--RISK2REV c--RISK1 C --ATT1 C me
ATT2 C mm
ATT3 C Be
INTl C SW
INT2 C --
perceivedwebsite-easeof usetrust in-store
perceived risk
perceivedwebsi te-usefulness
perceivedwebsite-easeof use
perceived risk
attitudetowards-buying at thestoreperceivedwebsi te-usefulnessperceived-sizeperceived siz-eperceived siz-eperceived-reputationperceived-reputationtrust in-storetrust in-storetrust in-storeperceived riskperceived riskperceived riskperceived riskattitudetowards-buying at thestoreattitudetowards-buying at thestoreattitudetowards-buying at thestorebuying-intentionbuying-intention
0.649 0.08 0 -. 0.569
-0.223 0.177 0.209 -0.129
-1.203 0.184 0 -0.73 1
0.175 0.08 0.027 0.153
0.094 0.095 0.319 0.072
-0.153 0.095 0.108 -0.123
0.513 0.065 0 0.678
0.054 0.046 0.244 0.062
1 0.674
1.146 0.12 0 0.803
1.216 0.127 0 0.861
1 0.56
0.762 0.148 0 0.515
1 0.85 10.485 0.09 0 0.40.706 0.091 0 0.5791.048 0.113 0 0.7270.933 0.087 0 0.8690.888 0.085 0 0.841
1 0.6631 0.925
0.945 0.035 0 0.956
0.91 0.039 0 0.912
1 0.777
0.538 0.05 1 0 0.702
48
INT3
INT4
EASE1
EASE2
EASE3
EASE4
EASE5
USEFUL1
USEFUL2
USEFUL3
<--
< --
< --
< --
< V W
< es
c --
< --
c--
c--
buying intent-ionbuying intent-ionperceivedwebsite-easeof useperceivedwebsi te-easeof useperceivedwebsite-easeof useperceivedwebsite-easeof useperceivedwebsite-easeof useperceivedwebsite-usefulnessperceivedwebsite-usefulnessperceivedwebsite-usefulness
1.078 0.078 O- 0.867
1.182 0.083 0 0.897
1 0.839
1.04 0.065 0 0.856
1.052 0.06 1 0 0.892
1.007 0.062 0 0.865
1.145 0.06 0 0.949
1 0.885
1.021 0.06 1 0 0.939
0.691 0.065 0 0.642
Intercepts
SIZE1SIZE2SIZE3REVREP2REVREP3TRUST1TRUST2TRUST3RISK4REVRISK3REVRISK2REVRISK1ATT1ATT2ATT3INTlINT2INT3INT4EASE1EASE2EASE3EASE4EASE5USEFUL1USEFUL2USEFUL3
Estimate S.E.3.701 0.093.079 0.0873.187 0.0864.238 0.0474.089 0.0394.537 0.0735.257 0.075
4.93 0.0764.009 0.0944.033 0.073.944 0.0693.939 0.0983.603 0.1163.383 0.1063.598 0.1072.285 0.104I .537 0.0622.42 1 0.1012.584 0.1075.243 0.0985.145 0.15.168 0.0974.967 0.0965.154 0.0994.332 0.1064.636 0.1025.103 0.101
49
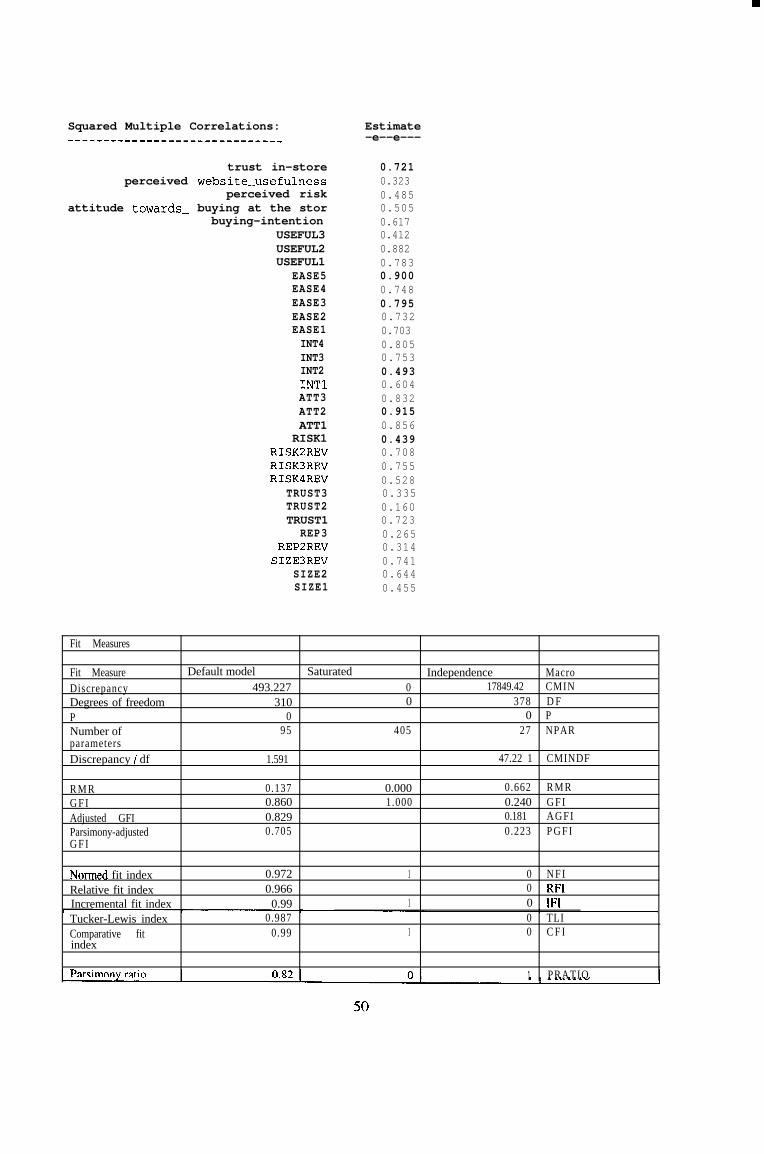
Squared Multiple Correlations:---------------a--------------
Estimate-e--e---
trust in-store 0.721perceived website-usefulness 0.323
perceived risk 0.485attitude towards- buying at the stor 0.505
buying-intention 0.617USEFUL3 0.412USEFUL2 0.882USEFUL1 0.783
EASE5 0.900EASE4 0.748EASE3 0.795EASE2 0.732EASE1 0.703INT4 0.805INT3 0.753INT2 0.493INTl 0.604ATT3 0.832ATT2 0.915ATT1 0.856RISK1 0.439
RISK2REV 0.708RISK3REV 0.755RISK4REV 0.528
TRUST3 0.335TRUST2 0.160TRUST1 0.723
REP3 0.265REP2REV 0.314
SIZE3REV 0.741SIZE2 0.644SIZE1 0.455
Fit Measures
Fit Measure Default model Saturated Independence MacroDiscrepancy 493.227 0 17849.42 CMINDegrees of freedom 310 0 378 D FP 0 0 PNumber of 95 405 27 NPARparametersDiscrepancy / df 1.591 47.22 1 CMINDF
R M RG F IAdjusted GFIParsimony-adjustedG F I
0.1370.8600.8290.705
0.0001.000
0.662 R M R0.240 G F I0.181 AGFI0.223 P G F I
Normed fit indexRelative fit indexIncremental fit indexTucker-Lewis indexComparative fitindex
0.972 1 0 N F I0.966 0 RF10.99 1 0 IF1
0.987 0 TLI0.99 1 0 C F I
1 PRATIO

Parsimony-adjustedN F IParsimony-adjustedC F I
0.797 0 0 PNFI
0.812 0 0 PCFI
Noncentrality
FMIN
parameter estimate
F O
NCP lower bound
F O lower
NCP upper
bound
bound
183.227
2.316
0
0
17471.42
83.8
NCP
126.654
FMIN
0
0.86
17037.41
0
NCPLO247.725
82.025
0
F O
17911.75 NCPHI
0.595 0 79.988 FOLOF O upper bound
RMSEARMSEA lower
bound
1.163 0 84.093 FOHI0.053 0.466 RMSEA0.044 0.46 RMSEALO
RMSEA upper 0.06 1 0.472 RMSEAHIbound
L P for test of close fit 1 0.3 1 I 0 1 PCLOSE I
Akaike informationcriterion (AIC)Browne-Cudeckcriterion
683.227 810 17903.42 AIC
711.983 932.595 17911.59 BCC
IBayes informationcriterion I I I I
BICI
1 Consistent AICI I I II I I f CAIC I
Expected crossvalidation index
ECVI lowerbound
ECVI upperbound
3.208 3.803 84.054 ECVI
2.942 3.803 82.016 ECVILO
3.51 3.803 86.121 ECVIHI
Hoelter .05 index 153 6 HFIVEHoelter .Ol index 161 6 HONE
51
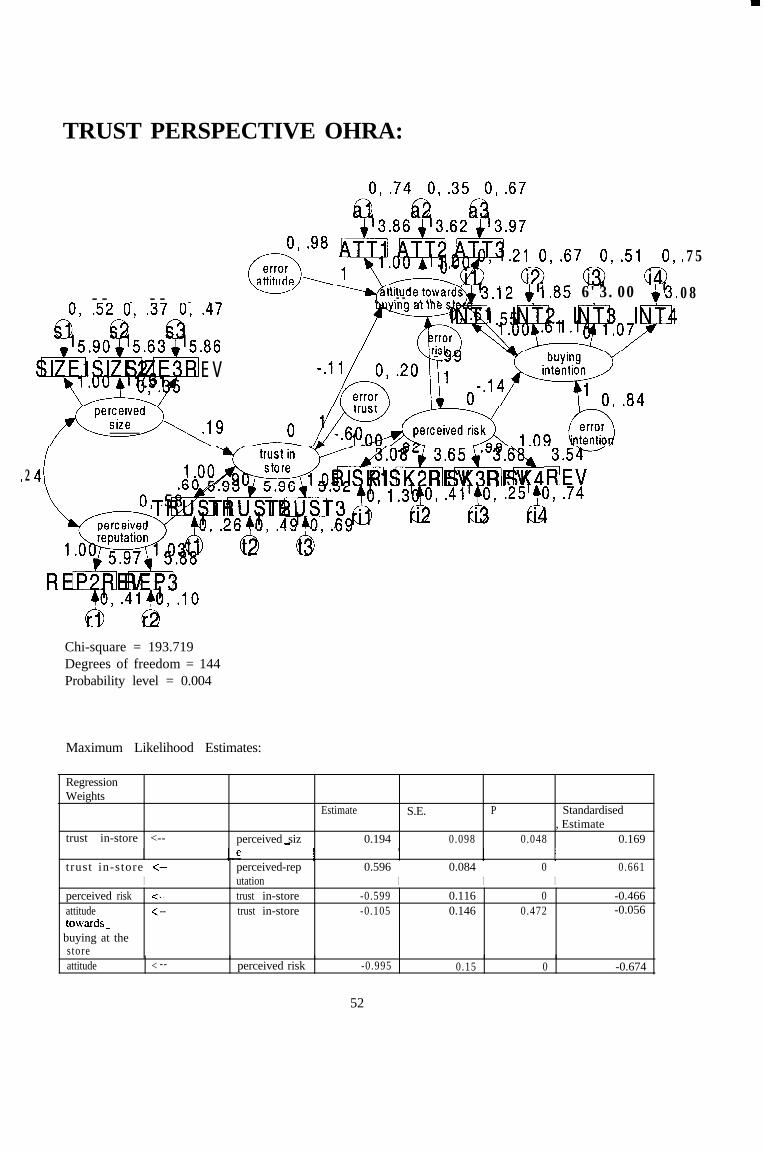
TRUST PERSPECTIVE OHRA:
. 2
0,.74 0,.35 0,.67a! 62 63k'3.86 L'3.62 A'3.97
- -- a -- - m- ~qtudetoward~'3.12 h'1.85 6'3.00mmm.. -- ,A AL- -A- +'3.0, .52 0, .37 0, .47
95.9095.6395.86EV
Chi-square = 193.719Degrees of freedom = 144Probability level = 0.004
Maximum Likelihood Estimates:
3.5wB]EV
1.3&0,.41'40, .25'+0,.74I3 .
. 6@
RegressionWeights
trust in-store <--
Estimate S.E. P Standardised, Estimate
perceived siz- 0.194 0.098 0.048 0.169
trust in-store <--I
perceived-reputation
0.596I
0.084I
0I
0.661
perceived risk <-- trust in-store -0.599 0.116 0 -0.466attitude < -- trust in-store -0.105 0.146 0.472 -0.056towards-
1 buying at thestoreattitude < -- perceived risk -0.995 0.15 0 -0.674
. 75
08
52
A
< --
c---4perceived risk
towards-buying at thestore
-0.142
0.548attitudetowards-buying at thestoreperceived siz-e
0I
0.587I
SIZE1 < -- 1 0 .638
SIZE2 < -- perceived siz-e
1.729 0.19 ~ 0 0.862
SIZE3REV <-- perceived siz-e
1.507 0.167 0 0.794
REP2REV < -- perceived-reputationperceived-reputation
0.763I
1
1.035
1
REP3 < -- 0.095 0I
0.925I
TRUST1 < -- trust in-storetrust in-storetrust in-storeperceived riskperceived riskperceived riskperceived riskattitudetowards-buying at thestoreattitudetowards-buying at thestoreattitudetowards-buying at thestorebuying-intentionbuying-intentionbuying intent-ionbuying-intention
I 0.802 1TRUST2 < -- 0.899 0.101 0 I 0.659 1TRUST3RISK4REVRISK3REVRISK2REV
< -- 1.045 0.119 01 0.652 1< -- 1.094 0.128
0.988 0.106< --< -- 0.919
RISK1 < -- I 0.611 111ATT1 < --
< -- 0.067ATT2
ATT3
INTl
INT2
INT3
INT4
Intercepts
1.122
1.002 0.067< - -
< - -
< -a
C- -
< we
SIZE1SIZE2SIZE3REVREP2REVREP3TRUST1TRUST2TRUST3RISK4REVRISK3REV
1 I 0.741I
0.614 0.064
0.09
0.089
1.135
1.067n I
0 0.832
Estimate SE.5.902 0.0645.628 0.082
5.86 0.0775.967 0.0685.879 0.0585.926 0.0585.963 0.0645.516 0.075
3.54 0.0883.684 0.069
53
RISK2REV 3.65 1 0.07 1RISK1 3.084 0.099ATT1 3.856 0.107ATT2 3.619 0.108ATT3 3.967 0.105INTl 3.121 0.112INT2 1.851 0.076INT3 2.995 0.106INT4 3.079 0.106
Squared Multiple Correlations: Estimatemm--a------------------------- a-------
trust in-store 0.583perceived risk 0.218
attitude towards- buying at the stor 0.422buying-intention 0.433
INT4 0.692INT3 0.787INT2 o-453INTl 0.549ATT3 0.717ATT2 0.858ATT1 0.695RISK1 0.373
RISK2REV 0.614RISK3REV 0.751RISK4REV 0.555
TRUST3 0.425TRUST2 0.434TRUST1 0.643
REP3 0.856REP2REV 0.582
SIZE3REV 0.631SIZE2 0.743SIZE1 0.407
Fit Measures
Fit Measure Default model Saturated Independence MacroDiscrepancy 193.719 0 12866.95 CMINDegrees of freedom 144 0 190 D FP 0.004 0 PNumber of 65 209 19 NPARparametersDiscrepancy / df 1.345 67.721 CMINDF
R M RG F IAdjus ted GFIParsimony-adjustedG F I
0.0750.9120.8830.69 1
0.0001.000
0.555 R M R0.330 G F I0.256 AGFI0.297 P G F I
Normed fit index 0.985 1 0 N F IRelative fit index 0.98 0 RF1Incremental fit index 0.996 1 0 IF1Tucker-Lewis index 0.995 0 TLIComparative fit 0.996 1 0 C F I
5 4

index
Parsimony ratioParsimony-adjustedN F IParsimony-adjustedC F I
0.758 0 1 PRATIO0.746 0 0 P N F I
0.755 0 0 PCFI
Noncentrali tyDarameter estimate
49.719 0 12676.95 NCP
boundRMSEA upper
boundP for test of close fit
Akaike informationcriterion (AIC)Browne-CudeckcriterionBayes informationcriterionConsistent AICExpected crossvalidation index
ECVI lowerbound
ECVI upperboundMECVI
Hoelter .05 indexHoelter .Ol index
0.054
0.871
323.719
337.121
1.513
1.362
1.701
1.575
192206
418
461.093
1.953
1.953
1.953
2.155
0.567 RMSEAHI
0 PCLOSE
12904.95 AIC
12908.86 B C C
BIC
CAIC60.303 ECVI
58.581 ECVILO
62.055 ECVIHI
60.322 MECVI
4 HFIVE4 H O N E
55
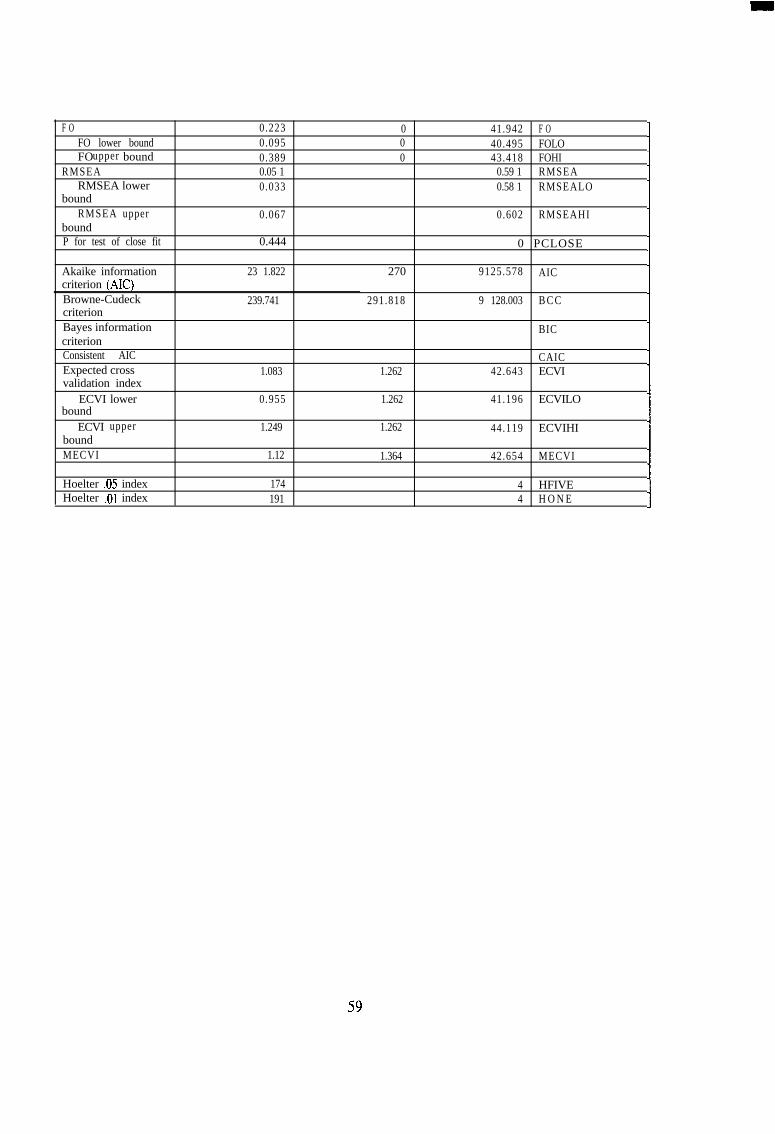
WEBSITE PERSPECTIVE OHRA:
0,.72 0, .31 0,.73
0, 1.83
Chi-square = 133.822Degrees of freedom = 86Probability level = 0.001
Maximum Likelihood Estimates:
RegressionWeights
Estimate S.E. P StandardisedEstimate
website-usefu c-- websi te-ease 0.534 0.089 0 0.425lness of useattitude-towar c-- website-ease 0.195 0.08 1 0.016 0.178ds buying-at of usethe onlinestoreattitude-towar <-- website-usefu 0.33 0.069 0 0.378ds buying-at lnessthe onlinestoreonline-purcha C-- website-usefu 0.03 0.058 0.6 0.037
56
se-intention lnessonline-purcha <-- attitude-towar 0.588 0.079 0 0.632se-intention ds buying-at
the onlinestore
EASE5 c -- websi te-ease 1 0.914of use
EASE4 c -- website-ease 0.948 .0.049 0 0.838of use
EASE3 < -- website-ease 0.861 0.044 0 0.846of use
EASE2 < -- website-ease 1.035 0.043 0 0.906of use
EASE1 < -- websi te-ease 1 0.896of use
USEFUL3 < -- websi te-use fu 0.992 0.078 0 0.757lness
USEFUL2 < -- website-usefu 1.139 0.073 0 0.926lness
USEFUL1 < -- website-usefu 1 0.845lness
ATT1 < -- attitude-towar 1 0.838ds buying-atthe onlinestore
ATT2 < -- attitude-towar 1.127 0.066 0 0.936ds buying-atthe onlinestore
ATT3 < -- attitude-towar 0.979 0.066 0 0.83 1ds buying-atthe onlinestore
INTl < -- online-purcha 1 0.743se-intention
INT2 C -- online-purcha -0.615 0.064 0 0.677se-intention
INT3 C -- online-purcha 1.135 0.09 0 0.889
! INT4se-intention
C -- online-purcha 1.059 0.089 0 0.827II se-intention I
Intercepts
EASE5EASE4EASE3EASE2EASE1USEFUL3USEFUL2USEFUL1ATT1ATT2ATT3INTlINT2INT3INT4
Estimate S.E.5.186 0.0895.047 0.0925.326 0.0835.209 0.0935.372 0.09 13.986 0.1343.781 0.1263.567 0.1213.856 0.1073.619 0.1083.967 0.1053.121 0.1121.851 0.0762.995 0.1063.079 0.106
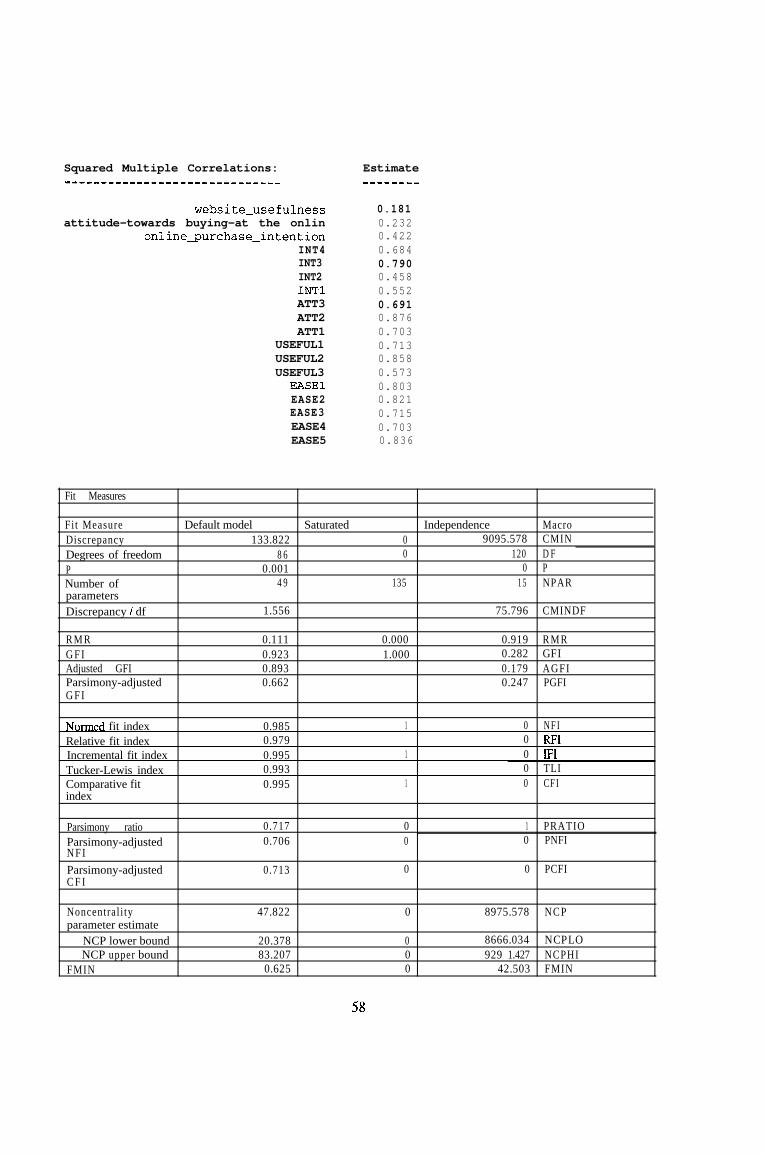
Squared Multiple Correlations:--------------------am--------
website-usefulness 0.181attitude-towards buying-at the onlin 0.232
online_purchase-intention 0.422INT4 0.684INT3 0.790INT2 0.458INTl 0.552ATT3 0.691ATT2 0.876ATT1 0.703
USEFUL1 0.713USEFUL2 0.858USEFUL3 0.573
EASE1 0.803EASE2 0.821EASE3 0.715EASE4 0.703EASE5 0.836
Estimate------a_
Fit Measures
Fit Measure Default model Saturated Independence MacroDiscrepancy 133.822 0 9095.578 CMINDegrees of freedom 8 6 0 120 D FP 0.001 0 PNumber of 4 9 135 1 5 NPARparametersDiscrepancy / df 1.556 75.796 CMINDF
R M RG F IAdjusted GFIParsimony-adjustedG F I
0.1110.9230.8930.662
0.0001.000
0.919 R M R0.282 GFI0.179 AGFI0.247 PGFI
Normed fit indexRelative fit indexIncremental fit indexTucker-Lewis indexComparative fitindex
0.985 1 0 NFI0.979 0 RF10.995 1 0 IF10.993 0 TLI0.995 1 0 CFI
Parsimony ratio 0.717 0 1 PRATIOParsimony-adjusted 0.706 0 0 PNFIN F IParsimony-adjusted 0.713 0 0 PCFIC F I
Noncentral i typarameter estimate
NCP lower boundNCP boundupper
FMIN
47.822 0 8975.578 NCP
20.378 0 8666.034 NCPLO83.207 0 929 1.427 NCPHI
0.625 0 42.503 FMIN
58
F OFO lower boundFO boundupper
RMSEARMSEA lower
boundRMSEA upper
boundP for test of close fit
0.2230.0950.3890.05 10.033
0.067
0.444
000
41.942 F O40.495 FOLO43.418 FOHI
0.59 1 RMSEA0.58 1 RMSEALO
0.602 RMSEAHI
0 PCLOSE
Akaike informationcriterion (AK)Browne-CudeckcriterionBayes informationcriterionConsistent AICExpected crossvalidation index
ECVI lowerbound
ECVI upperboundMECVI
23 1.822 270 9125.578 AIC
239.741 291.818 9 128.003 B C C
BIC
CAIC1.083 1.262 42.643 ECVI
0.955 1.262 41.196 ECVILO
1.249 1.262 44.119 ECVIHI
1.12 1.364 42.654 MECVI
Hoelter .05 index 174 4 HFIVEHoelter .Ol index 191 4 H O N E
59
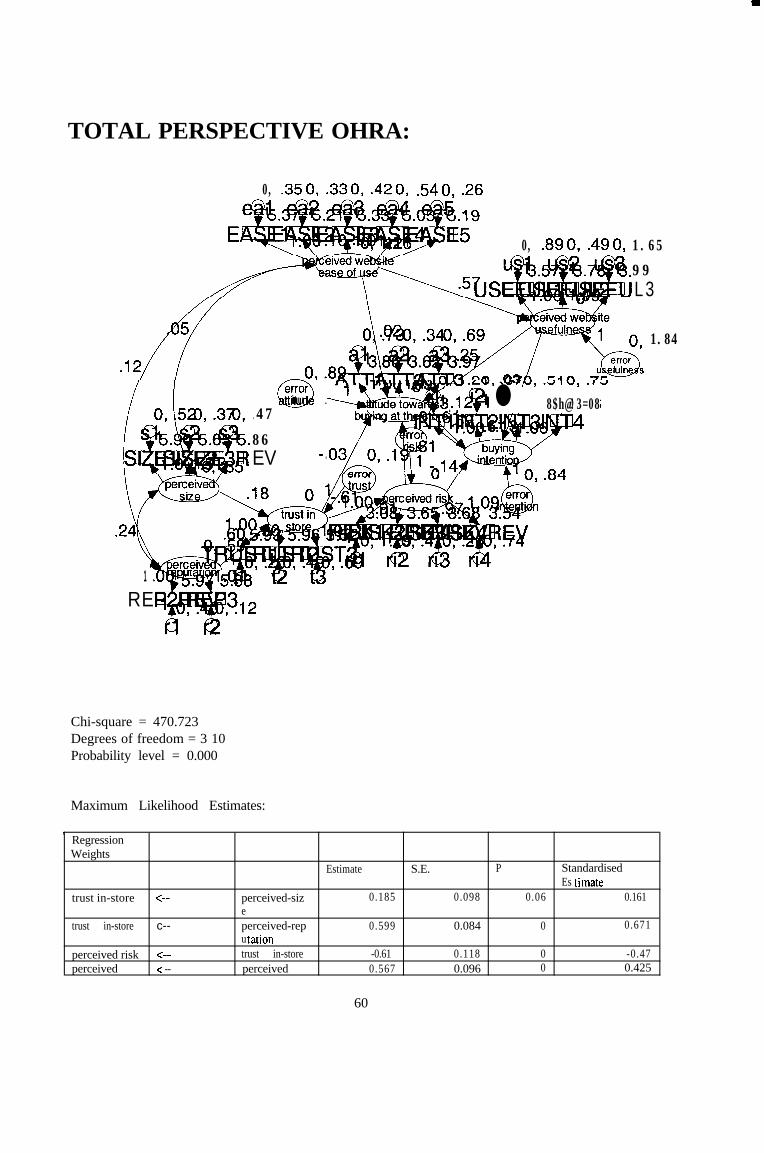
TOTAL PERSPECTIVE OHRA:
0, .350, .330, .420, .540, -26
0, .890, .490, 1.65
99L3
errorQitu ..47
86EV - .
l.l@!. 1 l 8$h@!3=08
1.84
1 .RE
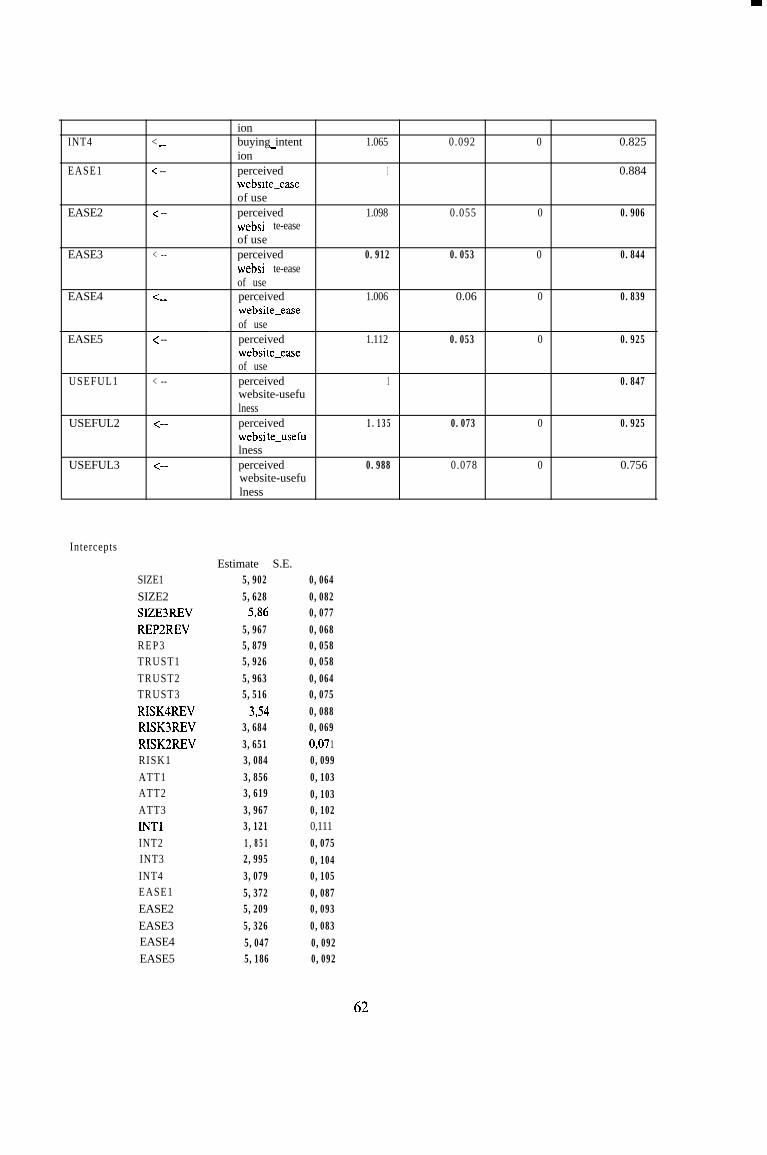
Chi-square = 470.723Degrees of freedom = 3 10Probability level = 0.000
Maximum Likelihood Estimates:
tRegressionWeights
Estimate S.E. P StandardisedEs timate
trust in-store c-- perceived-siz 0.185 0.098 0.06 0.161e
trust in-store c-- perceived-rep 0.599 0.084 0 0.671u tation
perceived risk C-- trust in-store -0.61 0.118 0 -0.47perceived < -- perceived 0.567 0.096 0 0.425
60
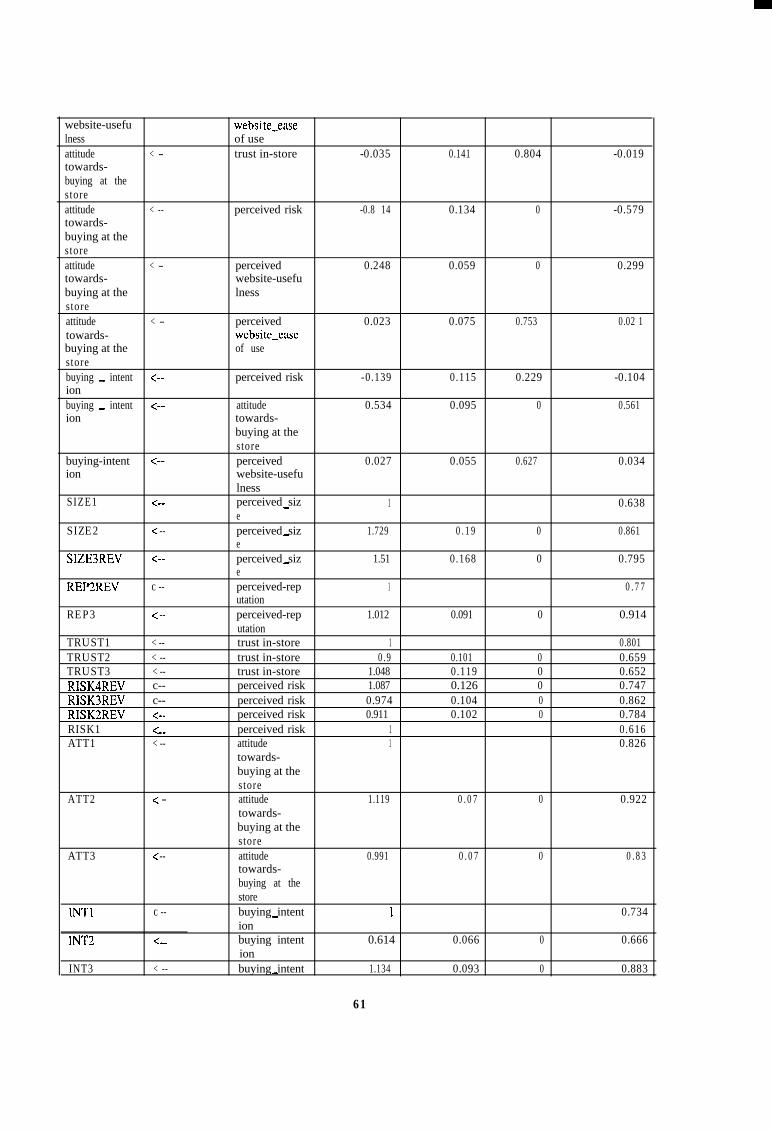
website-usefu websi te-easelness of useattitude < -- trust in-store -0.035 0.141 0.804 -0.019towards-buying at thestoreattitude < -- perceived risk -0.8 14 0.134 0 -0.579towards-buying at thestoreattitude < -- perceived 0.248 0.059 0 0.299towards- website-usefubuying at the lnessstoreattitude < -- perceived 0.023 0.075 0.753 0.02 1towards- website-easebuying at the of usestorebuying - intent <-- perceived risk -0.139 0.115 0.229 -0.104ionbuying - intent <-- attitude 0.534 0.095 0 0.561ion towards-
buying at thestore
buying-intent <-- perceived 0.027 0.055 0.627 0.034ion website-usefu
lnessSIZE1 <Be perceived siz 1- 0.638
eSIZE2 < -- perceived siz 1.729 0.19 0 0.861-
eSIZE3REV <-- perceived siz 1.51 0.168 0 0.795-
eREP2REV C -- perceived-rep 1 0 .77
utationREP3 < -- perceived-rep 1.012 0.091 0 0.914
utationTRUST1 < -- trust in-store 1 0.801TRUST2 < -- trust in-store 0.9 0.101 0 0.659TRUST3 < -- trust in-store 1.048 0.119 0 0.652RISK4REV c-- perceived risk 1.087 0.126 0 0.747RISK3REV c-- perceived risk 0.974 0.104 0 0.862RISK2REV <-- perceived risk 0.911 0.102 0 0.784RISK1 < V W perceived risk 1 0.616ATT1 < -- attitude 1 0.826
towards-buying at thestore
ATT2 < -- attitude 1.119 0.07 0 0.922towards-buying at thestore
ATT3 < -- attitude 0.991 0.07 0 0.83towards-buying at thestore
INTl C -- buying intent 1. 0.734-ion
INT2 < WV buying intent 0.614 0.066 0 0.666-ion
INT3 < -- buying intent 1.134 0.093 0 0.883-
61
INT4 < Be
EASE1 < --
EASE2 < --
EASE3 < --
EASE4 < em
EASE5 < --
USEFUL1 < --
USEFUL2 <--
USEFUL3 <--
ionbuying intent-ionperceivedwebsite-easeof useperceivedwebsi te-easeof useperceivedwebsi te-easeof useperceivedwebsite-easeof useperceivedwebsite-easeof useperceivedwebsite-usefulnessperceivedwebsi te-usefulnessperceivedwebsite-usefulness
1.065 0.092 0 0.825
1 0.884
1.098 0.055 0 0.906
0.912 0.053 0 0.844
1.006 0.06 0 0.839
1.112 0.053 0 0.925
1 0.847
1.135 0.073 0 0.925
0.988 0.078 0 0.756
Intercepts
SIZE1SIZE2SIZE3REVREP2REVREP3TRUST1TRUST2TRUST3RISK4REVRISK3REVRISK2REVRISK1ATT1ATT2ATT3INTlINT2INT3INT4EASE1EASE2EASE3EASE4EASE5
Estimate S.E.5,9025,6285,86
5,9675,8795,9265,9635,5163,54
3,6843,6513,0843,8563,6193,9673,1211,8512,9953,0795,3725,2095,3265,0475,186
0,0640,0820,0770,0680,0580,0580,0640,0750,0880,0690,07 10,0990,1030,1030,1020,1110,0750,1040,1050,0870,0930,0830,0920,092
62
USEFUL1 3,567 0,121USEFUL2 3,781 0,126USEFUL3 3,986 0,134
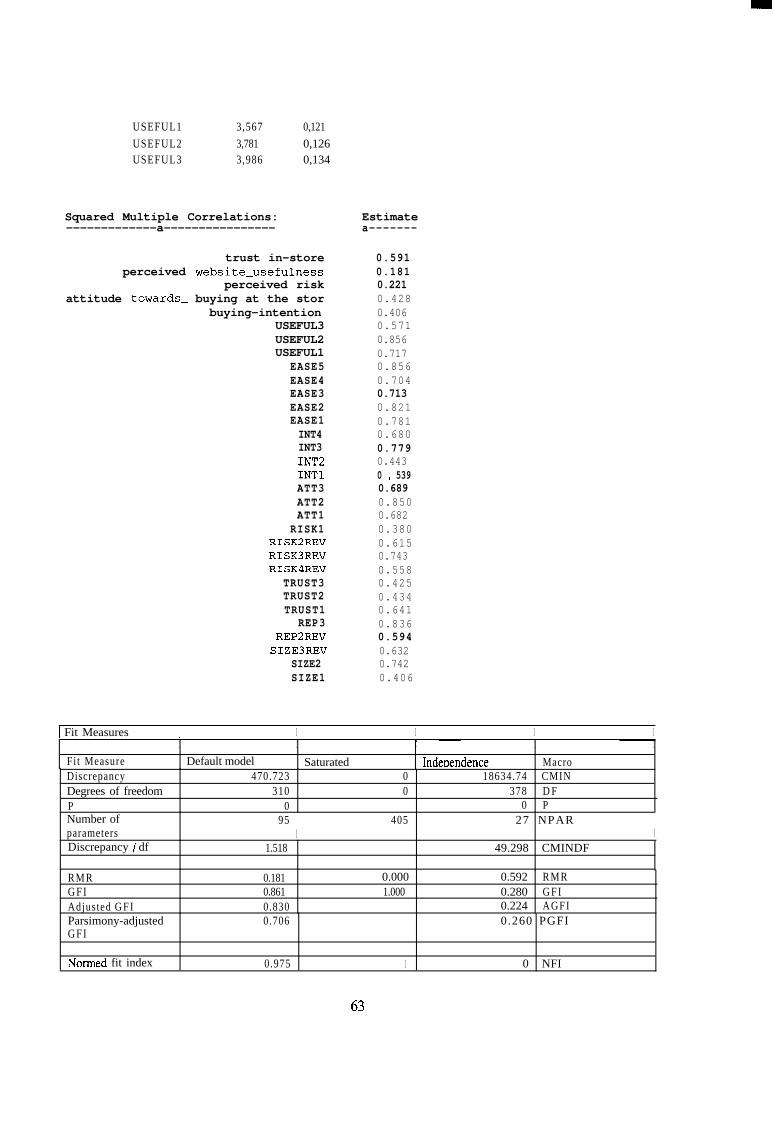
Squared Multiple Correlations:-------------a----------------
trust in-store 0.591perceived website-usefulness 0.181
perceived risk 0.221attitude towards- buying at the stor 0.428
buying-intention 0.406USEFUL3 0.571USEFUL2 0.856USEFUL1 0.717
EASE5 0.856EASE4 0.704EASE3 0.713EASE2 0.821EASE1 0.781INT4 0.680INT3 0.779INT2 0.443INTl 0 * 539ATT3 0.689ATT2 0.850ATT1 0.682
RISK1 0.380RISK2REV 0.615RISK3REV 0.743RISK4REV 0.558
TRUST3 0.425TRUST2 0.434TRUST1 0.641
REP3 0.836REP2REV 0.594SIZE3REV 0.632
SIZE2 0.742SIZE1 0.406
Estimatea-------
1 Fit Measures I I I I II I I r-- I I
Fit Measure Default model Saturated Indeoendence MacroDiscrepancy 470.723Degrees of freedom 310P 0
00
18634.74 CMIN378 D F
0 PNumber ofparameters
95I
405 27 NPARI
Discrepancy / df 1.518 49.298 CMINDF
R M R 0.181 0.000 0.592 R M RG F I 0.861 1.000 0.280 G F IAdjusted G F I 0.830 0.224 AGFIParsimony-adjustedG F I
0.706 0.260 PGFI
Normed fit index 0.975 1 0 NFI
63
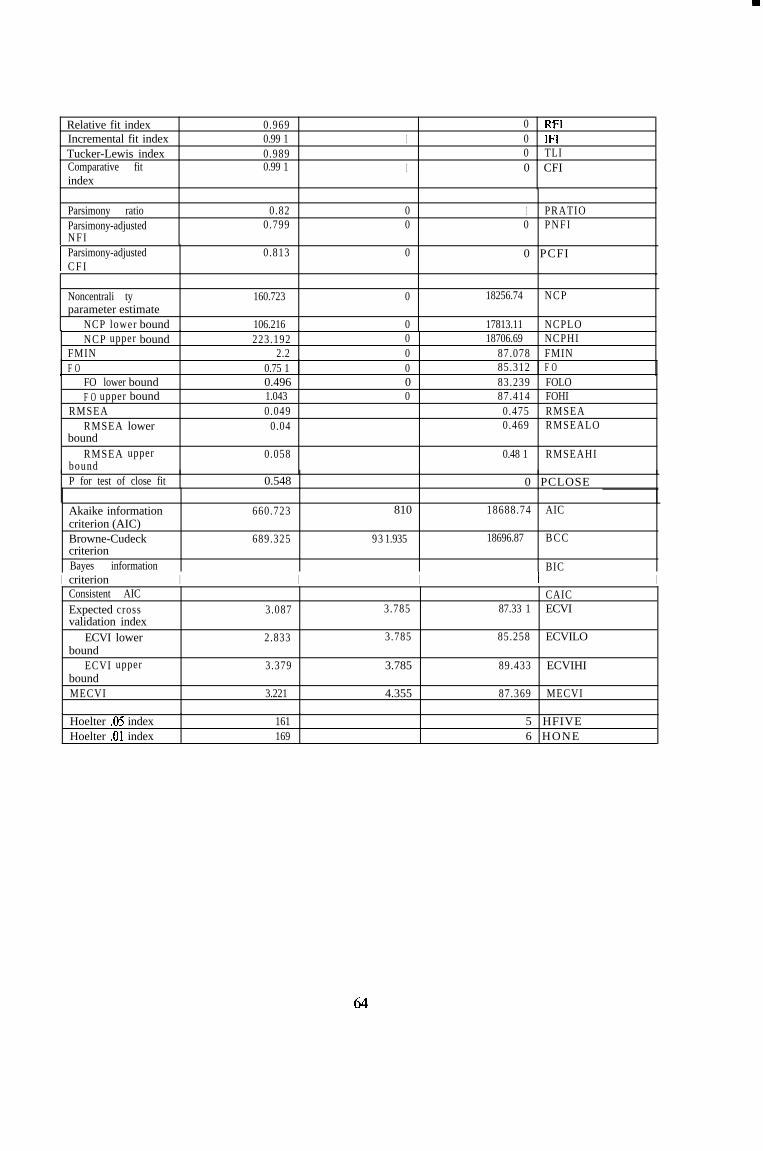
Relative fit index 0.969 0 RF1Incremental fit index 0.99 1 1 0 IFITucker-Lewis index 0.989 0 TLIComparative fitindex
0.99 1 1 0 CFI
Parsimony ratio 0.82 0 1 PRATIOParsimony-adjusted 0.799 0 0 P N F IN F I
I Parsimony-adjusted 0.813 0 0 PCFIC F I
Noncentrali typarameter estimate
NCP lower bound
160.723 0 18256.74 NCP
106.216 0 17813.11 NCPLONCP upper bound 223.192 0 18706.69 NCPHI
FMIN 2.2 0 87.078 FMINF O 0.75 1 0\ 85.312 F O
FO lower bound 0.496 0 83.239 FOLOF O upper bound 1.043 0 87.414 FOHI
RMSEA 0.049 0.475 RMSEARMSEA lower 0.04 0.469 RMSEALO
boundRMSEA upper 0.058 0.48 1 RMSEAHI
boundP for test of close fit 0.548 0 PCLOSE
Akaike informationcriterion (AIC)Browne-Cudeckcriterion
660.723 810 18688.74 AIC
689.325 93 1.935 18696.87 B C C
IBayes information BICcriterion I I I I IConsistent AICExpected crossvalidation index
ECVI lowerbound
ECVI upperboundMECVI
CAIC3.087 3.785 87.33 1 ECVI
2.833 3.785 85.258 ECVILO
3.379 3.785 89.433 ECVIHI
3.221 4.355 87.369 MECVI
Hoelter .05 indexHoelter .Ol index
161 5 HFIVE169 6 HONE
64


![Serle Court Inaugural Company Conference 2020...First Respondent in Re AMT Coffee Limited [2019] EWHC 46 (Ch) an 11 day High Court trial (in which Matthew Morrison acted for the Second](https://img.pdfslide.us/doc/110x75/5e6d91c0612f2862547d7824/serle-court-inaugural-company-conference-2020-first-respondent-in-re-amt-coffee.jpg)


![Famous in Love by Rebecca Serle [Excerpt]](https://img.pdfslide.us/doc/110x75/55cf93fe550346f57b9f0496/famous-in-love-by-rebecca-serle-excerpt.jpg)