Embed Size (px)
Citation preview

AMERICAN JOURNAL OF PHYSICAL ANTHROPOLOGY 100:443-460 (1996)
Sequence Diversity of the Control Region of Mitochondrial DNA in Tuscany and Its Implications for the Peopling of Europe
PAOLO FRANCALACCI, JAUME BERTRANPETIT, FRANCESC CALAFELL, AND PETER A. UNDERHILL Istituto di Antropologia, Universita di Sassari, 07100 Sassari (Pl?), and Laboratorio di Genetica Molecolare del CNR, Port0 Conte, 07041 Alghero (SS) (PIC) Italy; Laboratori d'Antropologia, Facultat de Bwlogia, Universitat de Barcelona, 08028 Barcelona, Spain (J.B., KC.); and Department of Genetics, Stanford Uniuersity, Stanford, California 94305 (PA. U.)
KEY WORDS European populations
Mitochondrial variability, DNA sequences,
ABSTRACT The control region of mitochondrial DNA has been widely studied in various human populations. This paper reports sequence data for hypervariable segments 1 and 2 of the control region from a population from southern Tuscany (Italy). The results confirm the high Variability of the control region, with 43 different haplotypes in 49 individuals sampled. The comparison of this set of data with other European populations allows the reconstruction of the population history of Tuscany. Independent approaches, such as the estimation of haplotype diversity, mean pairwise differences, genetic distances and discriminant analysis, place the Tuscan sample in an intermediate position between sequences from culturally or geographically isolated regions of Europe (Sardinia, the Basque Country, Britain) and those from the Middle East. In spite of the remarkable genetic homogeneity in Europe, a degree of variability is shown by local European populations and homogeneity increases with the relative isolation of the population. The pat- tern of mitochondrial variation in Tuscany indicates the persistence of an ancient European component subsequently enriched by migrational waves, possibly from the Middle East. o 1996 Wiley-Liss, Inc.
Mitochondrial DNA (mtDNA) is of great interest to population geneticists due to its unique features: maternal inheritance, ab- sence of recombination, and high mutation rate. Early papers studied the variability of this molecule in human populations by means of restriction enzymes (Johnson et al., 1983; Horai et al., 1984). More recently, a number of studies have involved the amplifi- cation and sequencing of a specific region, the control region, which encompasses the origin of replication, and which shows the highest variability of the mitochondrial ge- nome in its two hypervariable segments (Vigilant et al., 1989; Vigilant, 1990; Horai
and Hayasaka, 1990). All these studies have been used to infer conclusions on many as- pects of human evolution, such as the spread of modern humans (Cann et al., 1987; Vigi- lant et al., 1991), migration patterns at a continental level (Torroni et al., 1993a,b; Shields et al., 19931, and the microdifferenti- ation and demographic history of single pop- ulations (Ward et al., 1991; Bertranpetit et al., 1995).
Received December 16, 1994; accepted December 26, 1995. Address reprint requests to Paolo Francalacci, Istituto di An-
tropologia, Universita di Sassari, Via Regina Margherita 15, 07100 Sassari, Italy.
0 1996 WILEY-LISS, INC.

444 P. FRANCALACCI ET AL
We report here the sequences of the two hypervariable segments of the control region of mtDNA observed in a homogeneous popu- lation in central Italy. The area studied is the southern part of Tuscany, which repre- sents the most conservative area of the re- gion because of the relative isolation of its population after the decline of Roman rule. The coastal plains became marshy and re- mained insalubrious for many centuries, and peopling was limited to small villages in pro- tected areas in the hills. The neo-Latin lan- guage spoken in the area is highly conserva- tive, with few innovative features introduced from neighboring regions (Devoto, 1977). A multivariate study using principal-compo- nent analysis carried out on 7 genetic loci and 34 independent alleles from various Ital- ian samples (Piazza et al., 1988) shows the genetic identity of this population, as it con- stitutes a pole of the second principal compo- nent in a principal-component analysis of Italy. Sharp genetic change associated with linguistic differentiation in central Italy was also noted by Barbujani and Sokal (1991). In addition, this area represents the core of the Etruscan civilization, historically de- fined since the seventh century B.C. and gradually absorbed by the Roman expansion beginning in the fourth century B.C. Exclud- ing a few military clashes, Roman penetra- tion in Etruria was mainly political and cul- tural. Even though some colonies of veterans were established in the territory, no massive replacement of population is known from historical sources.
The Etruscan language, although our knowledge of it is not complete, was clearly of non-Indo-European origin and was spoken in the area until the first century A.D., when it was eventually replaced by Latin. In the fifth century B.C. the area of distribution of Etruscan was completely surrounded by speakers of various Indo-European lan- guages (Renfrew, 1993).
The history of the peopling of the region is still under debate. The prevalent hypothesis points to an autochthonous ethnogenesis of the Etruscan people (although with signifi- cant exchanges with the neighboring Italic populations and with the possible arrival of foreign immigrants), as indicated by the ar- chaeological continuity between the prehis-
toric (Early Iron Age) Villanovian settling and the Etruscan towns built on the same sites. The development of the Etruscan civi- lization must be seen within the same frame- work of cultural, social and genetic interac- tions among peoples of the Italian peninsula, and, more generally, of the Mediterranean, which are at the origin of all the different historical peoples who have lived in Italy since the Iron Age. Nonetheless, the autoch- thony of the Etruscan culture is clearly es- tablished (Pallottino, 1984; Facchini, 1992). The sample studied here represents a cultur- ally defined population whose origin may be related to the pre-Indo-European peopling of Europe.
MATERIALS AND METHODS Population sampling
DNA was extracted from the hair roots of 49 unrelated individuals whose maternal grandmother had been born in the area con- sidered for this study. Three other individu- als maternally related to individuals of the sample were also included as controls. Sam- ples were collected in various villages of southern Tuscany (Fig. 1). The main towns, harbors, and tourist resorts of the coast, which have been affected by recent immigra- tion, were excluded, and the sampling was carried out in villages of medium to small population, in the hilly internal part of the region. The area studied measures approxi- mately 3,000 km2 and is populated by about 100,000 inhabitants. In order to exclude re- lated individuals, each subject was inter- viewed. In addition, only very few samples were chosen for each village, limiting the probability of sampling relatives.
Molecular analysis DNA was amplified directly from lysated
hair roots according to the method described by Higuchi (1989). The two hypervariable regions of the control region of the mtDNA were amplified enzymatically by polymerase chain reaction (PCR) using the primers
GC-3’) and H16401(5’-TGATTTCACGGAG- GATGGTG-3‘) for the first segment and the primers L29 (5’-GGTCTATCACCCTAT- TAACCAC-3‘) and H 408 (5‘-CTGTTAAA-
L15996 (5’-CTCCACCATTAGCACCCAAA-

MITOCHONDRIAL VARIABILITY IN TUSCANY 445
Fig. 1. Map of the Italian peninsula showing the Tuscan region and the southern area (shaded) where the samples were collected.
AGTGCATACCGCCA-3') for the second. To achieve the desired single specific product for segment 1, a hot-start technique (DAquila et al., 1991) was applied to the PCRreaction. Reagents were preheated over 8VC, then 2.5U of taq polymerase was added and 30 cycles of the following thermal cycle regime were immediately initiated: denaturation at 95°C for 45 seconds, annealing at 55°C for 1 minute, and extension at 72°C for 1 minute, repeated for 30 cycles.
The PCR products were purified with Pro- mega Magic Prep and Pharmacia Miniprep Spun columns and sequenced with an Ap- plied Biosystem ABI 373A automatic se- quencer applying a DyeDeoxy TerminatorTM cycle sequencing protocol. For each sample, both H and L strands were sequenced and compared, to distinguish true mutational events from incorrect nucleotide readings of the instrument. The sequences obtained cover, without missing nucleotides, the en- tire region between the mentioned primers: from nucleotide 15996 to 16401 and a total of 403 base pairs for segment 1, and from 29 to 408 and a total of 377 base pairs for seg- ment 2, following the reference numbers of the Cambridge sequence (Anderson et al., 1981).
Computer analysis The data were analyzed by SPSS and
PHYLIP 3 . 5 ~ (Felsenstein, 1989) standard packages and with other specially written programs for computing genetic distances and other comparisons between sequences and populations. Other human control-re- gion sequences used for comparison were ob- tained through GenBank and published ref- erences.
The present data were compared with those from 13 populations for segment 1: Basques (45 individuals, 27 haplotypes; Bertranpetit et al., 1995), Sardinians (69 individuals, 46 haplotypes; Di Rienzo and Wilson, 19911, Britons (Piercy et al., 1993); unspecified Caucasoids (21 individuals, 19 haplotypes; Di Rienzo and Wilson, 1991; Vig- ilant, 1990) Middle Easterners (42 individu- als, 38 haplotypes; Di Rienzo and Wilson, 1991), Asians (24 individuals, 24 haplotypes; Vigilant, 1990) Papua New Guineans (20 in- dividuals, 16 haplotypes; Vigilant, 19901, Nuu-Chah-Nulth American Indians (63 in- dividuals, 28 haplotypes; Ward et al., 19911, Bantu-speaking Africans (Herero and Yo- ruba; 41 individuals, 21 haplotypes; Vigilant, 1990), Hazda (19 individuals, 4 haplotypes; Vigilant, 1990), Pygmies (37 individuals, 23 haplotypes; Vigilant, 1990), !Kung (25 indi- viduals, 12 haplotypes; Vigilant, 1990).
For segment 2, information is more scarce, and data from only 8 populations, published by Vigilant (1990), were used: Europeans (29 individuals, 26 haplotypes), Asians (24 individuals, 24 haplotypes), Papua New Guineans (17 individuals, 15 haplotypes), Bantu-speaking Afi-icans (28 individuals, 24 haplotypes), Hazda (4 individuals, 4 haplo- types), Pygmies (29 individuals, 28 haplo- types), and !Kung (16 individuals, 11 haplo- types), as well as the British data (100 individuals, 91 haplotypes) published by Piercy et al. (1993).
RESULTS AND DISCUSSION Description of variation
Sequences for the two segments of the hy- pervariable region of the control region were obtained for all the 49 individuals included in this study and for the 3 individuals ana- lyzed as a control sample. The sequences

446 P. FRANCALACCI ET AL.
And 1 2 3 4 5 , 6 7 , 8 9 10 11 12 1 3 14 1 5 16 1 7 18 19 20 21 22 23 24 25 26 27 28 29 30 3 1 32 33 34 35 36 37 38 39 40 41 42 43 44 45 46 47 48 49 50 51,52
1111111111 1111111111 1111111111 1111111111 1111111111 11111 6666666666 6666666666 6666666666 6666666666 6666666666 66666 0001111111 1111111112 2222222222 2222222222 2222333333 33333 5690122344 5567788991 2223344456 6677788899 9999000111 22556 1934169457 3632669233 2340108961 3504814601 2467049168 45262
Fig, 2. Variable position for 49 mitochondria1 control region sequences (plus 3 sequences of maternally related individuals). Sequences were listed according to the order of sample collection. Nucleotide posi- tions from 16051 to 16362 belong to segment 1; nucleotide positions from 57a to 319 belong to segment 2. A dash(-) indicates the presence of the same nucleotide as in the reference sequence (And, first row).
amplified from the 3 pairs of maternally re- lated individuals were identical, confirming the validity of the method of analysis and the absence of contamination in these samples. Figure 2 shows the nucleotide differences of segments 1 and 2 with respect to the refer- ence sequence (Anderson et al., 1981), for all the 52 individuals sampled.
Segment 1. The 49 individuals showed 40 different haplotypes for segment 1. The vari- able sites were 55 out of 406 nucleotides, the mzjmity transitions, with only 2 transver- sions detected in this sample (3.6% of the
total). More pyrimidine than purine transi- tions were observed, with a ratio of 38:15 (2.53:l). This difference was statistically sig- nificant when compared to the base content of the region (201 pyrimidines and 159 pu- rines; x2 = 4.77,1d.f., P = 0.029; Fisher’s ex- act test P = 0.020). This result may be inter- preted as a bias in the mutation rate according to the chemical nature of the nu- cleotide, and thus does not depend only on the position within the region, clearly shown by Wakeley (1993).
The allelic partition was as follows: 9 indi-

MITOCHONDRIAL VARIABILITY IN TUSCANY 447
viduals had the same haplotype (identical to the reference sequences of Anderson et al., 19811, 2 individuals shared another se- quence, while 38 individuals had a unique haplotype. When compared with other popu- lations, 4 sequences found in Tuscany are also present in Sardinia (out of 46 haplo- types), 3 are shared with Basques (out of 27 haplotypes), 7 with British (out of 72 haplo- types), one with the Middle East sample (out of 38 haplotypes), and 30 are unique to Tus- cany. No coincidence was found for haplo- types from other human groups.
In a population at equilibrium, under the infinite allele model, it is possible to calcu- late the expected number of alleles K given the sample size n (Ewens, 1979; Hart1 and Clark, 1979) through the expression: k = 8/8 + 8/(€1 + 1) + . . . + 848 + n-11, where n is the sample size and 8 = 2Nu, u being the mutation rate and N the effective female population size. For 49 individuals and 40 alleles, 0 equals 99.38, a value much higher than that found in other populations (Ward et al., 1991; Bertranpetit et al., 1995). This value indicates that the number of alleles increases extensively with larger sample size, as shown in Figure 3, where clearly the expected number of different sequences still increases in samples of more than 1,000 (see also Ward et al., 1993). To have a good de- scription of the whole variation, a larger sample size would be needed and conse- quently this approach is inadequate for esti- mating the effective population size.
Segment 2. In the same sample of 49 indi- viduals, segment 2 showed a lower variabil- ity than segment 1; 29 haplotypes were de- tected and 35 sites out of 380 nucleotides were found to be different from the reference sequence reported in Anderson et al. (1981) All the variability is represented by transi- tions. A more equilibrated CT versus AG ra- tio, corresponding to 15:14 (1.07:1), was ob- served for this segment, which fits the base content of this region (210 pyrimidines, 170 purines; x2 = 0.136, 1 d.f., P = 0.712; Fish- er’s exact test P = 0.714).
The lower heterogeneity of this segment is reflected both by the allelic partition and by the haplotypes shared with other popula- tions. As to the allelic partition, 1 haplotype
was common to 12 individuals, 1 haplotype to 4 individuals, 2 haplotypes to 3 individu- als each, 2 haplotypes to 2 individuals each, and 23 haplotypes were unique. Comparison with other populations indicated that 10 haplotypes were also observed in the general Caucasian sample, and in the large British sample, while 2 other haplotypes were also detected in very distant populations, from both Asia and Africa. The remaining 17 hap- lotypes were unique to the Tuscan sample. Geographical specificity is not as clear as that found for segment 1.
In this segment, we found 5 insertions in respect to the reference sequence. Some were related to single nucleotide repetitions; after a run of 7 Cs (position 309 of segment 2; see Fig. 1) 16 individuals had an extra C and 4 individuals two extra Cs; and an additional C was found in all individuals after a run of 5 Cs in position 315. Another case consisted of an extra T after a run of 4 Ts in position 57, found in a single individual. Finally, a C was inserted after a T in position 60 in an- other single individual. There seemed to be two different types of insertion, related or not to the presence of a run of a single nucleo- tide; these polynucleotide stretches could be insertion hot spots.
Segment 1 + 2. When considering the con- trol region as a whole, the allelic partition was much simpler; one sequence was shared by 7 individuals and the remaining 42 indi- viduals had unique sequences. All these re- sults show the high degree of variability found even within populations coming from a geographically reduced area.
Haplotype diversity in European populations
The diversity among European popula- tions can be estimated both by the heteroge- neity among the individuals analyzed, and by the degree of difference observed among the haplotypes. Diversity can be ascertained using either all the individual sequences obtained, whether or not they are found replicated in other individuals, or differ- ent sequences (referred also as haplotypes throughout this paper) as the basis for calcu- lations.
The calculation of the relative proportion

448 P. FRANCALACCI ET AL.
0 200 400 600 800 1000
Sample size
Fig. 3. Expected number of alleles when increasing the sample size for 8 = 99.38. The point for 49 individuals and 40 alleles is shown.
of individuals per haplotype and of Shan- non’s measure of information H (and the ra- tio to its maximum, H,,, for a given sample size, H’; Magurran, 1988) shows the vari- ability within a population, taking into account the information provided by all individuals analyzed; in contrast, other pa- rameters only consider the different haplo- types, such as the relative number of parsi- mony steps needed to link all haplotypes in a most parsimonious tree, which reflects the diversity among them.
In the Tuscan sample, several diversity parameters were estimated for segment 1 since data on other local European popula- tions are very limited for segment 2. Results are shown in Table 1; there are 0.82 haplo- types per individual; the measure H’ of infor- mation is 0.94; the average pairwise differ- ence in nucleotides between all possible pairs of sequences of all individuals is 5.03; and the number of steps needed to link the 40 haplotypes is 81, corresponding to an av- erage of 2.02 steps per haplotype. To obtain the last parameter, a set of most parsimoni- ous trees was generated using the default
options of the DNAPARS program in the PHYLIP 3.5~ package (Felsenstein, 1989).
The European populations included in this study reflect different cultural and geo- graphical features: Basques, with a long- standing cultural and genetic isolation from neighboring peoples (Calafell and Bertran- petit, 1993,1994); Sardinians, an important outlier within European genetic variation (Cavalli-Sforza et al., 1994), who are island- dwellers; and Britons, also island-dwellers, who live on an island that has been an im- portant fringe of human movements (Ca- valli-Sforza et al., 1994). Tuscans, on the other hand, are settled in continental Italy where various migrational events have taken place since prehistoric times. Middle Easterners are from an area known to be the place of origin of several major cultural innovations. The degree of heterogeneity of the mitochondria1 haplotypes in the popula- tion studied can be related to their different history: Tuscans show higher values for the four parameters than the other European populations living in areas that are isolated culturally (Basques) o r geographically (Sar-

MITOCHONDRIAL VARIABILITY IN TUSCANY 449
TABLE I . Parameters of seauence divergence in several Dooulations’
N k a b C d e H H’
Tuscany 49 40 0.82 5.03 t 0.86 1.40 81 2.02 4.99 0.94
Sardinia (2) 69 46 0.67 4.22 i 0.75 1.17 84 1.83 4.97 0.90 Basques (1) 45 27 0.60 3.15 t 0.72 0.87 40 1.48 4.33 0.91
~ ~ ~ ~~~~~~~ ~~
Britain (3) 100 72 0.72 4.35 t 0.72 1.21 110 1.53 5.74 0.93 Middle East (2) 42 38 0.90 7.08 t 1.22 1.97 84 2.21 5.20 0.99
lSources: (1) Bertranpetit et al. (1995); (2) DiRieuzo et al. (1991); (3) Piercy et al. (1993). All values have been computed for the segment between positions 16024 and 16383 (360 base pairs). Abbreviations: N, sample size; k, number of different haplotypes; a, number of lineages per individual; b, mean pairwise difference between individuals (i 1 S.D.) in number of nucleotides; c, average pairwise percentage difference per nucleotide (= b x 100/360); d, number of parsimony steps for the most parsimonious tree; e, number of parsimony steps per haplotype
H, haplotype diversity; H’, ratio of H to H,, (maximum H according to sample size).
dinians and Britons), and lower values than Middle Easterners (Table 1). The high Tus- can heterogeneity within the European framework could be explained by a higher variability already present at the origin of the population (probably related to the expansion of modern humans), but could also be due t o later migrations that may have increased the heterogeneity of the group. In any case, it is interesting to note the high heterogeneity in a small, local, rural Euro- pean population which, according to the cal- culated parameters, corresponds broadly to a general population of “Europeans” gath- ered from different sources and with no spe- cific place of origin.
Pairwise difference distribution The distribution of the pairwise differ-
ences for segment 1 follows the pattern found in other non-African populations, with a wave shape, indicating the existence of an ancient episode of exponential growth as de- scribed by Rogers and Harpending (1992; Fig. 4a). The robustness of the distribution was tested by the standard deviations of each of the pairwise values calculated by the jackknife method (Efron, 1982). It is clear from the small values of these errors (Fig. 4a) that the shape of the distribution is very robust, and its properties can therefore be analyzed.
According to a theoretical model developed by Li (1977) and Rogers and Harpending (1992), it is possible to use the three parame- ters of the pairwise distribution to obtain an estimation of certain demographic parame- ters of the putative expansion that may be responsable for the shape of the distribution. Least-square parameter estimates are:
T = 28t = 4.81, 8 0 = 2No0 = 0.82 and el = 2N18 = 31.19
When comparing the expected and observed distributions (Fig. 4b), the overall shapes are similar and no significant differences are found through the x2 test ( x 2 = 20.31, 12 d.f., P = 0.061).
Knowledge of the mutation rate for this region would make it possible to compute the time of the population expansion, and the effective population size before and after. Unfortunately, there is no general agree- ment on the mutation rate for the control region, although it is accepted that rates are higher than for other parts of the genome, including the coding region of the mitochon- drial DNA (Tamura and Nei, 1993). The cal- culation of the mutation rate presents sev- eral difficulties that have caused differences of more than one order of magnitude be- tween the various estimates (Vigilant et al., 1991; Ward et al., 1991; Tamura and Nei, 1993). On the other hand, differences in mu- tation rate between segments 1 and 2 are obvious in all known sequence sets, as the number of observed substitutions is much higher for segment 1 than for 2, with an approximate ratio of 2:l for the same num- ber of sites. Furthermore, these estimates are derived considering the hypervariable segments as a whole, while clearly the muta- tion rate varies within segments. Wakeley (1993) recognized in segment 1 of the hyper- variable regions 29 “fast” sites whose rate of substitution is, on average, 7.4 times higher than the “slow” sites. In addition, some nu- cleotides included in the hypervariable re- gion may not be variable a t all, and the inclusion of these sites leads to an underesti-

450 P. F W C A L A C C I ET AL.
Frequency 0.2
0.15
0.1
0.05
0
a
0.2
0.15
0.1
0.05
0 1 2 3 4 5 6 7 8 9 10 11 12 Number of differences
Frequency
0 1 2 3 4 5 6 7 8 9 10 11 12 Number of differences
b - Observed --+- Rogers 8 Harpending
Fig. 4. a: Pairwise difference distribution for segment 1 of the control region with jackknife standard deviations. b: Observed and expected distributions under the Rogers and Harpending (1992) model.
mation of the mutation rate for the actual polymorphic region. As a consequence of all these inaccuracies, the estimation of the time of expansion of a given population (Rog- ers and Harpending 1992), relying on a very uncertain mutation rate, cannot refer to a
real historical date, and is not used here on this account. However, the comparison of distributions in different populations pro- vides a clear relative dating of their popula- tion expansions as the peak of the distribu- tion travels to the right at a fixed pace, a

MITOCHONDRIAL VARIABILITY IN TUSCANY 45 1
Frequency 0.2 1
0 2 4 6 8 10 12 14 16 18 Number of differences
- Tuscans + Britons + Middle Easterners
- Basques + Sardinians
Fig. 5. Comparison of painvise difference distributions for segment 1 in some European populations.
function of the mutation rate (the same in all) and the time since the expansion.
When the pairwise distribution was com- pared to other European populations, the Tuscan sample’s peak lay to the right of other European populations (Fig. 5). Mean pair- wise difference in Tuscans was 5.03 ? 0.86 nucleotides (standard error derived from 200 bootstrap replicates), higher than that of Basques (3.15 2 0.72), Sardinians (4.22 2 0.75), and Britons (4.35 2 0.72; Fig. 5). Val- ues through the estimation of T showed the same sequence. This finding suggests that the Tuscan population shows the effects of a more ancient expansion than the other three European populations. The sample from the Middle East presented a peak more to the right of the European populations, with a mean at 7.08 ? 1.22 nucleotides. This result implies a more ancient population expansion than for any European and suggests a popu- lation expansion into Europe from the Mid- dle East, with each population showing traces of its own growth after the settling.
The analysis of segment 2 was undertaken in a similar way. Here the pairwise distribu- tion showed a sharp peak at a low number of nucleotides (Fig. 6), with a mean value of 3.43. When fitting the Rogers and Harpend- ing model, the parameters were very low:
T = 1.93; 00 = 2.21 and €4 = 14.58. Nonethe- less, there were highly significant differ- ences between the observed and expected distributions (x2 = 67.06, 12 d.f., P = 0.000). This discordance may be due to the low mu- tation rate and the low number of mutating nucleotides for segment 2, which may lead to higher sampling errors.
When analyzing the whole hypervariable region, consisting in the sum of segments 1 and 2, the pairwise distribution (Fig. 6) showed a much wider range of variation, with a mode at 9 differences and a mean of 8.46 2 1.29. The estimated parameters were T = 6.98; fJO = 2.57 and 01 = 48.22. The fit- ting of the observed to the expected distribu- tions gives a x2 not far below the significance level (x2 = 33.92, 19 d.f., P = 0.019): a much better fit than for segment 2 and worse than for segment 1. There are no data for segment 2 to allow comparisons with other Euro- pean populations.
Genetic distances: dA and intermatches The differences between pairs of popula-
tions may be estimated through different pa- rameters. For sequence data, Nei and Miller (1990) defined the dA distance, which is based on the proportion of different nucleo- tides between the sequences from the two
452 P. F W C A L A C C I ET A L
Frequency
0.25 :
0 1 2 3 4 5 6 7 8 9 10 11 12 13 14 15 16 17 18 19 20 21 Number of differences
~ Segment 1 Segment 2 - Segment 1+2
Fig. 6. Pairwise difference distributions of segment 1, segment 2 and both together in the Tuscan sample.
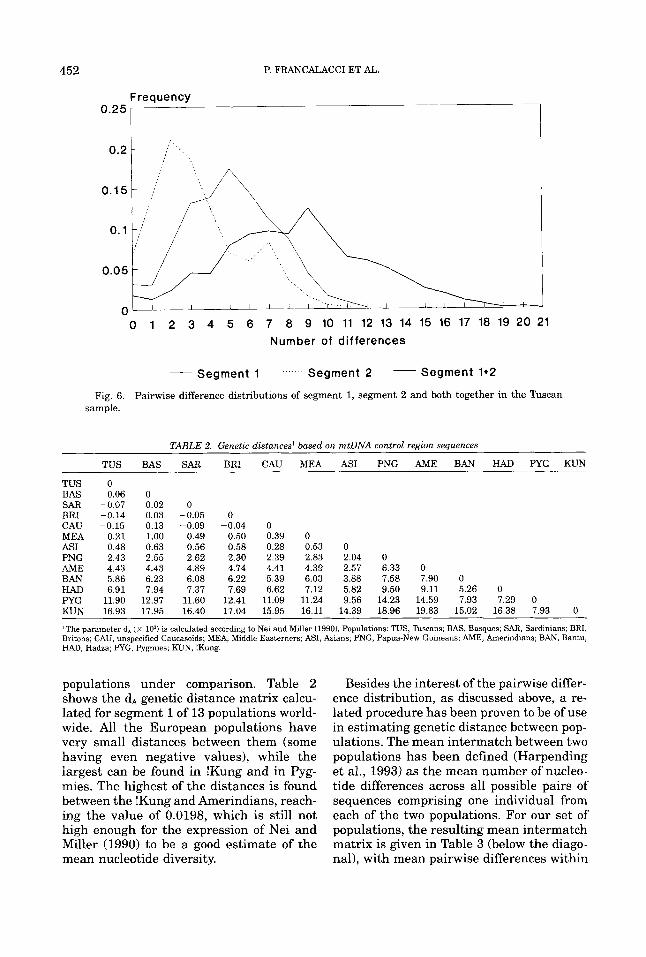
TABLE 2. Genetic distances' based on mtDNA control region sequences
TUS BAS SAR BRI CAU MEA AS1 PNG AME BAN HAD PYG KUN
TUS 0 BAS 0.06 0 S A R -0.07 0.02 0 BRI -0.14 0.03 -0.05 0 CAW -0.15 0.13 -0.09 -0.04 0 MEA 0.21 1.00 0.49 0.50 0.39 0 AS1 0.48 0.63 0.56 0.58 0.28 0.53 0 PNG 2.43 2.55 2.62 2.30 2.39 2.83 2.04 0 AhfE 4.43 4.43 4.89 4.74 4.41 4.39 2.57 6.33 0 BAN 5.86 6.23 6.08 6.22 5.39 6.03 3.88 7.58 7.90 0 HAD 6.91 7.94 7.37 7.69 6.62 7.12 5.82 9.50 9.11 5.26 0 PYG 11.90 12.97 11.60 12.41 11.09 11.24 9.56 14.23 14.59 7.93 7.29 0 KUN 16.93 17.95 16.40 17.04 15.95 16.11 14.39 18.96 19.83 15.02 16.38 7.93 0
IThe parameter d, ( X lo3) is calculated according to Nei and Miller (1990). Populations: TUS, Tuscans; BAS, Basques; SAR, Sardinians; BRI, Britons; CAU, unspecified Caucasoids; MEA, Middle Easterners; ASI, Asians; PNG, Papua-New Guineans; AME, Amerindians; BAN, Bantu; HAD, Hadza; PYG, Pygmies; KUN, !Kung.
populations under comparison. Table 2 shows the dA genetic distance matrix calcu- lated for segment 1 of 13 populations world- wide. All the European populations have very small distances between them (some having even negative values), while the largest can be found in !Kung and in Pyg- mies. The highest of the distances is found between the !Kung and Amerindians, reach- ing the value of 0.0198, which is still not high enough for the expression of Nei and Miller (1990) to be a good estimate of the mean nucleotide diversity.
Besides the interest of the pairwise differ- ence distribution, as discussed above, a re- lated procedure has been proven to be of use in estimating genetic distance between pop- ulations. The mean intermatch between two populations has been defined (Harpending et al., 1993) as the mean number of nucleo- tide differences across all possible pairs of sequences comprising one individual from each of the two populations. For our set of populations, the resulting mean intermatch matrix is given in Table 3 (below the diago- nal), with mean pairwise differences within

MITOCHONDRIAL VARIABILITY IN TUSCANY 453
TUS BAS
TUS BAS SAR BRI CAU MEA AS1 PNG AME BAN HAD PYG KUN
5.03 0.10 4.19 3.15 4.63 3.78 4.66 3.84 4.77 3.98 6.15 5.55 6.88 6.05 6.28 5.39 6.80 5.92 6.66 5.86 7.23 6.67
10.89 10.37 10.04 9.51
TABLE 3. Pairwise differences for segment 1 of the control region'
SAR BRI CAU MEA AS1 PNG AME BAN
0.00 -0.03 -0.03 0.10 0.23 0.83 1.63 2.05 0.09 0.04 0.13 0.43 0.34 0.87 1.69 2.19 4.22 0.01 0.00 0.20 0.25 0.81 1.79 2.10 4.30 4.35 0.01 0.20 0.26 0.83 1.73 2.17 4.39 4.46 4.56 0.16 0.14 0.66 1.62 1.72 5.85 5.91 5.98 7.08 0.22 0.73 1.60 1.82 6.50 6.58 6.56 7.90 8.28 0.42 1.00 1.01 5.86 5.95 5.88 7.21 7.50 5.88 2.24 2.45 6.56 6.57 6.56 7.80 7.80 7.84 5.32 2.53 6.31 6.45 6.10 7.46 7.25 7.49 7.29 4.20 6.92 6.41 6.78 8.18 8.27 8.49 8.21 6.19
10.41 10.74 10.36 11.66 11.59 10.75 11.99 8.38 9.47 9.75 9.44 10.76 10.65 9.74 11.21 8.06
HAD PYG KUN
2.89 4.05 5.93 3.27 4.46 6.34 2.98 3.97 5.77 2.77 4.26 5.98 2.67 3.75 5.57 1.81 3.79 5.63 2.30 3.12 4.92 3.72 3.48 5.21 3.72 5.00 6.96 2.26 1.95 4.37 3.66 2.12 5.33 8.28 8.66 2.91 8.75 8.83 3.19
I Below the diagonal: intermatches between pairs ofpopulations. Diagonal: mismatches within a population (also called mean painvise difference). Above the diagonal: intermatch-based genetic distance (d, = d, - (d,, + dJ2). Population abbreviations as in Table 2.
TABLE 4. Genetic differences for segment-2 sequences'
TUS BRI CAU AS1 PNG BAN HAD PYG KUN
TUS 0 BRI -0.08 CAU 1.04 AS1 1.81 PNG 1.90 BAN 1.92 HAD 4.90 PYG 5.88 KUN 12.71
0.01 0 1.30 2.17 2.07 2.51 5.07 6.31
12.89
0.47 0.42 0 0.40 0.71 1.16 2.90 4.92
11.25
0.68 0.69 0.25 0 0.16 1.36 2.33 5.55
10.76
0.83 0.71 0.45 0.24 0 1.99 1.84 6.32
10.27
0.79 2.02 0.82 1.57 0.55 1.41 0.58 1.20 0.86 1.10 0 1.45 2.97 0 2.33 6.22 7.32 7.59
2.05 1.87 1.76 1.91 2.25 0.98 2.51 0 7.89
3.94 3.82 3.48 3.29 3.19 2.36 2.70 2.66 0
>Above the diagonal: dA. Below the diagonal: D,. Population abbreviations as in Table 2.
each population (mismatches in the nomen- clature of Harpending et al., 1993) in the di- agonal.
The intermatches between two popula- tions may be considered as an estimation of the genetic difference between them and the matrix of intermatches can be considered a distance matrix, but a transformation is needed to take into account the variation within the two populations and to make the diagonal values equal to zero. A simple transformation, called the Jensen difference (Rao, 1982), is: dI = d,, - (dl, + dJ2, where d,, is the mean number of intermatches be- tween populations i and j, and d,, and d, are the mean pairwise aifferences (mismatches) within populations i and j (Di Rienzo et al., 1994; Mountain et al., 1995; Table 4, above the diagonal).
The similarity between the two matrices (dA and intermatch distances, d,) may be in- dicated through a correlation, the signifi- cance of which had to be tested by a nonpara- metic analysis due to the clear violation of
the independence condition. The Mantel test (Mantel, 1967) was performed with 1,000 random shufflings of one of the matrices. The correlation obtained is 0.989, a value higher than any of the 1,000 permutations and thus highly significant (P = 0.000). The information provided by the matrix of inter- matches once transformed into distances is, consequently, very similar to that of dA ge- netic distances (except for a scale difference, which is a function of the number of nucleo- tides considered and thus of little interest).
Harpending et al. (1993) stressed that in populations with little common history (iso- lated from each other for a long time before expansions) the mean of the intermatches is higher than either of the two mismatches. This is the same as saying there is a high genetic distance between them. In the pres- ent comparison, this happens for nearly all African populations, compared with other populations and with each other, and with some cases of Papuans and Nuu-Chah- Nulth. In contrast, Asian and European pop-
454 P. FRANCALACCI ET AL.
ulations show mismatch values within their respective intermatch values. This supports the hypothesis of a long seperation between different African haplotypes, while Asians and Europeans could have expanded from a single ancestral population (Bowcock et al., 1991).
The graphic representation of the dA dis- tance matrix (indistinguishable from that of the dI distance matrix), a neighbor-joining unrooted tree (Saitou and Nei, 1987) is given in Figure 6. A descriptive idea of the ro- bustness of the tree may be obtained through bootstrap, recalculating the distance ma- trix and drawing the tree from subsequent random resamples of the original data (Felsenstein, 1985). This procedure has been repeated for 200 resamples and the most fre- quent tree (also called the consensus tree) coincides in its topology with the original neighbor-joining tree of Figure 7. The figure also shows the percentages of cases in which a given node is found in the 200 trees from the bootstrap. The robustness of the tree is striking for the African part but is also quite high for the rest, in spite of the low dis- tance values.
These results point to a remarkable homo- geneity among all the European populations when compared to those of other continents, especially Africa. Nonetheless, the pattern of variation seems to have a specific and quite robust structure, at least for the external position of the Middle East sample and, to a lesser extent, for the location of the Basques at the opposite edge of the tree. Although branch lengths are very short, the ramification pattern within European popu- lations was found consistently in the boot- strapped trees. Downwards from Middle Easterners, the branching order is Tuscans, Britons, Sardinians and Basques; this pat- tern is the same as that revealed by mean pairwise differences.
This approach was also followed for seg- ment 2. There are fewer populations avail- able for comparison: Tuscany, unspecified Caucasians, Asia, Papua-New Guinea, Bantu, Hadza, Pygmies and !Kung. The dA distances are shown in Table 5 below the diagonal, and the intermatches corrected ac- cording to the mismatches, as seen before, are shown above the diagnonal of the same
table. The correlation between the two ma- trices is 0.985, highly significant (P = 0.000) according to the Mantel test. The neighbor- joining tree for the dA matrix is shown in Figure 8. The similarity of trees from seg- ment 1 and 2 is striking, indicating that the global relationships among the population studied are still evident from the sequence analysis of the segment 2 despite the re- duced number of mutations detected. How- ever, the scarcity of data does not allow us to draw conclusions for the European popu- lations.
Discriminant analysis
The relative position of the different Euro- pean populations, with some differential traits but no clear pattern of geographic dif- ferentiation, raises the question of whether and to what extent a given sequence could be allocated among the known geographic variation. The question may be approached through discriminant analysis, which as- signs every case (in this case a given se- quence) to a predefined group as a function of the values obtained for the different inde- pendent variables (in this case the variable nucleotides). This approach may be particu- larly useful if a sequence of unknown origin has to be assigned or related to known popu- lations, as in the case of forensic remains or ancient DNA studies. Another possible application could be in the recognition of the different genetic contributions in the case of populations in which admixture may have happened (e.g., Gypsy or Jewish communi- ties). Discriminant analysis may also help to recognize the relative importance of the variables in establishing the separation among groups, which, in the present case, would mean recognizing specific nucleotides for specific populations and measuring their relative importance in assessing the discrim- ination among groups.
Among the possible discriminant proce- dures, the linear discriminant function seems the best choice due to its statistical properties (Tatsuoka, 1971; Hand, 1981). In situations where the independent variables are binary or discrete, as in this case, the linear discriminant function is not optimal, but most evidence suggests that it performs reasonably well and more robustly than

MITOCHONDRIAL VARIABILITY IN TUSCANY 455
* 57.5%
M EA
Fig. 7. Neighbor-joining tree originating from the d, distance matrix calculated for segment 1. Names of the populations as in Table 3. The numbers in the figure refer to the percentage of cases in which a given mode is found after 200 resamplings by bootstrap analysis. The neighbor-joining tree for Caucasoid populations is shown in the insert.
TABLE 5. Classification results from the discriminant analysis with five populations’
Predicted group membership Actual No of group cases TUS SAR BAS BRI MEA
TUS 40 23 1 0 15 1
SAR 46 0 21 0 24 1
BAS 27 0 2 5 20 0
BRI 72 9 5 0 57 1
MEA 38 0 3 0 7 28
57.5% 2.5% 0.0% 37.5% 2.5%
0.0% 45.7% 0.0% 52.2% 2.1%
0.0% 7.4% 18.5% 74.1% 0.0%
12.5% 6.9% 0.0% 79.2% 1.4%
0.0% 7.9% 0.0% 18.4% 73.7%
1 Diagonal: cases correctly classified. Abbreviations as in Table 2
other nonparametric procedures (Gilbert, 1968; Hand, 1981). Nucleotide data are clearly discrete but the possible presence of one of the four bases poses the problem of properly weighing the differences between them: a codification such as 1 = A, 2 = G, 3 = C and 4 = T would evaluate correctly the transitions (difference = 1) but not the
transversions. To minimize the impact of this bias, the value “1” was assigned if the nucleotide observed coincided with that re- ported in the reference sequence (which is the most frequent) and the value “2” if the position showed a transition. In the rare case in which a transversion was present, the po- sition assumes the value “3,” regardless of

456 P. FRANCALACCI ET AL.
HAD
Fig. 8. Neighbor-joining tree originating from the dA distance matrix calculated for segment 2. Names of pop- ulations as in Table 3.
the nucleotide type. This was the case for 19 out of the 111 variable nucleotides in the five samples under consideration: Tuscans, Sardinians, Basques, Britons and Middle Easterners. Other analyses with other codi- fications for the nucleotides had a minor in- fluence in the results of the discriminant analysis (data not shown) and thus the bias introduced by the codification did not notice- ably affect the final results.
As missing values cannot enter the analy- sis, incomplete sequences were dropped, as were sites that did not vary within the popu- lations under consideration. Sequences with length mutations were not included. The to- tal number of different complete sequences were: 40 Tuscans, 46 Sardinians, 27 Basques, 68 Britons and 38 Middle Easterners.
Although 4 different canonical discrimi- nant functions can be computed, only the first 2 are statistically significant and thus of in- terest. They involve 57 out ofthe 111 variable positions. The first discriminant function(ex- plaining 49.3% of the variance) stresses the difference between Middle Easterners and
the other populations, with the Basques at the opposite end. The second function (ex- plaining 26.8% of the variation), on the other hand, separates Tuscans from the rest.
Figure 9 shows the territorial map for the two canonical discriminant functions (ex- plaining 76.1% of the variability). The centroids of the British, Basque and Sardin- ian samples lie very close in the territorial map, in the British area, with a remarkable overlapping in the distribution of their sam- ples, while the centroid of Tuscany, and, more clearly, that of the Middle East sample, occupy a more distant position. It is worth noting that the two discriminant functions are uncorrelated and that one function tends to separate the Middle Easterners from the general Caucasoid variation and the other from the Tuscans. This result supports the idea of a barely structured variation of the isolated (culturally andor geographically) European populations and two different and partially independent sources of variation given by the Tuscans and, primarily, the Middle Easterners.
The same two canonical discriminant func- tions may be used to classify the sample cases and to analyze the amount and pattern ofmis- classification. Table 5 reports the assignation of the cases to the different groups, where the diagonal elements are the cases correctly classified. The overall percentage of cases correctly classified is 60%. The behavior of the British sample deserves some comment: it is a large sample (72 different sequences) with a high percentage ofwell classified cases and with many cases from the populations falling into them (up to 74% of Basques and 52% of Sardinians). The reason for this seems t o be that this sample occupies a large portion of the multidimensional space of sequence variation and thus attracts similar se- quences. In other words, sequences shared by more than one population must necessarily be assigned to one of them, the larger sample (in this case the British sample) being the most attractive. This fact again seems to sup- port the affinity among Britons, Basques and Sardinians, leaving room for a certain speci- ficity ofTuscans and clearly defining the Mid- dle East sample, which shows the best classi- fication of their sequences.

MITOCHONDRIAL VARIABILITY IN TUSCANY 457
Discriminant function 2 4
2
0
-2
- 4 -3 -2 -1 0 1 2 3
Discriminant function 1
Fig. 9. Territorial map of the two canonical discriminant functions of the discriminant analysis. Names of populations as in Table 3. Each population is shown by its centroid. The close positions of Britons, Basques and Sardinians is evident.
CONCLUSIONS The analysis of the control region of the
mtDNA of Tuscany provides new clues in the reconstruction of the population history of the region and, more generally, of Europe. The results from various independent ap- proaches point to a remarkable homogeneity among several European populations, namely Basques, Sardinians and Britons, but also reveal some differences caused by the geographic location and cultural past which have influenced their population his- tory. As shown by different parameters (av- erage number of individuals per haplotype and diversity coefficient, H’), the variability among individuals in Tuscany is intermedi- ate between the more variable Middle East- erners and the European populations men- tioned, the Basques having the lowest degree of heterogeneity. Haplotype diversity, mea- sured by the average number of steps in the most parsimonious tree that links all the haplotypes, reflects the same pattern, in- creasing from Basques to Middle Eastern- ers, with Tuscans in an intermediate posi- tion. Similar results are obtained through
the distribution of pairwise differences be- tween all pairs of sequences in each popula- tion. Briefly, Basques, and to a lesser extent, Britons and Sardinians, harbor a lower hap- lotype variability and this is composed of sequences that are more similar to each other (in a phylogenetic sense) than Middle Easterners, while Tuscans fall in the middle of the variability range defined by the two groups.
The sequence variation in Europe is too low to be interpreted in detail through ge- netic distances from control region se- quences; this is not the case for non-Euro- pean populations, with a longer independent evolutionary history. However, the structure of the tree drawn from dA distance in Europe, whose robustness is tested by bootstrap analysis, indicates that the genetic similari- ties reflect the pattern already described in Europe: that is, the mean position of Tuscany between the other European populations and the Middle East.
The results of the discriminant analysis carried out on the European sample point also to a remarkable homogeneity among

458 P. FRANCALACCI ET AL.
haplotypes in the Basque, Sardinian and British samples, hardly distinguishable on the basis of their geographic origin, and whose centroids lie within a restricted area of the territorial map. In agreement with previous results, discriminant analysis shows the higher diversity of the Middle East sample, as shown by the coefficient of the first discriminant function and by the low percentage of cases misclassified as Eu- ropean.
All the results obtained on genetic vari- ability and relationships in Europe and the Middle East point to the same pattern, pro- duced by ancient population events which shaped the genetic structure. The pattern found is compatible with the effects of a mi- gration wave originating in the Middle East and reaching distant places in Europe in- cluding the western part and the islands. This pattern of expansion has been proposed with a very clear archaeological basis for the Neolithic expansion (Ammerman and Ca- valli-Sforza, 1984) and for the expansion of anatomically modern humans, inferred from paleoanthropological data (Stringer, 1989). Other known expansions such as that re- sponsible for the spread of Indo-European languages, if independent of the Neolithic expansion, are unlikely to have produced the pattern found, because of differences in the geographical distribution and lower demo- graphic impact. Of the two hypotheses, only the expansion of modern humans could be responsible for the patterns of pairwise dis- tribution found (Di Rienzo and Wilson, 1991; Harpending et al., 1993) because of the dates given by the Rogers and Harpending (1992) model: despite the inaccuracy of the muta- tion rate, the different estimates always give dates older than the Neolithic expansion into Europe.
With specific reference to the Tuscan popu- lation, its intermediate position between Middle Eastern and other European popula- tions confirms its ancient origin and the preservation of its genetic identity. Archaeo- logically, there are no important population replacements related t o cultural changes, and even the unique Etruscan culture is seen as a direct successor of the previous Villanov- ian period. Lingusitically, it has been sug- gested (Renfrew, 1993) that the Etruscan
language could be a survivor of the proto- Indo-European language replacement pro- cess, in much the same manner as Basque is generally seen as a pre-Indo-European survivor in northern Spain. Thus, even in this small population the traces of very an- cient events are still present. The higher ge- netic diversity in Tuscany than in other Eu- ropean populations may be related to later contacts that could have enriched the mito- chondrial variability of the area; these con- tacts do not seem to have been so important in more isolated (geographically or cultur- ally) or peripheral populations.
In conclusion, the whole set of data indi- cates the persistence in Europe of the effects of an ancient population growth, probably originating outside Europe but with an in situ increase whose effects are still present. The resulting mitochondrial variability was subsequently enriched by more recent expansion events, whose influence on the different European population varies ac- cording to their degree of relative isolation.
ACKNOWLEDGMENTS This research was supported by MURST
60%, CNR “Biological Archive,” and Sardinia Autonomous Region grants to P.F., by U.S. National Institutes of Health grant GMS 20467 and 28428 to L.L. Cavalli-Sforza, and by Direccibn General de Investigacibn Cien- tifica y Tecnica grant PB92-0722 and Human Capital and Mobility network grant ERCHRXTC92-0032 to J.B. P.F. thanks L. Terrenato and collaborators (University of Rome “Tor Vergata”) for warm encourage- ment during the research and for providing a CNR fellowship, and M. Siniscalco and co- workers (I.G.M., Porto Conte) for hospitality and valuable technical help. Thanks, also, to the Fondazione Laboratori di Ricerca e Formazione Porto Conte for providing part of the instrumentation.
LITERATURE CITED Ammerman AJ, and Cavalli-Sforza LL (1984) Neolithic
Transition and the Genetics of Populations in Europe. Princeton: Princeton University Press.
Anderson S, Bankw AT, Barrel BG, De Bruijn MH, Coulson AR, Sanger F, Schreier PH, Smith AJH, Sta- den R, and Young G (1981) Sequence and organization of the human mitochondria1 genome. Nature 290: 457465

MITOCHONDRIAL VARIABILITY IN TUSCANY 459
Barbujani G, and Sokal RR (1991) Genetic population structure of Italy. 11. Physical and cultural barriers to gene flow. Am. J. Hum. Genet. 48:398-411
Bertranpetit J , Sala J , Calafell F, Underhill PA, Moral P, and Comas D (1995) Human mitochondrial DNA variation a t the origin of Basques. Ann. Hum. Genet. (in press).
Bowcock AM, Kidd JR, Mountain JL, Hebert JM, Caro- tenuto L, Kidd KK, and Cavalli-Sforza LL (1991) Drift, admixture, and selection in human evolution; A study with DNA polymorphisms. Proc. Natl. Acad. Sci.
Calafell F, and Bertranpetit J (1993) A simulation of the genetic history of the Iberian Peninsula. Curr. Anthrop. 34:735-745.
Calafell F, Bertranpetit J (1994) Principal component analysis of gene frequencies and the origin of Basques. Am. J . Phys. Anthrop. 93:201-215.
Cann RL, Stoneking M, and Wilson AC (1987) Mito- chondrial DNA and human evolution. Nature 325: 31-36.
Cavalli-Sforza LL, Menozzi P, and Piazza A (1994) His- tory and Geography of Human Genes. Princeton: Princeton University Press.
DAquila RT, Bechtel U, Videler JA, Eron JJ, Gorczyca P, and Kaplan JC (1991) Maximizing sensitivity and specificity of PCR by pre-amplification heating. Nucl. Acid Res. 19:3749.
Devoto G (1977) I1 linguaggio d’Italia. Milano: Rizzoli Editore.
Di Rienzo A, and Wilson AC (1991) Branching pattern in the evolutionary tree for human mitochondrial DNA. Proc. Natl. Acad. Sci. USA 88:1597-1601.
Di Rienzo A, Peterson AC, Garza JC, Valdes AM, Slatkin M, and Freimer NB (1994) Mutational processes of simple sequence repeat loci in human populations. Proc. Natl. Acad. Sci. USA 91:3166-3170.
Efron B (1982) The Jackknife, the Bootstrap and other Resampling Plans. Philadelphia: Society for Indus- trial and Applied Mathematics.
Ewens WJ (1979) Mathematical Population Genetics. Berlin: Springer-Verlag.
Facchini F (1992) Diffusion culturelle et migrations hu- maines. Rivista di Antropologia 70:199-207.
Felsenstein J (1985) Confidence limits onphylogenies: An approach using the bootstrap. Evolution 35:785-791.
Felsenstein J (1989) PHYLIP-Phylogeny Interference Package (version 3.2) Cladistics 5:164-166.
Gilbert ES (1968) On discrimination using qualitative variables. J . Amer. Stat. Assoc. 63:1399-1412.
Hand DJ (1981) Discrimination and Classification. New York: Wiley and Sons.
Harpending HC, Sherry ST, Rogers AR, and Stoneking M (1993) The genetic structures of ancient human populations. Curr. Anthrop. 34:483-496.
Hart1 DL, and Clark AG (1979) Principles of population genetics. Sunderland, MA: Sinauer Associates.
Higuchi R (1989) Simple and rapid preparation of sam- ples for PCR. In HA Erlich (ed.): PCR Technology: Principles and Applications for DNA Amplification. New York: Stockton Press, pp. 31-38.
Horai S, and Hayasaka K (1990) Intraspecific nucleotide
USA 88:839-843.
human mitochondrial DNA. Am. J. Hum. Genet. 462: 828-842.
Horai S, Gojobori T, and Matsunaga E (1984) Mitochon- drial DNA polymorphisms in Japanese. I. Analysis with restriction enzymes of six base pair recognition. Hum. Genet. 68:324-332.
Johnson MJ, Wallace SD, Ferris SD, Rattazzi MC, and Cavalli-Sforza LL (1983) Radiation of human mito- chondrial DNA types analyzed by restriction endonu- clease cleavage patterns. J. Mol. Evol. 19:255-271.
Li WH (1977) Distribution of nucleotide differences be- tween two randomly chosen cistrons in a finite popula- tion. Genetics 85331-337.
Magurran AE (1988) Ecological Diversity and Its Mea- sure. Princeton: Princeton University Press.
Mantel N (1987) The detection of disease clustering and a generalized regression approach. Cancer Res. 27: 209-220.
Mountain JL, Hebert JM, Bhattacharyya S, Underhill PA, Ottolenghi C, Gadgil M, and Cavalli-Sforza LL (1995) Demographic history of India and mitochon- drial DNA sequence diversity. Am. J . Hum. Genet. 56:979-992.
Nei M, and Miller JC (1990) A simple method for esti- mating average number of nucleotide substitution within and between populations from restriction data. Genetics 125:87-879.
Pallottino M (1984) Etruscologia. Milano: Hoepli. Piazza A, Cappello N, Olivetti E, and Rendine S (1988)
A genetic history of Italy. Ann. Hum. Genet. 52: 203-213.
Piercy R, Sullivan KM, Benson N, and Gill P (1993) The application of mitochondrial DNA typing to the study of white Caucasian genetic identification. Int. J. Leg. Med. 106t85-90.
Rao CR (1982) Diversity and dissimilarity coefficients: a unified approach. Theoret. Pop. Biol. 21:24-43.
Renfrew C (1993) The Roots of Ethnicity. Archaeology, Genetics and the Origins of Europe. Unione Internazi- onale degli Istituti di Archeologia Storia e Storia dell’ Arte in Roma.
Rogers AR, and Harpending H (1992) Population growth makes waves in the distribution of pairwise genetic distances. Mol. Biol. Evol. 9552-569.
Saitou N, and Nei M (1987) The neighbor-joining tree method: A new method for reconstructing phyloge- netic trees. Mol. Biol Evol. 4:406-425.
Shields GF, Schmiechen AM, Frazier BL, Redd A, Voe- voda MI, Reed JK, and Ward RH (1993) mtDNA se- quences suggest a recent evolutionary divergence for Beringian and Northern American populations. Am. J . Hum. Genet. 535149462.
Stringer C (1989) The origin of early modern humans: A comparison of the European and non-European evi- dence. In P Mellars and C Stringer (eds): The Human Revolution: Behavioural and Biological Perspectives on the Origin of Modern humans. Princeton: Princeton University Press, pp. 232-244.
Tamura A, and Nei M (1993) Estimation of the number of nucleotide substitutions in the control region of mi- tochondrial DNA in humans and chimpanzees. Mol. Biol. Evol. 10.512-526.
Tatsuoka MM (1971) Multivariate Analysis. New York: sequence differences in the major noncoding region of Wiley and Sons.

460 P. FRANCALACCI ET AL
Torroni A, Schurr TG, Cabell MF, Brown MD, Nee1 JV, Larsen M, Smith DG, Vullo CM, and Wallace DC (1993a) Asian affinities and continental radiation of the four founding Native American mtDNAs. Am. J. Hum. Genet. 53:563-590.
Torroni A, Sukernik RI, Schurr TG, Starikovskaya YB, Cabell MF, Crawford MH, Comuzzie AG, and Wallace DC (199313) mtDNA variation of aborigenal Siberians reveals distinct genetic affinities with Native Ameri- cans. Am. J . Hum. Genet. 53:591-608
Vigilant L (1990) Control region sequences from African populations and the evolution of human mitochondrial DNA. PhD thesis, University of California at Berke- ley, Berkeley.
Vigilant L, Pennington R, Harpending H, Kocher TD, and Wilson AC (1989) Mitochondria1 DNA sequences
in single hairs from a southern African population. Proc. Natl. Acad. Sci. USA 86:9350-9354.
Vigilant L, Stoneking M, Harpending H, Hawkes K, and Wilson AC (1991) African populations and the evolu- tion of mitochondrial DNA. Science 253:1503-1507.
Wakeley J (1993) Substitution rate variation among sites in hypervariable region 1 of human mitochon- drial DNA. J. Mol. Evol. 37:613-623.
Ward RH, Frazier BL, Dew-Jager K, and Paabo S (1991) Extensive mitochondrial diversity within a single Am- erindian tribe. Proc. Natl. Acad. Sci. USA 88:8720- 8724.
Ward RH, Redd A, Valencia D, Frazier BL, and Paabo S (1993) Genetic and linguistic differentiation in the Americas. Proc. Natl. Acad. Sci. USA90:10663-10667.