Embed Size (px)
Citation preview

September 2018 M&A and Investment Summary

2 | M&A and Investment Summary September 2018
Table of Contents
Overview of Monthly M&A and Investment Activity 31
Monthly M&A and Investment Activity by Industry Segment 92
Additional Monthly M&A and Investment Activity Data 413
About Petsky Prunier 584
Securities offered through Petsky Prunier Securities, LLC, member of FINRA.
This M&A and Investment Summary has been prepared by and is being distributed in the United States by Petsky Prunier, a broker dealer registered with the U.S. SEC and a member ofFINRA.

3 | M&A and Investment Summary September 2018
M&A and Investment Summary for All Segments
Transaction Distribution
▪ A total of 671 deals were announced in September 2018, of which 351 were worth $35.9 billion in aggregate reported value
▪ Software was the most active segment with 268 deals announced— 129 of these transactions reported $9.8 billion in value
▪ Digital Media/Commerce was the most valuable segment with 137 transactions, 93 of which reported $10.1 billion in value
▪ Strategic buyers announced 276 deals (45 reported $22.3 billion in value)
▪ VC/Growth Capital investors announced 361 transactions (298 reported $10.5 billion in value)
▪ Private Equity investors announced 34 deals during the month (eight reported $3.1 billion in value)
*Note, transactions valued at $6 billion or more have been excluded from totals to limit comparative distortions. The aggregate total for September does not include The Carlyle Group’s pending $6.7 billion
acquisition of Sedgwick Claims Management Services
# % $MM % # $MM # $MM # $MM
Software 268 40% $9,802.2 27% 86 $4,830.0 7 $1,085.0 175 $3,887.2
Digital Media/Commerce 137 20% 10,143.2 28% 37 5,046.7 5 250.0 95 4,846.5
Marketing Technology 101 15% 7,238.4 20% 42 4,967.0 7 1,100.0 52 1,171.4
Business Services 74 11% 7,158.4 20% 50 6,607.4 8 340.0 16 211.0
Agency & Marketing Services 37 6% 320.0 1% 33 180.0 2 140.0 2 -
Digital Advertising 21 3% 162.4 0% 13 5.8 2 - 6 156.6
Traditional Media 19 3% 741.7 2% 12 472.4 2 190.0 5 79.3
Information 14 2% 286.4 1% 3 176.0 1 - 10 110.4
Total 671 100% 35,852.7 100% 276 22,285.3 34 3,105.0 361 10,462.4
September 2018
BUYER/INVESTOR BREAKDOWN
Transactions Reported Value Strategic Buyout Venture/Growth Capital

4 | M&A and Investment Summary September 2018
609 554 514 615 583 654 659 668 685 713 726 671
$37.8
$25.0
$98.1
$54.4
$36.8
$28.6$35.5
$57.9$61.6
$46.3
$37.2$42.6
685569
$-
$10.0
$20.0
$30.0
$40.0
$50.0
$60.0
$70.0
$80.0
$90.0
$100.0
$110.0
$120.0
Oct-17 Nov-17 Dec-17 Jan-18 Feb-18 Mar-18 Apr-18 May-18 Jun-18 Jul-18 Aug-18 Sep-18
Transaction Distribution
▪ Venture/ Growth Capital activity was up 13 percent compared with the average monthly strategic activity totals of the past twelve months with 361 transactions announced
▪ Significant transactions reported during the month included:
• Adobe’s pending acquisition of Marketo from Vista Equity Partners in a transaction valued at $4.8 billion
• The pending acquisition of Pandora by Sirius XM in a transaction valuing the company at $3.3 billion
• Sirius Capital Group’s $1.5 billion sale of Intralinks to SS&C Technologies
• Accel-KKR’s $1.1 billion sale of content management platform Episerver to Vista Equity Partners
• XO Group’s $810 million sale to Spectrum Equity and Permira Funds-backed wedding media company WeddingWire
CA Technologies / Broadcom
21st Century Fox
/ Disney
Gemalto / Thales
Thomson Reuters F&R / Blackstone
CSRA / Gen.Dynamics
MuleSoft
M&A and Investment Summary for All Segments
Flipkart / Walmart
BMC Software /KKR
GithubSedgwick
*Note, transactions valued at $6 billion or more have been excluded from totals to limit comparative distortions. The aggregate total does not include Disney’s pending $69 billion acquisition of 21st Century
Fox, Thales’ $6.6 billion acquisition of Gemalto, Blackstone’s pending $20 billion acquisition of Thomson Reuters’ F&R business, General Dynamics’ $9.6 billion acquisition of CSRA, Salesforce’s $6.5 billion
acquisition of MuleSoft, Walmart’s $16 billion majority investment in Flipkart, KKR’s $8.6 billion acquisition of BMC Software, Microsoft’s pending $7.5 billion TEV acquisition of GitHub, Broadcom’s pending
$18.4 billion acquisition of CA Technologies, and Carlyle Group’s pending $6.7 billion acquisition of Sedgwick Management Services
5 | M&A and Investment Summary September 2018
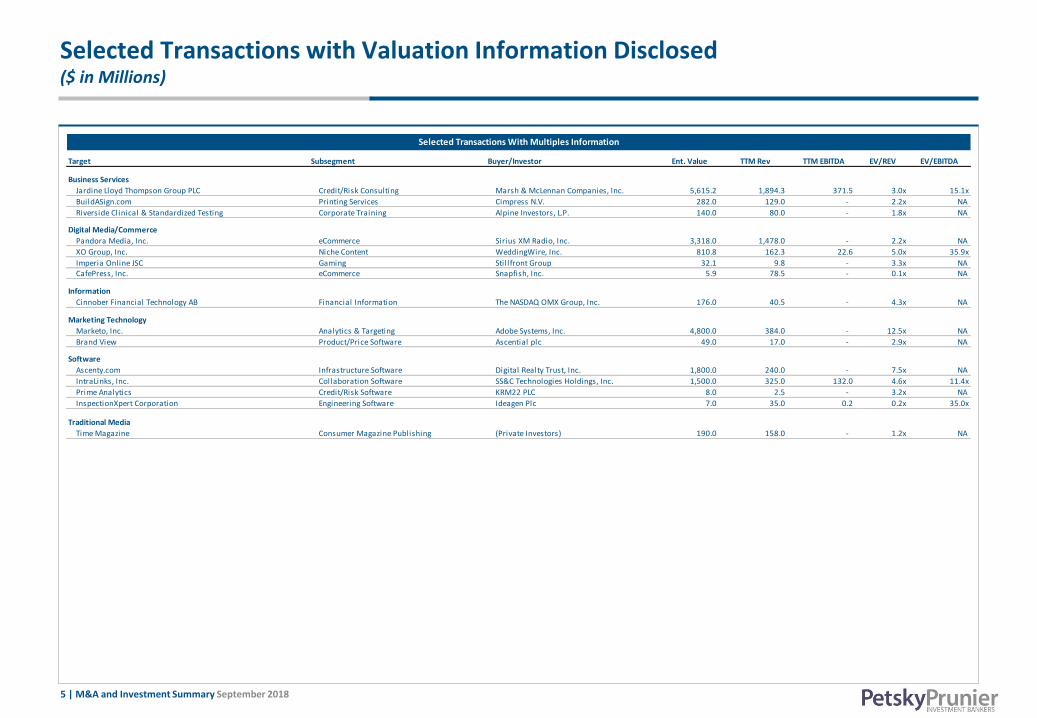
Selected Transactions with Valuation Information Disclosed($ in Millions)
Target Subsegment Buyer/Investor Ent. Value TTM Rev TTM EBITDA EV/REV EV/EBITDA
Business Services
Jardine Lloyd Thompson Group PLC Credit/Risk Consulting Marsh & McLennan Companies, Inc. 5,615.2 1,894.3 371.5 3.0x 15.1x
BuildASign.com Printing Services Cimpress N.V. 282.0 129.0 - 2.2x NA
Riverside Clinical & Standardized Testing Corporate Training Alpine Investors, L.P. 140.0 80.0 - 1.8x NA
Digital Media/Commerce
Pandora Media, Inc. eCommerce Sirius XM Radio, Inc. 3,318.0 1,478.0 - 2.2x NA
XO Group, Inc. Niche Content WeddingWire, Inc. 810.8 162.3 22.6 5.0x 35.9x
Imperia Online JSC Gaming Stil lfront Group 32.1 9.8 - 3.3x NA CafePress, Inc. eCommerce Snapfish, Inc. 5.9 78.5 - 0.1x NA
Information
Cinnober Financial Technology AB Financial Information The NASDAQ OMX Group, Inc. 176.0 40.5 - 4.3x NA NA
Marketing Technology
Marketo, Inc. Analytics & Targeting Adobe Systems, Inc. 4,800.0 384.0 - 12.5x NA
Brand View Product/Price Software Ascential plc 49.0 17.0 - 2.9x NA
Software
Ascenty.com Infrastructure Software Digital Realty Trust, Inc. 1,800.0 240.0 - 7.5x NA
IntraLinks, Inc. Collaboration Software SS&C Technologies Holdings, Inc. 1,500.0 325.0 132.0 4.6x 11.4x
Prime Analytics Credit/Risk Software KRM22 PLC 8.0 2.5 - 3.2x NA
InspectionXpert Corporation Engineering Software Ideagen Plc 7.0 35.0 0.2 0.2x 35.0x
Traditional Media
Time Magazine Consumer Magazine Publishing (Private Investors) 190.0 158.0 - 1.2x NA
Selected Transactions With Multiples Information
6 | M&A and Investment Summary September 2018
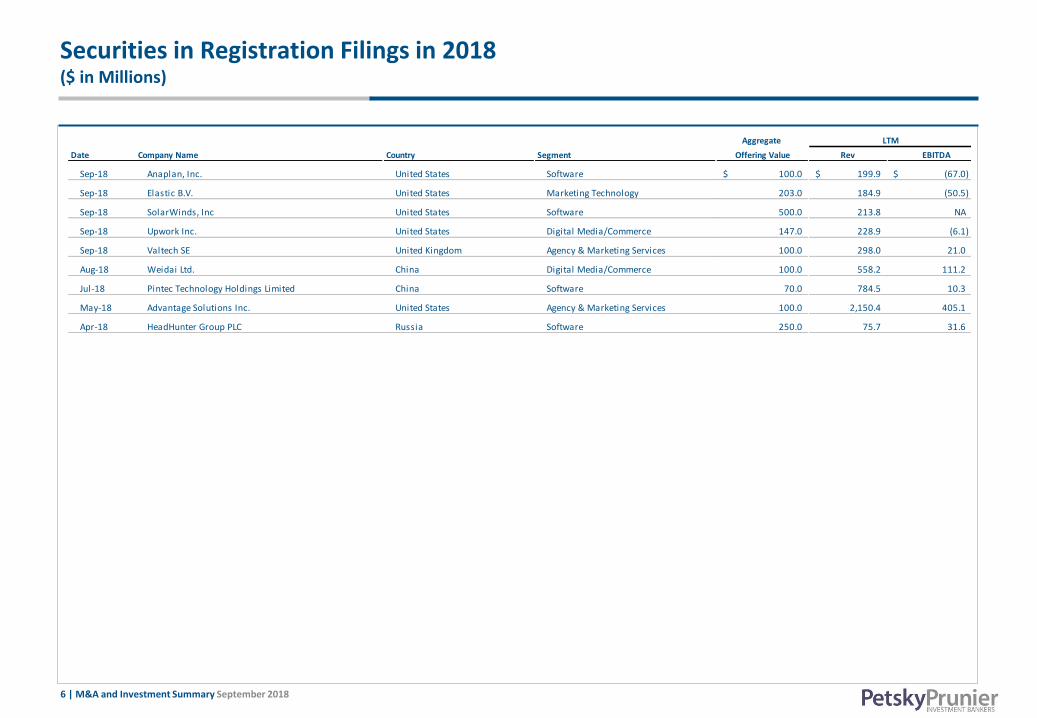
Securities in Registration Filings in 2018($ in Millions)
Aggregate
Date Company Name Country Segment Offering Value Rev EBITDA
Sep-18 Anaplan, Inc. United States Software 100.0$ 199.9$ (67.0)$
Sep-18 Elastic B.V. United States Marketing Technology 203.0 184.9 (50.5)
Sep-18 SolarWinds, Inc United States Software 500.0 213.8 NA
Sep-18 Upwork Inc. United States Digital Media/Commerce 147.0 228.9 (6.1)
Sep-18 Valtech SE United Kingdom Agency & Marketing Services 100.0 298.0 21.0
Aug-18 Weidai Ltd. China Digital Media/Commerce 100.0 558.2 111.2
Jul-18 Pintec Technology Holdings Limited China Software 70.0 784.5 10.3
May-18 Advantage Solutions Inc. United States Agency & Marketing Services 100.0 2,150.4 405.1
Apr-18 HeadHunter Group PLC Russia Software 250.0 75.7 31.6
LTM

7 | M&A and Investment Summary September 2018
Initial Offering Final Price Stock Price at Close Stock Price on % Change from
Date Ticker PPLLC Segment Company Name Country Price Range Per Share on 1st Trading Day Sep 30, 2018 1st Trading Day
Sep-18 CTK Marketing Technology CooTek (Cayman) Inc. China $12.00-$14.00 12.00 $9.44, down 21.3% 9.44 0.0%
Sep-18 EB Marketing Technology Eventbri te, Inc. United States 19.00-21.00 23.00 36.5, up 58.7% 37.97 4.0%
Sep-18 FTCH Digi ta l Media/Commerce Farfetch Limited United Kingdom 17.00-19.00 20.00 28.45, up 42.3% 27.23 (4.3%)
Sep-18 NYSE: LAIX Digi ta l Media/Commerce LAIX Inc. China 11.50-13.50 12.50 12.65, up 1.2% 12.55 (0.8%)
Sep-18 Qtt Digi ta l Media/Commerce Qutoutiao Inc. China 7.00-9.00 7.00 15.97, up 128.1% 7.13 (55.4%)
Sep-18 SVMK Marketing Technology SVMK Inc. United States 9.00-11.00 12.00 17.24, up 43.7% 16.03 (7.0%)
Jul -18 JG Software Aurora Mobi le Limited China 8.50-10.50 8.50 $8.80, up 3.5% 6.86 (22.0%)
Jul -18 CANG Digi ta l Media/Commerce Cango Inc. China 10.00-12.00 11.00 12.52, up 13.8% 11.33 (9.5%)
Jul -18 DAVA Bus iness Services Endava plc United Kingdom 17.00-19.00 20.00 25.2, up 26.0% 28.53 13.2%
Jul -18 OPRA Digi ta l Media/Commerce Opera Limited Norway 10.00-12.00 12.00 13.11, up 9.3% 8.99 (31.4%)
Jul -18 PDD Digi ta l Media/Commerce Pinduoduo Inc. China 16.00-19.00 19.00 26.70, up 40.5% 26.29 (1.5%)
Jul -18 TENB Software Tenable Holdings , Inc. United States 20.00-22.00 23.00 30.25, up 31.5% 38.88 28.5%
Jun-18 NYSE:AVLR Software Avalara , Inc. United States 21.00-23.00 24.00 44.94, up 87.3% 34.93 (22.3%)
Jun-18 NasdaqGM:DOMO Software Domo, Inc. United States 19.00-22.00 21.00 27.30, up 30.0% 21.45 (21.4%)
Jun-18 NasdaqGM:EVER Digi ta l Advertis ing EverQuote, Inc. United States 15.00-17.00 18.00 18.02, up 0.1% 14.86 (17.5%)
Jun-18 NasdaqGS:IIIV Software i3 Vertica ls , Inc. United States 11.00-13.00 13.00 18.35, up 41.2% 22.98 25.2%
Jun-18 NasdaqGS:UXIN Digi ta l Media/Commerce Uxin Limited China 10.50-12.50 9.00 9.67, up 7.4% 6.79 (29.8%)
May-18 NasdaqGS:GSKY Software GreenSky, Inc. United States 21.00-23.00 23.00 25.36, up 10.3% 18.00 (29.0%)
May-18 NasdaqGM:EVOP Software EVO Payments , Inc. United States 14.00-16.00 16.00 19.02, up 18.9% 23.90 25.7%
May-18 NYSE:HUYA Digi ta l Media/Commerce HUYA Inc. China 10.00-12.00 12.00 16.06, up 33.8% 23.58 46.8%
May-18 NasdaqGS:PS Software Plura ls ight, Inc. United States 12.00-14.00 15.00 20.00, up 33.3% 32.00 60.0%
May-18 NasdaqGS:CBLK Software Carbon Black, Inc. United States 15.00-17.00 19.00 23.94, up 26.0% 21.18 (11.5%)
Apr-18 NYSE:CDAY Software Ceridian HCM Holding Inc. United States 19.00-21.00 22.00 28.90, up 31.4% 42.03 45.4%
Apr-18 NasdaqGS:DOCU Software DocuSign, Inc. United States 26.00-28.00 29.00 39.73, up 37.0% 52.57 32.3%
Apr-18 NYSE:PVTL Software Pivota l Software, Inc. United States 14.00-16.00 15.00 15.73, up 4.9% 19.58 24.5%
Apr-18 NYSE:SMAR Software Smartsheet Inc. United States 12.00-14.00 15.00 19.55, up 30.3% 31.26 59.9%
Apr-18 NYSE:ZUO Marketing Technology Zuora, Inc. United States 11.00-13.00 14.00 20.00, up 42.8% 23.11 15.6%
Mar-18 NasdaqGS:BILI Digi ta l Media/Commerce Bi l ibi l i Inc. China 10.50-12.50 11.50 11.24, down 2.2% 13.48 19.9%
Mar-18 NasdaqGS:DBX Software Dropbox, Inc. United States 18.00-20.00 21.00 28.48, up 35.6% 26.83 (5.8%)
Mar-18 NasdaqGS:IQ Digi ta l Media/Commerce iQIYI, Inc. China 17.00-19.00 18.00 15.55, down 13.6% 27.07 74.1%
Mar-18 NasdaqGS:ZS Software Zsca ler, Inc. United States 13.00-15.00 16.00 33.00, up 106.3% 40.78 23.6%
Feb-18 NasdaqGM:CDLX Software Cardlytics , Inc. United States 13.00-15.00 13.00 13.37, up 2.8% 25.04 87.3%
LTM IPO Performance
8 | M&A and Investment Summary September 2018
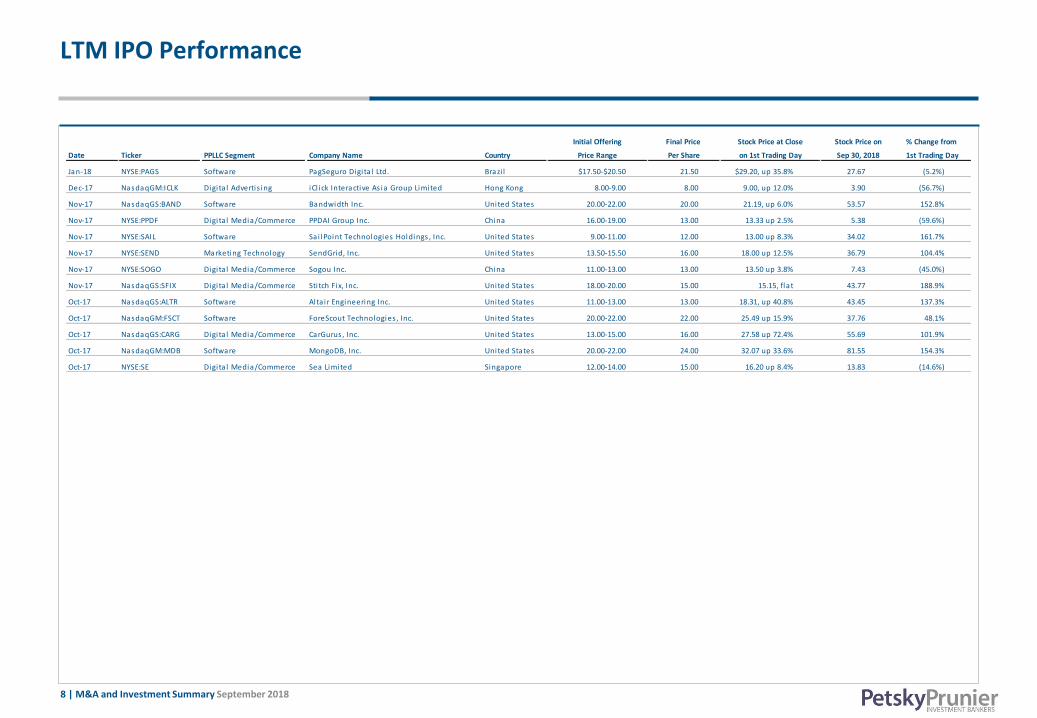
LTM IPO Performance
Initial Offering Final Price Stock Price at Close Stock Price on % Change from
Date Ticker PPLLC Segment Company Name Country Price Range Per Share on 1st Trading Day Sep 30, 2018 1st Trading Day
Jan-18 NYSE:PAGS Software PagSeguro Digi ta l Ltd. Brazi l $17.50-$20.50 21.50 $29.20, up 35.8% 27.67 (5.2%)
Dec-17 NasdaqGM:ICLK Digi ta l Advertis ing iCl ick Interactive As ia Group Limited Hong Kong 8.00-9.00 8.00 9.00, up 12.0% 3.90 (56.7%)
Nov-17 NasdaqGS:BAND Software Bandwidth Inc. United States 20.00-22.00 20.00 21.19, up 6.0% 53.57 152.8%
Nov-17 NYSE:PPDF Digi ta l Media/Commerce PPDAI Group Inc. China 16.00-19.00 13.00 13.33 up 2.5% 5.38 (59.6%)
Nov-17 NYSE:SAIL Software Sai lPoint Technologies Holdings , Inc. United States 9.00-11.00 12.00 13.00 up 8.3% 34.02 161.7%
Nov-17 NYSE:SEND Marketing Technology SendGrid, Inc. United States 13.50-15.50 16.00 18.00 up 12.5% 36.79 104.4%
Nov-17 NYSE:SOGO Digita l Media/Commerce Sogou Inc. China 11.00-13.00 13.00 13.50 up 3.8% 7.43 (45.0%)
Nov-17 NasdaqGS:SFIX Digi ta l Media/Commerce Sti tch Fix, Inc. United States 18.00-20.00 15.00 15.15, flat 43.77 188.9%
Oct-17 NasdaqGS:ALTR Software Alta i r Engineering Inc. United States 11.00-13.00 13.00 18.31, up 40.8% 43.45 137.3%
Oct-17 NasdaqGM:FSCT Software ForeScout Technologies , Inc. United States 20.00-22.00 22.00 25.49 up 15.9% 37.76 48.1%
Oct-17 NasdaqGS:CARG Digi ta l Media/Commerce CarGurus , Inc. United States 13.00-15.00 16.00 27.58 up 72.4% 55.69 101.9%
Oct-17 NasdaqGM:MDB Software MongoDB, Inc. United States 20.00-22.00 24.00 32.07 up 33.6% 81.55 154.3%
Oct-17 NYSE:SE Digi ta l Media/Commerce Sea Limited Singapore 12.00-14.00 15.00 16.20 up 8.4% 13.83 (14.6%)

9 | M&A and Investment Summary September 2018
Digital Media/Commerce
▪ Of the 137 transactions recorded in the Digital Media/Commerce segment in September, 93 announced $10.1 billion in reported value
▪ eCommerce was the most active subsegment across all subsegments with 71 transactions announced, of which 50 were reported for
$6.6 billion, including:
• Postmates’ $300 million investment from Tiger Global Management, valuing the company at $1.2 billion
• The $220 million acquisition of Latin America online grocery delivery marketplace Cornershop by Walmart
▪ Select Digital Media/Commerce transactions include:
• The $400 million investments received by online real estate platforms Compass and Opendoor from SoftBank
• Online used car sales company Shift’s $140 million investment from Lithia, Alliance Ventures, BMW iVentures, DCM, DFJ, G2VP, and Goldman Sachs Investment Partners.
• iHeartMedia’s $55 million acquisition of podcast content publisher Stuff Media
• Housing rental app Zumper’s $46 million round of funding from Axel Springer, Stereo Capital, Dawn Capital, Kleiner Perkins Caufield & Byers, Byer Capital, and Goodwater Capital
# % $MM % # $MM # $MM # $MM
eCommerce 71 52% $6,638.1 65% 17 $3,713.8 3 250.0 51 $2,674.3
Digital Marketplace 21 15% 1,651.1 16% 2 - 2 - 17 1,651.1
Niche Content 19 14% 978.8 10% 10 865.8 0 - 9 113.0
Gaming 10 7% 670.7 7% 6 467.1 0 - 4 203.6
Mobile Content/Apps 10 7% 87.9 1% 1 - 0 - 9 87.9
Social Media/Apps 5 4% 116.6 1% 0 - 0 - 5 116.6
Total 137 100% 10,143.2 100% 37 5,046.7 5 250.0 95 4,846.5
BUYER/INVESTOR BREAKDOWN
Transactions Reported Value Strategic Buyout Venture/Growth Capital
DIGITAL MEDIA/COMMERCE TRANSACTIONS BY SEGMENT

10 | M&A and Investment Summary September 2018
Digital MediaPublic Company Valuation (1/2)
*Note: Alphabet Inc. pricing represents (Nasdaq:GOOGL)
($ in Millions, except stock price data)
Stock Price Chg % From Equity Ent. LTM LTM Margin LTM LTM Multiples
Company Name 09/28/18 52WK High Value Value Revenue EBITDA EBITDA Rev Growth EV/Rev EV/EBITDA
Alphabet Inc. $1,207.08 -7% $ 834,976.8 $ 736,703.8 $ 123,898.0 $ 38,205.0 30.8% 24.8% 5.9x 19.3x
Apple Inc. 225.74 -2% 1,090,308.4 1,133,938.4 255,274.0 78,533.0 30.8% 14.2% 4.4x 14.4x
Facebook, Inc. 164.46 -25% 474,832.0 432,644.0 48,497.0 27,395.0 56.5% 46.2% 8.9x 15.8x
Fitbit, Inc. 5.35 -31% 1,312.7 732.3 1,510.5 (141.1) NM -12.7% 0.5x NM
Glu Mobile Inc. 7.45 -4% 1,056.4 991.4 333.0 (40.7) NM 49.2% 3.0x NM
GoPro, Inc. 7.20 -37% 1,004.4 999.1 1,149.6 (90.7) NM -11.3% 0.9x NM
IAC/InterActiveCorp 216.72 -3% 18,034.8 19,002.2 3,833.2 510.3 13.3% 23.5% 5.0x 37.2x
j2 Global, Inc. 82.85 -10% 4,079.8 4,730.1 1,158.5 421.8 36.4% 17.0% 4.1x 11.2x
Leaf Group Ltd. 10.00 -17% 235.0 203.1 141.3 (14.3) NM 19.9% 1.4x NM
The Meet Group, Inc. 4.95 -7% 362.1 389.6 152.8 23.0 15.0% 56.2% 2.5x 17.0x
Netflix, Inc. 374.13 -12% 162,917.7 167,353.4 13,878.7 1,439.8 10.4% 36.2% 12.1x NM
Pandora Media, Inc. 9.51 -6% 2,565.2 2,900.4 1,478.0 (272.5) NM 2.8% 2.0x NM
RealNetworks, Inc. 2.94 -41% 110.6 68.4 72.8 (17.5) NM 12.3% 0.9x NM
Remark Holdings, Inc. 3.19 -79% 111.0 141.9 75.5 (30.1) NM 20.5% 1.9x NM
Roku, Inc. 73.03 -4% 7,746.9 7,572.7 606.4 0.2 0.0% 39.1% 12.5x NM
Snap Inc. 8.48 -60% 10,832.0 9,278.3 986.6 (1,449.0) NM 57.8% 9.4x NM
TheStreet, Inc. 2.20 -12% 109.1 66.5 61.2 2.9 4.8% 4.4% 1.1x 22.9x
Twitter, Inc. 28.46 -40% 21,485.88 18,520.95 2,696.61 586.07 21.7% 9.8% 6.9x 31.6x
XO Group Inc. 34.48 -4% 868.1 751.3 162.3 22.7 14.0% 3.0% 4.6x 33.1x
Zynga Inc. 4.01 -12% 3,449.3 3,057.1 883.2 78.5 8.9% 13.7% 3.5x 39.0x
Average 4.3x 26.3x
US-Based Digital Media and Internet

11 | M&A and Investment Summary September 2018
Digital Media Public Company Valuation (2/2)
($ in Millions, except stock price data)
Stock Price Chg % From Equity Ent. LTM LTM Margin LTM LTM Multiples
Company Name Headquarters 09/28/18 52WK High Value Value Revenue EBITDA EBITDA Rev Growth EV/Rev EV/EBITDA
Baidu, Inc. China $228.68 -20% $ 80,062.5 $ 70,894.5 $ 14,189.1 $ 4,794.5 33.8% 26.5% 5.0x 14.8x
Bilibili Inc. * China 13.48 -41% 3,753.9 3,153.8 507.0 15.2 3.0% 0.0% 6.2x NM
CooTek (Cayman) Inc. * China 9.44 -18% 210.7 341.1 78.5 (3.1) NM 0.0% 4.3x NM
CyberAgent, Inc. Japan 53.31 -13% 6,707.4 6,523.3 3,733.6 406.2 10.9% 16.5% 1.7x 16.1x
DeNA Co., Ltd. Japan 17.69 -30% 2,568.6 1,711.8 1,234.7 355.8 28.8% -3.6% 1.4x 4.8x
G5 Entertainment AB (publ) Sweden 34.31 -49% 308.2 296.1 155.4 17.0 10.9% 69.5% 1.9x 17.4x
Gree, Inc. Japan 4.72 -34% 1,113.3 345.0 703.0 97.5 13.9% 19.2% 0.5x 3.5x
HolidayCheck Group AG * Germany 3.67 -20% 208.7 178.5 159.5 3.3 2.1% 17.0% 1.1x 53.7x
HUYA Inc. * China 23.58 -54% 4,805.5 3,972.4 484.4 (0.8) NM 0.0% 8.2x NM
International Game Technology PLC United Kingdom 19.75 -36% 4,033.0 12,310.4 4,976.2 1,487.4 29.9% 0.3% 2.5x 8.3x
iQIYI, Inc. China 27.07 -41% 19,299.9 17,470.5 3,144.6 1,006.1 32.0% 0.0% 5.6x 17.4x
LAIX Inc. * China 12.55 -4% 601.8 649.3 54.1 (51.9) NM 0.0% 12.0x NM
mixi, Inc. Japan 24.02 -58% 1,879.2 630.1 1,582.7 653.0 41.3% -15.7% 0.4x 1.0x
Meitu, Inc. * China 0.70 -58% 2,923.5 2,357.1 664.7 (59.0) NM 38.7% 3.5x NM
NCSOFT Corporation South Korea 398.64 -11% 8,471.2 7,259.3 1,952.7 814.9 41.7% 117.2% 3.7x 8.9x
NAVER Corporation South Korea 645.03 -27% 18,581.6 16,630.5 4,620.0 1,192.4 25.8% 19.2% 3.6x 13.9x
NetEase, Inc. China 228.25 -40% 29,975.8 25,470.0 8,693.0 1,335.4 15.4% 19.1% 2.9x 19.1x
NEXON Co., Ltd. Japan 13.09 -26% 11,695.3 8,030.2 2,268.0 1,109.2 48.9% 20.1% 3.5x 7.2x
Opera Limited Norway 8.99 -42% 986.4 948.3 156.2 39.6 25.4% 0.0% 6.1x 23.9x
Pacific Online Limited China 0.14 -35% 148.7 97.7 147.6 19.3 13.1% 3.0% 0.7x 5.1x
Phoenix New Media Limited * China 4.22 -48% 307.0 199.4 231.8 5.1 2.2% 5.1% 0.9x 38.7x
Renren Inc. * China 1.41 -92% 97.3 205.2 436.7 (111.4) NM 435.9% 0.5x NM
Sea Limited * Singapore 13.83 -20% 4,633.5 4,305.0 557.5 (716.2) NM 48.9% 7.7x NM
Sogou Inc. China 7.43 -52% 2,874.2 1,830.3 1,084.9 147.2 13.6% 52.6% 1.7x 12.4x
Spotify Technology S.A. * Luxembourg 180.83 -9% 32,509.3 30,859.5 5,358.8 (295.2) NM 0.0% 5.8x NM
Weibo Corporation * China 73.13 -49% 16,286.5 15,599.7 1,474.0 544.1 36.9% 75.0% 10.6x 28.7x
Wemade Entertainment Co.,Ltd. South Korea 27.93 -50% 463.7 335.2 104.6 17.7 16.9% 9.7% 3.2x 18.9x
Yandex N.V. Netherlands 32.89 -26% 10,777.7 10,018.6 1,714.9 386.1 22.5% 27.8% 5.8x 25.9x
YY Inc. China 74.92 -48% 4,740.3 3,176.0 2,075.9 455.7 22.0% 45.4% 1.5x 7.0x
Average 3.4x 16.0x
Internationally-based Digital Media and Internet

12 | M&A and Investment Summary September 2018
eCommercePublic Company Valuation (1/2)
($ in Millions, except stock price data)
Stock Price Chg % From Equity Ent. LTM LTM Margin LTM LTM Multiples
Company Name 09/28/18 52WK High Value Value Revenue EBITDA EBITDA Rev Growth EV/Rev EV/EBITDA
1-800-FLOWERS.COM, Inc. $11.80 -21% $ 762.2 $ 717.3 $ 1,151.9 $ 74.7 6.5% -3.5% 0.6x 9.6x
Alphabet Inc. 1,207.08 -7% 834,976.8 736,703.8 123,898.0 38,205.0 30.8% 24.8% 5.9x 19.3x
Amazon.com, Inc. 2,003.00 -2% 976,945.6 995,684.6 208,125.0 20,631.0 9.9% 38.6% 4.8x 48.3x
Apple Inc. 225.74 -2% 1,090,308.4 1,133,938.4 255,274.0 78,533.0 30.8% 14.2% 4.4x 14.4x
Blucora, Inc. 40.25 -3% 1,917.7 2,106.3 551.8 105.0 19.0% 12.3% 3.8x 20.1x
Blue Apron Holdings, Inc. 1.72 -69% 331.1 344.9 774.5 (119.9) NM -14.3% 0.4x NM
Booking Holdings Inc. 1,984.00 -11% 94,184.5 95,615.0 13,702.4 5,463.1 39.9% 19.3% 7.0x 17.5x
CarGurus, Inc. 55.69 -3% 6,096.1 5,954.3 382.6 12.9 3.4% 48.8% 15.6x NM
Carvana Co. 59.09 -19% 2,024.2 2,549.5 1,326.1 (162.0) NM 131.0% 1.9x NM
CDW Corporation 88.92 -2% 13,459.3 16,986.5 15,836.4 1,198.5 7.6% 10.4% 1.1x 14.2x
Chegg, Inc. 28.43 -13% 3,239.9 3,050.6 287.3 10.8 3.7% 13.4% 10.6x NM
Copart, Inc. 51.53 -23% 11,969.3 12,094.7 1,805.7 664.1 36.8% 24.7% 6.7x 18.2x
GrubHub Inc. 138.62 -7% 12,539.8 12,180.2 840.5 175.3 20.9% 46.0% 14.5x 69.5x
eBay Inc. 33.02 -30% 32,674.9 37,908.9 10,065.0 3,001.0 29.8% 7.8% 3.8x 12.6x
Etsy, Inc. 51.38 -4% 6,152.9 5,861.7 495.9 75.9 15.3% 25.1% 11.8x 77.2x
EVINE Live Inc. 1.15 -34% 76.3 116.9 650.2 15.4 2.4% 0.4% 0.2x 7.6x
Expedia Group, Inc. 130.48 -15% 19,500.4 20,773.4 10,672.8 1,157.8 10.8% 13.0% 1.9x 17.9x
FTD Companies, Inc. 2.63 -81% 73.5 242.7 1,057.5 28.9 2.7% -3.7% 0.2x 8.4x
GrubHub Inc. 138.62 -7% 12,539.8 12,180.2 840.5 175.3 20.9% 46.0% 14.5x 69.5x
IAC/InterActiveCorp 216.72 -3% 18,034.8 19,002.2 3,833.2 510.3 13.3% 23.5% 5.0x 37.2x
Liberty TripAdvisor Holdings, Inc. 14.85 -19% 1,113.3 4,227.3 1,571.0 225.0 14.3% -0.7% 2.7x 18.8x
Liquidity Services, Inc. 6.35 -21% 204.0 110.6 233.2 (19.5) NM -18.8% 0.5x NM
Match Group, Inc. 57.91 -5% 16,034.9 16,998.5 1,550.9 514.6 33.2% 30.2% 11.0x 33.0x
Overstock.com, Inc. 27.70 -69% 803.6 732.1 1,808.8 (138.7) NM -1.3% 0.4x NM
PetMed Express, Inc. 33.01 -43% 676.6 582.1 281.5 55.6 19.8% 9.8% 2.1x 10.5x
Qurate Retail, Inc. $22.21 -6% 10,195.9 17,347.9 12,188.0 1,824.0 15.0% 18.9% 1.4x 9.5x
Shutterfly, Inc. 65.89 -34% 2,203.5 3,225.4 1,432.3 207.0 14.5% 24.6% 2.3x 15.6x
Shutterstock, Inc. 54.58 -2% 1,908.3 1,618.5 602.5 47.5 7.9% 16.4% 2.7x 34.1x
Spark Networks SE 11.40 -26% 148.1 152.6 112.6 (3.1) NM 20.7% 1.4x NM
Stamps.com Inc. 226.20 -21% 4,106.60 3,905.33 520.72 204.67 39.3% 24.1% 7.5x 19.1x
Stitch Fix, Inc. 43.77 -17% 4,283.7 3,996.4 1,166.5 44.9 3.8% 26.3% 3.4x 89.0x
U.S. Auto Parts Network, Inc. 1.55 -51% 54.2 56.9 297.7 10.3 3.5% -2.6% 0.2x 5.5x
Wayfair Inc. 147.67 -2% 13,242.5 13,150.5 5,696.7 (263.6) NM 45.0% 2.3x NM
Average 4.2x 19.3x
US-based eCommerce

13 | M&A and Investment Summary September 2018
eCommercePublic Company Valuation (2/2)
($ in Millions, except stock price data)
Internationally-based eCommerce
Stock Price Chg % From Equity Ent. LTM LTM Margin LTM LTM Multiples
Company Name Headquarters 09/28/18 52WK High Value Value Revenue EBITDA EBITDA Rev Growth EV/Rev EV/EBITDA
58.com Inc. China $73.60 -18% $ 10,855.2 $ 10,276.0 $ 1,720.5 $ 392.2 22.8% 30.6% 6.0x 26.2x
Alibaba Group Holding Limited * China 164.76 -22% 423,751.2 428,653.0 42,451.3 12,745.9 30.0% 59.4% 10.1x 33.6x
Cango Inc. * China 11.33 -18% 1,712.0 2,068.0 162.4 55.4 34.1% 0.0% 12.7x 37.3x
Cnova N.V. * France 4.79 -14% 1,649.1 1,961.0 2,619.8 11.2 0.4% 21.8% 0.7x NM
Despegar.com, Corp. Argentina 16.87 -54% 1,165.7 798.4 552.3 77.8 14.1% 18.6% 1.4x 10.3x
Farfetch Limited * United Kingdom 27.23 -16% 7,974.6 8,379.5 480.9 (131.4) NM 0.0% 17.4x NM
JD.com, Inc. * China 26.09 -49% 37,733.1 36,044.9 62,895.5 314.8 0.5% 34.2% 0.6x NM
Jumei International Holding Limited * China 2.13 -47% 319.7 (90.0) 769.8 (10.7) NM -14.4% NM 8.4x
LightInTheBox Holding Co., Ltd. * China 0.83 -76% 56.2 15.4 294.2 (22.7) NM -5.3% 0.1x NM
MercadoLibre, Inc. * Argentina 340.47 -19% 15,034.3 14,955.7 1,500.9 35.4 2.4% 44.2% 10.0x NM
Netshoes (Cayman) Limited * Brazil 2.34 -83% 72.7 138.9 488.1 (21.8) NM 1.8% 0.3x NM
PChome Online Inc. * Taiwan 4.54 -27% 532.2 314.7 1,039.9 (61.0) NM 18.4% 0.3x NM
Pinduoduo Inc. * China 26.29 -14% 29,123.7 29,217.3 860.5 (1,065.3) NM 0.0% 34.0x NM
Rakuten, Inc. Japan 7.67 -32% 10,358.2 13,917.5 9,171.3 1,723.5 18.8% 19.2% 1.5x 8.1x
Secoo Holding Limited * China 12.70 -18% 642.1 646.2 667.2 20.6 3.1% 51.9% 1.0x 31.3x
Travelport Worldwide Limited United Kingdom 16.87 -17% 2,129.1 4,220.5 2,524.3 416.5 16.5% 5.2% 1.7x 10.1x
trivago N.V. * Germany 6.16 -47% 2,160.9 2,045.9 1,124.4 (89.3) NM -1.8% 1.8x NM
Uxin Limited * China 6.79 -35% 1,985.4 2,132.1 381.7 (403.6) NM 0.0% 5.6x NM
Vipshop Holdings Limited China 6.24 -67% 4,130.1 3,896.9 12,093.5 523.5 4.3% 24.2% 0.3x 7.4x
X Financial China 9.00 -56% 1,359.4 1,265.8 457.8 210.7 46.0% 0.0% 2.8x 6.0x
Average 4.6x 17.1x

14 | M&A and Investment Summary September 2018
Digital Advertising
▪ A total of 21 transactions were announced in the Digital Advertising segment, of which seven were valued at more than $160 million
▪ The four strategic acquisitions made in the Mobile Marketing subsegment is the largest single month of the past 24 months
▪ Select transactions:
• Advantage solutions acquisition of mobile video and branded content advertising company Jun Group Productions from Halyard
Capital (a Petsky Prunier led transaction)
• The $81 million round of funding received by travel metasearch platform Evaneos from Growth Fund, Level Equity, Quadrille Capital,
Xange, and Bpifrance
• Verve’s acquisition of in-app video advertising platform Receptiv for an undisclosed amount
• The acquisition of in-app header bidding solution MAX by AppLovin
• Canada-based insurance and financial products comparison company Kantix’s sale to Ontario Teachers’ Pension Plan
# % $MM % # $MM # $MM # $MM
Mobile Marketing 4 19% - 0% 4 - 0 - 0 -
Vertical Search 4 19% $130.2 80% 1 - 0 - 3 130.2
Online Lead Generation 3 14% 3.9 2% 2 - 0 - 1 3.9
Ad Networks/Exchanges 2 10% 2.5 2% 1 - 0 - 1 2.5
Comparison Shopping 2 10% 5.8 4% 1 5.8 1 - 0 -
Digital Promotion/Coupon 2 10% 20.0 12% 1 - 0 - 1 20.0
Search Marketing 2 10% - 0% 1 - 1 - 0 -
Affiliate/CPA Network 1 5% - 0% 1 - 0 - 0 -
Digital Video 1 5% - 0% 1 - 0 - 0 -
Total 21 100% 162.4 100% 13 5.8 2 0.0 6 156.6
DIGITAL ADVERTISING TRANSACTIONS BY SEGMENT BUYER/INVESTOR BREAKDOWN
Transactions Reported Value Strategic Buyout Venture/Growth Capital

15 | M&A and Investment Summary September 2018
Digital AdvertisingPublic Company Valuation (1/2)
($ in Millions, except stock price data)
US-based Digital Advertising
Stock Price Chg % From Equity Ent. LTM LTM Margin LTM LTM Multiples
Company Name 09/28/18 52WK High Value Value Revenue EBITDA EBITDA Rev Growth EV/Rev EV/EBITDA
Alliance Data Systems Corporation $236.16 -15% $ 12,975.5 $ 33,649.3 $ 7,806.7 $ 1,772.5 22.7% 5.3% 4.3x 19.0x
Alphabet Inc. 1,207.08 -7% 834,976.8 736,703.8 123,898.0 38,205.0 30.8% 24.8% 5.9x 19.3x
ANGI Homeservices Inc. 23.48 -2% 11,302.5 11,344.9 955.1 (19.7) NM 62.2% 11.9x NM
AutoWeb, Inc. 2.96 -70% 38.3 20.8 131.8 (3.3) NM -15.6% 0.2x NM
Care.com, Inc. 22.11 -4% 691.3 629.3 182.0 13.3 7.3% 7.3% 3.5x 47.3x
DHI Group, Inc. 2.10 -35% 112.8 121.8 188.0 26.9 14.3% -12.8% 0.6x 4.5x
EverQuote, Inc. 14.86 -33% 370.6 463.5 146.3 (3.7) NM 0.0% 3.2x NM
Facebook, Inc. 164.46 -25% 474,832.0 432,644.0 48,497.0 27,395.0 56.5% 46.2% 8.9x 15.8x
Fluent, Inc. 2.15 -69% 161.9 215.3 233.0 7.9 3.4% 12.8% 0.9x 27.3x
Groupon, Inc. 3.77 -37% 2,142.9 1,704.6 2,751.6 128.1 4.7% -6.0% 0.6x 13.3x
Inuvo, Inc. 0.62 -45% 20.0 20.2 83.6 (1.2) NM 15.1% 0.2x NM
LendingTree, Inc. 230.10 -43% 2,949.2 2,900.9 697.6 85.1 12.2% 45.1% 4.2x 34.1x
QuinStreet, Inc. 13.57 -17% 666.0 601.3 404.4 21.2 5.2% 34.9% 1.5x 28.4x
Quotient Technology Inc. * 15.50 -13% 1,474.2 1,266.9 351.4 16.0 4.6% 21.6% 3.6x 79.2x
Redfin Corporation 18.70 -41% 1,658.8 1,467.9 427.8 (19.3) NM 36.8% 3.4x NM
RhythmOne plc 2.90 -32% 227.4 239.5 255.1 5.8 2.3% 71.2% 0.9x 41.0x
Snap Inc. 8.48 -60% 10,832.0 9,278.3 986.6 (1,449.0) NM 57.8% 9.4x NM
Telaria, Inc. 3.79 -28% 200.4 135.5 49.8 (14.3) NM 46.0% 2.7x NM
The Rubicon Project, Inc. 3.60 -14% 181.7 77.4 120.1 (54.7) NM -47.2% 0.6x NM
The Trade Desk, Inc. * 150.91 -7% 6,476.6 6,334.9 380.1 90.4 23.8% 51.1% 16.7x 70.1x
TiVo Corporation 12.45 -38% 1,530.99 2,222.55 774.83 182.15 23.5% -5.5% 2.9x 12.2x
Travelzoo 11.85 -44% 145.6 126.1 110.6 7.3 6.6% 2.0% 1.1x 17.2x
TripAdvisor, Inc. 51.07 -18% 7,024.5 6,346.5 1,571.0 169.0 10.8% 2.5% 4.0x 37.6x
TrueCar, Inc. 14.10 -14% 1,439.2 1,270.0 334.5 (20.9) NM 9.0% 3.8x NM
Twitter, Inc. 28.46 -40% 21,485.9 18,520.9 2,696.6 586.1 21.7% 9.8% 6.9x 31.6x
Web.com Group, Inc. 27.90 -2% 1,349.6 1,962.8 750.8 142.0 18.9% 0.1% 2.6x 13.8x
Yelp Inc. * 49.20 -6% 4,116.8 3,313.5 896.6 39.3 4.4% 13.6% 3.7x 84.3x
Yext, Inc. 23.70 NA 2,336.5 2,211.7 198.5 (68.0) NM 36.5% 11.1x NM
Zillow Group, Inc. * 44.20 -32% 8,945.5 8,440.3 1,189.3 78.3 6.6% 23.3% 7.1x 107.8x
Average 3.7x 23.9x

16 | M&A and Investment Summary September 2018
Digital AdvertisingPublic Company Valuation (2/2)
($ in Millions, except stock price data)
Internationally-based Digital Advertising
Stock Price Chg % From Equity Ent. LTM LTM Margin LTM LTM Multiples
Company Name Headquarters 09/28/18 52WK High Value Value Revenue EBITDA EBITDA Rev Growth EV/Rev EV/EBITDA
Cliq Digital AG Germany $4.88 -57% $ 30.2 $ 40.1 $ 77.2 $ 3.4 4.4% -4.1% 0.5x 11.9x
Criteo S.A. France 22.94 -52% 1,537.1 1,078.6 2,339.4 255.2 10.9% 14.1% 0.5x 4.2x
iClick Interactive Asia Group Limited Hong Kong 3.90 -66% 188.1 172.4 147.4 (10.1) NM 39.3% 1.2x NM
MakeMyTrip Limited India 27.45 -34% 2,799.4 2,444.4 620.6 (175.3) NM 19.7% 3.9x NM
Matomy Media Group Ltd. Israel 0.40 -69% 38.8 64.6 177.3 10.2 5.8% -39.5% 0.4x 6.3x
Metaps Inc. Japan 20.59 -51% 277.2 239.3 186.2 (1.5) NM 52.1% 1.3x NM
Pacific Online Limited China 0.14 -35% 148.7 97.7 147.6 19.3 13.1% 3.0% 0.7x 5.1x
Perion Network Ltd. Israel 3.01 -26% 77.8 83.9 266.0 20.0 7.5% -8.5% 0.3x 4.2x
Rightmove plc * United Kingdom 6.14 -13% 5,507.1 5,488.3 336.3 251.4 74.7% 10.0% 16.3x 21.8x
Septeni Holdings Co., Ltd. Japan 1.57 -62% 198.2 71.5 138.8 15.2 10.9% 0.5% 0.5x 4.7x
Taptica International Ltd Israel 4.89 -28% 332.0 290.4 289.3 38.2 13.2% 107.0% 1.0x 7.6x
Tencent Holdings Limited * China 41.30 -32% 390,588.95 399,882.76 42,119.38 16,286.97 38.7% 46.4% 9.5x 24.6x
TradeDoubler AB (publ) Sweden 0.30 -34% 13.34 20.17 125.37 1.51 1.2% -11.5% 0.2x 13.3x
XLMedia PLC Jersey 1.22 -58% 268.8 227.9 128.8 39.4 30.6% 7.0% 1.8x 5.8x
Yandex N.V. * Netherlands 32.89 -26% 10,777.7 10,018.6 1,714.9 386.1 22.5% 27.8% 5.8x 25.9x
Average 2.4x 11.9x

17 | M&A and Investment Summary September 2018
Marketing Technology
▪ The Marketing Technology segment announced 101 transactions in September, of which 46 reported more than $7.2 billion in value
▪ Strategic acquisitions accounted for 42 percent of total monthly activity, consistent with average single month totals over the past
twelve months
▪ Select transactions:
• CI Capital Partner-backed Impact Group’s acquisition of AI-driven digital advertising platform Cluep (a Petsky Prunier-led transaction)
• Insight Venture Partners $80 million investment in business analytics platform Sisense
• The acquisition of price and product composition software Brand View by Ascential in a transaction valued at $49 million
• AR mapping and visual solutions company Blippar’s $37 million round of funding from Candy Ventures and Qualcomm Ventures
• Nielsen’s acquisition of video game media research company SuperData
• The acquisition of subscription model enablement platform Plasso and by GoDaddy
# % $MM % # $MM # $MM # $MM
Analytics & Targeting 17 17% $5,006.6 69% 4 $4,800.0 0 - 13 $206.6
CRM 12 12% 68.7 1% 6 10.0 1 - 5 58.7
Social Technology 9 9% 5.3 0% 5 - 1 - 3 5.3
Content Management 7 7% 1,120.2 15% 2 - 1 1,100.0 4 20.2
MRM/Workflow Management 7 7% 116.0 2% 3 108.0 1 - 3 8.0
Email/Messaging Software 6 6% 14.0 0% 4 - 0 - 2 14.0
Teleservices/eServices 5 5% 463.0 6% 2 - 2 - 1 463.0
Other 38 38% 444.6 6% 16 49.0 1 - 21 238.2
Total 101 100% 7,238.4 100% 42 4,967.0 7 1,100.0 52 1,171.4
MARKETING TECHNOLOGY TRANSACTIONS BY SEGMENT BUYER/INVESTOR BREAKDOWN
Transactions Reported Value Strategic Buyout Venture/Growth Capital
18 | M&A and Investment Summary September 2018
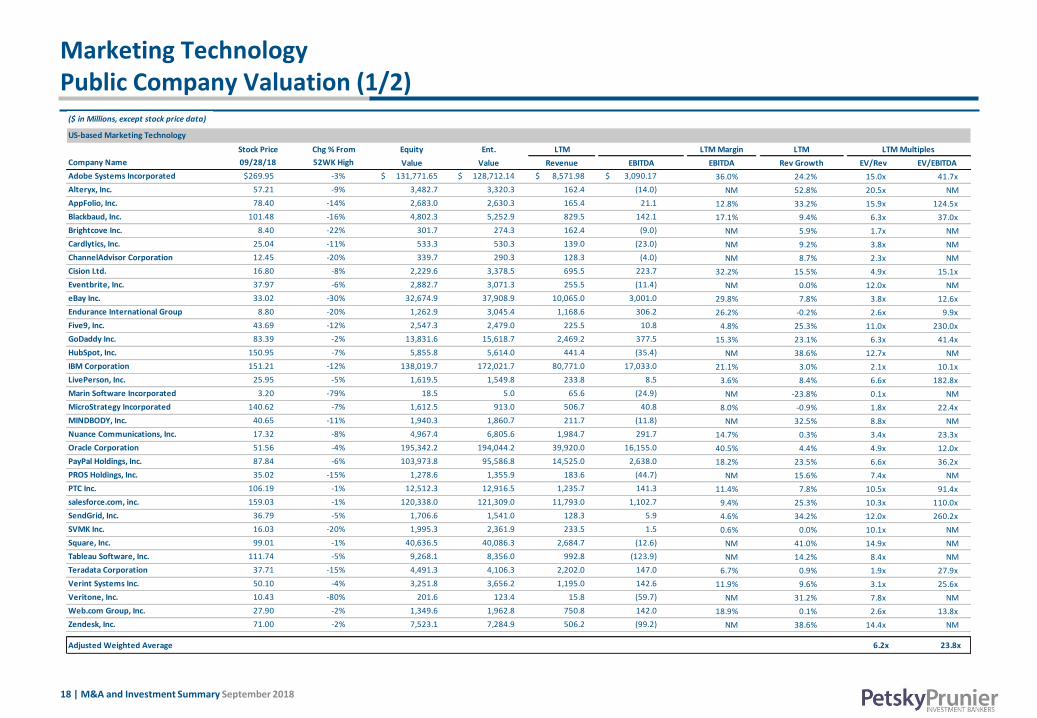
Marketing TechnologyPublic Company Valuation (1/2)
($ in Millions, except stock price data)
Stock Price Chg % From Equity Ent. LTM LTM Margin LTM LTM Multiples
Company Name 09/28/18 52WK High Value Value Revenue EBITDA EBITDA Rev Growth EV/Rev EV/EBITDA
Adobe Systems Incorporated $269.95 -3% $ 131,771.65 $ 128,712.14 $ 8,571.98 $ 3,090.17 36.0% 24.2% 15.0x 41.7x
Alteryx, Inc. 57.21 -9% 3,482.7 3,320.3 162.4 (14.0) NM 52.8% 20.5x NM
AppFolio, Inc. 78.40 -14% 2,683.0 2,630.3 165.4 21.1 12.8% 33.2% 15.9x 124.5x
Blackbaud, Inc. 101.48 -16% 4,802.3 5,252.9 829.5 142.1 17.1% 9.4% 6.3x 37.0x
Brightcove Inc. 8.40 -22% 301.7 274.3 162.4 (9.0) NM 5.9% 1.7x NM
Cardlytics, Inc. 25.04 -11% 533.3 530.3 139.0 (23.0) NM 9.2% 3.8x NM
ChannelAdvisor Corporation 12.45 -20% 339.7 290.3 128.3 (4.0) NM 8.7% 2.3x NM
Cision Ltd. 16.80 -8% 2,229.6 3,378.5 695.5 223.7 32.2% 15.5% 4.9x 15.1x
Eventbrite, Inc. 37.97 -6% 2,882.7 3,071.3 255.5 (11.4) NM 0.0% 12.0x NM
eBay Inc. 33.02 -30% 32,674.9 37,908.9 10,065.0 3,001.0 29.8% 7.8% 3.8x 12.6x
Endurance International Group
Holdings, Inc.
8.80 -20% 1,262.9 3,045.4 1,168.6 306.2 26.2% -0.2% 2.6x 9.9x
Five9, Inc. 43.69 -12% 2,547.3 2,479.0 225.5 10.8 4.8% 25.3% 11.0x 230.0x
GoDaddy Inc. 83.39 -2% 13,831.6 15,618.7 2,469.2 377.5 15.3% 23.1% 6.3x 41.4x
HubSpot, Inc. 150.95 -7% 5,855.8 5,614.0 441.4 (35.4) NM 38.6% 12.7x NM
IBM Corporation 151.21 -12% 138,019.7 172,021.7 80,771.0 17,033.0 21.1% 3.0% 2.1x 10.1x
LivePerson, Inc. 25.95 -5% 1,619.5 1,549.8 233.8 8.5 3.6% 8.4% 6.6x 182.8x
Marin Software Incorporated 3.20 -79% 18.5 5.0 65.6 (24.9) NM -23.8% 0.1x NM
MicroStrategy Incorporated 140.62 -7% 1,612.5 913.0 506.7 40.8 8.0% -0.9% 1.8x 22.4x
MINDBODY, Inc. 40.65 -11% 1,940.3 1,860.7 211.7 (11.8) NM 32.5% 8.8x NM
Nuance Communications, Inc. 17.32 -8% 4,967.4 6,805.6 1,984.7 291.7 14.7% 0.3% 3.4x 23.3x
Oracle Corporation 51.56 -4% 195,342.2 194,044.2 39,920.0 16,155.0 40.5% 4.4% 4.9x 12.0x
PayPal Holdings, Inc. 87.84 -6% 103,973.8 95,586.8 14,525.0 2,638.0 18.2% 23.5% 6.6x 36.2x
PROS Holdings, Inc. 35.02 -15% 1,278.6 1,355.9 183.6 (44.7) NM 15.6% 7.4x NM
PTC Inc. 106.19 -1% 12,512.3 12,916.5 1,235.7 141.3 11.4% 7.8% 10.5x 91.4x
salesforce.com, inc. 159.03 -1% 120,338.0 121,309.0 11,793.0 1,102.7 9.4% 25.3% 10.3x 110.0x
SendGrid, Inc. 36.79 -5% 1,706.6 1,541.0 128.3 5.9 4.6% 34.2% 12.0x 260.2x
SVMK Inc. 16.03 -20% 1,995.3 2,361.9 233.5 1.5 0.6% 0.0% 10.1x NM
Square, Inc. 99.01 -1% 40,636.5 40,086.3 2,684.7 (12.6) NM 41.0% 14.9x NM
Tableau Software, Inc. 111.74 -5% 9,268.1 8,356.0 992.8 (123.9) NM 14.2% 8.4x NM
Teradata Corporation 37.71 -15% 4,491.3 4,106.3 2,202.0 147.0 6.7% 0.9% 1.9x 27.9x
Verint Systems Inc. 50.10 -4% 3,251.8 3,656.2 1,195.0 142.6 11.9% 9.6% 3.1x 25.6x
Veritone, Inc. 10.43 -80% 201.6 123.4 15.8 (59.7) NM 31.2% 7.8x NM
Web.com Group, Inc. 27.90 -2% 1,349.6 1,962.8 750.8 142.0 18.9% 0.1% 2.6x 13.8x
Zendesk, Inc. 71.00 -2% 7,523.1 7,284.9 506.2 (99.2) NM 38.6% 14.4x NM
Adjusted Weighted Average 6.2x 23.8x
US-based Marketing Technology
19 | M&A and Investment Summary September 2018
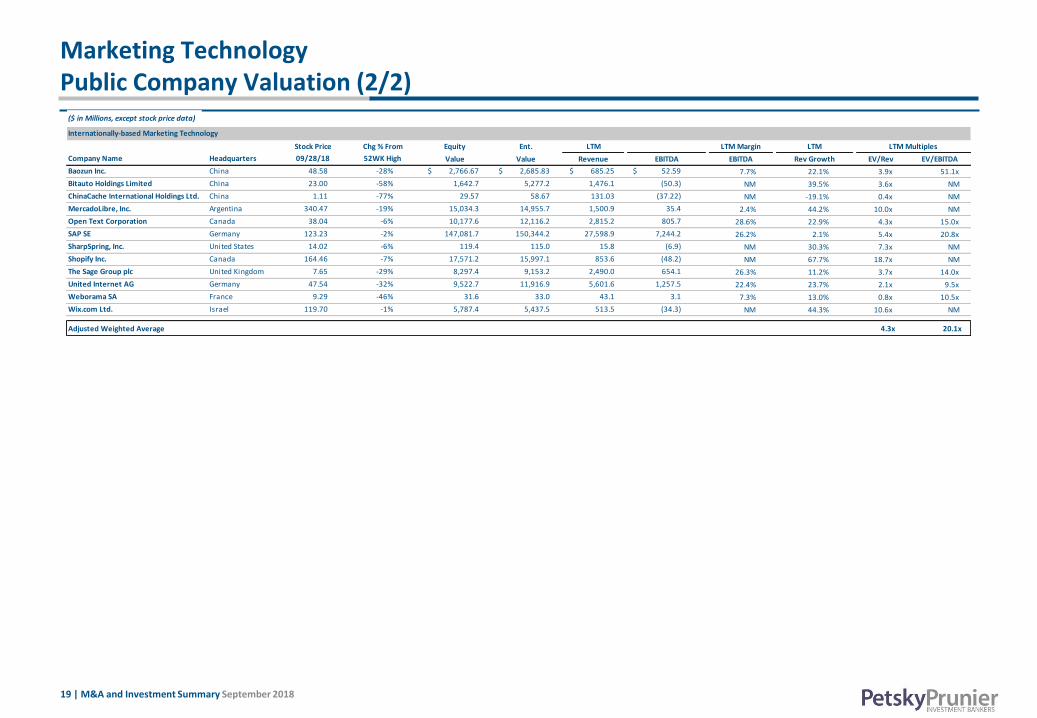
Marketing TechnologyPublic Company Valuation (2/2)
($ in Millions, except stock price data)
Stock Price Chg % From Equity Ent. LTM LTM Margin LTM LTM Multiples
Company Name Headquarters 09/28/18 52WK High Value Value Revenue EBITDA EBITDA Rev Growth EV/Rev EV/EBITDA
Baozun Inc. China 48.58 -28% $ 2,766.67 $ 2,685.83 $ 685.25 $ 52.59 7.7% 22.1% 3.9x 51.1x
Bitauto Holdings Limited China 23.00 -58% 1,642.7 5,277.2 1,476.1 (50.3) NM 39.5% 3.6x NM
ChinaCache International Holdings Ltd. China 1.11 -77% 29.57 58.67 131.03 (37.22) NM -19.1% 0.4x NM
MercadoLibre, Inc. Argentina 340.47 -19% 15,034.3 14,955.7 1,500.9 35.4 2.4% 44.2% 10.0x NM
Open Text Corporation Canada 38.04 -6% 10,177.6 12,116.2 2,815.2 805.7 28.6% 22.9% 4.3x 15.0x
SAP SE Germany 123.23 -2% 147,081.7 150,344.2 27,598.9 7,244.2 26.2% 2.1% 5.4x 20.8x
SharpSpring, Inc. United States 14.02 -6% 119.4 115.0 15.8 (6.9) NM 30.3% 7.3x NM
Shopify Inc. Canada 164.46 -7% 17,571.2 15,997.1 853.6 (48.2) NM 67.7% 18.7x NM
The Sage Group plc United Kingdom 7.65 -29% 8,297.4 9,153.2 2,490.0 654.1 26.3% 11.2% 3.7x 14.0x
United Internet AG Germany 47.54 -32% 9,522.7 11,916.9 5,601.6 1,257.5 22.4% 23.7% 2.1x 9.5x
Weborama SA France 9.29 -46% 31.6 33.0 43.1 3.1 7.3% 13.0% 0.8x 10.5x
Wix.com Ltd. Israel 119.70 -1% 5,787.4 5,437.5 513.5 (34.3) NM 44.3% 10.6x NM
Adjusted Weighted Average 4.3x 20.1x
Internationally-based Marketing Technology
20 | M&A and Investment Summary September 2018
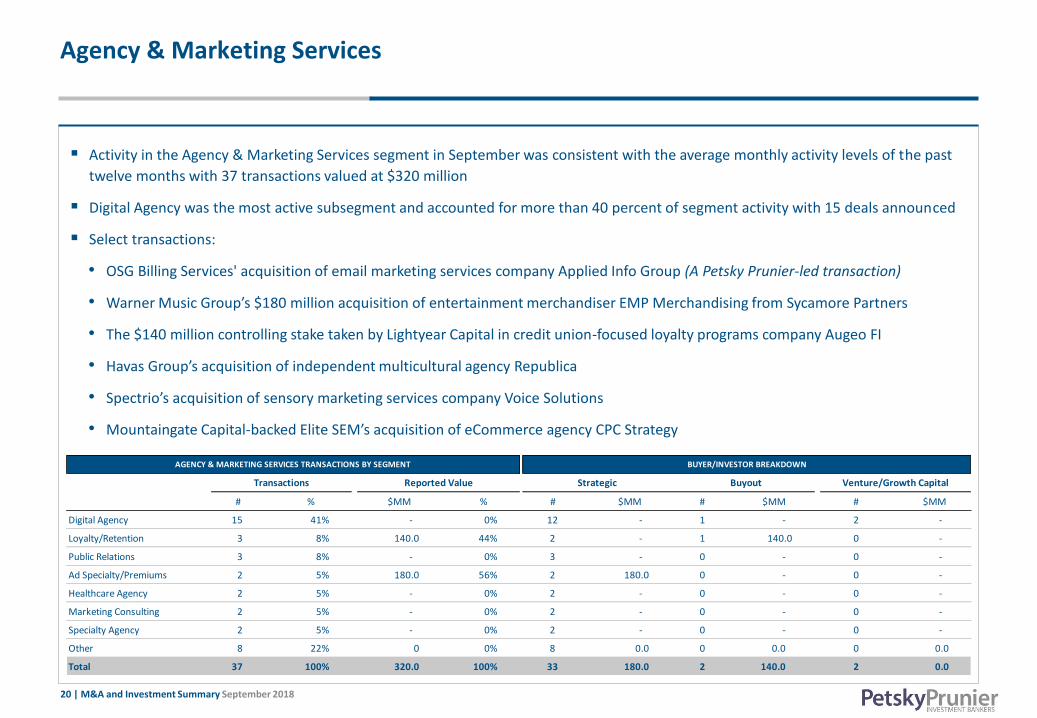
Agency & Marketing Services
▪ Activity in the Agency & Marketing Services segment in September was consistent with the average monthly activity levels of the past
twelve months with 37 transactions valued at $320 million
▪ Digital Agency was the most active subsegment and accounted for more than 40 percent of segment activity with 15 deals announced
▪ Select transactions:
• OSG Billing Services' acquisition of email marketing services company Applied Info Group (A Petsky Prunier-led transaction)
• Warner Music Group’s $180 million acquisition of entertainment merchandiser EMP Merchandising from Sycamore Partners
• The $140 million controlling stake taken by Lightyear Capital in credit union-focused loyalty programs company Augeo FI
• Havas Group’s acquisition of independent multicultural agency Republica
• Spectrio’s acquisition of sensory marketing services company Voice Solutions
• Mountaingate Capital-backed Elite SEM’s acquisition of eCommerce agency CPC Strategy
# % $MM % # $MM # $MM # $MM
Digital Agency 15 41% - 0% 12 - 1 - 2 -
Loyalty/Retention 3 8% 140.0 44% 2 - 1 140.0 0 -
Public Relations 3 8% - 0% 3 - 0 - 0 -
Ad Specialty/Premiums 2 5% 180.0 56% 2 180.0 0 - 0 -
Healthcare Agency 2 5% - 0% 2 - 0 - 0 -
Marketing Consulting 2 5% - 0% 2 - 0 - 0 -
Specialty Agency 2 5% - 0% 2 - 0 - 0 -
Other 8 22% 0 0% 8 0.0 0 0.0 0 0.0
Total 37 100% 320.0 100% 33 180.0 2 140.0 2 0.0
AGENCY & MARKETING SERVICES TRANSACTIONS BY SEGMENT BUYER/INVESTOR BREAKDOWN
Transactions Reported Value Strategic Buyout Venture/Growth Capital

21 | M&A and Investment Summary September 2018
Agency Public Company Valuation
($ in Millions, except stock price data)
Stock Price Chg % From Equity Ent. LTM LTM Margin LTM LTM Multiples
Company Name Headquarters 09/28/18 52WK High Value Value Revenue EBITDA EBITDA Rev Growth EV/Rev EV/EBITDA
Cello Health plc United Kingdom $1.76 -4% $ 184.4 $ 191.5 $ 223.2 $ 16.5 7.4% 3.7% 0.9x 11.6x
Dentsu Inc. Japan 46.44 -3% 13,090.8 15,300.9 8,760.5 1,608.9 18.4% NM 1.7x 9.5x
Enero Group Limited Australia 0.93 0% 78.7 55.8 148.1 10.9 7.4% 10.7% 0.4x 5.1x
Hakuhodo DY Holdings Inc Japan 17.56 -1% 6,551.4 5,475.2 12,249.5 660.1 5.4% 6.3% 0.4x 8.3x
Huntsworth plc United Kingdom 1.50 -20% 518.1 569.7 270.4 38.0 14.0% 9.1% 2.1x 15.0x
M&C Saatchi plc United Kingdom 4.83 -14% 417.0 419.3 456.3 30.1 6.6% 40.5% 0.9x 13.9x
MDC Partners Inc. United States 4.15 -66% 238.4 1,437.0 1,485.3 186.4 12.6% 0.7% 1.0x 7.7x
Next Fifteen Communications Group plc United Kingdom 7.04 -12% 557.1 588.3 283.6 47.2 16.7% 8.7% 2.1x 12.5x
Omnicom Group Inc. United States 68.02 -18% 15,261.8 19,024.4 15,385.2 2,351.5 15.3% -0.2% 1.2x 8.1x
OPT Holding, Inc. * Japan 30.36 -1% 686.6 658.2 779.1 27.1 3.5% 16.0% 0.8x 24.3x
Publicis Groupe S.A. France 59.81 -19% 13,794.7 17,383.6 10,843.5 1,996.3 18.4% -8.0% 1.6x 8.7x
The Interpublic Group of Companies, Inc. United States 22.87 -12% 8,777.2 10,520.1 8,094.7 1,166.0 14.4% 5.2% 1.3x 9.0x
UDG Healthcare plc Ireland 8.88 -29% 2,208.0 2,251.4 1,316.2 160.9 12.2% 17.1% 1.7x 14.0x
WPP plc United Kingdom 14.67 -24% 18,301.1 24,885.1 19,934.7 3,035.7 15.2% -2.5% 1.2x 8.2x
1.3x 8.8xAdjusted Weighted Average

22 | M&A and Investment Summary September 2018
Marketing ServicesPublic Company Valuation
($ in Millions, except stock price data)
Stock Price Chg % From Equity Ent. LTM LTM Margin LTM LTM Multiples
Company Name Headquarters 09/28/18 52WK High Value Value Revenue EBITDA EBITDA Rev Growth EV/Rev EV/EBITDA
Acxiom Holdings, Inc. * United States $49.41 -4% $ 3,837.3 $ 3,971.0 $ 931.9 $ 96.6 10.4% 6.1% 4.3x 41.1x
Affinion Group Holdings, Inc. United States 14.00 -4% 128.2 2,016.4 955.6 226.8 23.7% 14.3% 2.1x 8.9x
Aimia Inc. Canada 3.50 -2% 533.7 522.8 1,248.5 138.9 11.1% 15.0% 0.4x 3.8x
Alliance Data Systems Corporation United States 236.16 -15% 12,975.5 29,519.3 7,806.7 1,772.5 22.7% 5.3% 3.8x 16.7x
Fluent, Inc. * United States 2.15 -69% 161.9 215.3 233.0 7.9 3.4% 12.8% 0.9x 27.3x
CSG Systems International, Inc. United States 40.14 -18% 1,345.1 1,520.1 819.1 139.9 17.1% 6.4% 1.9x 10.9x
Deluxe Corporation United States 56.94 -28% 2,711.6 3,409.8 1,972.7 483.7 24.5% 3.2% 1.7x 7.0x
Fair Isaac Corporation * United States 228.55 -5% 6,660.9 7,299.7 1,005.9 224.9 22.4% 10.0% 7.3x 32.5x
Harte Hanks, Inc. United States 7.13 -41% 44.5 34.0 345.1 (0.6) NM -13.1% 0.1x NM
High Co. SA France 5.95 -15% 123.7 66.7 190.0 18.6 9.8% 8.0% 0.4x 3.6x
Multiplus S.A. Brazil 6.09 -41% 986.7 646.0 571.8 123.9 21.7% 47.7% 1.1x 5.2x
Pitney Bowes Inc. United States 7.08 -52% 1,331.2 4,158.8 3,818.7 646.2 16.9% 19.3% 1.1x 6.4x
Points International Ltd. Canada 14.04 -25% 200.2 128.5 365.4 11.5 3.1% 9.7% 0.4x 11.2x
Viad Corp United States 59.25 -5% 1,204.3 1,414.3 1,257.5 114.8 9.1% -5.4% 1.1x 12.3x
3.0x 13.2xAdjusted Weighted Average

23 | M&A and Investment Summary September 2018
Traditional Media
▪ Of the 19 transactions recorded in the Traditional Media segment in September, seven announced $742 million in reported value
▪ Entertainment Media continues to drive overall segment activity with seven deals announced throughout the month
▪ Select transactions from the segment included:
• UK-based Global Media & Entertainment’s $300 million acquisition of outdoor advertising company Primesight and $160 million acquisition of digital billboard company Outdoor Plus, both also based in the UK, to create new division Global Outdoor
• The acquisition of Time Magazine by Salesforce CEO Marc Benioff in a transaction valued at $190 million
• The $60 million minority stake taken by Valence Media in UK-based independent production company Fullwell 73
• Immediate Media’s acquisition of BBC Good Food from BBC Studios for an undisclosed amount
• The BMG acquisition of hip-hop and rap record label RBC Records for an undisclosed amount
# % $MM % # $MM # $MM # $MM
Entertainment Media 7 37% $67.7 9% 4 - 0 - 3 $67.7
Consumer Magazine Publishing 5 26% 201.2 27% 4 11.2 1 190.0 0 -
B-to-B Media 4 21% 11.6 2% 1 - 1 - 2 11.6
Traditional Outdoor 2 11% 461.2 62% 2 461.2 0 - 0 -
Consumer Book Publishing 1 5% - 0% 1 - 0 - 0 -
Total 19 100% 741.7 100% 12 472.4 2 190.0 5 79.3
TRADTIONAL MEDIA TRANSACTIONS BY SEGMENT BUYER/INVESTOR BREAKDOWN
Transactions Reported Value Strategic Buyout Venture/Growth Capital

24 | M&A and Investment Summary September 2018
Traditional MediaPublic Company Valuation (1/3)
($ in Millions, except stock price data)
Stock Price Chg % From Equity Ent. LTM LTM Margin LTM LTM Multiples
Company Name Headquarters 09/28/18 52WK High Value Value Revenue EBITDA EBITDA Rev Growth EV/Rev EV/EBITDA
CBS Corporation United States $57.45 -7% $ 21,625.6 $ 31,223.6 $ 14,319.0 $ 3,112.0 21.7% 8.5% 2.2x 10.0x
Discovery, Inc. United States 32.00 -2% 21,823.4 41,823.4 8,667.0 2,945.0 34.0% 31.6% 4.8x 14.2x
Twenty-First Century Fox, Inc. * United States 46.33 -8% 85,422.5 99,321.5 30,400.0 6,905.0 22.7% 6.7% 3.3x 14.4x
Viacom, Inc. United States 33.76 -5% 13,738.6 23,207.6 12,777.0 2,918.0 22.8% -3.0% 1.8x 8.0x
The Walt Disney Company United States 116.94 -1% 173,918.1 198,385.1 57,906.0 17,423.0 30.1% 4.3% 3.4x 11.4x
Adjusted Weighted Average 3.3x 11.3x
($ in Millions, except stock price data)
B-to-B Media
Stock Price Chg % From Equity Ent. LTM LTM Margin LTM LTM Multiples
Company Name Headquarters 09/28/18 52WK High Value Value Revenue EBITDA EBITDA Rev Growth EV/Rev EV/EBITDA
Ascential plc United Kingdom $5.45 -11% $ 2,182.7 $ 2,554.7 $ 527.3 $ 138.9 26.4% 38.5% 4.8x 18.4x
Centaur Media Plc United Kingdom $0.50 -32% 72.7 70.3 92.8 6.9 7.4% 16.2% 0.8x 10.3x
Emerald Expositions Events, Inc. United States $16.48 -33% 1,203.9 1,701.8 352.5 150.6 42.7% 3.5% 4.8x 11.3x
Euromoney Institutional Investor PLC United Kingdom $17.56 -8% 1,886.0 1,949.2 552.6 149.3 27.0% 11.2% 3.5x 13.1x
Informa plc United Kingdom 9.94 -12% 12,439.6 16,040.2 2,374.3 749.2 31.6% 11.6% 6.8x 21.4x
MCH Group AG Switzerland 27.76 -61% 166.8 331.6 540.6 58.0 10.7% 34.4% 0.6x 5.7x
ITE Group plc * United Kingdom 0.94 -63% 694.0 792.4 222.3 29.5 13.3% 12.8% 3.6x 26.9x
Tarsus Group plc Ireland 3.70 -15% 452.0 582.3 149.8 50.2 33.5% 39.8% 3.9x 11.6x
TechTarget, Inc. * United States 19.42 -44% 535.6 528.6 117.1 21.7 18.5% 14.1% 4.5x 24.3x
Adjusted Weighted Average 5.8x 19.1x
($ in Millions, except stock price data)
Radio Broadcasting
Stock Price Chg % From Equity Ent. LTM LTM Margin LTM LTM Multiples
Company Name Headquarters 09/28/18 52WK High Value Value Revenue EBITDA EBITDA Rev Growth EV/Rev EV/EBITDA
Beasley Broadcast Group, Inc. United States $6.90 -52% $ 189.8 $ 385.7 $ 234.2 $ 41.5 17.7% 19.4% 1.6x 9.3x
Emmis Communications Corporation United States 5.23 -10% 67.6 175.0 136.3 15.8 11.6% -31.4% 1.3x 11.1x
Entercom Communications Corp. * United States 7.90 -36% 1,125.9 3,014.7 1,041.6 168.8 16.2% 121.5% 2.9x 17.9x
Pandora Media, Inc. United States 9.51 -6% 2,565.2 2,900.4 1,478.0 (272.5) NM 2.8% 2.0x NM
Salem Media Group, Inc. United States 3.40 -50% 89.0 341.3 262.7 40.4 15.4% -3.8% 1.3x 8.4x
Sirius XM Holdings Inc. * United States 6.32 -18% 28,142.7 34,527.2 5,590.9 2,026.3 36.2% 7.1% 6.2x 17.0x
Spanish Broadcasting System, Inc. United States 0.00 NA 1.0 411.0 137.9 42.1 30.6% -3.8% 3.0x 9.8x
Townsquare Media, Inc. United States 7.83 -25% 148.0 642.5 512.8 99.1 19.3% 5.4% 1.3x 6.5x
Urban One, Inc. United States 2.00 -17% 91.9 1,012.2 435.9 114.9 26.4% -1.7% 2.3x 8.8x
Adjusted Weighted Average 2.2x 8.6x
*Calculation is market cap weighted and excludes revenue multiples that are 2.0 standard deviations above the mean (5.5x)and EBITDA multiples that are 1.0 standard deviations above the mean (15.2x)
Large Cap Diversified Media
*Calculation is market cap weighted and excludes revenue multiples that are 2.0 standard deviations above the mean (5.5x)and EBITDA multiples that are 1.0 standard deviations above the mean (14.3x)
*Calculation is market cap weighted and excludes revenue multiples that are 2.0 standard deviations above the mean (7.6x)and EBITDA multiples that are 1.0 standard deviations above the mean (23.1x)

25 | M&A and Investment Summary September 2018
Traditional MediaPublic Company Valuation (2/3)
($ in Millions, except stock price data)
Broadcast, Cable, and Satellite Television
Stock Price Chg % From Equity Ent. LTM LTM Margin LTM
Company Name Headquarters 09/28/18 52WK High Value Value Revenue EBITDA EBITDA Rev Growth EV/Rev EV/EBITDA
Altice Europe N.V. Netherlands $2.70 -87% $ 3,208.8 $ 45,342.5 $ 26,940.7 $ 10,115.0 37.5% 18.2% 1.7x 4.5x
AMC Networks Inc. United States $66.34 -4% 3,776.6 6,770.4 2,877.2 905.2 31.5% 2.9% 2.4x 7.5x
Sky plc United Kingdom 22.56 0% 38,736.8 47,324.8 17,925.5 2,635.1 14.7% 5.2% 2.6x 18.0x
CVC Limited Australia 2.03 -3% 242.3 215.7 48.1 25.7 53.5% 38.3% 4.5x 8.4x
CBS Corporation United States 57.45 -7% 21,625.6 31,223.6 14,319.0 3,112.0 21.7% 8.5% 2.2x 10.0x
Charter Communications, Inc. United States 325.88 -18% 75,559.8 155,102.8 42,571.0 15,600.0 36.6% 4.3% 3.6x 9.9x
Comcast Corporation United States 35.41 -20% 162,246.3 223,492.3 87,179.0 28,388.0 32.6% 3.5% 2.6x 7.9x
Discovery, Inc. United States 32.00 -2% 21,823.4 41,823.4 8,667.0 2,945.0 34.0% 31.6% 4.8x 14.2x
DISH Network Corporation United States 35.76 -35% 16,718.4 30,731.0 13,986.7 2,731.4 19.5% -5.8% 2.2x 11.3x
Entravision Communications Corporation United States 4.90 -38% 435.4 488.3 549.2 301.1 54.8% 108.3% 0.9x 1.6x
GCI Liberty, Inc. * United States NA NA 5,538.1 8,049.6 307.5 40.8 13.3% 97.0% 26.2x 197.1x
Gray Television, Inc. United States 17.50 -2% 1,525.5 2,851.1 929.2 318.1 34.2% 6.5% 3.1x 9.0x
Grupo Televisa, S.A.B. Mexico 3.56 -28% 10,369.0 15,842.2 5,032.0 1,869.1 37.1% 3.0% 3.1x 8.5x
Liberty Global plc United Kingdom 28.93 -27% 21,845.8 53,704.6 15,743.8 7,146.8 45.4% 20.5% 3.4x 7.5x
Nexstar Media Group, Inc. United States 81.40 -9% 3,708.2 7,857.2 2,541.2 889.6 35.0% 45.0% 3.1x 8.8x
Stolt-Nielsen Limited United Kingdom 15.31 -15% 825.6 3,367.2 2,076.9 454.3 21.9% 8.5% 1.6x 7.4x
Sinclair Broadcast Group, Inc. United States 28.35 -29% 2,899.7 5,757.5 2,850.4 756.8 26.5% 2.9% 2.0x 7.6x
TEGNA Inc. United States 11.96 -23% 2,574.6 5,681.5 1,980.8 637.3 32.2% -1.7% 2.9x 8.9x
The E.W. Scripps Company United States 16.50 -14% 1,352.4 1,919.0 987.7 98.0 9.9% 16.7% 1.9x 19.6x
Adjusted Weighted Average 2.9x 9.9x
($ in Millions, except stock price data)
Entertainment Media
Stock Price Chg % From Equity Ent. LTM LTM Margin LTM
Company Name Headquarters 09/28/18 52WK High Value Value Revenue EBITDA EBITDA Rev Growth EV/Rev EV/EBITDA
Cineplex Inc. Canada $27.08 -13% $ 1,714.8 $ 2,154.4 $ 1,213.9 $ 195.0 16.1% 5.1% 1.8x 11.1x
Eros International Plc United States 12.05 -22% 851.9 1,181.4 260.6 61.3 23.5% 7.4% 4.5x 19.3x
Lions Gate Entertainment Corp. United States 24.39 -33% 5,076.0 7,386.8 4,056.5 453.7 11.2% 11.0% 1.8x 16.3x
Live Nation Entertainment, Inc. United States 54.47 -1% 11,387.5 12,457.9 10,761.7 643.9 6.0% 21.0% 1.2x 19.3x
Twenty-First Century Fox, Inc. United States 46.33 -8% 85,422.5 99,321.5 30,400.0 6,905.0 22.7% 6.7% 3.3x 14.4x
Liberty Global plc United Kingdom 28.93 -27% 21,845.8 53,704.6 15,743.8 7,146.8 45.4% 20.5% 3.4x 7.5x
Village Roadshow Limited Australia 1.80 -40% 347.9 675.4 711.2 40.3 5.7% -5.0% 0.9x 16.7x
World Wrestling Entertainment, Inc. * United States 96.73 -1% 7,542.9 7,415.1 867.2 135.5 15.6% 13.9% 8.6x 54.7x
Adjusted Weighted Average 3.4x 13.8x
LTM Multiples
*Calculation is market cap weighted and excludes revenue multiples that are 2.0 standard deviations above the mean (8.6x)and EBITDA multiples that are 1.0 standard deviations above the mean (36.5x)
*Calculation is market cap weighted and excludes revenue multiples that are 2.0 standard deviations above the mean (14.9x)and EBITDA multiples that are 1.0 standard deviations above the mean (62.6x)
LTM Multiples
26 | M&A and Investment Summary September 2018
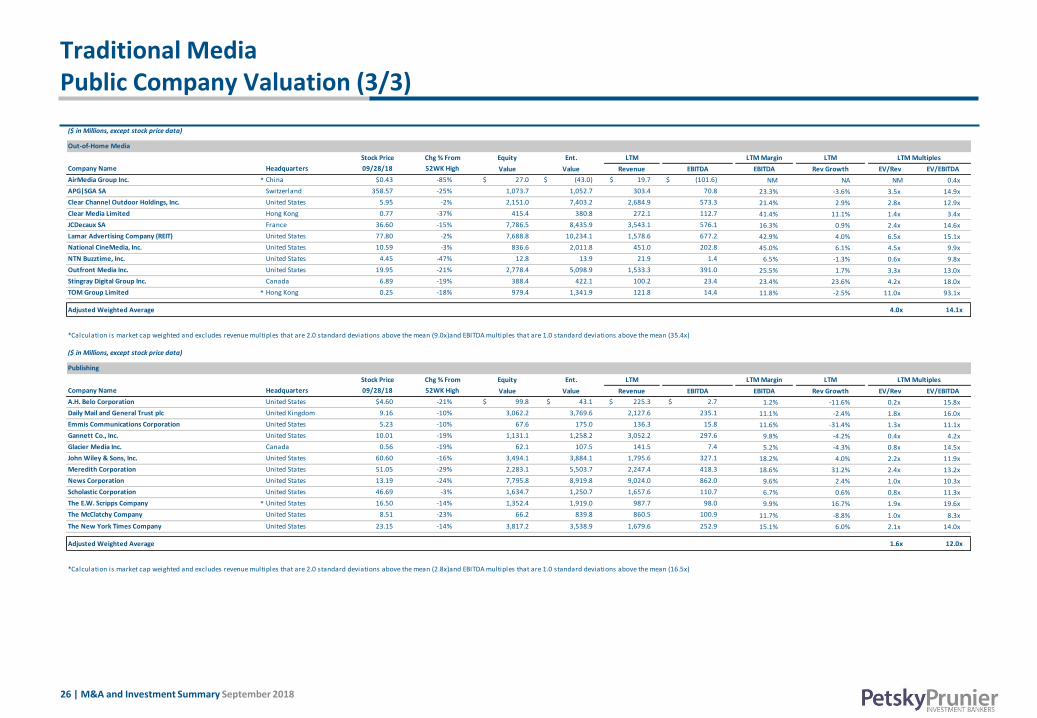
Traditional MediaPublic Company Valuation (3/3)
($ in Millions, except stock price data)
Out-of-Home Media
Stock Price Chg % From Equity Ent. LTM LTM Margin LTM LTM Multiples
Company Name Headquarters 09/28/18 52WK High Value Value Revenue EBITDA EBITDA Rev Growth EV/Rev EV/EBITDA
AirMedia Group Inc. * China $0.43 -85% $ 27.0 $ (43.0) $ 19.7 $ (101.6) NM NA NM 0.4x
APG|SGA SA Switzerland 358.57 -25% 1,073.7 1,052.7 303.4 70.8 23.3% -3.6% 3.5x 14.9x
Clear Channel Outdoor Holdings, Inc. United States 5.95 -2% 2,151.0 7,403.2 2,684.9 573.3 21.4% 2.9% 2.8x 12.9x
Clear Media Limited Hong Kong 0.77 -37% 415.4 380.8 272.1 112.7 41.4% 11.1% 1.4x 3.4x
JCDecaux SA France 36.60 -15% 7,786.5 8,435.9 3,543.1 576.1 16.3% 0.9% 2.4x 14.6x
Lamar Advertising Company (REIT) United States 77.80 -2% 7,688.8 10,234.1 1,578.6 677.2 42.9% 4.0% 6.5x 15.1x
National CineMedia, Inc. United States 10.59 -3% 836.6 2,011.8 451.0 202.8 45.0% 6.1% 4.5x 9.9x
NTN Buzztime, Inc. United States 4.45 -47% 12.8 13.9 21.9 1.4 6.5% -1.3% 0.6x 9.8x
Outfront Media Inc. United States 19.95 -21% 2,778.4 5,098.9 1,533.3 391.0 25.5% 1.7% 3.3x 13.0x
Stingray Digital Group Inc. Canada 6.89 -19% 388.4 422.1 100.2 23.4 23.4% 23.6% 4.2x 18.0x
TOM Group Limited * Hong Kong 0.25 -18% 979.4 1,341.9 121.8 14.4 11.8% -2.5% 11.0x 93.1x
Adjusted Weighted Average 4.0x 14.1x
($ in Millions, except stock price data)
Publishing
Stock Price Chg % From Equity Ent. LTM LTM Margin LTM LTM Multiples
Company Name Headquarters 09/28/18 52WK High Value Value Revenue EBITDA EBITDA Rev Growth EV/Rev EV/EBITDA
A.H. Belo Corporation United States $4.60 -21% $ 99.8 $ 43.1 $ 225.3 $ 2.7 1.2% -11.6% 0.2x 15.8x
Daily Mail and General Trust plc United Kingdom 9.16 -10% 3,062.2 3,769.6 2,127.6 235.1 11.1% -2.4% 1.8x 16.0x
Emmis Communications Corporation United States 5.23 -10% 67.6 175.0 136.3 15.8 11.6% -31.4% 1.3x 11.1x
Gannett Co., Inc. United States 10.01 -19% 1,131.1 1,258.2 3,052.2 297.6 9.8% -4.2% 0.4x 4.2x
Glacier Media Inc. Canada 0.56 -19% 62.1 107.5 141.5 7.4 5.2% -4.3% 0.8x 14.5x
John Wiley & Sons, Inc. United States 60.60 -16% 3,494.1 3,884.1 1,795.6 327.1 18.2% 4.0% 2.2x 11.9x
Meredith Corporation United States 51.05 -29% 2,283.1 5,503.7 2,247.4 418.3 18.6% 31.2% 2.4x 13.2x
News Corporation United States 13.19 -24% 7,795.8 8,919.8 9,024.0 862.0 9.6% 2.4% 1.0x 10.3x
Scholastic Corporation United States 46.69 -3% 1,634.7 1,250.7 1,657.6 110.7 6.7% 0.6% 0.8x 11.3x
The E.W. Scripps Company * United States 16.50 -14% 1,352.4 1,919.0 987.7 98.0 9.9% 16.7% 1.9x 19.6x
The McClatchy Company United States 8.51 -23% 66.2 839.8 860.5 100.9 11.7% -8.8% 1.0x 8.3x
The New York Times Company United States 23.15 -14% 3,817.2 3,538.9 1,679.6 252.9 15.1% 6.0% 2.1x 14.0x
Adjusted Weighted Average 1.6x 12.0x
*Calculation is market cap weighted and excludes revenue multiples that are 2.0 standard deviations above the mean (2.8x)and EBITDA multiples that are 1.0 standard deviations above the mean (16.5x)
*Calculation is market cap weighted and excludes revenue multiples that are 2.0 standard deviations above the mean (9.0x)and EBITDA multiples that are 1.0 standard deviations above the mean (35.4x)

27 | M&A and Investment Summary September 2018
Software
▪ Within the Software segment, nearly $4.8 billion in reported value involved strategic buyers, while $3.9 billion in venture/growth
capital investments were announced
▪ Activity was driven primarily by the Financial Software subsegment, which announced 68 transactions worth more than $1.6 billion
▪ Select transactions:
• The $295 million acquisition of OpsGenie, a provider of IT alert solutions for DevOps departments, by Atlassian
• Stripe’s $245 million round of funding at a reported valuation of $20 billion from Tiger Global Management, Sequoia Capital, DST
Global, Andreessen Horowitz, Kleiner Perkins Caufield & Byers, and Khosla Ventures
• Robotic process automation company UiPath’s $225 million investment from CapitalG, Sequoia Capital, and Accel Partners
• The $100 million round of funding from GV, Iconiq Capital, and Khosla Ventures for open-source code collaboration platform GitLab
• The acquisition of collaboration solutions provider Teem by WeWork in a transaction valued at a reported $100 million
• Public data-as-a-service solutions company Enigma’s $95 million round of funding from New Enterprise Associates, Capital One
Growth Ventures, BB&T, Third Point, MetLife, Comcast Ventures, Crosslink Capital, and Two Sigma Ventures
# % $MM % # $MM # $MM # $MM
Financial 68 25% $1,587.9 16% 25 $684.5 1 - 42 $903.4
Healthcare 29 11% 555.1 6% 6 75.5 1 - 22 479.6
Security 27 10% 653.0 7% 7 - 0 - 20 653.0
ERP 26 10% 1,468.7 15% 8 - 3 1,085.0 15 383.7
Infrastructure 19 7% 2,565.6 26% 6 2,100.0 0 - 13 465.6
Other 99 37% 2,971.9 30% 34 1,970 2 0 63 1,001.9
Total 268 100% 9,802.2 100% 86 4,830.0 7 1,085.0 175 3,887.2
SOFTWARE TRANSACTIONS BY SEGMENT BUYER/INVESTOR BREAKDOWN
Transactions Reported Value Strategic Buyout Venture/Growth Capital
28 | M&A and Investment Summary September 2018
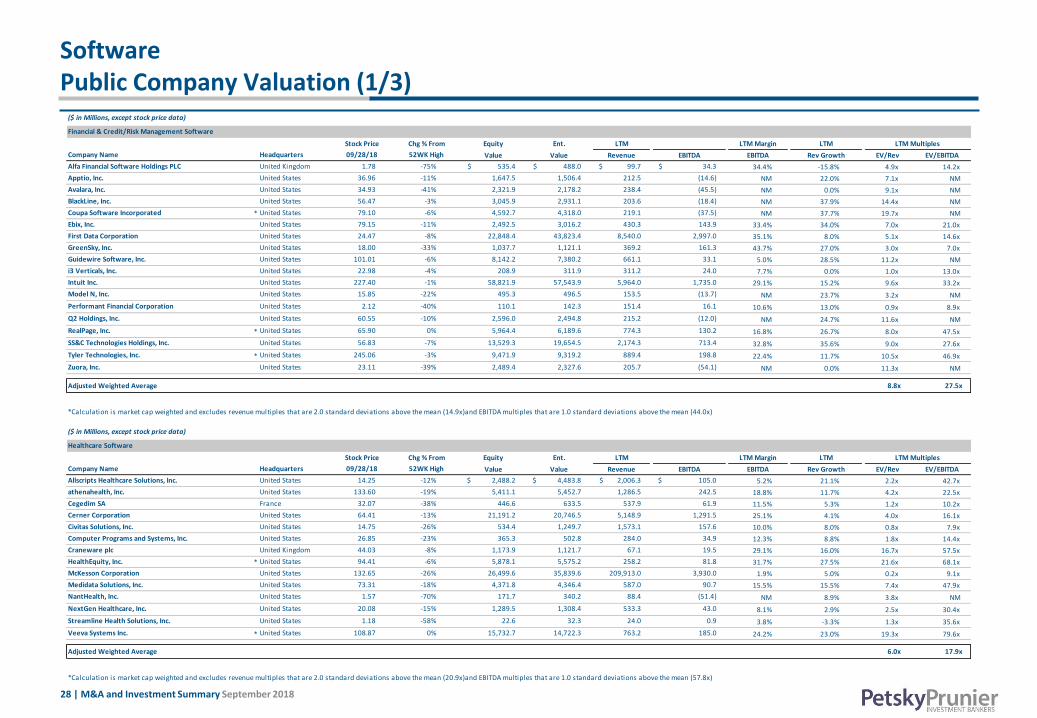
SoftwarePublic Company Valuation (1/3)
($ in Millions, except stock price data)
Stock Price Chg % From Equity Ent. LTM LTM Margin LTM LTM Multiples
Company Name Headquarters 09/28/18 52WK High Value Value Revenue EBITDA EBITDA Rev Growth EV/Rev EV/EBITDA
Alfa Financial Software Holdings PLC United Kingdom 1.78 -75% $ 535.4 $ 488.0 $ 99.7 $ 34.3 34.4% -15.8% 4.9x 14.2x
Apptio, Inc. United States 36.96 -11% 1,647.5 1,506.4 212.5 (14.6) NM 22.0% 7.1x NM
Avalara, Inc. United States 34.93 -41% 2,321.9 2,178.2 238.4 (45.5) NM 0.0% 9.1x NM
BlackLine, Inc. United States 56.47 -3% 3,045.9 2,931.1 203.6 (18.4) NM 37.9% 14.4x NM
Coupa Software Incorporated * United States 79.10 -6% 4,592.7 4,318.0 219.1 (37.5) NM 37.7% 19.7x NM
Ebix, Inc. United States 79.15 -11% 2,492.5 3,016.2 430.3 143.9 33.4% 34.0% 7.0x 21.0x
First Data Corporation United States 24.47 -8% 22,848.4 43,823.4 8,540.0 2,997.0 35.1% 8.0% 5.1x 14.6x
GreenSky, Inc. United States 18.00 -33% 1,037.7 1,121.1 369.2 161.3 43.7% 27.0% 3.0x 7.0x
Guidewire Software, Inc. United States 101.01 -6% 8,142.2 7,380.2 661.1 33.1 5.0% 28.5% 11.2x NM
i3 Verticals, Inc. United States 22.98 -4% 208.9 311.9 311.2 24.0 7.7% 0.0% 1.0x 13.0x
Intuit Inc. United States 227.40 -1% 58,821.9 57,543.9 5,964.0 1,735.0 29.1% 15.2% 9.6x 33.2x
Model N, Inc. United States 15.85 -22% 495.3 496.5 153.5 (13.7) NM 23.7% 3.2x NM
Performant Financial Corporation United States 2.12 -40% 110.1 142.3 151.4 16.1 10.6% 13.0% 0.9x 8.9x
Q2 Holdings, Inc. United States 60.55 -10% 2,596.0 2,494.8 215.2 (12.0) NM 24.7% 11.6x NM
RealPage, Inc. * United States 65.90 0% 5,964.4 6,189.6 774.3 130.2 16.8% 26.7% 8.0x 47.5x
SS&C Technologies Holdings, Inc. United States 56.83 -7% 13,529.3 19,654.5 2,174.3 713.4 32.8% 35.6% 9.0x 27.6x
Tyler Technologies, Inc. * United States 245.06 -3% 9,471.9 9,319.2 889.4 198.8 22.4% 11.7% 10.5x 46.9x
Zuora, Inc. United States 23.11 -39% 2,489.4 2,327.6 205.7 (54.1) NM 0.0% 11.3x NM
Adjusted Weighted Average 8.8x 27.5x
($ in Millions, except stock price data)
Healthcare Software
Stock Price Chg % From Equity Ent. LTM LTM Margin LTM LTM Multiples
Company Name Headquarters 09/28/18 52WK High Value Value Revenue EBITDA EBITDA Rev Growth EV/Rev EV/EBITDA
Allscripts Healthcare Solutions, Inc. United States 14.25 -12% $ 2,488.2 $ 4,483.8 $ 2,006.3 $ 105.0 5.2% 21.1% 2.2x 42.7x
athenahealth, Inc. United States 133.60 -19% 5,411.1 5,452.7 1,286.5 242.5 18.8% 11.7% 4.2x 22.5x
Cegedim SA France 32.07 -38% 446.6 633.5 537.9 61.9 11.5% 5.3% 1.2x 10.2x
Cerner Corporation United States 64.41 -13% 21,191.2 20,746.5 5,148.9 1,291.5 25.1% 4.1% 4.0x 16.1x
Civitas Solutions, Inc. United States 14.75 -26% 534.4 1,249.7 1,573.1 157.6 10.0% 8.0% 0.8x 7.9x
Computer Programs and Systems, Inc. United States 26.85 -23% 365.3 502.8 284.0 34.9 12.3% 8.8% 1.8x 14.4x
Craneware plc United Kingdom 44.03 -8% 1,173.9 1,121.7 67.1 19.5 29.1% 16.0% 16.7x 57.5x
HealthEquity, Inc. * United States 94.41 -6% 5,878.1 5,575.2 258.2 81.8 31.7% 27.5% 21.6x 68.1x
McKesson Corporation United States 132.65 -26% 26,499.6 35,839.6 209,913.0 3,930.0 1.9% 5.0% 0.2x 9.1x
Medidata Solutions, Inc. United States 73.31 -18% 4,371.8 4,346.4 587.0 90.7 15.5% 15.5% 7.4x 47.9x
NantHealth, Inc. United States 1.57 -70% 171.7 340.2 88.4 (51.4) NM 8.9% 3.8x NM
NextGen Healthcare, Inc. United States 20.08 -15% 1,289.5 1,308.4 533.3 43.0 8.1% 2.9% 2.5x 30.4x
Streamline Health Solutions, Inc. United States 1.18 -58% 22.6 32.3 24.0 0.9 3.8% -3.3% 1.3x 35.6x
Veeva Systems Inc. * United States 108.87 0% 15,732.7 14,722.3 763.2 185.0 24.2% 23.0% 19.3x 79.6x
Adjusted Weighted Average 6.0x 17.9x
*Calculation is market cap weighted and excludes revenue multiples that are 2.0 standard deviations above the mean (14.9x)and EBITDA multiples that are 1.0 standard deviations above the mean (44.0x)
Financial & Credit/Risk Management Software
*Calculation is market cap weighted and excludes revenue multiples that are 2.0 standard deviations above the mean (20.9x)and EBITDA multiples that are 1.0 standard deviations above the mean (57.8x)
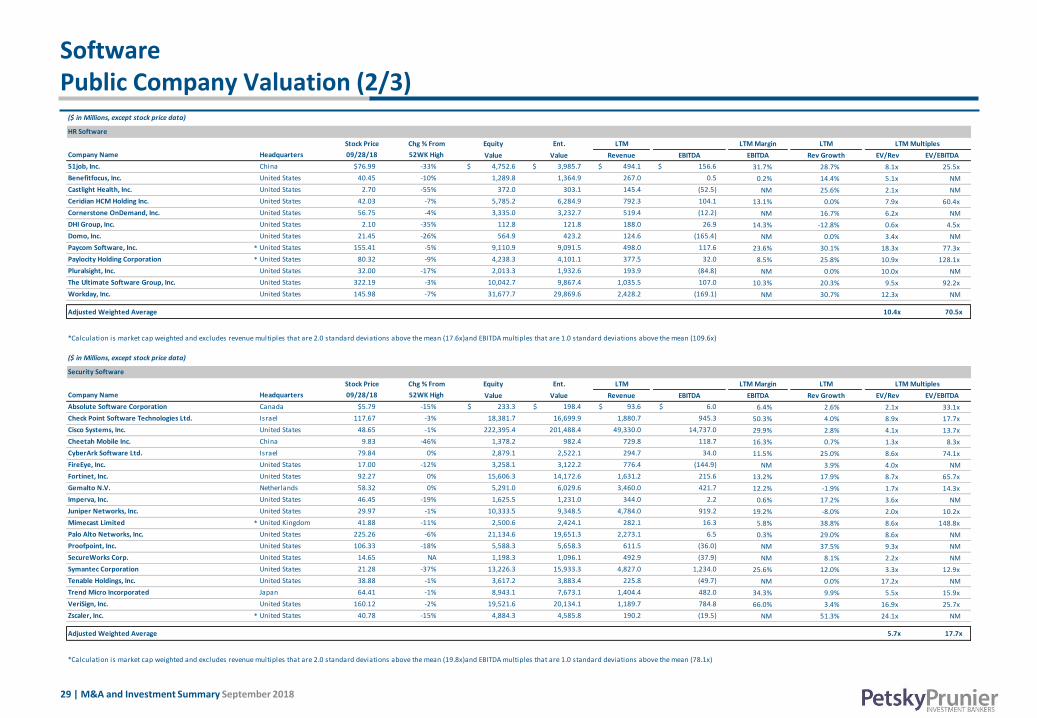
29 | M&A and Investment Summary September 2018
SoftwarePublic Company Valuation (2/3)
($ in Millions, except stock price data)
HR Software
Stock Price Chg % From Equity Ent. LTM LTM Margin LTM
Company Name Headquarters 09/28/18 52WK High Value Value Revenue EBITDA EBITDA Rev Growth EV/Rev EV/EBITDA
51job, Inc. China $76.99 -33% $ 4,752.6 $ 3,985.7 $ 494.1 $ 156.6 31.7% 28.7% 8.1x 25.5x
Benefitfocus, Inc. United States 40.45 -10% 1,289.8 1,364.9 267.0 0.5 0.2% 14.4% 5.1x NM
Castlight Health, Inc. United States 2.70 -55% 372.0 303.1 145.4 (52.5) NM 25.6% 2.1x NM
Ceridian HCM Holding Inc. United States 42.03 -7% 5,785.2 6,284.9 792.3 104.1 13.1% 0.0% 7.9x 60.4x
Cornerstone OnDemand, Inc. United States 56.75 -4% 3,335.0 3,232.7 519.4 (12.2) NM 16.7% 6.2x NM
DHI Group, Inc. United States 2.10 -35% 112.8 121.8 188.0 26.9 14.3% -12.8% 0.6x 4.5x
Domo, Inc. United States 21.45 -26% 564.9 423.2 124.6 (165.4) NM 0.0% 3.4x NM
Paycom Software, Inc. * United States 155.41 -5% 9,110.9 9,091.5 498.0 117.6 23.6% 30.1% 18.3x 77.3x
Paylocity Holding Corporation * United States 80.32 -9% 4,238.3 4,101.1 377.5 32.0 8.5% 25.8% 10.9x 128.1x
Pluralsight, Inc. United States 32.00 -17% 2,013.3 1,932.6 193.9 (84.8) NM 0.0% 10.0x NM
The Ultimate Software Group, Inc. United States 322.19 -3% 10,042.7 9,867.4 1,035.5 107.0 10.3% 20.3% 9.5x 92.2x
Workday, Inc. United States 145.98 -7% 31,677.7 29,869.6 2,428.2 (169.1) NM 30.7% 12.3x NM
Adjusted Weighted Average 10.4x 70.5x
($ in Millions, except stock price data)
Security Software
Stock Price Chg % From Equity Ent. LTM LTM Margin LTM
Company Name Headquarters 09/28/18 52WK High Value Value Revenue EBITDA EBITDA Rev Growth EV/Rev EV/EBITDA
Absolute Software Corporation Canada $5.79 -15% $ 233.3 $ 198.4 $ 93.6 $ 6.0 6.4% 2.6% 2.1x 33.1x
Check Point Software Technologies Ltd. Israel 117.67 -3% 18,381.7 16,699.9 1,880.7 945.3 50.3% 4.0% 8.9x 17.7x
Cisco Systems, Inc. United States 48.65 -1% 222,395.4 201,488.4 49,330.0 14,737.0 29.9% 2.8% 4.1x 13.7x
Cheetah Mobile Inc. China 9.83 -46% 1,378.2 982.4 729.8 118.7 16.3% 0.7% 1.3x 8.3x
CyberArk Software Ltd. Israel 79.84 0% 2,879.1 2,522.1 294.7 34.0 11.5% 25.0% 8.6x 74.1x
FireEye, Inc. United States 17.00 -12% 3,258.1 3,122.2 776.4 (144.9) NM 3.9% 4.0x NM
Fortinet, Inc. United States 92.27 0% 15,606.3 14,172.6 1,631.2 215.6 13.2% 17.9% 8.7x 65.7x
Gemalto N.V. Netherlands 58.32 0% 5,291.0 6,029.6 3,460.0 421.7 12.2% -1.9% 1.7x 14.3x
Imperva, Inc. United States 46.45 -19% 1,625.5 1,231.0 344.0 2.2 0.6% 17.2% 3.6x NM
Juniper Networks, Inc. United States 29.97 -1% 10,333.5 9,348.5 4,784.0 919.2 19.2% -8.0% 2.0x 10.2x
Mimecast Limited * United Kingdom 41.88 -11% 2,500.6 2,424.1 282.1 16.3 5.8% 38.8% 8.6x 148.8x
Palo Alto Networks, Inc. United States 225.26 -6% 21,134.6 19,651.3 2,273.1 6.5 0.3% 29.0% 8.6x NM
Proofpoint, Inc. United States 106.33 -18% 5,588.3 5,658.3 611.5 (36.0) NM 37.5% 9.3x NM
SecureWorks Corp. United States 14.65 NA 1,198.3 1,096.1 492.9 (37.9) NM 8.1% 2.2x NM
Symantec Corporation United States 21.28 -37% 13,226.3 15,933.3 4,827.0 1,234.0 25.6% 12.0% 3.3x 12.9x
Tenable Holdings, Inc. United States 38.88 -1% 3,617.2 3,883.4 225.8 (49.7) NM 0.0% 17.2x NM
Trend Micro Incorporated Japan 64.41 -1% 8,943.1 7,673.1 1,404.4 482.0 34.3% 9.9% 5.5x 15.9x
VeriSign, Inc. United States 160.12 -2% 19,521.6 20,134.1 1,189.7 784.8 66.0% 3.4% 16.9x 25.7x
Zscaler, Inc. * United States 40.78 -15% 4,884.3 4,585.8 190.2 (19.5) NM 51.3% 24.1x NM
Adjusted Weighted Average 5.7x 17.7x
LTM Multiples
LTM Multiples
*Calculation is market cap weighted and excludes revenue multiples that are 2.0 standard deviations above the mean (17.6x)and EBITDA multiples that are 1.0 standard deviations above the mean (109.6x)
*Calculation is market cap weighted and excludes revenue multiples that are 2.0 standard deviations above the mean (19.8x)and EBITDA multiples that are 1.0 standard deviations above the mean (78.1x)

30 | M&A and Investment Summary September 2018
SoftwarePublic Company Valuation (3/3)
($ in Millions, except stock price data)
Engineering Software
Stock Price Chg % From Equity Ent. LTM LTM Margin LTM
Company Name Headquarters 09/28/18 52WK High Value Value Revenue EBITDA EBITDA Rev Growth EV/Rev EV/EBITDA
ANSYS, Inc. United States $186.68 -2% $ 15,736.7 $ 15,040.6 $ 1,166.7 $ 469.2 40.2% 12.9% 12.9x 32.1x
Dassault Systèmes SE France 149.59 -9% 38,242.9 35,870.1 3,859.8 1,050.9 27.2% 4.1% 9.3x 34.1x
PTC Inc. * United States 106.19 -1% 12,512.3 12,916.5 1,235.7 141.3 11.4% 7.8% 10.5x 91.4x
Synopsys, Inc. United States 98.61 -5% 14,652.3 14,538.5 3,022.6 514.0 17.0% 13.5% 4.8x 28.3x
Trimble Inc. United States 43.46 -5% 10,863.1 11,578.9 2,911.4 503.0 17.3% 19.3% 4.0x 23.0x
Adjusted Weighted Average 8.7x 31.1x
($ in Millions, except stock price data)
Infrastructure Software
Stock Price Chg % From Equity Ent. LTM LTM Margin LTM LTM Multiples
Company Name Headquarters 09/28/18 52WK High Value Value Revenue EBITDA EBITDA Rev Growth EV/Rev EV/EBITDA
Adobe Systems Incorporated United States $269.95 -3% $ 131,771.6 $ 128,712.1 $ 8,572.0 $ 3,090.2 36.0% 24.2% 15.0x 41.7x
Atlassian Corporation Plc * United Kingdom 96.14 -1% 22,623.1 21,709.3 874.0 4.5 0.5% 41.0% 24.8x NM
Bandwidth Inc. United States 53.57 -3% 1,008.9 952.2 185.1 19.0 10.3% 18.3% 5.1x 50.1x
CA, Inc. United States 44.15 0% 18,462.0 18,053.0 4,148.0 1,254.0 30.2% 2.1% 4.4x 14.4x
Cloudera, Inc. United States 17.65 -21% 2,667.2 2,288.8 411.1 (176.4) NM 32.8% 5.6x NM
Commvault Systems, Inc. * United States 70.00 -4% 3,201.4 2,739.8 709.6 16.0 2.3% 7.6% 3.9x 171.2x
DocuSign, Inc. United States 52.57 -23% 8,243.4 7,424.6 602.3 (291.9) NM 0.0% 12.3x NM
Dropbox, Inc. United States 26.83 -38% 10,793.9 9,979.9 1,247.7 (363.4) NM 28.2% 8.0x NM
Endurance International Group Holdings, Inc. United States 8.80 -20% 1,262.9 3,045.4 1,168.6 306.2 26.2% -0.2% 2.6x 9.9x
First Data Corporation United States 24.47 -8% 22,848.4 43,823.4 8,540.0 2,997.0 35.1% 8.0% 5.1x 14.6x
Hortonworks Inc. United States 22.81 -13% 1,855.6 1,774.2 309.4 (164.0) NM 42.4% 5.7x NM
IBM Corporation United States 151.21 -12% 138,019.7 172,021.7 80,771.0 17,033.0 21.1% 3.0% 2.1x 10.1x
Nutanix, Inc. United States 42.72 -34% 7,385.8 6,881.1 1,155.5 (237.2) NM 36.6% 6.0x NM
Okta, Inc. United States 70.36 -7% 7,682.1 7,409.6 325.6 (120.5) NM 59.9% 22.8x NM
Rapid7, Inc. United States 36.92 -6% 1,725.6 1,610.9 221.2 (47.1) NM 24.2% 7.3x NM
Pivotal Software, Inc. United States 19.58 -37% 5,039.6 4,368.6 582.4 (128.6) NM 0.0% 7.5x NM
salesforce.com, inc. United States 159.03 -1% 120,338.0 121,309.0 11,793.0 1,102.7 9.4% 25.3% 10.3x 110.0x
ServiceNow, Inc. United States 195.63 -5% 34,811.6 33,919.0 2,276.3 37.7 1.7% 40.5% 14.9x NM
Smartsheet Inc. United States 31.26 -8% 3,212.2 3,008.6 141.1 (39.2) NM 0.0% 21.3x NM
Synchronoss Technologies, Inc. United States 6.60 -58% 281.6 473.9 357.7 (59.4) NM -17.2% 1.3x NM
Talend S.A. France 69.74 -5% 2,083.9 1,991.9 176.5 (31.1) NM 39.5% 11.3x NM
Twilio Inc. United States 86.28 -3% 8,407.7 8,036.1 492.6 (77.7) NM 46.3% 16.3x NM
Varonis Systems, Inc. United States 73.25 -12% 2,140.4 1,981.7 244.1 (18.7) NM 32.4% 8.1x NM
Adjusted Weighted Average 9.3x 47.9x
LTM Multiples
*Calculation is market cap weighted and excludes revenue multiples that are 2.0 standard deviations above the mean (23.0x)and EBITDA multiples that are 1.0 standard deviations above the mean (111.3x)
*Calculation is market cap weighted and excludes revenue multiples that are 2.0 standard deviations above the mean (15.9x)and EBITDA multiples that are 1.0 standard deviations above the mean (69.9x)
31 | M&A and Investment Summary September 2018
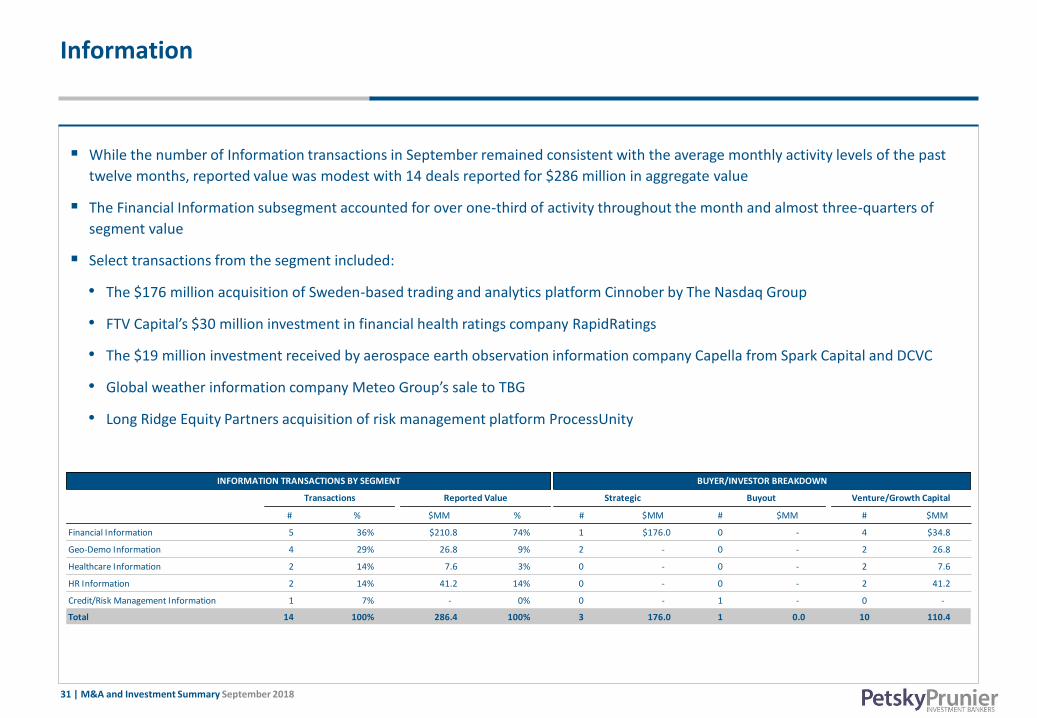
Information
▪ While the number of Information transactions in September remained consistent with the average monthly activity levels of the past
twelve months, reported value was modest with 14 deals reported for $286 million in aggregate value
▪ The Financial Information subsegment accounted for over one-third of activity throughout the month and almost three-quarters of
segment value
▪ Select transactions from the segment included:
• The $176 million acquisition of Sweden-based trading and analytics platform Cinnober by The Nasdaq Group
• FTV Capital’s $30 million investment in financial health ratings company RapidRatings
• The $19 million investment received by aerospace earth observation information company Capella from Spark Capital and DCVC
• Global weather information company Meteo Group’s sale to TBG
• Long Ridge Equity Partners acquisition of risk management platform ProcessUnity
# % $MM % # $MM # $MM # $MM
Financial Information 5 36% $210.8 74% 1 $176.0 0 - 4 $34.8
Geo-Demo Information 4 29% 26.8 9% 2 - 0 - 2 26.8
Healthcare Information 2 14% 7.6 3% 0 - 0 - 2 7.6
HR Information 2 14% 41.2 14% 0 - 0 - 2 41.2
Credit/Risk Management Information 1 7% - 0% 0 - 1 - 0 -
Total 14 100% 286.4 100% 3 176.0 1 0.0 10 110.4
INFORMATION TRANSACTIONS BY SEGMENT BUYER/INVESTOR BREAKDOWN
Transactions Reported Value Strategic Buyout Venture/Growth Capital
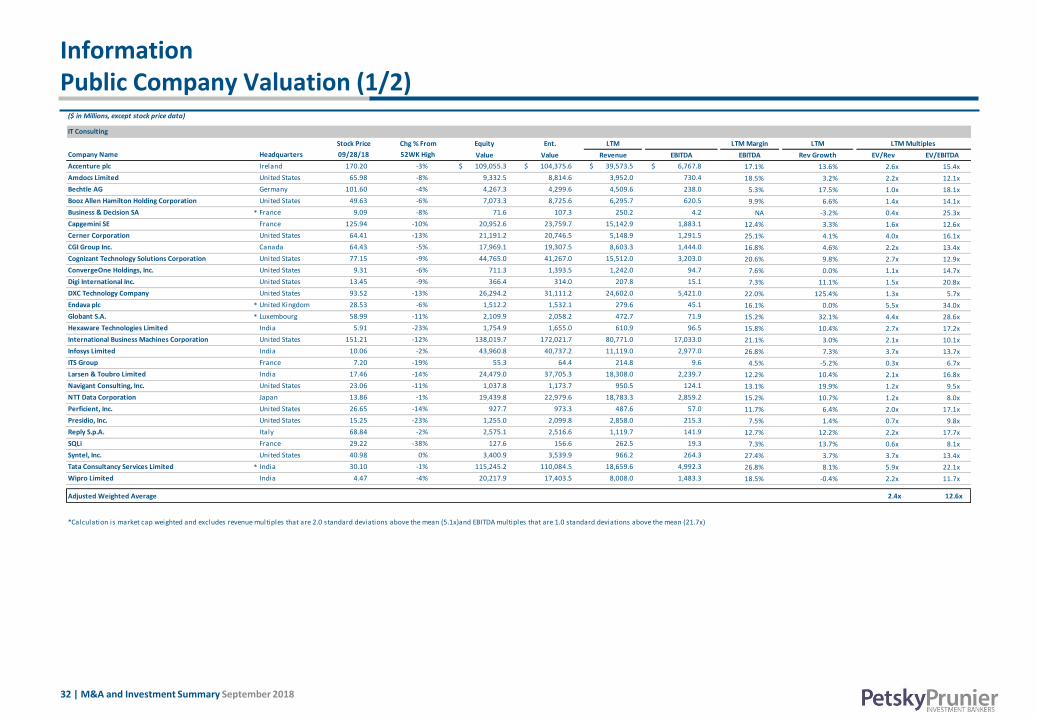
32 | M&A and Investment Summary September 2018
InformationPublic Company Valuation (1/2)
($ in Millions, except stock price data)
IT Consulting
Stock Price Chg % From Equity Ent. LTM LTM Margin LTM LTM Multiples
Company Name Headquarters 09/28/18 52WK High Value Value Revenue EBITDA EBITDA Rev Growth EV/Rev EV/EBITDA
Accenture plc Ireland 170.20 -3% $ 109,055.3 $ 104,375.6 $ 39,573.5 $ 6,767.8 17.1% 13.6% 2.6x 15.4x
Amdocs Limited United States 65.98 -8% 9,332.5 8,814.6 3,952.0 730.4 18.5% 3.2% 2.2x 12.1x
Bechtle AG Germany 101.60 -4% 4,267.3 4,299.6 4,509.6 238.0 5.3% 17.5% 1.0x 18.1x
Booz Allen Hamilton Holding Corporation United States 49.63 -6% 7,073.3 8,725.6 6,295.7 620.5 9.9% 6.6% 1.4x 14.1x
Business & Decision SA * France 9.09 -8% 71.6 107.3 250.2 4.2 NA -3.2% 0.4x 25.3x
Capgemini SE France 125.94 -10% 20,952.6 23,759.7 15,142.9 1,883.1 12.4% 3.3% 1.6x 12.6x
Cerner Corporation United States 64.41 -13% 21,191.2 20,746.5 5,148.9 1,291.5 25.1% 4.1% 4.0x 16.1x
CGI Group Inc. Canada 64.43 -5% 17,969.1 19,307.5 8,603.3 1,444.0 16.8% 4.6% 2.2x 13.4x
Cognizant Technology Solutions Corporation United States 77.15 -9% 44,765.0 41,267.0 15,512.0 3,203.0 20.6% 9.8% 2.7x 12.9x
ConvergeOne Holdings, Inc. United States 9.31 -6% 711.3 1,393.5 1,242.0 94.7 7.6% 0.0% 1.1x 14.7x
Digi International Inc. United States 13.45 -9% 366.4 314.0 207.8 15.1 7.3% 11.1% 1.5x 20.8x
DXC Technology Company United States 93.52 -13% 26,294.2 31,111.2 24,602.0 5,421.0 22.0% 125.4% 1.3x 5.7x
Endava plc * United Kingdom 28.53 -6% 1,512.2 1,532.1 279.6 45.1 16.1% 0.0% 5.5x 34.0x
Globant S.A. * Luxembourg 58.99 -11% 2,109.9 2,058.2 472.7 71.9 15.2% 32.1% 4.4x 28.6x
Hexaware Technologies Limited India 5.91 -23% 1,754.9 1,655.0 610.9 96.5 15.8% 10.4% 2.7x 17.2x
International Business Machines Corporation United States 151.21 -12% 138,019.7 172,021.7 80,771.0 17,033.0 21.1% 3.0% 2.1x 10.1x
Infosys Limited India 10.06 -2% 43,960.8 40,737.2 11,119.0 2,977.0 26.8% 7.3% 3.7x 13.7x
ITS Group France 7.20 -19% 55.3 64.4 214.8 9.6 4.5% -5.2% 0.3x 6.7x
Larsen & Toubro Limited India 17.46 -14% 24,479.0 37,705.3 18,308.0 2,239.7 12.2% 10.4% 2.1x 16.8x
Navigant Consulting, Inc. United States 23.06 -11% 1,037.8 1,173.7 950.5 124.1 13.1% 19.9% 1.2x 9.5x
NTT Data Corporation Japan 13.86 -1% 19,439.8 22,979.6 18,783.3 2,859.2 15.2% 10.7% 1.2x 8.0x
Perficient, Inc. United States 26.65 -14% 927.7 973.3 487.6 57.0 11.7% 6.4% 2.0x 17.1x
Presidio, Inc. United States 15.25 -23% 1,255.0 2,099.8 2,858.0 215.3 7.5% 1.4% 0.7x 9.8x
Reply S.p.A. Italy 68.84 -2% 2,575.1 2,516.6 1,119.7 141.9 12.7% 12.2% 2.2x 17.7x
SQLi France 29.22 -38% 127.6 156.6 262.5 19.3 7.3% 13.7% 0.6x 8.1x
Syntel, Inc. United States 40.98 0% 3,400.9 3,539.9 966.2 264.3 27.4% 3.7% 3.7x 13.4x
Tata Consultancy Services Limited * India 30.10 -1% 115,245.2 110,084.5 18,659.6 4,992.3 26.8% 8.1% 5.9x 22.1x
Wipro Limited India 4.47 -4% 20,217.9 17,403.5 8,008.0 1,483.3 18.5% -0.4% 2.2x 11.7x
Adjusted Weighted Average 2.4x 12.6x
*Calculation is market cap weighted and excludes revenue multiples that are 2.0 standard deviations above the mean (5.1x)and EBITDA multiples that are 1.0 standard deviations above the mean (21.7x)

33 | M&A and Investment Summary September 2018
InformationPublic Company Valuation (2/2)
($ in Millions, except stock price data)
Marketing Information
Stock Price Chg % From Equity Ent. LTM LTM Margin LTM LTM Multiples
Company Name Headquarters 09/28/18 52WK High Value Value Revenue EBITDA EBITDA Rev Growth EV/Rev EV/EBITDA
Acxiom Holdings, Inc. * United States $49.41 -4% $ 3,837.3 $ 3,971.0 $ 931.9 $ 96.6 10.4% 6.1% 4.3x 41.1x
Alliance Data Systems Corporation United States 236.16 -15% 12,975.5 33,649.3 7,806.7 1,772.5 22.7% 5.3% 4.3x 19.0x
Cello Health plc United Kingdom 1.76 -4% 184.4 191.5 223.2 16.5 7.4% 3.7% 0.9x 11.6x
Ebiquity plc United Kingdom 0.59 -61% 43.7 78.9 116.4 12.9 11.1% 2.6% 0.7x 6.1x
Harte Hanks, Inc. United States 7.13 -41% 44.5 34.0 345.1 (0.6) NM -13.1% 0.1x NM
InnerWorkings, Inc. United States 7.92 -34% 409.3 548.8 1,150.4 27.5 2.4% 4.7% 0.5x 20.0x
INTAGE HOLDINGS Inc. Japan 9.16 -31% 377.0 281.2 456.0 47.2 10.3% 4.1% 0.6x 6.0x
Ipsos SA France 30.63 -24% 1,333.8 1,894.2 2,021.5 232.2 11.5% -2.8% 0.9x 8.2x
Nielsen Holdings plc United Kingdom 27.66 -34% 9,825.0 18,286.0 6,659.0 1,657.0 24.9% 4.1% 2.7x 11.0x
Pearson plc United Kingdom 11.61 -9% 8,999.0 10,115.7 5,714.8 749.5 13.1% -8.5% 1.8x 13.5x
System1 Group PLC United Kingdom 2.73 -62% 34.3 26.9 37.8 3.0 8.0% -13.7% 0.7x 8.9x
YouGov plc * United Kingdom 6.13 -8% 646.8 619.1 159.1 21.3 13.4% 14.2% 3.9x 29.0x
Adjusted Weighted Average 3.1x 14.6x
($ in Millions, except stock price data)
Other Information
Stock Price Chg % From Equity Ent. LTM LTM Margin LTM LTM Multiples
Company Name Headquarters 09/28/18 52WK High Value Value Revenue EBITDA EBITDA Rev Growth EV/Rev EV/EBITDA
Fluent, Inc. United States $ 2.15 -69% $ 161.9 $ 215.3 $ 233.0 $ 7.9 3.4% 12.8% 0.9x 27.3x
Forrester Research, Inc. United States 45.90 -8% 829.6 686.5 344.8 31.6 9.2% 5.2% 2.0x 21.7x
Gartner, Inc. * United States 158.50 -2% 14,394.7 16,683.7 3,807.5 507.1 13.3% 38.6% 4.4x 32.9x
HealthStream, Inc. United States 31.01 -3% 1,002.3 836.8 254.6 29.0 11.4% 14.7% 3.3x 28.9x
IQVIA Holdings Inc. United States 129.74 -1% 26,283.6 36,339.6 8,475.0 1,786.0 21.1% 8.6% 4.3x 20.3x
Informa plc United Kingdom 9.94 -12% 12,439.6 16,040.2 2,374.3 749.2 31.6% 11.6% 6.8x 21.4x
National Research Corporation United States 38.60 -10% 954.9 987.9 117.9 37.4 31.8% 3.3% 8.4x 26.4x
NIC Inc. United States 14.80 -22% 985.1 812.4 347.2 86.5 24.9% 6.1% 2.3x 9.4x
Premier, Inc. United States 45.78 0% 2,438.8 2,393.6 1,661.3 695.8 41.9% 14.2% 1.4x 3.4x
Proofpoint, Inc. United States 106.33 -18% 5,588.3 5,658.3 611.5 (36.0) NM 37.5% 9.3x NM
Reed Elsevier plc(1) United Kingdom 21.08 -9% 41,542.0 49,750.3 9,637.7 2,930.6 30.4% -0.5% 5.2x 17.0x
Wolters Kluwer N.V. Netherlands 62.37 -4% 17,025.6 19,315.6 4,984.2 1,402.4 28.1% -3.2% 3.9x 13.8x
Adjusted Weighted Average 4.9x 17.7x
*Calculation is market cap weighted and excludes revenue multiples that are 2.0 standard deviations above the mean (5.0x)and EBITDA multiples that are 1.0 standard deviations above the mean (26.7x)
(1) All financials are representative of the Reed Elsevier combined businesses, except per stock data, which represents Reed Elsevier (LSE:REL)
*Calculation is market cap weighted and excludes revenue multiples that are 2.0 standard deviations above the mean (9.7x)and EBITDA multiples that are 1.0 standard deviations above the mean (29.0x)

34 | M&A and Investment Summary September 2018
Business & IT Services
▪ September was an active month for the Business & IT Services segment with 74 transactions valued at nearly $7.2 billion
▪ IT Consulting transactions accounted for more than forty percent of all transactions throughout the month with 31 deals announced
▪ The 50 strategic transactions announced in the segment were valued at $6.6 billion
▪ Select transaction from the segment include:
• Marsh & McLennan’s acquisition of risk and insurance and employee benefits company Jardine Lloyd Thompson Group in a transaction valued at $5.6 billion
• Digital Realty’s $1.8 billion acquisition of Brazil-based cloud computing and managed hosting solutions provider Ascenty
• Online education company MasterClass’ $80 million Series D funding round from IVP, New Enterprise Associates, Javelin Ventures, Advancit Capital, Atomico, and Evolution Media.
• Insight Enterprises’ $79 million acquisition of IT solutions provider Cardinal Solutions Group
• Infosys’s acquisition of Sweden-based Salesforce consulting firm Fluido
# % $MM % # $MM # $MM # $MM
IT Consulting 31 42% $40.0 1% 24 - 4 - 3 $40.0
Corporate Training 17 23% 802.1 11% 6 540.3 1 140.0 10 121.8
Healthcare Consulting 4 5% 170.0 2% 2 170.0 1 - 1 -
BPO 3 4% 43.7 1% 1 - 1 - 1 43.7
Financial Consulting 3 4% 5.5 0% 2 - 0 - 1 5.5
HR Consulting 3 4% - 0% 3 - 0 - 0 -
Management Consulting 3 4% - 0% 3 - 0 - 0 -
Other 10 14% 6,097.2 85% 9 5,897.2 1 200.0 0 0.0
Total 74 100% 7,158.4 100% 50 6,607.4 8 340.0 16 211.0
*Other includes Staffing
BUSINESS SERVICES TRANSACTIONS BY SEGMENT BUYER/INVESTOR BREAKDOWN
Transactions Reported Value Strategic Buyout Venture/Growth Capital

35 | M&A and Investment Summary September 2018
Business & IT ServicesPublic Company Valuation (1/3)
($ in Millions, except stock price data)
Consulting
Stock Price Chg % From Equity Ent. LTM LTM Margin LTM
Company Name Headquarters 09/28/18 52WK High Value Value Revenue EBITDA EBITDA Rev Growth EV/Rev EV/EBITDA
Accenture plc Ireland 170.20 -3% $ 109,055.3 $ 104,375.6 $ 39,573.5 $ 6,767.8 17.1% 13.6% 2.6x 15.4x
CRA International, Inc. United States 50.22 -15% 405.8 417.9 393.4 28.2 7.2% 14.7% 1.1x 14.8x
FTI Consulting, Inc. United States 73.19 -11% 2,713.7 2,968.8 1,926.5 252.5 13.1% 8.8% 1.5x 11.8x
Information Services Group, Inc. United States 4.78 -12% 215.6 304.4 274.9 25.5 9.3% 14.1% 1.1x 11.9x
Navigant Consulting, Inc. United States 23.06 -11% 1,037.8 1,173.7 950.5 124.1 13.1% 19.9% 1.2x 9.5x
ICF International, Inc. United States 75.45 -8% 1,423.0 1,660.3 1,253.6 111.2 8.9% 4.6% 1.3x 14.9x
Huron Consulting Group Inc. * United States 49.40 -2% 1,064.2 1,406.5 753.5 90.3 12.0% 3.0% 1.9x 15.6x
The Hackett Group, Inc. United States 20.15 -2% 593.7 593.9 267.5 41.8 15.6% 1.9% 2.2x 14.2x
Adjusted Weighted Average 1.5x 12.4x
($ in Millions, except stock price data)
HR Services
Stock Price Chg % From Equity Ent. LTM LTM Margin LTM
Company Name Headquarters 09/28/18 52WK High Value Value Revenue EBITDA EBITDA Rev Growth EV/Rev EV/EBITDA
Automatic Data Processing, Inc. * United States 150.66 0% $ 65,904.7 $ 65,733.8 $ 13,325.8 $ 2,918.1 21.9% 7.6% 4.9x 22.5x
Barrett Business Services, Inc. United States 66.78 -32% 491.5 461.5 940.4 35.1 3.7% 6.7% 0.5x 13.1x
Capita plc United Kingdom 1.86 -76% 3,087.8 4,286.7 5,436.2 535.5 9.8% -5.1% 0.8x 8.0x
DHI Group, Inc. United States 2.10 -35% 112.8 121.8 188.0 26.9 14.3% -12.8% 0.6x 4.5x
Edenred SA France 38.14 -9% 9,047.4 10,586.9 1,512.1 536.7 35.5% 8.5% 7.0x 19.7x
Insperity, Inc. * United States 117.95 -3% 4,944.9 4,733.4 3,558.7 177.2 5.0% 14.4% 1.3x 26.7x
Marsh & McLennan Companies, Inc. United States 82.72 -6% 41,771.9 47,068.9 14,760.0 3,505.0 23.7% 9.4% 3.2x 13.4x
Paychex, Inc. United States 73.65 -3% 26,491.4 26,067.2 3,380.9 1,425.5 42.2% 7.3% 7.7x 18.3x
TriNet Group, Inc. United States 56.32 -6% 3,973.4 4,165.4 3,378.0 284.0 8.4% 5.9% 1.2x 14.7x
WageWorks, Inc. United States 42.75 -35% 1,694.5 1,046.9 461.7 91.7 19.9% 33.1% 2.3x 11.4x
Adjusted Weighted Average 4.7x 15.4x
*Calculation is market cap weighted and excludes revenue multiples that are 2.0 standard deviations above the mean (2.4x)and EBITDA multiples that are 1.0 standard deviations above the mean (15.2x)
LTM Multiples
LTM Multiples
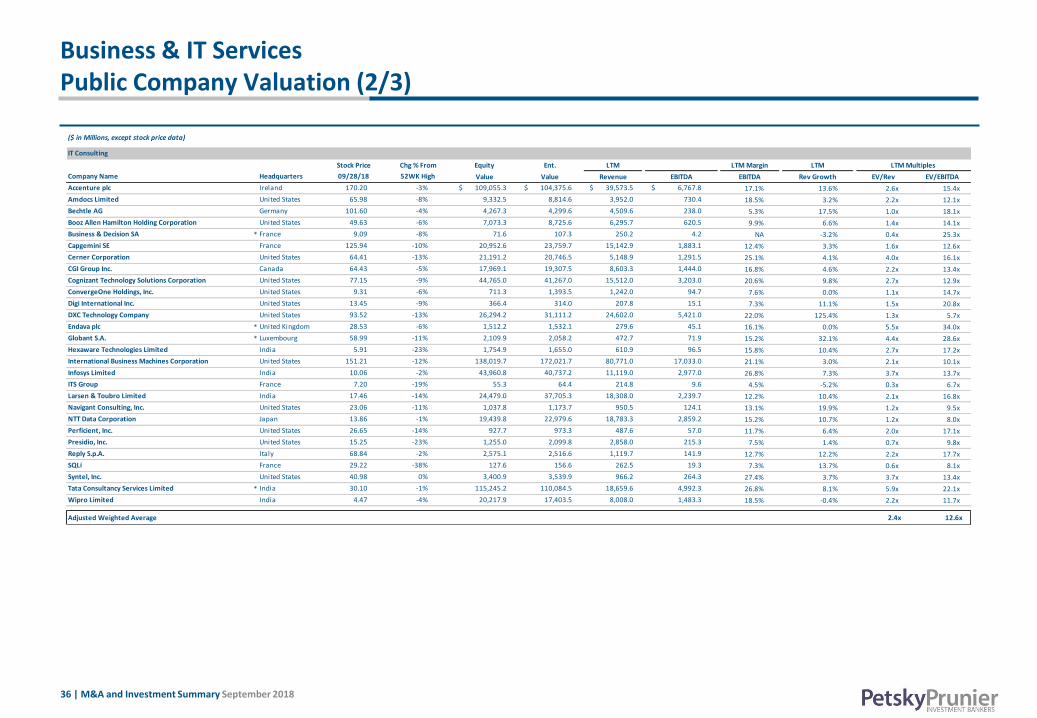
36 | M&A and Investment Summary September 2018
Business & IT ServicesPublic Company Valuation (2/3)
($ in Millions, except stock price data)
IT Consulting
Stock Price Chg % From Equity Ent. LTM LTM Margin LTM LTM Multiples
Company Name Headquarters 09/28/18 52WK High Value Value Revenue EBITDA EBITDA Rev Growth EV/Rev EV/EBITDA
Accenture plc Ireland 170.20 -3% $ 109,055.3 $ 104,375.6 $ 39,573.5 $ 6,767.8 17.1% 13.6% 2.6x 15.4x
Amdocs Limited United States 65.98 -8% 9,332.5 8,814.6 3,952.0 730.4 18.5% 3.2% 2.2x 12.1x
Bechtle AG Germany 101.60 -4% 4,267.3 4,299.6 4,509.6 238.0 5.3% 17.5% 1.0x 18.1x
Booz Allen Hamilton Holding Corporation United States 49.63 -6% 7,073.3 8,725.6 6,295.7 620.5 9.9% 6.6% 1.4x 14.1x
Business & Decision SA * France 9.09 -8% 71.6 107.3 250.2 4.2 NA -3.2% 0.4x 25.3x
Capgemini SE France 125.94 -10% 20,952.6 23,759.7 15,142.9 1,883.1 12.4% 3.3% 1.6x 12.6x
Cerner Corporation United States 64.41 -13% 21,191.2 20,746.5 5,148.9 1,291.5 25.1% 4.1% 4.0x 16.1x
CGI Group Inc. Canada 64.43 -5% 17,969.1 19,307.5 8,603.3 1,444.0 16.8% 4.6% 2.2x 13.4x
Cognizant Technology Solutions Corporation United States 77.15 -9% 44,765.0 41,267.0 15,512.0 3,203.0 20.6% 9.8% 2.7x 12.9x
ConvergeOne Holdings, Inc. United States 9.31 -6% 711.3 1,393.5 1,242.0 94.7 7.6% 0.0% 1.1x 14.7x
Digi International Inc. United States 13.45 -9% 366.4 314.0 207.8 15.1 7.3% 11.1% 1.5x 20.8x
DXC Technology Company United States 93.52 -13% 26,294.2 31,111.2 24,602.0 5,421.0 22.0% 125.4% 1.3x 5.7x
Endava plc * United Kingdom 28.53 -6% 1,512.2 1,532.1 279.6 45.1 16.1% 0.0% 5.5x 34.0x
Globant S.A. * Luxembourg 58.99 -11% 2,109.9 2,058.2 472.7 71.9 15.2% 32.1% 4.4x 28.6x
Hexaware Technologies Limited India 5.91 -23% 1,754.9 1,655.0 610.9 96.5 15.8% 10.4% 2.7x 17.2x
International Business Machines Corporation United States 151.21 -12% 138,019.7 172,021.7 80,771.0 17,033.0 21.1% 3.0% 2.1x 10.1x
Infosys Limited India 10.06 -2% 43,960.8 40,737.2 11,119.0 2,977.0 26.8% 7.3% 3.7x 13.7x
ITS Group France 7.20 -19% 55.3 64.4 214.8 9.6 4.5% -5.2% 0.3x 6.7x
Larsen & Toubro Limited India 17.46 -14% 24,479.0 37,705.3 18,308.0 2,239.7 12.2% 10.4% 2.1x 16.8x
Navigant Consulting, Inc. United States 23.06 -11% 1,037.8 1,173.7 950.5 124.1 13.1% 19.9% 1.2x 9.5x
NTT Data Corporation Japan 13.86 -1% 19,439.8 22,979.6 18,783.3 2,859.2 15.2% 10.7% 1.2x 8.0x
Perficient, Inc. United States 26.65 -14% 927.7 973.3 487.6 57.0 11.7% 6.4% 2.0x 17.1x
Presidio, Inc. United States 15.25 -23% 1,255.0 2,099.8 2,858.0 215.3 7.5% 1.4% 0.7x 9.8x
Reply S.p.A. Italy 68.84 -2% 2,575.1 2,516.6 1,119.7 141.9 12.7% 12.2% 2.2x 17.7x
SQLi France 29.22 -38% 127.6 156.6 262.5 19.3 7.3% 13.7% 0.6x 8.1x
Syntel, Inc. United States 40.98 0% 3,400.9 3,539.9 966.2 264.3 27.4% 3.7% 3.7x 13.4x
Tata Consultancy Services Limited * India 30.10 -1% 115,245.2 110,084.5 18,659.6 4,992.3 26.8% 8.1% 5.9x 22.1x
Wipro Limited India 4.47 -4% 20,217.9 17,403.5 8,008.0 1,483.3 18.5% -0.4% 2.2x 11.7x
Adjusted Weighted Average 2.4x 12.6x

37 | M&A and Investment Summary September 2018
Business & IT ServicesPublic Company Valuation (3/3)
($ in Millions, except stock price data)
Outsourced Services
Stock Price Chg % From Equity Ent. LTM LTM Margin LTM LTM Multiples
Company Name Headquarters 09/28/18 52WK High Value Value Revenue EBITDA EBITDA Rev Growth EV/Rev EV/EBITDA
AMREP Corporation United States $7.31 -26% $ 59.4 $ 46.4 $ 40.1 $ 2.0 5.1% -0.2% 1.2x 22.9x
Cimpress N.V. Netherlands 136.61 -20% 4,220.2 5,236.6 2,592.5 264.9 10.2% 21.4% 2.0x 19.8x
Communisis plc United Kingdom 0.68 -28% 142.5 173.5 516.0 33.5 6.5% 8.5% 0.3x 5.2x
Convergys Corporation United States 23.74 -11% 2,162.3 2,218.3 2,701.3 328.7 12.2% -7.3% 0.8x 6.7x
CSG Systems International, Inc. United States 40.14 -18% 1,345.1 1,520.1 819.1 139.9 17.1% 6.4% 1.9x 10.9x
Elanders AB (publ) Sweden 10.24 -9% 361.9 690.5 1,113.1 61.1 5.5% 15.8% 0.6x 11.3x
Eniro AB (publ) Sweden 0.23 -95% 15.3 117.8 160.1 17.4 10.9% -22.2% 0.7x 6.8x
ExlService Holdings, Inc. United States 66.20 -1% 2,271.5 2,106.7 807.3 112.9 14.0% 12.0% 2.6x 18.7x
Firstsource Solutions Limited India 0.85 -26% 587.2 653.9 522.3 67.9 13.0% 1.0% 1.3x 9.6x
Genpact Limited Bermuda 30.61 -12% 5,814.3 6,717.7 2,860.7 414.6 14.5% 9.0% 2.3x 16.2x
InnerWorkings, Inc. United States 7.92 -34% 409.3 548.8 1,150.4 27.5 2.4% 4.7% 0.5x 20.0x
j2 Global, Inc. United States 82.85 -10% 4,079.8 4,730.1 1,158.5 421.8 36.4% 17.0% 4.1x 11.2x
Liq Participações S.A. Brazil 0.23 -84% 1.7 12.7 397.6 8.2 2.1% -19.2% 0.0x 1.6x
Luxoft Holding, Inc. Switzerland 47.35 -20% 1,588.2 1,509.2 910.3 100.8 11.1% 11.5% 1.7x 15.0x
MAXIMUS, Inc. United States 65.06 -11% 4,179.3 3,934.0 2,454.7 365.8 14.9% 0.1% 1.6x 10.8x
Quad/Graphics, Inc. United States 20.84 -33% 1,076.9 2,127.1 4,152.6 428.6 10.3% -1.5% 0.5x 5.0x
IQVIA Holdings Inc. United States 129.74 -1% 26,283.6 36,339.6 8,475.0 1,786.0 21.1% 8.6% 4.3x 20.3x
R.R. Donnelley & Sons Company United States 5.40 -49% 380.2 2,392.9 7,048.0 424.0 6.0% 2.7% 0.3x 5.6x
Serco Group plc United Kingdom 1.28 -18% 1,390.9 1,718.4 3,711.1 83.9 2.3% -7.0% 0.5x 20.5x
StarTek, Inc. United States 6.62 -19% 244.9 275.5 269.8 4.7 1.8% -12.1% 1.0x 58.0x
SYNNEX Corporation United States 84.70 -40% 3,356.5 4,809.5 19,113.5 711.9 3.7% 27.3% 0.3x 6.8x
Sykes Enterprises, Incorporated United States 30.49 -5% 1,287.9 1,215.5 1,637.7 162.0 9.9% 6.7% 0.7x 7.5x
Teleperformance SE France 188.80 -5% 10,905.0 12,395.7 4,864.1 737.4 15.2% 3.2% 2.5x 16.8x
TTEC Holdings, Inc. United States 25.90 -41% 1,195.9 1,421.4 1,510.8 178.6 11.8% 12.0% 0.9x 8.0x
transcosmos inc. Japan 25.33 -14% 1,050.7 942.7 2,452.5 84.6 3.4% 9.8% 0.4x 11.1x
Transcontinental Inc. Canada 17.72 -30% 1,559.2 2,702.9 1,777.8 383.3 21.6% 14.0% 1.5x 7.1x
Adjusted Weighted Average 1.3x 12.2x

38 | M&A and Investment Summary September 2018
PPLLC IndicesValuation Summary
Public Company Index MEAN MEDIAN W. AVG ADJ. W. AVG*
US-based Digital Media and Internet 4.6x 3.8x 6.3x 4.3x
Internationally-based Digital Media and Internet 3.9x 3.5x 4.9x 3.4x
US-based eCommerce 4.6x 2.7x 5.1x 4.2x
Internationally-based eCommerce 5.7x 1.7x 10.3x 4.6x
US-based Digital Advertising 4.4x 3.5x 7.0x 3.7x
Internationally-based Digital Advertising 2.9x 1.0x 9.4x 2.4x
US-based Marketing Technology 7.5x 6.6x 7.8x 6.2x
Internationally-based Marketing Technology 7.1x 4.1x 6.7x 5.6x
Agency 1.2x 1.2x 1.3x 1.3x
Marketing Services 1.9x 1.1x 3.9x 3.0x
Traditional Media 3.3x 2.5x 3.7x 3.5x
Software 8.0x 7.2x 8.0x 7.8x
Information 5.1x 4.3x 7.1x 6.6x
Business Services 1.4x 1.2x 2.9x 2.3x
As of close of business on 09/28/18
Current Summary Trading Valuation Information
Revenue Multiples (TTM)
*Calculation is market cap weighted and excludes revenue multiples that are 3 standard deviations above the mean and EBITDA multiples that are 2
standard deviations above the mean

39 | M&A and Investment Summary September 2018
PPLLC IndicesValuation Summary
Public Company Index MEAN MEDIAN W. AVG ADJ. W. AVG*
US-based Digital Media and Internet 24.1x 21.1x 15.5x 26.3x
Internationally-based Digital Media and Internet 16.5x 14.8x 13.1x 16.0x
US-based eCommerce 27.9x 18.2x 26.9x 19.3x
Internationally-based eCommerce 17.9x 10.2x 26.7x 17.1x
US-based Digital Advertising 37.0x 28.4x 19.1x 23.9x
Internationally-based Digital Advertising 10.9x 6.9x 5.0x 11.5x
US-based Marketing Technology 46.2x 32.1x 35.8x 23.8x
Internationally-based Marketing Technology 20.1x 14.5x 16.3x 19.5x
Agency 11.1x 9.3x 9.0x 8.8x
Marketing Services 14.4x 10.9x 20.5x 13.2x
Traditional Media 17.5x 11.4x 14.2x 12.5x
Software 36.2x 25.6x 27.2x 20.1x
Information 21.2x 19.2x 25.3x 18.1x
Business Services 12.2x 11.7x 14.9x 41.7x
As of close of business on 09/28/18
Current Summary Trading Valuation Information
EBITDA Multiples (TTM)
*Calculation is market cap weighted and excludes revenue multiples that are 3 standard deviations above the mean and EBITDA multiples that are 2
standard deviations above the mean

40 | M&A and Investment Summary September 2018
Marketing Technology
Digital Advertising
PPLLC IndicesLTM Share Pricing Trends
LTM Index Performance
• S&P 500 – 15.7 %
• Digital Media/Commerce – 26.8 %
• Traditional Media – 6.4%
LTM Index Performance
• S&P 500 – 15.7 %
• Marketing Technology – 20.6%
LTM Index Performance
• S&P 500 – 15.7 %
• Digital Advertising – 20.1%
LTM Index Performance
• S&P 500 – 15.7 %
• Agency – (8.3) %
• Marketing Services – 23.9 %
Digital Media/Commerce and Traditional Media
Software LTM Index Performance
• S&P 500 – 15.7 %
• Software – 27.01 %
Agency & Marketing Services
Information & Business Services LTM Index Performance
• S&P 500 – 15.7 %
• Information – 19.1 %
• Business Services – 19.7 %
Note: LTM as of 9/28/2018
80%
95%
110%
125%
140%
155%
170%
Sep-17 Nov-17 Jan-18 Mar-18 May-18 Jul-18
Ind
ex P
erfo
rman
ce (
%)
Traditional Media S&P 500 Index (^SPX) Digital Media/Commerce
80%
90%
100%
110%
120%
130%
140%
150%
Sep-17 Nov-17 Jan-18 Mar-18 May-18 Jul-18
Ind
ex P
erfo
rman
ce (
%)
Marketing Technology S&P 500 Index (^SPX)
80%
90%
100%
110%
120%
130%
140%
150%
Sep-17 Nov-17 Jan-18 Mar-18 May-18 Jul-18
Ind
ex P
erfo
rman
ce (
%)
Agency Marketing Services S&P 500 Index (^SPX)
80%
90%
100%
110%
120%
130%
140%
150%
Sep-17 Nov-17 Jan-18 Mar-18 May-18 Jul-18
Ind
ex P
erfo
rman
ce (
%)
Digital Advertising S&P 500 Index (^SPX)
80%
90%
100%
110%
120%
130%
140%
150%
Sep-17 Nov-17 Jan-18 Mar-18 May-18 Jul-18
Ind
ex P
erfo
rman
ce (
%)
Software S&P 500 Index (^SPX)
80%
90%
100%
110%
120%
130%
140%
150%
Sep-17 Nov-17 Jan-18 Mar-18 May-18 Jul-18
Ind
ex P
erfo
rman
ce (
%)
Information Business Services S&P 500 Index (^SPX)
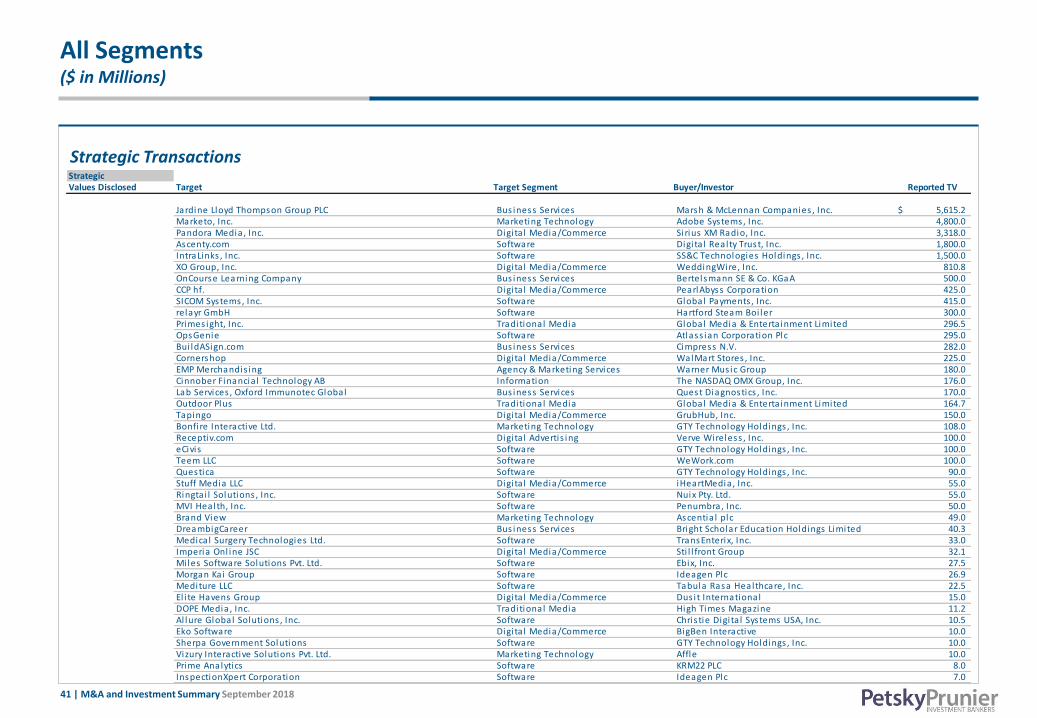
41 | M&A and Investment Summary September 2018
Strategic Transactions
All Segments($ in Millions)
StrategicValues Disclosed Target Target Segment Buyer/Investor Reported TV
Jardine Lloyd Thompson Group PLC Bus iness Services Marsh & McLennan Companies , Inc. 5,615.2$ Marketo, Inc. Marketing Technology Adobe Systems, Inc. 4,800.0 Pandora Media, Inc. Digi ta l Media/Commerce Sirius XM Radio, Inc. 3,318.0 Ascenty.com Software Digi ta l Realty Trust, Inc. 1,800.0 IntraLinks , Inc. Software SS&C Technologies Holdings , Inc. 1,500.0 XO Group, Inc. Digi ta l Media/Commerce WeddingWire, Inc. 810.8 OnCourse Learning Company Bus iness Services Bertelsmann SE & Co. KGaA 500.0 CCP hf. Digi ta l Media/Commerce PearlAbyss Corporation 425.0 SICOM Systems, Inc. Software Global Payments , Inc. 415.0 relayr GmbH Software Hartford Steam Boi ler 300.0 Primes ight, Inc. Traditional Media Global Media & Enterta inment Limited 296.5 OpsGenie Software Atlass ian Corporation Plc 295.0 Bui ldASign.com Bus iness Services Cimpress N.V. 282.0 Cornershop Digi ta l Media/Commerce WalMart Stores , Inc. 225.0 EMP Merchandis ing Agency & Marketing Services Warner Mus ic Group 180.0 Cinnober Financia l Technology AB Information The NASDAQ OMX Group, Inc. 176.0 Lab Services , Oxford Immunotec Global Bus iness Services Quest Diagnostics , Inc. 170.0 Outdoor Plus Traditional Media Global Media & Enterta inment Limited 164.7 Tapingo Digi ta l Media/Commerce GrubHub, Inc. 150.0 Bonfi re Interactive Ltd. Marketing Technology GTY Technology Holdings , Inc. 108.0 Receptiv.com Digita l Advertis ing Verve Wireless , Inc. 100.0 eCivis Software GTY Technology Holdings , Inc. 100.0 Teem LLC Software WeWork.com 100.0 Questica Software GTY Technology Holdings , Inc. 90.0 Stuff Media LLC Digi ta l Media/Commerce iHeartMedia, Inc. 55.0 Ringtai l Solutions , Inc. Software Nuix Pty. Ltd. 55.0 MVI Health, Inc. Software Penumbra, Inc. 50.0 Brand View Marketing Technology Ascentia l plc 49.0 DreambigCareer Bus iness Services Bright Scholar Education Holdings Limited 40.3 Medica l Surgery Technologies Ltd. Software TransEnterix, Inc. 33.0 Imperia Onl ine JSC Digi ta l Media/Commerce Sti l l front Group 32.1 Mi les Software Solutions Pvt. Ltd. Software Ebix, Inc. 27.5 Morgan Kai Group Software Ideagen Plc 26.9 Mediture LLC Software Tabula Rasa Healthcare, Inc. 22.5 El i te Havens Group Digi ta l Media/Commerce Dus it International 15.0 DOPE Media, Inc. Traditional Media High Times Magazine 11.2 Al lure Global Solutions , Inc. Software Chris tie Digi ta l Systems USA, Inc. 10.5 Eko Software Digi ta l Media/Commerce BigBen Interactive 10.0 Sherpa Government Solutions Software GTY Technology Holdings , Inc. 10.0 Vizury Interactive Solutions Pvt. Ltd. Marketing Technology Affle 10.0 Prime Analytics Software KRM22 PLC 8.0 InspectionXpert Corporation Software Ideagen Plc 7.0
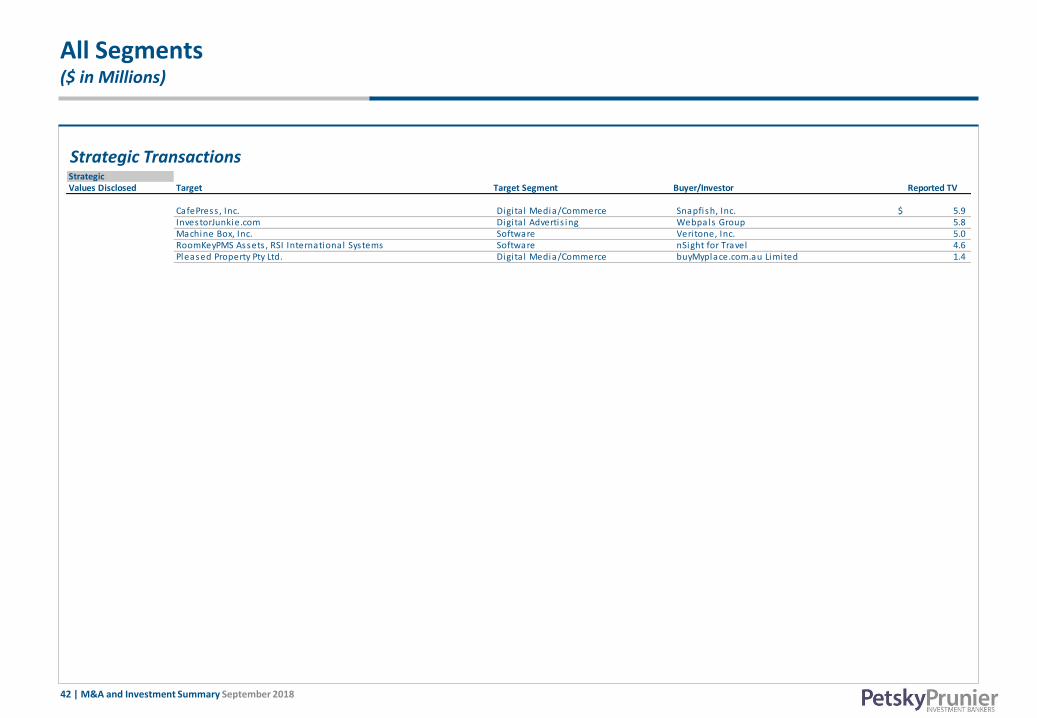
42 | M&A and Investment Summary September 2018
All Segments($ in Millions)
Strategic TransactionsStrategicValues Disclosed Target Target Segment Buyer/Investor Reported TV
CafePress , Inc. Digi ta l Media/Commerce Snapfish, Inc. 5.9$ InvestorJunkie.com Digita l Advertis ing Webpals Group 5.8 Machine Box, Inc. Software Veri tone, Inc. 5.0 RoomKeyPMS Assets , RSI International Systems Software nSight for Travel 4.6 Pleased Property Pty Ltd. Digi ta l Media/Commerce buyMyplace.com.au Limited 1.4
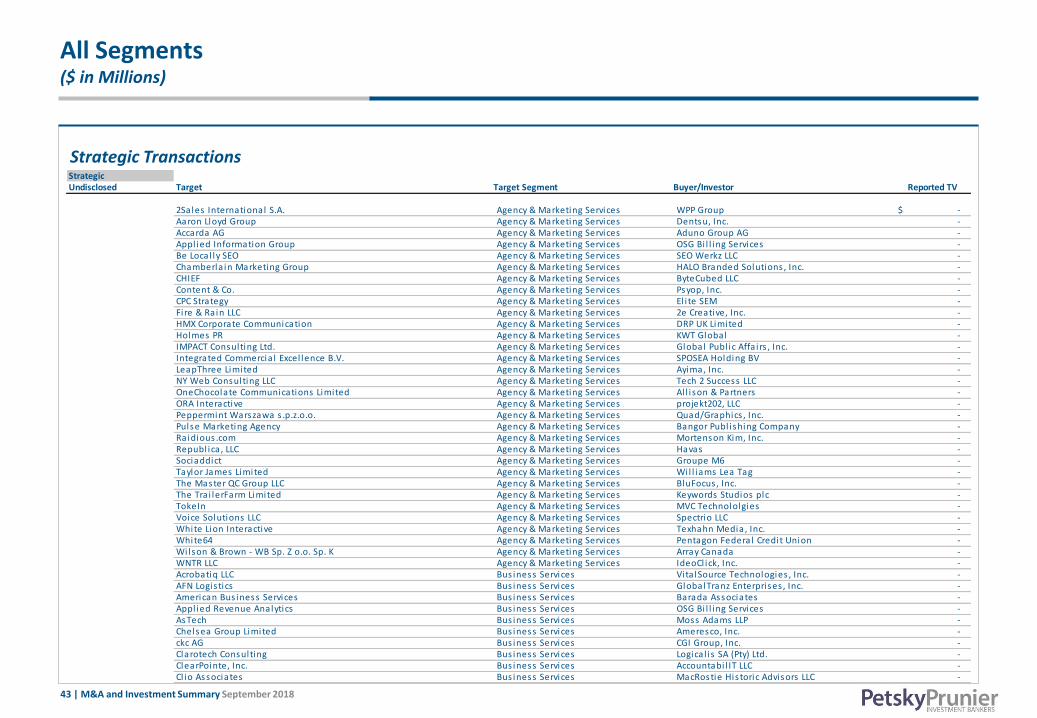
43 | M&A and Investment Summary September 2018
Strategic Transactions
All Segments($ in Millions)
StrategicUndisclosed Target Target Segment Buyer/Investor Reported TV
2Sales International S.A. Agency & Marketing Services WPP Group -$ Aaron Lloyd Group Agency & Marketing Services Dentsu, Inc. - Accarda AG Agency & Marketing Services Aduno Group AG - Appl ied Information Group Agency & Marketing Services OSG Bi l l ing Services - Be Local ly SEO Agency & Marketing Services SEO Werkz LLC - Chamberla in Marketing Group Agency & Marketing Services HALO Branded Solutions , Inc. - CHIEF Agency & Marketing Services ByteCubed LLC - Content & Co. Agency & Marketing Services Psyop, Inc. - CPC Strategy Agency & Marketing Services El i te SEM - Fi re & Rain LLC Agency & Marketing Services 2e Creative, Inc. - HMX Corporate Communication Agency & Marketing Services DRP UK Limited - Holmes PR Agency & Marketing Services KWT Global - IMPACT Consulting Ltd. Agency & Marketing Services Global Publ ic Affa i rs , Inc. - Integrated Commercia l Excel lence B.V. Agency & Marketing Services SPOSEA Holding BV - LeapThree Limited Agency & Marketing Services Ayima, Inc. - NY Web Consulting LLC Agency & Marketing Services Tech 2 Success LLC - OneChocolate Communications Limited Agency & Marketing Services Al l i son & Partners - ORA Interactive Agency & Marketing Services projekt202, LLC - Peppermint Warszawa s .p.z.o.o. Agency & Marketing Services Quad/Graphics , Inc. - Pulse Marketing Agency Agency & Marketing Services Bangor Publ ishing Company - Ra idious .com Agency & Marketing Services Mortenson Kim, Inc. - Republ ica , LLC Agency & Marketing Services Havas - Sociaddict Agency & Marketing Services Groupe M6 - Taylor James Limited Agency & Marketing Services Wi l l iams Lea Tag - The Master QC Group LLC Agency & Marketing Services BluFocus , Inc. - The Tra i lerFarm Limited Agency & Marketing Services Keywords Studios plc - TokeIn Agency & Marketing Services MVC Technololgies - Voice Solutions LLC Agency & Marketing Services Spectrio LLC - White Lion Interactive Agency & Marketing Services Texhahn Media, Inc. - White64 Agency & Marketing Services Pentagon Federal Credit Union - Wi lson & Brown - WB Sp. Z o.o. Sp. K Agency & Marketing Services Array Canada - WNTR LLC Agency & Marketing Services IdeoCl ick, Inc. - Acrobatiq LLC Bus iness Services Vita lSource Technologies , Inc. - AFN Logis tics Bus iness Services GlobalTranz Enterprises , Inc. - American Bus iness Services Bus iness Services Barada Associates - Appl ied Revenue Analytics Bus iness Services OSG Bi l l ing Services - AsTech Bus iness Services Moss Adams LLP - Chelsea Group Limited Bus iness Services Ameresco, Inc. - ckc AG Bus iness Services CGI Group, Inc. - Clarotech Consulting Bus iness Services Logica l i s SA (Pty) Ltd. - ClearPointe, Inc. Bus iness Services Accountabi l IT LLC - Cl io Associates Bus iness Services MacRostie His toric Advisors LLC -

44 | M&A and Investment Summary September 2018
All Segments($ in Millions)
Strategic TransactionsStrategicUndisclosed Target Target Segment Buyer/Investor Reported TV
CloudTrek Pty Ltd. Bus iness Services Deloitte LLP -$ Devs United Bus iness Services Marcus Thomas LLC - Dextra Digi ta l (Brazi l ) Bus iness Services Mutant - DonRiver, Inc. Bus iness Services Ciena Corporation - e/Doc Systems, Inc. Bus iness Services Novatech, Inc. - EOS Education LLC Bus iness Services Boxl ight Corporation - Flores & Associates Bus iness Services DirectPath LLC - Fluido Oy Bus iness Services Infosys Limited - HCP Advisors Bus iness Services BBG, Inc. - Henderson Scott Ltd. Bus iness Services Search Consultancy Limited - Idealware Bus iness Services Tech Impact - Infini ti Consulting Group LLC Bus iness Services InterVis ion Systems LLC - Inzenka Bus iness Services Sia Partners - Jayway Bus iness Services Devoteam - KnowledgeAdvisors Bus iness Services eXplorance, Inc. - LinkedMD LLC Bus iness Services HealthXL Limited - Lyunche Bus iness Services Souche.com - Marketing & Communications Solutions , Merri l l Corp Bus iness Services Toppan Vintage, Inc. - Mexia Bus iness Services Deloitte LLP - Misco Solutions B.V. Bus iness Services ComputaCenter plc - Open Query Bus iness Services Catalyst IT Austra l ia Pty Limited - ORBA Sp. Z o.o. Bus iness Services Lingaro sp. z o.o - Otto Henning GmbH Bus iness Services KPMG LLP - Predictive Service LLC Bus iness Services Lewel lyn Technology LLC - Ramsey Solutions LLC Bus iness Services A5 Corporation - Remedy Employer Services Bus iness Services CoAdvantage - SKT Consulting Bus iness Services Sia Partners - Specia l ty Insurance Consultants LLC Bus iness Services NFP Corporation - Steward Consulting, Inc. Bus iness Services BCS Prosoft, Inc. - System Partners Bus iness Services DXC Technology Company - Thresher Communication & Productivi ty, Inc. Bus iness Services Rahi Systems, Inc. - TM Solutions (TMS) Bus iness Services Chess ICT - TPGS Bus iness Services System One - Tra inologic Bus iness Services Jfrog, Inc. - Wise.is Bus iness Services Advania hf. - Betopin.com Digita l Advertis ing Thimba Media Limited - BetterLoanChoice.com LLC Digi ta l Advertis ing Digi ta l Media Solutions , LLC - Digi ta l Broker Unit of GetSafe GmbH Digi ta l Advertis ing Verivox GmbH - Jun Group Productions LLC Digi ta l Advertis ing Advantage Solutions , Inc. - MAX, Inc. Digi ta l Advertis ing AppLovin Corporation - Optimob Digi ta l Advertis ing Tune, Inc. - Point It!, Inc. Digi ta l Advertis ing Add3, LLC -
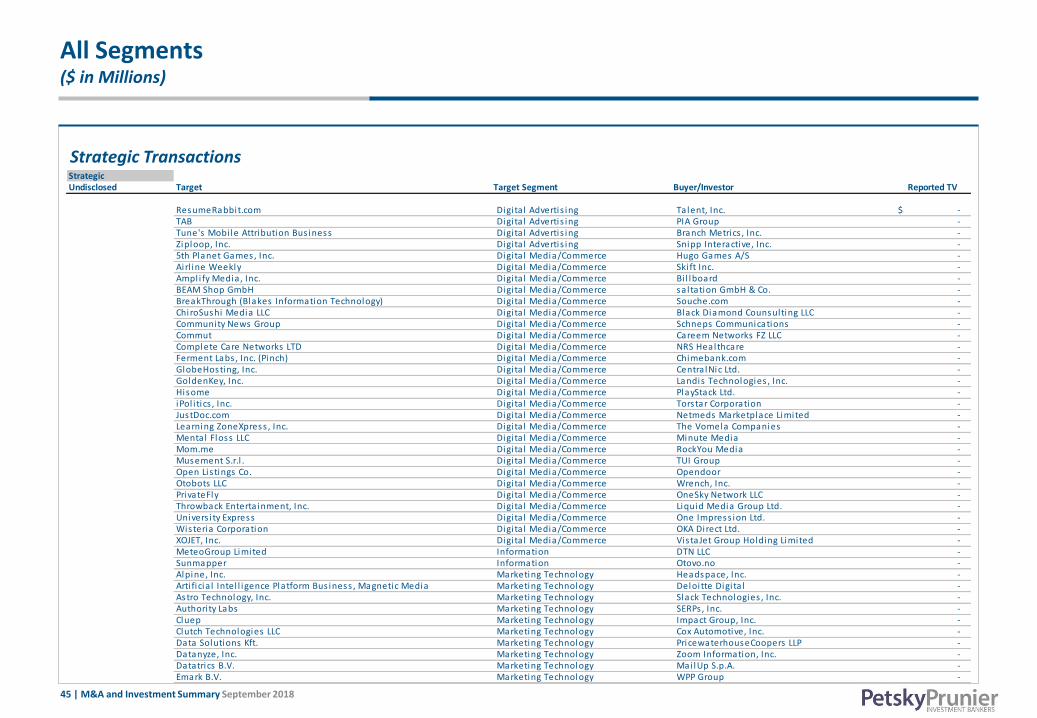
45 | M&A and Investment Summary September 2018
All Segments($ in Millions)
Strategic TransactionsStrategicUndisclosed Target Target Segment Buyer/Investor Reported TV
ResumeRabbit.com Digita l Advertis ing Talent, Inc. -$ TAB Digi ta l Advertis ing PIA Group - Tune's Mobi le Attribution Bus iness Digi ta l Advertis ing Branch Metrics , Inc. - Ziploop, Inc. Digi ta l Advertis ing Snipp Interactive, Inc. - 5th Planet Games, Inc. Digi ta l Media/Commerce Hugo Games A/S - Ai rl ine Weekly Digi ta l Media/Commerce Ski ft Inc. - Ampl i fy Media , Inc. Digi ta l Media/Commerce Bi l lboard - BEAM Shop GmbH Digi ta l Media/Commerce saltation GmbH & Co. - BreakThrough (Blakes Information Technology) Digi ta l Media/Commerce Souche.com - ChiroSushi Media LLC Digi ta l Media/Commerce Black Diamond Counsulting LLC - Community News Group Digi ta l Media/Commerce Schneps Communications - Commut Digi ta l Media/Commerce Careem Networks FZ LLC - Complete Care Networks LTD Digi ta l Media/Commerce NRS Healthcare - Ferment Labs , Inc. (Pinch) Digi ta l Media/Commerce Chimebank.com - GlobeHosting, Inc. Digi ta l Media/Commerce Centra lNic Ltd. - GoldenKey, Inc. Digi ta l Media/Commerce Landis Technologies , Inc. - Hisome Digi ta l Media/Commerce PlayStack Ltd. - iPol i tics , Inc. Digi ta l Media/Commerce Torstar Corporation - JustDoc.com Digita l Media/Commerce Netmeds Marketplace Limited - Learning ZoneXpress , Inc. Digi ta l Media/Commerce The Vomela Companies - Mental Floss LLC Digi ta l Media/Commerce Minute Media - Mom.me Digi ta l Media/Commerce RockYou Media - Musement S.r.l . Digi ta l Media/Commerce TUI Group - Open Lis tings Co. Digi ta l Media/Commerce Opendoor - Otobots LLC Digi ta l Media/Commerce Wrench, Inc. - PrivateFly Digi ta l Media/Commerce OneSky Network LLC - Throwback Enterta inment, Inc. Digi ta l Media/Commerce Liquid Media Group Ltd. - Univers i ty Express Digi ta l Media/Commerce One Impress ion Ltd. - Wisteria Corporation Digi ta l Media/Commerce OKA Direct Ltd. - XOJET, Inc. Digi ta l Media/Commerce VistaJet Group Holding Limited - MeteoGroup Limited Information DTN LLC - Sunmapper Information Otovo.no - Alpine, Inc. Marketing Technology Headspace, Inc. - Arti ficia l Intel l igence Platform Bus iness , Magnetic Media Marketing Technology Deloitte Digi ta l - Astro Technology, Inc. Marketing Technology Slack Technologies , Inc. - Authori ty Labs Marketing Technology SERPs , Inc. - Cluep Marketing Technology Impact Group, Inc. - Clutch Technologies LLC Marketing Technology Cox Automotive, Inc. - Data Solutions Kft. Marketing Technology PricewaterhouseCoopers LLP - Datanyze, Inc. Marketing Technology Zoom Information, Inc. - Datatrics B.V. Marketing Technology Mai lUp S.p.A. - Emark B.V. Marketing Technology WPP Group -
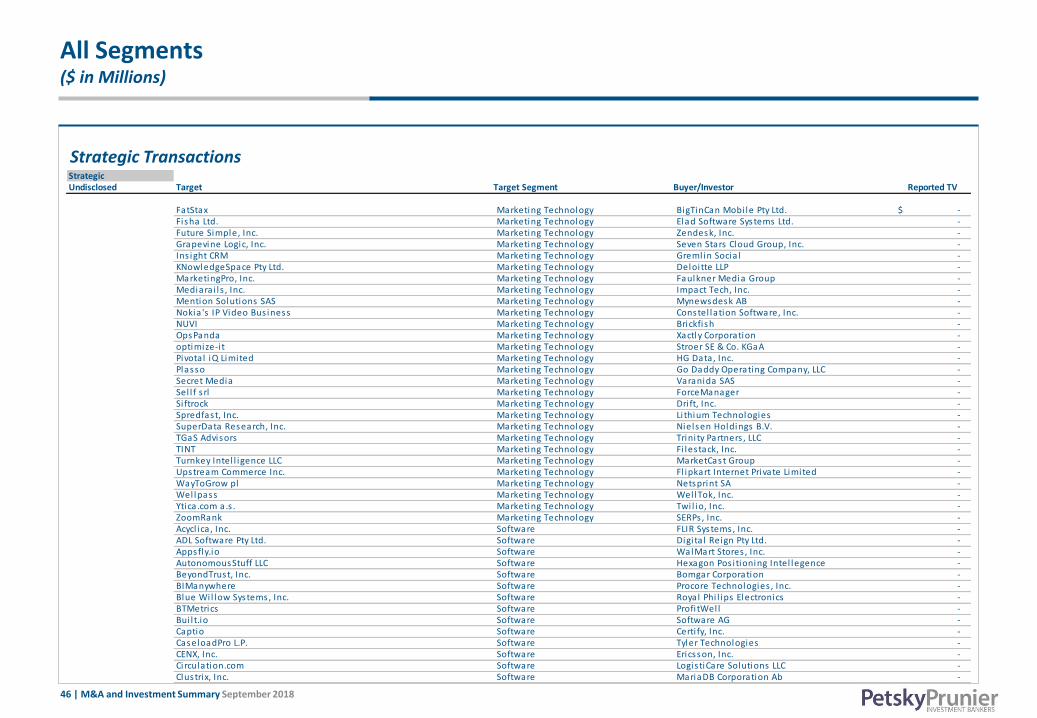
46 | M&A and Investment Summary September 2018
All Segments($ in Millions)
Strategic TransactionsStrategicUndisclosed Target Target Segment Buyer/Investor Reported TV
FatStax Marketing Technology BigTinCan Mobi le Pty Ltd. -$ Fisha Ltd. Marketing Technology Elad Software Systems Ltd. - Future Simple, Inc. Marketing Technology Zendesk, Inc. - Grapevine Logic, Inc. Marketing Technology Seven Stars Cloud Group, Inc. - Ins ight CRM Marketing Technology Greml in Socia l - KNowledgeSpace Pty Ltd. Marketing Technology Deloitte LLP - MarketingPro, Inc. Marketing Technology Faulkner Media Group - Mediara i l s , Inc. Marketing Technology Impact Tech, Inc. - Mention Solutions SAS Marketing Technology Mynewsdesk AB - Nokia 's IP Video Bus iness Marketing Technology Constel lation Software, Inc. - NUVI Marketing Technology Brickfish - OpsPanda Marketing Technology Xactly Corporation - optimize-i t Marketing Technology Stroer SE & Co. KGaA - Pivotal iQ Limited Marketing Technology HG Data, Inc. - Plasso Marketing Technology Go Daddy Operating Company, LLC - Secret Media Marketing Technology Varanida SAS - Sel l f s rl Marketing Technology ForceManager - Si ftrock Marketing Technology Dri ft, Inc. - Spredfast, Inc. Marketing Technology Li thium Technologies - SuperData Research, Inc. Marketing Technology Nielsen Holdings B.V. - TGaS Advisors Marketing Technology Trini ty Partners , LLC - TINT Marketing Technology Fi lestack, Inc. - Turnkey Intel l igence LLC Marketing Technology MarketCast Group - Upstream Commerce Inc. Marketing Technology Fl ipkart Internet Private Limited - WayToGrow pl Marketing Technology Netsprint SA - Wel lpass Marketing Technology Wel lTok, Inc. - Ytica .com a.s . Marketing Technology Twi l io, Inc. - ZoomRank Marketing Technology SERPs , Inc. - Acycl ica , Inc. Software FLIR Systems, Inc. - ADL Software Pty Ltd. Software Digi ta l Reign Pty Ltd. - Appsfly.io Software WalMart Stores , Inc. - AutonomousStuff LLC Software Hexagon Pos i tioning Intel legence - BeyondTrust, Inc. Software Bomgar Corporation - BIManywhere Software Procore Technologies , Inc. - Blue Wi l low Systems, Inc. Software Royal Phi l ips Electronics - BTMetrics Software Profi tWel l - Bui l t.io Software Software AG - Captio Software Certi fy, Inc. - CaseloadPro L.P. Software Tyler Technologies - CENX, Inc. Software Ericsson, Inc. - Ci rculation.com Software Logis tiCare Solutions LLC - Clustrix, Inc. Software MariaDB Corporation Ab -

47 | M&A and Investment Summary September 2018
All Segments($ in Millions)
Strategic TransactionsStrategicUndisclosed Target Target Segment Buyer/Investor Reported TV
Cognate, Inc. Software Go Daddy Operating Company, LLC -$ Comet Solutions , Inc. Software Aras Corporation - Cross Match Technologies , Inc. Software ASSA ABLOY - Danforth Systems LLC Software Barcoding, Inc. - DCR Workforce, Inc. Software Coupa Software, Inc. - Education Partners LLC Software Campus Management Corporation - Electronic Transaction Systems Corporation Software Elavon Inc. - Elegri ty, Inc. Software iManage LLC - FeatureX, Inc. Software Orbita l Ins ight, Inc. - Forte Payment Systems, Inc. Software CSG International , Inc. - Fscom Software PricewaterhouseCoopers LLP - Fundi Software Pty Ltd. Software Rocket Software, Inc. - Groupcal l Ltd. Software Community Brands - ICOD, Inc. Software Prima Solutions - Inventory Management Solution Software Net@Work, Inc. - Iridize Ltd. Software Oracle Corporation - LightWork Des ign Ltd. Software Siemens AG - Lobe Arti ficia l Intel l igence, Inc. Software Microsoft Corporation - Locus Energy Software AlsoEnergy - Maxus Austra l ia Pty l td. Software Lucidea Corporation - Meri t Tarkvara AS Software Visma AS - Metamako General Pty Ltd. Software Aris ta Networks , Inc. - MicroMain Corporation Software JDM Technology Group - Mubble Networks Pvt Ltd. Software Obopay Mobi le Technology India Pvt. Ltd. - NetFaci l i ties , Inc. Software AMTdirect - NoMAD Software JAMF Software, LLC - Oi ldex, Inc. Software Dri l l inginfo, Inc. - PeopleStreme Software Ascender Group - Pi rean Limited Software Exostar, Inc. - Probanx Information Systems Ltd. Software iSignthis Ltd. - Prol i fic Bus iness Solutions Software Talus Payments - RapidFire Tools , Inc. Software Kaseya Limited - RightScale, Inc. Software Flexera Software LLC - Sage Microsystems, Inc. Software DRB Systems LLC - Sherbit, Inc. Software Medopad Ltd. - Simless , Inc. Software GigSky, Inc. - Si trion, Inc. Software Limeade, Inc. - StackPointCloud, Inc. Software NetApp - StayNTouch, LLC Software Shi ji Group - Supdate Software Crowdcube Limited - Surgimap Software Globus Medica l , Inc. - ThunderBui ld BV Software Topcon Pos i tioning Systems, Inc. -
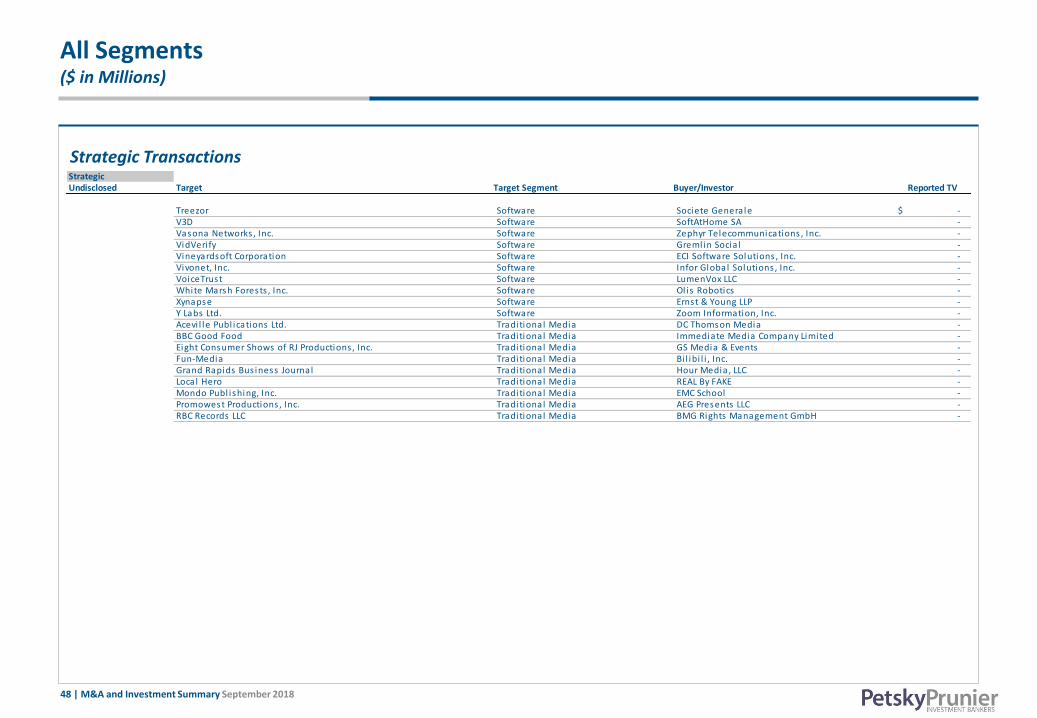
48 | M&A and Investment Summary September 2018
All Segments($ in Millions)
Strategic TransactionsStrategicUndisclosed Target Target Segment Buyer/Investor Reported TV
Treezor Software Societe Generale -$ V3D Software SoftAtHome SA - Vasona Networks , Inc. Software Zephyr Telecommunications , Inc. - VidVeri fy Software Greml in Socia l - Vineyardsoft Corporation Software ECI Software Solutions , Inc. - Vivonet, Inc. Software Infor Global Solutions , Inc. - VoiceTrust Software LumenVox LLC - White Marsh Forests , Inc. Software Ol is Robotics - Xynapse Software Ernst & Young LLP - Y Labs Ltd. Software Zoom Information, Inc. - Acevi l le Publ ications Ltd. Traditional Media DC Thomson Media - BBC Good Food Traditional Media Immediate Media Company Limited - Eight Consumer Shows of RJ Productions , Inc. Traditional Media GS Media & Events - Fun-Media Traditional Media Bi l ibi l i , Inc. - Grand Rapids Bus iness Journal Traditional Media Hour Media, LLC - Local Hero Traditional Media REAL By FAKE - Mondo Publ ishing, Inc. Traditional Media EMC School - Promowest Productions , Inc. Traditional Media AEG Presents LLC - RBC Records LLC Traditional Media BMG Rights Management GmbH -

49 | M&A and Investment Summary September 2018
All Segments($ in Millions)
Buyout Transactions Buyout DealsValues Disclosed Target Target Segment Buyer/Investor Reported TV
NewEase Software Warburg Pincus LLC 1,600.0$ EPiServer AB Marketing Technology Ins ight Venture Partners 1,100.0 Getty Images , Inc. Digi ta l Media/Commerce (Private Investors ) 490.2 ByBox Holdings Limited Software Francisco Partners 285.0 UnitedLex Corporation Bus iness Services CVC Capita l Partners Ltd. 200.0 Time Magazine Traditional Media (Private Investors ) 190.0 Augeo FI Agency & Marketing Services Lightyear Capita l LLC 140.0 Rivers ide Cl inica l & Standardized Testing Bus iness Services Alpine Investors , L.P. 140.0
Buyout DealsUndisclosed Target Target Segment Buyer/Investor Reported TV
SpotOn Marketing ApS Agency & Marketing Services Adel is Equity Partners -$ Core BTS, Inc. Bus iness Services Tai lwind Capita l Group, LLC - Iron Bow Technologies , LLC Bus iness Services H.I.G. Capita l LLC - Paradigm Consulting Group, Inc. Bus iness Services Golden Opportunities Fund - Sogetrel Bus iness Services Latour Capita l - STATinMED Research Bus iness Services Ancor Capita l Partners - Voice Comm LLC Bus iness Services Tiger Peak Capita l - Convert IT Marketing, Inc. Digi ta l Advertis ing Abbey Road Capita l - Kanetix Ltd. Digi ta l Advertis ing Ontario Teachers ' Pens ion Plan - Bonhams Digi ta l Media/Commerce Epiris Managers LLP - Evino.com.br Digi ta l Media/Commerce Undisclosed - Linebooker (PTY) Ltd. Digi ta l Media/Commerce GemCap - Primrose Digi ta l Media/Commerce Rockpool Investments - ProcessUnity, Inc. Information Long Ridge Equity Partners LLC - Chal lenger, Inc. (Formerly CEB unit) Marketing Technology Marl in Equity Partners - Donuts , Inc. Marketing Technology ABRY Partners , LLC - HyperLab Marketing Technology Everise - Li ss ted Limited Marketing Technology Primary Capita l Limited - Penetrace AS Marketing Technology Verdane Capita l - Personi fy Corporation Marketing Technology Paml ico Capita l - Connance, Inc. Software Bain Capita l , LLC - NOVAtime Technology, Inc. Software Summit Partners LP - softgarden e-recruiting GmbH Software Investcorp - TPAY Mobi le FZ-LLC Software Hel ios Investment Partners LLP - Transportation Ins ight Software Gryphon Investors , Inc. - Questex Media Group Traditional Media MidOcean Partners -
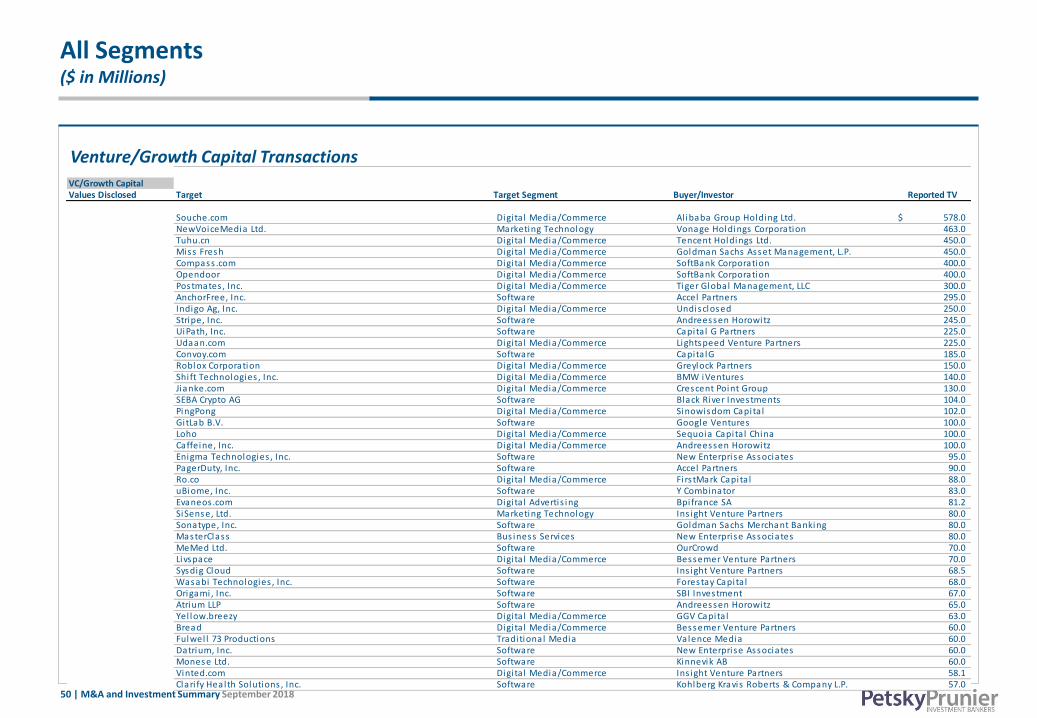
50 | M&A and Investment Summary September 2018
All Segments($ in Millions)
Venture/Growth Capital Transactions VC/Growth CapitalValues Disclosed Target Target Segment Buyer/Investor Reported TV
Souche.com Digita l Media/Commerce Al ibaba Group Holding Ltd. 578.0$ NewVoiceMedia Ltd. Marketing Technology Vonage Holdings Corporation 463.0 Tuhu.cn Digi ta l Media/Commerce Tencent Holdings Ltd. 450.0 Miss Fresh Digi ta l Media/Commerce Goldman Sachs Asset Management, L.P. 450.0 Compass .com Digita l Media/Commerce SoftBank Corporation 400.0 Opendoor Digi ta l Media/Commerce SoftBank Corporation 400.0 Postmates , Inc. Digi ta l Media/Commerce Tiger Global Management, LLC 300.0 AnchorFree, Inc. Software Accel Partners 295.0 Indigo Ag, Inc. Digi ta l Media/Commerce Undisclosed 250.0 Stripe, Inc. Software Andreessen Horowitz 245.0 UiPath, Inc. Software Capita l G Partners 225.0 Udaan.com Digita l Media/Commerce Lightspeed Venture Partners 225.0 Convoy.com Software Capita lG 185.0 Roblox Corporation Digi ta l Media/Commerce Greylock Partners 150.0 Shi ft Technologies , Inc. Digi ta l Media/Commerce BMW iVentures 140.0 Jianke.com Digita l Media/Commerce Crescent Point Group 130.0 SEBA Crypto AG Software Black River Investments 104.0 PingPong Digi ta l Media/Commerce Sinowisdom Capita l 102.0 Gi tLab B.V. Software Google Ventures 100.0 Loho Digi ta l Media/Commerce Sequoia Capita l China 100.0 Caffeine, Inc. Digi ta l Media/Commerce Andreessen Horowitz 100.0 Enigma Technologies , Inc. Software New Enterprise Associates 95.0 PagerDuty, Inc. Software Accel Partners 90.0 Ro.co Digi ta l Media/Commerce Firs tMark Capita l 88.0 uBiome, Inc. Software Y Combinator 83.0 Evaneos .com Digita l Advertis ing Bpifrance SA 81.2 SiSense, Ltd. Marketing Technology Ins ight Venture Partners 80.0 Sonatype, Inc. Software Goldman Sachs Merchant Banking 80.0 MasterClass Bus iness Services New Enterprise Associates 80.0 MeMed Ltd. Software OurCrowd 70.0 Livspace Digi ta l Media/Commerce Bessemer Venture Partners 70.0 Sysdig Cloud Software Ins ight Venture Partners 68.5 Wasabi Technologies , Inc. Software Forestay Capita l 68.0 Origami, Inc. Software SBI Investment 67.0 Atrium LLP Software Andreessen Horowitz 65.0 Yel low.breezy Digi ta l Media/Commerce GGV Capita l 63.0 Bread Digi ta l Media/Commerce Bessemer Venture Partners 60.0 Fulwel l 73 Productions Traditional Media Valence Media 60.0 Datrium, Inc. Software New Enterprise Associates 60.0 Monese Ltd. Software Kinnevik AB 60.0 Vinted.com Digita l Media/Commerce Ins ight Venture Partners 58.1 Clari fy Health Solutions , Inc. Software Kohlberg Kravis Roberts & Company L.P. 57.0

51 | M&A and Investment Summary September 2018
All Segments($ in Millions)
Venture/Growth Capital TransactionsVC/Growth CapitalValues Disclosed Target Target Segment Buyer/Investor Reported TV
Trumid Financia l LLC Software Deutsche Boerse AG 53.0$ Jumo World Limited Software Goldman Sachs Merchant Banking 52.0 iQiyi Sports Digi ta l Media/Commerce Sequoia Capita l China 51.0 Darktrace Limited Software Kohlberg Kravis Roberts & Company L.P. 50.0 Forter Software Sales force Ventures 50.0 Ola Digi ta l Media/Commerce Sai l ing Capita l Advisors Ltd. 50.0 Pendo.io Marketing Technology Sapphire Ventures , LLC 50.0 PingCAP, Inc. Software Fosun Venture Capita l Investment 50.0 Ki ra Systems, Inc. Software Ins ight Venture Partners 50.0 Launchmetrics Marketing Technology Bpifrance SA 50.0 Zumper, Inc. Digi ta l Advertis ing Kleiner Perkins Caufield & Byers 46.0 Endotronix, Inc. Software Li fe Science Partners 45.0 Freightos Software GE Ventures 44.4 StockX LLC Digi ta l Media/Commerce Google Ventures 44.0 Udesk Bus iness Services Tiger Global Management, LLC 43.7 Factual , Inc. Marketing Technology Upfront Ventures 42.0 Ooda Health, Inc. Software Oak HC/FT 40.5 Pymetrics , Inc. Information Sales force Ventures 40.0 Contino Ltd. Bus iness Services Columbia Capita l Corporation 40.0 WalkMe, Inc. Software Ins ight Venture Partners 40.0 Coco-BCX Digi ta l Media/Commerce 500 Startups 40.0 ShipBob, Inc. Software Menlo Ventures 40.0 LendInvest Ltd. Digi ta l Media/Commerce Atomico Investments 39.5 Maxex LLC Software Moore Capita l Management 38.0 Q4, Inc. Marketing Technology Napier Park Global Capita l LP 38.0 Bl ippar Marketing Technology QUALCOMM Ventures 37.0 Highspot, Inc. Marketing Technology Madrona Venture Group 35.0 StreamSets , Inc. Software New Enterprise Associates 35.0 Idx Technologies , Inc. Software 8VC 33.0 Facet Wealth Software Warburg Pincus LLC 33.0 AutoGrid Systems, Inc. Software CLP Holdings 32.0 Honestbee Pte. Ltd. Digi ta l Media/Commerce Undisclosed 31.0 The Infatuation, Inc. Digi ta l Media/Commerce WndrCo Holdings , LLC 30.0 Nozomi Networks , Inc. Software GGV Capita l 30.0 iSpot.tv, Inc. Marketing Technology Ins ight Venture Partners 30.0 Instana, Inc. Software Accel Partners 30.0 Singular Labs , Inc. Marketing Technology General Catalyst Partners LLC 30.0 DADI Cloud Limited Digi ta l Media/Commerce Undisclosed 30.0 Wemai Software Cenova Ventures 30.0 Integrate.a i Software Portag3 Ventures 30.0 Kissht Software Sis tema As ia Fund 30.0 Rapid Ratings International Information FTV Capita l 30.0

52 | M&A and Investment Summary September 2018
All Segments($ in Millions)
Venture/Growth Capital TransactionsVC/Growth CapitalValues Disclosed Target Target Segment Buyer/Investor Reported TV
Pixel lot LTD Marketing Technology Shamrock Capita l Advisors , Inc. 30.0$ Wunder Mobi l i ty Digi ta l Media/Commerce Blumberg Capita l 30.0 Shopal Marketing Technology Youngor Group 29.2 Maven Cl inic Co. Software Sequoia Capita l 27.0 Softomotive Software Grafton Capita l 25.0 Licious Digi ta l Media/Commerce Vertex Ventures 25.0 Veem.com Software Kleiner Perkins Caufield & Byers 25.0 Quantum Metric Marketing Technology Ins ight Venture Partners 25.0 Fidel is Cybersecuri ty Solutions , Inc. Software Undisclosed 25.0 HyperGrid, Inc. Software HighBAR Partners 25.0 Packet Host, Inc. Software Third Point Ventures 25.0 Corel ight, Inc. Software General Catalyst Partners LLC 25.0 Mirror Digi ta l Media/Commerce Spark Capita l 25.0 ubera l l GmbH Marketing Technology HPE Growth Capita l 25.0 Kayrros SAS Software Index Ventures 24.4 Moka Teknology Indones ia Software Sequoia Capita l 24.0 Qonto Software Valar Ventures LP 23.0 Cargo Systems, Inc. Digi ta l Media/Commerce Founders Fund 22.5 Snyk Ltd. Software Accel Partners 22.0 NetraDyne, Inc. Software M12 21.0 Cosmo Tech Software Inven Capita l 21.0 Guardhat, Inc. Software RTP Ventures 20.0 Sl ice Labs , Inc. Software XL Innovate 20.0 The Markup Digi ta l Media/Commerce (Private Investors ) 20.0 mabl Software Google Ventures 20.0 ParkWhiz, Inc. Digi ta l Media/Commerce NewSpring Capita l 20.0 Fave Group Digi ta l Advertis ing SIG As ia Investments 20.0 Glasswal l Solutions Ltd. Software IPGL 19.6 Capel la Space Corp. Information Spark Capita l 19.0 Oxbotica Ltd. Software IP Group Plc 18.6 Satispay Limited Software Endeavor Catalyst 17.7 Al l Dream Network Technology Bus iness Services IDG Capita l Partners 17.5 YouDo.com Digita l Media/Commerce PJSC MTS 17.0 Scratch Services , Inc. Digi ta l Media/Commerce Index Ventures 17.0 HYP3R Marketing Technology Structure Capita l 17.0 Asana Rebel GmbH Digi ta l Media/Commerce Greycroft Partners LLC 17.0 SynapseFi Software Trini ty Ventures 17.0 Inovia Group AB Software Verdane Capita l 16.5 CareStack Software Accel Partners 16.0 Job Today S.A. Software Accel Partners 16.0 Yoco Technologies (Pty) Ltd. Marketing Technology Veloci ty Capita l B.V. 16.0 Cl ippings Limited Digi ta l Media/Commerce Advance Venture Partners 15.4

53 | M&A and Investment Summary September 2018
All Segments($ in Millions)
Venture/Growth Capital TransactionsVC/Growth CapitalValues Disclosed Target Target Segment Buyer/Investor Reported TV
Stratio Big Data, S.L. Software Adara Ventures 15.1$ ATTN: Digi ta l Media/Commerce Evolution Media Capita l 15.0 Shohoz Digi ta l Media/Commerce 500 Startups 15.0 Divido Financia l Services Limited Software Dawn Capita l 15.0 Seed CX Ltd. Software Bain Capita l Ventures 15.0 Drinks Holdings , Inc. Digi ta l Media/Commerce Shea Ventures 15.0 ANINE BING Corporation Digi ta l Media/Commerce Index Ventures 15.0 DaoCloud Daoke Network Technology Co., Ltd. Software Marathon Venture Partners 14.6 Anxinji Software Ant Financia l 14.6 Jel lysmack.com Digita l Media/Commerce Partech Ventures 14.0 Avrios International AG Software Notion Capita l 14.0 Modulr Finance Limited Software Blenheim Chalcot Management Limited 13.8 Custora, Inc. Marketing Technology Greycroft Partners LLC 13.8 IoTium, Inc. Software March Capita l Partners 13.6 Tresori t AG Software 3TS Capita l Partners , Ltd. 13.3 Beekeeper, Inc. Software Keen Venture Partners 13.0 Unmortgage Ltd. Digi ta l Media/Commerce Anthemis Exponentia l Ventures 13.0 Notable Health Software F-Prime Capita l 13.0 Data.world, Inc. Digi ta l Media/Commerce Workday Ventures 12.0 Vezeeta.com Digita l Media/Commerce BECO Capita l 12.0 Jabmo SAS Marketing Technology Idinvest Partners 11.7 Atheneum Partners GmbH Traditional Media Cross lantic Capita l 11.6 Treez, Inc. Marketing Technology AFI Capita l Partners 11.5 LiveSafe, Inc. Software Hearst Ventures 11.0 Burlywood, Inc. Software Arcadia Woods Partners 10.6 Ravel in Technology Limited Software Blackfin Capita l Partners 10.4 Broadly Inc. Marketing Technology Foundry Group 10.0 Covr Financia l Technologies LLC Software Nyca Partners 10.0 Source Defense Ltd. Software Global Bra in Corporation 10.0 TwentyBN Software M12 10.0 TapCl icks , Inc. Marketing Technology Boathouse Capita l 10.0 GHGSat, Inc. Software Bus iness Development Bank of Canada 10.0 Cleo AI Ltd. Software Balderton Capita l 10.0 Cortera, Inc. Marketing Technology Battery Ventures 10.0 AlphaNetworks LLC Digi ta l Media/Commerce Shuttle Fund 10.0 Tamr, Inc. Software Granite Hi l l Capita l Ventures 10.0 Strikingly, Inc. Marketing Technology Cathay Capita l 10.0 Hoodl ine Marketing Technology Dentsu Ventures 10.0 Paga Software Global Innovation Fund 10.0 Blue Medora Software Edison Partners 10.0 Al lplants Ltd. Digi ta l Media/Commerce Fel ix Capita l 9.9 Holmusk Software Heri tas Venture Fund 9.8

54 | M&A and Investment Summary September 2018
All Segments($ in Millions)
Venture/Growth Capital TransactionsVC/Growth CapitalValues Disclosed Target Target Segment Buyer/Investor Reported TV
Ordermark, Inc. Software Techstars Ventures 9.5$ Setoo Ltd. Software Kamet 9.4 Doctena S.A. Software (Private Investors ) 9.3 Shine.fr Digi ta l Media/Commerce Daphni 9.3 Pa i Health, Inc. Digi ta l Media/Commerce Undisclosed 9.0 Payke, Inc. Marketing Technology Eight Roads Ventures 9.0 Wove Technologies , Inc. Marketing Technology August Capita l Management 9.0 Migo, Inc. Digi ta l Media/Commerce Clayton Venture Group 9.0 CloudCherry Marketing Technology Pel ion Venture Partners 9.0 Copado Solutions S.L. Software Ins ight Venture Partners 8.8 Cobase Software ING Ventures 8.8 I l lumix, Inc. Digi ta l Media/Commerce Maveron, LLC 8.6 Hometree Marketplace Ltd. Digi ta l Media/Commerce LocalGlobe 8.5 Proscia , Inc. Software Flybridge Capita l Partners 8.3 Da i lyLook.com Digita l Media/Commerce Upfront Ventures 8.0 Apprentice.io Software Pri tzker Group 8.0 Miso, Inc. Digi ta l Media/Commerce Socia l Capita l LP 8.0 TripCreator Marketing Technology Undisclosed 8.0 BreezoMeter Ltd. Information Idinvest Partners 7.8 One Media IP Group plc Traditional Media Bus iness Growth Fund plc 7.7 Nosto Solutions Ltd. Marketing Technology Idinvest Partners 7.5 Empl i fy, Inc. Software Edison Partners 7.5 MarketDia l , Inc. Marketing Technology Cross l ink Capita l 7.5 SnapMD, Inc. Software Undisclosed 7.1 Ra l ly Rd, Inc. Digi ta l Media/Commerce Anthemis Group 7.0 Masterplan.com Bus iness Services Tengelmann Ventures 7.0 Yumble Digi ta l Media/Commerce Launch Capita l 7.0 Ra la l i .com Digita l Media/Commerce Digi ta l Garage, Inc. 7.0 Joint Academy Software Al fven & Didrikson 7.0 HqO Digi ta l Media/Commerce JLL Spark 6.6 Concirrus Ltd. Software IQ Capita l Partners LLP 6.6 Funding Options Ltd. Digi ta l Media/Commerce ING Ventures 6.6 LIVELY Digi ta l Media/Commerce GGV Capita l 6.5 BrandTotal Marketing Technology Fl int Capita l 6.0 Socotra , Inc. Software 8VC 6.0 Arkose Labs Software U.S. Venture Partners 6.0 Avid Ratings , Inc. Marketing Technology 4490 Ventures 6.0 Wagestream Ltd. Software QED Investors LLC 5.9 Travels i fy Marketing Technology AccorHotels 5.8 Bi rd Office SAS Software CapHorn Invest 5.8 SoloLearn, Inc. Bus iness Services Learn Capita l Venture Partners 5.6 Ala ia Capita l LLC Bus iness Services Centana Growth Partners 5.5

55 | M&A and Investment Summary September 2018
All Segments($ in Millions)
Venture/Growth Capital TransactionsVC/Growth CapitalValues Disclosed Target Target Segment Buyer/Investor Reported TV
Shepper Ltd. Digi ta l Media/Commerce Aviva Ventures 5.4$ Ingenica Solutions Limited Software CJM Ventures 5.2 SLAMcore Software Amadeus Capita l Partners Limited 5.0 DreamTeam Digita l Media/Commerce Mangrove Capita l Partners 5.0 MortgageGym Limited Software Gocompare.com Ltd. 5.0 Domici le Digi ta l Media/Commerce Crosscut Ventures 5.0 Saykara, Inc. Software SpringRock Ventures 5.0 DyeMans ion GmbH Digi ta l Media/Commerce b-to-v Partners AG 5.0 Hiretual , Inc. Software Northern Light Venture Capita l 5.0 Hem Des ign Studio Sweden AB Digi ta l Media/Commerce Verdane Capita l 5.0 TAPPP Digi ta l Media/Commerce Accompl ice 5.0 Mejuri , Inc. Digi ta l Media/Commerce Fel ix Capita l 5.0 Canopy Pte. Ltd. Information Daymon As ia Ventures 4.8 Perlego Ltd. Digi ta l Media/Commerce Accelerated Digi ta l Ventures 4.8 klarx GmbH Digi ta l Media/Commerce Target Global 4.7 Bi twala GmbH Software Earlybird Venture Capita l GmgH & Co. KG 4.7 iFunded Digi ta l Media/Commerce Creathor Venture Management GmbH 4.7 Duffel Digi ta l Media/Commerce Blossom Capita l 4.7 Lumen App Ltd. Digi ta l Media/Commerce (Private Investors ) 4.6 CybSafe Ltd. Software Undisclosed 4.6 Giga lo.de Software Mark IV Capita l 4.5 Empower Finance, Inc. Software Sequoia Capita l 4.5 akti ia SA Software TransLink Capita l 4.2 Groundfloor Software (Private Investors ) 4.2 Taxfyle Digi ta l Media/Commerce Ocean Azul Partners 4.1 Ed App Bus iness Services Undisclosed 4.0 Zencargo Limited Software LocalGlobe 4.0 DataGrai l , Inc. Software Cloud Apps Capita l Partners 4.0 Sigstr, Inc. Marketing Technology Edison Partners 4.0 OneCause, Inc. Digi ta l Media/Commerce MK Capita l Management LLC 4.0 WhiteHat GB Bus iness Services Lightspeed Venture Partners 4.0 AudioTel l igence Ltd. Marketing Technology Cambridge Innovation Captia l 4.0 Fi t4D Information SJF Ventures 4.0 Expeto Wireless , Inc. Software Mistra l Venture Partners 3.9 Bloom Credit, Inc. Digi ta l Advertis ing Slow Ventures 3.9 MyLi fe Digi ta l Ltd. Software Bus iness Growth Fund plc 3.9 Umitron Pte. Ltd. Software Mira i Creation Fund 3.7 HotDoc Onl ine Pty Ltd. Information AirTree Ventures 3.6 Upfluence, Inc. Marketing Technology ISAI Gestion 3.6 Goals101 Software Nexus Venture Partners 3.5 EasyKnock, Inc. Software Blumberg Capita l 3.5 Secure Code Warrior Pty Ltd. Software Paladin Capita l 3.5

56 | M&A and Investment Summary September 2018
All Segments($ in Millions)
Venture/Growth Capital TransactionsVC/Growth CapitalValues Disclosed Target Target Segment Buyer/Investor Reported TV
Uppercase Digi ta l Media/Commerce Lerer Hippeau Ventures 3.5$ Accrual i fy, Inc. Software Al igned Partners 3.2 Momentum IoT LLC Software Howard Edmund Capita l 3.1 Teraki GmbH Software Paladin Capita l 3.0 Kobiton, Inc. Software Kinetic Ventures 3.0 Edge Intel l igence, Inc. Software Tal is Capita l 3.0 MODE, Inc. Software True Ventures 3.0 Dutchie Digi ta l Media/Commerce Casa Verde Capita l 3.0 Qbera Software E-City Ventures 3.0 Publ ic Goods , Inc. Digi ta l Media/Commerce Yes VC 3.0 Scythe, Inc. Software Evolution Equity Partners 3.0 Logiwa Software Revo Capita l 3.0 NewtonX, Inc. Digi ta l Advertis ing Third Prime Capita l 3.0 Fleetonomy Ltd. Software Vertex Ventures 3.0 Si lvernest, Inc. Digi ta l Media/Commerce Incenter 3.0 Countingup Ltd. Software Forward Partners 3.0 Deuxièmeavis .fr Software Citizen Capita l 2.9 The Jones Agency, Inc. Software 500 Startups 2.7 PrimaryBid Limited Software (Private Investors ) 2.6 The Ins ide Digi ta l Media/Commerce Corigin Ventures 2.6 VVIP Digi ta l Media/Commerce Pecunio 2.5 Learning People Bus iness Services Tal is Capita l 2.5 Scibids Technology SAS Digi ta l Advertis ing Iris Capita l 2.5 OverWatchID, Inc. Software WestWave Capita l 2.5 Frey Digi ta l Media/Commerce (Private Investors ) 2.4 Dogu.io Marketing Technology Spring Capita l Partners , L.P. 2.4 Cinelytic, Inc. Software T&B Media Global 2.3 Turbo Tenant LLC Digi ta l Media/Commerce Access Venture Partners 2.2 SenseHawk, Inc. Software SAIF Partners 2.0 Leena.AI, Inc. Software (Private Investors ) 2.0 Shypple B.V. Software August Ventures 2.0 Sytorus Ltd. Software Enterprise Ireland 2.0 Haystack TV, Inc. Digi ta l Media/Commerce Alta i r Capita l 2.0 Nummo Ltd. Software (Private Investors ) 1.9 Rx.Health, Inc. Software Undisclosed 1.8 Wonderflow Marketing Technology P101 1.7 TestCard Diagnostics Ltd. Software Neo Ventures 1.7 CashMe SpA Software Undisclosed 1.7 Tida lSca le, Inc. Software Infosys Limited 1.5 ZenLedger Software Vestigo Ventures 1.5 Nodle.io Software Blockchange Ventures 1.5 Arcade Solutions , Inc. Marketing Technology ATX Seed Ventures 1.5
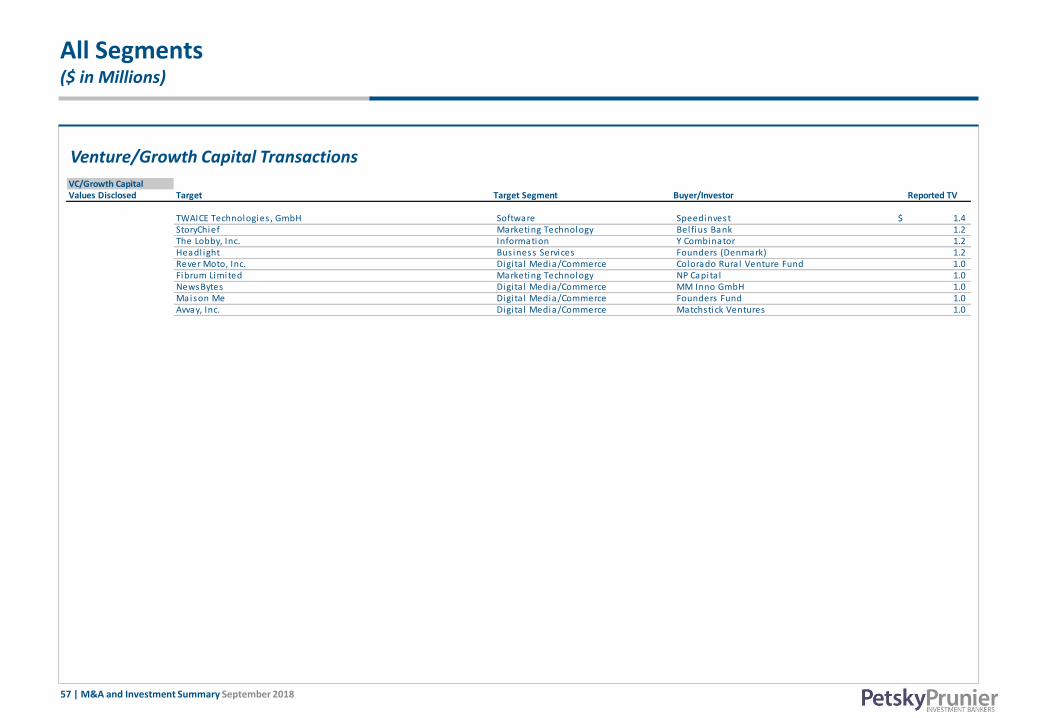
57 | M&A and Investment Summary September 2018
All Segments($ in Millions)
Venture/Growth Capital Transactions
VC/Growth CapitalValues Disclosed Target Target Segment Buyer/Investor Reported TV
TWAICE Technologies , GmbH Software Speedinvest 1.4$ StoryChief Marketing Technology Belfius Bank 1.2 The Lobby, Inc. Information Y Combinator 1.2 Headl ight Bus iness Services Founders (Denmark) 1.2 Rever Moto, Inc. Digi ta l Media/Commerce Colorado Rural Venture Fund 1.0 Fibrum Limited Marketing Technology NP Capita l 1.0 NewsBytes Digi ta l Media/Commerce MM Inno GmbH 1.0 Maison Me Digita l Media/Commerce Founders Fund 1.0 Avvay, Inc. Digi ta l Media/Commerce Matchstick Ventures 1.0
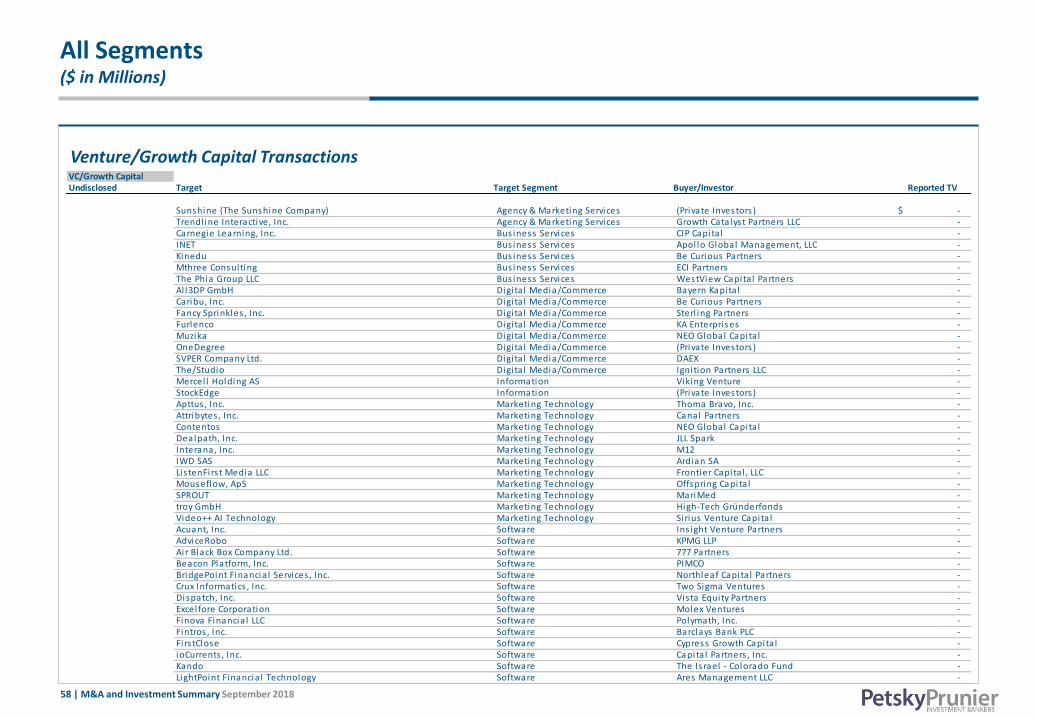
58 | M&A and Investment Summary September 2018
All Segments($ in Millions)
Venture/Growth Capital TransactionsVC/Growth CapitalUndisclosed Target Target Segment Buyer/Investor Reported TV
Sunshine (The Sunshine Company) Agency & Marketing Services (Private Investors ) -$ Trendl ine Interactive, Inc. Agency & Marketing Services Growth Catalyst Partners LLC - Carnegie Learning, Inc. Bus iness Services CIP Capita l - INET Bus iness Services Apol lo Global Management, LLC - Kinedu Bus iness Services Be Curious Partners - Mthree Consulting Bus iness Services ECI Partners - The Phia Group LLC Bus iness Services WestView Capita l Partners - Al l3DP GmbH Digi ta l Media/Commerce Bayern Kapita l - Caribu, Inc. Digi ta l Media/Commerce Be Curious Partners - Fancy Sprinkles , Inc. Digi ta l Media/Commerce Sterl ing Partners - Furlenco Digi ta l Media/Commerce KA Enterprises - Muzika Digi ta l Media/Commerce NEO Global Capita l - OneDegree Digi ta l Media/Commerce (Private Investors ) - SVPER Company Ltd. Digi ta l Media/Commerce DAEX - The/Studio Digi ta l Media/Commerce Ignition Partners LLC - Mercel l Holding AS Information Viking Venture - StockEdge Information (Private Investors ) - Apttus , Inc. Marketing Technology Thoma Bravo, Inc. - Attribytes , Inc. Marketing Technology Canal Partners - Contentos Marketing Technology NEO Global Capita l - Dealpath, Inc. Marketing Technology JLL Spark - Interana, Inc. Marketing Technology M12 - IWD SAS Marketing Technology Ardian SA - Li s tenFirs t Media LLC Marketing Technology Frontier Capita l , LLC - Mouseflow, ApS Marketing Technology Offspring Capita l - SPROUT Marketing Technology MariMed - troy GmbH Marketing Technology High-Tech Gründerfonds - Video++ AI Technology Marketing Technology Sirius Venture Capita l - Acuant, Inc. Software Ins ight Venture Partners - AdviceRobo Software KPMG LLP - Ai r Black Box Company Ltd. Software 777 Partners - Beacon Platform, Inc. Software PIMCO - BridgePoint Financia l Services , Inc. Software Northleaf Capita l Partners - Crux Informatics , Inc. Software Two Sigma Ventures - Dispatch, Inc. Software Vista Equity Partners - Excel fore Corporation Software Molex Ventures - Finova Financia l LLC Software Polymath, Inc. - Fintros , Inc. Software Barclays Bank PLC - Fi rs tClose Software Cypress Growth Capita l - ioCurrents , Inc. Software Capita l Partners , Inc. - Kando Software The Is rael - Colorado Fund - LightPoint Financia l Technology Software Ares Management LLC -
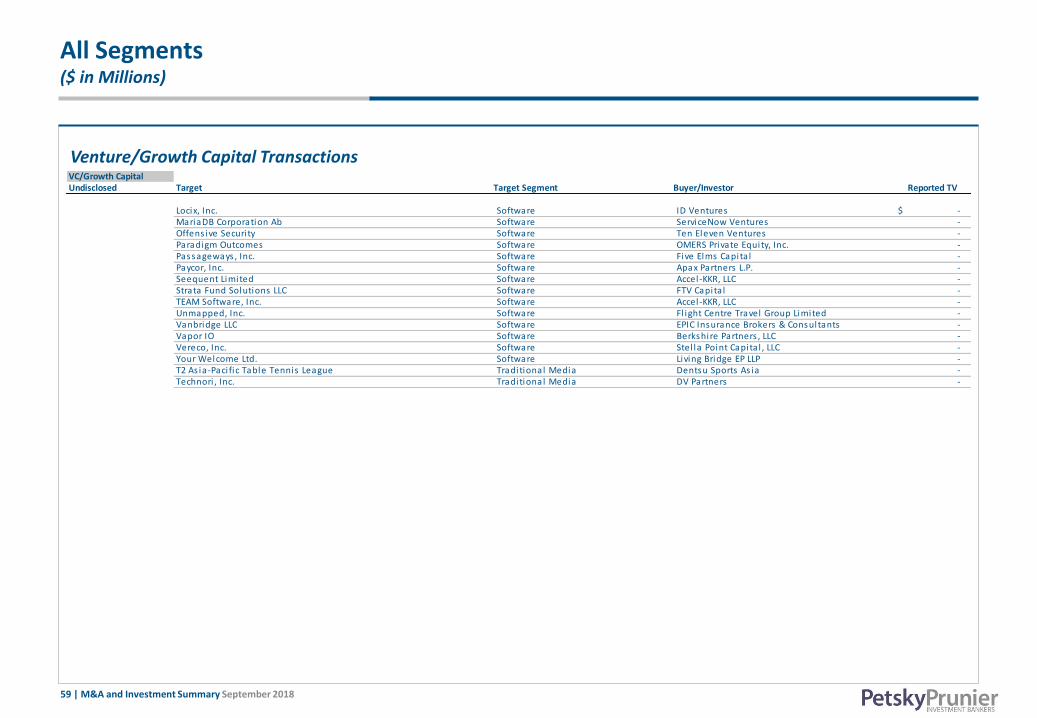
59 | M&A and Investment Summary September 2018
All Segments($ in Millions)
Venture/Growth Capital TransactionsVC/Growth CapitalUndisclosed Target Target Segment Buyer/Investor Reported TV
Locix, Inc. Software ID Ventures -$ MariaDB Corporation Ab Software ServiceNow Ventures - Offens ive Securi ty Software Ten Eleven Ventures - Paradigm Outcomes Software OMERS Private Equity, Inc. - Passageways , Inc. Software Five Elms Capita l - Paycor, Inc. Software Apax Partners L.P. - Seequent Limited Software Accel -KKR, LLC - Strata Fund Solutions LLC Software FTV Capita l - TEAM Software, Inc. Software Accel -KKR, LLC - Unmapped, Inc. Software Fl ight Centre Travel Group Limited - Vanbridge LLC Software EPIC Insurance Brokers & Consultants - Vapor IO Software Berkshire Partners , LLC - Vereco, Inc. Software Stel la Point Capita l , LLC - Your Welcome Ltd. Software Living Bridge EP LLP - T2 As ia-Paci fic Table Tennis League Traditional Media Dentsu Sports As ia - Technori , Inc. Traditional Media DV Partners -

60 | M&A and Investment Summary September 2018
Petsky Prunier: Maximizing Shareholder Value
▪ M&A Advisory and Sell-Side Representation
▪ Privately-Owned Companies
▪ Entrepreneur-Led Businesses
▪ Private Equity Portfolio Companies
▪ VC-Backed Companies
▪ Corporate Divestitures
▪ Selected Buy-Side Engagements
▪ Capital Raising and Private Placements
▪ Advertising & Marketing
▪ eCommerce
▪ Digital Media
▪ Technology
▪ Information
▪ Business Services
▪ Healthcare Services
▪ Business Current Situation Assessment and
Profit Improvement Planning
▪ Opportunity Mapping: Strategic Planning & Development
▪ Competitive Landscape Analysis
▪ M&A Transaction Due Diligence Support
▪ Buy-Side Targeting Criteria & Integration Strategy
▪ Custom Market Research
▪ Publishing, Speaking, and Thought Leadership
▪ Top-ranked, global investment bank dedicated to digital advertising and marketing, eCommerce, digital media, technology, information,
business services, and healthcare services industries
▪ Extensive sell-side M&A and capital raise expertise, with a transaction closing rate unmatched at our level of deal volume
▪ Founded in 1999
▪ More than 50 focused professionals; growth of 40% since 2011
▪ New York, Las Vegas, Chicago, Boston, Charlotte
▪ Deep relationships across a broad spectrum of strategic buyers, as well as private equity, growth equity, and VC groups and lenders
▪ Strategic consulting firm Winterberry Group – one of the largest industry-specific advisors providing strategic and transactional services
▪ Global reach enhanced through our partnerships in China and India
▪ Securities transactions are processed through Petsky Prunier Securities LLC, a member of FINRA and an affiliated entity
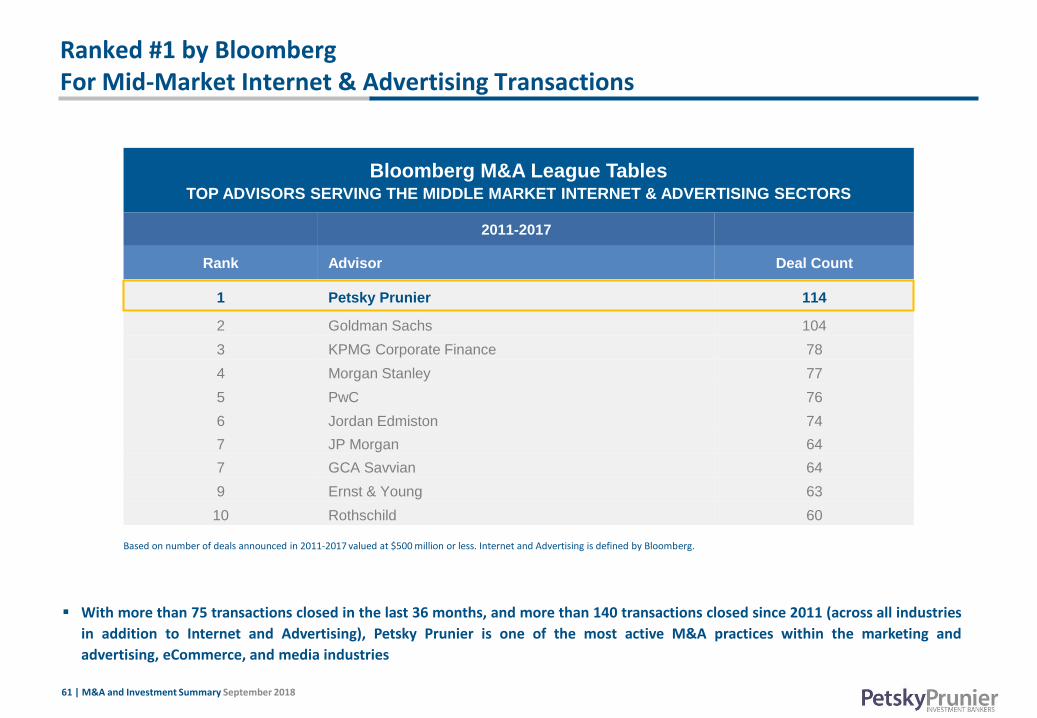
61 | M&A and Investment Summary September 2018
Ranked #1 by Bloomberg For Mid-Market Internet & Advertising Transactions
Bloomberg M&A League TablesTOP ADVISORS SERVING THE MIDDLE MARKET INTERNET & ADVERTISING SECTORS
2011-2017
Rank Advisor Deal Count
1 Petsky Prunier 114
2 Goldman Sachs 104
3 KPMG Corporate Finance 78
4 Morgan Stanley 77
5 PwC 76
6 Jordan Edmiston 74
7 JP Morgan 64
7 GCA Savvian 64
9 Ernst & Young 63
10 Rothschild 60
Based on number of deals announced in 2011‐2017 valued at $500 million or less. Internet and Advertising is defined by Bloomberg.
▪ With more than 75 transactions closed in the last 36 months, and more than 140 transactions closed since 2011 (across all industries
in addition to Internet and Advertising), Petsky Prunier is one of the most active M&A practices within the marketing and
advertising, eCommerce, and media industries
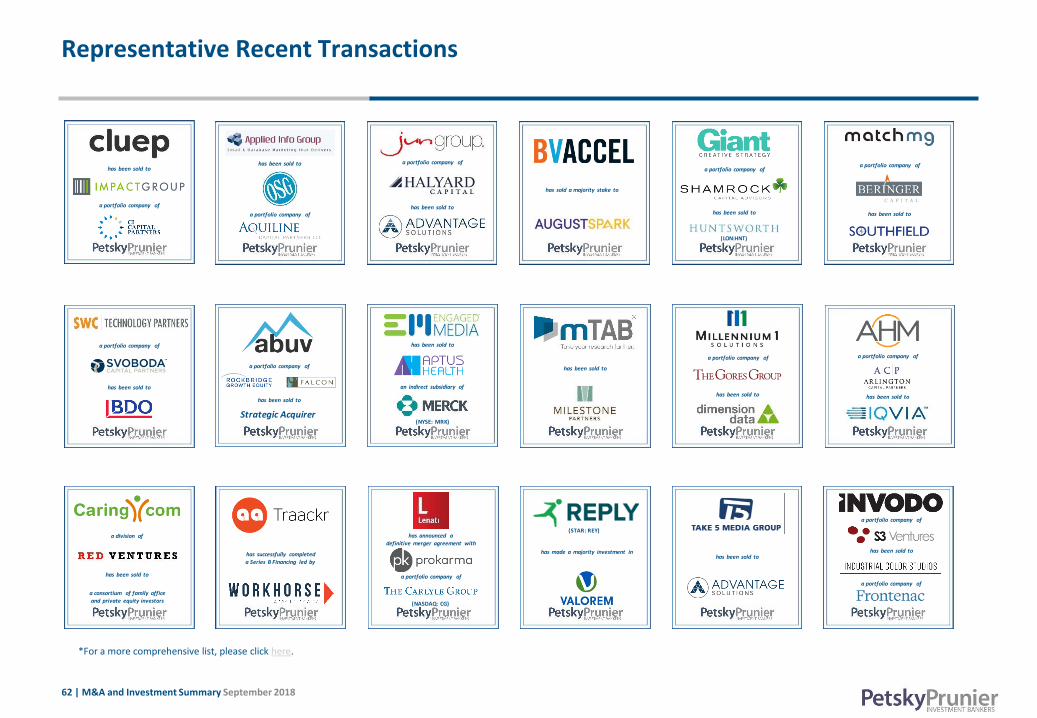
62 | M&A and Investment Summary September 2018
Representative Recent Transactions
*For a more comprehensive list, please click here.
a portfolio company of
a portfolio company of
has been sold tohas made a majority investment in
(STAR: REY)has announced a
definitive merger agreement with
a portfolio company of
(NASDAQ: CG)
has successfully completed
a Series B Financing led by
has been sold to
an indirect subsidiary of
(NYSE: MRK)
a division of
has been sold to
a consortium of family office and private equity investors
a portfolio company of
has been sold to
a portfolio company of
has been sold to
has been sold to
has been sold to
a portfolio company of
Strategic Acquirer
has been sold to
a portfolio company of
has been sold to
a portfolio company of a portfolio company of
has been sold to
(LON:HNT)
has been sold to
has sold a majority stake to
has been sold to
a portfolio company of has been sold to
a portfolio company of
has been sold to
a portfolio company of
has been sold to