Embed Size (px)
Citation preview

September 2015 M&A and Investment Summary
2 | M&A and Investment Summary September 2015
Table of Contents
About Petsky Prunier 3 1
Overview of Monthly M&A and Investment Activity 6 2
Monthly M&A and Investment Activity by Industry Segment 12 3
Additional Monthly M&A and Investment Activity Data 42 4
Securities offered through Petsky Prunier Securities, LLC, member of FINRA.
This M&A and Investment Summary has been prepared by and is being distributed in the United States by Petsky Prunier, a broker dealer registered with the U.S. SEC and a member of FINRA. Petsky Prunier is not affiliated with Altium Capital Ltd, but has partnered with Altium to expand its international presence. Altium has not prepared or verified the information in this Summary. Persons in the United States should contact Petsky Prunier for further information or services. This M&A and Investment Summary is not being distributed by Altium Capital Ltd in the United States and Altium Capital Ltd is not offering any services to persons in the United States.

3 | M&A and Investment Summary September 2015
Petsky Prunier: Maximizing Shareholder Value
Top-ranked, global investment bank dedicated to digital advertising and marketing, eCommerce, digital media, technology, information,
business services, and healthcare services industries
Extensive sell-side M&A and capital raise expertise, with a transaction closing rate unmatched at our level of deal volume
Founded in 1999
More than 50 focused professionals; growth of 40% since 2011
New York, Palo Alto, Las Vegas, Chicago, Boston, Tampa
Deep relationships across a broad spectrum of strategic buyers, as well as private equity, growth equity, and VC groups and lenders
Strategic consulting firm Winterberry Group – one of the largest industry-specific advisors providing strategic and transactional services
Global reach enhanced through our partnerships with investment bank Altium in Europe, as well as The Mountain Capital Group in
China, and Allegro Advisors and o3 Capital in India
Securities transactions are processed through Petsky Prunier Securities LLC, a member of FINRA and an affiliated entity
M&A Advisory and Sell-Side Representation
Privately-Owned Companies
Entrepreneur-Led Businesses
Private Equity Portfolio Companies
VC-Backed Companies
Corporate Divestitures
Selected Buy-Side Engagements
Capital Raising and Private Placements
Advertising & Marketing
eCommerce
Digital Media
Technology
Information
Business Services
Healthcare Services
Business Current Situation Assessment and
Profit Improvement Planning
Opportunity Mapping: Strategic Planning & Development
Competitive Landscape Analysis
M&A Transaction Due Diligence Support
Buy-Side Targeting Criteria & Integration Strategy
Custom Market Research
Publishing, Speaking, and Thought Leadership
4 | M&A and Investment Summary September 2015
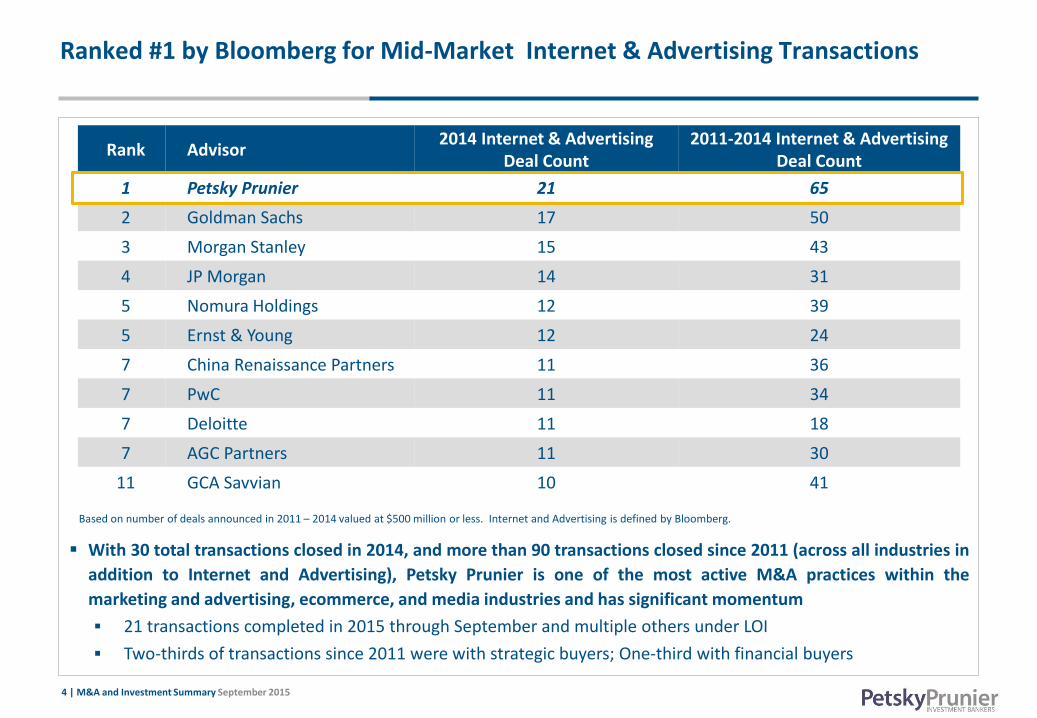
Ranked #1 by Bloomberg for Mid-Market Internet & Advertising Transactions
Rank Advisor 2014 Internet & Advertising
Deal Count 2011-2014 Internet & Advertising
Deal Count
1 Petsky Prunier 21 65
2 Goldman Sachs 17 50
3 Morgan Stanley 15 43
4 JP Morgan 14 31
5 Nomura Holdings 12 39
5 Ernst & Young 12 24
7 China Renaissance Partners 11 36
7 PwC 11 34
7 Deloitte 11 18
7 AGC Partners 11 30
11 GCA Savvian 10 41
Based on number of deals announced in 2011 – 2014 valued at $500 million or less. Internet and Advertising is defined by Bloomberg.
With 30 total transactions closed in 2014, and more than 90 transactions closed since 2011 (across all industries in
addition to Internet and Advertising), Petsky Prunier is one of the most active M&A practices within the
marketing and advertising, ecommerce, and media industries and has significant momentum
21 transactions completed in 2015 through September and multiple others under LOI
Two-thirds of transactions since 2011 were with strategic buyers; One-third with financial buyers
5 | M&A and Investment Summary September 2015
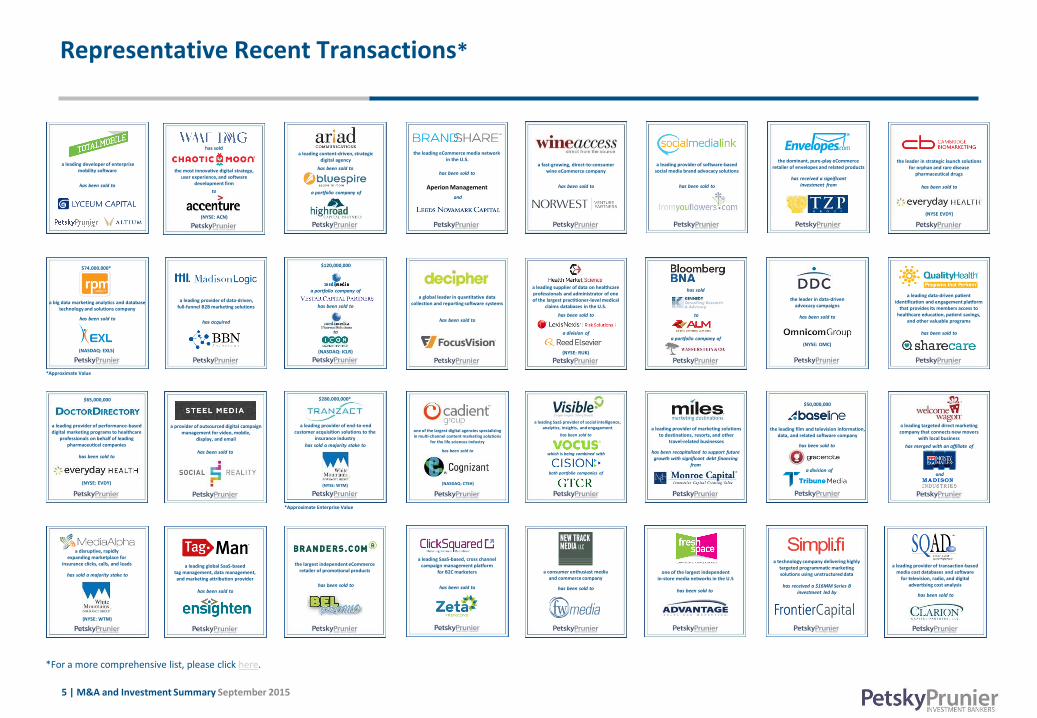
Representative Recent Transactions*
a big data marketing analytics and database technology and solutions company
has been sold to
$74,000,000*
(NASDAQ: EXLS)
*Approximate Value
a fast-growing, direct-to-consumer wine eCommerce company
has been sold to
the leader in data-driven advocacy campaigns
has been sold to
(NYSE: OMC)
a technology company delivering highly targeted programmatic marketing solutions using unstructured data
has received a $16MM Series B investment led by
a leading provider of transaction-based media cost databases and software
for television, radio, and digital advertising cost analysis
has been sold to
a leading data-driven patient identification and engagement platform
that provides its members access to healthcare education, patient savings,
and other valuable programs
has been sold to
a leading provider of performance-based digital marketing programs to healthcare
professionals on behalf of leading pharmaceutical companies
has been sold to
(NYSE: EVDY)
a leading SaaS-based, cross channel campaign management platform
for B2C marketers
has been sold to has been sold to
one of the largest independent in-store media networks in the U.S
a consumer enthusiast media and commerce company
has been sold to
has merged with an affiliate of
a leading targeted direct marketing company that connects new movers
with local business
and
a leading global SaaS-based tag management, data management, and marketing attribution provider
has been sold to
the largest independent eCommerce retailer of promotional products
has been sold to
a disruptive, rapidly expanding marketplace for
insurance clicks, calls, and leads
has sold a majority stake to
(NYSE: WTM)
a provider of outsourced digital campaign management for video, mobile,
display, and email
has been sold to has been sold to
the leading film and television information, data, and related software company
$50,000,000
a division of
a leading provider of marketing solutions to destinations, resorts, and other
travel-related businesses
has been recapitalized to support future growth with significant debt financing
from
a leading SaaS provider of social intelligence, analytics, insights, and engagement
has been sold to
which is being combined with
both portfolio companies of
one of the largest digital agencies specializing in multi-channel content marketing solutions
for the life sciences industry
has been sold to
(NASDAQ: CTSH)
a leading provider of end-to-end customer acquisition solutions to the
insurance industry
has sold a majority stake to
(NYSE: WTM)
$280,000,000*
*Approximate Enterprise Value
a leading supplier of data on healthcare professionals and administrator of one of the largest practitioner-level medical
claims databases in the U.S.
has been sold to
(NYSE: RUK)
a division of
a global leader in quantitative data collection and reporting software systems
has been sold to
has sold
to
a portfolio company of
has sold a portfolio company of
(NASDAQ: ICLR)
to
$120,000,000
has been sold to
a leading provider of software-based social media brand advocacy solutions
has been sold to
the dominant, pure-play eCommerce retailer of envelopes and related products
has received a significant investment from
the leader in strategic launch solutions for orphan and rare disease
pharmaceutical drugs
has been sold to
(NYSE EVDY)
a leading provider of data-driven, full-funnel B2B marketing solutions
has acquired
$65,000,000
a leading developer of enterprise mobility software
has been sold to
has sold
the most innovative digital strategy, user experience, and software
development firm
(NYSE: ACN)
to
the leading eCommerce media network in the U.S.
has been sold to
and
Aperion Management
a leading content-driven, strategic digital agency
has been sold to
a portfolio company of
*For a more comprehensive list, please click here.

6 | M&A and Investment Summary September 2015
M&A and Investment Summary for All Segments
Transaction Distribution
A total of 401 deals were announced in September 2015, of which 250 were worth $20 billion in aggregate reported value
Digital Media/Commerce was the most active and highest reported value segment with 100 deals announced — 77 of these transactions reported $6.9 billion in value
The Marketing Technology segment announced 87 transactions, of which 53 were reported worth $2.3 billion
Strategic buyers announced 167 deals (42 reported $9.7 billion of value)
VC/Growth Capital investors announced 223 transactions (207 reported $9.3 billion of value)
Buyout investors announced 11 deals during the month (one reported $1 billion of value)
*Vista Equity Partners’ $6.7 billion acquisition of Solera Holdings has been excluded to limit comparative distortions
# % $MM % # $MM # $MM # $MM
Digital Media/Commerce 100 25% $6,870.8 34% 22 $584.5 0 - 78 $6,286.3
Software 94 23% 2,408.9 12% 29 887.2 4 - 61 1,521.7
Marketing Technology 87 22% 2,294.3 11% 35 1,412.1 1 - 51 882.2
Digital Advertising 34 8% 796.0 4% 12 331.3 1 - 21 464.7
Business Services 30 7% 1,725.3 9% 18 575.7 4 1,000.0 8 149.6
Agency & Marketing Services 27 7% 370.5 2% 26 370.5 1 - 0 -
Traditional Media 15 4% 4,456.5 22% 13 4,454.0 0 - 2 2.5
Information 14 3% 1,081.5 5% 12 1,077.0 0 - 2 4.5
Total 401 100% 20,003.8 100% 167 9,692.3 11 1,000.0 223 9,311.5
September 2015
BUYER/INVESTOR BREAKDOWN
Transactions Reported Value Strategic Buyout Venture/Growth Capital

7 | M&A and Investment Summary August 2015
$37.5
$14.5
$40.4
$14.5
$23.5
$11.2 $15.0$18.8
$25.9$18.3
$108.4
$23.1$26.7
428 491 410 380 385 425 456 492 458 466 448 376 401 $-
$100.0
$200.0
$300.0
$400.0
$500.0
$-
$10.0
$20.0
$30.0
$40.0
$50.0
$60.0
$70.0
$80.0
$90.0
$100.0
$110.0
$120.0
Sep-14 Oct-14 Nov-14 Dec-14 Jan-15 Feb-15 Mar-15 Apr-15 May-15 Jun-15 Jul-15 Aug-15 Sep-15
Transaction Distribution
Aggregate reported transaction value of $20 billion in September was down 14 percent from August 2015 and down six percent from
September 2014
Strategic activity accounted for 48 percent of reported deal value during the month and included significant transactions:
• The $2.3 billion merger of Meredith and Media General; subsequent to this announcement, NexStar Broadcasting announced its
intention to acquire Media General
• comScore’s $732 million acquisition of media measurement company Rentrak
• 21st Century Fox’s $725 million acquisition of National Geographic Society’s media assets
• The $500 million purchase of multiscreen video company Elemental Technologies by Amazon
• Axel Springer's majority stake purchase of Business Insider at a valuation of $390 million
M&A and Investment Summary for All Segments
Time Warner/ Charter
Bright House/ Charter
Sungard
Veritas Solera
*Note, Charter Communications’ $78.8 billion and $10.8 billion acquisitions of Time Warner and Bright House Networks , Fidelity National Information Services ‘ $9.1 billion acquisition of SunGard Data
Systems, The Carlyle Group’s $8 billion acquisition of Veritas Systems , and Vista Equity Partners’ $6.7 billion acquisition of Solera Holdings have been excluded to limit comparative distortions.
8 | M&A and Investment Summary September 2015
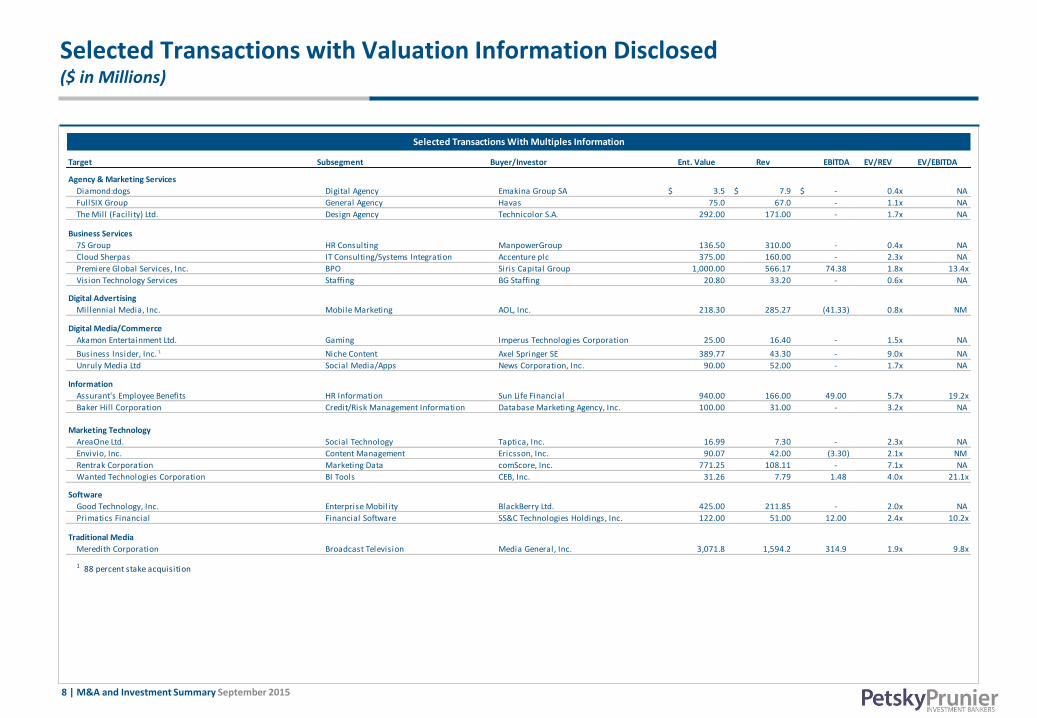
Selected Transactions with Valuation Information Disclosed ($ in Millions)
Target Subsegment Buyer/Investor Ent. Value Rev EBITDA EV/REV EV/EBITDA
Agency & Marketing Services
Diamond:dogs Digital Agency Emakina Group SA 3.5$ 7.9$ -$ 0.4x NA
FullSIX Group General Agency Havas 75.0 67.0 - 1.1x NA
The Mill (Facility) Ltd. Design Agency Technicolor S.A. 292.00 171.00 - 1.7x NA
Business Services
7S Group HR Consulting ManpowerGroup 136.50 310.00 - 0.4x NA
Cloud Sherpas IT Consulting/Systems Integration Accenture plc 375.00 160.00 - 2.3x NA
Premiere Global Services, Inc. BPO Siris Capital Group 1,000.00 566.17 74.38 1.8x 13.4x
Vision Technology Services Staffing BG Staffing 20.80 33.20 - 0.6x NA
Digital Advertising
Millennial Media, Inc. Mobile Marketing AOL, Inc. 218.30 285.27 (41.33) 0.8x NM
Digital Media/Commerce
Akamon Entertainment Ltd. Gaming Imperus Technologies Corporation 25.00 16.40 - 1.5x NA
Business Insider, Inc. 1 Niche Content Axel Springer SE 389.77 43.30 - 9.0x NA
Unruly Media Ltd Social Media/Apps News Corporation, Inc. 90.00 52.00 - 1.7x NA
Information
Assurant's Employee Benefits HR Information Sun Life Financial 940.00 166.00 49.00 5.7x 19.2x
Baker Hill Corporation Credit/Risk Management Information Database Marketing Agency, Inc. 100.00 31.00 - 3.2x NA
Marketing Technology
AreaOne Ltd. Social Technology Taptica, Inc. 16.99 7.30 - 2.3x NA
Envivio, Inc. Content Management Ericsson, Inc. 90.07 42.00 (3.30) 2.1x NM
Rentrak Corporation Marketing Data comScore, Inc. 771.25 108.11 - 7.1x NA
Wanted Technologies Corporation BI Tools CEB, Inc. 31.26 7.79 1.48 4.0x 21.1x
Software
Good Technology, Inc. Enterprise Mobility BlackBerry Ltd. 425.00 211.85 - 2.0x NA
Primatics Financial Financial Software SS&C Technologies Holdings, Inc. 122.00 51.00 12.00 2.4x 10.2x
Traditional Media
Meredith Corporation Broadcast Television Media General, Inc. 3,071.8 1,594.2 314.9 1.9x 9.8x
1 88 percent stake acquisition
Selected Transactions With Multiples Information
9 | M&A and Investment Summary September 2015
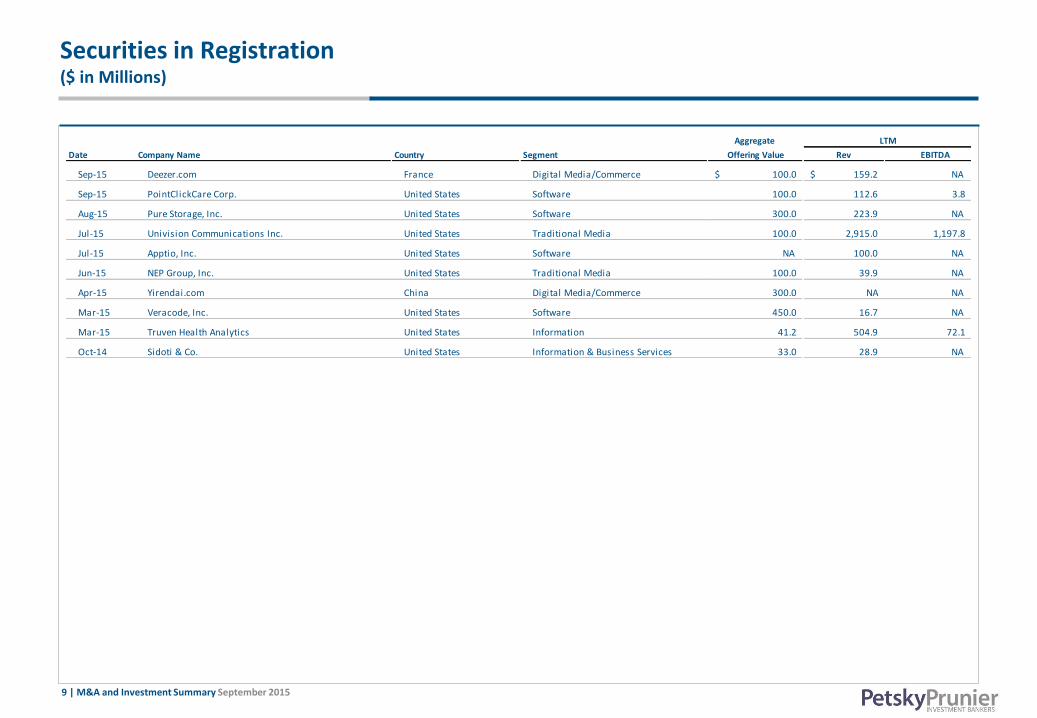
Securities in Registration ($ in Millions)
Aggregate
Date Company Name Country Segment Offering Value Rev EBITDA
Sep-15 Deezer.com France Digital Media/Commerce 100.0$ 159.2$ NA
Sep-15 PointClickCare Corp. United States Software 100.0 112.6 3.8
Aug-15 Pure Storage, Inc. United States Software 300.0 223.9 NA
Jul-15 Univision Communications Inc. United States Traditional Media 100.0 2,915.0 1,197.8
Jul-15 Apptio, Inc. United States Software NA 100.0 NA
Jun-15 NEP Group, Inc. United States Traditional Media 100.0 39.9 NA
Apr-15 Yirendai.com China Digital Media/Commerce 300.0 NA NA
Mar-15 Veracode, Inc. United States Software 450.0 16.7 NA
Mar-15 Truven Health Analytics United States Information 41.2 504.9 72.1
Oct-14 Sidoti & Co. United States Information & Business Services 33.0 28.9 NA
LTM
10 | M&A and Investment Summary September 2015
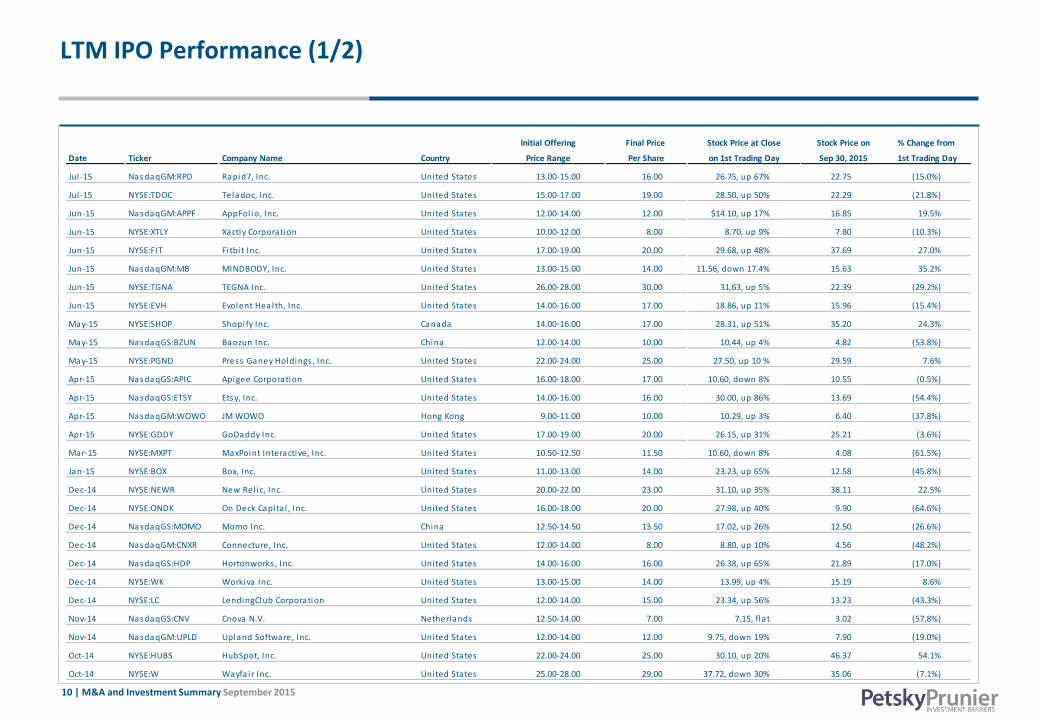
LTM IPO Performance (1/2)
Initial Offering Final Price Stock Price at Close Stock Price on % Change from
Date Ticker Company Name Country Price Range Per Share on 1st Trading Day Sep 30, 2015 1st Trading Day
Jul -15 NasdaqGM:RPD Rapid7, Inc. United States 13.00-15.00 16.00 26.75, up 67% 22.75 (15.0%)
Jul -15 NYSE:TDOC Teladoc, Inc. United States 15.00-17.00 19.00 28.50, up 50% 22.29 (21.8%)
Jun-15 NasdaqGM:APPF AppFol io, Inc. United States 12.00-14.00 12.00 $14.10, up 17% 16.85 19.5%
Jun-15 NYSE:XTLY Xactly Corporation United States 10.00-12.00 8.00 8.70, up 9% 7.80 (10.3%)
Jun-15 NYSE:FIT Fi tbi t Inc. United States 17.00-19.00 20.00 29.68, up 48% 37.69 27.0%
Jun-15 NasdaqGM:MB MINDBODY, Inc. United States 13.00-15.00 14.00 11.56, down 17.4% 15.63 35.2%
Jun-15 NYSE:TGNA TEGNA Inc. United States 26.00-28.00 30.00 31.63, up 5% 22.39 (29.2%)
Jun-15 NYSE:EVH Evolent Health, Inc. United States 14.00-16.00 17.00 18.86, up 11% 15.96 (15.4%)
May-15 NYSE:SHOP Shopify Inc. Canada 14.00-16.00 17.00 28.31, up 51% 35.20 24.3%
May-15 NasdaqGS:BZUN Baozun Inc. China 12.00-14.00 10.00 10.44, up 4% 4.82 (53.8%)
May-15 NYSE:PGND Press Ganey Holdings , Inc. United States 22.00-24.00 25.00 27.50, up 10 % 29.59 7.6%
Apr-15 NasdaqGS:APIC Apigee Corporation United States 16.00-18.00 17.00 10.60, down 8% 10.55 (0.5%)
Apr-15 NasdaqGS:ETSY Etsy, Inc. United States 14.00-16.00 16.00 30.00, up 86% 13.69 (54.4%)
Apr-15 NasdaqGM:WOWO JM WOWO Hong Kong 9.00-11.00 10.00 10.29, up 3% 6.40 (37.8%)
Apr-15 NYSE:GDDY GoDaddy Inc. United States 17.00-19.00 20.00 26.15, up 31% 25.21 (3.6%)
Mar-15 NYSE:MXPT MaxPoint Interactive, Inc. United States 10.50-12.50 11.50 10.60, down 8% 4.08 (61.5%)
Jan-15 NYSE:BOX Box, Inc. United States 11.00-13.00 14.00 23.23, up 65% 12.58 (45.8%)
Dec-14 NYSE:NEWR New Rel ic, Inc. United States 20.00-22.00 23.00 31.10, up 35% 38.11 22.5%
Dec-14 NYSE:ONDK On Deck Capita l , Inc. United States 16.00-18.00 20.00 27.98, up 40% 9.90 (64.6%)
Dec-14 NasdaqGS:MOMO Momo Inc. China 12.50-14.50 13.50 17.02, up 26% 12.50 (26.6%)
Dec-14 NasdaqGM:CNXR Connecture, Inc. United States 12.00-14.00 8.00 8.80, up 10% 4.56 (48.2%)
Dec-14 NasdaqGS:HDP Hortonworks , Inc. United States 14.00-16.00 16.00 26.38, up 65% 21.89 (17.0%)
Dec-14 NYSE:WK Workiva Inc. United States 13.00-15.00 14.00 13.99, up 4% 15.19 8.6%
Dec-14 NYSE:LC LendingClub Corporation United States 12.00-14.00 15.00 23.34, up 56% 13.23 (43.3%)
Nov-14 NasdaqGS:CNV Cnova N.V. Netherlands 12.50-14.00 7.00 7.15, flat 3.02 (57.8%)
Nov-14 NasdaqGM:UPLD Upland Software, Inc. United States 12.00-14.00 12.00 9.75, down 19% 7.90 (19.0%)
Oct-14 NYSE:HUBS HubSpot, Inc. United States 22.00-24.00 25.00 30.10, up 20% 46.37 54.1%
Oct-14 NYSE:W Wayfa ir Inc. United States 25.00-28.00 29.00 37.72, down 30% 35.06 (7.1%)
11 | M&A and Investment Summary September 2015
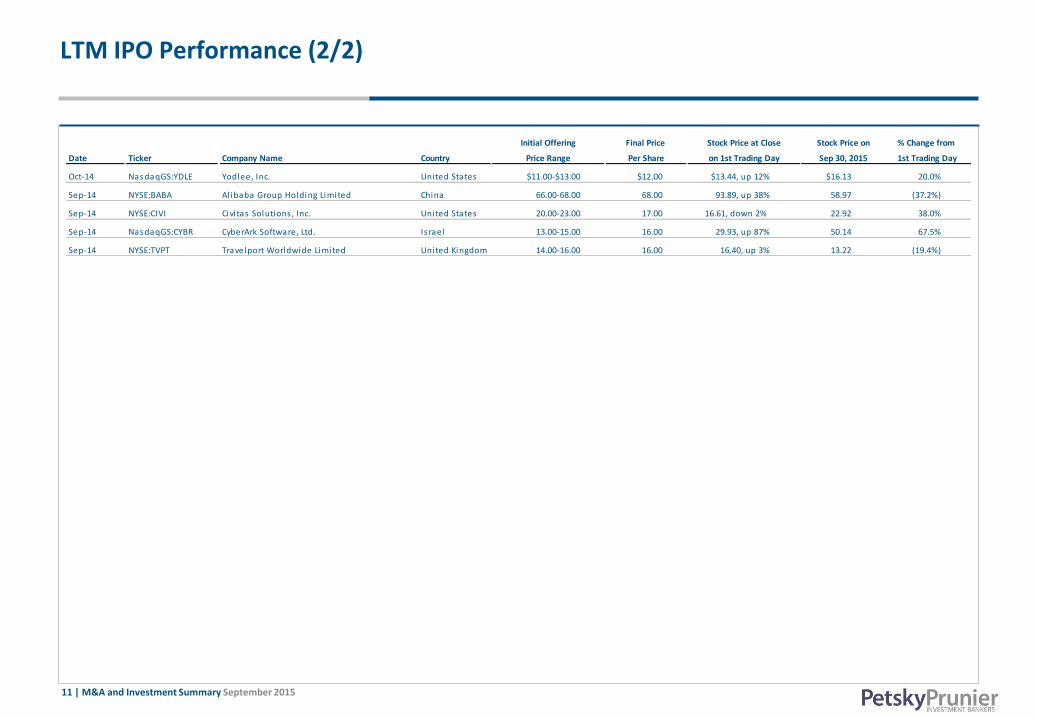
LTM IPO Performance (2/2)
Initial Offering Final Price Stock Price at Close Stock Price on % Change from
Date Ticker Company Name Country Price Range Per Share on 1st Trading Day Sep 30, 2015 1st Trading Day
Oct-14 NasdaqGS:YDLE Yodlee, Inc. United States $11.00-$13.00 $12.00 $13.44, up 12% $16.13 20.0%
Sep-14 NYSE:BABA Al ibaba Group Holding Limited China 66.00-68.00 68.00 93.89, up 38% 58.97 (37.2%)
Sep-14 NYSE:CIVI Civi tas Solutions , Inc. United States 20.00-23.00 17.00 16.61, down 2% 22.92 38.0%
Sep-14 NasdaqGS:CYBR CyberArk Software, Ltd. Is rael 13.00-15.00 16.00 29.93, up 87% 50.14 67.5%
Sep-14 NYSE:TVPT Travelport Worldwide Limited United Kingdom 14.00-16.00 16.00 16.40, up 3% 13.22 (19.4%)
12 | M&A and Investment Summary September 2015
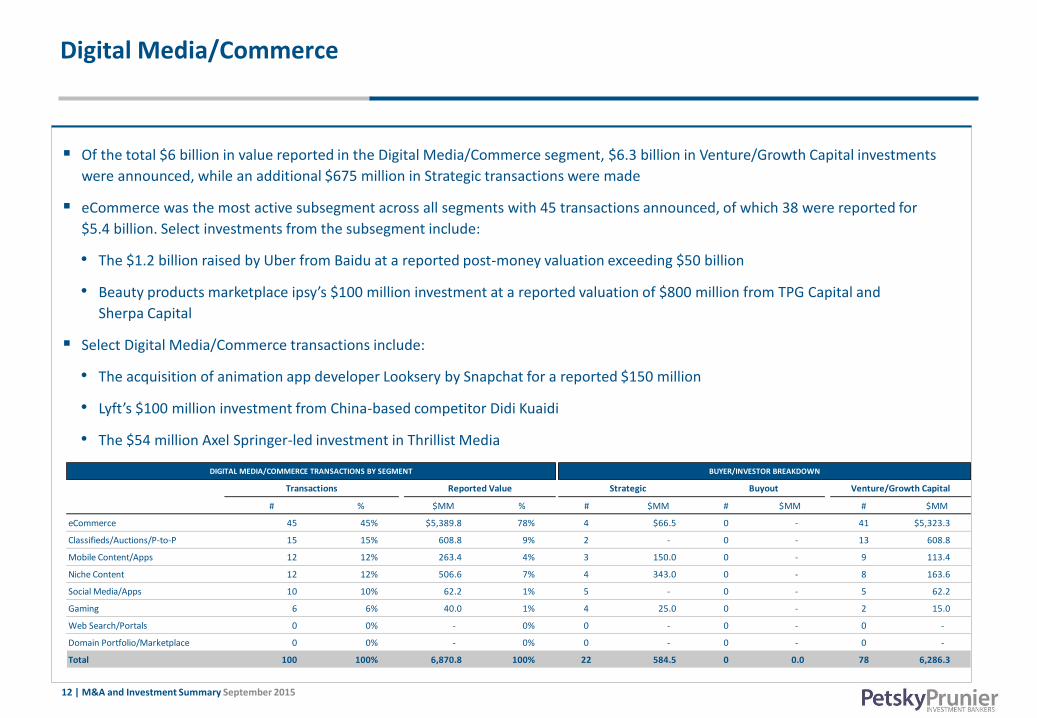
Digital Media/Commerce
Of the total $6 billion in value reported in the Digital Media/Commerce segment, $6.3 billion in Venture/Growth Capital investments
were announced, while an additional $675 million in Strategic transactions were made
eCommerce was the most active subsegment across all segments with 45 transactions announced, of which 38 were reported for
$5.4 billion. Select investments from the subsegment include:
• The $1.2 billion raised by Uber from Baidu at a reported post-money valuation exceeding $50 billion
• Beauty products marketplace ipsy’s $100 million investment at a reported valuation of $800 million from TPG Capital and
Sherpa Capital
Select Digital Media/Commerce transactions include:
• The acquisition of animation app developer Looksery by Snapchat for a reported $150 million
• Lyft’s $100 million investment from China-based competitor Didi Kuaidi
• The $54 million Axel Springer-led investment in Thrillist Media
# % $MM % # $MM # $MM # $MM
eCommerce 45 45% $5,389.8 78% 4 $66.5 0 - 41 $5,323.3
Classifieds/Auctions/P-to-P 15 15% 608.8 9% 2 - 0 - 13 608.8
Mobile Content/Apps 12 12% 263.4 4% 3 150.0 0 - 9 113.4
Niche Content 12 12% 506.6 7% 4 343.0 0 - 8 163.6
Social Media/Apps 10 10% 62.2 1% 5 - 0 - 5 62.2
Gaming 6 6% 40.0 1% 4 25.0 0 - 2 15.0
Web Search/Portals 0 0% - 0% 0 - 0 - 0 -
Domain Portfolio/Marketplace 0 0% - 0% 0 - 0 - 0 -
Total 100 100% 6,870.8 100% 22 584.5 0 0.0 78 6,286.3
BUYER/INVESTOR BREAKDOWN
Transactions Reported Value Strategic Buyout Venture/Growth Capital
DIGITAL MEDIA/COMMERCE TRANSACTIONS BY SEGMENT
13 | M&A and Investment Summary September 2015
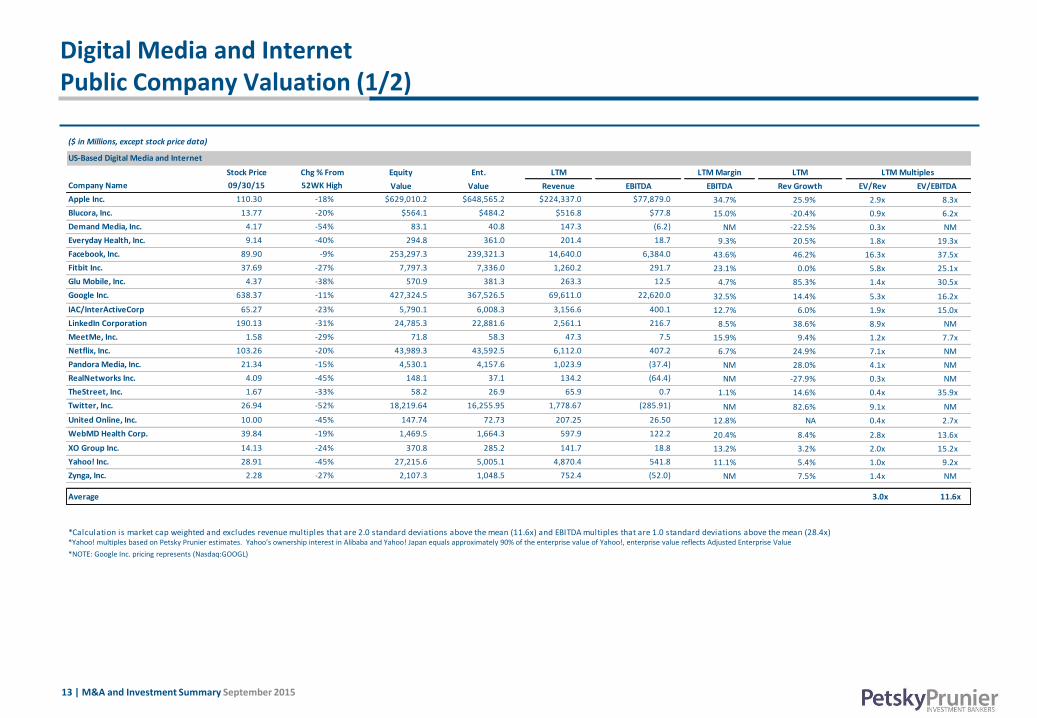
Digital Media and Internet Public Company Valuation (1/2)
*NOTE: Google Inc. pricing represents (Nasdaq:GOOGL)
*Yahoo! multiples based on Petsky Prunier estimates. Yahoo’s ownership interest in Alibaba and Yahoo! Japan equals approximately 90% of the enterprise value of Yahoo!, enterprise value reflects Adjusted Enterprise Value
($ in Millions, except stock price data)
Stock Price Chg % From Equity Ent. LTM LTM Margin LTM LTM Multiples
Company Name 09/30/15 52WK High Value Value Revenue EBITDA EBITDA Rev Growth EV/Rev EV/EBITDA
Apple Inc. 110.30 -18% $629,010.2 $648,565.2 $224,337.0 $77,879.0 34.7% 25.9% 2.9x 8.3x
Blucora, Inc. 13.77 -20% $564.1 $484.2 $516.8 $77.8 15.0% -20.4% 0.9x 6.2x
Demand Media, Inc. 4.17 -54% 83.1 40.8 147.3 (6.2) NM -22.5% 0.3x NM
Everyday Health, Inc. 9.14 -40% 294.8 361.0 201.4 18.7 9.3% 20.5% 1.8x 19.3x
Facebook, Inc. 89.90 -9% 253,297.3 239,321.3 14,640.0 6,384.0 43.6% 46.2% 16.3x 37.5x
Fitbit Inc. 37.69 -27% 7,797.3 7,336.0 1,260.2 291.7 23.1% 0.0% 5.8x 25.1x
Glu Mobile, Inc. 4.37 -38% 570.9 381.3 263.3 12.5 4.7% 85.3% 1.4x 30.5x
Google Inc. 638.37 -11% 427,324.5 367,526.5 69,611.0 22,620.0 32.5% 14.4% 5.3x 16.2x
IAC/InterActiveCorp 65.27 -23% 5,790.1 6,008.3 3,156.6 400.1 12.7% 6.0% 1.9x 15.0x
LinkedIn Corporation 190.13 -31% 24,785.3 22,881.6 2,561.1 216.7 8.5% 38.6% 8.9x NM
MeetMe, Inc. 1.58 -29% 71.8 58.3 47.3 7.5 15.9% 9.4% 1.2x 7.7x
Netflix, Inc. 103.26 -20% 43,989.3 43,592.5 6,112.0 407.2 6.7% 24.9% 7.1x NM
Pandora Media, Inc. 21.34 -15% 4,530.1 4,157.6 1,023.9 (37.4) NM 28.0% 4.1x NM
RealNetworks Inc. 4.09 -45% 148.1 37.1 134.2 (64.4) NM -27.9% 0.3x NM
TheStreet, Inc. 1.67 -33% 58.2 26.9 65.9 0.7 1.1% 14.6% 0.4x 35.9x
Twitter, Inc. 26.94 -52% 18,219.64 16,255.95 1,778.67 (285.91) NM 82.6% 9.1x NM
United Online, Inc. 10.00 -45% 147.74 72.73 207.25 26.50 12.8% NA 0.4x 2.7x
WebMD Health Corp. 39.84 -19% 1,469.5 1,664.3 597.9 122.2 20.4% 8.4% 2.8x 13.6x
XO Group Inc. 14.13 -24% 370.8 285.2 141.7 18.8 13.2% 3.2% 2.0x 15.2x
Yahoo! Inc. 28.91 -45% 27,215.6 5,005.1 4,870.4 541.8 11.1% 5.4% 1.0x 9.2x
Zynga, Inc. 2.28 -27% 2,107.3 1,048.5 752.4 (52.0) NM 7.5% 1.4x NM
Average 3.0x 11.6x
*Calculation is market cap weighted and excludes revenue multiples that are 2.0 standard deviations above the mean (11.6x) and EBITDA multiples that are 1.0 standard deviations above the mean (28.4x)
US-Based Digital Media and Internet
14 | M&A and Investment Summary September 2015
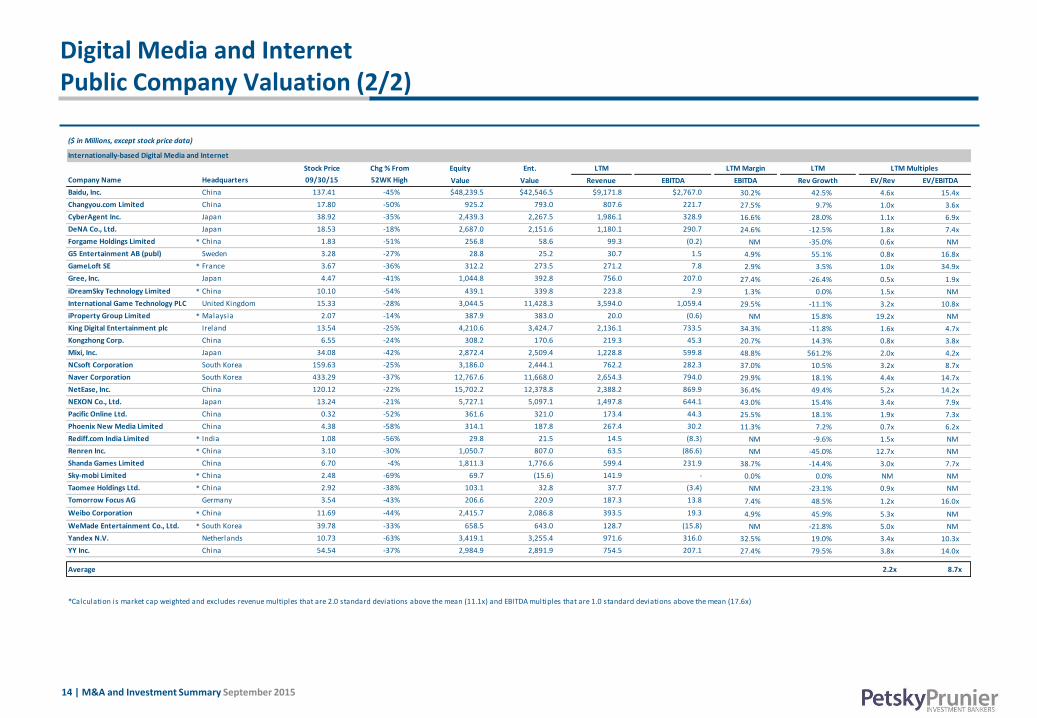
Digital Media and Internet Public Company Valuation (2/2)
($ in Millions, except stock price data)
Stock Price Chg % From Equity Ent. LTM LTM Margin LTM LTM Multiples
Company Name Headquarters 09/30/15 52WK High Value Value Revenue EBITDA EBITDA Rev Growth EV/Rev EV/EBITDA
Baidu, Inc. China 137.41 -45% $48,239.5 $42,546.5 $9,171.8 $2,767.0 30.2% 42.5% 4.6x 15.4x
Changyou.com Limited China 17.80 -50% 925.2 793.0 807.6 221.7 27.5% 9.7% 1.0x 3.6x
CyberAgent Inc. Japan 38.92 -35% 2,439.3 2,267.5 1,986.1 328.9 16.6% 28.0% 1.1x 6.9x
DeNA Co., Ltd. Japan 18.53 -18% 2,687.0 2,151.6 1,180.1 290.7 24.6% -12.5% 1.8x 7.4x
Forgame Holdings Limited * China 1.83 -51% 256.8 58.6 99.3 (0.2) NM -35.0% 0.6x NM
G5 Entertainment AB (publ) Sweden 3.28 -27% 28.8 25.2 30.7 1.5 4.9% 55.1% 0.8x 16.8x
GameLoft SE * France 3.67 -36% 312.2 273.5 271.2 7.8 2.9% 3.5% 1.0x 34.9x
Gree, Inc. Japan 4.47 -41% 1,044.8 392.8 756.0 207.0 27.4% -26.4% 0.5x 1.9x
iDreamSky Technology Limited * China 10.10 -54% 439.1 339.8 223.8 2.9 1.3% 0.0% 1.5x NM
International Game Technology PLC United Kingdom 15.33 -28% 3,044.5 11,428.3 3,594.0 1,059.4 29.5% -11.1% 3.2x 10.8x
iProperty Group Limited * Malaysia 2.07 -14% 387.9 383.0 20.0 (0.6) NM 15.8% 19.2x NM
King Digital Entertainment plc Ireland 13.54 -25% 4,210.6 3,424.7 2,136.1 733.5 34.3% -11.8% 1.6x 4.7x
Kongzhong Corp. China 6.55 -24% 308.2 170.6 219.3 45.3 20.7% 14.3% 0.8x 3.8x
Mixi, Inc. Japan 34.08 -42% 2,872.4 2,509.4 1,228.8 599.8 48.8% 561.2% 2.0x 4.2x
NCsoft Corporation South Korea 159.63 -25% 3,186.0 2,444.1 762.2 282.3 37.0% 10.5% 3.2x 8.7x
Naver Corporation South Korea 433.29 -37% 12,767.6 11,668.0 2,654.3 794.0 29.9% 18.1% 4.4x 14.7x
NetEase, Inc. China 120.12 -22% 15,702.2 12,378.8 2,388.2 869.9 36.4% 49.4% 5.2x 14.2x
NEXON Co., Ltd. Japan 13.24 -21% 5,727.1 5,097.1 1,497.8 644.1 43.0% 15.4% 3.4x 7.9x
Pacific Online Ltd. China 0.32 -52% 361.6 321.0 173.4 44.3 25.5% 18.1% 1.9x 7.3x
Phoenix New Media Limited China 4.38 -58% 314.1 187.8 267.4 30.2 11.3% 7.2% 0.7x 6.2x
Rediff.com India Limited * India 1.08 -56% 29.8 21.5 14.5 (8.3) NM -9.6% 1.5x NM
Renren Inc. * China 3.10 -30% 1,050.7 807.0 63.5 (86.6) NM -45.0% 12.7x NM
Shanda Games Limited China 6.70 -4% 1,811.3 1,776.6 599.4 231.9 38.7% -14.4% 3.0x 7.7x
Sky-mobi Limited * China 2.48 -69% 69.7 (15.6) 141.9 - 0.0% 0.0% NM NM
Taomee Holdings Ltd. * China 2.92 -38% 103.1 32.8 37.7 (3.4) NM -23.1% 0.9x NM
Tomorrow Focus AG Germany 3.54 -43% 206.6 220.9 187.3 13.8 7.4% 48.5% 1.2x 16.0x
Weibo Corporation * China 11.69 -44% 2,415.7 2,086.8 393.5 19.3 4.9% 45.9% 5.3x NM
WeMade Entertainment Co., Ltd. * South Korea 39.78 -33% 658.5 643.0 128.7 (15.8) NM -21.8% 5.0x NM
Yandex N.V. Netherlands 10.73 -63% 3,419.1 3,255.4 971.6 316.0 32.5% 19.0% 3.4x 10.3x
YY Inc. China 54.54 -37% 2,984.9 2,891.9 754.5 207.1 27.4% 79.5% 3.8x 14.0x
Average 2.2x 8.7x
*Calculation is market cap weighted and excludes revenue multiples that are 2.0 standard deviations above the mean (11.1x) and EBITDA multiples that are 1.0 standard deviations above the mean (17.6x)
Internationally-based Digital Media and Internet

15 | M&A and Investment Summary September 2015
eCommerce Public Company Valuation (1/2)
($ in Millions, except stock price data)
Stock Price Chg % From Equity Ent. LTM LTM Margin LTM LTM Multiples
Company Name 09/30/15 52WK High Value Value Revenue EBITDA EBITDA Rev Growth EV/Rev EV/EBITDA
1-800-Flowers.com Inc. 9.10 -32% $591.8 $697.8 $1,121.5 $87.7 7.8% 48.3% 0.6x 8.0x
Amazon.com, Inc. 511.89 -12% 239,416.1 243,368.1 95,808.0 5,726.0 6.0% 17.2% 2.5x 42.5x
Apple Inc. 110.30 -18% 629,010.2 648,565.2 224,337.0 77,879.0 34.7% 25.9% 2.9x 8.3x
Blucora, Inc. 13.77 -20% 564.1 484.2 516.8 77.8 15.0% -20.4% 0.9x 6.2x
Blue Nile Inc. 33.54 -11% 386.0 346.9 483.4 16.4 3.4% 6.2% 0.7x 21.2x
CafePress Inc. 4.29 -20% 73.3 31.8 142.8 (3.5) NM 16.5% 0.2x NM
CDW Corporation 40.86 -3% 6,929.4 10,136.6 12,385.4 915.5 7.4% 9.3% 0.8x 11.1x
Chegg, Inc. 7.21 -19% 632.0 569.5 317.9 17.4 5.5% 14.5% 1.8x 32.7x
Copart, Inc. 32.90 -15% 3,954.2 4,144.3 1,146.1 388.9 33.9% -1.5% 3.6x 10.7x
eBay Inc. 24.44 -63% 29,773.5 26,841.5 18,351.0 5,167.0 28.2% 11.1% 1.5x 5.2x
Etsy, Inc. 13.69 -62% 1,531.9 1,253.2 232.5 4.2 1.8% 50.4% 5.4x NM
Expedia Inc. 117.68 -10% 16,702.8 16,413.7 6,104.5 705.8 11.6% 16.3% 2.7x 23.3x
Google Inc. 638.37 -11% 427,324.5 367,526.5 69,611.0 22,620.0 32.5% 14.4% 5.3x 16.2x
GrubHub Inc. 24.34 -49% 2,059.7 1,752.3 311.5 86.7 27.8% 53.3% 5.6x 20.2x
Hollywood Media Corp. 0.72 -44% 16.3 (6.6) 0.4 (4.8) NM -31.1% NM 1.4x
HSN, Inc. 57.24 -28% 3,027.6 3,629.0 3,682.9 332.5 9.0% 6.7% 1.0x 10.9x
IAC/InterActiveCorp 65.27 -23% 5,790.1 6,008.3 3,156.6 400.1 12.7% 6.0% 1.9x 15.0x
Liberty Interactive Corporation $26.23 -17% 12,090.1 16,725.1 10,048.0 1,749.0 17.4% -2.8% 1.7x 9.6x
Liquidity Services, Inc. 7.39 -44% 221.9 125.7 436.3 28.3 6.5% -13.8% 0.3x 4.4x
Overstock.com Inc. 17.16 -37% 433.0 329.0 1,609.7 24.3 1.5% 17.3% 0.2x 13.6x
PetMed Express, Inc. 16.10 -13% 327.3 269.1 228.5 31.3 13.7% -1.4% 1.2x 8.6x
The Priceline Group Inc. 1,236.86 -10% 62,710.8 64,922.7 8,797.7 3,266.2 37.1% 16.1% 7.4x 19.9x
Shutterfly, Inc. 35.75 -28% 1,295.7 1,481.7 969.2 89.6 9.2% 16.8% 1.5x 16.5x
Shutterstock, Inc. 30.24 -64% 1,090.1 823.7 376.8 50.0 13.3% 34.3% 2.2x 16.5x
Spark Networks, Inc. 2.88 -44% 72.5 57.9 55.0 9.3 16.9% -17.8% 1.1x 6.2x
Stamps.com Inc. 74.01 -17% 1,220.39 1,138.18 172.10 42.12 24.5% 31.2% 6.6x 27.0x
U.S. Auto Parts Network, Inc. 1.88 -44% 63.9 77.5 291.4 3.8 1.3% 9.4% 0.3x 20.2x
EVINE Live Inc. 2.62 -63% 149.7 194.5 677.8 11.9 1.7% 3.2% 0.3x 16.4x
Wayfair Inc. 35.06 -38% 2,938.4 2,650.4 1,660.9 (124.9) NM 50.1% 1.6x NM
Average 1.8x 12.7x
*Calculation is market cap weighted and excludes revenue multiples that are 2.0 standard deviations above the mean (6.3x) and EBITDA multiples that are 1.0 standard deviations above the mean (24.4x)
US-based eCommerce

16 | M&A and Investment Summary September 2015
eCommerce Public Company Valuation (1/2)
($ in Millions, except stock price data)
Stock Price Chg % From Equity Ent. LTM LTM Margin LTM LTM Multiples
Company Name Headquarters 09/30/15 52WK High Value Value Revenue EBITDA EBITDA Rev Growth EV/Rev EV/EBITDA
58.com Inc. * China 47.05 -44% $ 6,543.4 $ 6,084.0 $ 398.8 $ (75.0) NM 99.7% 15.3x NM
Alibaba Group Holding Limited China 58.97 -51% 148,157.8 137,847.7 13,011.5 4,259.5 32.7% 40.3% 10.6x 32.4x
Cnova N.V. * Netherlands 3.02 -65% 1,332.7 1,291.9 4,113.3 20.4 0.5% 17.7% 0.3x 63.3x
E-Commerce China Dangdang Inc. * China 5.97 -56% 483.0 207.9 1,417.6 (3.5) NM 22.2% 0.1x NM
eLong Inc. * China 17.02 -38% 625.2 411.3 157.7 (143.8) NM -10.8% 2.6x NM
JD.com, Inc. * China 26.06 -31% 36,052.4 32,427.3 23,595.1 (61.2) NM 63.6% 1.4x NM
Jiayuan.com International Ltd. China 6.15 -35% 182.8 104.1 110.3 3.6 3.2% 26.3% 0.9x 29.1x
Jumei International Holding Limited China 9.87 -65% 1,433.1 992.5 882.4 53.2 6.0% 54.1% 1.1x 18.7x
LightInTheBox Holding Co., Ltd. * China 2.78 -68% 133.0 77.8 377.2 (38.5) NM 18.5% 0.2x NM
Mercadolibre, Inc. Argentina 91.06 -41% 4,020.8 3,971.3 611.7 189.2 30.9% 21.2% 6.5x 21.0x
PChome Online Inc. Taiwan 11.47 -25% 1,065.0 932.1 698.6 36.4 5.2% 19.7% 1.3x 25.6x
Rakuten, Inc. Japan 12.73 -37% 18,125.4 18,375.4 5,347.3 1,243.0 23.2% 18.0% 3.4x 14.8x
Travelport Worldwide Limited United Kingdom 13.22 -29% 1,619.4 3,972.4 2,151.0 350.0 16.3% 1.8% 1.8x 11.3x
Vipshop Holdings Limited China 16.80 -45% 9,742.8 9,208.3 5,085.7 295.2 5.8% 98.2% 1.8x 31.2x
Average 2.5x 20.5x
*Calculation is market cap weighted and excludes revenue multiples that are 2.0 standard deviations above the mean (12.3x) and EBITDA multiples that are 1.0 standard deviations above the mean (42.8x)
Internationally-based eCommerce

17 | M&A and Investment Summary September 2015
Digital Advertising
There was a total of 34 transactions announced in the Digital Advertising segment, of which 23 were worth nearly $800 million in
reported value
Mobile Marketing was the most valuable subsegment with five transactions worth a reported $243 million in value
Select Transactions:
• AOL’s $238 million purchase of mobile advertising solutions provider Millennial Media
• Local review site Thumbtack’s $125 million round of funding led by Baillie Gifford with participation from Tiger Global Management,
Google Capital, and Sequoia Capital
• News Corp.’s $90 million acquisition of social video advertising platform Unruly
• Gartner’s acquisition of software comparison site Capterra
# % $MM % # $MM # $MM # $MM
Online Lead Generation 7 21% $28.0 4% 5 $23.0 0 - 2 $5.0
Mobile Marketing 5 15% 242.9 31% 2 218.3 0 - 3 24.6
Vertical Search 5 15% 220.0 28% 1 - 0 - 4 220.0
Comparison Shopping 4 12% 48.9 6% 1 - 0 - 3 48.9
Digital Promotion/Coupon 4 12% 51.2 6% 2 - 0 - 2 51.2
Digital Video 3 9% 127.0 16% 1 90.0 0 - 2 37.0
Ad Networks/Exchanges 2 6% 10.5 1% 0 - 0 - 2 10.5
Other* 3 9% 67.5 8% 0 - 0 - 3 67.5
Total 34 100% 796.0 100% 12 331.3 1 0.0 21 464.7
DIGITAL ADVERTISING TRANSACTIONS BY SEGMENT BUYER/INVESTOR BREAKDOWN
Transactions Reported Value Strategic Buyout Venture/Growth Capital
18 | M&A and Investment Summary September 2015
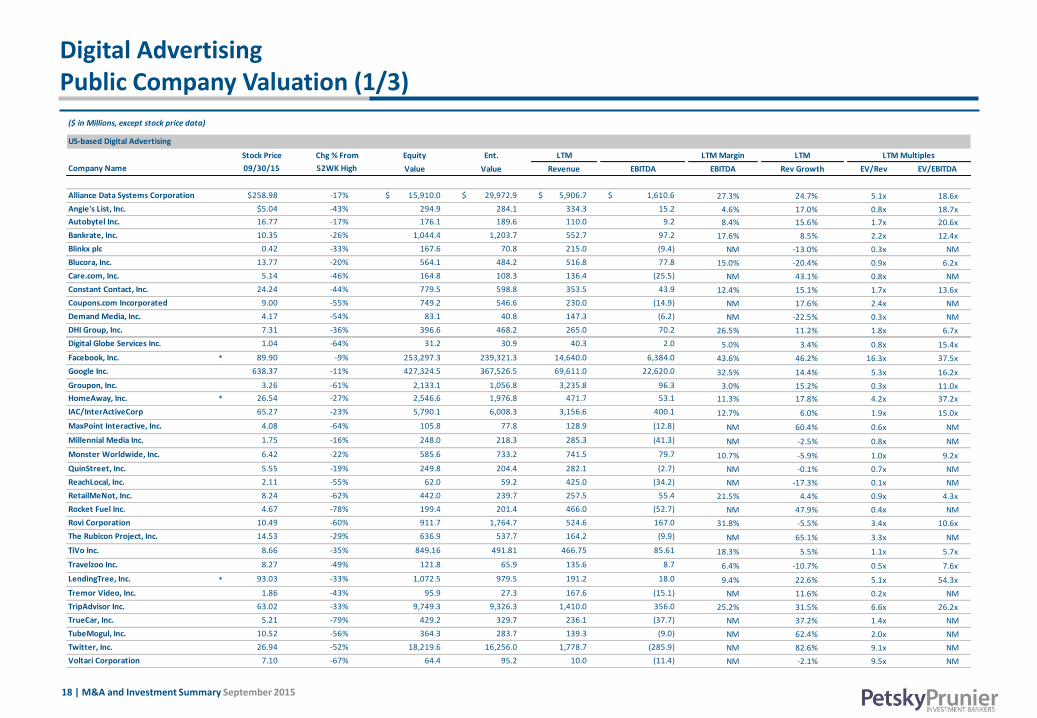
Digital Advertising Public Company Valuation (1/3)
($ in Millions, except stock price data)
US-based Digital Advertising
Stock Price Chg % From Equity Ent. LTM LTM Margin LTM LTM Multiples
Company Name 09/30/15 52WK High Value Value Revenue EBITDA EBITDA Rev Growth EV/Rev EV/EBITDA
Alliance Data Systems Corporation $258.98 -17% $ 15,910.0 $ 29,972.9 $ 5,906.7 $ 1,610.6 27.3% 24.7% 5.1x 18.6x
Angie's List, Inc. $5.04 -43% 294.9 284.1 334.3 15.2 4.6% 17.0% 0.8x 18.7x
Autobytel Inc. 16.77 -17% 176.1 189.6 110.0 9.2 8.4% 15.6% 1.7x 20.6x
Bankrate, Inc. 10.35 -26% 1,044.4 1,203.7 552.7 97.2 17.6% 8.5% 2.2x 12.4x
Blinkx plc 0.42 -33% 167.6 70.8 215.0 (9.4) NM -13.0% 0.3x NM
Blucora, Inc. 13.77 -20% 564.1 484.2 516.8 77.8 15.0% -20.4% 0.9x 6.2x
Care.com, Inc. 5.14 -46% 164.8 108.3 136.4 (25.5) NM 43.1% 0.8x NM
Constant Contact, Inc. 24.24 -44% 779.5 598.8 353.5 43.9 12.4% 15.1% 1.7x 13.6x
Coupons.com Incorporated 9.00 -55% 749.2 546.6 230.0 (14.9) NM 17.6% 2.4x NM
Demand Media, Inc. 4.17 -54% 83.1 40.8 147.3 (6.2) NM -22.5% 0.3x NM
DHI Group, Inc. 7.31 -36% 396.6 468.2 265.0 70.2 26.5% 11.2% 1.8x 6.7x
Digital Globe Services Inc. 1.04 -64% 31.2 30.9 40.3 2.0 5.0% 3.4% 0.8x 15.4x
Facebook, Inc. * 89.90 -9% 253,297.3 239,321.3 14,640.0 6,384.0 43.6% 46.2% 16.3x 37.5x
Google Inc. 638.37 -11% 427,324.5 367,526.5 69,611.0 22,620.0 32.5% 14.4% 5.3x 16.2x
Groupon, Inc. 3.26 -61% 2,133.1 1,056.8 3,235.8 96.3 3.0% 15.2% 0.3x 11.0x
HomeAway, Inc. * 26.54 -27% 2,546.6 1,976.8 471.7 53.1 11.3% 17.8% 4.2x 37.2x
IAC/InterActiveCorp 65.27 -23% 5,790.1 6,008.3 3,156.6 400.1 12.7% 6.0% 1.9x 15.0x
MaxPoint Interactive, Inc. 4.08 -64% 105.8 77.8 128.9 (12.8) NM 60.4% 0.6x NM
Millennial Media Inc. 1.75 -16% 248.0 218.3 285.3 (41.3) NM -2.5% 0.8x NM
Monster Worldwide, Inc. 6.42 -22% 585.6 733.2 741.5 79.7 10.7% -5.9% 1.0x 9.2x
QuinStreet, Inc. 5.55 -19% 249.8 204.4 282.1 (2.7) NM -0.1% 0.7x NM
ReachLocal, Inc. 2.11 -55% 62.0 59.2 425.0 (34.2) NM -17.3% 0.1x NM
RetailMeNot, Inc. 8.24 -62% 442.0 239.7 257.5 55.4 21.5% 4.4% 0.9x 4.3x
Rocket Fuel Inc. 4.67 -78% 199.4 201.4 466.0 (52.7) NM 47.9% 0.4x NM
Rovi Corporation 10.49 -60% 911.7 1,764.7 524.6 167.0 31.8% -5.5% 3.4x 10.6x
The Rubicon Project, Inc. 14.53 -29% 636.9 537.7 164.2 (9.9) NM 65.1% 3.3x NM
TiVo Inc. 8.66 -35% 849.16 491.81 466.75 85.61 18.3% 5.5% 1.1x 5.7x
Travelzoo Inc. 8.27 -49% 121.8 65.9 135.6 8.7 6.4% -10.7% 0.5x 7.6x
LendingTree, Inc. * 93.03 -33% 1,072.5 979.5 191.2 18.0 9.4% 22.6% 5.1x 54.3x
Tremor Video, Inc. 1.86 -43% 95.9 27.3 167.6 (15.1) NM 11.6% 0.2x NM
TripAdvisor Inc. 63.02 -33% 9,749.3 9,326.3 1,410.0 356.0 25.2% 31.5% 6.6x 26.2x
TrueCar, Inc. 5.21 -79% 429.2 329.7 236.1 (37.7) NM 37.2% 1.4x NM
TubeMogul, Inc. 10.52 -56% 364.3 283.7 139.3 (9.0) NM 62.4% 2.0x NM
Twitter, Inc. 26.94 -52% 18,219.6 16,256.0 1,778.7 (285.9) NM 82.6% 9.1x NM
Voltari Corporation 7.10 -67% 64.4 95.2 10.0 (11.4) NM -2.1% 9.5x NM
19 | M&A and Investment Summary September 2015
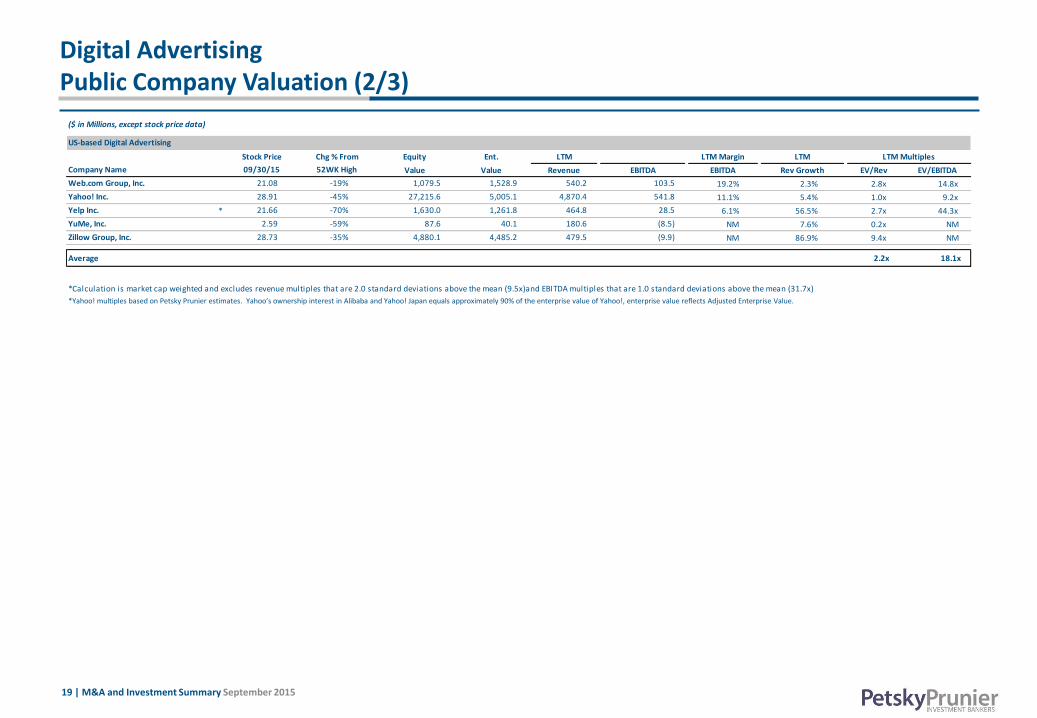
Digital Advertising Public Company Valuation (2/3)
*Yahoo! multiples based on Petsky Prunier estimates. Yahoo’s ownership interest in Alibaba and Yahoo! Japan equals approximately 90% of the enterprise value of Yahoo!, enterprise value reflects Adjusted Enterprise Value.
($ in Millions, except stock price data)
US-based Digital Advertising
Stock Price Chg % From Equity Ent. LTM LTM Margin LTM LTM Multiples
Company Name 09/30/15 52WK High Value Value Revenue EBITDA EBITDA Rev Growth EV/Rev EV/EBITDA
Web.com Group, Inc. 21.08 -19% 1,079.5 1,528.9 540.2 103.5 19.2% 2.3% 2.8x 14.8x
Yahoo! Inc. 28.91 -45% 27,215.6 5,005.1 4,870.4 541.8 11.1% 5.4% 1.0x 9.2x
Yelp Inc. * 21.66 -70% 1,630.0 1,261.8 464.8 28.5 6.1% 56.5% 2.7x 44.3x
YuMe, Inc. 2.59 -59% 87.6 40.1 180.6 (8.5) NM 7.6% 0.2x NM
Zillow Group, Inc. 28.73 -35% 4,880.1 4,485.2 479.5 (9.9) NM 86.9% 9.4x NM
Average 2.2x 18.1x
*Calculation is market cap weighted and excludes revenue multiples that are 2.0 standard deviations above the mean (9.5x)and EBITDA multiples that are 1.0 standard deviations above the mean (31.7x)
20 | M&A and Investment Summary September 2015
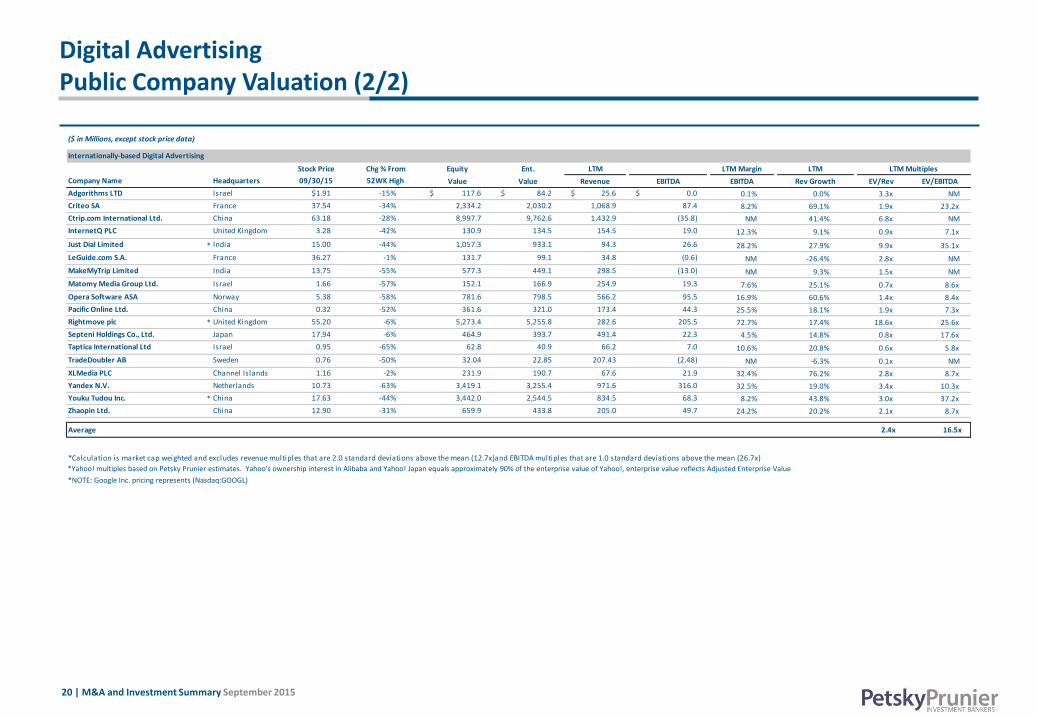
Digital Advertising Public Company Valuation (2/2)
*Yahoo! multiples based on Petsky Prunier estimates. Yahoo’s ownership interest in Alibaba and Yahoo! Japan equals approximately 90% of the enterprise value of Yahoo!, enterprise value reflects Adjusted Enterprise Value
*NOTE: Google Inc. pricing represents (Nasdaq:GOOGL)
($ in Millions, except stock price data)
Stock Price Chg % From Equity Ent. LTM LTM Margin LTM LTM Multiples
Company Name Headquarters 09/30/15 52WK High Value Value Revenue EBITDA EBITDA Rev Growth EV/Rev EV/EBITDA
Adgorithms LTD Israel $1.91 -15% $ 117.6 $ 84.2 $ 25.6 $ 0.0 0.1% 0.0% 3.3x NM
Criteo SA France 37.54 -34% 2,334.2 2,030.2 1,068.9 87.4 8.2% 69.1% 1.9x 23.2x
Ctrip.com International Ltd. China 63.18 -28% 8,997.7 9,762.6 1,432.9 (35.8) NM 41.4% 6.8x NM
InternetQ PLC United Kingdom 3.28 -42% 130.9 134.5 154.5 19.0 12.3% 9.1% 0.9x 7.1x
Just Dial Limited * India 15.00 -44% 1,057.3 933.1 94.3 26.6 28.2% 27.9% 9.9x 35.1x
LeGuide.com S.A. France 36.27 -1% 131.7 99.1 34.8 (0.6) NM -26.4% 2.8x NM
MakeMyTrip Limited India 13.75 -55% 577.3 449.1 298.5 (13.0) NM 9.3% 1.5x NM
Matomy Media Group Ltd. Israel 1.66 -57% 152.1 166.9 254.9 19.3 7.6% 25.1% 0.7x 8.6x
Opera Software ASA Norway 5.38 -58% 781.6 798.5 566.2 95.5 16.9% 60.6% 1.4x 8.4x
Pacific Online Ltd. China 0.32 -52% 361.6 321.0 173.4 44.3 25.5% 18.1% 1.9x 7.3x
Rightmove plc * United Kingdom 55.20 -6% 5,273.4 5,255.8 282.6 205.5 72.7% 17.4% 18.6x 25.6x
Septeni Holdings Co., Ltd. Japan 17.94 -6% 464.9 393.7 491.4 22.3 4.5% 14.8% 0.8x 17.6x
Taptica International Ltd Israel 0.95 -65% 62.8 40.9 66.2 7.0 10.6% 20.8% 0.6x 5.8x
TradeDoubler AB Sweden 0.76 -50% 32.04 22.85 207.43 (2.48) NM -6.3% 0.1x NM
XLMedia PLC Channel Islands 1.16 -2% 231.9 190.7 67.6 21.9 32.4% 76.2% 2.8x 8.7x
Yandex N.V. Netherlands 10.73 -63% 3,419.1 3,255.4 971.6 316.0 32.5% 19.0% 3.4x 10.3x
Youku Tudou Inc. * China 17.63 -44% 3,442.0 2,544.5 834.5 68.3 8.2% 43.8% 3.0x 37.2x
Zhaopin Ltd. China 12.90 -31% 659.9 433.8 205.0 49.7 24.2% 20.2% 2.1x 8.7x
Average 2.4x 16.5x
Internationally-based Digital Advertising
*Calculation is market cap weighted and excludes revenue multiples that are 2.0 standard deviations above the mean (12.7x)and EBITDA multiples that are 1.0 standard deviations above the mean (26.7x)
21 | M&A and Investment Summary September 2015
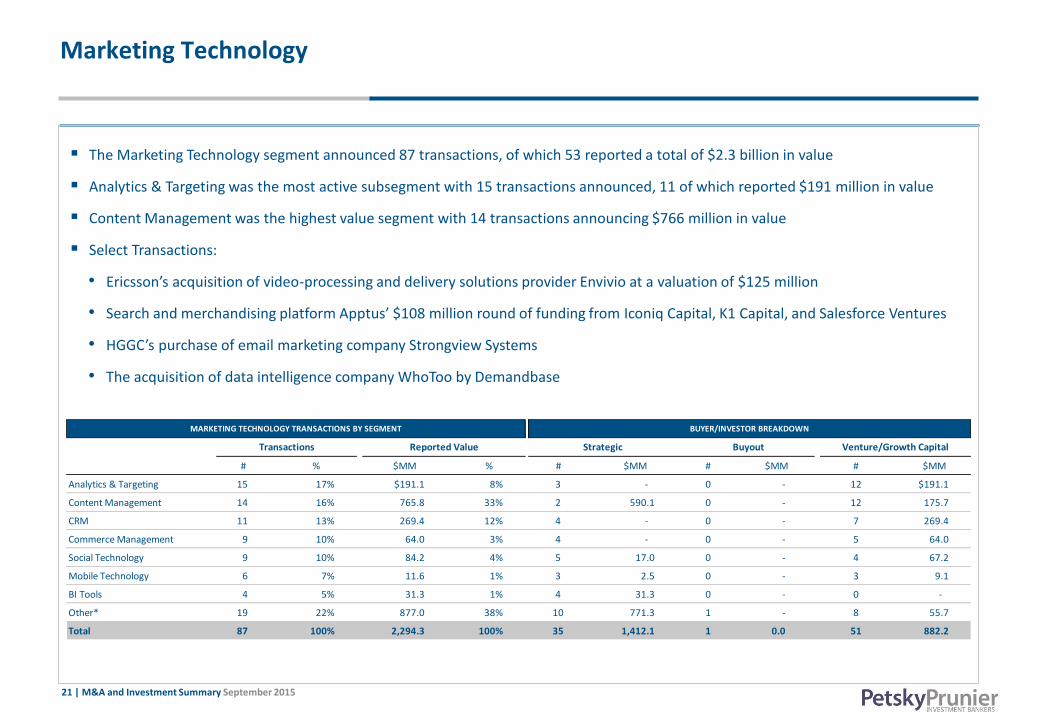
Marketing Technology
The Marketing Technology segment announced 87 transactions, of which 53 reported a total of $2.3 billion in value
Analytics & Targeting was the most active subsegment with 15 transactions announced, 11 of which reported $191 million in value
Content Management was the highest value segment with 14 transactions announcing $766 million in value
Select Transactions:
• Ericsson’s acquisition of video-processing and delivery solutions provider Envivio at a valuation of $125 million
• Search and merchandising platform Apptus’ $108 million round of funding from Iconiq Capital, K1 Capital, and Salesforce Ventures
• HGGC’s purchase of email marketing company Strongview Systems
• The acquisition of data intelligence company WhoToo by Demandbase
# % $MM % # $MM # $MM # $MM
Analytics & Targeting 15 17% $191.1 8% 3 - 0 - 12 $191.1
Content Management 14 16% 765.8 33% 2 590.1 0 - 12 175.7
CRM 11 13% 269.4 12% 4 - 0 - 7 269.4
Commerce Management 9 10% 64.0 3% 4 - 0 - 5 64.0
Social Technology 9 10% 84.2 4% 5 17.0 0 - 4 67.2
Mobile Technology 6 7% 11.6 1% 3 2.5 0 - 3 9.1
BI Tools 4 5% 31.3 1% 4 31.3 0 - 0 -
Other* 19 22% 877.0 38% 10 771.3 1 - 8 55.7
Total 87 100% 2,294.3 100% 35 1,412.1 1 0.0 51 882.2
MARKETING TECHNOLOGY TRANSACTIONS BY SEGMENT BUYER/INVESTOR BREAKDOWN
Transactions Reported Value Strategic Buyout Venture/Growth Capital

22 | M&A and Investment Summary September 2015
Marketing Technology Public Company Valuation (1/3)
($ in Millions, except stock price data)
Stock Price Chg % From Equity Ent. LTM LTM Margin LTM LTM Multiples
Company Name 09/30/15 52WK High Value Value Revenue EBITDA EBITDA Rev Growth EV/Rev EV/EBITDA
Adobe Systems Incorporated * 82.22 -6% $ 41,011.28 $ 39,248.64 $ 4,562.44 $ 1,098.85 24.1% 10.9% 8.6x 35.7x
AppFolio, Inc. 16.85 -9% 564.9 504.5 60.5 (9.4) NM 0.0% 8.3x NM
Bazaarvoice, Inc. 4.51 -52% 363.3 317.1 194.1 (20.4) NM 11.7% 1.6x NM
Blackbaud Inc. 56.12 -12% 2,585.0 2,830.1 600.7 98.2 16.3% 13.4% 4.7x 28.8x
Brightcove Inc. 4.92 -42% 160.3 140.8 128.6 (2.5) NM 6.9% 1.1x NM
ChannelAdvisor Corporation 9.94 -56% 249.3 192.7 91.6 (23.1) NM 18.6% 2.1x NM
Constant Contact, Inc. 24.24 -44% 779.5 598.8 353.5 43.9 12.4% 15.1% 1.7x 13.6x
Covisint Corporation 2.15 -51% 84.4 37.3 85.4 (22.0) NM -9.7% 0.4x NM
Cvent, Inc. 33.66 -3% 1,401.2 1,237.6 165.1 0.6 0.4% 31.7% 7.5x NM
Demandware, Inc. 51.68 -32% 1,944.8 1,758.7 195.4 (28.7) NM 47.8% 9.0x NM
eBay Inc. 24.44 -63% 29,773.5 26,841.5 18,351.0 5,167.0 28.2% 11.1% 1.5x 5.2x
Endurance International Group
Holdings, Inc. 13.36 -43% 1,779.2 2,816.5 691.9 183.4 26.5% 22.0% 4.1x 15.4x
Five9, Inc. 3.70 -40% 185.9 168.3 114.7 (25.8) NM 22.4% 1.5x NM
GoDaddy Inc. * 25.21 -24% 1,638.7 2,664.1 1,499.4 88.9 5.9% 19.9% 1.8x 30.0x
HubSpot, Inc. 46.37 -16% 1,565.2 1,455.8 145.7 (51.7) NM 55.3% 10.0x NM
Interactive Intelligence Group Inc. * 29.71 -47% 643.7 577.6 367.8 9.3 2.5% 12.1% 1.6x 62.0x
IBM Corporation 144.97 -24% 142,002.4 172,063.4 86,913.0 22,376.0 25.7% -10.4% 2.0x 7.7x
Jive Software, Inc. 4.67 -35% 352.8 241.2 190.0 (26.3) NM 18.0% 1.3x NM
LivePerson Inc. * 7.56 -49% 432.2 395.1 230.1 9.3 4.0% 20.5% 1.7x 42.5x
Marin Software Incorporated 3.13 -68% 115.5 76.0 105.9 (29.6) NM 19.5% 0.7x NM
Marketo, Inc. 28.42 -20% 1,213.7 1,109.5 178.3 (55.3) NM 46.2% 6.2x NM
MicroStrategy Inc. 196.47 -13% 2,232.8 1,804.9 556.9 115.8 20.8% -5.2% 3.2x 15.6x
MINDBODY, Inc. 15.63 -10% 611.6 520.8 84.8 (25.3) NM 0.0% 6.1x NM
NetSuite Inc. 83.90 -26% 6,631.5 6,524.9 643.6 (62.6) NM 35.0% 10.1x NM
Nuance Communications, Inc. 16.37 -14% 5,071.3 6,738.1 1,929.3 237.9 12.3% 1.9% 3.5x 28.3x
Oracle Corporation 36.12 -23% 154,038.4 140,599.4 38,078.0 15,787.0 41.5% -1.1% 3.7x 8.9x
Press Ganey Holdings, Inc. * 29.59 -16% 1,556.6 1,730.6 300.2 27.6 9.2% 0.0% 5.8x 62.7x
PROS Holdings, Inc. 22.14 -27% 656.0 612.3 185.9 (17.8) NM 15.5% 3.3x NM
PTC Inc. 31.74 -26% 3,623.7 3,973.0 1,309.4 262.0 20.0% -1.9% 3.0x 15.2x
Qlik Technologies, Inc. 36.45 -14% 3,366.62 3,060.27 580.16 1.18 0.2% 14.1% 5.3x NM
Rightside Group, Ltd. 7.67 -30% 144.7 123.2 203.2 (4.6) NM 11.5% 0.6x NM
Rovi Corporation 10.49 -60% 911.75 1,764.74 524.64 167.04 31.8% -5.5% 3.4x 10.6x
The Rubicon Project, Inc. 14.53 -29% 636.9 537.7 164.2 (9.9) NM 65.1% 3.3x NM
salesforce.com, inc. * 69.43 -12% 45,515.3 46,366.1 5,974.1 315.8 5.3% 25.3% 7.8x 146.8x
Sizmek Inc. 5.99 -29% 177.2 110.3 165.4 13.3 8.1% -1.6% 0.7x 8.3x
US-based Marketing Technology
23 | M&A and Investment Summary September 2015
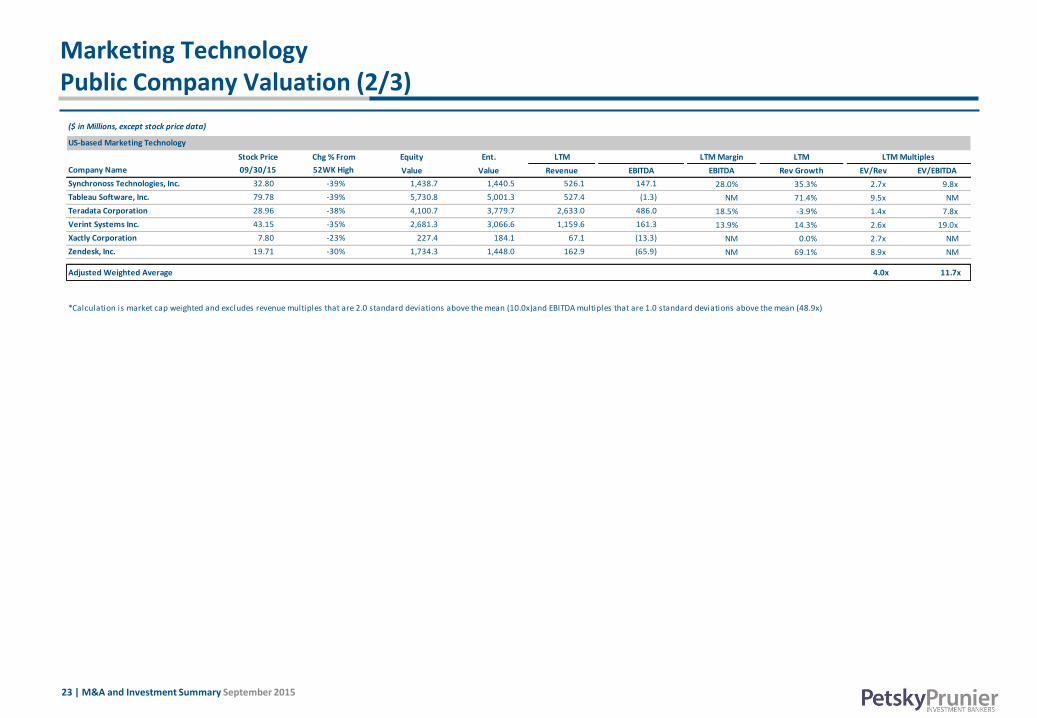
Marketing Technology Public Company Valuation (2/3)
($ in Millions, except stock price data)
Stock Price Chg % From Equity Ent. LTM LTM Margin LTM LTM Multiples
Company Name 09/30/15 52WK High Value Value Revenue EBITDA EBITDA Rev Growth EV/Rev EV/EBITDA
Synchronoss Technologies, Inc. 32.80 -39% 1,438.7 1,440.5 526.1 147.1 28.0% 35.3% 2.7x 9.8x
Tableau Software, Inc. 79.78 -39% 5,730.8 5,001.3 527.4 (1.3) NM 71.4% 9.5x NM
Teradata Corporation 28.96 -38% 4,100.7 3,779.7 2,633.0 486.0 18.5% -3.9% 1.4x 7.8x
Verint Systems Inc. 43.15 -35% 2,681.3 3,066.6 1,159.6 161.3 13.9% 14.3% 2.6x 19.0x
Xactly Corporation 7.80 -23% 227.4 184.1 67.1 (13.3) NM 0.0% 2.7x NM
Zendesk, Inc. 19.71 -30% 1,734.3 1,448.0 162.9 (65.9) NM 69.1% 8.9x NM
Adjusted Weighted Average 4.0x 11.7x
*Calculation is market cap weighted and excludes revenue multiples that are 2.0 standard deviations above the mean (10.0x)and EBITDA multiples that are 1.0 standard deviations above the mean (48.9x)
US-based Marketing Technology
24 | M&A and Investment Summary September 2015
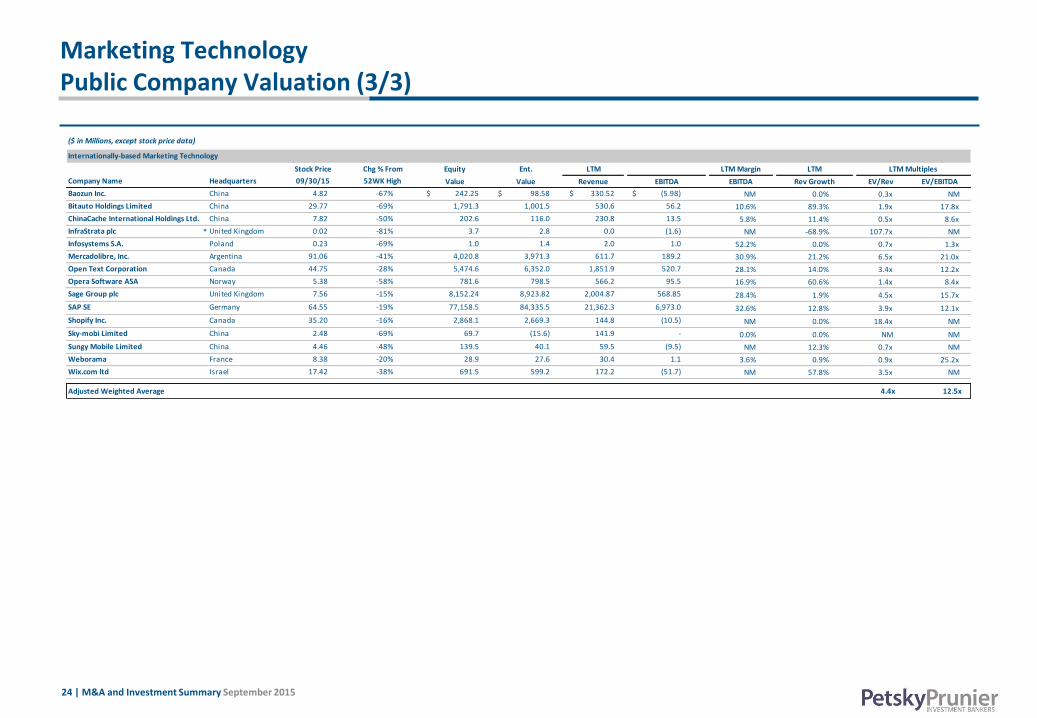
Marketing Technology Public Company Valuation (3/3)
($ in Millions, except stock price data)
Stock Price Chg % From Equity Ent. LTM LTM Margin LTM LTM Multiples
Company Name Headquarters 09/30/15 52WK High Value Value Revenue EBITDA EBITDA Rev Growth EV/Rev EV/EBITDA
Baozun Inc. China 4.82 -67% $ 242.25 $ 98.58 $ 330.52 $ (5.98) NM 0.0% 0.3x NM
Bitauto Holdings Limited China 29.77 -69% 1,791.3 1,001.5 530.6 56.2 10.6% 89.3% 1.9x 17.8x
ChinaCache International Holdings Ltd. China 7.82 -50% 202.6 116.0 230.8 13.5 5.8% 11.4% 0.5x 8.6x
InfraStrata plc * United Kingdom 0.02 -81% 3.7 2.8 0.0 (1.6) NM -68.9% 107.7x NM
Infosystems S.A. Poland 0.23 -69% 1.0 1.4 2.0 1.0 52.2% 0.0% 0.7x 1.3x
Mercadolibre, Inc. Argentina 91.06 -41% 4,020.8 3,971.3 611.7 189.2 30.9% 21.2% 6.5x 21.0x
Open Text Corporation Canada 44.75 -28% 5,474.6 6,352.0 1,851.9 520.7 28.1% 14.0% 3.4x 12.2x
Opera Software ASA Norway 5.38 -58% 781.6 798.5 566.2 95.5 16.9% 60.6% 1.4x 8.4x
Sage Group plc United Kingdom 7.56 -15% 8,152.24 8,923.82 2,004.87 568.85 28.4% 1.9% 4.5x 15.7x
SAP SE Germany 64.55 -19% 77,158.5 84,335.5 21,362.3 6,973.0 32.6% 12.8% 3.9x 12.1x
Shopify Inc. Canada 35.20 -16% 2,868.1 2,669.3 144.8 (10.5) NM 0.0% 18.4x NM
Sky-mobi Limited China 2.48 -69% 69.7 (15.6) 141.9 - 0.0% 0.0% NM NM
Sungy Mobile Limited China 4.46 -48% 139.5 40.1 59.5 (9.5) NM 12.3% 0.7x NM
Weborama France 8.38 -20% 28.9 27.6 30.4 1.1 3.6% 0.9% 0.9x 25.2x
Wix.com ltd Israel 17.42 -38% 691.5 599.2 172.2 (51.7) NM 57.8% 3.5x NM
Adjusted Weighted Average 4.4x 12.5x
Internationally-based Marketing Technology
25 | M&A and Investment Summary September 2015
Agency & Marketing Services
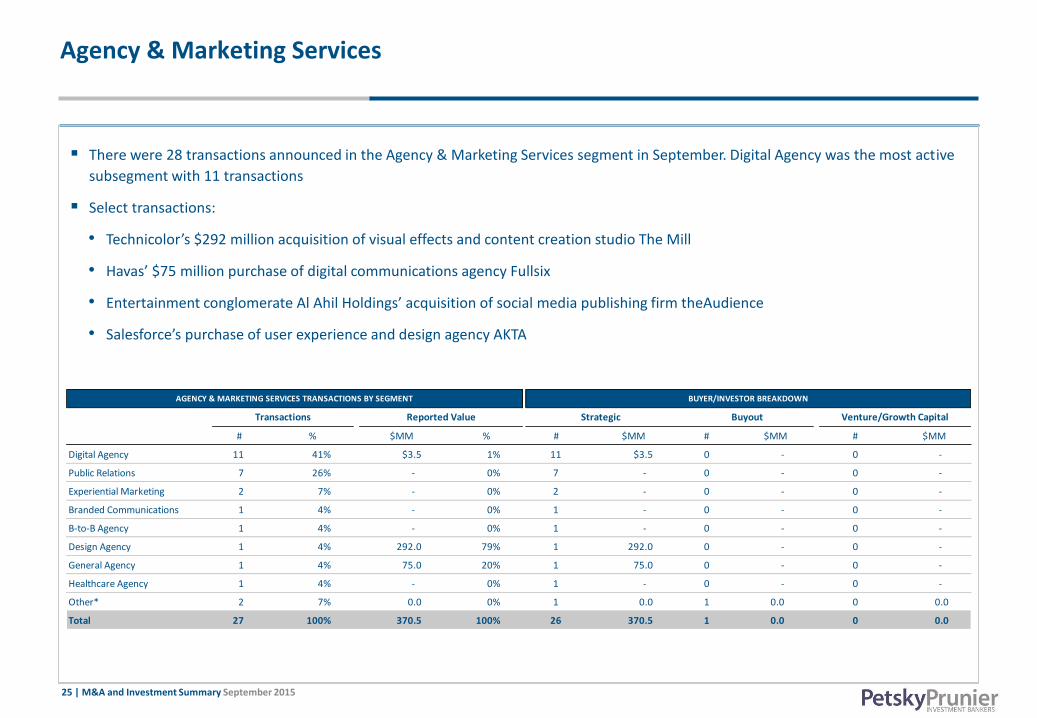
There were 28 transactions announced in the Agency & Marketing Services segment in September. Digital Agency was the most active
subsegment with 11 transactions
Select transactions:
• Technicolor’s $292 million acquisition of visual effects and content creation studio The Mill
• Havas’ $75 million purchase of digital communications agency Fullsix
• Entertainment conglomerate Al Ahil Holdings’ acquisition of social media publishing firm theAudience
• Salesforce’s purchase of user experience and design agency AKTA
# % $MM % # $MM # $MM # $MM
Digital Agency 11 41% $3.5 1% 11 $3.5 0 - 0 -
Public Relations 7 26% - 0% 7 - 0 - 0 -
Experiential Marketing 2 7% - 0% 2 - 0 - 0 -
Branded Communications 1 4% - 0% 1 - 0 - 0 -
B-to-B Agency 1 4% - 0% 1 - 0 - 0 -
Design Agency 1 4% 292.0 79% 1 292.0 0 - 0 -
General Agency 1 4% 75.0 20% 1 75.0 0 - 0 -
Healthcare Agency 1 4% - 0% 1 - 0 - 0 -
Other* 2 7% 0.0 0% 1 0.0 1 0.0 0 0.0
Total 27 100% 370.5 100% 26 370.5 1 0.0 0 0.0
AGENCY & MARKETING SERVICES TRANSACTIONS BY SEGMENT BUYER/INVESTOR BREAKDOWN
Transactions Reported Value Strategic Buyout Venture/Growth Capital
26 | M&A and Investment Summary September 2015
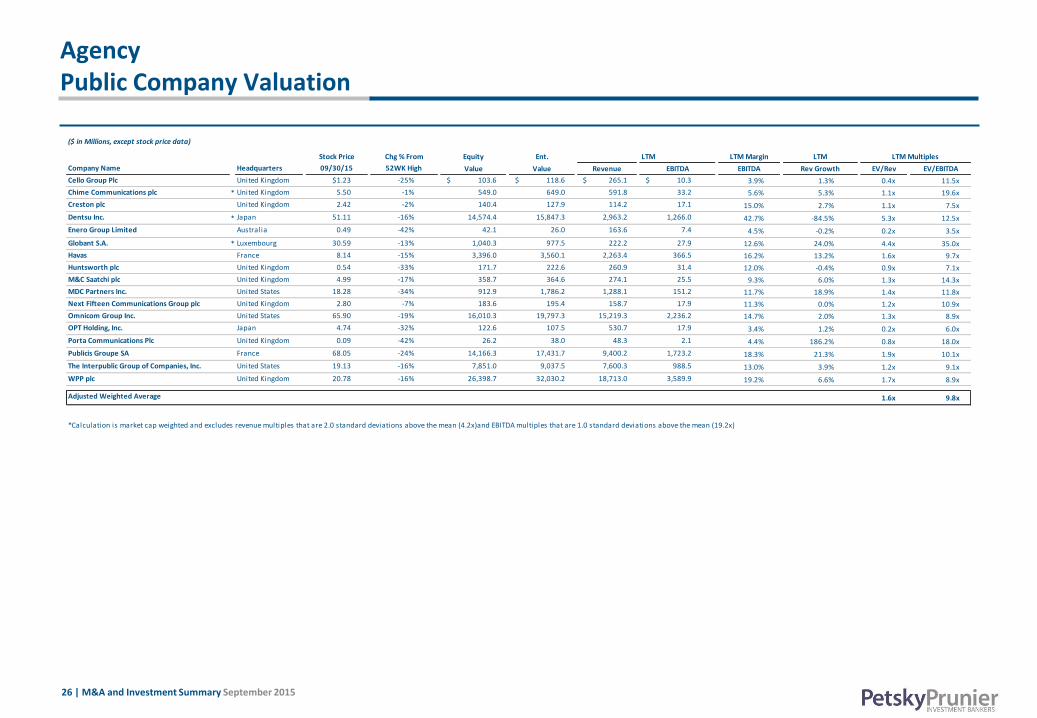
Agency Public Company Valuation
($ in Millions, except stock price data)
Stock Price Chg % From Equity Ent. LTM LTM Margin LTM LTM Multiples
Company Name Headquarters 09/30/15 52WK High Value Value Revenue EBITDA EBITDA Rev Growth EV/Rev EV/EBITDA
Cello Group Plc United Kingdom $1.23 -25% $ 103.6 $ 118.6 $ 265.1 $ 10.3 3.9% 1.3% 0.4x 11.5x
Chime Communications plc * United Kingdom 5.50 -1% 549.0 649.0 591.8 33.2 5.6% 5.3% 1.1x 19.6x
Creston plc United Kingdom 2.42 -2% 140.4 127.9 114.2 17.1 15.0% 2.7% 1.1x 7.5x
Dentsu Inc. * Japan 51.11 -16% 14,574.4 15,847.3 2,963.2 1,266.0 42.7% -84.5% 5.3x 12.5x
Enero Group Limited Australia 0.49 -42% 42.1 26.0 163.6 7.4 4.5% -0.2% 0.2x 3.5x
Globant S.A. * Luxembourg 30.59 -13% 1,040.3 977.5 222.2 27.9 12.6% 24.0% 4.4x 35.0x
Havas France 8.14 -15% 3,396.0 3,560.1 2,263.4 366.5 16.2% 13.2% 1.6x 9.7x
Huntsworth plc United Kingdom 0.54 -33% 171.7 222.6 260.9 31.4 12.0% -0.4% 0.9x 7.1x
M&C Saatchi plc United Kingdom 4.99 -17% 358.7 364.6 274.1 25.5 9.3% 6.0% 1.3x 14.3x
MDC Partners Inc. United States 18.28 -34% 912.9 1,786.2 1,288.1 151.2 11.7% 18.9% 1.4x 11.8x
Next Fifteen Communications Group plc United Kingdom 2.80 -7% 183.6 195.4 158.7 17.9 11.3% 0.0% 1.2x 10.9x
Omnicom Group Inc. United States 65.90 -19% 16,010.3 19,797.3 15,219.3 2,236.2 14.7% 2.0% 1.3x 8.9x
OPT Holding, Inc. Japan 4.74 -32% 122.6 107.5 530.7 17.9 3.4% 1.2% 0.2x 6.0x
Porta Communications Plc United Kingdom 0.09 -42% 26.2 38.0 48.3 2.1 4.4% 186.2% 0.8x 18.0x
Publicis Groupe SA France 68.05 -24% 14,166.3 17,431.7 9,400.2 1,723.2 18.3% 21.3% 1.9x 10.1x
The Interpublic Group of Companies, Inc. United States 19.13 -16% 7,851.0 9,037.5 7,600.3 988.5 13.0% 3.9% 1.2x 9.1x
WPP plc United Kingdom 20.78 -16% 26,398.7 32,030.2 18,713.0 3,589.9 19.2% 6.6% 1.7x 8.9x
1.6x 9.8xAdjusted Weighted Average
*Calculation is market cap weighted and excludes revenue multiples that are 2.0 standard deviations above the mean (4.2x)and EBITDA multiples that are 1.0 standard deviations above the mean (19.2x)

27 | M&A and Investment Summary September 2015
Marketing Services Public Company Valuation
($ in Millions, except stock price data)
Stock Price Chg % From Equity Ent. LTM LTM Margin LTM LTM Multiples
Company Name Headquarters 09/30/15 52WK High Value Value Revenue EBITDA EBITDA Rev Growth EV/Rev EV/EBITDA
Acxiom Corporation United States $19.76 -8% $ 1,540.1 $ 1,689.1 $ 1,030.3 $ 150.6 14.6% 3.9% 1.6x 11.2x
Aimia Inc. Canada 8.72 -35% 1,389.0 1,488.5 2,004.9 161.7 8.1% 6.4% 0.7x 9.2x
Alliance Data Systems Corporation * United States 258.98 -17% 15,910.0 25,609.2 5,906.7 1,610.6 27.3% 24.7% 4.3x 15.9x
CSG Systems International Inc. United States 30.80 -7% 1,007.0 1,098.1 747.0 121.9 16.3% -0.8% 1.5x 9.0x
Data Group Ltd. Canada 0.20 -70% 4.6 68.0 246.8 14.5 5.9% -1.0% 0.3x 4.7x
DST Systems Inc. United States 105.14 -22% 3,768.6 4,163.8 2,782.8 430.3 15.5% 3.7% 1.5x 9.7x
Fair Isaac Corporation * United States 84.50 -13% 2,631.2 3,194.8 827.6 184.6 22.3% 9.2% 3.9x 17.3x
Harte-Hanks Inc. United States 3.53 -57% 217.7 260.0 524.2 50.7 9.7% -6.4% 0.5x 5.1x
High Co. SA France 6.73 -8% 69.9 27.2 156.1 12.9 8.3% 5.0% 0.2x 2.1x
Insignia Systems Inc. United States 2.53 -43% 30.9 12.4 26.8 1.9 7.3% -0.7% 0.5x 6.4x
Multiplus SA Brazil 8.05 -24% 1,306.7 996.9 661.2 141.3 21.4% 18.4% 1.5x 7.1x
PDI, Inc. United States 1.79 -35% 29.9 42.6 131.8 (14.9) NM 2.0% 0.3x NM
Pitney Bowes Inc. United States 19.85 -23% 4,008.1 6,498.7 3,697.1 845.3 22.9% -3.4% 1.8x 7.7x
Points International Ltd. Canada 10.75 -23% 167.0 129.2 261.2 11.2 4.3% 3.6% 0.5x 11.5x
Viad Corp United States 28.99 -3% 582.1 662.6 1,104.4 94.8 8.6% 14.6% 0.6x 7.0x
1.4x 8.7xAdjusted Weighted Average
*Calculation is market cap weighted and excludes revenue multiples that are 2.0 standard deviations above the mean (3.8x)and EBITDA multiples that are 1.0 standard deviations above the mean (13.0x)

28 | M&A and Investment Summary September 2015
Traditional Media
There were 15 transactions announced in the Traditional Media segment in September, of which seven reported a total of $4.5 billion
in aggregate reported value; all but two transactions reported this month were acquisitions
Select Transactions:
• Gray Television’s acquisition of Schurz Communications’ radio and TV station assets for $443 million
• DTS’ acquisition of radio broadcasting and technology company iBiquity Digital from Columbia Partners Private Capital for
$172 million
• The purchase of digital film and television distributor Juice Worldwide by Vubiquity
• The sale of dmg events’ Digital Marketing division to Comexposium
# % $MM % # $MM # $MM # $MM
B-to-B Media 3 20% $2.5 0% 2 - 0 - 1 $2.5
Broadcast Television 2 13% 442.5 10% 2 442.5 0 - 0 -
Consumer Book Publishing 2 13% - 0% 2 - 0 - 0 -
Consumer Magazine Publishing 2 13% 747.0 17% 2 747.0 0 - 0 -
Entertainment 2 13% 15.5 0% 2 15.5 0 - 0 -
Newspaper Publishing 2 13% 3,077.0 69% 2 3,077.0 0 - 0 -
Other* 2 13% 172.0 8% 1 172.0 0 0.0 1 0.0
Total 15 100% 4,456.5 100% 13 4,454.0 0 0.0 2 2.5
TRADTIONAL MEDIA TRANSACTIONS BY SEGMENT BUYER/INVESTOR BREAKDOWN
Transactions Reported Value Strategic Buyout Venture/Growth Capital

29 | M&A and Investment Summary September 2015
Traditional Media Public Company Valuation (1/3)
($ in Millions, except stock price data)
Stock Price Chg % From Equity Ent. LTM LTM Margin LTM LTM Multiples
Company Name Headquarters 09/30/15 52WK High Value Value Revenue EBITDA EBITDA Rev Growth EV/Rev EV/EBITDA
CBS Corporation United States $39.90 -38% $ 19,241.2 $ 27,021.2 $ 13,767.0 $ 3,069.0 22.3% 1.0% 2.0x 8.8x
Discovery Communications, Inc. United States 26.03 -31% 16,443.4 24,019.4 6,435.0 2,505.0 38.9% 8.5% 3.7x 9.6x
Time Warner Inc. United States 68.75 -25% 56,071.2 76,743.2 28,243.0 7,865.0 27.8% 3.7% 2.7x 9.8x
Twenty-First Century Fox, Inc. United States 26.98 -31% 53,563.1 65,761.1 28,987.0 6,372.0 22.0% -9.0% 2.3x 10.3x
Viacom, Inc. United States 43.15 -45% 17,220.7 30,156.7 13,471.0 4,270.0 31.7% 0.2% 2.2x 7.1x
The Walt Disney Company * United States 102.20 -16% 172,499.1 187,285.1 51,342.0 14,813.0 28.9% 7.0% 3.6x 12.6x
Adjusted Weighted Average 3.1x 9.5x
($ in Millions, except stock price data)
B-to-B Media
Stock Price Chg % From Equity Ent. LTM LTM Margin LTM LTM Multiples
Company Name Headquarters 09/30/15 52WK High Value Value Revenue EBITDA EBITDA Rev Growth EV/Rev EV/EBITDA
Euromoney Institutional Investor PLC United Kingdom $14.38 -26% $ 1,817.7 $ 1,843.3 $ 606.8 $ 190.1 31.3% -1.1% 3.0x 9.7x
Global Sources Ltd. Bermuda 8.31 -3% 251.2 163.7 189.7 38.9 20.5% 1.9% 0.9x 4.2x
Informa plc United Kingdom 8.50 -8% 5,507.5 6,890.3 1,865.4 573.5 30.7% 4.5% 3.7x 12.0x
TechTarget, Inc. * United States 8.52 -33% 275.0 253.7 110.5 15.4 13.9% 16.3% 2.3x 16.5x
UBM plc United Kingdom 7.35 -18% 3,251.4 4,089.0 1,323.0 306.7 23.2% 10.2% 3.1x 13.3x
Adjusted Weighted Average 3.3x 11.8x
($ in Millions, except stock price data)
Radio Broadcasting
Stock Price Chg % From Equity Ent. LTM LTM Margin LTM LTM Multiples
Company Name Headquarters 09/30/15 52WK High Value Value Revenue EBITDA EBITDA Rev Growth EV/Rev EV/EBITDA
Beasley Broadcast Group Inc. United States $4.09 -32% $ 95.0 $ 176.6 $ 82.9 $ 15.6 18.8% 48.4% 2.1x 11.3x
Cumulus Media Inc. United States 0.70 -84% 164.5 2,619.0 1,213.5 243.6 20.1% 4.8% 2.2x 10.8x
Emmis Communications Corp. United States 1.24 -45% 55.0 358.5 236.7 39.5 16.7% 10.4% 1.5x 9.1x
Entercom Communications Corp. United States 10.16 -24% 386.8 821.8 380.4 91.6 24.1% 1.0% 2.2x 9.0x
Pandora Media, Inc. United States 21.34 -15% 4,530.1 4,157.6 1,023.9 (37.4) NM 28.0% 4.1x NM
Radio One Inc. United States 2.13 -50% 102.9 1,078.0 447.5 122.1 27.3% -0.4% 2.4x 8.8x
Salem Media Group, Inc. United States 6.12 -44% 155.8 434.4 264.7 47.2 17.8% 5.0% 1.6x 9.2x
Sirius XM Holdings Inc. * United States 3.74 -7% 20,084.9 24,907.3 4,352.2 1,384.0 31.8% 9.0% 5.7x 18.0x
Spanish Broadcasting System Inc. United States 5.07 -31% 36.8 433.8 142.9 39.9 27.9% -6.2% 3.0x 10.9x
Townsquare Media, Inc. United States 9.77 -32% 174.5 719.5 387.1 92.5 23.9% 18.0% 1.9x 7.8x
Adjusted Weighted Average 3.7x 9.3x
Large Cap Diversified Media
*Calculation is market cap weighted and excludes revenue multiples that are 2.0 standard deviations above the mean (4.3x)and EBITDA multiples that are 1.0 standard deviations above the mean (11.5x)
*Calculation is market cap weighted and excludes revenue multiples that are 2.0 standard deviations above the mean (4.8x)and EBITDA multiples that are 1.0 standard deviations above the mean (15.7x)
30 | M&A and Investment Summary September 2015
Traditional Media Public Company Valuation (2/3)
($ in Millions, except stock price data)
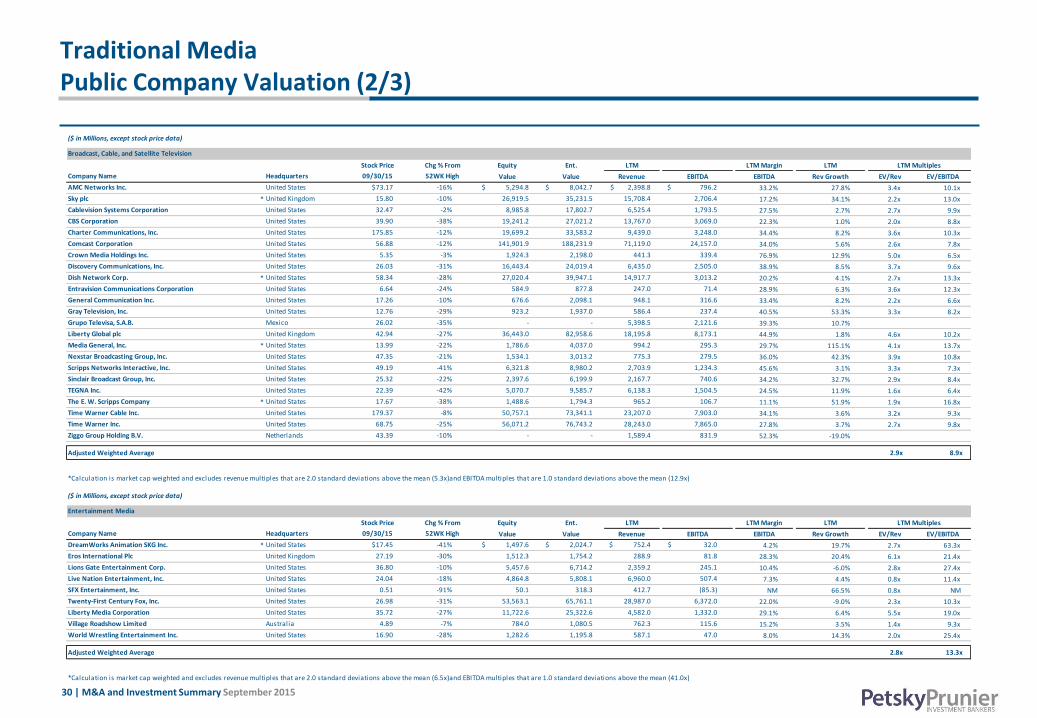
Broadcast, Cable, and Satellite Television
Stock Price Chg % From Equity Ent. LTM LTM Margin LTM
Company Name Headquarters 09/30/15 52WK High Value Value Revenue EBITDA EBITDA Rev Growth EV/Rev EV/EBITDA
AMC Networks Inc. United States $73.17 -16% $ 5,294.8 $ 8,042.7 $ 2,398.8 $ 796.2 33.2% 27.8% 3.4x 10.1x
Sky plc * United Kingdom 15.80 -10% 26,919.5 35,231.5 15,708.4 2,706.4 17.2% 34.1% 2.2x 13.0x
Cablevision Systems Corporation United States 32.47 -2% 8,985.8 17,802.7 6,525.4 1,793.5 27.5% 2.7% 2.7x 9.9x
CBS Corporation United States 39.90 -38% 19,241.2 27,021.2 13,767.0 3,069.0 22.3% 1.0% 2.0x 8.8x
Charter Communications, Inc. United States 175.85 -12% 19,699.2 33,583.2 9,439.0 3,248.0 34.4% 8.2% 3.6x 10.3x
Comcast Corporation United States 56.88 -12% 141,901.9 188,231.9 71,119.0 24,157.0 34.0% 5.6% 2.6x 7.8x
Crown Media Holdings Inc. United States 5.35 -3% 1,924.3 2,198.0 441.3 339.4 76.9% 12.9% 5.0x 6.5x
Discovery Communications, Inc. United States 26.03 -31% 16,443.4 24,019.4 6,435.0 2,505.0 38.9% 8.5% 3.7x 9.6x
Dish Network Corp. * United States 58.34 -28% 27,020.4 39,947.1 14,917.7 3,013.2 20.2% 4.1% 2.7x 13.3x
Entravision Communications Corporation United States 6.64 -24% 584.9 877.8 247.0 71.4 28.9% 6.3% 3.6x 12.3x
General Communication Inc. United States 17.26 -10% 676.6 2,098.1 948.1 316.6 33.4% 8.2% 2.2x 6.6x
Gray Television, Inc. United States 12.76 -29% 923.2 1,937.0 586.4 237.4 40.5% 53.3% 3.3x 8.2x
Grupo Televisa, S.A.B. Mexico 26.02 -35% - - 5,398.5 2,121.6 39.3% 10.7%
Liberty Global plc United Kingdom 42.94 -27% 36,443.0 82,958.6 18,195.8 8,173.1 44.9% 1.8% 4.6x 10.2x
Media General, Inc. * United States 13.99 -22% 1,786.6 4,037.0 994.2 295.3 29.7% 115.1% 4.1x 13.7x
Nexstar Broadcasting Group, Inc. United States 47.35 -21% 1,534.1 3,013.2 775.3 279.5 36.0% 42.3% 3.9x 10.8x
Scripps Networks Interactive, Inc. United States 49.19 -41% 6,321.8 8,980.2 2,703.9 1,234.3 45.6% 3.1% 3.3x 7.3x
Sinclair Broadcast Group, Inc. United States 25.32 -22% 2,397.6 6,199.9 2,167.7 740.6 34.2% 32.7% 2.9x 8.4x
TEGNA Inc. United States 22.39 -42% 5,070.7 9,585.7 6,138.3 1,504.5 24.5% 11.9% 1.6x 6.4x
The E. W. Scripps Company * United States 17.67 -38% 1,488.6 1,794.3 965.2 106.7 11.1% 51.9% 1.9x 16.8x
Time Warner Cable Inc. United States 179.37 -8% 50,757.1 73,341.1 23,207.0 7,903.0 34.1% 3.6% 3.2x 9.3x
Time Warner Inc. United States 68.75 -25% 56,071.2 76,743.2 28,243.0 7,865.0 27.8% 3.7% 2.7x 9.8x
Ziggo Group Holding B.V. Netherlands 43.39 -10% - - 1,589.4 831.9 52.3% -19.0%
Adjusted Weighted Average 2.9x 8.9x
($ in Millions, except stock price data)
Entertainment Media
Stock Price Chg % From Equity Ent. LTM LTM Margin LTM
Company Name Headquarters 09/30/15 52WK High Value Value Revenue EBITDA EBITDA Rev Growth EV/Rev EV/EBITDA
DreamWorks Animation SKG Inc. * United States $17.45 -41% $ 1,497.6 $ 2,024.7 $ 752.4 $ 32.0 4.2% 19.7% 2.7x 63.3x
Eros International Plc United Kingdom 27.19 -30% 1,512.3 1,754.2 288.9 81.8 28.3% 20.4% 6.1x 21.4x
Lions Gate Entertainment Corp. United States 36.80 -10% 5,457.6 6,714.2 2,359.2 245.1 10.4% -6.0% 2.8x 27.4x
Live Nation Entertainment, Inc. United States 24.04 -18% 4,864.8 5,808.1 6,960.0 507.4 7.3% 4.4% 0.8x 11.4x
SFX Entertainment, Inc. United States 0.51 -91% 50.1 318.3 412.7 (85.3) NM 66.5% 0.8x NM
Twenty-First Century Fox, Inc. United States 26.98 -31% 53,563.1 65,761.1 28,987.0 6,372.0 22.0% -9.0% 2.3x 10.3x
Liberty Media Corporation United States 35.72 -27% 11,722.6 25,322.6 4,582.0 1,332.0 29.1% 6.4% 5.5x 19.0x
Village Roadshow Limited Australia 4.89 -7% 784.0 1,080.5 762.3 115.6 15.2% 3.5% 1.4x 9.3x
World Wrestling Entertainment Inc. United States 16.90 -28% 1,282.6 1,195.8 587.1 47.0 8.0% 14.3% 2.0x 25.4x
Adjusted Weighted Average 2.8x 13.3x
LTM Multiples
LTM Multiples
*Calculation is market cap weighted and excludes revenue multiples that are 2.0 standard deviations above the mean (6.5x)and EBITDA multiples that are 1.0 standard deviations above the mean (41.0x)
*Calculation is market cap weighted and excludes revenue multiples that are 2.0 standard deviations above the mean (5.3x)and EBITDA multiples that are 1.0 standard deviations above the mean (12.9x)
31 | M&A and Investment Summary September 2015
Traditional Media Public Company Valuation (3/3)
($ in Millions, except stock price data)
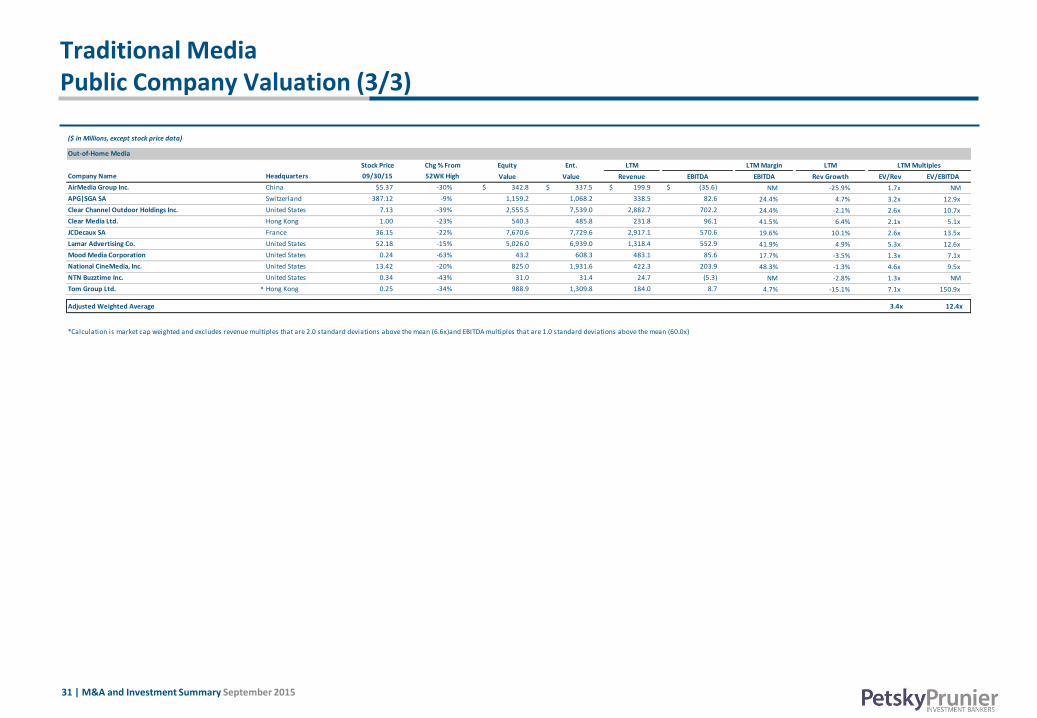
Out-of-Home Media
Stock Price Chg % From Equity Ent. LTM LTM Margin LTM LTM Multiples
Company Name Headquarters 09/30/15 52WK High Value Value Revenue EBITDA EBITDA Rev Growth EV/Rev EV/EBITDA
AirMedia Group Inc. China $5.37 -30% $ 342.8 $ 337.5 $ 199.9 $ (35.6) NM -25.9% 1.7x NM
APG|SGA SA Switzerland 387.12 -9% 1,159.2 1,068.2 338.5 82.6 24.4% 4.7% 3.2x 12.9x
Clear Channel Outdoor Holdings Inc. United States 7.13 -39% 2,555.5 7,539.0 2,882.7 702.2 24.4% -2.1% 2.6x 10.7x
Clear Media Ltd. Hong Kong 1.00 -23% 540.3 485.8 231.8 96.1 41.5% 6.4% 2.1x 5.1x
JCDecaux SA France 36.15 -22% 7,670.6 7,729.6 2,917.1 570.6 19.6% 10.1% 2.6x 13.5x
Lamar Advertising Co. United States 52.18 -15% 5,026.0 6,939.0 1,318.4 552.9 41.9% 4.9% 5.3x 12.6x
Mood Media Corporation United States 0.24 -63% 43.2 608.3 483.1 85.6 17.7% -3.5% 1.3x 7.1x
National CineMedia, Inc. United States 13.42 -20% 825.0 1,931.6 422.3 203.9 48.3% -1.3% 4.6x 9.5x
NTN Buzztime Inc. United States 0.34 -43% 31.0 31.4 24.7 (5.3) NM -2.8% 1.3x NM
Tom Group Ltd. * Hong Kong 0.25 -34% 988.9 1,309.8 184.0 8.7 4.7% -15.1% 7.1x 150.9x
Adjusted Weighted Average 3.4x 12.4x
*Calculation is market cap weighted and excludes revenue multiples that are 2.0 standard deviations above the mean (6.6x)and EBITDA multiples that are 1.0 standard deviations above the mean (60.0x)
32 | M&A and Investment Summary September 2015
Software
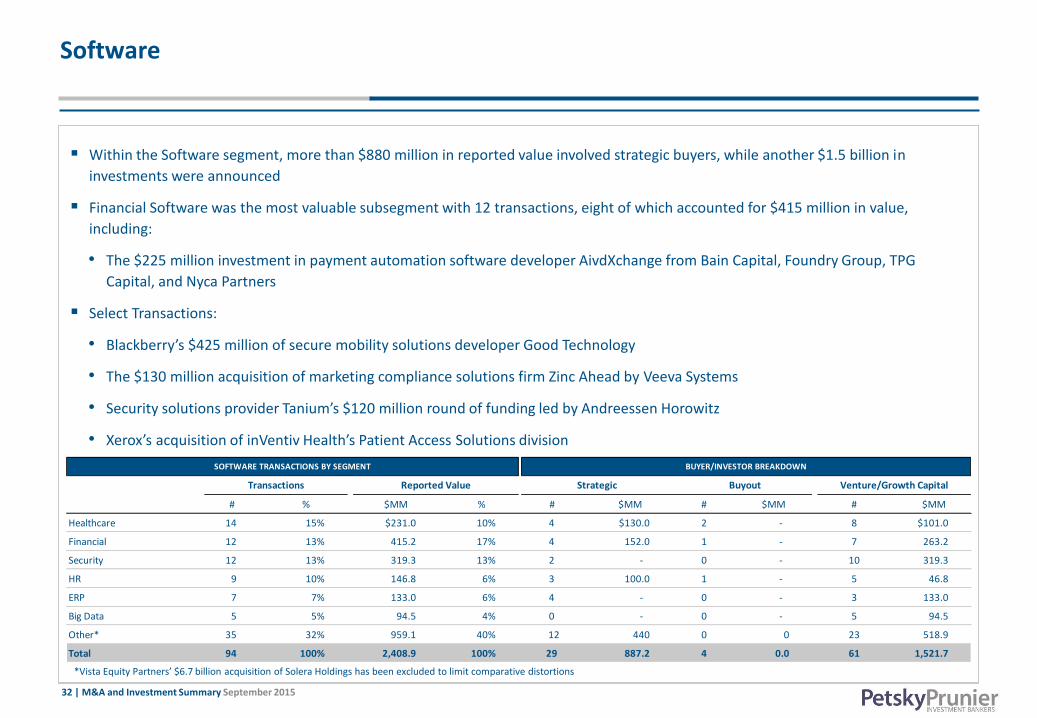
Within the Software segment, more than $880 million in reported value involved strategic buyers, while another $1.5 billion in
investments were announced
Financial Software was the most valuable subsegment with 12 transactions, eight of which accounted for $415 million in value,
including:
• The $225 million investment in payment automation software developer AivdXchange from Bain Capital, Foundry Group, TPG
Capital, and Nyca Partners
Select Transactions:
• Blackberry’s $425 million of secure mobility solutions developer Good Technology
• The $130 million acquisition of marketing compliance solutions firm Zinc Ahead by Veeva Systems
• Security solutions provider Tanium’s $120 million round of funding led by Andreessen Horowitz
• Xerox’s acquisition of inVentiv Health’s Patient Access Solutions division
*Vista Equity Partners’ $6.7 billion acquisition of Solera Holdings has been excluded to limit comparative distortions
# % $MM % # $MM # $MM # $MM
Healthcare 14 15% $231.0 10% 4 $130.0 2 - 8 $101.0
Financial 12 13% 415.2 17% 4 152.0 1 - 7 263.2
Security 12 13% 319.3 13% 2 - 0 - 10 319.3
HR 9 10% 146.8 6% 3 100.0 1 - 5 46.8
ERP 7 7% 133.0 6% 4 - 0 - 3 133.0
Big Data 5 5% 94.5 4% 0 - 0 - 5 94.5
Other* 35 32% 959.1 40% 12 440 0 0 23 518.9
Total 94 100% 2,408.9 100% 29 887.2 4 0.0 61 1,521.7
SOFTWARE TRANSACTIONS BY SEGMENT BUYER/INVESTOR BREAKDOWN
Transactions Reported Value Strategic Buyout Venture/Growth Capital
33 | M&A and Investment Summary September 2015
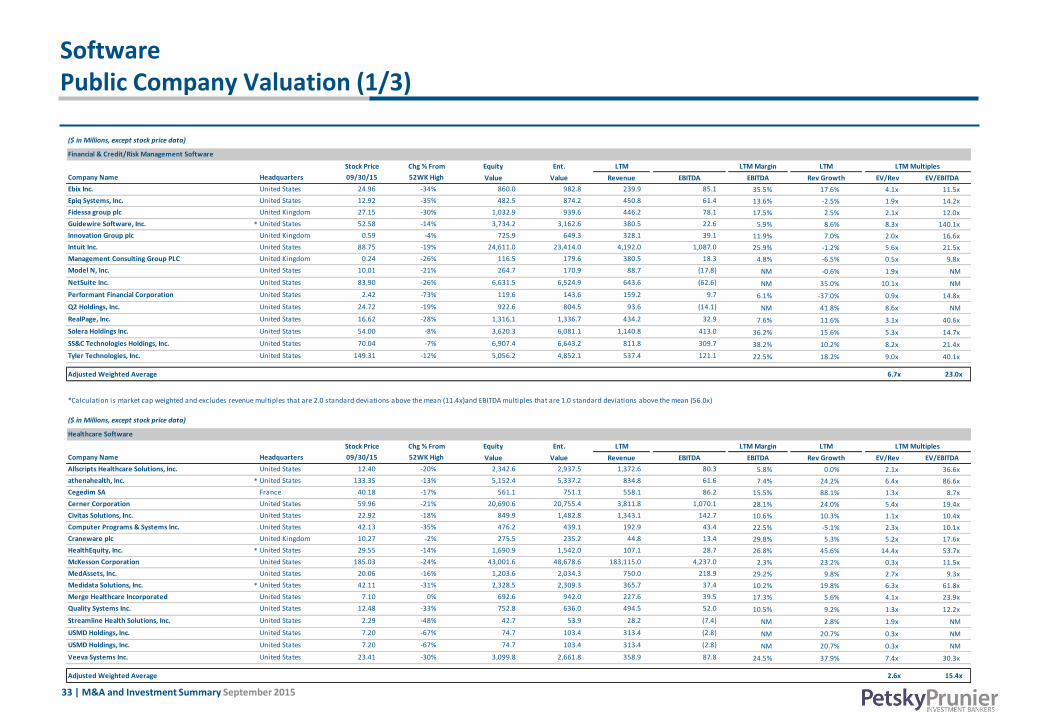
Software Public Company Valuation (1/3)
($ in Millions, except stock price data)
Stock Price Chg % From Equity Ent. LTM LTM Margin LTM LTM Multiples
Company Name Headquarters 09/30/15 52WK High Value Value Revenue EBITDA EBITDA Rev Growth EV/Rev EV/EBITDA
Ebix Inc. United States 24.96 -34% 860.0 982.8 239.9 85.1 35.5% 17.6% 4.1x 11.5x
Epiq Systems, Inc. United States 12.92 -35% 482.5 874.2 450.8 61.4 13.6% -2.5% 1.9x 14.2x
Fidessa group plc United Kingdom 27.15 -30% 1,032.9 939.6 446.2 78.1 17.5% 2.5% 2.1x 12.0x
Guidewire Software, Inc. * United States 52.58 -14% 3,734.2 3,162.6 380.5 22.6 5.9% 8.6% 8.3x 140.1x
Innovation Group plc United Kingdom 0.59 -4% 725.9 649.3 328.1 39.1 11.9% 7.0% 2.0x 16.6x
Intuit Inc. United States 88.75 -19% 24,611.0 23,414.0 4,192.0 1,087.0 25.9% -1.2% 5.6x 21.5x
Management Consulting Group PLC United Kingdom 0.24 -26% 116.5 179.6 380.5 18.3 4.8% -6.5% 0.5x 9.8x
Model N, Inc. United States 10.01 -21% 264.7 170.9 88.7 (17.8) NM -0.6% 1.9x NM
NetSuite Inc. United States 83.90 -26% 6,631.5 6,524.9 643.6 (62.6) NM 35.0% 10.1x NM
Performant Financial Corporation United States 2.42 -73% 119.6 143.6 159.2 9.7 6.1% -37.0% 0.9x 14.8x
Q2 Holdings, Inc. United States 24.72 -19% 922.6 804.5 93.6 (14.1) NM 41.8% 8.6x NM
RealPage, Inc. United States 16.62 -28% 1,316.1 1,336.7 434.2 32.9 7.6% 11.6% 3.1x 40.6x
Solera Holdings Inc. United States 54.00 -8% 3,620.3 6,081.1 1,140.8 413.0 36.2% 15.6% 5.3x 14.7x
SS&C Technologies Holdings, Inc. United States 70.04 -7% 6,907.4 6,643.2 811.8 309.7 38.2% 10.2% 8.2x 21.4x
Tyler Technologies, Inc. United States 149.31 -12% 5,056.2 4,852.1 537.4 121.1 22.5% 18.2% 9.0x 40.1x
Adjusted Weighted Average 6.7x 23.0x
($ in Millions, except stock price data)
Healthcare Software
Stock Price Chg % From Equity Ent. LTM LTM Margin LTM LTM Multiples
Company Name Headquarters 09/30/15 52WK High Value Value Revenue EBITDA EBITDA Rev Growth EV/Rev EV/EBITDA
Allscripts Healthcare Solutions, Inc. United States 12.40 -20% 2,342.6 2,937.5 1,372.6 80.3 5.8% 0.0% 2.1x 36.6x
athenahealth, Inc. * United States 133.35 -13% 5,152.4 5,337.2 834.8 61.6 7.4% 24.2% 6.4x 86.6x
Cegedim SA France 40.18 -17% 561.1 751.1 558.1 86.2 15.5% 88.1% 1.3x 8.7x
Cerner Corporation United States 59.96 -21% 20,690.6 20,755.4 3,811.8 1,070.1 28.1% 24.0% 5.4x 19.4x
Civitas Solutions, Inc. United States 22.92 -18% 849.9 1,482.8 1,343.1 142.7 10.6% 10.3% 1.1x 10.4x
Computer Programs & Systems Inc. United States 42.13 -35% 476.2 439.1 192.9 43.4 22.5% -5.1% 2.3x 10.1x
Craneware plc United Kingdom 10.27 -2% 275.5 235.2 44.8 13.4 29.8% 5.3% 5.2x 17.6x
HealthEquity, Inc. * United States 29.55 -14% 1,690.9 1,542.0 107.1 28.7 26.8% 45.6% 14.4x 53.7x
McKesson Corporation United States 185.03 -24% 43,001.6 48,678.6 183,115.0 4,237.0 2.3% 23.2% 0.3x 11.5x
MedAssets, Inc. United States 20.06 -16% 1,203.6 2,034.3 750.0 218.9 29.2% 9.8% 2.7x 9.3x
Medidata Solutions, Inc. * United States 42.11 -31% 2,328.5 2,309.3 365.7 37.4 10.2% 19.8% 6.3x 61.8x
Merge Healthcare Incorporated United States 7.10 0% 692.6 942.0 227.6 39.5 17.3% 5.6% 4.1x 23.9x
Quality Systems Inc. United States 12.48 -33% 752.8 636.0 494.5 52.0 10.5% 9.2% 1.3x 12.2x
Streamline Health Solutions, Inc. United States 2.29 -48% 42.7 53.9 28.2 (7.4) NM 2.8% 1.9x NM
USMD Holdings, Inc. United States 7.20 -67% 74.7 103.4 313.4 (2.8) NM 20.7% 0.3x NM
USMD Holdings, Inc. United States 7.20 -67% 74.7 103.4 313.4 (2.8) NM 20.7% 0.3x NM
Veeva Systems Inc. United States 23.41 -30% 3,099.8 2,661.8 358.9 87.8 24.5% 37.9% 7.4x 30.3x
Adjusted Weighted Average 2.6x 15.4x
*Calculation is market cap weighted and excludes revenue multiples that are 2.0 standard deviations above the mean (11.4x)and EBITDA multiples that are 1.0 standard deviations above the mean (56.0x)
Financial & Credit/Risk Management Software
34 | M&A and Investment Summary September 2015
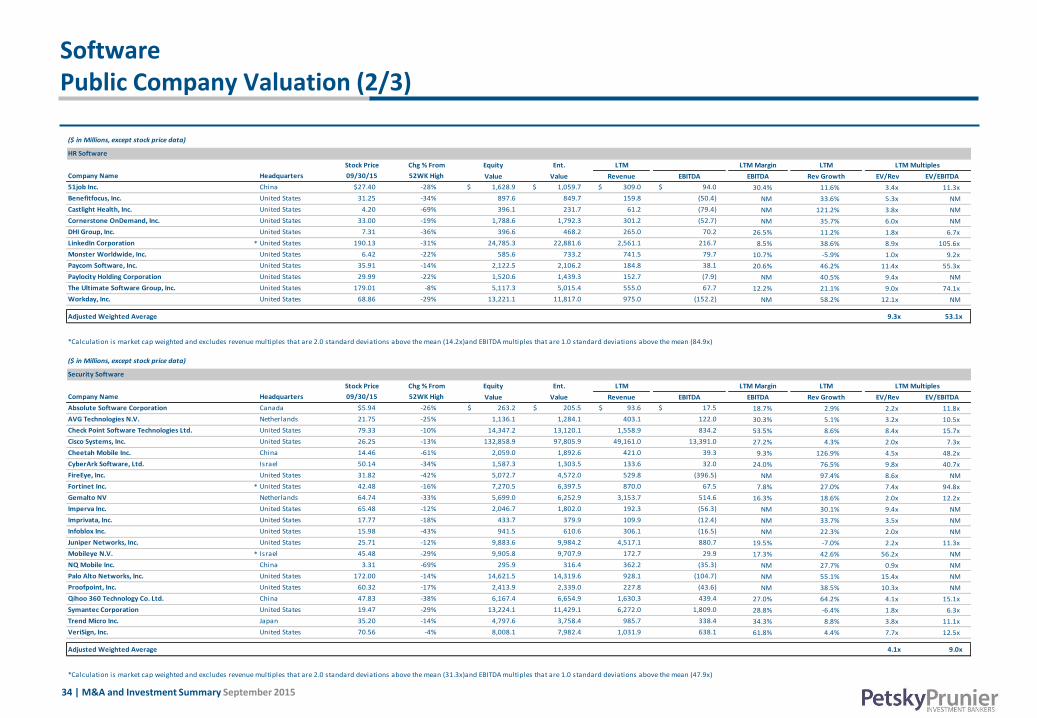
Software Public Company Valuation (2/3)
($ in Millions, except stock price data)
HR Software
Stock Price Chg % From Equity Ent. LTM LTM Margin LTM
Company Name Headquarters 09/30/15 52WK High Value Value Revenue EBITDA EBITDA Rev Growth EV/Rev EV/EBITDA
51job Inc. China $27.40 -28% $ 1,628.9 $ 1,059.7 $ 309.0 $ 94.0 30.4% 11.6% 3.4x 11.3x
Benefitfocus, Inc. United States 31.25 -34% 897.6 849.7 159.8 (50.4) NM 33.6% 5.3x NM
Castlight Health, Inc. United States 4.20 -69% 396.1 231.7 61.2 (79.4) NM 121.2% 3.8x NM
Cornerstone OnDemand, Inc. United States 33.00 -19% 1,788.6 1,792.3 301.2 (52.7) NM 35.7% 6.0x NM
DHI Group, Inc. United States 7.31 -36% 396.6 468.2 265.0 70.2 26.5% 11.2% 1.8x 6.7x
LinkedIn Corporation * United States 190.13 -31% 24,785.3 22,881.6 2,561.1 216.7 8.5% 38.6% 8.9x 105.6x
Monster Worldwide, Inc. United States 6.42 -22% 585.6 733.2 741.5 79.7 10.7% -5.9% 1.0x 9.2x
Paycom Software, Inc. United States 35.91 -14% 2,122.5 2,106.2 184.8 38.1 20.6% 46.2% 11.4x 55.3x
Paylocity Holding Corporation United States 29.99 -22% 1,520.6 1,439.3 152.7 (7.9) NM 40.5% 9.4x NM
The Ultimate Software Group, Inc. United States 179.01 -8% 5,117.3 5,015.4 555.0 67.7 12.2% 21.1% 9.0x 74.1x
Workday, Inc. United States 68.86 -29% 13,221.1 11,817.0 975.0 (152.2) NM 58.2% 12.1x NM
Adjusted Weighted Average 9.3x 53.1x
($ in Millions, except stock price data)
Security Software
Stock Price Chg % From Equity Ent. LTM LTM Margin LTM
Company Name Headquarters 09/30/15 52WK High Value Value Revenue EBITDA EBITDA Rev Growth EV/Rev EV/EBITDA
Absolute Software Corporation Canada $5.94 -26% $ 263.2 $ 205.5 $ 93.6 $ 17.5 18.7% 2.9% 2.2x 11.8x
AVG Technologies N.V. Netherlands 21.75 -25% 1,136.1 1,284.1 403.1 122.0 30.3% 5.1% 3.2x 10.5x
Check Point Software Technologies Ltd. United States 79.33 -10% 14,347.2 13,120.1 1,558.9 834.2 53.5% 8.6% 8.4x 15.7x
Cisco Systems, Inc. United States 26.25 -13% 132,858.9 97,805.9 49,161.0 13,391.0 27.2% 4.3% 2.0x 7.3x
Cheetah Mobile Inc. China 14.46 -61% 2,059.0 1,892.6 421.0 39.3 9.3% 126.9% 4.5x 48.2x
CyberArk Software, Ltd. Israel 50.14 -34% 1,587.3 1,303.5 133.6 32.0 24.0% 76.5% 9.8x 40.7x
FireEye, Inc. United States 31.82 -42% 5,072.7 4,572.0 529.8 (396.5) NM 97.4% 8.6x NM
Fortinet Inc. * United States 42.48 -16% 7,270.5 6,397.5 870.0 67.5 7.8% 27.0% 7.4x 94.8x
Gemalto NV Netherlands 64.74 -33% 5,699.0 6,252.9 3,153.7 514.6 16.3% 18.6% 2.0x 12.2x
Imperva Inc. United States 65.48 -12% 2,046.7 1,802.0 192.3 (56.3) NM 30.1% 9.4x NM
Imprivata, Inc. United States 17.77 -18% 433.7 379.9 109.9 (12.4) NM 33.7% 3.5x NM
Infoblox Inc. United States 15.98 -43% 941.5 610.6 306.1 (16.5) NM 22.3% 2.0x NM
Juniper Networks, Inc. United States 25.71 -12% 9,883.6 9,984.2 4,517.1 880.7 19.5% -7.0% 2.2x 11.3x
Mobileye N.V. * Israel 45.48 -29% 9,905.8 9,707.9 172.7 29.9 17.3% 42.6% 56.2x NM
NQ Mobile Inc. China 3.31 -69% 295.9 316.4 362.2 (35.3) NM 27.7% 0.9x NM
Palo Alto Networks, Inc. United States 172.00 -14% 14,621.5 14,319.6 928.1 (104.7) NM 55.1% 15.4x NM
Proofpoint, Inc. United States 60.32 -17% 2,413.9 2,339.0 227.8 (43.6) NM 38.5% 10.3x NM
Qihoo 360 Technology Co. Ltd. China 47.83 -38% 6,167.4 6,654.9 1,630.3 439.4 27.0% 64.2% 4.1x 15.1x
Symantec Corporation United States 19.47 -29% 13,224.1 11,429.1 6,272.0 1,809.0 28.8% -6.4% 1.8x 6.3x
Trend Micro Inc. Japan 35.20 -14% 4,797.6 3,758.4 985.7 338.4 34.3% 8.8% 3.8x 11.1x
VeriSign, Inc. United States 70.56 -4% 8,008.1 7,982.4 1,031.9 638.1 61.8% 4.4% 7.7x 12.5x
Adjusted Weighted Average 4.1x 9.0x
LTM Multiples
LTM Multiples
*Calculation is market cap weighted and excludes revenue multiples that are 2.0 standard deviations above the mean (14.2x)and EBITDA multiples that are 1.0 standard deviations above the mean (84.9x)
*Calculation is market cap weighted and excludes revenue multiples that are 2.0 standard deviations above the mean (31.3x)and EBITDA multiples that are 1.0 standard deviations above the mean (47.9x)
35 | M&A and Investment Summary September 2015
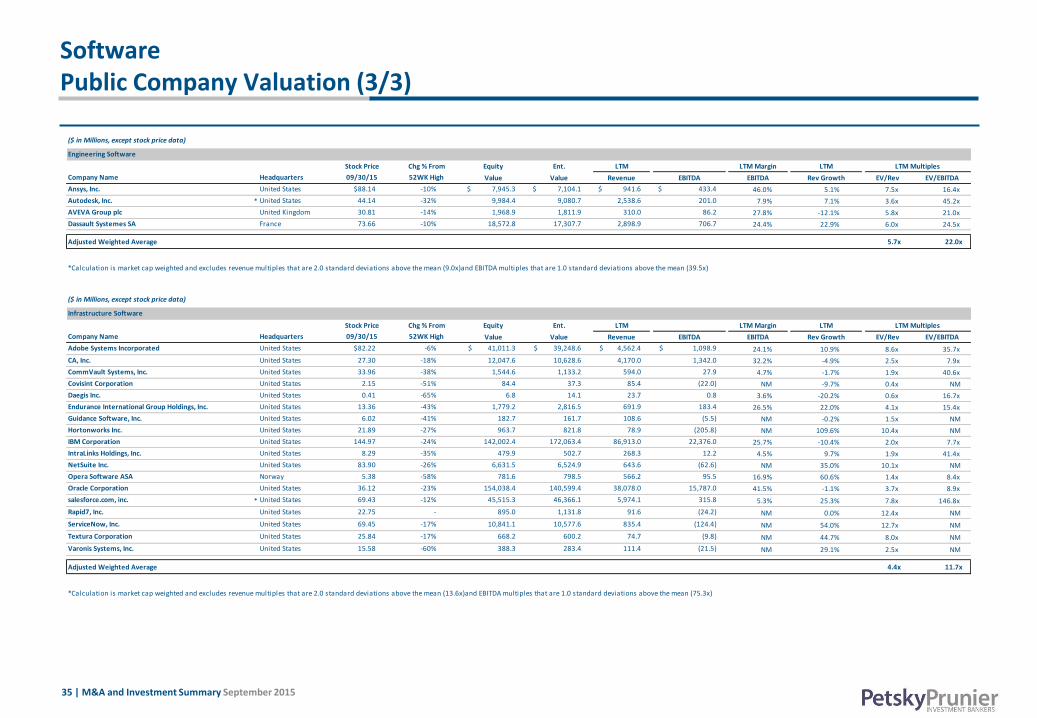
Software Public Company Valuation (3/3)
($ in Millions, except stock price data)
Engineering Software
Stock Price Chg % From Equity Ent. LTM LTM Margin LTM LTM Multiples
Company Name Headquarters 09/30/15 52WK High Value Value Revenue EBITDA EBITDA Rev Growth EV/Rev EV/EBITDA
Ansys, Inc. United States $88.14 -10% $ 7,945.3 $ 7,104.1 $ 941.6 $ 433.4 46.0% 5.1% 7.5x 16.4x
Autodesk, Inc. * United States 44.14 -32% 9,984.4 9,080.7 2,538.6 201.0 7.9% 7.1% 3.6x 45.2x
AVEVA Group plc United Kingdom 30.81 -14% 1,968.9 1,811.9 310.0 86.2 27.8% -12.1% 5.8x 21.0x
Dassault Systemes SA France 73.66 -10% 18,572.8 17,307.7 2,898.9 706.7 24.4% 22.9% 6.0x 24.5x
Adjusted Weighted Average 5.7x 22.0x
($ in Millions, except stock price data)
Infrastructure Software
Stock Price Chg % From Equity Ent. LTM LTM Margin LTM LTM Multiples
Company Name Headquarters 09/30/15 52WK High Value Value Revenue EBITDA EBITDA Rev Growth EV/Rev EV/EBITDA
Adobe Systems Incorporated United States $82.22 -6% $ 41,011.3 $ 39,248.6 $ 4,562.4 $ 1,098.9 24.1% 10.9% 8.6x 35.7x
CA, Inc. United States 27.30 -18% 12,047.6 10,628.6 4,170.0 1,342.0 32.2% -4.9% 2.5x 7.9x
CommVault Systems, Inc. United States 33.96 -38% 1,544.6 1,133.2 594.0 27.9 4.7% -1.7% 1.9x 40.6x
Covisint Corporation United States 2.15 -51% 84.4 37.3 85.4 (22.0) NM -9.7% 0.4x NM
Daegis Inc. United States 0.41 -65% 6.8 14.1 23.7 0.8 3.6% -20.2% 0.6x 16.7x
Endurance International Group Holdings, Inc. United States 13.36 -43% 1,779.2 2,816.5 691.9 183.4 26.5% 22.0% 4.1x 15.4x
Guidance Software, Inc. United States 6.02 -41% 182.7 161.7 108.6 (5.5) NM -0.2% 1.5x NM
Hortonworks Inc. United States 21.89 -27% 963.7 821.8 78.9 (205.8) NM 109.6% 10.4x NM
IBM Corporation United States 144.97 -24% 142,002.4 172,063.4 86,913.0 22,376.0 25.7% -10.4% 2.0x 7.7x
IntraLinks Holdings, Inc. United States 8.29 -35% 479.9 502.7 268.3 12.2 4.5% 9.7% 1.9x 41.4x
NetSuite Inc. United States 83.90 -26% 6,631.5 6,524.9 643.6 (62.6) NM 35.0% 10.1x NM
Opera Software ASA Norway 5.38 -58% 781.6 798.5 566.2 95.5 16.9% 60.6% 1.4x 8.4x
Oracle Corporation United States 36.12 -23% 154,038.4 140,599.4 38,078.0 15,787.0 41.5% -1.1% 3.7x 8.9x
salesforce.com, inc. * United States 69.43 -12% 45,515.3 46,366.1 5,974.1 315.8 5.3% 25.3% 7.8x 146.8x
Rapid7, Inc. United States 22.75 - 895.0 1,131.8 91.6 (24.2) NM 0.0% 12.4x NM
ServiceNow, Inc. United States 69.45 -17% 10,841.1 10,577.6 835.4 (124.4) NM 54.0% 12.7x NM
Textura Corporation United States 25.84 -17% 668.2 600.2 74.7 (9.8) NM 44.7% 8.0x NM
Varonis Systems, Inc. United States 15.58 -60% 388.3 283.4 111.4 (21.5) NM 29.1% 2.5x NM
Adjusted Weighted Average 4.4x 11.7x
*Calculation is market cap weighted and excludes revenue multiples that are 2.0 standard deviations above the mean (13.6x)and EBITDA multiples that are 1.0 standard deviations above the mean (75.3x)
*Calculation is market cap weighted and excludes revenue multiples that are 2.0 standard deviations above the mean (9.0x)and EBITDA multiples that are 1.0 standard deviations above the mean (39.5x)
36 | M&A and Investment Summary September 2015
Information
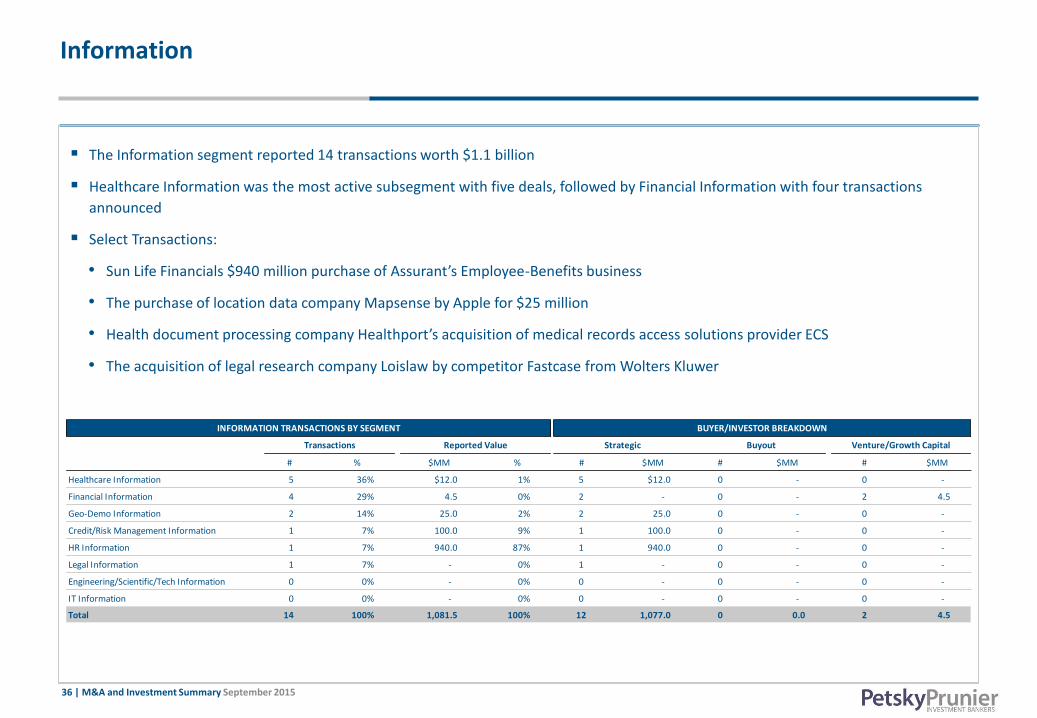
The Information segment reported 14 transactions worth $1.1 billion
Healthcare Information was the most active subsegment with five deals, followed by Financial Information with four transactions
announced
Select Transactions:
• Sun Life Financials $940 million purchase of Assurant’s Employee-Benefits business
• The purchase of location data company Mapsense by Apple for $25 million
• Health document processing company Healthport’s acquisition of medical records access solutions provider ECS
• The acquisition of legal research company Loislaw by competitor Fastcase from Wolters Kluwer
# % $MM % # $MM # $MM # $MM
Healthcare Information 5 36% $12.0 1% 5 $12.0 0 - 0 -
Financial Information 4 29% 4.5 0% 2 - 0 - 2 4.5
Geo-Demo Information 2 14% 25.0 2% 2 25.0 0 - 0 -
Credit/Risk Management Information 1 7% 100.0 9% 1 100.0 0 - 0 -
HR Information 1 7% 940.0 87% 1 940.0 0 - 0 -
Legal Information 1 7% - 0% 1 - 0 - 0 -
Engineering/Scientific/Tech Information 0 0% - 0% 0 - 0 - 0 -
IT Information 0 0% - 0% 0 - 0 - 0 -
Total 14 100% 1,081.5 100% 12 1,077.0 0 0.0 2 4.5
INFORMATION TRANSACTIONS BY SEGMENT BUYER/INVESTOR BREAKDOWN
Transactions Reported Value Strategic Buyout Venture/Growth Capital
37 | M&A and Investment Summary September 2015
Information Public Company Valuation (1/2)
($ in Millions, except stock price data)
Stock Price Chg % From Equity Ent. Cash & ST. Total LTM LTM Margin LTM LTM Multiples
Company Name Headquarters 09/30/15 52WK High Value Value Investments Debt Revenue EBITDA EBITDA Rev Growth EV/Rev EV/EBITDA
Broadridge Financial Solutions, Inc. United States $55.35 -7% $ 6,546.4 $ 6,911.6 $ 324.2 $ 689.4 $ 2,694.2 $ 576.9 21.4% 5.3% 2.6x 12.0x
Computershare Limited Australia 7.44 -22% 4,127.8 5,248.2 555.9 1,769.1 1,966.2 531.3 27.0% -2.2% 2.7x 9.9x
CoreLogic, Inc. United States 37.23 -12% 3,316.5 4,512.5 136.9 1,314.8 1,463.8 338.1 23.1% 6.3% 3.1x 13.3x
CoStar Group Inc. * United States 173.06 -23% 5,619.3 5,642.6 351.8 375.0 638.8 102.6 16.1% 29.1% 8.8x 55.0x
DST Systems Inc. United States 105.14 -22% 3,768.6 4,163.8 103.0 498.2 2,782.8 430.3 15.5% 3.7% 1.5x 9.7x
Dun & Bradstreet Corp. United States 105.00 -23% 3,791.7 5,450.9 137.8 1,786.6 1,685.2 436.1 25.9% 4.3% 3.2x 12.5x
Envestnet, Inc. United States 29.97 -49% 1,067.4 1,016.7 198.9 147.6 384.5 45.3 11.8% 25.0% 2.6x 22.4x
Equifax Inc. United States 97.18 -8% 11,491.0 12,926.7 84.2 1,480.9 2,567.9 893.3 34.8% 9.3% 5.0x 14.5x
Experian plc Ireland 16.01 -17% 15,327.9 18,669.8 155.0 3,421.0 4,810.0 1,549.0 32.2% -0.6% 3.9x 12.1x
FactSet Research Systems Inc. United States 159.81 -8% 6,600.2 6,452.7 182.9 35.0 1,006.8 363.3 36.1% 9.4% 6.4x 17.8x
Fair Isaac Corporation United States 84.50 -13% 2,631.2 3,194.8 84.4 648.0 827.6 184.6 22.3% 9.2% 3.9x 17.3x
Fidelity National Information Services, Inc. United States 67.08 -7% 18,888.6 23,576.3 446.4 5,043.3 6,436.0 1,610.5 25.0% 3.9% 3.7x 14.6x
Financial Engines, Inc. United States 29.47 -36% 1,525.4 1,208.3 317.2 - 299.4 61.3 20.5% 13.9% 4.0x 19.7x
McGraw Hill Financial, Inc. United States 86.50 -21% 23,571.3 24,207.3 1,720.0 1,494.0 5,168.0 2,102.0 40.7% 6.4% 4.7x 11.5x
Moody's Corporation United States 98.20 -14% 19,669.5 20,955.9 2,047.5 3,106.1 3,477.3 1,591.9 45.8% 11.3% 6.0x 13.2x
Morningstar Inc. United States 80.26 -8% 3,551.3 3,330.3 257.1 35.0 781.4 245.1 31.4% 7.8% 4.3x 13.6x
MSCI Inc. United States 59.46 -14% 6,449.1 6,794.0 455.0 800.0 1,036.1 432.2 41.7% 8.0% 6.6x 15.7x
Reis, Inc. United States 22.65 -18% 254.3 227.1 27.2 - 45.7 13.4 29.4% 20.0% 5.0x 16.9x
SEI Investments Co. United States 48.23 -13% 8,000.8 7,376.0 624.8 - 1,308.0 393.3 30.1% 8.9% 5.6x 18.8x
Thomson Reuters Corporation United States 40.04 -3% 31,105.3 38,612.5 1,299.0 8,870.0 12,400.0 2,677.0 21.6% -2.0% 3.1x 14.4x
Verisk Analytics, Inc. * United States 73.91 -8% 12,452.9 15,623.3 149.2 3,319.7 1,870.6 872.8 46.7% 12.6% 8.4x 17.9x
Workiva Inc. United States 15.19 -8% 617.2 554.9 86.4 24.2 127.2 (37.2) NM 27.8% 4.4x NM
Adjusted Weighted Average 4.3x 14.1x
($ in Millions, except stock price data)
Marketing Information
Stock Price Chg % From Equity Ent. Cash & ST. Total LTM LTM Margin LTM LTM Multiples
Company Name Headquarters 09/30/15 52WK High Value Value Investments Debt Revenue EBITDA EBITDA Rev Growth EV/Rev EV/EBITDA
Acxiom Corporation United States $19.76 -8% $ 1,540.1 $ 1,689.1 $ 123.2 $ 272.2 $ 1,030.3 $ 150.6 14.6% 3.9% 1.6x 11.2x
Alliance Data Systems Corporation United States 258.98 -17% 15,910.0 29,972.9 822.3 14,651.5 5,906.7 1,610.6 27.3% 24.7% 5.1x 18.6x
Brainjuicer Group Plc United Kingdom 5.47 -17% 69.6 61.6 8.3 - 39.4 6.9 17.5% 0.7% 1.6x 8.9x
Cello Group Plc United Kingdom 1.23 -25% 103.6 118.6 1.8 17.3 265.1 10.3 3.9% 1.3% 0.4x 11.5x
comScore, Inc. * United States 46.15 -29% 1,797.1 1,639.7 187.9 30.5 351.0 18.7 5.3% 15.1% 4.7x 87.7x
Cross Marketing Inc. Japan 3.42 -35% 61.6 75.7 13.1 25.9 80.0 7.3 9.1% 38.1% 0.9x 10.4x
Ebiquity plc United Kingdom 2.22 -7% 160.0 201.5 14.3 54.9 113.5 17.9 15.7% 7.9% 1.8x 11.3x
GfK SE Germany 34.93 -26% 1,275.1 1,760.9 106.3 528.9 1,673.3 230.7 13.8% 2.6% 1.1x 7.6x
Harte-Hanks Inc. United States 3.53 -57% 217.7 260.0 31.2 73.5 524.2 50.7 9.7% -6.4% 0.5x 5.1x
InnerWorkings Inc. United States 6.25 -34% 336.2 432.6 15.6 111.9 992.6 29.9 3.0% 1.6% 0.4x 14.5x
Intage Holdings Inc. Japan 14.24 -25% 284.2 229.9 60.9 6.3 360.4 42.8 11.9% 2.6% 0.6x 5.4x
Ipsos SA France 19.59 -36% 887.2 1,524.7 189.3 803.7 1,945.3 222.9 11.5% 6.0% 0.8x 6.8x
NeuStar, Inc. United States 27.21 -17% 1,480.3 1,855.7 412.0 787.4 1,004.4 392.6 39.1% 7.7% 1.8x 4.7x
Nielsen N.V. Netherlands 44.47 -10% 16,314.3 23,540.3 331.0 7,482.0 6,222.0 1,541.0 24.8% 2.3% 3.8x 15.3x
Onvia Inc. United States 4.02 -27% 29.8 21.5 8.4 0.0 23.2 (0.3) NM 4.4% 0.9x NM
Pearson plc United Kingdom 17.05 -26% 13,828.7 17,483.1 608.6 4,396.9 7,837.7 896.4 11.4% 1.2% 2.2x 19.5x
Rentrak Corporation * United States 54.07 -38% 830.4 752.0 79.0 - 108.1 2.3 2.1% 33.0% 7.0x NM
YouGov plc United Kingdom 1.75 -14% 179.8 174.2 5.8 0.3 106.6 9.0 8.4% 8.9% 1.6x 19.3x
Adjusted Weighted Average 3.5x 16.5x
Financial & Credit/Risk Management Information
*Calculation is market cap weighted and excludes revenue multiples that are 2.0 standard deviations above the mean (8.2x)and EBITDA multiples that are 1.0 standard deviations above the mean (26.1x)
*Calculation is market cap weighted and excludes revenue multiples that are 2.0 standard deviations above the mean (5.8x)and EBITDA multiples that are 1.0 standard deviations above the mean (35.8x)

38 | M&A and Investment Summary September 2015
Information Public Company Valuation (2/2)
($ in Millions, except stock price data)
Other Information
Stock Price Chg % From Equity Ent. Cash & ST. Total LTM LTM Margin LTM LTM Multiples
Company Name Headquarters 09/30/15 52WK High Value Value Investments Debt Revenue EBITDA EBITDA Rev Growth EV/Rev EV/EBITDA
Centaur Media plc United Kingdom $1.20 -9% $ 171.1 $ 193.1 $ 2.2 $ 25.0 $ 104.4 $ 10.5 10.1% 0.0% 1.8x 18.3x
CEB Inc. United States 68.34 -25% 2,291.0 2,660.1 124.1 493.3 922.7 213.7 23.2% 6.7% 2.9x 12.4x
Forrester Research Inc. United States 31.44 -25% 563.4 452.6 110.8 - 314.0 33.9 10.8% 3.5% 1.4x 13.3x
Gartner Inc. United States 83.93 -9% 6,969.7 7,327.2 357.6 715.0 2,074.0 332.3 16.0% 9.3% 3.5x 22.1x
IHS Inc. United States 116.00 -15% 7,908.7 9,730.2 225.9 2,129.1 2,307.9 584.1 25.3% 4.5% 4.2x 16.7x
Informa plc United Kingdom 8.50 -8% 5,507.5 6,890.3 59.0 1,492.7 1,865.4 573.5 30.7% 4.5% 3.7x 12.0x
National Research Corp. United States 33.00 -16% 365.3 331.8 40.6 7.0 99.5 29.8 29.9% 4.4% 3.3x 11.1x
Markit Ltd. United Kingdom 29.00 -3% 5,124.6 5,583.5 119.5 542.1 1,085.7 412.1 38.0% 7.9% 5.1x 13.5x
NIC Inc. United States 17.71 -13% 1,156.5 1,049.1 107.4 - 281.7 70.9 25.2% 8.9% 3.7x 14.8x
Premier, Inc. United States 34.37 -14% 1,298.3 929.0 387.2 17.9 1,007.0 329.4 32.7% 10.6% 0.9x 2.8x
Proofpoint, Inc. * United States 60.32 -17% 2,413.9 2,339.0 410.7 335.7 227.8 (43.6) NM 38.5% 10.3x NM
Reed Elsevier plc(1) United Kingdom 17.13 -6% 34,993.9 40,986.2 233.7 6,225.9 9,510.4 2,309.6 24.3% 4.5% 4.3x 17.7x
Solera Holdings Inc. United States 54.00 -8% 3,620.3 6,081.1 479.6 2,484.0 1,140.8 413.0 36.2% 15.6% 5.3x 14.7x
Tarsus Group plc Ireland 3.33 -7% 337.0 411.5 20.6 89.3 112.3 33.8 30.1% -2.2% 3.7x 12.2x
TechTarget, Inc. United States 8.52 -33% 275.0 253.7 21.3 - 110.5 15.4 13.9% 16.3% 2.3x 16.5x
The Advisory Board Company * United States 45.54 -25% 1,938.1 2,452.8 49.6 564.3 666.3 61.9 9.3% 0.0% 3.7x 39.6x
UBM plc United Kingdom 7.35 -18% 3,251.4 4,089.0 179.7 1,007.4 1,323.0 306.7 23.2% 10.2% 3.1x 13.3x
Wolters Kluwer NV Netherlands 30.70 -15% 8,958.7 11,274.4 568.1 2,861.6 4,409.9 1,099.4 24.9% 11.9% 2.6x 10.3x
*Calculation is market cap weighted and excludes revenue multiples that are 2.0 standard deviations above the mean (7.7x)and EBITDA multiples that are 1.0 standard deviations above the mean (22.9x)
(1) All financials are representative of the Reed Elsevier combined businesses, except per stock data, which represents Reed Elsevier (LSE:REL)
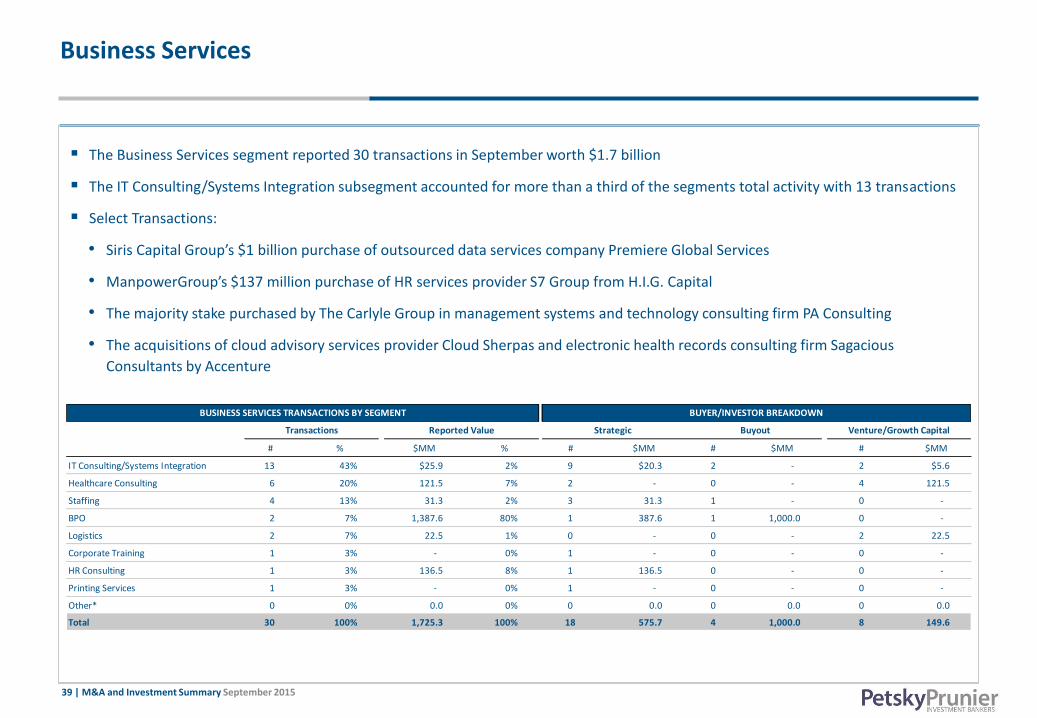
39 | M&A and Investment Summary September 2015
Business Services
The Business Services segment reported 30 transactions in September worth $1.7 billion
The IT Consulting/Systems Integration subsegment accounted for more than a third of the segments total activity with 13 transactions
Select Transactions:
• Siris Capital Group’s $1 billion purchase of outsourced data services company Premiere Global Services
• ManpowerGroup’s $137 million purchase of HR services provider S7 Group from H.I.G. Capital
• The majority stake purchased by The Carlyle Group in management systems and technology consulting firm PA Consulting
• The acquisitions of cloud advisory services provider Cloud Sherpas and electronic health records consulting firm Sagacious
Consultants by Accenture
# % $MM % # $MM # $MM # $MM
IT Consulting/Systems Integration 13 43% $25.9 2% 9 $20.3 2 - 2 $5.6
Healthcare Consulting 6 20% 121.5 7% 2 - 0 - 4 121.5
Staffing 4 13% 31.3 2% 3 31.3 1 - 0 -
BPO 2 7% 1,387.6 80% 1 387.6 1 1,000.0 0 -
Logistics 2 7% 22.5 1% 0 - 0 - 2 22.5
Corporate Training 1 3% - 0% 1 - 0 - 0 -
HR Consulting 1 3% 136.5 8% 1 136.5 0 - 0 -
Printing Services 1 3% - 0% 1 - 0 - 0 -
Other* 0 0% 0.0 0% 0 0.0 0 0.0 0 0.0
Total 30 100% 1,725.3 100% 18 575.7 4 1,000.0 8 149.6
BUSINESS SERVICES TRANSACTIONS BY SEGMENT BUYER/INVESTOR BREAKDOWN
Transactions Reported Value Strategic Buyout Venture/Growth Capital

40 | M&A and Investment Summary September 2015
Business Services Public Company Valuation (1/3)
($ in Millions, except stock price data)
Consulting
Stock Price Chg % From Equity Ent. Cash & ST. Total LTM LTM Margin LTM LTM Multiples
Company Name Headquarters 09/30/15 52WK High Value Value Investments Debt Revenue EBITDA EBITDA Rev Growth EV/Rev EV/EBITDA
CRA International Inc. United States 21.58 -34% 195.7 180.6 15.8 0.1 306.5 28.6 9.3% 0.7% 0.6x 6.3x
FTI Consulting, Inc. United States 41.51 -5% 1,736.8 2,207.8 240.0 711.0 1,757.8 208.1 11.8% 2.8% 1.3x 10.6x
Information Services Group, Inc. United States 3.91 -21% 145.9 185.6 13.1 52.0 210.4 18.8 8.9% 1.2% 0.9x 9.9x
Navigant Consulting Inc. United States 15.91 -4% 762.0 929.5 3.9 171.4 817.2 125.4 15.3% 12.6% 1.1x 7.4x
ICF International Inc. United States 30.39 -31% 588.7 941.2 7.4 360.0 1,103.7 105.2 9.5% 12.3% 0.9x 9.0x
Huron Consulting Group Inc. United States 62.53 -21% 1,371.0 1,822.4 16.8 468.2 802.7 136.9 17.1% -0.4% 2.3x 13.3x
The Hackett Group, Inc. * United States 13.75 -10% 409.2 411.2 16.2 18.3 223.4 26.2 11.7% 9.7% 1.8x 15.7x
Towers Watson & Co. United States 117.38 -17% 8,132.7 7,545.9 842.3 240.0 3,645.0 715.0 19.6% 4.7% 2.1x 10.6x
Adjusted Weighted Average 1.9x 10.6x
($ in Millions, except stock price data)
HR Services
Stock Price Chg % From Equity Ent. Cash & ST. Total LTM LTM Margin LTM LTM Multiples
Company Name Headquarters 09/30/15 52WK High Value Value Investments Debt Revenue EBITDA EBITDA Rev Growth EV/Rev EV/EBITDA
Automatic Data Processing, Inc. United States 80.36 -11% 37,389.4 35,732.7 1,665.9 9.2 10,938.5 2,281.2 20.9% 7.0% 3.3x 15.7x
Barrett Business Services Inc. United States 42.93 -14% 309.2 349.9 4.4 45.2 699.3 (43.3) NM 20.8% 0.5x NM
Capita plc United Kingdom 18.13 -11% 12,005.7 14,863.6 768.5 3,624.0 7,227.6 1,069.0 14.8% 10.8% 2.1x 13.9x
DHI Group, Inc. United States 7.31 -36% 396.6 468.2 32.7 104.3 265.0 70.2 26.5% 11.2% 1.8x 6.7x
Edenred SA France 16.29 -47% 3,759.6 4,762.9 913.4 1,902.5 1,126.1 363.1 32.2% 7.8% 4.2x 13.1x
Insperity, Inc. United States 43.93 -21% 1,088.2 898.8 189.4 - 2,483.5 92.2 3.7% 8.0% 0.4x 9.8x
LinkedIn Corporation * United States 190.13 -31% 24,785.3 22,881.6 3,033.4 1,104.0 2,561.1 216.7 8.5% 38.6% 8.9x 105.6x
Marsh & McLennan Companies, Inc. United States 52.22 -13% 27,676.2 30,771.2 930.0 3,936.0 12,827.0 2,746.0 21.4% 1.7% 2.4x 11.2x
Monster Worldwide, Inc. United States 6.42 -22% 585.6 733.2 107.7 209.0 741.5 79.7 10.7% -5.9% 1.0x 9.2x
Paychex, Inc. United States 47.63 -8% 17,172.5 16,634.8 536.6 - 2,795.8 1,189.3 42.5% 8.7% 5.9x 14.0x
Professional Diversity Network LLC United States 0.74 -87% 10.9 5.0 6.4 0.5 30.5 (6.0) NM 591.4% 0.2x NM
Towers Watson & Co. United States 117.38 -17% 8,132.7 7,545.9 842.3 240.0 3,645.0 715.0 19.6% 4.7% 2.1x 10.6x
TriNet Group, Inc. United States 16.80 -56% 1,185.4 1,566.8 128.4 509.8 2,425.2 148.6 6.1% 23.5% 0.6x 10.5x
WageWorks, Inc. United States 45.08 -31% 1,616.3 1,199.0 496.4 79.1 314.5 47.3 15.0% 36.8% 3.8x 25.3x
Adjusted Weighted Average 3.2x 13.6x
*Calculation is market cap weighted and excludes revenue multiples that are 2.0 standard deviations above the mean (2.7x)and EBITDA multiples that are 1.0 standard deviations above the mean (14.0x)
*Calculation is market cap weighted and excludes revenue multiples that are 2.0 standard deviations above the mean (7.6x)and EBITDA multiples that are 1.0 standard deviations above the mean (47.7x)

41 | M&A and Investment Summary September 2015
Business Services Public Company Valuation (2/3)
($ in Millions, except stock price data)
HR Services
Stock Price Chg % From Equity Ent. Cash & ST. Total LTM LTM Margin LTM LTM Multiples
Company Name Headquarters 09/30/15 52WK High Value Value Investments Debt Revenue EBITDA EBITDA Rev Growth EV/Rev EV/EBITDA
Automatic Data Processing, Inc. United States 80.36 -11% 37,389.4 35,732.7 1,665.9 9.2 10,938.5 2,281.2 20.9% 7.0% 3.3x 15.7x
Barrett Business Services Inc. United States 42.93 -14% 309.2 349.9 4.4 45.2 699.3 (43.3) NM 20.8% 0.5x NM
Capita plc United Kingdom 18.13 -11% 12,005.7 14,863.6 768.5 3,624.0 7,227.6 1,069.0 14.8% 10.8% 2.1x 13.9x
DHI Group, Inc. United States 7.31 -36% 396.6 468.2 32.7 104.3 265.0 70.2 26.5% 11.2% 1.8x 6.7x
Edenred SA France 16.29 -47% 3,759.6 4,762.9 913.4 1,902.5 1,126.1 363.1 32.2% 7.8% 4.2x 13.1x
Insperity, Inc. United States 43.93 -21% 1,088.2 898.8 189.4 - 2,483.5 92.2 3.7% 8.0% 0.4x 9.8x
LinkedIn Corporation * United States 190.13 -31% 24,785.3 22,881.6 3,033.4 1,104.0 2,561.1 216.7 8.5% 38.6% 8.9x 105.6x
Marsh & McLennan Companies, Inc. United States 52.22 -13% 27,676.2 30,771.2 930.0 3,936.0 12,827.0 2,746.0 21.4% 1.7% 2.4x 11.2x
Monster Worldwide, Inc. United States 6.42 -22% 585.6 733.2 107.7 209.0 741.5 79.7 10.7% -5.9% 1.0x 9.2x
Paychex, Inc. United States 47.63 -8% 17,172.5 16,634.8 536.6 - 2,795.8 1,189.3 42.5% 8.7% 5.9x 14.0x
Professional Diversity Network LLC United States 0.74 -87% 10.9 5.0 6.4 0.5 30.5 (6.0) NM 591.4% 0.2x NM
Towers Watson & Co. United States 117.38 -17% 8,132.7 7,545.9 842.3 240.0 3,645.0 715.0 19.6% 4.7% 2.1x 10.6x
TriNet Group, Inc. United States 16.80 -56% 1,185.4 1,566.8 128.4 509.8 2,425.2 148.6 6.1% 23.5% 0.6x 10.5x
WageWorks, Inc. United States 45.08 -31% 1,616.3 1,199.0 496.4 79.1 314.5 47.3 15.0% 36.8% 3.8x 25.3x
Adjusted Weighted Average 3.2x 13.6x
($ in Millions, except stock price data)
IT Consulting/Systems Integration
Stock Price Chg % From Equity Ent. Cash & ST. Total LTM LTM Margin LTM LTM Multiples
Company Name Headquarters 09/30/15 52WK High Value Value Investments Debt Revenue EBITDA EBITDA Rev Growth EV/Rev EV/EBITDA
Accenture plc Ireland 98.26 -7% $ 61,579.7 $ 57,757.7 $ 4,028.6 $ 27.2 $ 31,047.9 $ 5,146.2 16.6% 3.5% 1.9x 11.2x
Amdocs Limited Channel Islands 56.88 -7% 8,741.0 7,339.3 1,401.7 - 3,617.0 701.4 19.4% 3.1% 2.0x 10.5x
Bechtle AG Germany 89.88 -6% 1,887.6 1,821.7 132.9 81.8 3,005.9 150.5 5.0% 11.0% 0.6x 12.1x
Booz Allen Hamilton Holding Corporation United States 26.21 -16% 3,839.2 5,304.5 151.5 1,616.7 5,304.1 507.5 9.6% -1.3% 1.0x 10.5x
Broadridge Financial Solutions, Inc. United States 55.35 -7% 6,546.4 6,911.6 324.2 689.4 2,694.2 576.9 21.4% 5.3% 2.6x 12.0x
Business & Decision SA France 6.71 -26% 52.9 92.5 6.5 45.6 245.8 13.4 5.5% 11.3% 0.4x 6.9x
Cap Gemini S.A. France 88.86 -13% 15,312.7 13,794.9 6,394.9 4,864.4 12,338.6 1,344.5 10.9% 9.0% 1.1x 10.3x
CGI Group, Inc. Canada 36.09 -17% 11,110.7 12,481.5 212.1 1,683.8 8,163.3 1,404.3 17.2% -2.8% 1.5x 8.9x
Cognizant Technology Solutions Corporation United States 62.61 -10% 38,162.6 35,658.6 3,566.5 1,062.5 11,319.8 2,254.8 19.9% 17.9% 3.2x 15.8x
Computer Sciences Corporation United States 61.38 -16% 8,490.8 8,933.8 2,199.0 2,618.0 11,697.0 1,015.0 8.7% -9.9% 0.8x 8.8x
CSG Systems International Inc. United States 30.80 -7% 1,007.0 1,098.1 194.0 285.1 747.0 121.9 16.3% -0.8% 1.5x 9.0x
Digi International Inc. * United States 11.79 -2% 294.6 203.3 91.3 - 208.0 9.2 4.4% 8.1% 1.0x 22.1x
Globant S.A. * Luxembourg 30.59 -13% 1,040.3 977.5 63.7 0.9 222.2 27.9 12.6% 24.0% 4.4x 35.0x
International Business Machines Corporation United States 144.97 -24% 142,002.4 172,063.4 8,760.0 38,668.0 86,913.0 22,376.0 25.7% -10.4% 2.0x 7.7x
Infosys Ltd. * India 17.70 -3% - - 4,537.0 - 8,834.0 2,493.0 28.2% 5.3% NM NM
ITS Group France 6.60 -30% 50.5 56.3 13.1 19.1 210.9 8.6 4.1% 17.5% 0.3x 6.5x
NCI, Inc. United States 13.27 -21% 173.0 192.1 0.4 19.5 316.9 25.2 8.0% -2.4% 0.6x 7.6x
NTT Data Corporation Japan 50.19 -4% 14,079.5 15,876.9 1,735.2 3,229.5 12,547.0 1,984.7 15.8% 10.8% 1.3x 8.0x
Perficient Inc. United States 15.43 -28% 544.5 597.7 6.8 60.0 445.5 55.0 12.4% 13.9% 1.3x 10.9x
Tata Consultancy Services Limited * India 39.46 -9% - - 3,693.3 62.3 15,430.2 3,978.8 25.8% 14.3% NM NM
Wipro Ltd. India 9.11 -12% 22,356.7 19,401.6 4,358.5 1,285.0 7,550.6 1,652.3 21.9% 7.2% 2.6x 11.7x
Adjusted Weighted Average 2.0x 9.9x
*Calculation is market cap weighted and excludes revenue multiples that are 2.0 standard deviations above the mean (7.6x)and EBITDA multiples that are 1.0 standard deviations above the mean (47.7x)
*Calculation is market cap weighted and excludes revenue multiples that are 2.0 standard deviations above the mean (3.7x)and EBITDA multiples that are 1.0 standard deviations above the mean (18.5x)

42 | M&A and Investment Summary September 2015
Business Services Public Company Valuation (2/3)
($ in Millions, except stock price data)
Outsourced Services
Stock Price Chg % From Equity Ent. Cash & ST. Total LTM LTM Margin LTM LTM Multiples
Company Name Headquarters 09/30/15 52WK High Value Value Investments Debt Revenue EBITDA EBITDA Rev Growth EV/Rev EV/EBITDA
Luxoft Holding, Inc. * SwitzerlandSwitzerland 63.29 -8% $ 2,081.8 $ 2,022.6 $ 59.9 $ 0.8 $ 556.3 $ 101.8 18.3% 30.3% 3.6x 19.9x
MAXIMUS, Inc. United States 59.56 -15% 3,928.1 4,015.4 81.9 166.8 1,956.5 301.0 15.4% 18.6% 2.1x 13.3x
Quad/Graphics, Inc. United States 12.10 -50% 600.3 2,074.9 13.6 1,488.2 4,847.6 527.4 10.9% 1.9% 0.4x 3.9x
Quintiles Transnational Holdings Inc. United States 69.57 -14% 8,536.8 10,224.6 803.6 2,491.3 4,229.4 750.7 17.7% 6.3% 2.4x 13.6x
R.R. Donnelley & Sons Company United States 14.56 -28% 3,038.7 6,508.4 295.4 3,746.8 11,521.3 1,071.7 9.3% 5.3% 0.6x 6.1x
Salmat Limited Australia 0.44 -62% 70.2 62.5 37.4 19.6 383.4 11.3 3.0% 10.0% 0.2x 5.5x
Serco Group plc United Kingdom 1.54 -68% 1,677.5 2,098.8 247.1 682.3 5,846.8 (990.1) NM -11.4% 0.4x NM
St Ives plc United Kingdom 2.74 -11% 357.9 423.0 18.1 82.7 507.4 59.0 11.6% 4.5% 0.8x 7.2x
StarTek, Inc. United States 3.35 -67% 52.0 83.9 6.4 38.3 252.7 7.7 3.0% 2.6% 0.3x 11.0x
Sykes Enterprises, Incorporated United States 25.50 -2% 1,109.8 952.4 222.4 65.0 1,313.7 152.9 11.6% 0.9% 0.7x 6.2x
Teleperformance S.A. France 75.61 -6% 4,318.3 4,753.7 340.7 768.6 3,532.2 464.5 13.2% 27.8% 1.3x 10.2x
TeleTech Holdings Inc. United States 26.79 -8% 1,294.0 1,327.2 93.8 116.1 1,279.8 164.8 12.9% 5.5% 1.0x 8.1x
Trans Cosmos, Inc. Japan 24.30 -16% 999.8 770.7 253.2 6.4 1,668.3 92.4 5.5% 7.5% 0.5x 8.3x
Transcontinental Inc. Canada 14.18 -6% 1,110.6 1,339.5 41.7 277.3 1,605.4 311.7 19.4% 4.2% 0.8x 4.3x
Cimpress N.V. Netherlands 76.11 -17% 2,469.8 3,070.2 110.5 652.7 1,494.2 202.6 13.6% 17.6% 2.1x 15.2x
West Corporation United States 22.40 -38% 1,856.1 5,155.1 158.5 3,457.5 2,268.5 654.1 28.8% 21.0% 2.3x 7.9x
Xchanging plc United Kingdom 1.62 -45% 400.4 474.4 179.3 228.3 836.0 (0.9) NM -14.4% 0.6x NM
Adjusted Weighted Average 0.6x 7.5x
*Calculation is market cap weighted and excludes revenue multiples that are 2.0 standard deviations above the mean (1.4x)and EBITDA multiples that are 1.0 standard deviations above the mean (14.1x)
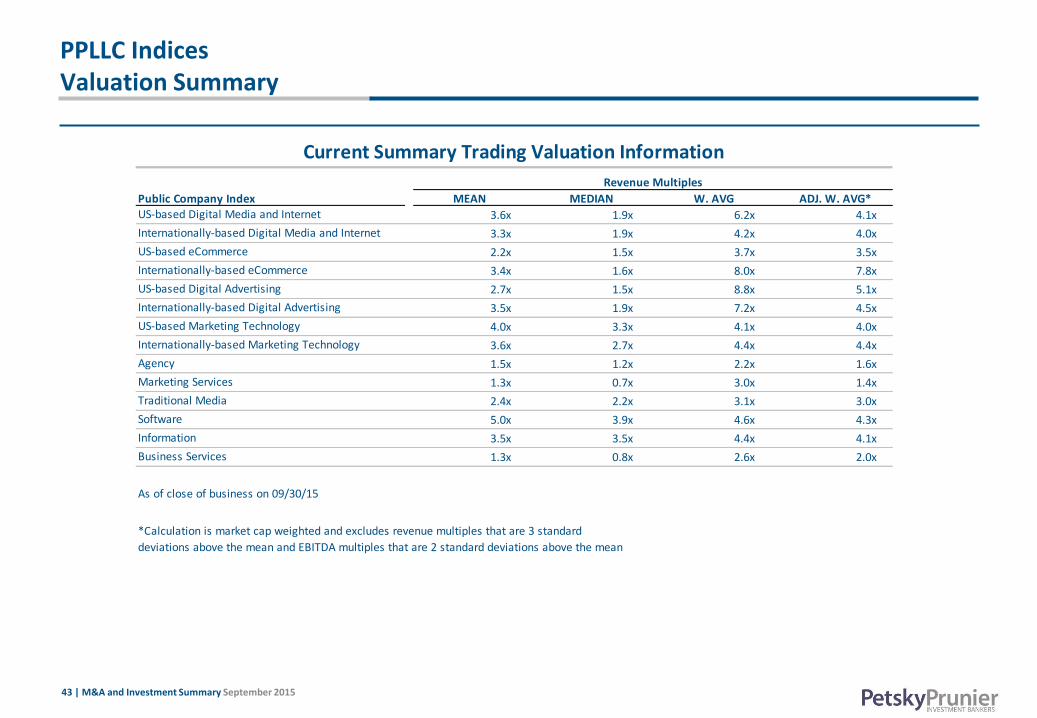
43 | M&A and Investment Summary September 2015
PPLLC Indices Valuation Summary
Public Company Index MEAN MEDIAN W. AVG ADJ. W. AVG*US-based Digital Media and Internet 3.6x 1.9x 6.2x 4.1x
Internationally-based Digital Media and Internet 3.3x 1.9x 4.2x 4.0x
US-based eCommerce 2.2x 1.5x 3.7x 3.5x
Internationally-based eCommerce 3.4x 1.6x 8.0x 7.8x
US-based Digital Advertising 2.7x 1.5x 8.8x 5.1x
Internationally-based Digital Advertising 3.5x 1.9x 7.2x 4.5x
US-based Marketing Technology 4.0x 3.3x 4.1x 4.0x
Internationally-based Marketing Technology 3.6x 2.7x 4.4x 4.4x
Agency 1.5x 1.2x 2.2x 1.6x
Marketing Services 1.3x 0.7x 3.0x 1.4x
Traditional Media 2.4x 2.2x 3.1x 3.0x
Software 5.0x 3.9x 4.6x 4.3x
Information 3.5x 3.5x 4.4x 4.1x
Business Services 1.3x 0.8x 2.6x 2.0x
deviations above the mean and EBITDA multiples that are 2 standard deviations above the mean
Current Summary Trading Valuation Information
Revenue Multiples
As of close of business on 09/30/15
*Calculation is market cap weighted and excludes revenue multiples that are 3 standard

44 | M&A and Investment Summary September 2015
PPLLC Indices Valuation Summary
Public Company Index MEAN MEDIAN W. AVG ADJ. W. AVG*US-based Digital Media and Internet 17.3x 15.1x 15.4x 11.6x
Internationally-based Digital Media and Internet 10.3x 7.9x 12.2x 12.8x
US-based eCommerce 16.9x 15.0x 17.1x 12.0x
Internationally-based eCommerce 27.5x 25.6x 24.5x 30.0x
US-based Digital Advertising 18.1x 14.8x 22.6x 15.9x
Internationally-based Digital Advertising 15.7x 8.7x 14.8x 18.2x
US-based Marketing Technology 17.4x 15.6x 24.4x 11.9x
Internationally-based Marketing Technology 12.7x 12.2x 12.3x 12.5x
Agency 12.0x 10.1x 10.2x 9.8x
Marketing Services 8.8x 8.3x 12.9x 8.7x
Traditional Media 13.4x 10.0x 11.0x 10.8x
Software 29.4x 15.4x 23.7x 12.8x
Information 16.6x 14.0x 16.4x 15.1x
Business Services 11.7x 10.3x 18.1x 12.3x
deviations above the mean and EBITDA multiples that are 2 standard deviations above the mean
Current Summary Trading Valuation Information
EBITDA Multiples
As of close of business on 09/30/15
*Calculation is market cap weighted and excludes revenue multiples that are 3 standard
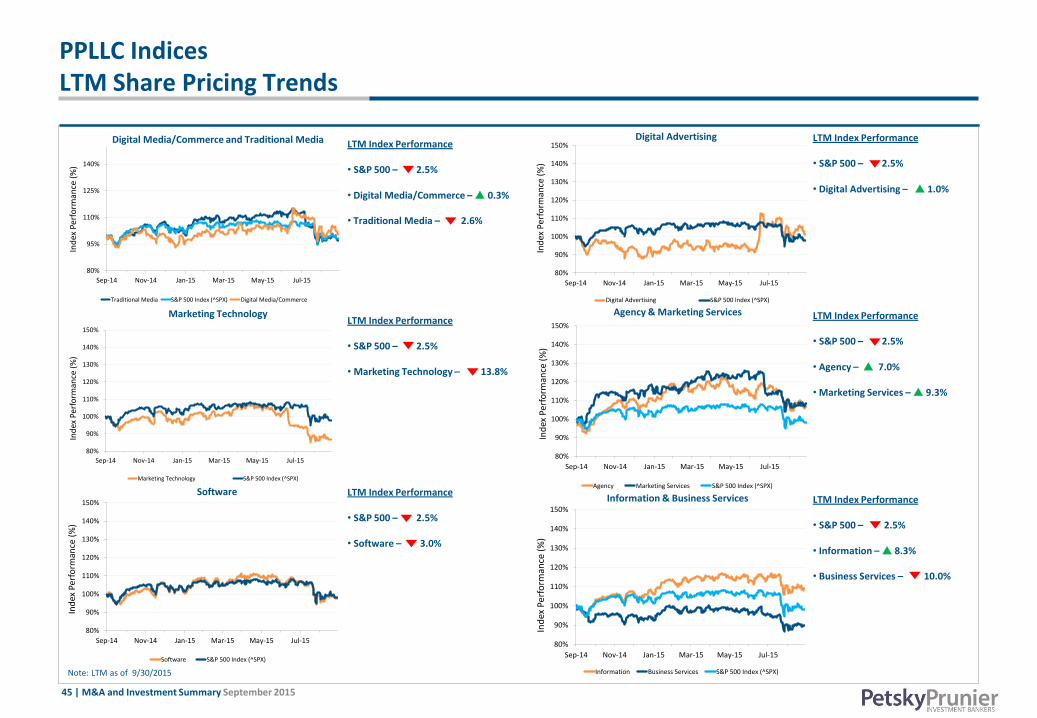
45 | M&A and Investment Summary September 2015
Digital Advertising
PPLLC Indices LTM Share Pricing Trends
Note: LTM as of 9/30/2015
LTM Index Performance • S&P 500 – 2.5% • Digital Media/Commerce – 0.3%
• Traditional Media – 2.6%
LTM Index Performance • S&P 500 – 2.5%
• Marketing Technology – 13.8%
LTM Index Performance • S&P 500 – 2.5% • Digital Advertising – 1.0%
LTM Index Performance • S&P 500 – 2.5%
• Agency – 7.0%
• Marketing Services – 9.3%
Digital Media/Commerce and Traditional Media
Software
Marketing Technology
LTM Index Performance • S&P 500 – 2.5%
• Software – 3.0%
Agency & Marketing Services
Information & Business Services LTM Index Performance • S&P 500 – 2.5%
• Information – 8.3%
• Business Services – 10.0%
80%
95%
110%
125%
140%
Sep-14 Nov-14 Jan-15 Mar-15 May-15 Jul-15
Ind
ex P
erfo
rman
ce (
%)
Traditional Media S&P 500 Index (^SPX) Digital Media/Commerce
80%
90%
100%
110%
120%
130%
140%
150%
Sep-14 Nov-14 Jan-15 Mar-15 May-15 Jul-15
Ind
ex P
erfo
rman
ce (
%)
Marketing Technology S&P 500 Index (^SPX)
80%
90%
100%
110%
120%
130%
140%
150%
Sep-14 Nov-14 Jan-15 Mar-15 May-15 Jul-15
Ind
ex P
erfo
rman
ce (
%)
Software S&P 500 Index (^SPX)
80%
90%
100%
110%
120%
130%
140%
150%
Sep-14 Nov-14 Jan-15 Mar-15 May-15 Jul-15
Ind
ex P
erfo
rman
ce (
%)
Digital Advertising S&P 500 Index (^SPX)
80%
90%
100%
110%
120%
130%
140%
150%
Sep-14 Nov-14 Jan-15 Mar-15 May-15 Jul-15
Ind
ex P
erfo
rman
ce (
%)
Agency Marketing Services S&P 500 Index (^SPX)
80%
90%
100%
110%
120%
130%
140%
150%
Sep-14 Nov-14 Jan-15 Mar-15 May-15 Jul-15
Ind
ex P
erfo
rman
ce (
%)
Information Business Services S&P 500 Index (^SPX)
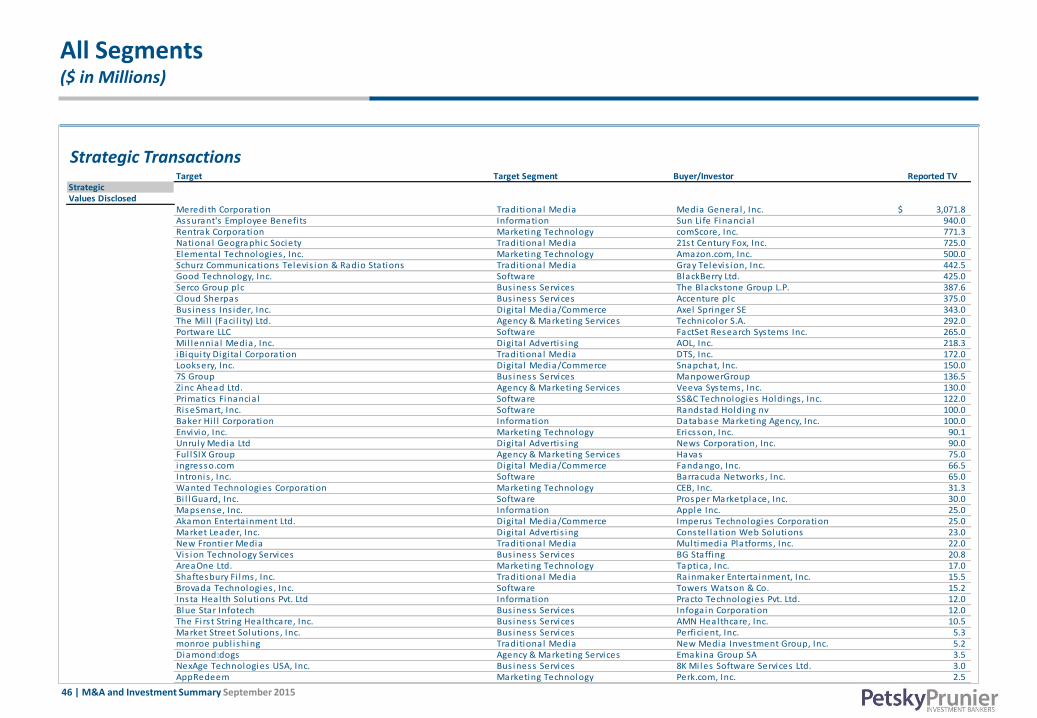
46 | M&A and Investment Summary September 2015
All Segments ($ in Millions)
Strategic Transactions Target Target Segment Buyer/Investor Reported TV
StrategicValues Disclosed
Meredith Corporation Traditional Media Media General , Inc. 3,071.8$ Assurant's Employee Benefi ts Information Sun Li fe Financia l 940.0 Rentrak Corporation Marketing Technology comScore, Inc. 771.3 National Geographic Society Traditional Media 21st Century Fox, Inc. 725.0 Elemental Technologies , Inc. Marketing Technology Amazon.com, Inc. 500.0 Schurz Communications Televis ion & Radio Stations Traditional Media Gray Televis ion, Inc. 442.5 Good Technology, Inc. Software BlackBerry Ltd. 425.0 Serco Group plc Bus iness Services The Blackstone Group L.P. 387.6 Cloud Sherpas Bus iness Services Accenture plc 375.0 Bus iness Ins ider, Inc. Digi ta l Media/Commerce Axel Springer SE 343.0 The Mi l l (Faci l i ty) Ltd. Agency & Marketing Services Technicolor S.A. 292.0 Portware LLC Software FactSet Research Systems Inc. 265.0 Mi l lennia l Media , Inc. Digi ta l Advertis ing AOL, Inc. 218.3 iBiquity Digi ta l Corporation Traditional Media DTS, Inc. 172.0 Looksery, Inc. Digi ta l Media/Commerce Snapchat, Inc. 150.0 7S Group Bus iness Services ManpowerGroup 136.5 Zinc Ahead Ltd. Agency & Marketing Services Veeva Systems, Inc. 130.0 Primatics Financia l Software SS&C Technologies Holdings , Inc. 122.0 RiseSmart, Inc. Software Randstad Holding nv 100.0 Baker Hi l l Corporation Information Database Marketing Agency, Inc. 100.0 Envivio, Inc. Marketing Technology Ericsson, Inc. 90.1 Unruly Media Ltd Digi ta l Advertis ing News Corporation, Inc. 90.0 Ful lSIX Group Agency & Marketing Services Havas 75.0 ingresso.com Digita l Media/Commerce Fandango, Inc. 66.5 Intronis , Inc. Software Barracuda Networks , Inc. 65.0 Wanted Technologies Corporation Marketing Technology CEB, Inc. 31.3 Bi l lGuard, Inc. Software Prosper Marketplace, Inc. 30.0 Mapsense, Inc. Information Apple Inc. 25.0 Akamon Enterta inment Ltd. Digi ta l Media/Commerce Imperus Technologies Corporation 25.0 Market Leader, Inc. Digi ta l Advertis ing Constel lation Web Solutions 23.0 New Frontier Media Traditional Media Multimedia Platforms, Inc. 22.0 Vis ion Technology Services Bus iness Services BG Staffing 20.8 AreaOne Ltd. Marketing Technology Taptica , Inc. 17.0 Shaftesbury Fi lms , Inc. Traditional Media Rainmaker Enterta inment, Inc. 15.5 Brovada Technologies , Inc. Software Towers Watson & Co. 15.2 Insta Health Solutions Pvt. Ltd Information Practo Technologies Pvt. Ltd. 12.0 Blue Star Infotech Bus iness Services Infogain Corporation 12.0 The Fi rs t String Healthcare, Inc. Bus iness Services AMN Healthcare, Inc. 10.5 Market Street Solutions , Inc. Bus iness Services Perficient, Inc. 5.3 monroe publ ishing Traditional Media New Media Investment Group, Inc. 5.2 Diamond:dogs Agency & Marketing Services Emakina Group SA 3.5 NexAge Technologies USA, Inc. Bus iness Services 8K Mi les Software Services Ltd. 3.0 AppRedeem Marketing Technology Perk.com, Inc. 2.5

47 | M&A and Investment Summary September 2015
All Segments ($ in Millions)
Strategic Transactions Target Target Segment Buyer/Investor Reported TV
StrategicUndisclosed
2DataFish Agency & Marketing Services Publ icis Groupe S.A. -$ AKTA Agency & Marketing Services Sales force.com - Broadgate Mainland Ltd. Agency & Marketing Services Four Communications Group plc - ConceptPR Agency & Marketing Services Ogi lvy Publ ic Relations Worldwide - Creatix Agency & Marketing Services GoHealth.com - dustland Agency & Marketing Services verndale - Feintuch Communications , Inc. Agency & Marketing Services Roher Publ ic Relations - HB Agency Agency & Marketing Services Eric Mower & Associates - Home Front Communications LLC Agency & Marketing Services Elmendorf/Ryan LLC - Horn Group Agency & Marketing Services Finn Partners - Ideal Group Agency & Marketing Services Hi l l+Knowlton Strategies - Juss i Intention Marketing Ltda. Agency & Marketing Services WPP Group - Marl in Network Agency & Marketing Services Advantage Sa les & Marketing, LLC - Quadrant Marketing Ltd. Agency & Marketing Services Match Marketing Group - Riverorchid Notch Agency & Marketing Services Havas - Six Degrees PR Agency & Marketing Services Cohn & Wolfe - SYMOVA LLC Agency & Marketing Services Global Marketing & Sa les , Inc. - Tardis Medica l Consultancy Agency & Marketing Services Publ icis Groupe S.A. - The Creative Counsel Group Agency & Marketing Services Publ icis Groupe S.A. - theAudience Agency & Marketing Services Al Ahl i Holding Group - Unison Partners LLC Agency & Marketing Services RepEquity, Inc. - Vi rtue Advertis ing LLC Agency & Marketing Services Logica l Pos i tion LLC - VIUS LLC Agency & Marketing Services Inverse Paradox LLC - angelpoint group Bus iness Services Crayon Group - Aztec Systems, Inc. Bus iness Services SBS Group - Cloud62, Inc. Bus iness Services Huron Consulting Group, Inc. - Divers i fied Healthcare Resources Bus iness Services Cardon Outreach - Frui tion Partners Bus iness Services Computer Sciences Corporation - Keen Systems, Inc. Bus iness Services Aleyant Systems LLC - Kennett Group Bus iness Services TRU Staffing Partners , Inc. - Sagacious Consultants LLC Bus iness Services Accenture plc - Trend Consulting Services , Inc. Bus iness Services Netsmart Technologies , Inc. - WeejeeLearning LLC Bus iness Services Principled Technologies , Inc. - Active Junky, Inc. Digi ta l Advertis ing Purch - Capterra Inc. Digi ta l Advertis ing Gartner, Inc. - ContactUs .com Digita l Advertis ing WorkWave - Ni ffler Labs Pvt. Ltd. Digi ta l Advertis ing Helpchat - RefGo Digi ta l Advertis ing WorkWave - Restaurantes .com Digita l Advertis ing Restalo.es Restaurant Reservations - Shipmymachinery.com Digita l Advertis ing Absolute Worldwide Logis tics , Inc. - Supersonic Ltd. Digi ta l Advertis ing ironSource Ltd. - Vamo Labs , Inc. Digi ta l Advertis ing Airbnb, Inc. -

48 | M&A and Investment Summary September 2015
All Segments ($ in Millions)
Strategic Transactions Target Target Segment Buyer/Investor Reported TV
StrategicUndisclosed
AlphaDraft Digi ta l Media/Commerce FanDuel , Inc. -$ Cruzin Digi ta l Media/Commerce BoatSetter, Inc. - Demibooks , Inc. Digi ta l Media/Commerce Educational Development Corporation - DotaProHub Digi ta l Media/Commerce Unikrn, Inc. - FADE Digi ta l Media/Commerce RelayRides - Fundly, Inc. Digi ta l Media/Commerce NonProfi tEasy - Hurrier Digi ta l Media/Commerce foodora - Ideal Shopping Direct plc Digi ta l Media/Commerce The Blackstone Group L.P. - JumpCam Digita l Media/Commerce RelayRides - Kanvas Labs , Inc. Digi ta l Media/Commerce AOL, Inc. - leaftv Digi ta l Media/Commerce Demand Media, Inc. - Plat Digi ta l Media/Commerce Hous ing.com - PopJam Digita l Media/Commerce SuperAwesome Limited - Ris ing Tide Games, Inc. Digi ta l Media/Commerce Zynga, Inc. - shandy media Digi ta l Media/Commerce obsev - TextureMedia, Inc. Digi ta l Media/Commerce Ultra/Standard Dis tributors , Inc. - Unwind Me, Inc. Digi ta l Media/Commerce Soothe LLC - Va lueMyStuff Digi ta l Media/Commerce Auctionata - Des ign Cost Data Information Bni Bui lding News, Inc. - Enterprise Consulting Solutions , Inc. Information HealthPort - IHM Services Information Pers ivia - Ins ignis , Inc. Information MSCI, Inc. - Lois law, Inc. Information Fastcase, Inc. - ParkMe, Inc. Information INRIX, Inc. - Skyl ight Healthcare Systems, Inc. Information GetWel lNetwork, Inc. - Synowledge LLC Information BioCl inica , Inc. - ADXSTUDIO, Inc. Marketing Technology Microsoft Corporation - Ambur POS Marketing Technology ShopKeep.com Inc. - AppCarousel , Inc. Marketing Technology AppDirect, Inc. - AS Digi ta l Marketing Technology The Pricel ine Group, Inc. - BigBHK Marketing Technology Hous ing.com - Commercia l ly Retai l Pty. Limited Marketing Technology Market Track LLC - Contact Advantage Limited Marketing Technology Reynolds & Reynolds Co. - Device9 GmbH Marketing Technology Flashtalking - Enterprise Avenue, Inc. Marketing Technology PeopleBrowsr - gazeMetrix Marketing Technology Sysomos, Inc. - HeyBubble, Inc. Marketing Technology Interfacing Technologies Corporation - inResto Service Pvt. Ltd. Marketing Technology Dineout.co.in - Ins ide Socia l Marketing Technology Simply Measured, Inc. - Magel ia SAS Marketing Technology Cegid Group SA - Masstech Group Marketing Technology Covington Capita l Corporation - Newsroom Solutions LLC Marketing Technology ChyronHego Corporation -
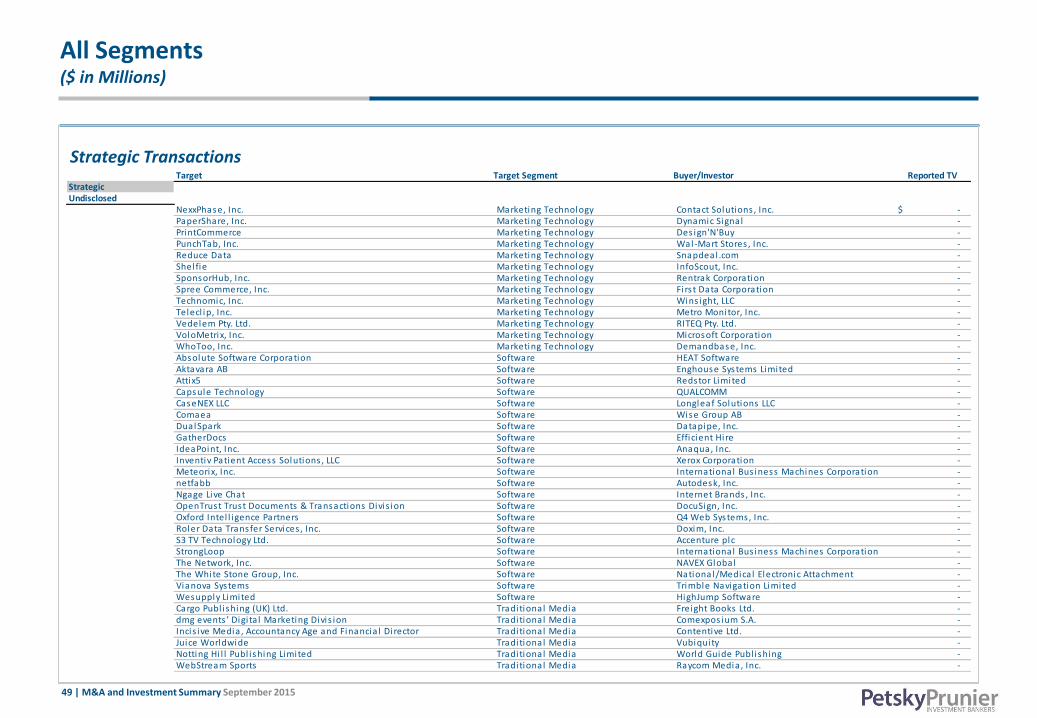
49 | M&A and Investment Summary September 2015
All Segments ($ in Millions)
Strategic Transactions Target Target Segment Buyer/Investor Reported TV
StrategicUndisclosed
NexxPhase, Inc. Marketing Technology Contact Solutions , Inc. -$ PaperShare, Inc. Marketing Technology Dynamic Signal - PrintCommerce Marketing Technology Des ign'N'Buy - PunchTab, Inc. Marketing Technology Wal-Mart Stores , Inc. - Reduce Data Marketing Technology Snapdeal .com - Shel fie Marketing Technology InfoScout, Inc. - SponsorHub, Inc. Marketing Technology Rentrak Corporation - Spree Commerce, Inc. Marketing Technology Firs t Data Corporation - Technomic, Inc. Marketing Technology Wins ight, LLC - Telecl ip, Inc. Marketing Technology Metro Monitor, Inc. - Vedelem Pty. Ltd. Marketing Technology RITEQ Pty. Ltd. - VoloMetrix, Inc. Marketing Technology Microsoft Corporation - WhoToo, Inc. Marketing Technology Demandbase, Inc. - Absolute Software Corporation Software HEAT Software - Aktavara AB Software Enghouse Systems Limited - Attix5 Software Redstor Limited - Capsule Technology Software QUALCOMM - CaseNEX LLC Software Longleaf Solutions LLC - Comaea Software Wise Group AB - DualSpark Software Datapipe, Inc. - GatherDocs Software Efficient Hire - IdeaPoint, Inc. Software Anaqua, Inc. - Inventiv Patient Access Solutions , LLC Software Xerox Corporation - Meteorix, Inc. Software International Bus iness Machines Corporation - netfabb Software Autodesk, Inc. - Ngage Live Chat Software Internet Brands , Inc. - OpenTrust Trust Documents & Transactions Divis ion Software DocuSign, Inc. - Oxford Intel l igence Partners Software Q4 Web Systems, Inc. - Roler Data Transfer Services , Inc. Software Doxim, Inc. - S3 TV Technology Ltd. Software Accenture plc - StrongLoop Software International Bus iness Machines Corporation - The Network, Inc. Software NAVEX Global - The White Stone Group, Inc. Software National/Medica l Electronic Attachment - Vianova Systems Software Trimble Navigation Limited - Wesupply Limited Software HighJump Software - Cargo Publ ishing (UK) Ltd. Traditional Media Freight Books Ltd. - dmg events ’ Digi ta l Marketing Divis ion Traditional Media Comexpos ium S.A. - Incis ive Media, Accountancy Age and Financia l Director Traditional Media Contentive Ltd. - Juice Worldwide Traditional Media Vubiquity - Notting Hi l l Publ ishing Limited Traditional Media World Guide Publ ishing - WebStream Sports Traditional Media Raycom Media, Inc. -

50 | M&A and Investment Summary September 2015
All Segments ($ in Millions)
Buyout Transactions Target Target Segment Buyer/Investor Reported TV
Buyout DealsValues Disclosed
Premiere Global Services , Inc. Bus iness Services Siris Capita l Group 1,000.0$
Target Target Segment Buyer/Investor Reported TV Buyout DealsUndisclosed
Walker Advertis ing, Inc. Agency & Marketing Services ClearLight Partners , LLC -$ Healthcare Staffing Services LLC Bus iness Services Thomas H. Lee Partners - PA Knowledge Limited Bus iness Services The Carlyle Group - Taos Mountain LLC Bus iness Services Bunker Hi l l Capita l - Bevo Media Digi ta l Advertis ing Vize Capita l - StrongView Systems, Inc. Marketing Technology HGGC, LLC - Bluegarden AS Software Marl in Equity Partners - MedeAnalytics , Inc. Software Thoma Bravo, Inc. - Ontario Systems LLC Software Arl ington Capita l Partners - RestorixHealth, Inc. Software Leonard Green & Partners , L.P. -
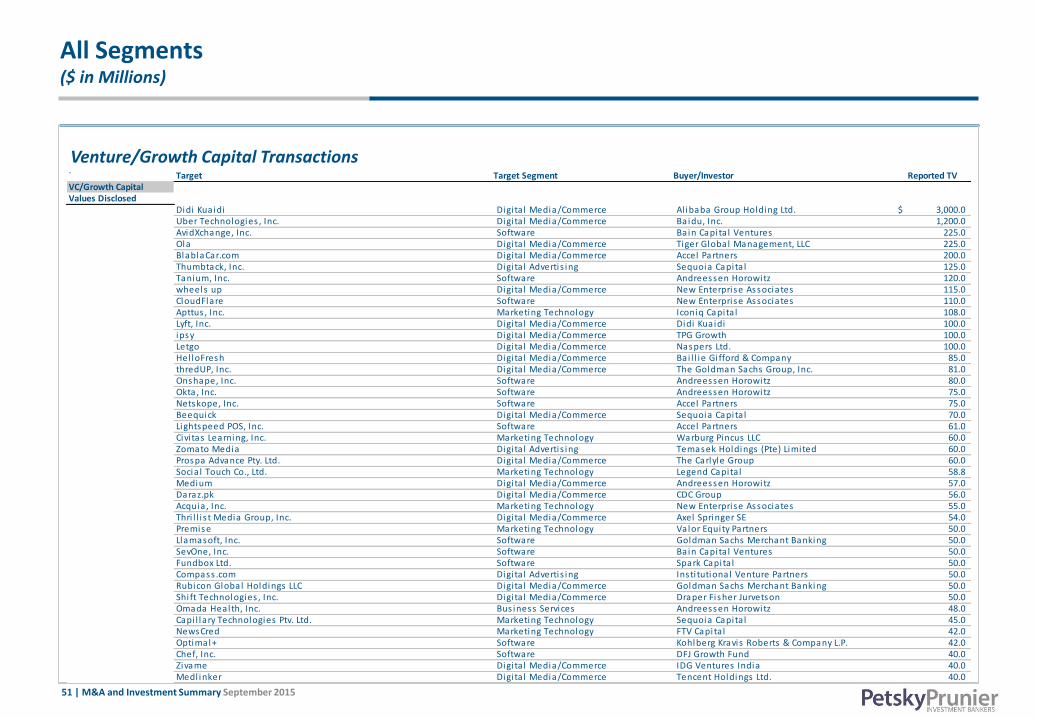
51 | M&A and Investment Summary September 2015
All Segments ($ in Millions)
Venture/Growth Capital Transactions ` Target Target Segment Buyer/Investor Reported TV VC/Growth CapitalValues Disclosed
Didi Kuaidi Digi ta l Media/Commerce Al ibaba Group Holding Ltd. 3,000.0$ Uber Technologies , Inc. Digi ta l Media/Commerce Baidu, Inc. 1,200.0 AvidXchange, Inc. Software Bain Capita l Ventures 225.0 Ola Digi ta l Media/Commerce Tiger Global Management, LLC 225.0 BlablaCar.com Digita l Media/Commerce Accel Partners 200.0 Thumbtack, Inc. Digi ta l Advertis ing Sequoia Capita l 125.0 Tanium, Inc. Software Andreessen Horowitz 120.0 wheels up Digi ta l Media/Commerce New Enterprise Associates 115.0 CloudFlare Software New Enterprise Associates 110.0 Apttus , Inc. Marketing Technology Iconiq Capita l 108.0 Lyft, Inc. Digi ta l Media/Commerce Didi Kuaidi 100.0 ipsy Digi ta l Media/Commerce TPG Growth 100.0 Letgo Digi ta l Media/Commerce Naspers Ltd. 100.0 Hel loFresh Digi ta l Media/Commerce Bai l l ie Gi fford & Company 85.0 thredUP, Inc. Digi ta l Media/Commerce The Goldman Sachs Group, Inc. 81.0 Onshape, Inc. Software Andreessen Horowitz 80.0 Okta, Inc. Software Andreessen Horowitz 75.0 Netskope, Inc. Software Accel Partners 75.0 Beequick Digi ta l Media/Commerce Sequoia Capita l 70.0 Lightspeed POS, Inc. Software Accel Partners 61.0 Civi tas Learning, Inc. Marketing Technology Warburg Pincus LLC 60.0 Zomato Media Digi ta l Advertis ing Temasek Holdings (Pte) Limited 60.0 Prospa Advance Pty. Ltd. Digi ta l Media/Commerce The Carlyle Group 60.0 Socia l Touch Co., Ltd. Marketing Technology Legend Capita l 58.8 Medium Digita l Media/Commerce Andreessen Horowitz 57.0 Daraz.pk Digi ta l Media/Commerce CDC Group 56.0 Acquia , Inc. Marketing Technology New Enterprise Associates 55.0 Thri l l i s t Media Group, Inc. Digi ta l Media/Commerce Axel Springer SE 54.0 Premise Marketing Technology Valor Equity Partners 50.0 Llamasoft, Inc. Software Goldman Sachs Merchant Banking 50.0 SevOne, Inc. Software Bain Capita l Ventures 50.0 Fundbox Ltd. Software Spark Capita l 50.0 Compass .com Digita l Advertis ing Insti tutional Venture Partners 50.0 Rubicon Global Holdings LLC Digi ta l Media/Commerce Goldman Sachs Merchant Banking 50.0 Shi ft Technologies , Inc. Digi ta l Media/Commerce Draper Fisher Jurvetson 50.0 Omada Health, Inc. Bus iness Services Andreessen Horowitz 48.0 Capi l lary Technologies Ptv. Ltd. Marketing Technology Sequoia Capita l 45.0 NewsCred Marketing Technology FTV Capita l 42.0 Optimal+ Software Kohlberg Kravis Roberts & Company L.P. 42.0 Chef, Inc. Software DFJ Growth Fund 40.0 Zivame Digi ta l Media/Commerce IDG Ventures India 40.0 Medl inker Digi ta l Media/Commerce Tencent Holdings Ltd. 40.0
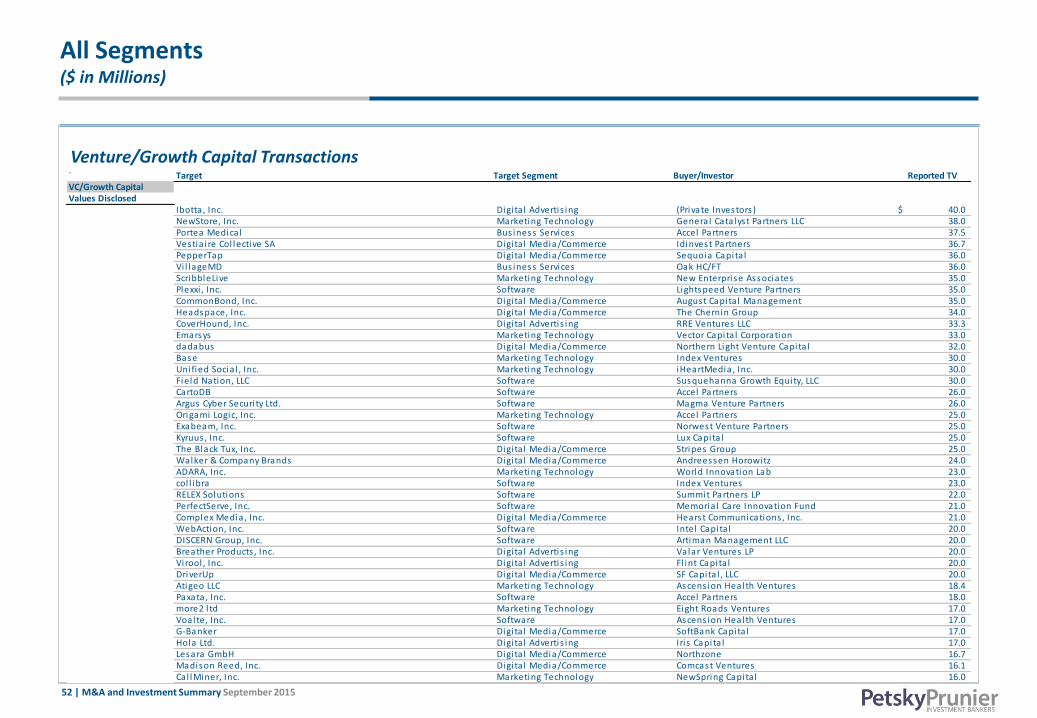
52 | M&A and Investment Summary September 2015
All Segments ($ in Millions)
Venture/Growth Capital Transactions ` Target Target Segment Buyer/Investor Reported TV VC/Growth CapitalValues Disclosed
Ibotta , Inc. Digi ta l Advertis ing (Private Investors ) 40.0$ NewStore, Inc. Marketing Technology General Catalyst Partners LLC 38.0 Portea Medica l Bus iness Services Accel Partners 37.5 Vestia i re Col lective SA Digi ta l Media/Commerce Idinvest Partners 36.7 PepperTap Digi ta l Media/Commerce Sequoia Capita l 36.0 Vi l lageMD Bus iness Services Oak HC/FT 36.0 ScribbleLive Marketing Technology New Enterprise Associates 35.0 Plexxi , Inc. Software Lightspeed Venture Partners 35.0 CommonBond, Inc. Digi ta l Media/Commerce August Capita l Management 35.0 Headspace, Inc. Digi ta l Media/Commerce The Chernin Group 34.0 CoverHound, Inc. Digi ta l Advertis ing RRE Ventures LLC 33.3 Emarsys Marketing Technology Vector Capita l Corporation 33.0 dadabus Digi ta l Media/Commerce Northern Light Venture Capita l 32.0 Base Marketing Technology Index Ventures 30.0 Uni fied Socia l , Inc. Marketing Technology iHeartMedia, Inc. 30.0 Field Nation, LLC Software Susquehanna Growth Equity, LLC 30.0 CartoDB Software Accel Partners 26.0 Argus Cyber Securi ty Ltd. Software Magma Venture Partners 26.0 Origami Logic, Inc. Marketing Technology Accel Partners 25.0 Exabeam, Inc. Software Norwest Venture Partners 25.0 Kyruus , Inc. Software Lux Capita l 25.0 The Black Tux, Inc. Digi ta l Media/Commerce Stripes Group 25.0 Walker & Company Brands Digi ta l Media/Commerce Andreessen Horowitz 24.0 ADARA, Inc. Marketing Technology World Innovation Lab 23.0 col l ibra Software Index Ventures 23.0 RELEX Solutions Software Summit Partners LP 22.0 PerfectServe, Inc. Software Memoria l Care Innovation Fund 21.0 Complex Media, Inc. Digi ta l Media/Commerce Hearst Communications , Inc. 21.0 WebAction, Inc. Software Intel Capita l 20.0 DISCERN Group, Inc. Software Artiman Management LLC 20.0 Breather Products , Inc. Digi ta l Advertis ing Valar Ventures LP 20.0 Vi rool , Inc. Digi ta l Advertis ing Fl int Capita l 20.0 DriverUp Digi ta l Media/Commerce SF Capita l , LLC 20.0 Atigeo LLC Marketing Technology Ascens ion Health Ventures 18.4 Paxata, Inc. Software Accel Partners 18.0 more2 l td Marketing Technology Eight Roads Ventures 17.0 Voalte, Inc. Software Ascens ion Health Ventures 17.0 G-Banker Digi ta l Media/Commerce SoftBank Capita l 17.0 Hola Ltd. Digi ta l Advertis ing Iris Capita l 17.0 Lesara GmbH Digi ta l Media/Commerce Northzone 16.7 Madison Reed, Inc. Digi ta l Media/Commerce Comcast Ventures 16.1 Ca l lMiner, Inc. Marketing Technology NewSpring Capita l 16.0

53 | M&A and Investment Summary September 2015
All Segments ($ in Millions)
Venture/Growth Capital Transactions ` Target Target Segment Buyer/Investor Reported TV VC/Growth CapitalValues Disclosed
Farmigo, Inc. Digi ta l Media/Commerce Benchmark Capita l 16.0$ Moviepi lot.com Digita l Media/Commerce Webedia SAS 16.0 iAdvize SAS Marketing Technology Iris Capita l 15.6 HookLogic Digi ta l Advertis ing Intel Capita l 15.5 Aspiration Partners , Inc. Digi ta l Media/Commerce Renren, Inc. 15.5 WayIn, Inc. Marketing Technology U.S. Venture Partners 15.4 TYPEFORM S.L. Marketing Technology Index Ventures 15.0 Stormpath, Inc. Software New Enterprise Associates 15.0 Ski l l z, Inc. Digi ta l Media/Commerce Sequoia Capita l 15.0 CredR Digi ta l Media/Commerce Eight Roads Ventures 15.0 Yummly Digi ta l Advertis ing Bauer Venture Partners 15.0 Freightos Bus iness Services Aleph Global 14.0 ChoiceStream, Inc. Marketing Technology North Atlantic Capita l Corporation 14.0 Lumity, Inc. Software Socia l+Capita l 14.0 Wrap Media LLC Digi ta l Advertis ing Sales force Ventures 12.7 PackLink.es Digi ta l Advertis ing Accel Partners 12.6 StreamSets , Inc. Software New Enterprise Associates 12.5 Dynamic Signal Marketing Technology Rembrandt Venture Partners 12.0 Teambition Ltd. Software Northern Light Venture Capita l 12.0 Apperian, Inc. Software Bessemer Venture Partners 12.0 HappyFresh Digi ta l Media/Commerce Temasek Holdings (Pte) Limited 12.0 DWNLD Digi ta l Media/Commerce Greylock Partners 12.0 Fundera, Inc. Digi ta l Media/Commerce Khos la Ventures 11.5 Norse Corporation Software KPMG LLP 11.4 Lengow Marketing Technology Serena Capita l 11.2 Take Eat Easy S.P.R.L. Digi ta l Media/Commerce Rocket Internet GmbH 11.2 DoveConviene SRL Digi ta l Advertis ing Highland Capita l Partners 11.2 PinpointCare Software Undisclosed 11.0 Arrayent, Inc. Software Intel Capita l 11.0 Kiswe Mobi le, Inc. Digi ta l Media/Commerce (Private Investors ) 10.8 QuanticMind, Inc. Marketing Technology Safeguard Scienti fics , Inc. 10.3 TeamSnap, Inc. Digi ta l Media/Commerce NorthGate Capita l , LLC 10.0 GrubMarket, Inc. Digi ta l Media/Commerce Fosun Venture Capita l Investment 10.0 la lamove Digi ta l Media/Commerce Mindworks Ventures 10.0 UNIFi Software Software Pel ion Venture Partners 10.0 dremio Software Lightspeed Venture Partners 10.0 Morphick, Inc. Software Orchard Holdings Group, LLC 10.0 Aviatrix Systems, Inc. Software Formation 8 10.0 Appcoach Digi ta l Advertis ing (Private Investors ) 10.0 VULOG Digi ta l Media/Commerce Opus Capita l Group 9.4 iQ media Group LLC Marketing Technology Edison Partners 9.0 Industrybuying.com Digita l Media/Commerce Kalaari Capita l 9.0

54 | M&A and Investment Summary September 2015
All Segments ($ in Millions)
Venture/Growth Capital Transactions ` Target Target Segment Buyer/Investor Reported TV VC/Growth CapitalValues Disclosed
Entefy, Inc. Marketing Technology Undisclosed 8.7$ Shadowfax Technologies Pvt. Ltd. Bus iness Services Eight Roads Ventures 8.5 Adsnative Digi ta l Advertis ing Rakuten Ventures 8.5 Qualpay, Inc. Marketing Technology Undisclosed 8.0 Cloud Lending Solutions , Inc. Marketing Technology SF Capita l , LLC 8.0 Al ignable, Inc. Digi ta l Media/Commerce Mayfield Fund 8.0 LearnUp, Inc. Software New Enterprise Associates 8.0 Iron.io Software Bain Capita l Ventures 8.0 MetaCommunications , Inc. Software NextLevel Venture Partners 8.0 MarketInvoice Digi ta l Media/Commerce (Private Investors ) 7.7 QuanTemplate Marketing Technology Anthemis Group 7.6 pa intzen Digi ta l Media/Commerce Bul lpen Capita l 7.2 Urgent.ly, Inc. Digi ta l Media/Commerce Verizon Ventures 7.0 CrunchBase Digi ta l Media/Commerce Emergence Capita l Partners 7.0 Datiphy, Inc. Software Highland Capita l Partners 7.0 Retency Marketing Technology Truffle Capita l 6.6 Amino Apps Digi ta l Media/Commerce Venrock Associates 6.5 Phantom Cyber Software The Blackstone Group L.P. 6.5 Ancoa Software Ltd. Software (Private Investors ) 6.4 SafetyCulture Pty. Ltd. Digi ta l Media/Commerce Blackbird Ventures 6.1 Codefied Inc. Marketing Technology August Capita l Management 6.0 Ysance Bus iness Services (Private Investors ) 5.6 TVSmi les GmbH Marketing Technology Omnes Capita l 5.6 SheerID Marketing Technology Voyager Capita l 5.3 PaperG, Inc. Marketing Technology KLP Enterprises 5.0 Infoworks .io, Inc. Software Nexus Venture Partners 5.0 Universa l Avenue AB Digi ta l Advertis ing Northzone 5.0 Ta lentSky, Inc. Software (Private Investors ) 5.0 l i feIMAGE Software Blue Cross Blue Shield Association 5.0 Cl iniCloud, Inc. Software Tencent Holdings Ltd. 5.0 Quovo, Inc. Software Long Light Capita l 4.8 Chictypes .com Digita l Media/Commerce 360 Capita l Partners 4.6 Ospoto, Inc. Digi ta l Media/Commerce PivotNorth Capita l 4.5 Saucey, Inc. Digi ta l Media/Commerce Blumberg Capita l 4.5 MoEngage, Inc. Marketing Technology Hel ion Venture Partners 4.3 Scoota Marketing Technology (Private Investors ) 4.2 Veloci ty Mobi le Limited Digi ta l Media/Commerce (Private Investors ) 4.0 InforcePRO Software LiveOak Venture Partners 4.0 Gi tLab B.V. Software Khos la Ventures 4.0 Bloomon B.V. Digi ta l Media/Commerce Partech Ventures 3.9 zuu Digi ta l Media/Commerce Fenox Venture Capita l 3.7 Vars i ty News Network, LLC Digi ta l Media/Commerce Arsenal Venture Partners 3.7

55 | M&A and Investment Summary September 2015
All Segments ($ in Millions)
Venture/Growth Capital Transactions
Target Target Segment Buyer/Investor Reported TV VC/Growth CapitalValues Disclosed
NowSecure, Inc. Marketing Technology Baird Capita l Partners 12.5$ Hinge Digi ta l Media/Commerce Shasta Ventures 12.0 Forward Networks , Inc. Technology & Communications Andreessen Horowitz 11.1 Adelphic Mobi le Digi ta l Advertis ing Google Ventures 11.0 OutboundEngine, Inc. Marketing Technology Si lverton Partners 11.0 Open Garden, Inc. Marketing Technology August Capita l Management 10.8 Cel lTrust Corporation Digi ta l Advertis ing Kayne Partners 10.5 Connect Software Corporation Digi ta l Media/Commerce Kinzon Capita l 10.3 Predi lytics , Inc. Software QUALCOMM Ventures 10.0 Playdots , Inc. Digi ta l Media/Commerce Greycroft Partners 10.0 Trapit, Inc. Marketing Technology Rogers Venture Partners 10.0 LockerDome, LLC Digi ta l Media/Commerce Cultivation Capita l 10.0 Narrative Science, Inc. Digi ta l Media/Commerce Battery Ventures 10.0 HashiCorp Technology & Communications Mayfield Fund 10.0 Orchestro, Inc. Marketing Technology Novak Biddle Venture Partners 9.8 Cloud Technology Partners , Inc. Technology & Communications Pri tzker Group 9.1 Canvas Solutions , Inc. Digi ta l Media/Commerce River Ci ties Capita l Fund 9.0 ad2games Digi ta l Advertis ing HitFox Group 9.0 Blab, Inc. Marketing Technology BlueFocus Communication Group Co., Ltd. 8.8 Peernova Technology & Communications Mosaik Partners 8.6 Lancers , Inc. Information & Bus iness Services GMO Venture Partners 8.5 Nok Nok Labs , Inc. Software DCM Ventures 8.3 InfluxDB Software Mayfield Fund 8.1 Ridibooks Digi ta l Media/Commerce NeoPlux 8.0 P97 Networks , Inc. Marketing Technology Emerald Technology Ventures 8.0 Happn Digi ta l Media/Commerce Alven Capita l Partners 8.0 Area 1 Securi ty, Inc. Software Kleiner Perkins Caufield & Byers 8.0 Tufin Ltd Software (Angel Investors ) 8.0 MetaMind, Inc. Technology & Communications Khos la Ventures 8.0 Appcito, Inc. Technology & Communications Atlas Venture 7.5 Zudy Zudy Technology & Communications Miami Stuff LLC 7.5 Ki tchi t, Inc. Digi ta l Media/Commerce Javel in Venture Partners 7.5 MarketInvoice Digi ta l Media/Commerce Northzone 7.5 DoveConviene SRL Digi ta l Advertis ing 360 Capita l Partners 7.3 Carwow Digi ta l Advertis ing Balderton Capita l 7.2 Oneview Healthcare Software (Private Investors ) 7.0 Chute Corporation Marketing Technology Foundry Group 7.0 Space Ape Games Digi ta l Media/Commerce Accel Partners 7.0 ServerSpace Software iomart Group 6.7 Bottlenose, Inc. Marketing Technology KPMG LLP 6.6 Mattermark Software Foundry Group 6.5
` Target Target Segment Buyer/Investor Reported TV VC/Growth CapitalValues Disclosed
Percenti l Digi ta l Media/Commerce Seaya Ventures 3.6$ Area360 Marketing Technology Madrona Venture Group 3.5 Buguroo Offens ive Securi ty S.L. Software Inveready 3.4 Quintype, Inc. Marketing Technology (Private Investors ) 3.3 Revegy, Inc. Marketing Technology Runa Capita l 3.0 IguanaFix S. de RL de CV Digi ta l Media/Commerce Riverwood Capita l , LLC 3.0 Routehappy, Inc. Digi ta l Media/Commerce Contour Venture Partners 3.0 Din, Inc. Digi ta l Media/Commerce Accel Partners 3.0 Bestdeal finance.com Pvt. Ltd. Software Kalaari Capita l 3.0 Trunomi, Inc Software Saturn Parnters 3.0 compareit4me Group Digi ta l Advertis ing STC Ventures 3.0 Medfus ion, Inc. Software Bul l Ci ty Venture Partners 3.0 Envoy Commerce Corporation Digi ta l Media/Commerce SoftTech VC, Inc. 3.0 AnswerDash, Inc. Marketing Technology Voyager Capita l 2.9 Netsertive, Inc. Marketing Technology Undisclosed 2.7 Guru Technologies , Inc. Marketing Technology Sales force Ventures 2.7 Fast Media Co., Ltd. Software Sales force Ventures 2.7 Ski l l jar, Inc. Software Tri logy Equity Partners , LLC 2.6 Shoptalk LLC Traditional Media Commerce Ventures 2.5 PeerIQ Information Fenway Summer 2.5 ConnectedYard, Inc. Marketing Technology Playground Capita l 2.2 LookLive BV Digi ta l Media/Commerce Liberty Global , Inc. 2.2 Tectonic Marketing Technology Sales force Ventures 2.0 RoomCentra l Digi ta l Advertis ing (Private Investors ) 2.0 PLYmedia Solutions , Inc. Digi ta l Advertis ing Fl int Capita l 2.0 Eden Technology Services , Inc. Digi ta l Media/Commerce Bessemer Venture Partners 2.0 Questis , Inc. Information (Private Investors ) 2.0 Kl ikin Deals Spain, SL Digi ta l Advertis ing Caixa Capita l 1.9 NoviCap Finance S.L. Digi ta l Media/Commerce Partech Ventures 1.7 InnerChef Pvt. Ltd. Digi ta l Media/Commerce TA Ventures 1.7 Ometria Ltd. Marketing Technology (Private Investors ) 1.5 Vanitee Digi ta l Media/Commerce (Private Investors ) 1.4 Si lverPush Marketing Technology M&S Partners 1.2 Padlet, Inc. Marketing Technology Cherubic Ventures 1.2 s imppler Software Greylock Partners 1.2 CanvasFl ip Solutions Pvt. Ltd. Software Bessemer Venture Partners 1.2 CureJoy, Inc. Digi ta l Media/Commerce Accel Partners 1.2 Portfol ium, Inc. Digi ta l Media/Commerce Vertica l Ventures LLC 1.2 Pingpad, Inc. Digi ta l Media/Commerce Greylock Partners 1.0
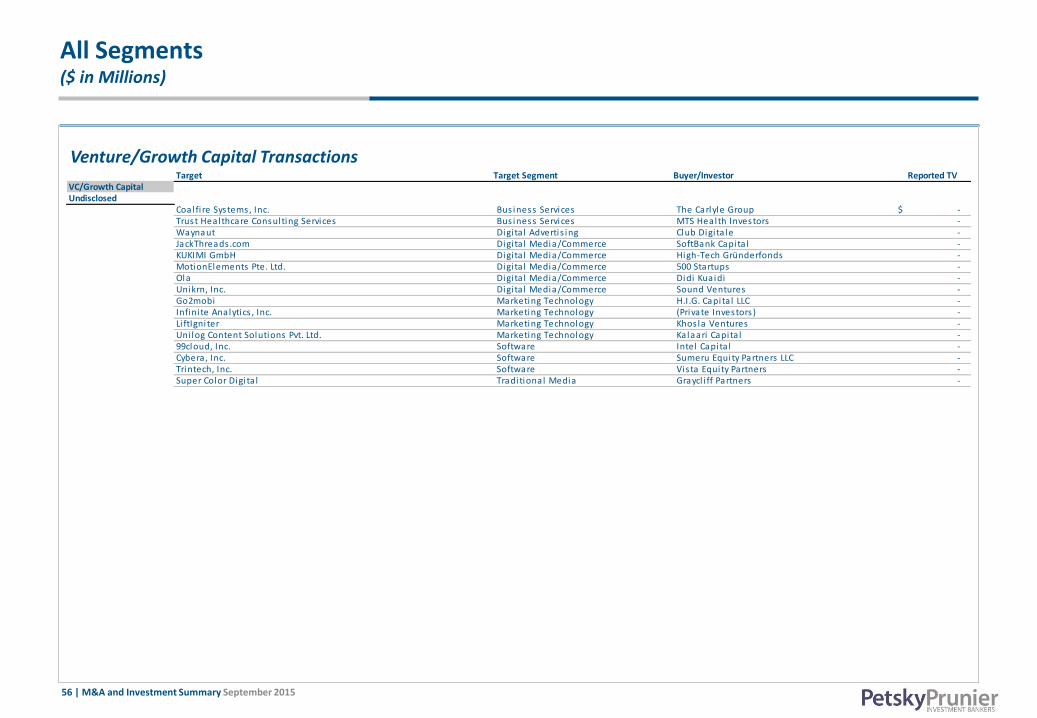
56 | M&A and Investment Summary September 2015
All Segments ($ in Millions)
Venture/Growth Capital Transactions Target Target Segment Buyer/Investor Reported TV
VC/Growth CapitalUndisclosed
Coal fi re Systems, Inc. Bus iness Services The Carlyle Group -$ Trust Healthcare Consulting Services Bus iness Services MTS Health Investors - Waynaut Digi ta l Advertis ing Club Digi ta le - JackThreads .com Digita l Media/Commerce SoftBank Capita l - KUKIMI GmbH Digi ta l Media/Commerce High-Tech Gründerfonds - MotionElements Pte. Ltd. Digi ta l Media/Commerce 500 Startups - Ola Digi ta l Media/Commerce Didi Kuaidi - Unikrn, Inc. Digi ta l Media/Commerce Sound Ventures - Go2mobi Marketing Technology H.I.G. Capita l LLC - Infini te Analytics , Inc. Marketing Technology (Private Investors ) - Li ftIgniter Marketing Technology Khos la Ventures - Uni log Content Solutions Pvt. Ltd. Marketing Technology Kalaari Capita l - 99cloud, Inc. Software Intel Capita l - Cybera, Inc. Software Sumeru Equity Partners LLC - Trintech, Inc. Software Vista Equity Partners - Super Color Digi ta l Traditional Media Graycl i ff Partners -