Embed Size (px)
Citation preview
FTSE ST INDEX SERIES INTRODUCTION
STI AND FTSE ST INDEX SERIES COMMENTARY
Source: FTSE Russell 1 of 30
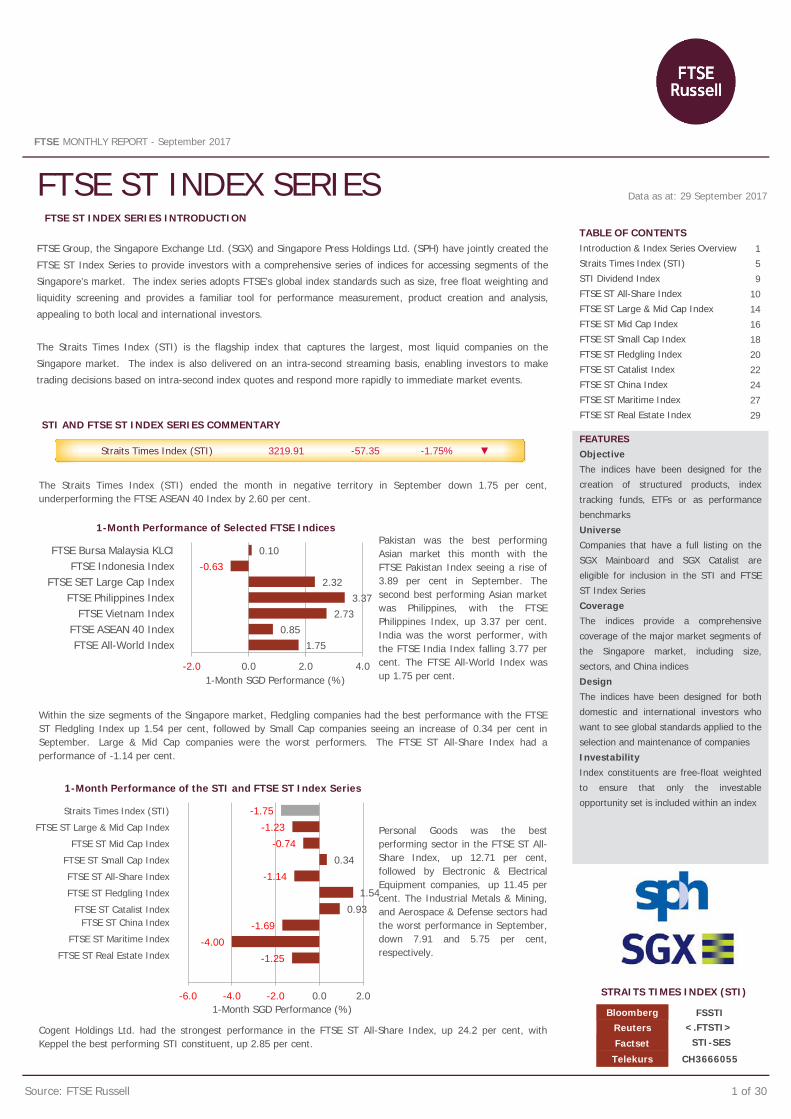
Pakistan was the best performingAsian market this month with theFTSE Pakistan Index seeing a rise of3.89 per cent in September. Thesecond best performing Asian marketwas Philippines, with the FTSEPhilippines Index, up 3.37 per cent.India was the worst performer, withthe FTSE India Index falling 3.77 percent. The FTSE All-World Index wasup 1.75 per cent.
Within the size segments of the Singapore market, Fledgling companies had the best performance with the FTSEST Fledgling Index up 1.54 per cent, followed by Small Cap companies seeing an increase of 0.34 per cent inSeptember. Large & Mid Cap companies were the worst performers. The FTSE ST All-Share Index had aperformance of -1.14 per cent.
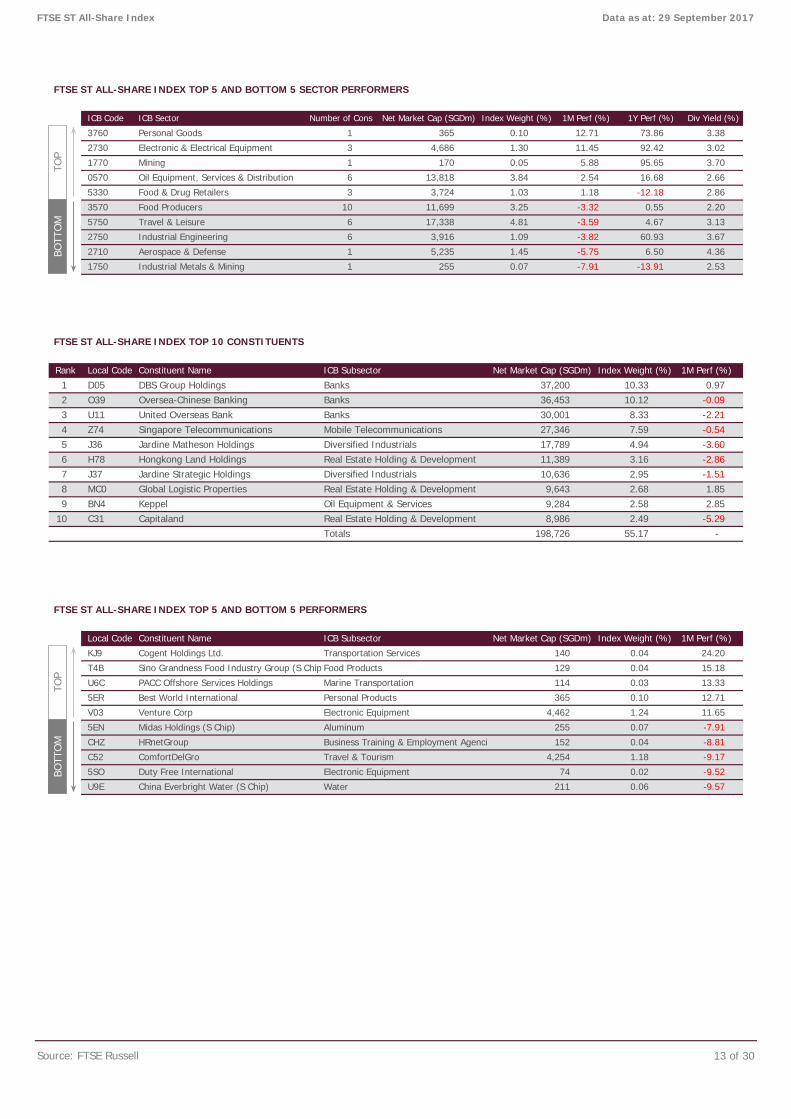
Personal Goods was the bestperforming sector in the FTSE ST All-Share Index, up 12.71 per cent,followed by Electronic & ElectricalEquipment companies, up 11.45 percent. The Industrial Metals & Mining,and Aerospace & Defense sectors hadthe worst performance in September,down 7.91 and 5.75 per cent,respectively.
Cogent Holdings Ltd. had the strongest performance in the FTSE ST All-Share Index, up 24.2 per cent, withKeppel the best performing STI constituent, up 2.85 per cent.
The Straits Times Index (STI) ended the month in negative territory in September down 1.75 per cent,underperforming the FTSE ASEAN 40 Index by 2.60 per cent.
Straits Times Index (STI) 3219.91 -57.35 -1.75% ▼
FTSE ST INDEX SERIES Data as at: 29 September 2017
FTSE MONTHLY REPORT - September 2017
FTSE Group, the Singapore Exchange Ltd. (SGX) and Singapore Press Holdings Ltd. (SPH) have jointly created the
FTSE ST Index Series to provide investors with a comprehensive series of indices for accessing segments of the
Singapore’s market. The index series adopts FTSE’s global index standards such as size, free float weighting and
liquidity screening and provides a familiar tool for performance measurement, product creation and analysis,
appealing to both local and international investors.
The Straits Times Index (STI) is the flagship index that captures the largest, most liquid companies on the
Singapore market. The index is also delivered on an intra-second streaming basis, enabling investors to make
trading decisions based on intra-second index quotes and respond more rapidly to immediate market events.
TABLE OF CONTENTS Introduction & Index Series Overview
Straits Times Index (STI)
STI Dividend Index
FTSE ST All-Share Index
FTSE ST Large & Mid Cap Index
FTSE ST Mid Cap Index
FTSE ST Small Cap Index
FTSE ST Fledgling Index
FTSE ST Catalist Index
FTSE ST China Index
FTSE ST Maritime Index
FTSE ST Real Estate Index
1
5
9
10
14
16
18
20
22
24
27
29
1.75 0.85
2.73 3.37
2.32 -0.63
0.10
-2.0 0.0 2.0 4.0
1-Month Performance of Selected FTSE Indices
1-Month SGD Performance (%)
FTSE Bursa Malaysia KLCI FTSE Indonesia Index
FTSE SET Large Cap Index FTSE Philippines Index
FTSE Vietnam Index FTSE ASEAN 40 Index FTSE All-World Index
STRAITS TIMES INDEX (STI)
FEATURES Objective The indices have been designed for the
creation of structured products, index
tracking funds, ETFs or as performance
benchmarks
Universe Companies that have a full listing on the
SGX Mainboard and SGX Catalist are
eligible for inclusion in the STI and FTSE
ST Index Series
Coverage The indices provide a comprehensive
coverage of the major market segments of
the Singapore market, including size,
sectors, and China indices
Design The indices have been designed for both
domestic and international investors who
want to see global standards applied to the
selection and maintenance of companies
Investability Index constituents are free-float weighted
to ensure that only the investable
opportunity set is included within an index
Bloomberg Reuters <.FTSTI>
Factset STI-SES
FSSTI
Telekurs CH3666055
-1.25
-4.00
-1.69
0.93
1.54
-1.14
0.34
-0.74
-1.23
-1.75
-6.0 -4.0 -2.0 0.0 2.0
1-Month Performance of the STI and FTSE ST Index Series
1-Month SGD Performance (%)
Straits Times Index (STI)
FTSE ST Mid Cap Index
FTSE ST Small Cap Index
FTSE ST All-Share Index
FTSE ST Fledgling Index
FTSE ST Catalist Index FTSE ST China Index
FTSE ST Maritime Index
FTSE ST Real Estate Index
FTSE ST Large & Mid Cap Index
STI AND FTSE ST INDEX SERIES
Source: FTSE Russell 2 of 30
FTSE ST Index Series Data as at: 29 September 2017
Indu
stry
Indi
ces
All-S
hare
Large & Mid Cap
Mid Cap
Small Cap 98%
Universe
Fledgling M
ariti
me
Screen for
Revenue from Maritime Related Activities
Chi
na
Cat
alis
t
Screen for
Sales Revenue / Operating Assets from
Mainland China
STI
Screen for Size and Higher
Liquidity
INFORMATION
Index Universe SGX Mainboard & SGX Catalist
Index Launch FTSE ST Index Series - 10 Jan 2008 FTSE ST China Index - 10 Jan 2008 FTSE ST Catalist Index - 22 Jun 2009 FTSE ST Maritime Index - 1 Sep 2009 STI Dividend Index - 1 Nov 2010
Base Date STI - 9 Jan 2008 Other FTSE ST Indices - 5 Oct 2007
Base Value STI - 3344.53 Other FTSE ST Indices - 1000
Index Calculation Real-time and end-of-day indices available. Real-time indices are calculated at the following intervals: STI - intra-second streaming basis Other FTSE ST Indices - every 60 seconds
End-of-Day Distribution Indices available at 19:00 Singapore local time (11:00 hours UK time GMT or 12:00 hours BST) via FTP and email
Currency USD, EUR, GBP, JPY, SGD Real-time calculated in SGD only
Review Dates Full review in March and September Fast entrant review in June and December
Index Rules Available at www.ftse.com/st
Vendor Codes See page 4 or contact [email protected]
Historical Data Available from August 1999
INDUSTRY CLASSIFICATION BENCHMARK (ICB) The indices are calculated in accordance with the Industry Classification Benchmark (ICB), the global standard for industry sector analysis The ICB contains four classification levels: Industries (x10) Supersectors (x19) Sectors (x41) Subsectors (x114) Global presence - ICB is adopted by stock exchanges representing over 65% of the world’s market capitalisation
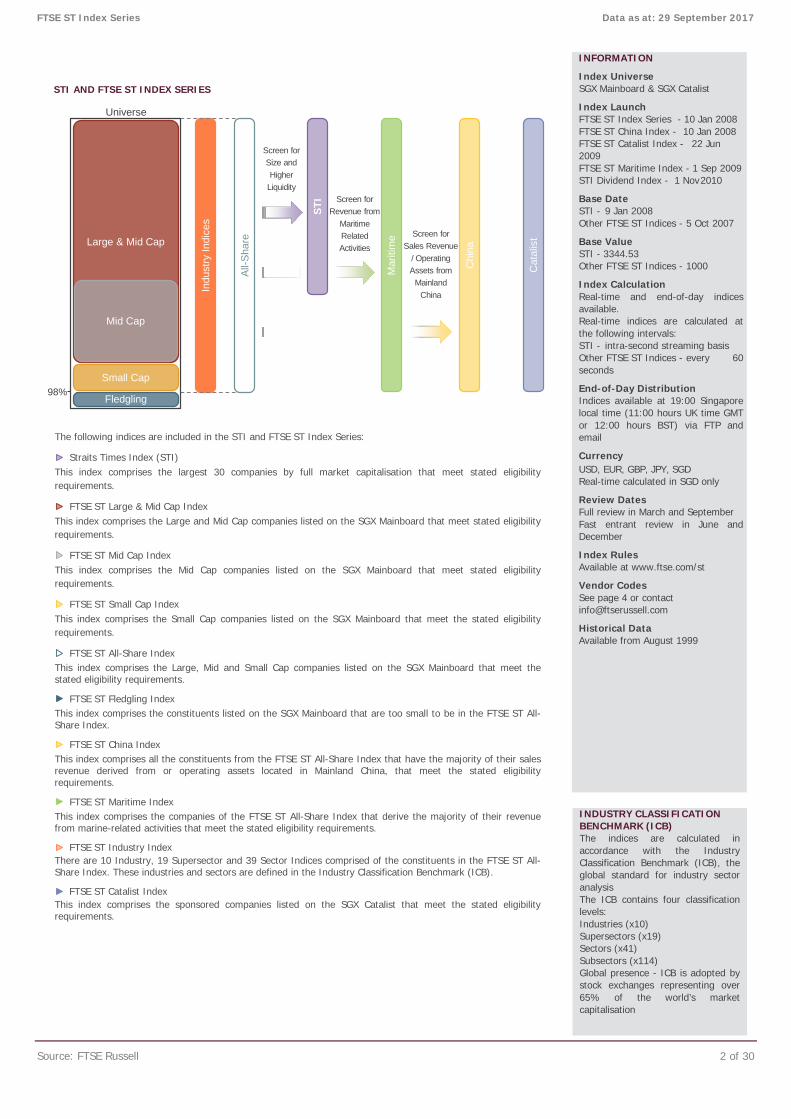
The following indices are included in the STI and FTSE ST Index Series:
Straits Times Index (STI) This index comprises the largest 30 companies by full market capitalisation that meet stated eligibility requirements.
FTSE ST Large & Mid Cap Index This index comprises the Large and Mid Cap companies listed on the SGX Mainboard that meet stated eligibility requirements.
FTSE ST Mid Cap Index This index comprises the Mid Cap companies listed on the SGX Mainboard that meet stated eligibility requirements.
FTSE ST Small Cap Index This index comprises the Small Cap companies listed on the SGX Mainboard that meet the stated eligibility requirements.
FTSE ST All-Share Index This index comprises the Large, Mid and Small Cap companies listed on the SGX Mainboard that meet the stated eligibility requirements.
FTSE ST Fledgling Index This index comprises the constituents listed on the SGX Mainboard that are too small to be in the FTSE ST All-Share Index.
FTSE ST China Index This index comprises all the constituents from the FTSE ST All-Share Index that have the majority of their sales revenue derived from or operating assets located in Mainland China, that meet the stated eligibility requirements.
FTSE ST Maritime Index This index comprises the companies of the FTSE ST All-Share Index that derive the majority of their revenue from marine-related activities that meet the stated eligibility requirements.
FTSE ST Industry Index There are 10 Industry, 19 Supersector and 39 Sector Indices comprised of the constituents in the FTSE ST All-Share Index. These industries and sectors are defined in the Industry Classification Benchmark (ICB).
FTSE ST Catalist Index This index comprises the sponsored companies listed on the SGX Catalist that meet the stated eligibility requirements.
INDEX METHODOLOGY OVERVIEW
Source: FTSE Russell 3 of 30
FTSE ST Index Series Data as at: 29 September 2017
Further details of the index methodology can be found on www.ftse.com/st. The following publications are available by contacting your local FTSE Russell Client Services team or [email protected].
GROUND RULES FOR THE FTSE ST INDEX SERIES
Eligible Securities
All classes of the ordinary shares in issue are eligible for inclusion in the STI and FTSE ST Index Series, subject to conforming to all other rules of eligibility, free float and liquidity.
Index Review
The STI and FTSE ST Index Series have a full review in every March and September using data on the Monday 4 weeks prior to review effective date. In June and December, a fast entrant review is applied to selected indices for new issues not large enough to qualify as fast entrants since the previous March or September review, using data on the Monday 4 weeks prior to the review effective date. For the STI, new issues will be reviewed with the existing constituents. The reviews will be implemented after the close of business on the third Friday of the review month.
Constituent Selection
Inclusion Screens
For the FTSE ST Index Series, the Index Universe is defined as the top 98% of the Country Universe where all eligible companies from the SGX Mainboard are ranked by full market capitalisation, i.e. before the adjustment of free float.
A company will be inserted at the periodic review if it is located at the position stated below in the Index Universe for the relevant index:
FTSE ST Large & Mid Cap Index - Risen to 86% or above FTSE ST Mid Cap Index - Risen to 86% or above, but below 68% FTSE ST Small Cap Index - Risen to 98% or above, but below 86%
A company will be deleted at the periodic review if it is located at the position stated below in the Index Universe for the relevant index:
FTSE ST Large & Mid Cap Index - Fallen below 92% FTSE ST Mid Cap Index - Fallen below 92%, or risen to 68% or above FTSE ST Small Cap Index - Fallen below 101%, or risen to 86% or above
A company will be eligible for the FTSE ST All-Share Index providing it is a constituent of either the large & mid, or small cap index.
At review, all constituents of the STI must be existing or pending constituents of the FTSE ST All-Share Index.
A company will be inserted into the STI at the periodic review if it rises above the position stated below when the eligible securities are ranked by full market capitalisation, i.e. before the adjustment of free float:
STI - Risen to 20th or above
A company in the STI will be deleted at the periodic review if it falls below the position stated below when the eligible securities are ranked by full market capitalisation, i.e. before the adjustment of free float:
STI - Fallen to 41st or below
Liquidity Screen
Liquidity screen is conducted in March and September and is based on a security’s median daily trading per month on the SGX, with each daily trade total ranked and the middle ranking day selected. Daily totals with zero trades are included.
For the FTSE ST Index Series (excluding the Fledgling and Catalist Index which are not screened for liquidity):
● Non-constituents must turnover at least 0.05% of their shares in issue (after the adjustment of free float) in ten of the twelve months prior to the March or September review.
● An existing constituent must trade at least 0.04% of its shares in issue (after the adjustment of free float) for at least eight of the twelve months prior to the March or September review.
● New issues must have a minimum 20 days trading record when reviewed and a turnover of at least 0.05% of their free float adjusted shares in each month since their listing.
For the STI:
● Non-constituents must turnover at least 0.10% of their shares in issue (after the adjustment of free float) in ten of the twelve months prior to the March or September review.
● An existing constituent must trade at least 0.08% of its shares in issue (after the adjustment of free float) for at least eight of the twelve months prior to the March or September review.
● New issues must have a minimum 20 days trading record when reviewed and a turnover of at least 0.10% of their free float adjusted shares in each month since their listing.
Free Float
The FTSE ST Index Series constituents are adjusted for free float and weighted according to how much share capital is available for public investment. FTSE has chosen to apply free float restrictions in weighted bands.
STI and FTSE ST Index Advisory Committee
The STI and FTSE ST Advisory Committee governs the ongoing management of these indices to ensure they continue to meet the needs of index users. The committee is made up of senior investment professionals and finance industry experts acting independently to advise on the creation of new indices, any enhancements to the methodology and to ensure that the index series evolves with any changes in the market environment.
GROUND RULES FOR THE STRAITS TIMES INDEX
COMMENTARY IN SEPTEMBER
VENDOR CODES
Index NameStraits Times Index (STI)FTSE ST Large & Mid Cap IndexFTSE ST Mid Cap IndexFTSE ST Small Cap IndexFTSE ST All-Share IndexFTSE ST Fledgling IndexFTSE ST Catalist IndexFTSE ST China IndexFTSE ST Maritime IndexFTSE ST Real Estate Index
Source: FTSE Russell 4 of 30
CH3610270CH3610318CH3610323CH3610337TK10211710TK4309208CH3610340TK10384198
FSTMFSTSFSTASFSTF
Global markets were in positive territory in September, with the FTSE All-World Index up 1.75per cent. Year-to-date global markets have continued on a positive path, up 8.24 per cent.
Europe was the best performing region in September finishing the month up 3.07 per cent.Middle East & Africa was the worst performing region, down on the month 5.04 per cent.Asian markets saw positive performance with the FTSE Asia Pacific Index up 0.11 per cent.
Within Asia Pakistan was the best performing market in September, with the FTSE PakistanIndex up 3.89 per cent. The Straits Times Index (STI) had a drop of 57.35 index points onthe month, seeing a negative performance of 1.75 per cent.
The Oil Equipment, Services & Distribution sector within the STI Index had the bestperformance up 2.04 per cent, with Aerospace & Defense sector showing the worstperformance down 5.75 per cent. The best performing STI Index constituent was Keppelshowing a positive return of 2.85 per cent in September.
Within the size segments in September fledgling companies were the best performers in theFTSE ST Index Series, up 1.54 per cent on the month with large cap companies showing theworst performance. The FTSE ST All-Share Index had a performance of -1.14 per cent inSeptember, with Cogent Holdings Ltd. the best performing constituent, up 24.20 per cent.
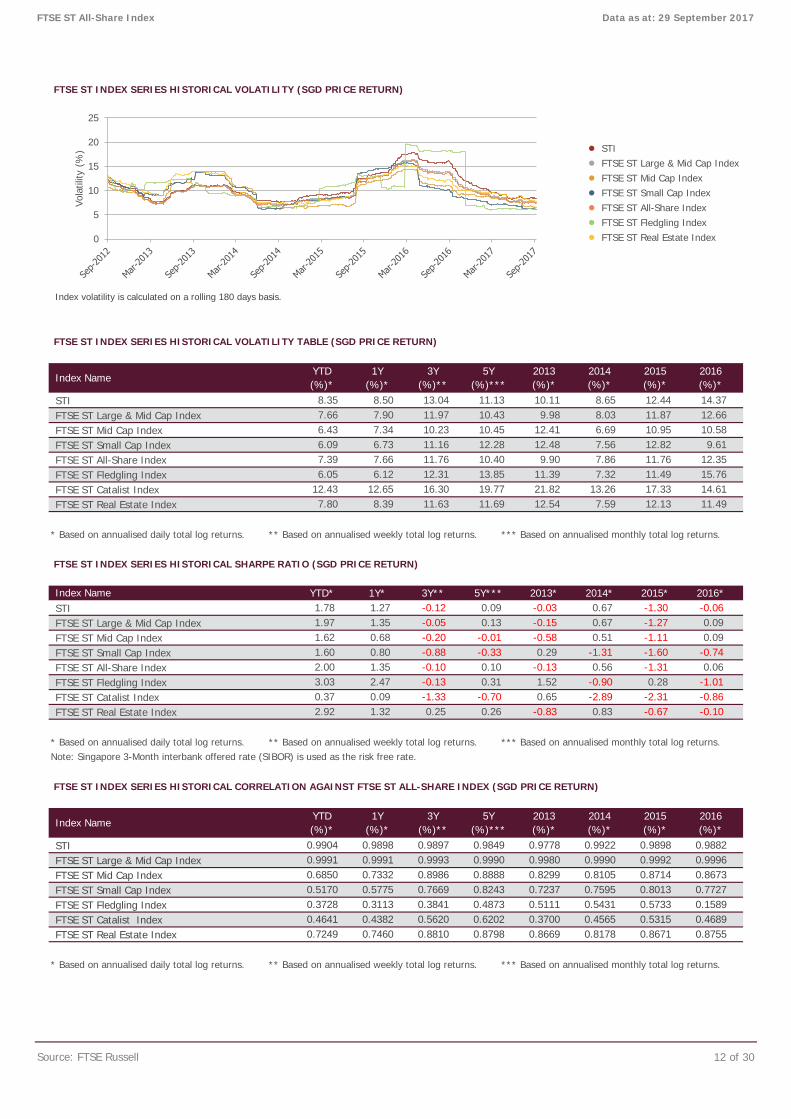
Year to date the FTSE ST Maritime Index has the highest volatility within the FTSE ST IndexSeries at 32.30 per cent. The FTSE ST Fledgling Index has the lowest volatility with 6.05 percent. This compares to a volatility of 25.98 and 15.76 per cent respectively for 2016. TheFTSE ST All-Share Index had a volatility of 7.39 per cent, lower than 2016's 12.35 per cent.
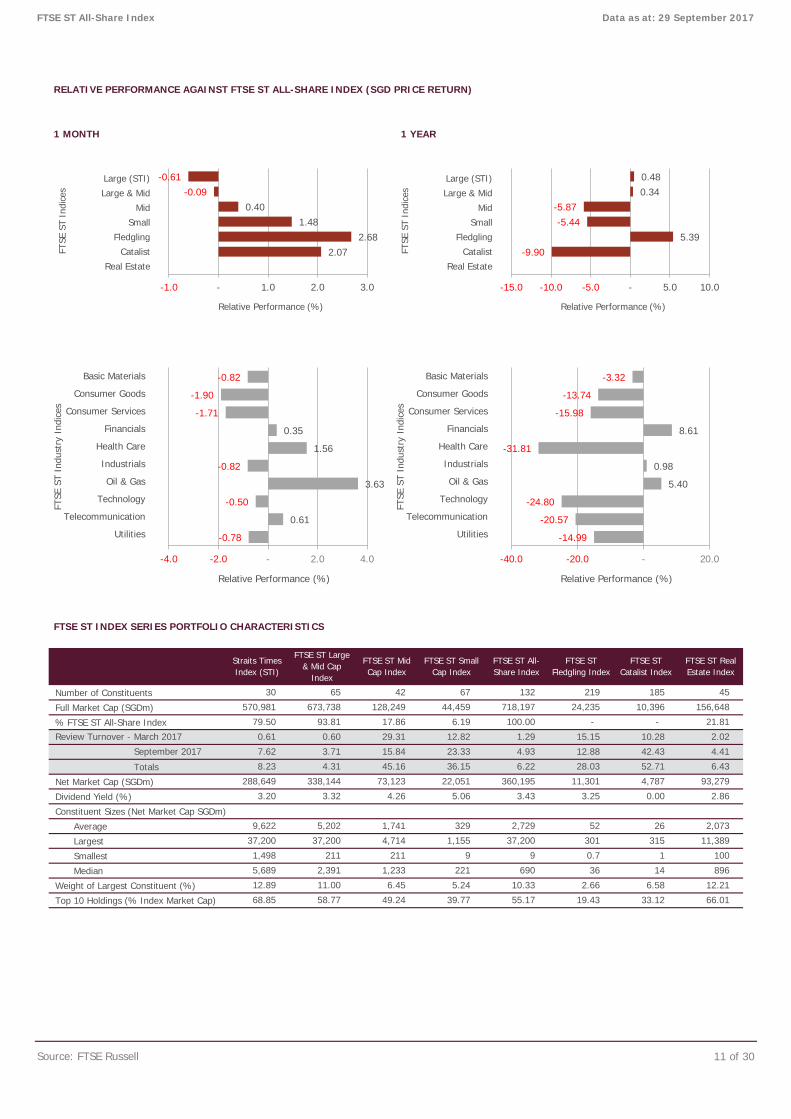
As at the end of September, the FTSE ST Large & Mid Cap Index accounts for 93.81 per centof the FTSE ST All-Share Index, with the 67 constituents of the FTSE ST Small Cap Indexaccounting for 6.19 per cent. The top ten constituents of the FTSE ST Large & Mid Cap Indexaccount for 58.77 per cent of the index, compared to 39.77 per cent of the FTSE ST SmallCap Index and 55.17 per cent of the FTSE ST All-Share Index.
Personal Goods was the best performing sector in the FTSE ST All-Share Index up 12.71 percent in September, with Electronic & Electrical Equipment being the second best performer up11.45 per cent. Industrial Metals & Mining was the worst performing sector followed byAerospace & Defense down 7.91 per cent and 5.75 per cent, respectively.
With an index weighting of 56.56 per cent and 30 constituents, Financials is the largestindustry in the FTSE ST Large & Mid Cap Index, up 3.82 per cent in weighting compared tothe previous month. This compares to a weight of 43.01 per cent in the FTSE ST Mid CapIndex and 56.39 per cent in the FTSE ST All-Share Index.
REUTERS.FTSTI
.FTFSTLM
TELEKURSCH3666055
-
FTSE ST Index Series Data as at: 29 September 2017
FTSESTI
FSTLMFSTMFSTSFSTASFSTF
FSTICAFSTCTFSTC
FSTAM
FSTF-SES
BLOOMBERGFSSTIFSTLM
.FTFSTC
FSTICA-SES
.FTFSTAMFSTC
FSTAM
FSTCT-SESFSTC-SES
FSTAM-SES
FSTICAFSTCT
.FTFSTM.FTFSTS.FTFSTAS.FTFSTF
.FTFSTICA
FACTSETSTI-SES
-FSTM-SESFSTS-SESFSTAS-SES
.FTFSTCT
INDEX OVERVIEW
STI FIVE-YEAR PERFORMANCE (SGD PRICE RETURN) PERFORMANCE HIGHLIGHTS
● STI ● FTSE ST All-Share Index
STI HISTORICAL PERFORMANCE TABLE (SGD PRICE RETURN)
STI
FTSE ST All-Share Index
PERFORMANCE OF THE STI AND SELECTED FTSE ASIA PACIFIC COUNTRY INDICES IN SEPTEMBER (SGD PRICE RETURN)
STI HISTORICAL REVIEW TURNOVER
Source: FTSE Russell 5 of 30
FTSE India Index
276,206
137 665 16 170 0.10
1 FTSE Pakistan Index 5 3.89 FTSE Indonesia Index
5.21
5.35 -0.27
-0.20 1.41 11.77
-1.22 -1.29
10
Index NameNumber of Cons
-1.14 0.26 11.75
26 93 3.37 5
29
2016(%)
6M(%)
YTD(%)
FTSE Philippines Index
3.43 11.73
3M(%)
6.24
Div Yield(%)
Net Market Cap (SGDm) Number of Cons
0.61
8.23
-3.77
276,392
7.62
1.30
BEFORE REVIEW
14
276,247 30
50 -2.06
-0.63
1,568 12
0.01
Straits Times Index (STI)
3.20 12.21
2014(%)
-14.34
2013(%)
30
1Y(%)
-1.01
Number of Cons
Net Market Cap (SGDbn)
1M Perf (%)
-1.75
-0.81 1.52
Net Market Cap (SGDbn)
1M Perf (%)
-0.58 1.02 -1.73
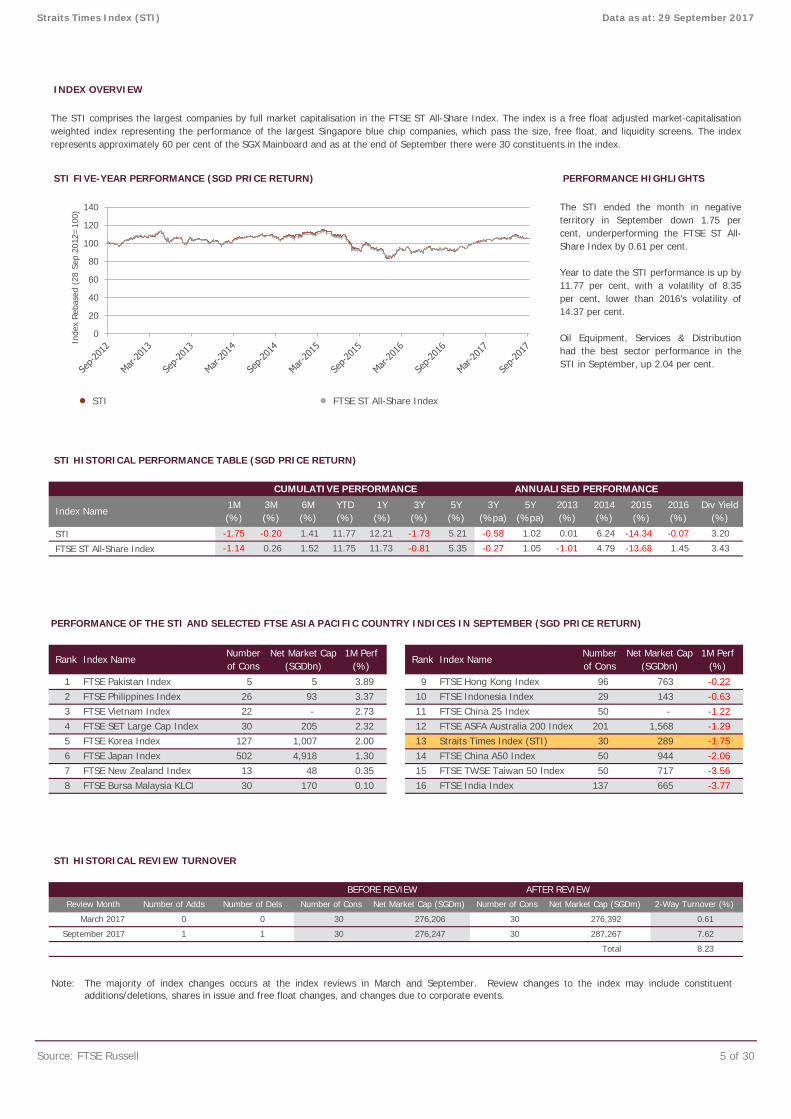
The STI ended the month in negativeterritory in September down 1.75 percent, underperforming the FTSE ST All-Share Index by 0.61 per cent.
Year to date the STI performance is up by11.77 per cent, with a volatility of 8.35per cent, lower than 2016’s volatility of14.37 per cent.
Oil Equipment, Services & Distributionhad the best sector performance in theSTI in September, up 2.04 per cent.
The STI comprises the largest companies by full market capitalisation in the FTSE ST All-Share Index. The index is a free float adjusted market-capitalisationweighted index representing the performance of the largest Singapore blue chip companies, which pass the size, free float, and liquidity screens. The indexrepresents approximately 60 per cent of the SGX Mainboard and as at the end of September there were 30 constituents in the index.
6
1
289
50 -
Net Market Cap (SGDm) 2-Way Turnover (%)
FTSE China 25 Index FTSE Vietnam Index 22
30 4,918 FTSE Japan Index 502
15 FTSE TWSE Taiwan 50 Index
11
-3.56 50
30
3Y(%)
2015(%)
5Y(%)
5Y(%pa)
1M(%)
FTSE Korea Index 127 1,007 2.00 4 FTSE SET Large Cap Index 5
2
FTSE China A50 Index
AFTER REVIEW
7 FTSE New Zealand Index 13
2.32 3
FTSE ASFA Australia 200 Index 201 205
944 48
Index Name
March 2017 0 0 30
287,267
Total
September 2017 1
Index Name
763
Rank
-0.22
Rank
8 FTSE Bursa Malaysia KLCI 30 0.35
Review Month Number of Adds Number of Dels Number of Cons
-
-1.75
717
30
143
Data as at: 29 September 2017
2.73
13 Straits Times Index (STI)
1.05
3Y(%pa)
-13.68 1.45 4.79
9 FTSE Hong Kong Index 96
CUMULATIVE PERFORMANCE ANNUALISED PERFORMANCE
-0.07
0
20
40
60
80
100
120
140
Inde
x Re
base
d (2
8 Se
p 20
12=
100)
The majority of index changes occurs at the index reviews in March and September. Review changes to the index may include constituent additions/deletions, shares in issue and free float changes, and changes due to corporate events.
Note:
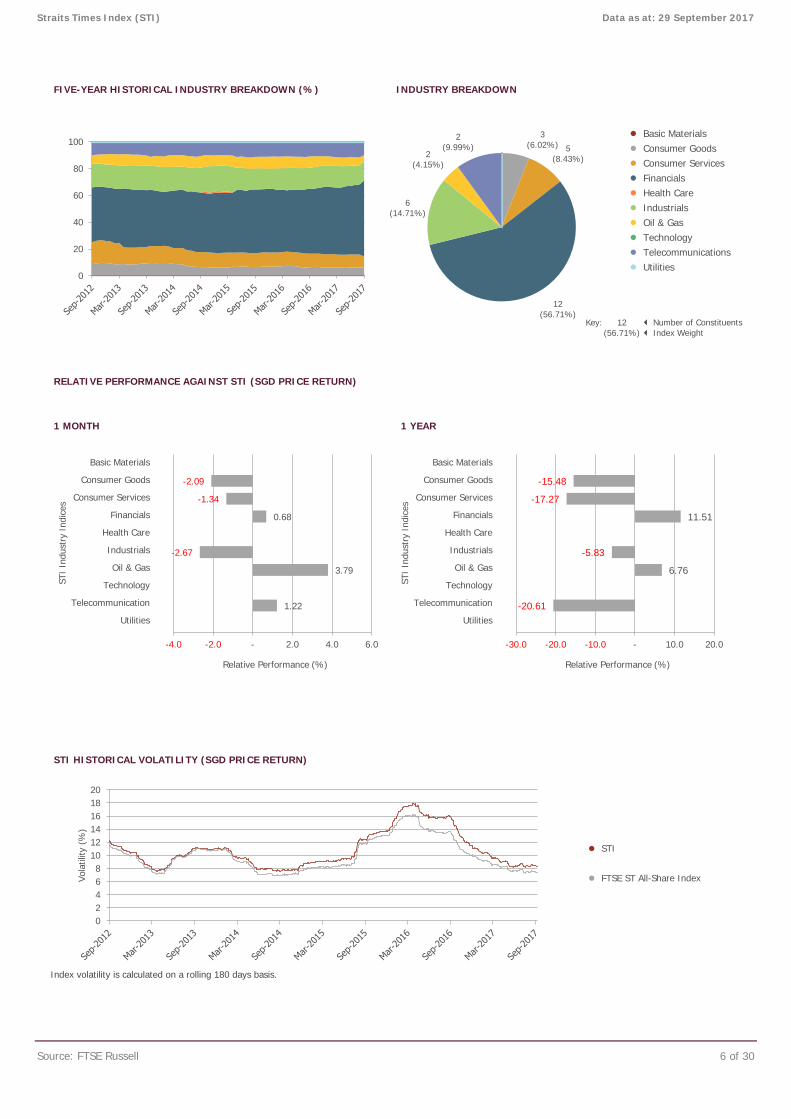
FIVE-YEAR HISTORICAL INDUSTRY BREAKDOWN (%) INDUSTRY BREAKDOWN
● Basic Materials● Consumer Goods● Consumer Services● Financials● Health Care● Industrials● Oil & Gas● Technology● Telecommunications● Utilities
RELATIVE PERFORMANCE AGAINST STI (SGD PRICE RETURN)
1 MONTH 1 YEAR
STI HISTORICAL VOLATILITY (SGD PRICE RETURN)
● STI
● FTSE ST All-Share Index
Index volatility is calculated on a rolling 180 days basis.
Source: FTSE Russell 6 of 30
Straits Times Index (STI) Data as at: 29 September 2017
Key:
12 (56.71%)
Number of Constituents Index Weight
0
20
40
60
80
1003
(6.02%) 5 (8.43%)
12 (56.71%)
6 (14.71%)
2 (4.15%)
2 (9.99%)
1.22
3.79
-2.67
0.68
-1.34
-2.09
-4.0 -2.0 - 2.0 4.0 6.0
Relative Performance (%)
Basic Materials
Consumer Goods
Consumer Services
Financials
Health Care
Industrials
Oil & Gas
Technology
Telecommunication
Utilities
STI
Indu
stry
Ind
ices
-20.61
6.76
-5.83
11.51
-17.27
-15.48
-30.0 -20.0 -10.0 - 10.0 20.0
Relative Performance (%)
Basic Materials
Consumer Goods
Consumer Services
Financials
Health Care
Industrials
Oil & Gas
Technology
Telecommunication
Utilities
STI
Indu
stry
Ind
ices
02468
101214161820
Vola
tility
(%
)
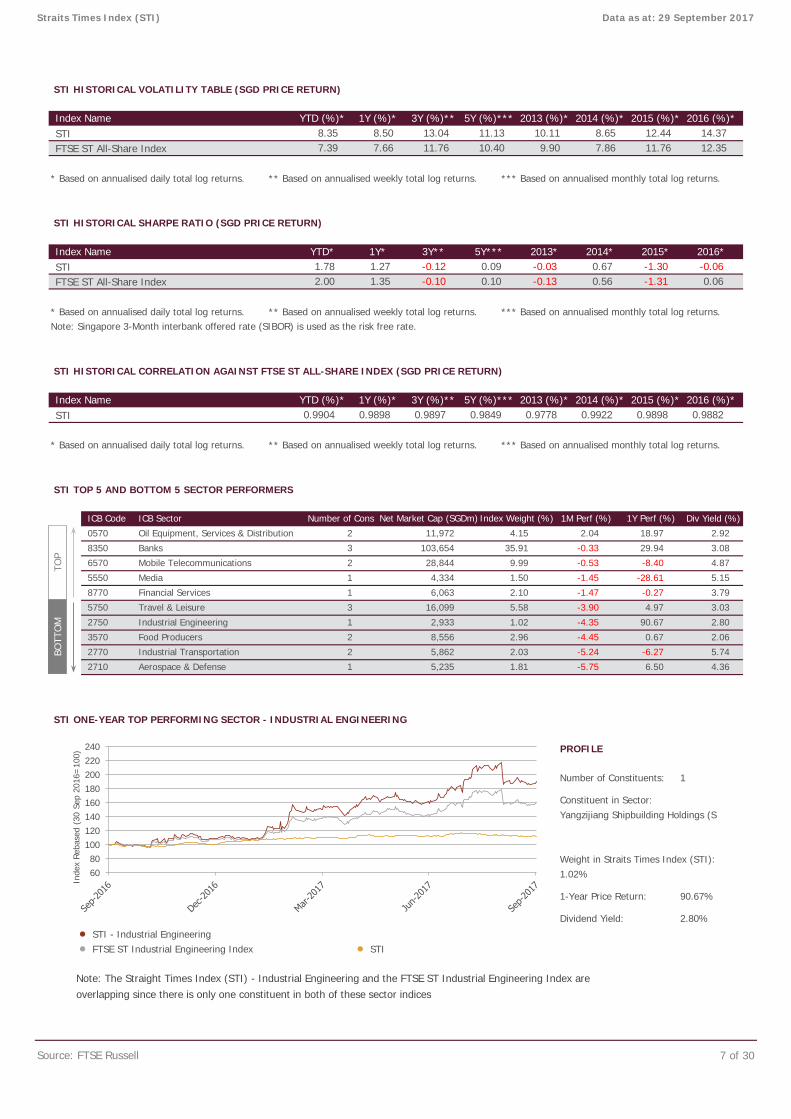
STI HISTORICAL VOLATILITY TABLE (SGD PRICE RETURN)
STIFTSE ST All-Share Index
* Based on annualised daily total log returns. ** Based on annualised weekly total log returns. *** Based on annualised monthly total log returns.
STI HISTORICAL SHARPE RATIO (SGD PRICE RETURN)
STIFTSE ST All-Share Index
* Based on annualised daily total log returns. ** Based on annualised weekly total log returns. *** Based on annualised monthly total log returns.Note: Singapore 3-Month interbank offered rate (SIBOR) is used as the risk free rate.
STI HISTORICAL CORRELATION AGAINST FTSE ST ALL-SHARE INDEX (SGD PRICE RETURN)
STI
* Based on annualised daily total log returns. ** Based on annualised weekly total log returns. *** Based on annualised monthly total log returns.
STI TOP 5 AND BOTTOM 5 SECTOR PERFORMERS
STI ONE-YEAR TOP PERFORMING SECTOR - INDUSTRIAL ENGINEERING
PROFILE
● STI - Industrial Engineering● FTSE ST Industrial Engineering Index ● STI
Source: FTSE Russell 7 of 30
7.39
2.00 -0.10 0.10
2014*-0.03 0.67
YTD (%)* 1Y (%)*0.9898
1.78 1.27
18.97
2016 (%)*
0.06 1.35
2013 (%)* 2015 (%)*3Y (%)**
2.80
2.06
5.74
0.9898
1 -28.61
-0.53
0.56
0.9778
-1.30
12.35 9.90 8.65
Index Name
3.79
0.9922
8.50
YTD* 1Y* 3Y** 5Y*** 2013*
Number of Cons
2014 (%)*
-1.31
2015 (%)*3Y (%)**
Data as at: 29 September 2017
2013 (%)*
Index Name
2.96
0.9882
35.91
Industrial Transportation
4.97
90.67
14.37 12.44 7.66 11.76 11.76
2016 (%)*
0.09 -0.06
5Y (%)***
-0.13
Index Name YTD (%)*
2015*-0.12
1Y (%)* 2014 (%)*
7.86
5Y (%)***13.04
ICB Code ICB Sector
2
3570
1
3
1
Food Producers
9.99
Banks
2750 Industrial Engineering
0.67
0570
8350 29.94
-5.24
16,099
2,933
2770
Oil Equipment, Services & Distribution 2.04
-0.27
-4.45
5,862 2.03 -6.27
2
1.02
8,556
Media
Financial Services 6,063
-8.40
4,334 1.50
6570 Mobile Telecommunications 28,844
-3.90
103,654
2
5750
8770
11,972 4.15
5.58
3
5550
2.10 -1.47
Travel & Leisure 3.03
Net Market Cap (SGDm) Index Weight (%) 1Y Perf (%)
-0.33
1M Perf (%)
0.9897
-4.35
0.9849 0.9904
2
1-Year Price Return:
Weight in Straits Times Index (STI):
1
Constituent in Sector:Yangzijiang Shipbuilding Holdings (S
Div Yield (%)
2.92
3.08
4.87
5.15-1.45
2710 Aerospace & Defense 5,235 1.81
Number of Constituents:
8.35 11.13 10.11
2.80%
-5.75
90.67%
Dividend Yield:
10.40
Straits Times Index (STI)
2016*
1.02%
6.50 4.361
TOP
BOTT
OM
6080
100120140160180200220240
Inde
x Re
base
d (3
0 Se
p 20
16=
100)
Note: The Straight Times Index (STI) - Industrial Engineering and the FTSE ST Industrial Engineering Index are overlapping since there is only one constituent in both of these sector indices
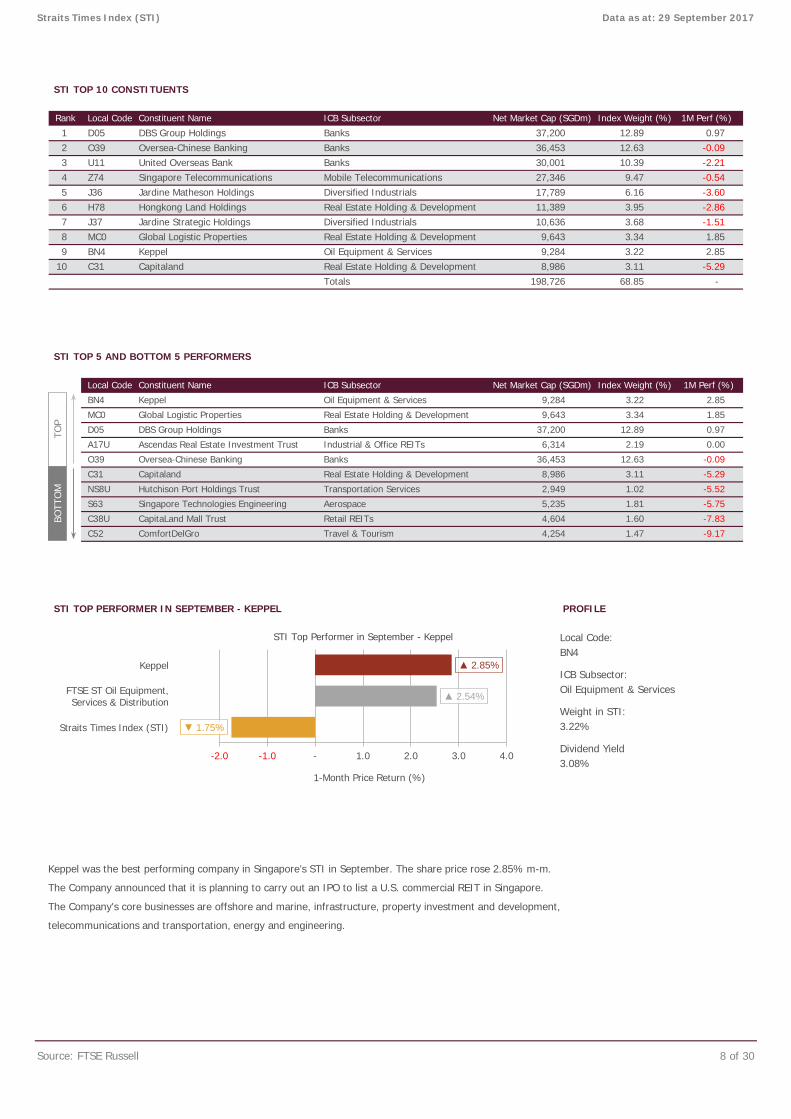
STI TOP 10 CONSTITUENTS
STI TOP 5 AND BOTTOM 5 PERFORMERS
STI TOP PERFORMER IN SEPTEMBER - KEPPEL PROFILE
Source: FTSE Russell 8 of 30
Net Market Cap (SGDm) Index Weight (%)
2.85
1M Perf (%)
BN4
-5.52
5
10
Local Code
D05O39U11Z74J36H78J37MC0BN4
-1.51
17,789-2.86
Index Weight (%)Net Market Cap (SGDm)
Diversified Industrials
-2.21
3.95
12.63
Real Estate Holding & Development 8,986 3.11Capitaland
C38U
Singapore Technologies Engineering
-5.29
0.00
1.60
Dividend Yield
-7.83
Weight in STI:3.22%
Hutchison Port Holdings Trust
10,636 3.68
-5.29
Hongkong Land Holdings Real Estate Holding & Development 11,389
3.34
C31
O39 -0.09
Ascendas Real Estate Investment Trust 6,314
6.16 -3.60
Capitaland Real Estate Holding & DevelopmentTotals 198,726 68.85
1.85
Jardine Matheson Holdings
Keppel
Rank
30,001
Constituent Name ICB Subsector 1M Perf (%)
Straits Times Index (STI) Data as at: 29 September 2017
10.39
0.97
Banks
1 DBS Group Holdings Banks 37,200
ICB Subsector:Oil Equipment & Services
C52 ComfortDelGro Travel & Tourism 4,254 1.47 -9.17
3.08%
Local Code:
CapitaLand Mall Trust Retail REITs 4,604
D05
Real Estate Holding & Development 9,643
BN4 Keppel
S63
2
Singapore Telecommunications Mobile Telecommunications 27,346 9.47
Banks 36,453 12.63
Industrial & Office REITs
12.89 0.97
2.85
MC0 Global Logistic Properties
8 Global Logistic Properties Real Estate Holding & Development 9,6437 Jardine Strategic Holdings
4
3.34
Local Code Constituent Name ICB Subsector
6
C31
Oil Equipment & Services 9,284 3.22
A17U 2.19
NS8U
-
9
Oversea-Chinese Banking3 United Overseas Bank
12.89
Transportation Services 2,949 1.02
-0.09
-0.54
Oversea-Chinese Banking Banks
-5.75Aerospace 5,235 1.81
36,453
Diversified Industrials
8,986 3.11
DBS Group Holdings Banks 37,200
Oil Equipment & Services 9,284 3.221.85
TOP
BOTT
OM
Keppel was the best performing company in Singapore’s STI in September. The share price rose 2.85% m-m.
The Company announced that it is planning to carry out an IPO to list a U.S. commercial REIT in Singapore.
The Company's core businesses are offshore and marine, infrastructure, property investment and development,
telecommunications and transportation, energy and engineering.
FTSE ST Oil Equipment, Services & Distribution
Keppel
Straits Times Index (STI) ▼ 1.75%
▲ 2.54%
▲ 2.85%
-2.0 -1.0 - 1.0 2.0 3.0 4.0
1-Month Price Return (%)
STI Top Performer in September - Keppel
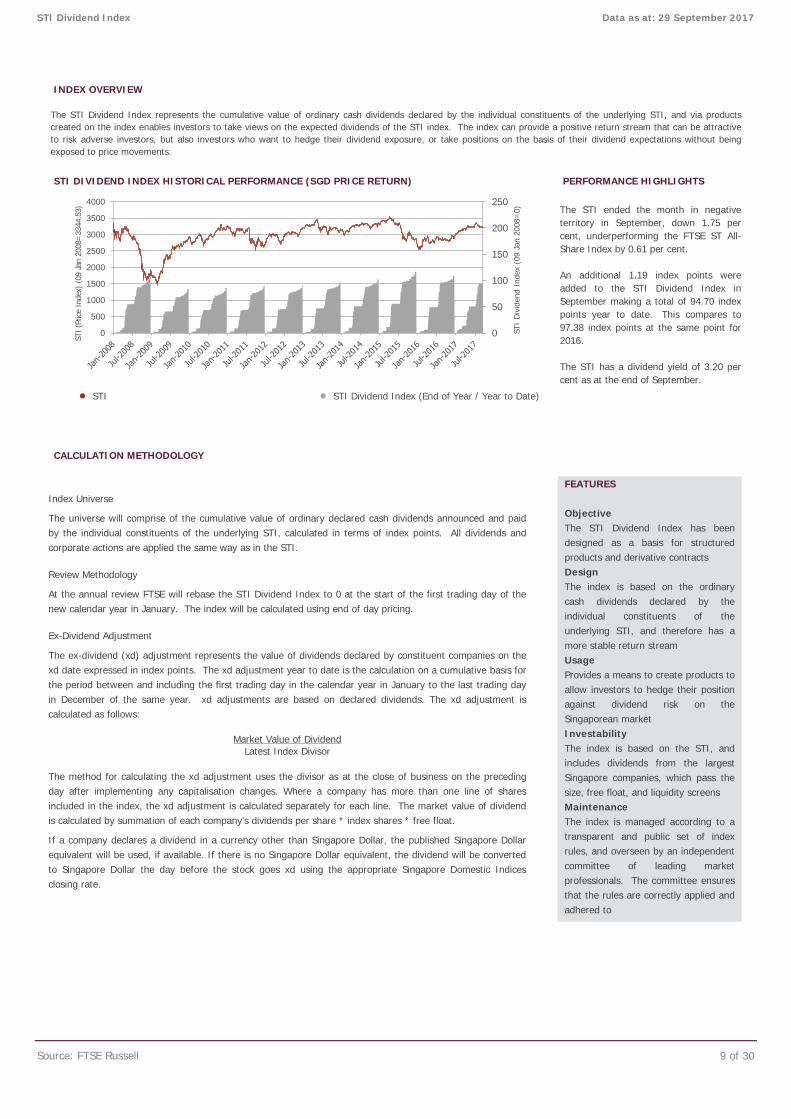
INDEX OVERVIEW
STI DIVIDEND INDEX HISTORICAL PERFORMANCE (SGD PRICE RETURN) PERFORMANCE HIGHLIGHTS
● STI ● STI Dividend Index (End of Year / Year to Date)
CALCULATION METHODOLOGY
Source: FTSE Russell 9 of 30
STI Dividend Index Data as at: 29 September 2017
The STI Dividend Index represents the cumulative value of ordinary cash dividends declared by the individual constituents of the underlying STI, and via productscreated on the index enables investors to take views on the expected dividends of the STI index. The index can provide a positive return stream that can be attractiveto risk adverse investors, but also investors who want to hedge their dividend exposure, or take positions on the basis of their dividend expectations without beingexposed to price movements.
The STI ended the month in negativeterritory in September, down 1.75 percent, underperforming the FTSE ST All-Share Index by 0.61 per cent.
An additional 1.19 index points wereadded to the STI Dividend Index inSeptember making a total of 94.70 indexpoints year to date. This compares to97.38 index points at the same point for2016.
The STI has a dividend yield of 3.20 percent as at the end of September.
0
50
100
150
200
250
0
500
1000
1500
2000
2500
3000
3500
4000
STI
Div
iden
d In
dex
(09
Jan
2008
=0)
STI
(Pric
e In
dex)
(09
Jan
200
8=33
44.5
3)
Index Universe
The universe will comprise of the cumulative value of ordinary declared cash dividends announced and paid by the individual constituents of the underlying STI, calculated in terms of index points. All dividends and corporate actions are applied the same way as in the STI.
Review Methodology
At the annual review FTSE will rebase the STI Dividend Index to 0 at the start of the first trading day of the new calendar year in January. The index will be calculated using end of day pricing.
Ex-Dividend Adjustment
The ex-dividend (xd) adjustment represents the value of dividends declared by constituent companies on the xd date expressed in index points. The xd adjustment year to date is the calculation on a cumulative basis for the period between and including the first trading day in the calendar year in January to the last trading day in December of the same year. xd adjustments are based on declared dividends. The xd adjustment is calculated as follows:
Market Value of Dividend Latest Index Divisor
The method for calculating the xd adjustment uses the divisor as at the close of business on the preceding day after implementing any capitalisation changes. Where a company has more than one line of shares included in the index, the xd adjustment is calculated separately for each line. The market value of dividend is calculated by summation of each company’s dividends per share * index shares * free float.
If a company declares a dividend in a currency other than Singapore Dollar, the published Singapore Dollar equivalent will be used, if available. If there is no Singapore Dollar equivalent, the dividend will be converted to Singapore Dollar the day before the stock goes xd using the appropriate Singapore Domestic Indices closing rate.
FEATURES Objective The STI Dividend Index has been designed as a basis for structured products and derivative contracts Design The index is based on the ordinary cash dividends declared by the individual constituents of the underlying STI, and therefore has a more stable return stream Usage Provides a means to create products to allow investors to hedge their position against dividend risk on the Singaporean market Investability The index is based on the STI, and includes dividends from the largest Singapore companies, which pass the size, free float, and liquidity screens Maintenance The index is managed according to a transparent and public set of index rules, and overseen by an independent committee of leading market professionals. The committee ensures that the rules are correctly applied and adhered to
INDEX OVERVIEW
FTSE ST ALL-SHARE INDEX FIVE-YEAR PERFORMANCE (SGD PRICE RETURN) PERFORMANCE HIGHLIGHTS
● STI ● FTSE ST Large & Mid Cap Index ● FTSE ST Mid Cap Index● FTSE ST Small Cap Index ● FTSE ST All-Share Index ● FTSE ST Fledgling Index
FTSE ST ALL-SHARE INDEX HISTORICAL PERFORMANCE TABLE (SGD PRICE RETURN)
STI
FTSE ST Large & Mid Cap Index
FTSE ST Mid Cap Index
FTSE ST Small Cap Index
FTSE ST All-Share Index
FTSE ST Fledgling Index
FTSE ST Catalist Index
FTSE ST China Index
FTSE ST Maritime Index
FTSE ST Real Estate Index
FIVE-YEAR HISTORICAL INDUSTRY BREAKDOWN (%) INDUSTRY BREAKDOWN (%)
● Basic Materials● Consumer Goods● Consumer Services● Financials● Health Care● Industrials● Oil & Gas● Technology● Telecommunications● Utilities
Source: FTSE Russell 10 of 30
-5.80
YTD(%)
1Y(%)
3.87
-1.69 2.78 0.79 13.61 17.27 3.11 5.29 1.03 1.04 -5.21
-14.06
4.06 6.82 -7.19
14.72 17.12 -2.00 23.89
-18.04 -6.18
1.52
4.26
5.06
1.45 3.43 4.79
-0.41 16.21
4.38
18.66 12.54 12.05
-1.38
1.67 0.54 6.82 -15.46
1.41
1.54 2.01 1.69
-1.23
-0.67
-49.87 -18.71
-13.68 -1.14
-0.11
-1.75
0.16
0.35 1.53
12.21
-6.59 -22.25 3.06
2.34 5.11
-8.50 -3.95 3.98 -9.18
0.26
1.24 7.58 6.29
19.29
2.75
-23.40
-3.29 -0.53 -1.11
3.05 -9.68
3.32
-4.55 -12.68 3.52 1.83 -46.28 0.93 -12.90 15.64
-2.55 2.86
-1.73 5.21 -0.58
FTSE ST All-Share Index
11.75 11.73 -0.81 5.35 -0.27
ANNUALISED PERFORMANCE
0.34 -1.20
3.25
1.05 -1.01
11.77
0.24
5Y(%pa)
2015(%)
2016(%)
Div Yield(%)
CUMULATIVE PERFORMANCE
1.40 -1.25 5.84 -13.39
-0.20
Index Name3Y
(%)5Y
(%)3Y
(%pa)
8.11 5.86
1M(%)
3M(%)
6M(%)
-6.72 3.78 -10.83
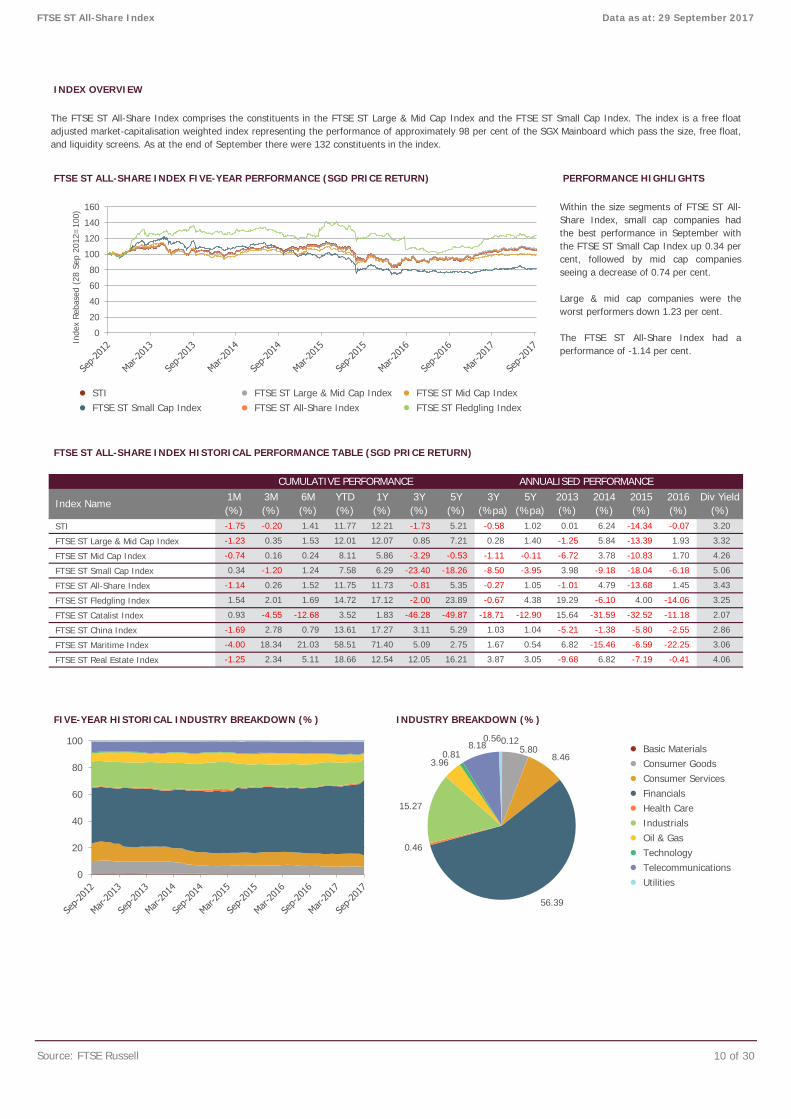
The FTSE ST All-Share Index comprises the constituents in the FTSE ST Large & Mid Cap Index and the FTSE ST Small Cap Index. The index is a free floatadjusted market-capitalisation weighted index representing the performance of approximately 98 per cent of the SGX Mainboard which pass the size, free float,and liquidity screens. As at the end of September there were 132 constituents in the index.
Within the size segments of FTSE ST All-Share Index, small cap companies hadthe best performance in September withthe FTSE ST Small Cap Index up 0.34 percent, followed by mid cap companiesseeing a decrease of 0.74 per cent.
Large & mid cap companies were theworst performers down 1.23 per cent.
The FTSE ST All-Share Index had aperformance of -1.14 per cent.
1.02 -0.07 3.20 6.24 -14.34
-0.74
0.85 7.21 0.28 1.93
2014(%)
2013(%)
Data as at: 29 September 2017
21.03 58.51 71.40 5.09
-6.10 4.00
-4.00 18.34
-1.25
1.70
0.01
-11.18 2.07
-18.26
12.01 12.07
-31.59 -32.52
0
20
40
60
80
100
120
140
160
Inde
x Re
base
d (2
8 Se
p 20
12=
100)
0
20
40
60
80
100 0.12 5.80
8.46
56.39
0.46
15.27
3.96 0.81
8.18 0.56
RELATIVE PERFORMANCE AGAINST FTSE ST ALL-SHARE INDEX (SGD PRICE RETURN)
1 MONTH 1 YEAR
FTSE ST INDEX SERIES PORTFOLIO CHARACTERISTICS
Number of Constituents
Full Market Cap (SGDm)
% FTSE ST All-Share Index
Totals
Net Market Cap (SGDm)
Dividend Yield (%)
Constituent Sizes (Net Market Cap SGDm)
Average
Largest
Smallest
Median
Weight of Largest Constituent (%)
Top 10 Holdings (% Index Market Cap)
Source: FTSE Russell 11 of 30
73,123
4.26
22,051
5.06
360,195
3.43
11,301
3.25
65
673,738
93.81
0.61
7.62
49.24
1,741
10.28
42.43
52.71
329
1,155
9
221 690
28.03
52
4,787
0.00
93,279
718,197
100.00
24,235
3.20
338,144
3.32
301
0.7
4,714
211211
Straits Times Index (STI)
30
570,981
79.50
2.86
361,233 896
Review Turnover -
26
315
1
2,073
11,389
100
March 2017
September 2017
8.23
0.60
3.71
4.31
288,649
14
FTSE ST All-Share Index Data as at: 29 September 2017
FTSE ST Catalist Index
FTSE ST Real Estate Index
FTSE ST Large & Mid Cap
Index
185
6.22
15.15
12.88
128,249
17.86
44,459
6.19
10,396
FTSE ST Mid Cap Index
FTSE ST Small Cap Index
FTSE ST All-Share Index
FTSE ST Fledgling Index
67
5.24
39.77
10.33
55.17
2.66
19.43
6.58
33.12
12.21
66.01
132 21942
29.31
15.84
45.16
12.82
23.33
36.15
1.29
6.45
-
45
156,648
21.81
9,622
37,200
1,498
5,689
5,202
37,200
2,391
12.89
68.85
11.00
58.77
2,729
37,200
9
4.93
2.02
4.41
6.43
-
2.07 2.68
1.48 0.40
-0.09 -0.61
-1.0 - 1.0 2.0 3.0
Relative Performance (%)
-0.78
0.61
-0.50
3.63
-0.82
1.56
0.35
-1.71
-1.90
-0.82
-4.0 -2.0 - 2.0 4.0
Relative Performance (%)
Basic Materials
Consumer Goods
Consumer Services
Financials
Health Care
Industrials
Oil & Gas
Technology
Telecommunication
Utilities
FTSE
ST
Indu
stry
Ind
ices
-14.99
-20.57
-24.80
5.40
0.98
-31.81
8.61
-15.98
-13.74
-3.32
-40.0 -20.0 - 20.0
Relative Performance (%)
Basic Materials
Consumer Goods
Consumer Services
Financials
Health Care
Industrials
Oil & Gas
Technology
Telecommunication
Utilities
FTSE
ST
Indu
stry
Ind
ices
-9.90 5.39
-5.44 -5.87
0.34 0.48
-15.0 -10.0 -5.0 - 5.0 10.0
Relative Performance (%)
FTSE
ST
Indi
ces
Large (STI)
Mid
Small
Fledgling
Catalist
Real Estate
Large & Mid
Large (STI)
Mid
Small
Fledgling
Catalist
Real Estate
FTSE
ST
Indi
ces Large & Mid
FTSE ST INDEX SERIES HISTORICAL VOLATILITY (SGD PRICE RETURN)
● STI● FTSE ST Large & Mid Cap Index● FTSE ST Mid Cap Index● FTSE ST Small Cap Index● FTSE ST All-Share Index● FTSE ST Fledgling Index● FTSE ST Real Estate Index
Index volatility is calculated on a rolling 180 days basis.
FTSE ST INDEX SERIES HISTORICAL VOLATILITY TABLE (SGD PRICE RETURN)
STIFTSE ST Large & Mid Cap IndexFTSE ST Mid Cap IndexFTSE ST Small Cap IndexFTSE ST All-Share IndexFTSE ST Fledgling IndexFTSE ST Catalist IndexFTSE ST Real Estate Index
* Based on annualised daily total log returns. ** Based on annualised weekly total log returns. *** Based on annualised monthly total log returns.
FTSE ST INDEX SERIES HISTORICAL SHARPE RATIO (SGD PRICE RETURN)
STIFTSE ST Large & Mid Cap IndexFTSE ST Mid Cap IndexFTSE ST Small Cap IndexFTSE ST All-Share IndexFTSE ST Fledgling IndexFTSE ST Catalist IndexFTSE ST Real Estate Index
* Based on annualised daily total log returns. ** Based on annualised weekly total log returns. *** Based on annualised monthly total log returns.Note: Singapore 3-Month interbank offered rate (SIBOR) is used as the risk free rate.
FTSE ST INDEX SERIES HISTORICAL CORRELATION AGAINST FTSE ST ALL-SHARE INDEX (SGD PRICE RETURN)
STIFTSE ST Large & Mid Cap IndexFTSE ST Mid Cap IndexFTSE ST Small Cap IndexFTSE ST Fledgling IndexFTSE ST Catalist IndexFTSE ST Real Estate Index
* Based on annualised daily total log returns. ** Based on annualised weekly total log returns. *** Based on annualised monthly total log returns.
Source: FTSE Russell 12 of 30
Index NameYTD(%)*
1Y(%)*
3Y(%)**
2015(%)*
Data as at: 29 September 2017
5Y(%)***
2013(%)*
2015(%)*
2016(%)*
Index Name
11.63 11.69
0.06
-1.33
0.4382 0.5620 0.6202
-0.03 0.67 -1.30 -0.06
-2.31 -0.86 0.37 0.09
2.00 1.35 -0.10 0.10 -0.13 0.56
8.39
7.39 7.66 11.76 10.40 9.90 7.86 11.76 12.35 6.05
11.49
15.76
6.43 7.34 10.23 10.45
12.13 12.43
12.54 7.59
-1.11
0.3113 0.3841 0.4873 0.5111
6.09
0.8810
-0.90 0.28 -1.01
12.44
9.61
11.39 7.32 11.49
6.73
14.61 6.12
8.35 8.50
1.78 1.27 -0.12 0.09
21.82 13.26 17.33
3.03
0.3700 0.4565 0.5431
2.47 -1.31
-0.13 0.31 1.52
16.30 19.77
0.8798 0.8669 0.8178 0.8671
12.41 6.69 10.95
7.80
FTSE ST All-Share Index
14.37
10.58
11.13 10.11 8.65 13.04
2014(%)*
12.31 13.85 12.65
11.16 12.28 12.48 7.56 12.82
0.09 1.60 0.80 -0.88 -0.33 0.29 -1.31 -1.60 -0.74 1.62 0.68 -0.20 -0.01 -0.58 0.51
YTD* 1Y* 3Y** 5Y*** 2016*2013* 2014* 2015*
1.97 1.35 -0.05 0.13 -0.15 0.67 -1.27 0.09
Index NameYTD(%)*
1Y(%)*
3Y(%)**
5Y(%)***
2013(%)*
0.8013 0.7727
2.92 1.32 0.25 0.26 -0.83 0.83 -0.67 -0.10
0.5170 0.5775 0.7669 0.8243 0.7237 0.7595
2014(%)*
2016(%)*
0.9898 0.9882
0.6850 0.7332 0.8986 0.8888 0.8299 0.8105 0.8673
0.9904 0.9898 0.9897 0.9849 0.9778 0.9922
-0.70 0.65 -2.89
0.4689 0.5315 0.5733 0.1589
0.9991 0.9991 0.9993 0.9990 0.9980 0.9990 0.9992 0.9996 0.8714
0.4641 0.3728
0.8755 0.7249 0.7460
7.66 7.90 11.97 10.43 9.98 8.03 11.87 12.66
0
5
10
15
20
25
Vola
tility
(%
)
FTSE ST ALL-SHARE INDEX TOP 5 AND BOTTOM 5 SECTOR PERFORMERS
FTSE ST ALL-SHARE INDEX TOP 10 CONSTITUENTS
FTSE ST ALL-SHARE INDEX TOP 5 AND BOTTOM 5 PERFORMERS
Source: FTSE Russell 13 of 30
Water
Travel & Tourism
152
4,254
74
211
U6C
5ER
U11Z74
China Everbright Water (S Chip)
ComfortDelGro
5SO
U9E
Local Code
D05O39
129
114
30,001
7 Jardine Strategic Holdings Diversified Industrials
CHZ
C52
Capitaland
3 United Overseas Bank Banks
-2.86
Index Weight (%)
Div Yield (%)
365
4,462
0.04
1.18
-0.09
0.02
0.06
2.49
Index Weight (%)
3
Net Market Cap (SGDm)
37,20036,453
2.66
1770 Mining 1 170 0.05 5.88
1.03 1.18
0570 Oil Equipment, Services & Distribution
ICB Code ICB Sector Number of Cons
3760
2730
Banks
1M Perf (%)
Electronic & Electrical Equipment 92.42 3.02
DBS Group Holdings Banks
16.68
-3.82
5,235 1.45 -5.75
0.97Constituent Name ICB Subsector
Oversea-Chinese Banking
Personal Goods 1 365
Net Market Cap (SGDm) Index Weight (%) 1M Perf (%) 1Y Perf (%)
0.10 12.71 73.86 3.38
Data as at: 29 September 2017FTSE ST All-Share Index
2.58
27,346
10.3310.128.337.59
95.65 3.70
4,686 1.30 11.45
0.07
6 13,818 3.84 2.54
-1.516 Hongkong Land Holdings Real Estate Holding & Development
-0.545 Jardine Matheson Holdings Diversified Industrials
10 11,699 3.25 0.55
60.93
5750 Travel & Leisure 6 17,338 4.81 -3.59 4.67
2750 Industrial Engineering 6 3,916 1.09
Rank
2 1
-2.21
- 198,726
9 Keppel Oil Equipment & Services-5.292.85
8 Global Logistic Properties Real Estate Holding & Development
4 Singapore Telecommunications Mobile Telecommunications-3.60J36
H78J37MC0BN4C31
17,78911,38910,6369,6439,2848,986
4.943.162.95
10
1.852.68
Aluminum -7.91
Sino Grandness Food Industry Group (S Chip Food Products 15.18
Cogent Holdings Ltd. Transportation Services
Local Code
24.20
Venture Corp Electronic Equipment 11.65
Best World International Personal Products 12.71
PACC Offshore Services Holdings Marine Transportation 13.33
0.04
0.04
0.03
0.10
1.24
0.07255
Constituent Name ICB Subsector 1M Perf (%)
V03
5EN
KJ9
T4B
55.17
Net Market Cap (SGDm)
140
4.36
-9.57
3.13
Food Producers
2.86
-9.17
Duty Free International Electronic Equipment
3.67
-12.18
3570
Aerospace & Defense 1
5330 Food & Drug Retailers 3 3,724
1750 Industrial Metals & Mining 1 255
HRnetGroup
-7.91 -13.91 2.53
2710
-3.32
6.50
2.20
TotalsReal Estate Holding & Development
Business Training & Employment Agencie -8.81
Midas Holdings (S Chip)
-9.52
TOP
BOTT
OM
TO
P BO
TTO
M
INDEX OVERVIEW
FTSE ST LARGE & MID CAP INDEX FIVE-YEAR PERFORMANCE (SGD PRICE RETURN) PERFORMANCE HIGHLIGHTS
● FTSE ST Large & Mid Cap Index ● FTSE ST All-Share Index
FTSE ST LARGE & MID CAP INDEX HISTORICAL PERFORMANCE TABLE (SGD PRICE RETURN)
FTSE ST Large & Mid Cap Index
FTSE ST All-Share Index
FTSE ST LARGE & MID CAP INDEX HISTORICAL REVIEW TURNOVER
FIVE-YEAR HISTORICAL INDUSTRY BREAKDOWN (%) INDUSTRY BREAKDOWN (%)
● Basic Materials● Consumer Goods● Consumer Services● Financials● Health Care● Industrials● Oil & Gas● Technology● Telecommunications● Utilities
Source: FTSE Russell 14 of 30
12.07 0.85
Review Month Number of Adds Number of Dels Number of Cons Net Market Cap (SGDm) Number of Cons Net Market Cap (SGDm) 2-Way Turnover (%)
0.60
September 2017 3
CUMULATIVE PERFORMANCE ANNUALISED PERFORMANCE
Index Name1M(%)
3M(%)
6M(%)
YTD(%)
1Y(%)
3Y(%)
5Y(%)
3Y(%pa)
5Y(%pa)
2013(%)
2014(%)
2015(%)
2016(%)
Div Yield(%)
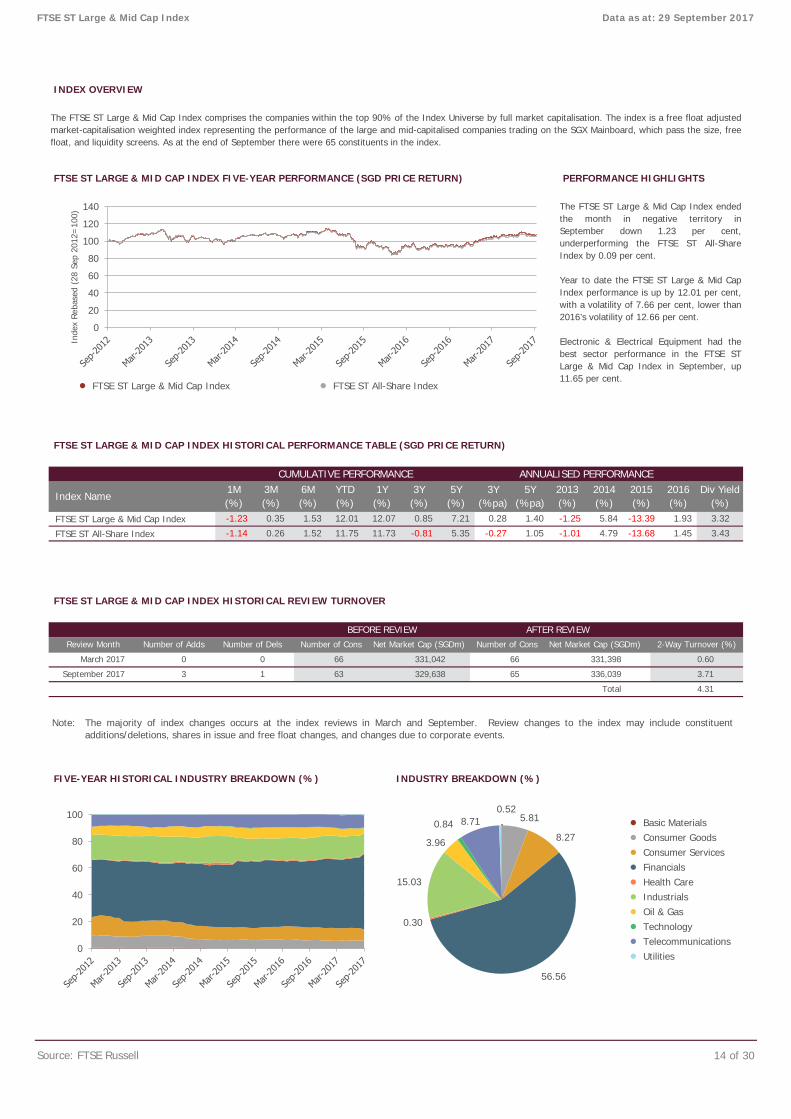
The FTSE ST Large & Mid Cap Index endedthe month in negative territory inSeptember down 1.23 per cent,underperforming the FTSE ST All-ShareIndex by 0.09 per cent.
Year to date the FTSE ST Large & Mid CapIndex performance is up by 12.01 per cent,with a volatility of 7.66 per cent, lower than2016’s volatility of 12.66 per cent.
Electronic & Electrical Equipment had thebest sector performance in the FTSE STLarge & Mid Cap Index in September, up11.65 per cent.
FTSE ST Large & Mid Cap Index Data as at: 29 September 2017
The FTSE ST Large & Mid Cap Index comprises the companies within the top 90% of the Index Universe by full market capitalisation. The index is a free float adjustedmarket-capitalisation weighted index representing the performance of the large and mid-capitalised companies trading on the SGX Mainboard, which pass the size, freefloat, and liquidity screens. As at the end of September there were 65 constituents in the index.
Total 4.31
March 2017 0
-1.23 0.35 1.53 12.01
3.43
BEFORE REVIEW AFTER REVIEW
0 66 331,042 66 331,398
0.28 1.40
-1.14 0.26 1.52 11.75 11.73 -0.81 5.35 -0.27 1.05
631
-1.25 5.84 -13.39 1.93 3.32
-1.01 4.79 -13.68 1.45
336,039329,638 3.7165
7.21
0
20
40
60
80
100
120
140
Inde
x Re
base
d (2
8 Se
p 20
12=
100)
0
20
40
60
80
100 5.81
8.27
56.56
0.30
15.03
3.96
0.84 8.71 0.52
The majority of index changes occurs at the index reviews in March and September. Review changes to the index may include constituent additions/deletions, shares in issue and free float changes, and changes due to corporate events.
Note:
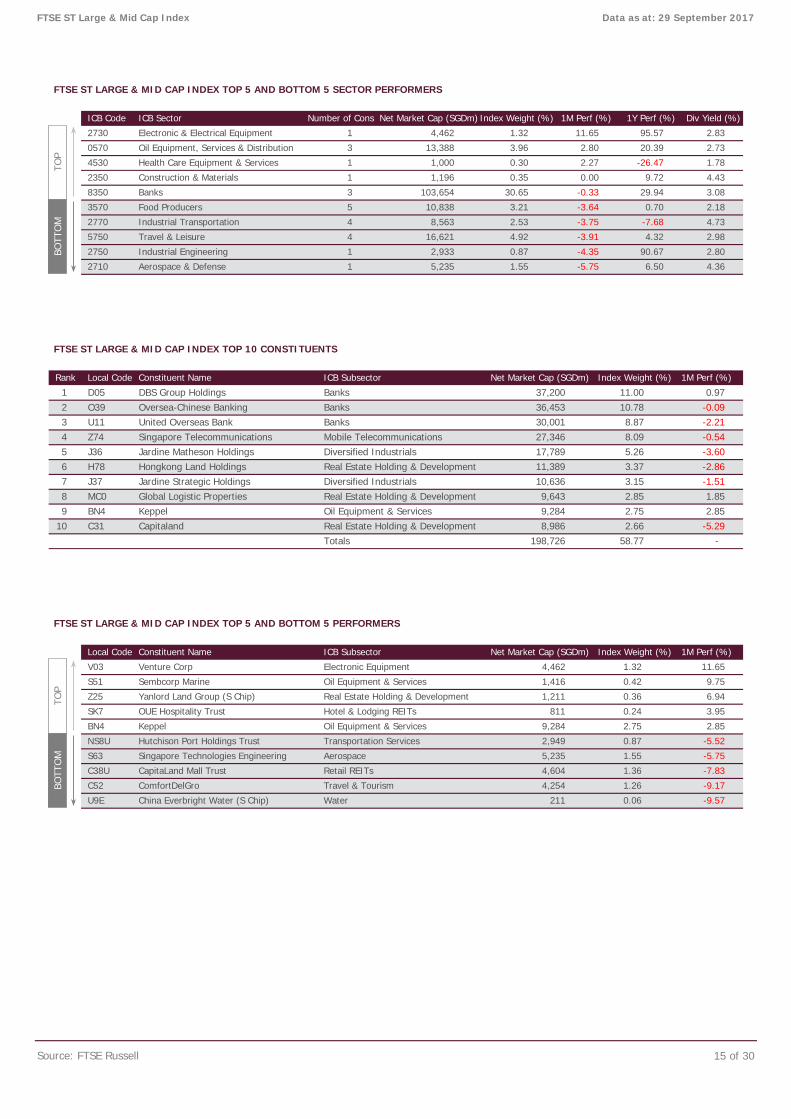
FTSE ST LARGE & MID CAP INDEX TOP 5 AND BOTTOM 5 SECTOR PERFORMERS
FTSE ST LARGE & MID CAP INDEX TOP 10 CONSTITUENTS
FTSE ST LARGE & MID CAP INDEX TOP 5 AND BOTTOM 5 PERFORMERS
Source: FTSE Russell 15 of 30
C52 ComfortDelGro Travel & Tourism 4,254 1.26 -9.17
U9E China Everbright Water (S Chip) Water 211 0.06 -9.57
Keppel Oil Equipment & Services 9,284 2.75 2.85
S63 Singapore Technologies Engineering Aerospace 5,235 1.55 -5.75
C38U CapitaLand Mall Trust Retail REITs 4,604 1.36 -7.83
NS8U Hutchison Port Holdings Trust Transportation Services
Z25 Yanlord Land Group (S Chip) Real Estate Holding & Development 1,211 0.36 6.94
SK7 OUE Hospitality Trust Hotel & Lodging REITs 811 0.24
S51 Sembcorp Marine Oil Equipment & Services 1,416 0.42 9.75
2,949 0.87 -5.52
3.95
BN4
2.53 -3.75 -7.68 4.73
5750 Travel & Leisure
V03 Venture Corp Electronic Equipment
10 C31 Capitaland Real Estate Holding & Development 8,986 2.66 -5.29Totals 198,726 58.77 -
Constituent Name ICB Subsector Net Market Cap (SGDm) Index Weight (%) 1M Perf (%)Local Code
7 J37 Jardine Strategic Holdings Diversified Industrials 10,636 3.15 -1.518 MC0 Global Logistic Properties Real Estate Holding & Development 9,643 2.85 1.859 BN4 Keppel Oil Equipment & Services 9,284 2.75 2.85
4 Z74 Singapore Telecommunications Mobile Telecommunications 27,346 8.09 -0.545 J36 Jardine Matheson Holdings Diversified Industrials 17,789 5.26 -3.606 H78 Hongkong Land Holdings Real Estate Holding & Development 11,389 3.37 -2.86
2 O39 Oversea-Chinese Banking Banks 36,453 10.78 -0.093 U11 United Overseas Bank Banks 30,001 8.87 -2.21
2750 Industrial Engineering 1 2,933 0.87 -4.35 90.67 2.80
2710 Aerospace & Defense 1 5,235 1.55
1 D05 DBS Group Holdings Banks 37,200 0.97
9.72 4.43
8350 Banks 3 103,654 30.65 -0.33 29.94 3.08
-5.75 6.50 4.36
Rank Local Code Constituent Name ICB Subsector Net Market Cap (SGDm) Index Weight (%) 1M Perf (%)
3570
2770 Industrial Transportation 4 8,563
2.98
95.57 2.83
0570 3 13,388 3.96 2.80 20.39 2.73
Div Yield (%)
2730 Electronic & Electrical Equipment 1 4,462 1.32
2.27 -26.47 1.78
Construction & Materials 1 1,196 0.35
4.32
4530 Health Care Equipment & Services 1 1,000 0.30
11.00
FTSE ST Large & Mid Cap Index
0.00
11.65
2350
Data as at: 29 September 2017
ICB Code ICB Sector Number of Cons Net Market Cap (SGDm) Index Weight (%) 1M Perf (%) 1Y Perf (%)
Food Producers 5 10,838 3.21 -3.64 0.70 2.18
4 16,621 4.92 -3.91
4,462 1.32 11.65
Oil Equipment, Services & Distribution
TOP
BOTT
OM
TO
P BO
TTO
M
INDEX OVERVIEW
FTSE ST MID CAP INDEX FIVE-YEAR PERFORMANCE (SGD PRICE RETURN) PERFORMANCE HIGHLIGHTS
● FTSE ST Mid Cap Index ● FTSE ST All-Share Index
FTSE ST MID CAP INDEX HISTORICAL PERFORMANCE TABLE (SGD PRICE RETURN)
FTSE ST Mid Cap Index
FTSE ST All-Share Index
FTSE ST MID CAP INDEX HISTORICAL REVIEW TURNOVER
FIVE-YEAR HISTORICAL INDUSTRY BREAKDOWN (%) INDUSTRY BREAKDOWN (%)
● Basic Materials● Consumer Goods● Consumer Services● Financials● Health Care● Industrials● Oil & Gas● Technology● Telecommunications● Utilities
Source: FTSE Russell 16 of 30
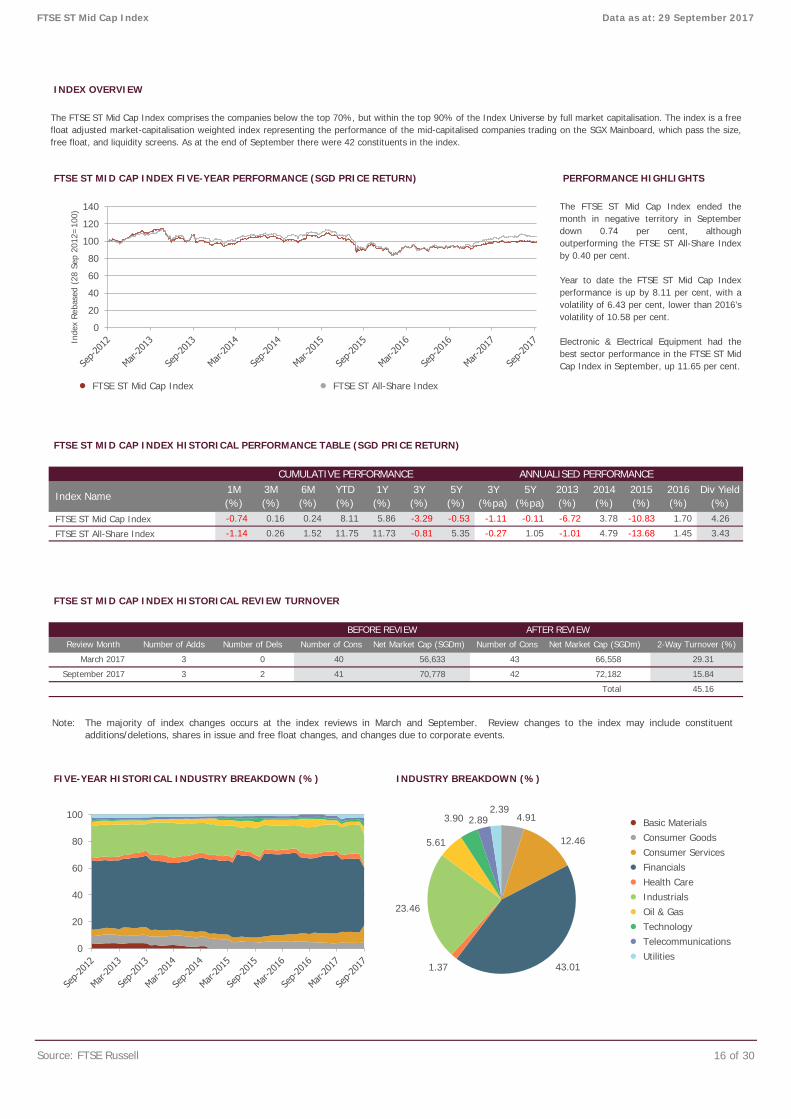
The FTSE ST Mid Cap Index ended themonth in negative territory in Septemberdown 0.74 per cent, althoughoutperforming the FTSE ST All-Share Indexby 0.40 per cent.
Year to date the FTSE ST Mid Cap Indexperformance is up by 8.11 per cent, with avolatility of 6.43 per cent, lower than 2016’svolatility of 10.58 per cent.
Electronic & Electrical Equipment had thebest sector performance in the FTSE ST MidCap Index in September, up 11.65 per cent.
2-Way Turnover (%)
AFTER REVIEW
5.35 -0.27 1.05
72,182
3.43
Review Month Number of Adds
-1.01
3
-0.81
Total 45.16
Net Market Cap (SGDm)
15.84
Number of Dels Number of Cons Net Market Cap (SGDm) Number of Cons
56,633 43 66,558
5Y(%)
-6.72 3.78 -10.83 1.70 -0.53 -1.11
2016(%)
4.26
4.79 -13.68 1.45
6M(%)
YTD(%)
1Y(%)
3Y(%)
3Y(%pa)
5Y(%pa)
2013(%)
2014(%)
2015(%)
Div Yield(%)
1M(%)
BEFORE REVIEW
2 41 70,778
-1.14 0.26 1.52 11.75 11.73
42
The FTSE ST Mid Cap Index comprises the companies below the top 70%, but within the top 90% of the Index Universe by full market capitalisation. The index is a freefloat adjusted market-capitalisation weighted index representing the performance of the mid-capitalised companies trading on the SGX Mainboard, which pass the size,free float, and liquidity screens. As at the end of September there were 42 constituents in the index.
0.16 0.24 8.11 5.86 -0.74 -0.11
ANNUALISED PERFORMANCE3M(%)
Index Name
-3.29
CUMULATIVE PERFORMANCE
March 2017 3 0 40
September 2017
29.31
FTSE ST Mid Cap Index Data as at: 29 September 2017
0
20
40
60
80
100
120
140
Inde
x Re
base
d (2
8 Se
p 20
12=
100)
0
20
40
60
80
100 4.91
12.46
43.01 1.37
23.46
5.61
3.90 2.89 2.39
The majority of index changes occurs at the index reviews in March and September. Review changes to the index may include constituent additions/deletions, shares in issue and free float changes, and changes due to corporate events.
Note:
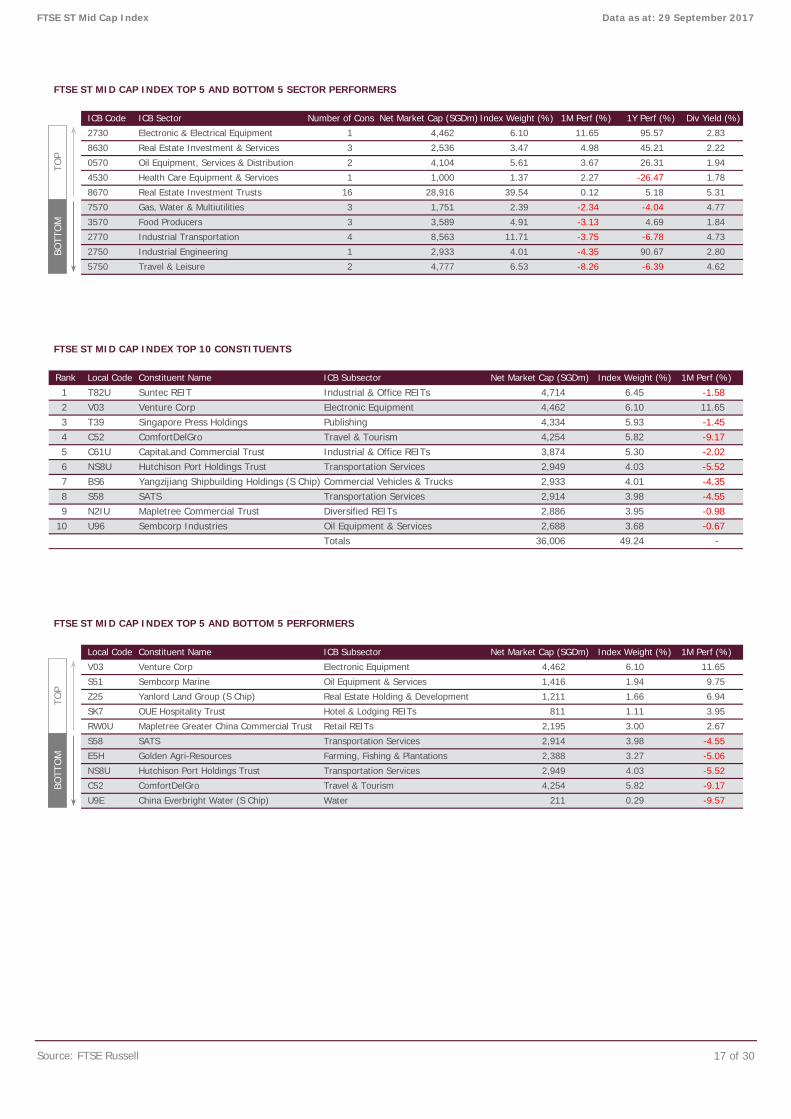
FTSE ST MID CAP INDEX TOP 5 AND BOTTOM 5 SECTOR PERFORMERS
FTSE ST MID CAP INDEX TOP 10 CONSTITUENTS
FTSE ST MID CAP INDEX TOP 5 AND BOTTOM 5 PERFORMERS
Source: FTSE Russell 17 of 30
1.84
Venture Corp 6.10
2,914 -4.55
-1.58
4.77
Diversified REITs
3.95
-4.35
-0.98
Singapore Press Holdings Publishing 4,334
-4.04
Real Estate Holding & Development
2,933
Transportation Services 2,949 4.03 -5.52
Oil Equipment & Services 2,688
Index Weight (%)
2.67
1,211
3.98
1.66
5.93Electronic Equipment 4,462
-5.52
-6.39
-1.45
1 2,933
Gas, Water & Multiutilities 3
2,195
4530
6
NS8U
3.00
Water
1.94
Golden Agri-Resources
OUE Hospitality Trust
V03 Venture Corp Electronic Equipment 4,462
5.82
0.29 -9.57
S58N2IU
7570 1,751
Suntec REIT
Transportation Services 2,914 3.98 -4.55
E5H
Sembcorp Marine Oil Equipment & Services 1,416S51
Z25
SATS
-9.17
Retail REITs
4,254 5.82
Hutchison Port Holdings Trust
Hotel & Lodging REITs
28,916 39.54 0.12 5.18
China Everbright Water (S Chip) 211
ComfortDelGro Travel & Tourism
Mapletree Greater China Commercial Trust
3.27 -5.06
C52
U9E
6.94
811 1.11
Sembcorp Industries
4.01
6.10
2.39
2
Constituent Name ICB Subsector
2,949 4.03
Index Weight (%)
11.71
4 ComfortDelGro Travel & Tourism
Transportation Services
4,714
U96
Local Code
3.68
-9.17
NS8UBS6
-
2770
6.45
C61U
-26.47
4.62
1M Perf (%)
CapitaLand Commercial Trust Industrial & Office REITs 3,874 5.30 -2.02
11.65
Index Weight (%) 1M Perf (%)
1.37
Industrial Transportation 4 8,563
Industrial & Office REITs
4,104
-2.34
11.65
1M Perf (%)
Local Code
3.95
Totals 36,006-0.67
8
10
Yangzijiang Shipbuilding Holdings (S Chip) Commercial Vehicles & Trucks
Mapletree Commercial Trust 2,886
7
9
Hutchison Port Holdings Trust Transportation Services
1
5
11.65T82UV03T39C52 4,254
3
Constituent Name ICB Subsector Net Market Cap (SGDm)
SATS
3570 Food Producers 3 3,589 4.91 -3.13
2.27
8670 Real Estate Investment Trusts 16 5.31
2.83
ICB Code ICB Sector
5.61 3.67 26.31
8630
1,000
0570 Oil Equipment, Services & Distribution
Data as at: 29 September 2017
Div Yield (%)
2
2.22
Number of Cons Net Market Cap (SGDm)
FTSE ST Mid Cap Index
1 1.78
1 4,462
Real Estate Investment & Services
6.10
45.21
4.69
Net Market Cap (SGDm)
49.24
Farming, Fishing & Plantations 2,388
S58
SK7
RW0U
9.75
Yanlord Land Group (S Chip)
4.01 -4.35 90.67 2.80
1.94
4.73
2750 Industrial Engineering
Health Care Equipment & Services
95.57
-3.75 -6.78
5750 Travel & Leisure 2 4,777 6.53 -8.26
Rank
1Y Perf (%)
3 2,536 3.47 4.98
2730 Electronic & Electrical Equipment
TOP
BOTT
OM
TO
P BO
TTO
M
INDEX OVERVIEW
FTSE ST SMALL CAP INDEX FIVE-YEAR PERFORMANCE (SGD PRICE RETURN) PERFORMANCE HIGHLIGHTS
● FTSE ST Small Cap Index ● FTSE ST All-Share Index
FTSE ST SMALL CAP INDEX HISTORICAL PERFORMANCE TABLE (SGD PRICE RETURN)
FTSE ST Small Cap Index
FTSE ST All-Share Index
FTSE ST SMALL CAP INDEX HISTORICAL REVIEW TURNOVER
FIVE-YEAR HISTORICAL INDUSTRY BREAKDOWN (%) INDUSTRY BREAKDOWN (%)
● Basic Materials● Consumer Goods● Consumer Services● Financials● Health Care● Industrials● Oil & Gas● Technology● Telecommunications● Utilities
Source: FTSE Russell 18 of 30
CUMULATIVE PERFORMANCE
Data as at: 29 September 2017
1.45
March 2017
2-Way Turnover (%)
Div Yield(%)
1Y(%)
3Y(%)
5Y(%)
3Y(%pa)
2013(%)
-18.26 1.24
Number of Cons Net Market Cap (SGDm)
BEFORE REVIEW AFTER REVIEW
Number of Cons
6
Net Market Cap (SGDm)
64 19,735
Total 36.15
61
3.43
6.29 -23.40
21,681 23.33
9
Number of DelsReview Month
-1.20 7.58 -6.18
Number of Adds
6M(%)
YTD(%)
FTSE ST Small Cap Index
Index Name1M(%)
2014(%)
-1.14 0.26
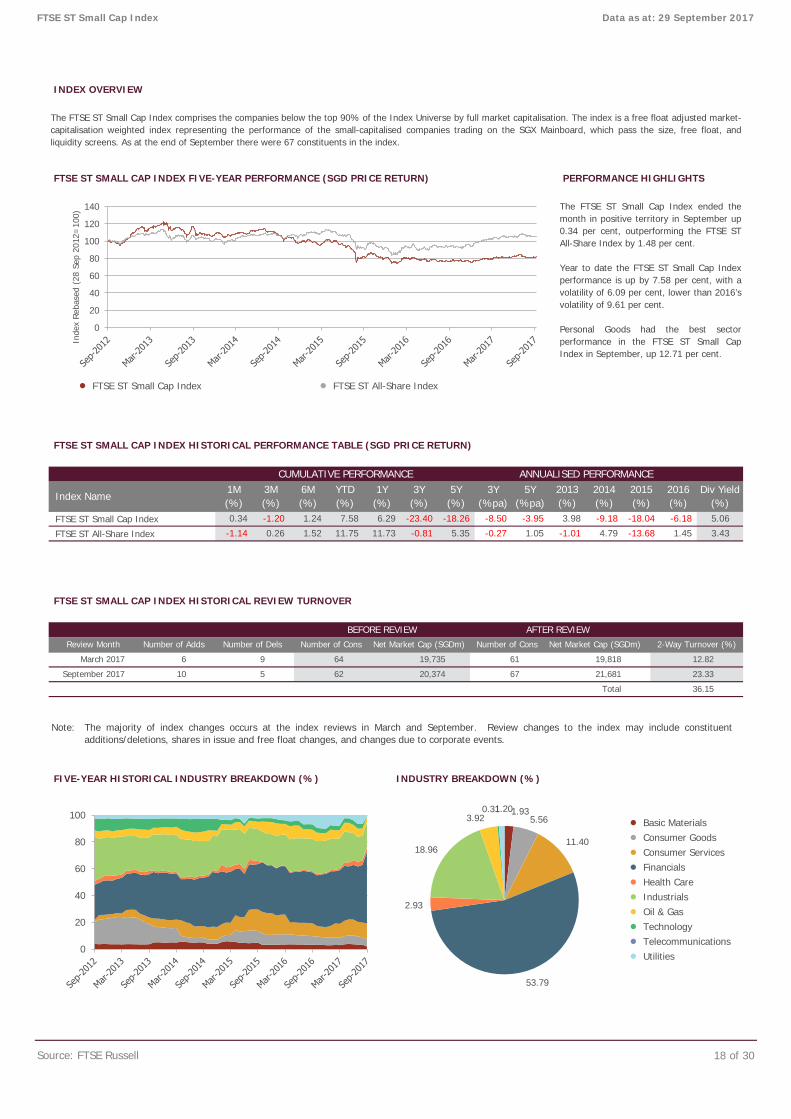
The FTSE ST Small Cap Index comprises the companies below the top 90% of the Index Universe by full market capitalisation. The index is a free float adjusted market-capitalisation weighted index representing the performance of the small-capitalised companies trading on the SGX Mainboard, which pass the size, free float, andliquidity screens. As at the end of September there were 67 constituents in the index.
ANNUALISED PERFORMANCE3M(%)
0.34
1.52 11.75 11.73
5.06 -8.50 -3.95 3.98 -9.18
2015(%)
2016(%)
-18.04
-0.81 5.35 -0.27 1.05 -1.01 4.79 -13.68
5Y(%pa)
67September 2017 10 5 62 20,374
19,818 12.82
The FTSE ST Small Cap Index ended themonth in positive territory in September up0.34 per cent, outperforming the FTSE STAll-Share Index by 1.48 per cent.
Year to date the FTSE ST Small Cap Indexperformance is up by 7.58 per cent, with avolatility of 6.09 per cent, lower than 2016’svolatility of 9.61 per cent.
Personal Goods had the best sectorperformance in the FTSE ST Small CapIndex in September, up 12.71 per cent.
0
20
40
60
80
100
120
140
Inde
x Re
base
d (2
8 Se
p 20
12=
100)
0
20
40
60
80
100 1.93 5.56
11.40
53.79
2.93
18.96
3.92 0.31 1.20
The majority of index changes occurs at the index reviews in March and September. Review changes to the index may include constituent additions/deletions, shares in issue and free float changes, and changes due to corporate events.
Note:
FTSE ST SMALL CAP INDEX TOP 5 AND BOTTOM 5 SECTOR PERFORMERS
FTSE ST SMALL CAP INDEX TOP 10 CONSTITUENTS
FTSE ST SMALL CAP INDEX TOP 5 AND BOTTOM 5 PERFORMERS
Source: FTSE Russell 19 of 30
ICB Subsector
255
S6NU
ND8US7OUJ91U
Local Code Index Weight (%)
KJ9
T4B
U6C
5ER
A50
BIP
F83
5SO
0.66
Aluminum
Net Market Cap (SGDm)
D5IUK2LU
Q1P
Trucking 100
Totals 8,770
FTSE ST Small Cap Index
1.16
0.33
2.36
5
39.77 - 10
Constituent Name
Data as at: 29 September 2017
0.61 6.49
Net Market Cap (SGDm) Index Weight (%) 1M Perf (%)
12.71
134
3760 Personal Goods 1 365 1.66 73.86 3.38
ICB Code ICB Sector
5370 General Retailers 3 401 1.82 6.99
Div Yield (%)1Y Perf (%)
3.65 3.83
Number of Cons
-3.72 5.90 1.99
1770 Mining 1
39.02
Electronic & Electrical Equipment 2 224 1.02 -3.51 - 6.66
-38.36 0.24
3.70
2770
3.68
4.29 5.44 14.96 1.70
Oil Equipment, Services & Distribution 3 430 1.95 -4.93
8630 Real Estate Investment & Services 3 521
Industrial Transportation 5
Specialty REITs 896 4.06
0570
1,119 5.07
2730
170 0.77 5.88 95.65
Local Code Index Weight (%)
BTOUBUOUAJBU
1 255 1.16 -7.91
Health Care Equipment & Services 3 645 2.93 -3.18
Industrial & Office REITs 1,155 5.24 2.56Frasers Logistics & Industrial Trust
2.53Industrial Metals & Mining -13.91
8770 Financial Services 1
4530
-9.51
6 Cache Logistics Trust Industrial & Office REITs 848
Rank Constituent Name ICB Subsector Net Market Cap (SGDm)
2
Lippo Malls Indonesia Retail Trust Retail REITs 853 3.873.84 -0.90
1
3 Keppel DC REIT
1M Perf (%)
1750
3.11
1.40
946
Manulife US REITIndustrial & Office REITs -0.47
9 ESR-REIT Industrial & Office REITs 724 3.28Ascendas Hospitality Trust Hotel & Lodging REITs 692 3.14
0.00
4 Croesus Retail Trust Retail REITs 885
0.00
Frasers Commercial Trust Industrial & Office REITs 805 3.65
-1.15
-1.088 Asian Pay Television Trust Broadcasting & Entertainment 794 3.60 0.007
4.01 0.87
1M Perf (%)
Cogent Holdings Ltd. Transportation Services 140 0.63 24.20
-7.91
HRnetGroup Business Training & Employment Agencie 152 0.69
Sino Grandness Food Industry Group (S Chip Food Products 129 0.59 15.18
PACC Offshore Services Holdings Marine Transportation 114 0.52 13.33
Best World International Personal Products 365 1.66 12.71
Rowsley Gambling 146 11.30
Vibrant Group -6.25
COSCO Shipping International (Singapore) (S Commercial Vehicles & Trucks 276 1.25 -6.56
-8.81
Midas Holdings (S Chip)5EN
CHZ
Duty Free International Electronic Equipment 74 -9.52
0.45
TOP
BOTT
OM
TO
P BO
TTO
M
INDEX OVERVIEW
FTSE ST FLEDGLING INDEX FIVE-YEAR PERFORMANCE (SGD PRICE RETURN) PERFORMANCE HIGHLIGHTS
● FTSE ST Fledgling Index ● FTSE ST All-Share Index
FTSE ST FLEDGLING INDEX HISTORICAL PERFORMANCE TABLE (SGD PRICE RETURN)
FTSE ST Fledgling Index
FTSE ST All-Share Index
FTSE ST FLEDGLING INDEX HISTORICAL REVIEW TURNOVER
FIVE-YEAR HISTORICAL INDUSTRY BREAKDOWN (%) INDUSTRY BREAKDOWN (%)
● Basic Materials● Consumer Goods● Consumer Services● Financials● Health Care● Industrials● Oil & Gas● Technology● Telecommunications● Utilities
Source: FTSE Russell 20 of 30
11.75 11.73
2-Way Turnover (%)
3M(%)
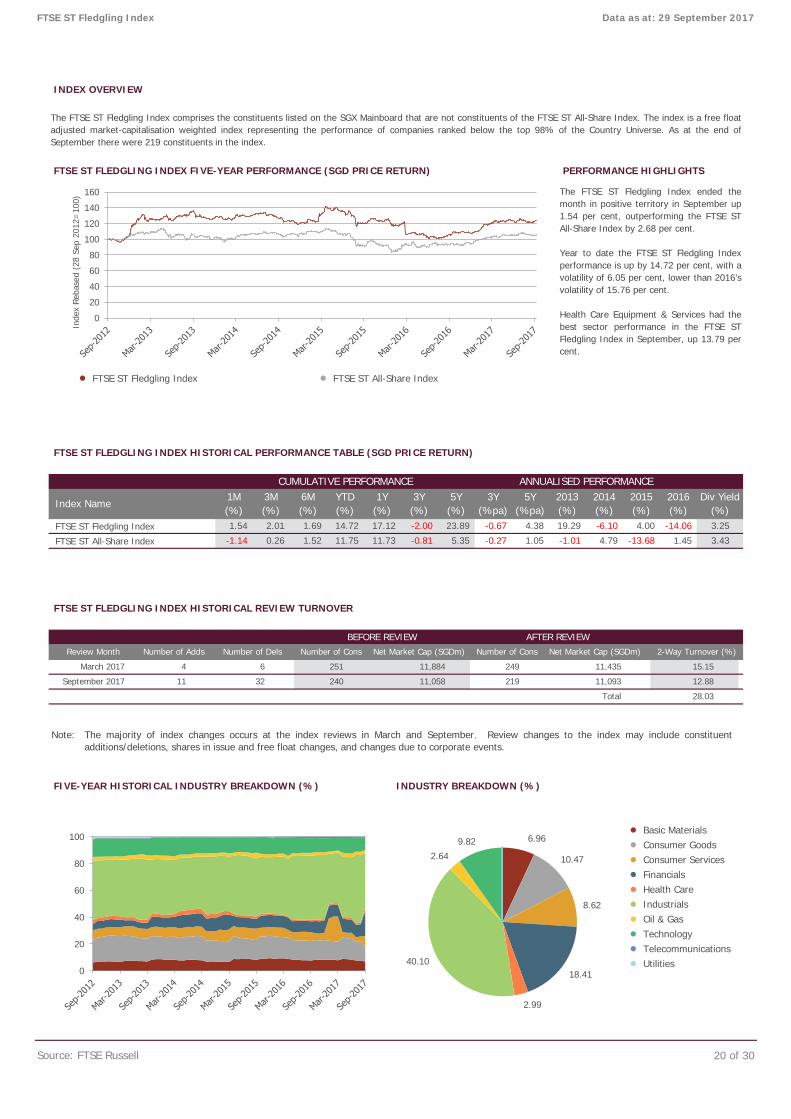
The FTSE ST Fledgling Index comprises the constituents listed on the SGX Mainboard that are not constituents of the FTSE ST All-Share Index. The index is a free floatadjusted market-capitalisation weighted index representing the performance of companies ranked below the top 98% of the Country Universe. As at the end ofSeptember there were 219 constituents in the index.
5Y(%)
3Y(%pa)
5Y(%pa)
2013(%)
2014(%)
Data as at: 29 September 2017FTSE ST Fledgling Index
2015(%)
2016(%)
3Y(%)
CUMULATIVE PERFORMANCE
Index Name1M(%)
-0.81 5.35 -0.27 1.05 -1.01 4.79 -13.68 1.45 3.43
1.69 14.72
The FTSE ST Fledgling Index ended themonth in positive territory in September up1.54 per cent, outperforming the FTSE STAll-Share Index by 2.68 per cent.
Year to date the FTSE ST Fledgling Indexperformance is up by 14.72 per cent, with avolatility of 6.05 per cent, lower than 2016’svolatility of 15.76 per cent.
Health Care Equipment & Services had thebest sector performance in the FTSE STFledgling Index in September, up 13.79 percent.
1.54 2.01 17.12 23.89
6M(%)
YTD(%)
1Y(%)
Div Yield(%)
-2.00 -0.67 4.38 19.29 -6.10 -14.06 3.25 4.00
BEFORE REVIEW AFTER REVIEW
ANNUALISED PERFORMANCE
Number of Dels Number of Cons Net Market Cap (SGDm) Number of Cons
11,093 12.88
15.15
Net Market Cap (SGDm)
March 2017 4 6 251 11,884 249 11,435
Review Month Number of Adds
Total 28.03
September 2017
-1.14 0.26 1.52
11 32 240 11,058 219
0
20
40
60
80
100
120
140
160
Inde
x Re
base
d (2
8 Se
p 20
12=
100)
0
20
40
60
80
100 6.96
10.47
8.62
18.41
2.99
40.10
2.64
9.82
The majority of index changes occurs at the index reviews in March and September. Review changes to the index may include constituent additions/deletions, shares in issue and free float changes, and changes due to corporate events.
Note:
FTSE ST FLEDGLING INDEX TOP 5 AND BOTTOM 5 SECTOR PERFORMERS
FTSE ST FLEDGLING INDEX TOP 10 CONSTITUENTS
FTSE ST FLEDGLING INDEX TOP 5 AND BOTTOM 5 PERFORMERS
Source: FTSE Russell 21 of 30
P01BMGUNR7T03S49
Div Yield (%)
Index Weight (%)
1Y Perf (%)
10.56 2.01
0570 Oil Equipment, Services & Distribution 8 299 2.64 7.69
1.48
6.03
ICB Code ICB Sector Number of Cons Net Market Cap (SGDm) Index Weight (%) 1M Perf (%)
13.10
4530 Health Care Equipment & Services 1 43 0.38 13.79 70.67
FTSE ST Fledgling Index Data as at: 29 September 2017
1.85
2720 General Industrials 6 103 0.91 -4.51
69.69 0.97
45.47 4.27
17.30 8.46
3570 Food Producers 11 469 4.15 5.71
Pharmaceuticals & Biotechnology
Local CodeRank Constituent Name ICB Subsector Net Market Cap (SGDm)
575 5.09
29.63
5370 General Retailers 10
2750 Industrial Engineering 26 1,144 10.13 5.28
9530 Software & Computer Services 6 188 1.67 -5.63
3530 Beverages 2 151 1.34 -4.02
20.82
2.66 -1.992
2 295 2.61 -4.23 42.19 3.11
0.00
Tianjin Zhongxin Pharmaceutical Group Pharmaceuticals 293 2.60 -4.451 Sunningdale Tech Industrial Machinery 301BHQ
T14
1M Perf (%)
Leisure Goods 2 73 0.65 -7.03 -43.83
-29.32 6.24
3740
4570
3 Poh Tiong Choon Transportation Services 273 2.42
1.47
0.008 Sing Investments & Finance Mortgage Finance9 MYP Transportation Services 166
-0.77
0.69
4 BHG Retail REIT Retail REITs 230 2.03 -0.675 Raffles Education Corp Specialized Consumer Services 208 1.84 47.966 Tat Hong Holdings Commercial Vehicles & Trucks 199
10 Abr Holdings Food Products 164 1.45Totals 2,196 19.43
1.76 26.39
S35F86533
Constituent Name ICB Subsector Net Market Cap (SGDm) 1M Perf (%)
15.49-
171 1.52 1.327 Singapore Reinsurance Reinsurance 191 1.69
Local Code Index Weight (%)
Falcon Energy Group Oil Equipment & Services 18.37 0.16 100.00
Raffles Education Corp Specialized Consumer Services 208.23 1.84 47.96
Courage Marine Group Marine Transportation 39.12 0.35 40.63
5FL
NR7
ATL
Gaylin Holdings Oil Equipment & Services 16.38 0.14 37.50
Raffles United Holdings Industrial Machinery 10.88 0.10 31.25
XMH Holdings Commercial Vehicles & Trucks 5.68 0.05 -16.67
RF7
K22
BQF
Intraco Diversified Industrials 15.02 0.13 -18.75
-26.88
Sakae Holdings Restaurants & Bars 10.51 0.09 -21.43
SunVic Chemical Holdings Commodity Chemicals 13.68 0.12
Jaya Holdings Commercial Vehicles & Trucks 0.74 0.01 -50.00
I06
5DO
A7S
BJE
TOP
BOTT
OM
TO
P BO
TTO
M
INDEX OVERVIEW
FTSE ST CATALIST INDEX THREE-YEAR PERFORMANCE (SGD PRICE RETURN) PERFORMANCE HIGHLIGHTS
● FTSE ST Catalist Index ● FTSE ST All-Share Index
FTSE ST CATALIST INDEX HISTORICAL PERFORMANCE TABLE (SGD PRICE RETURN)
FTSE ST Catalist Index
FTSE ST All-Share Index
FTSE ST CATALIST INDEX HISTORICAL REVIEW TURNOVER
Source: FTSE Russell 22 of 30
2015(%)
2-Way Turnover (%)
42.43
10.28
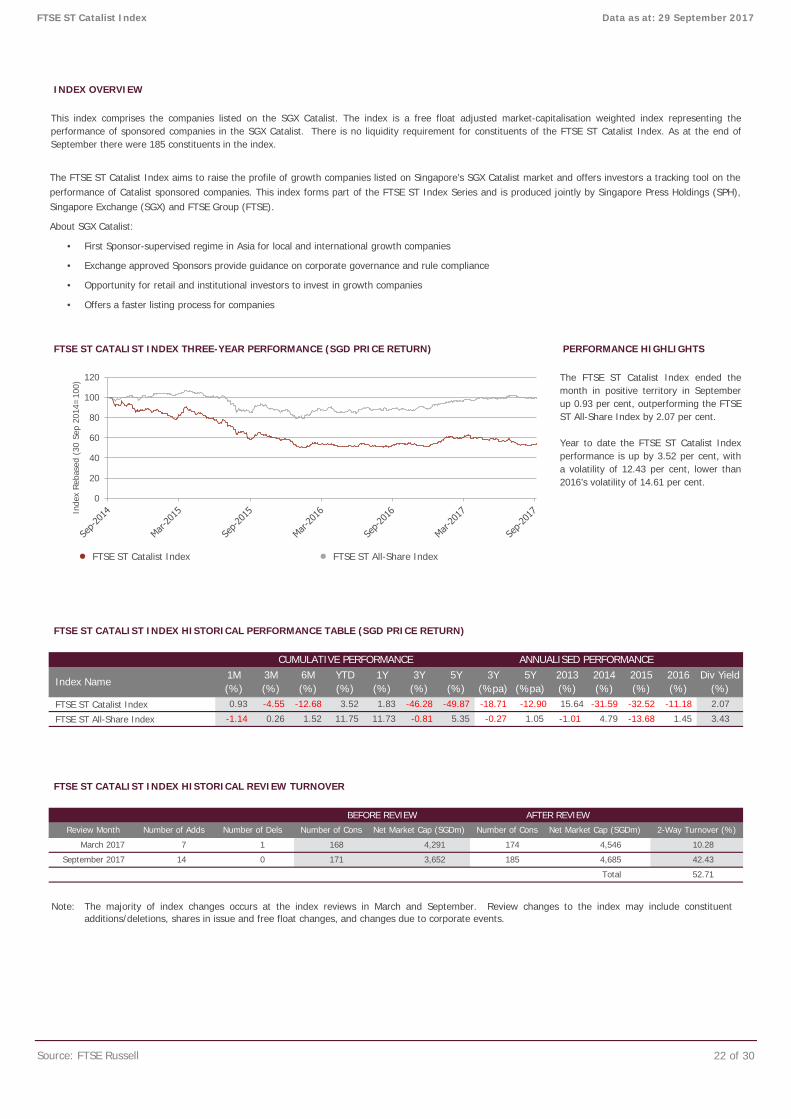
The FTSE ST Catalist Index ended themonth in positive territory in Septemberup 0.93 per cent, outperforming the FTSEST All-Share Index by 2.07 per cent.
Year to date the FTSE ST Catalist Indexperformance is up by 3.52 per cent, witha volatility of 12.43 per cent, lower than2016’s volatility of 14.61 per cent.
1M(%)
3M(%)
6M(%)
YTD(%)
1Y(%)
3Y(%)
14 0 171 3,652
-1.14 0.26 1.52 11.75 11.73
2013(%)
2014(%)
5Y(%)
Net Market Cap (SGDm) Number of Dels Number of Cons Net Market Cap (SGDm) Number of Cons
7 1 168 4,291 174 4,546
This index comprises the companies listed on the SGX Catalist. The index is a free float adjusted market-capitalisation weighted index representing theperformance of sponsored companies in the SGX Catalist. There is no liquidity requirement for constituents of the FTSE ST Catalist Index. As at the end ofSeptember there were 185 constituents in the index.
FTSE ST Catalist Index Data as at: 29 September 2017
CUMULATIVE PERFORMANCE ANNUALISED PERFORMANCE
Index Name
0.93
Review Month Number of Adds
Total 52.71
September 2017
2016(%)
Div Yield(%)
AFTER REVIEW
-0.81 5.35 -0.27 1.05 -1.01 4.79 -13.68
3Y(%pa)
5Y(%pa)
1.45 3.43
BEFORE REVIEW
March 2017
185 4,685
-12.68 3.52 1.83 -46.28 2.07 -4.55 -49.87 -18.71 -12.90 15.64 -31.59 -32.52 -11.18
0
20
40
60
80
100
120
Inde
x Re
base
d (3
0 Se
p 20
14=
100)
The FTSE ST Catalist Index aims to raise the profile of growth companies listed on Singapore’s SGX Catalist market and offers investors a tracking tool on the performance of Catalist sponsored companies. This index forms part of the FTSE ST Index Series and is produced jointly by Singapore Press Holdings (SPH), Singapore Exchange (SGX) and FTSE Group (FTSE).
About SGX Catalist:
• First Sponsor-supervised regime in Asia for local and international growth companies
• Exchange approved Sponsors provide guidance on corporate governance and rule compliance
• Opportunity for retail and institutional investors to invest in growth companies
• Offers a faster listing process for companies
The majority of index changes occurs at the index reviews in March and September. Review changes to the index may include constituent additions/deletions, shares in issue and free float changes, and changes due to corporate events.
Note:
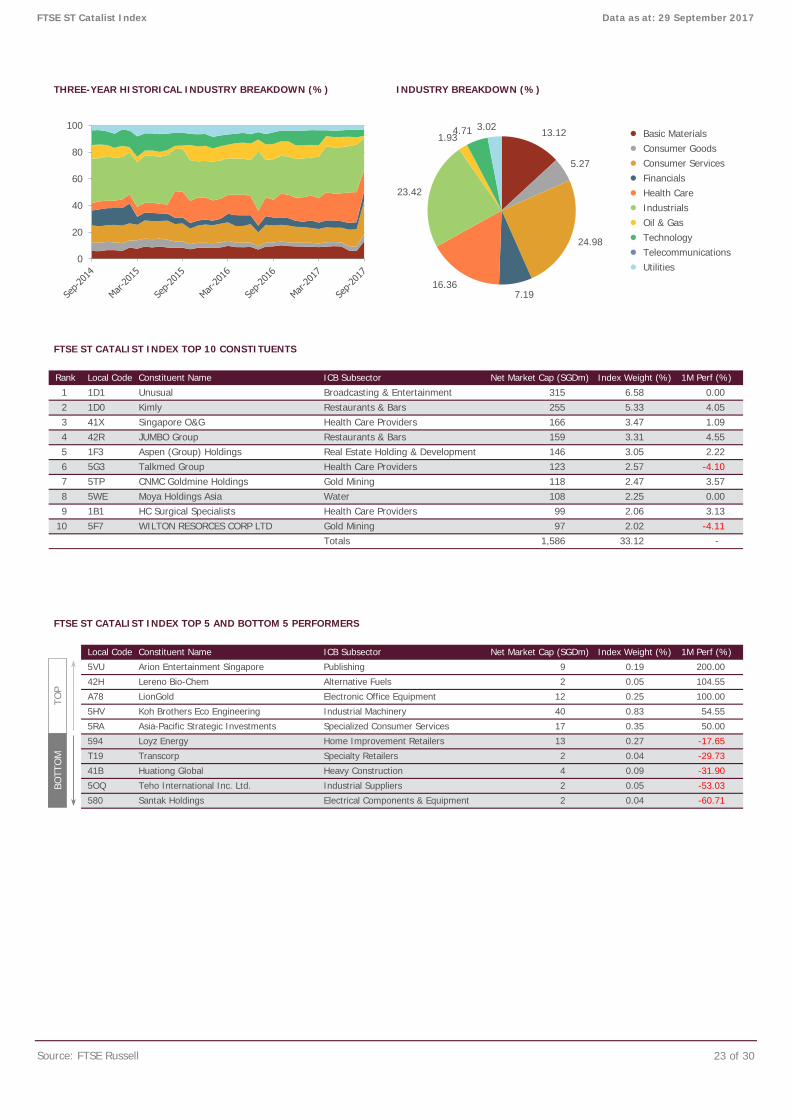
THREE-YEAR HISTORICAL INDUSTRY BREAKDOWN (%) INDUSTRY BREAKDOWN (%)
● Basic Materials● Consumer Goods● Consumer Services● Financials● Health Care● Industrials● Oil & Gas● Technology● Telecommunications● Utilities
FTSE ST CATALIST INDEX TOP 10 CONSTITUENTS
FTSE ST CATALIST INDEX TOP 5 AND BOTTOM 5 PERFORMERS
Source: FTSE Russell 23 of 30
5RA
594
Arion Entertainment Singapore Publishing 9
Real Estate Holding & Development 146
Constituent Name ICB Subsector Net Market Cap (SGDm)
Health Care Providers
FTSE ST Catalist Index Data as at: 29 September 2017
Local Code Index Weight (%)
1D11D0
5OQ
1M Perf (%)Rank Constituent Name ICB Subsector Net Market Cap (SGDm)
6.58 0.00
Local Code
5HV
5 Aspen (Group) Holdings3.31 4.55
2 255 5.33
-4.11
4.051 Unusual 315
2.57 -4.101F35G3
Totals 1,586 33.12
Teho International Inc. Ltd. Industrial Suppliers
Santak Holdings
Health Care Providers 99
1.09
3.13
Kimly Restaurants & BarsBroadcasting & Entertainment
3.57
2.226 Talkmed Group Health Care Providers 123
3.05
3 Singapore O&G41X42R4 JUMBO Group Restaurants & Bars 159
166 3.47
1M Perf (%)
-
108 2.25 0.007 CNMC Goldmine Holdings Gold Mining 118 2.47
2.06Moya Holdings Asia Water
9 HC Surgical Specialists
Index Weight (%)
10 WILTON RESORCES CORP LTD Gold Mining 97 2.02
8 5TP5WE1B15F7
0.19 200.00
Lereno Bio-Chem Alternative Fuels 2 0.05 104.55
LionGold Electronic Office Equipment 12 0.25 100.00
42H
A78
5VU
-17.65
Asia-Pacific Strategic Investments Specialized Consumer Services 17 0.35 50.00
Loyz Energy Home Improvement Retailers 13 0.27
Transcorp Specialty Retailers 2 0.04 -29.73
Huationg Global Heavy Construction 4 0.09 -31.90
2 0.05 -53.03
580 Electrical Components & Equipment
T19
41B
Koh Brothers Eco Engineering Industrial Machinery 40 0.83 54.55
2 0.04 -60.71
0
20
40
60
80
10013.12
5.27
24.98
7.19 16.36
23.42
1.93 4.71 3.02
TOP
BOTT
OM
INDEX OVERVIEW
FTSE ST CHINA INDEX FIVE-YEAR PERFORMANCE (SGD PRICE RETURN) PERFORMANCE HIGHLIGHTS
● FTSE ST All-Share Index ● FTSE ST China Index
FTSE ST CHINA INDEX HISTORICAL PERFORMANCE TABLE (SGD PRICE RETURN)
FTSE ST China Index
FTSE ST All-Share Index
FTSE ST CHINA INDEX HISTORICAL VOLATILITY TABLE (SGD PRICE RETURN)
FTSE ST China IndexFTSE ST All-Share Index
* Based on annualised daily total log returns. ** Based on annualised weekly total log returns. *** Based on annualised monthly total log returns.
Source: FTSE Russell 24 of 30
2.86
-1.14
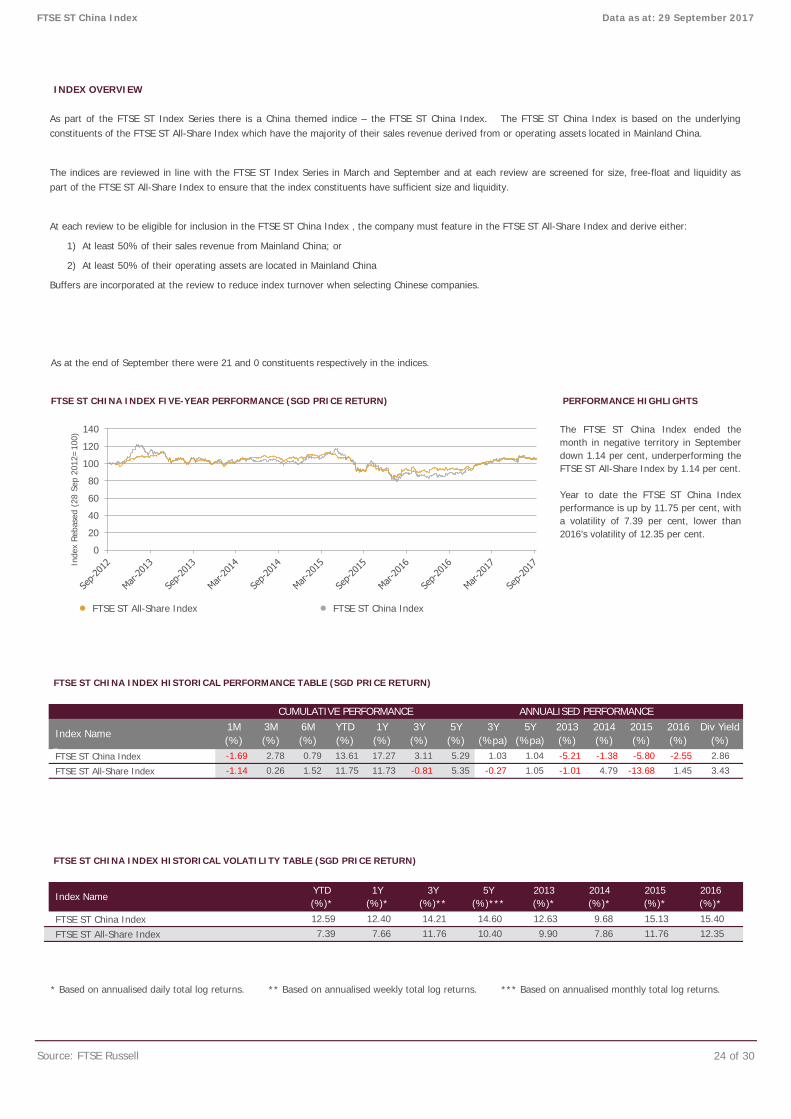
2.78 0.79 13.61 17.27 3.11
As at the end of September there were 21 and 0 constituents respectively in the indices.
-0.81 5.35 -0.27 1.05 -1.01 4.79
-5.21 -1.38 -5.80
3.43
-2.55 -1.69
3Y(%pa)
5Y(%pa)
2013(%)
2014(%)
Div Yield(%)
3Y(%)
5Y(%)
2015(%)
2016(%)
Data as at: 29 September 2017FTSE ST China Index
CUMULATIVE PERFORMANCE ANNUALISED PERFORMANCE
Index Name1M(%)
3M(%)
6M(%)
YTD(%)
1Y(%)
15.13
0.26 1.52 11.75 11.73
7.39 7.66
1Y(%)*
11.76
5.29
YTD(%)*
1.03 1.04
-13.68 1.45
10.40 9.90 7.86
Index Name3Y
(%)**5Y
(%)***2013(%)*
15.40
2014(%)*
2015(%)*
2016(%)*
12.59 12.40 14.21 14.60 12.63 11.76
9.68 12.35
The FTSE ST China Index ended themonth in negative territory in Septemberdown 1.14 per cent, underperforming theFTSE ST All-Share Index by 1.14 per cent.
Year to date the FTSE ST China Indexperformance is up by 11.75 per cent, witha volatility of 7.39 per cent, lower than2016’s volatility of 12.35 per cent.
0
20
40
60
80
100
120
140
Inde
x Re
base
d (2
8 Se
p 20
12=
100)
As part of the FTSE ST Index Series there is a China themed indice – the FTSE ST China Index. The FTSE ST China Index is based on the underlying constituents of the FTSE ST All-Share Index which have the majority of their sales revenue derived from or operating assets located in Mainland China.
The indices are reviewed in line with the FTSE ST Index Series in March and September and at each review are screened for size, free-float and liquidity as part of the FTSE ST All-Share Index to ensure that the index constituents have sufficient size and liquidity.
At each review to be eligible for inclusion in the FTSE ST China Index , the company must feature in the FTSE ST All-Share Index and derive either:
1) At least 50% of their sales revenue from Mainland China; or
2) At least 50% of their operating assets are located in Mainland China
Buffers are incorporated at the review to reduce index turnover when selecting Chinese companies.
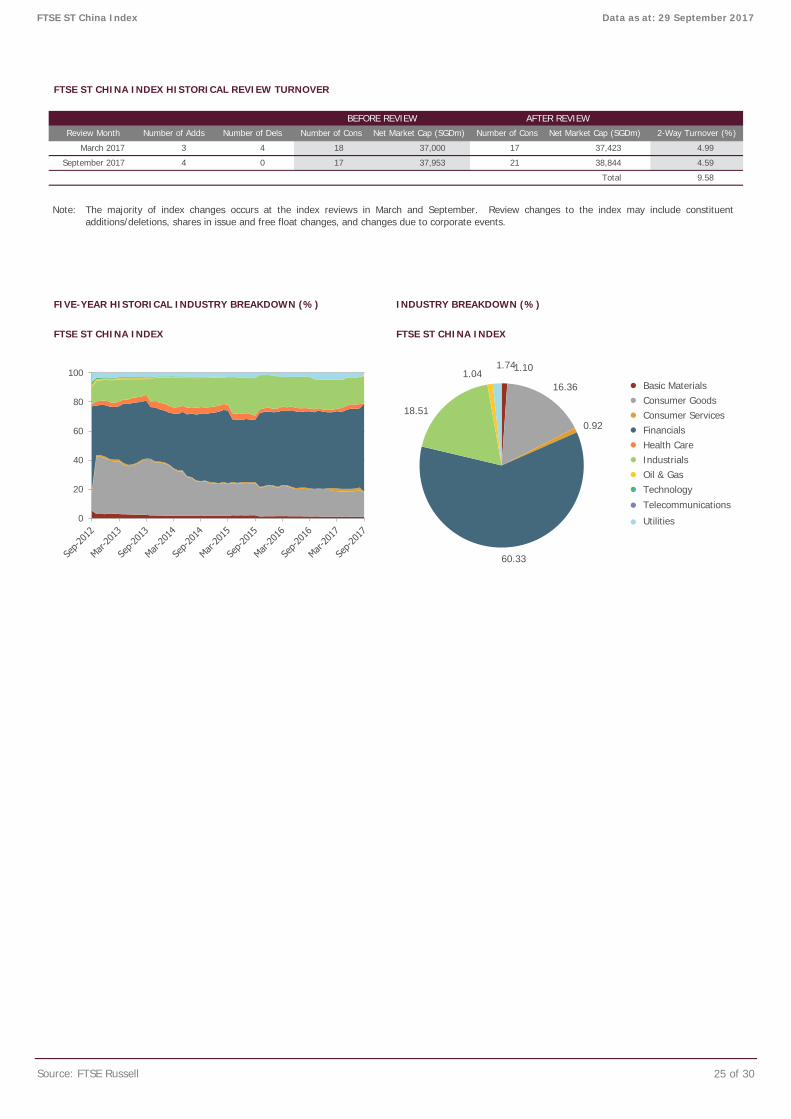
FTSE ST CHINA INDEX HISTORICAL REVIEW TURNOVER
FIVE-YEAR HISTORICAL INDUSTRY BREAKDOWN (%) INDUSTRY BREAKDOWN (%)
FTSE ST CHINA INDEX FTSE ST CHINA INDEX
● Basic Materials● Consumer Goods● Consumer Services● Financials● Health Care● Industrials● Oil & Gas● Technology
● Telecommunications
● Utilities
Source: FTSE Russell 25 of 30
September 2017
BEFORE REVIEW
2-Way Turnover (%)
4
18
AFTER REVIEW
FTSE ST China Index Data as at: 29 September 2017
17 4.99
0 17 37,953 21 38,844 4.59
Total 9.58
Review Month Number of Adds Number of Dels Number of Cons Net Market Cap (SGDm)
March 2017 3 4 37,000
Number of Cons Net Market Cap (SGDm)
37,423
0
20
40
60
80
100 1.10
16.36
0.92
60.33
18.51
1.04 1.74
The majority of index changes occurs at the index reviews in March and September. Review changes to the index may include constituent additions/deletions, shares in issue and free float changes, and changes due to corporate events.
Note:
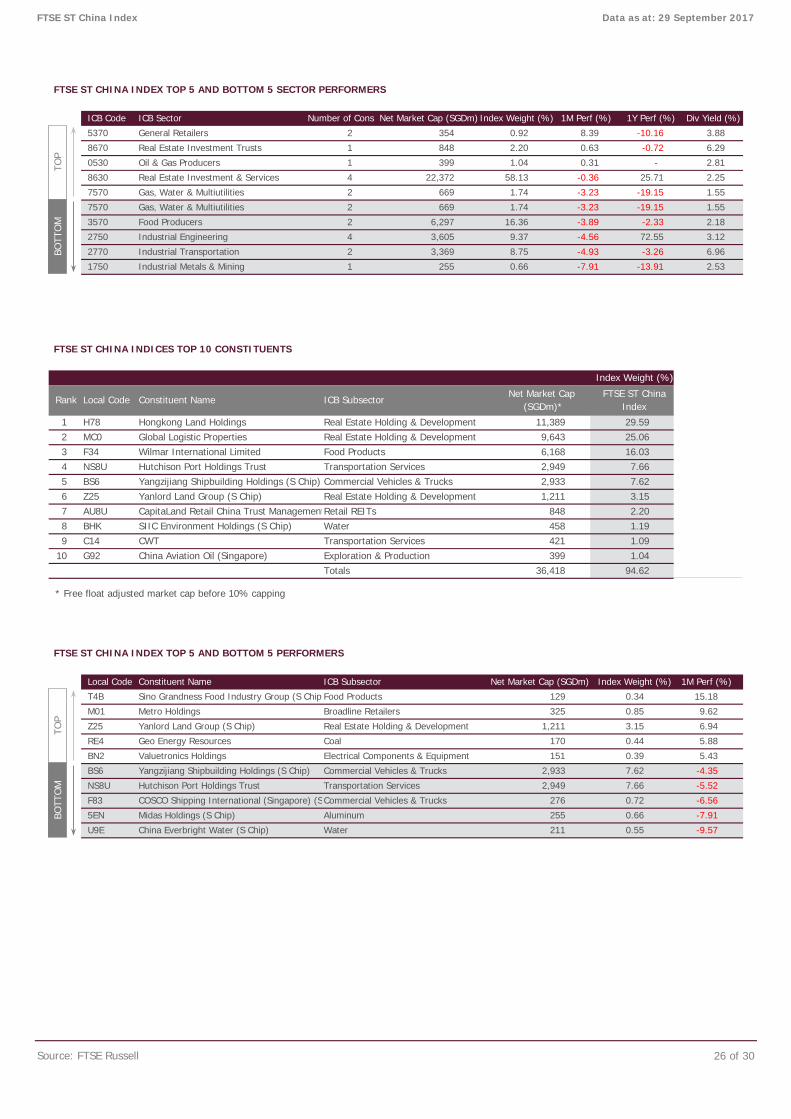
FTSE ST CHINA INDEX TOP 5 AND BOTTOM 5 SECTOR PERFORMERS
FTSE ST CHINA INDICES TOP 10 CONSTITUENTS
* Free float adjusted market cap before 10% capping
FTSE ST CHINA INDEX TOP 5 AND BOTTOM 5 PERFORMERS
Source: FTSE Russell 26 of 30
5.43
-4.35
-5.52
-6.56
-7.91
-9.57
4 3,605 9.37 -4.56 72.55 3.12
1 399 1.04
848 2.20 0.63 -0.72 6.29
ICB Code ICB Sector Number of Cons Net Market Cap (SGDm) Index Weight (%) 1M Perf (%) 1Y Perf (%)
FTSE ST China Index Data as at: 29 September 2017
0.31 - 2.81
5370 General Retailers 2 354 0.92 8.39 -10.16 3.88
8670 Real Estate Investment Trusts 1
7570 Gas, Water & Multiutilities 2 669 1.74 -3.23 -19.15 1.55
8630 Real Estate Investment & Services 4 22,372 58.13 -0.36 25.71 2.25
0530 Oil & Gas Producers
7570 Gas, Water & Multiutilities 2 669
Rank Constituent Name ICB Subsector
-3.23 -19.15 1.55
3570 Food Producers 2 6,297 16.36 -3.89 -2.33 2.18
2750
2770
1.74
Industrial Transportation 2 3,369 8.75 -4.93 -3.26 6.96
Local Code
255 0.66
Industrial Engineering
Food Products 6,168 16.03 4
1750 Industrial Metals & Mining
2,949 7.66
-7.91 -13.91 2.53
5 Yangzijiang Shipbuilding Holdings (S Chip) Commercial Vehicles & Trucks 2,933 7.62
1 Hongkong Land Holdings Real Estate Holding & Development 11,389 29.59 2 Global Logistic Properties Real Estate Holding & Development 9,643
1
BS6
3 Wilmar International Limited
SIIC Environment Holdings (S Chip) Water 458 1.19 9 CWT Transportation Services 421 1.09
10 China Aviation Oil (Singapore) Exploration & Production 399 1.04 C14G92
1M Perf (%)
8
15.18
9.62
Z25
RE4
6.94
5.88
Index Weight (%)
Metro Holdings Broadline Retailers 325 0.85
Yanlord Land Group (S Chip) Real Estate Holding & Development 1,211 3.15
T4B
M01
255 0.66
China Everbright Water (S Chip) Water 211 0.55
BS6
Geo Energy Resources Coal 170 0.44
Totals 36,418 94.62
Constituent Name ICB Subsector Net Market Cap (SGDm)
Sino Grandness Food Industry Group (S Chip Food Products 129 0.34
Local Code
Valuetronics Holdings Electrical Components & Equipment 151 0.39
Yangzijiang Shipbuilding Holdings (S Chip) Commercial Vehicles & Trucks 2,933 7.62
Hutchison Port Holdings Trust Transportation Services 2,949 7.66
Commercial Vehicles & Trucks 276 0.72
Midas Holdings (S Chip) Aluminum
Hutchison Port Holdings Trust
BN2
COSCO Shipping International (Singapore) (S
6 Yanlord Land Group (S Chip) Real Estate Holding & Development 1,211 3.15 7 CapitaLand Retail China Trust Management
25.06
Transportation Services
H78MC0F34NS8U
Retail REITs 848 2.20
NS8U
F83
Net Market Cap (SGDm)*
Index Weight (%)
5EN
U9E
Z25AU8UBHK
Div Yield (%)
FTSE ST China Index
TOP
BOTT
OM
TO
P BO
TTO
M
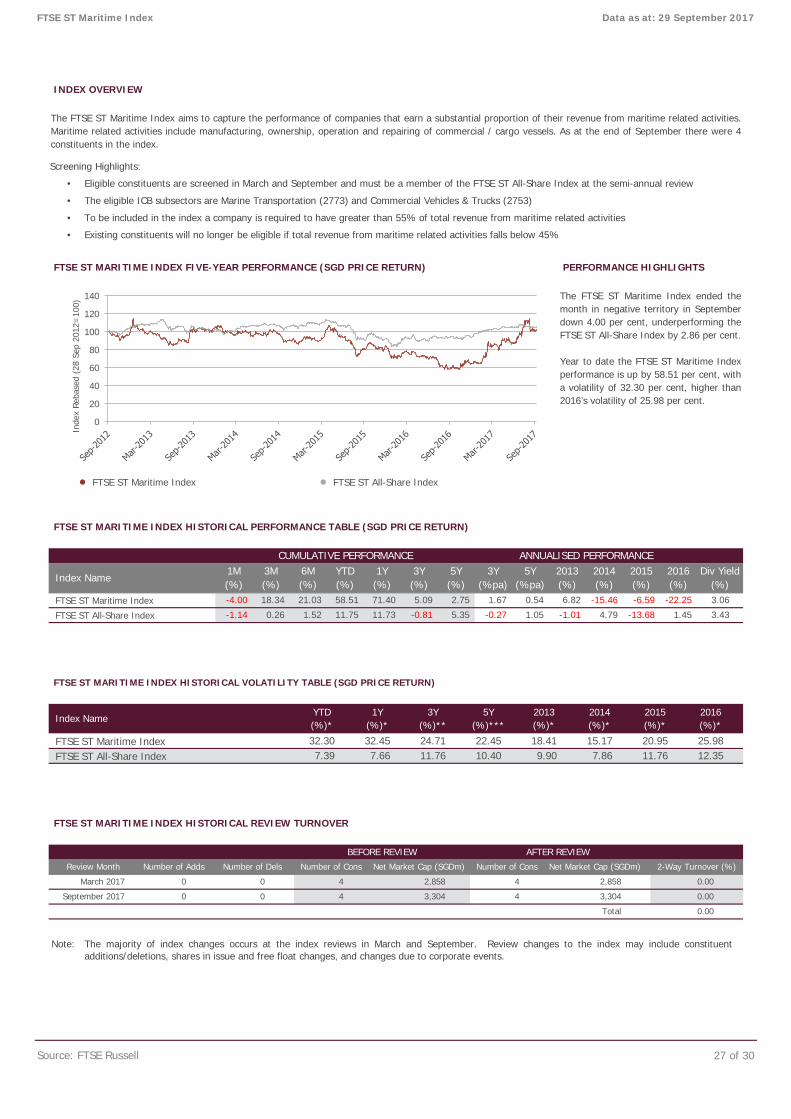
INDEX OVERVIEW
FTSE ST MARITIME INDEX FIVE-YEAR PERFORMANCE (SGD PRICE RETURN) PERFORMANCE HIGHLIGHTS
● FTSE ST Maritime Index ● FTSE ST All-Share Index
FTSE ST MARITIME INDEX HISTORICAL PERFORMANCE TABLE (SGD PRICE RETURN)
FTSE ST Maritime Index
FTSE ST All-Share Index
FTSE ST MARITIME INDEX HISTORICAL VOLATILITY TABLE (SGD PRICE RETURN)
FTSE ST Maritime IndexFTSE ST All-Share Index
FTSE ST MARITIME INDEX HISTORICAL REVIEW TURNOVER
Source: FTSE Russell 27 of 30
1Y(%)*
7.39
Data as at: 29 September 2017FTSE ST Maritime Index
ANNUALISED PERFORMANCE
Index Name1M(%)
3M(%)
6M(%)
YTD(%)
1Y(%)
3Y(%)
5Y(%)
3Y(%pa)
5Y(%pa)
-6.59 -22.25 3.06
2,858 0.00
September 2017 0 0 4 3,304 4 3,304 0.00
0.00
Index NameYTD(%)*
3Y(%)**
Div Yield(%)
9.90
1.52 11.75
5Y(%)***
2013(%)
2014(%)
2-Way Turnover (%)
2015(%)
2016(%)
-4.00 18.34 21.03 58.51
7.86 11.76 12.35 32.45 24.71 22.45 18.41 15.17
11.73
71.40 5.09 2.75 1.67 0.54 6.82 -15.46
The FTSE ST Maritime Index aims to capture the performance of companies that earn a substantial proportion of their revenue from maritime related activities.Maritime related activities include manufacturing, ownership, operation and repairing of commercial / cargo vessels. As at the end of September there were 4constituents in the index.
The FTSE ST Maritime Index ended themonth in negative territory in Septemberdown 4.00 per cent, underperforming theFTSE ST All-Share Index by 2.86 per cent.
Year to date the FTSE ST Maritime Indexperformance is up by 58.51 per cent, witha volatility of 32.30 per cent, higher than2016’s volatility of 25.98 per cent.
CUMULATIVE PERFORMANCE
10.40
Total
1.45
2014(%)*
2015(%)*
2016(%)*
32.30
-0.81 5.35 -0.27 1.05 -1.01
BEFORE REVIEW AFTER REVIEW
3.43 -13.68
0 4
-1.14 0.26
2,858 4
Review Month Number of Adds Number of Dels
20.95 25.98
Number of Cons Net Market Cap (SGDm) Number of Cons Net Market Cap (SGDm)
March 2017 0
2013(%)*
7.66 11.76
4.79
0
20
40
60
80
100
120
140
Inde
x Re
base
d (2
8 Se
p 20
12=
100)
Screening Highlights:
• Eligible constituents are screened in March and September and must be a member of the FTSE ST All-Share Index at the semi-annual review
• The eligible ICB subsectors are Marine Transportation (2773) and Commercial Vehicles & Trucks (2753)
• To be included in the index a company is required to have greater than 55% of total revenue from maritime related activities
• Existing constituents will no longer be eligible if total revenue from maritime related activities falls below 45%
The majority of index changes occurs at the index reviews in March and September. Review changes to the index may include constituent additions/deletions, shares in issue and free float changes, and changes due to corporate events.
Note:
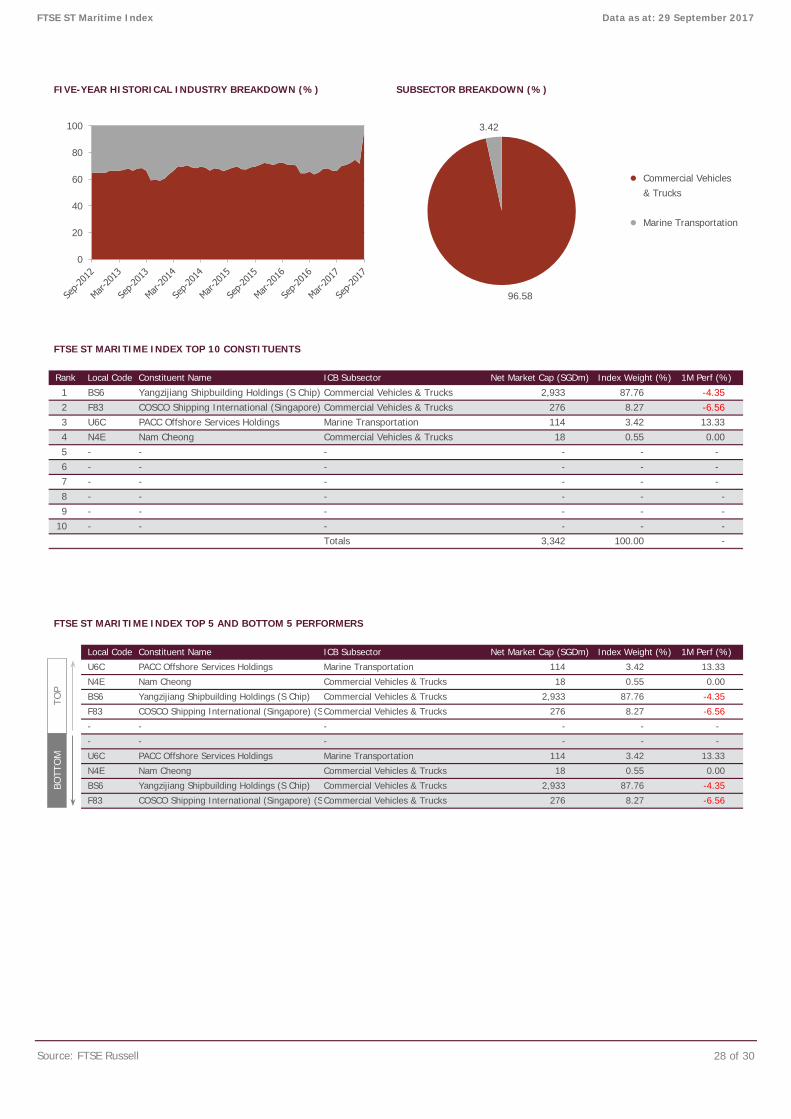
FIVE-YEAR HISTORICAL INDUSTRY BREAKDOWN (%) SUBSECTOR BREAKDOWN (%)
● Commercial Vehicles & Trucks
● Marine Transportation
FTSE ST MARITIME INDEX TOP 10 CONSTITUENTS
FTSE ST MARITIME INDEX TOP 5 AND BOTTOM 5 PERFORMERS
Source: FTSE Russell 28 of 30
8 - - - - - 9 -
--
4 5 -
1 Yangzijiang Shipbuilding Holdings (S Chip) Commercial Vehicles & Trucks
-
PACC Offshore Services Holdings
Totals 3,342
13.33
-
-
-7
2 COSCO Shipping International (Singapore) Commercial Vehicles & Trucks3 PACC Offshore Services Holdings Marine Transportation
- -
---- -10 -
2,933 87.76 -4.351M Perf (%)Local Code Index Weight (%)
- - -
BS6F83U6C
- -
8.27 -6.56
Yangzijiang Shipbuilding Holdings (S Chip)
-
- -
N4E- -
-
Local Code Index Weight (%)
3.42 13.33
114 3.42
-4.35
COSCO Shipping International (Singapore) (S
-
-
BS6
F83
-
N4E
3.42
- - -
BS6
100.00
U6C
Commercial Vehicles & Trucks 18 0.55
COSCO Shipping International (Singapore) (S
--
Nam Cheong Commercial Vehicles & Trucks 18 0.55
Nam Cheong
Yangzijiang Shipbuilding Holdings (S Chip) Commercial Vehicles & Trucks 2,933 87.76
N4E
276 8.27
1M Perf (%)
-
-6.56
Nam Cheong Commercial Vehicles & Trucks 18 0.55
Marine Transportation
- - -
87.76 -4.35Commercial Vehicles & Trucks
Commercial Vehicles & Trucks
-
0.00
Commercial Vehicles & Trucks
ICB Subsector Net Market Cap (SGDm)
- -
114
Net Market Cap (SGDm)
FTSE ST Maritime Index Data as at: 29 September 2017
U6C
ICB Subsector
114
-
PACC Offshore Services Holdings Marine Transportation
-
6
276
276 8.27 -6.56
2,933
F83
0.00
13.33
0.00
Rank Constituent Name
Constituent Name
0
20
40
60
80
100
96.58
3.42
TOP
BOTT
OM
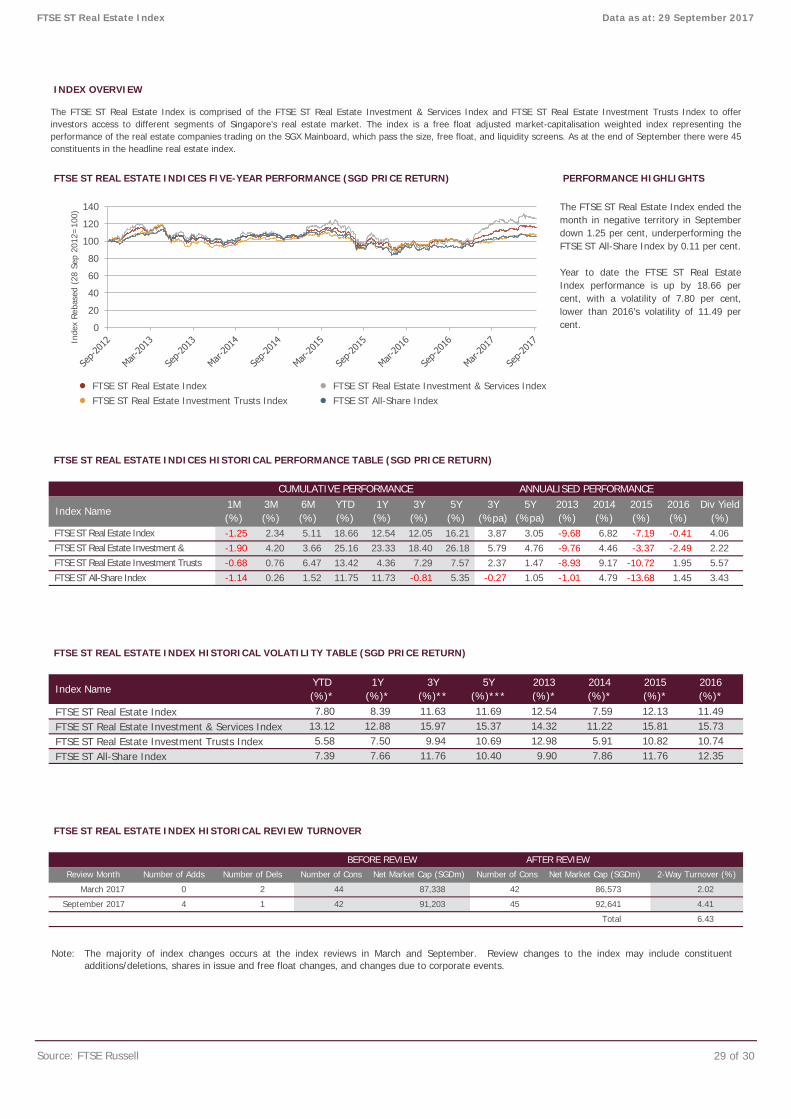
INDEX OVERVIEW
FTSE ST REAL ESTATE INDICES FIVE-YEAR PERFORMANCE (SGD PRICE RETURN) PERFORMANCE HIGHLIGHTS
● FTSE ST Real Estate Index ● FTSE ST Real Estate Investment & Services Index● FTSE ST Real Estate Investment Trusts Index ● FTSE ST All-Share Index
FTSE ST REAL ESTATE INDICES HISTORICAL PERFORMANCE TABLE (SGD PRICE RETURN)
FTSE ST REAL ESTATE INDEX HISTORICAL VOLATILITY TABLE (SGD PRICE RETURN)
FTSE ST Real Estate IndexFTSE ST Real Estate Investment & Services IndexFTSE ST Real Estate Investment Trusts IndexFTSE ST All-Share Index
FTSE ST REAL ESTATE INDEX HISTORICAL REVIEW TURNOVER
Source: FTSE Russell 29 of 30
2.37 1.47
7.39
2.22
BEFORE REVIEW
-1.14 0.26 4.79
23.33
-13.68 1.45 3.43
3.05 -9.68
1.52 11.75
26.18 5.79
1.05 -1.01
-9.76 4.46 -3.37
12.35
15.37
7.86 11.76 10.74
7.66 11.76 10.40 9.90
12.88 12.13 11.49
AFTER REVIEW
-1.90 4.20 25.16
Index Name
14.32 11.22 13.12 9.94
15.97 5.58
1M(%)
7.50 10.69 12.98 5.91
-2.49 -0.68 0.76 6.47 13.42 4.36 7.29 7.57
2013(%)*
2014(%)*
2015(%)*
2016(%)*
Index Name
18.40
2016(%)
3M(%)
September 2017 4 1 42 91,203 45 92,641 4.41
Number of Adds 2-Way Turnover (%)
Total 6.43
Number of Dels Number of Cons Net Market Cap (SGDm)
March 2017 0
Review Month
7.80
10.82
Number of Cons Net Market Cap (SGDm)
Div Yield(%)
5Y(%pa)
2013(%)
2014(%)
2015(%)
4.06 3.87
CUMULATIVE PERFORMANCE
-8.93
1Y(%)
-0.41 -1.25
5Y(%)***
-7.19
1Y(%)*
2 44 87,338 42 86,573 2.02
The FTSE ST Real Estate Index ended themonth in negative territory in Septemberdown 1.25 per cent, underperforming theFTSE ST All-Share Index by 0.11 per cent.
Year to date the FTSE ST Real EstateIndex performance is up by 18.66 percent, with a volatility of 7.80 per cent,lower than 2016’s volatility of 11.49 percent.
15.81
YTD(%)*
5.35 -0.27
2.34 5.11 18.66 12.54
8.39 11.63 11.69 12.54 7.59
12.05 16.21
9.17 -10.72 1.95 5.57
3Y(%pa)
6.82 3.66 4.76
3Y(%)
5Y(%)
6M(%)
YTD(%)
The FTSE ST Real Estate Index is comprised of the FTSE ST Real Estate Investment & Services Index and FTSE ST Real Estate Investment Trusts Index to offerinvestors access to different segments of Singapore’s real estate market. The index is a free float adjusted market-capitalisation weighted index representing theperformance of the real estate companies trading on the SGX Mainboard, which pass the size, free float, and liquidity screens. As at the end of September there were 45constituents in the headline real estate index.
15.73
FTSE ST Real Estate Index Data as at: 29 September 2017
3Y(%)**
ANNUALISED PERFORMANCE
-0.81 11.73
0
20
40
60
80
100
120
140
Inde
x Re
base
d (2
8 Se
p 20
12=
100)
FTSE ST Real Estate Index FTSE ST Real Estate Investment & FTSE ST Real Estate Investment Trusts FTSE ST All-Share Index
The majority of index changes occurs at the index reviews in March and September. Review changes to the index may include constituent additions/deletions, shares in issue and free float changes, and changes due to corporate events.
Note:
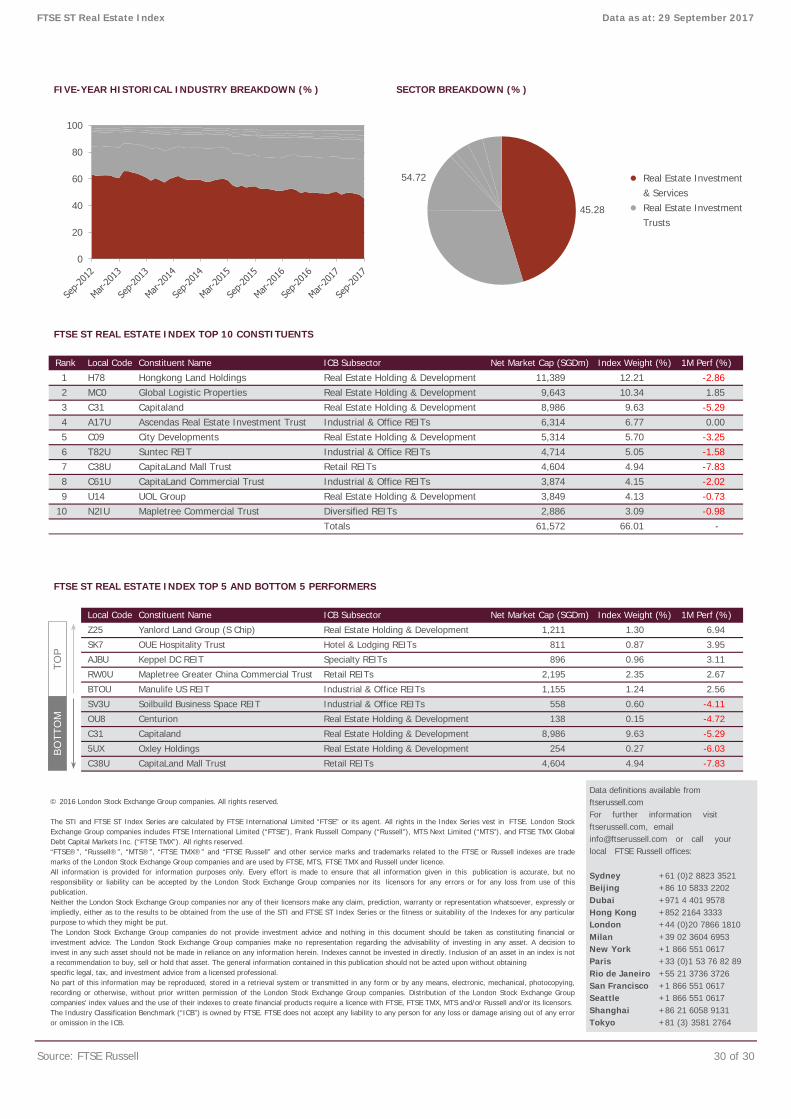
FIVE-YEAR HISTORICAL INDUSTRY BREAKDOWN (%) SECTOR BREAKDOWN (%)
● Real Estate Investment& Services
● Real Estate InvestmentTrusts
FTSE ST REAL ESTATE INDEX TOP 10 CONSTITUENTS
FTSE ST REAL ESTATE INDEX TOP 5 AND BOTTOM 5 PERFORMERS
Source: FTSE Russell 30 of 30
7 CapitaLand Mall Trust Retail REITs 4,604
Capitaland Real Estate Holding & Development 8,986 9.63 -5.290.00
5 City Developments Real Estate Holding & Development 5,314 5.70 -3.256 Suntec REIT Industrial & Office REITs 4,714 -1.58
-2.86
FTSE ST Real Estate Index Data as at: 29 September 2017
9,643 10.34 1.853
Index Weight (%) 1M Perf (%)
Yanlord Land Group (S Chip)
-4.72
-0.73
CapitaLand Mall Trust Retail REITs 4,604 4.94 -7.83
-
Constituent Name ICB Subsector Net Market Cap (SGDm) 1M Perf (%)
Capitaland Real Estate Holding & Development
5.05
254 0.27
9.63
Soilbuild Business Space REIT Industrial & Office REITs 558
Index Weight (%)
Real Estate Holding & Development 1,211 1.30
UOL Group Real Estate Holding & Development
Real Estate Holding & Development 138 0.15
BTOU
C38U
Totals 61,572 66.01-0.98
0.60 -4.11
C31
-6.03
8,986
OUE Hospitality Trust Hotel & Lodging REITs 811 0.87
-5.29
3.95
Oxley Holdings Real Estate Holding & Development
SV3U
Local Code
Z25
SK7
AJBU
RW0U
6.94
5UX
-7.83
Ascendas Real Estate Investment Trust Industrial & Office REITs
10
OU8 Centurion
CapitaLand Commercial Trust Industrial & Office REITs 3,874 4.15 -2.02
2.56
Keppel DC REIT Specialty REITs 896 0.96 3.11
Mapletree Greater China Commercial Trust Retail REITs 2,195 2.35 2.67
Manulife US REIT Industrial & Office REITs 1,155 1.24
3,849
4 6,314 6.77
8
1 Hongkong Land Holdings Real Estate Holding & Development 11,389 12.212 Global Logistic Properties Real Estate Holding & Development
Mapletree Commercial Trust Diversified REITs 2,886 3.09
4.94
4.139
Rank Constituent Name ICB Subsector Net Market Cap (SGDm)
© 2016 London Stock Exchange Group companies. All rights reserved.
The STI and FTSE ST Index Series are calculated by FTSE International Limited “FTSE” or its agent. All rights in the Index Series vest in FTSE. London StockExchange Group companies includes FTSE International Limited (“FTSE”), Frank Russell Company (“Russell”), MTS Next Limited (“MTS”), and FTSE TMX GlobalDebt Capital Markets Inc. (“FTSE TMX”). All rights reserved.“FTSE®”, “Russell®”, “MTS®”, “FTSE TMX®” and “FTSE Russell” and other service marks and trademarks related to the FTSE or Russell indexes are trademarks of the London Stock Exchange Group companies and are used by FTSE, MTS, FTSE TMX and Russell under licence. All information is provided for information purposes only. Every effort is made to ensure that all information given in this publication is accurate, but noresponsibility or liability can be accepted by the London Stock Exchange Group companies nor its licensors for any errors or for any loss from use of thispublication.Neither the London Stock Exchange Group companies nor any of their licensors make any claim, prediction, warranty or representation whatsoever, expressly orimpliedly, either as to the results to be obtained from the use of the STI and FTSE ST Index Series or the fitness or suitability of the Indexes for any particularpurpose to which they might be put. The London Stock Exchange Group companies do not provide investment advice and nothing in this document should be taken as constituting financial orinvestment advice. The London Stock Exchange Group companies make no representation regarding the advisability of investing in any asset. A decision toinvest in any such asset should not be made in reliance on any information herein. Indexes cannot be invested in directly. Inclusion of an asset in an index is nota recommendation to buy, sell or hold that asset. The general information contained in this publication should not be acted upon without obtaining specific legal, tax, and investment advice from a licensed professional.No part of this information may be reproduced, stored in a retrieval system or transmitted in any form or by any means, electronic, mechanical, photocopying,recording or otherwise, without prior written permission of the London Stock Exchange Group companies. Distribution of the London Stock Exchange Groupcompanies’ index values and the use of their indexes to create financial products require a licence with FTSE, FTSE TMX, MTS and/or Russell and/or its licensors.The Industry Classification Benchmark (“ICB”) is owned by FTSE. FTSE does not accept any liability to any person for any loss or damage arising out of any erroror omission in the ICB.
Local Code
H78MC0C31A17UC09T82UC38UC61U
N2IUU14
TOP
BOTT
OM
0
20
40
60
80
100
45.28
54.72
Data definitions available from ftserussell.com For further information visit ftserussell.com, email [email protected] or call your local FTSE Russell offices: Sydney +61 (0)2 8823 3521 Beijing +86 10 5833 2202 Dubai +971 4 401 9578 Hong Kong +852 2164 3333 London +44 (0)20 7866 1810 Milan +39 02 3604 6953 New York +1 866 551 0617 Paris +33 (0)1 53 76 82 89 Rio de Janeiro +55 21 3736 3726 San Francisco +1 866 551 0617 Seattle +1 866 551 0617 Shanghai +86 21 6058 9131 Tokyo +81 (3) 3581 2764