Embed Size (px)
Citation preview


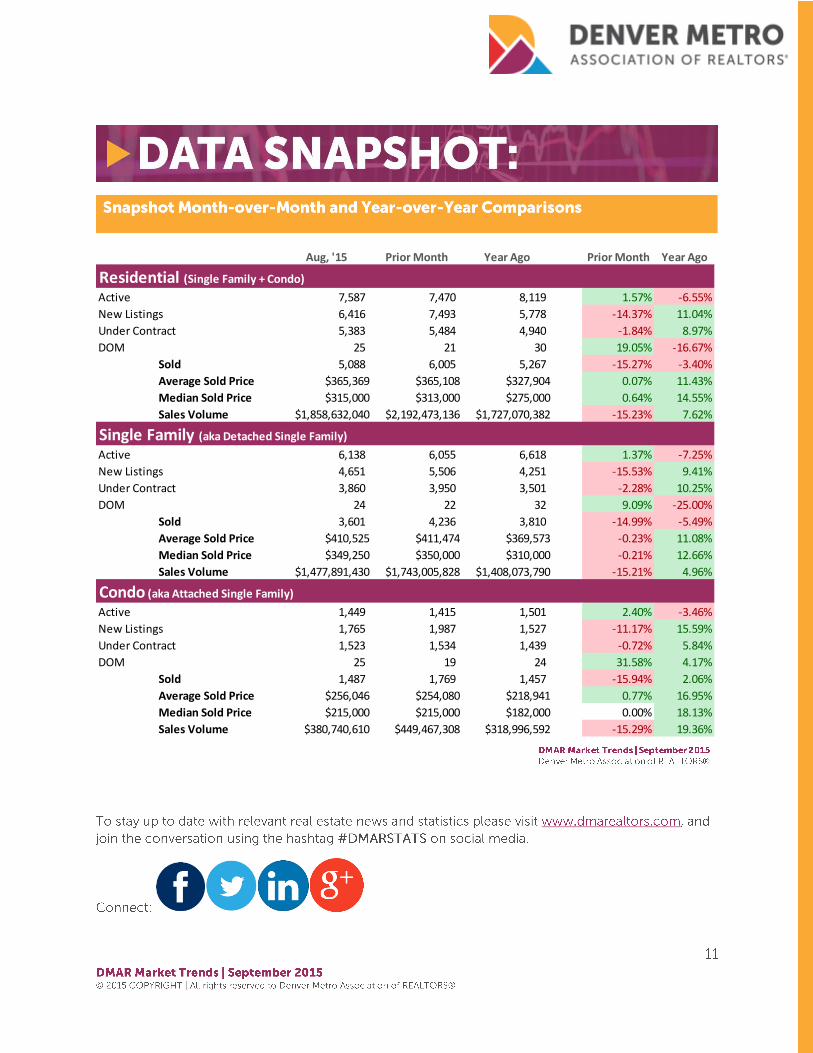
Aug, '15 Prior Month Year Ago Prior Month Year Ago
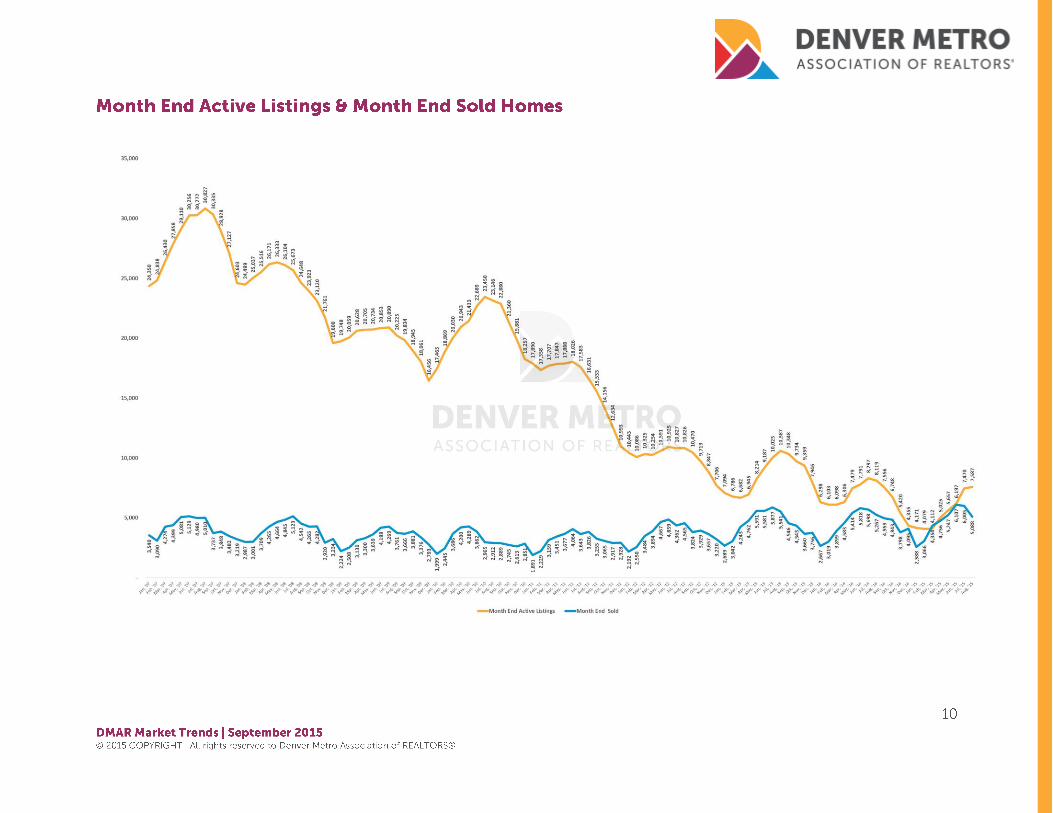
Active 7,587 7,470 8,119 1.57% -6.55%
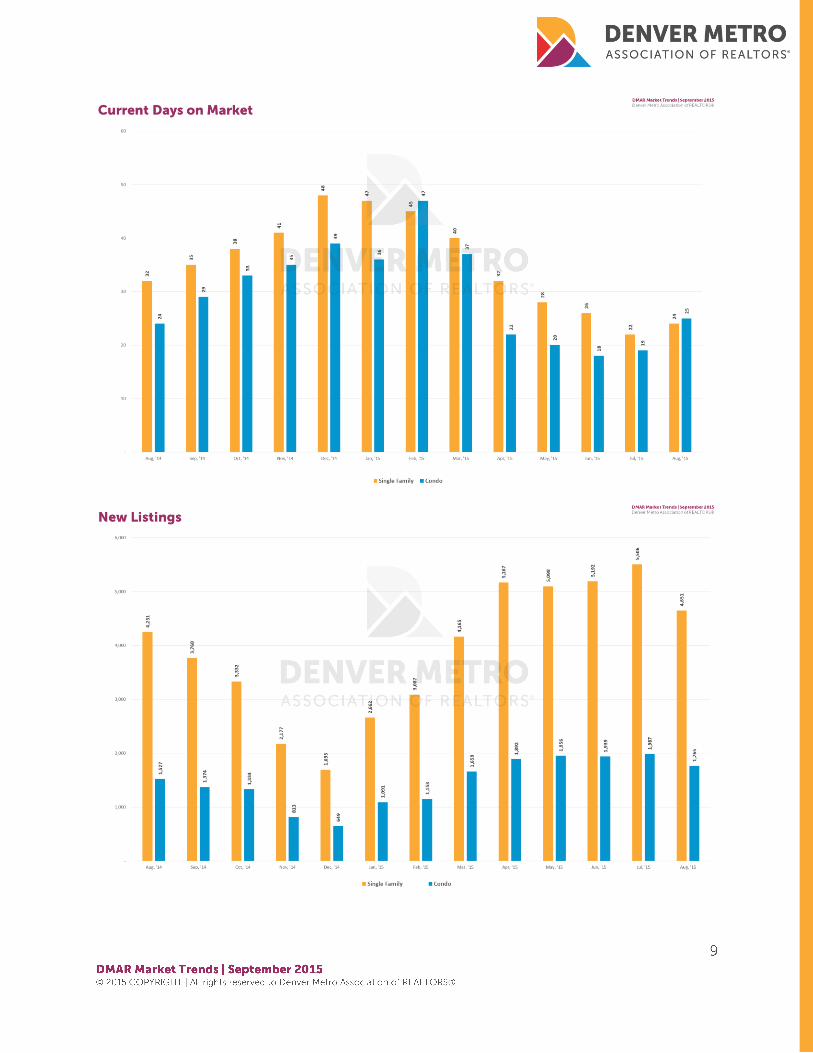
New Listings 6,416 7,493 5,778 -14.37% 11.04%
Under Contract 5,383 5,484 4,940 -1.84% 8.97%
DOM 25 21 30 19.05% -16.67%
Sold 5,088 6,005 5,267 -15.27% -3.40%
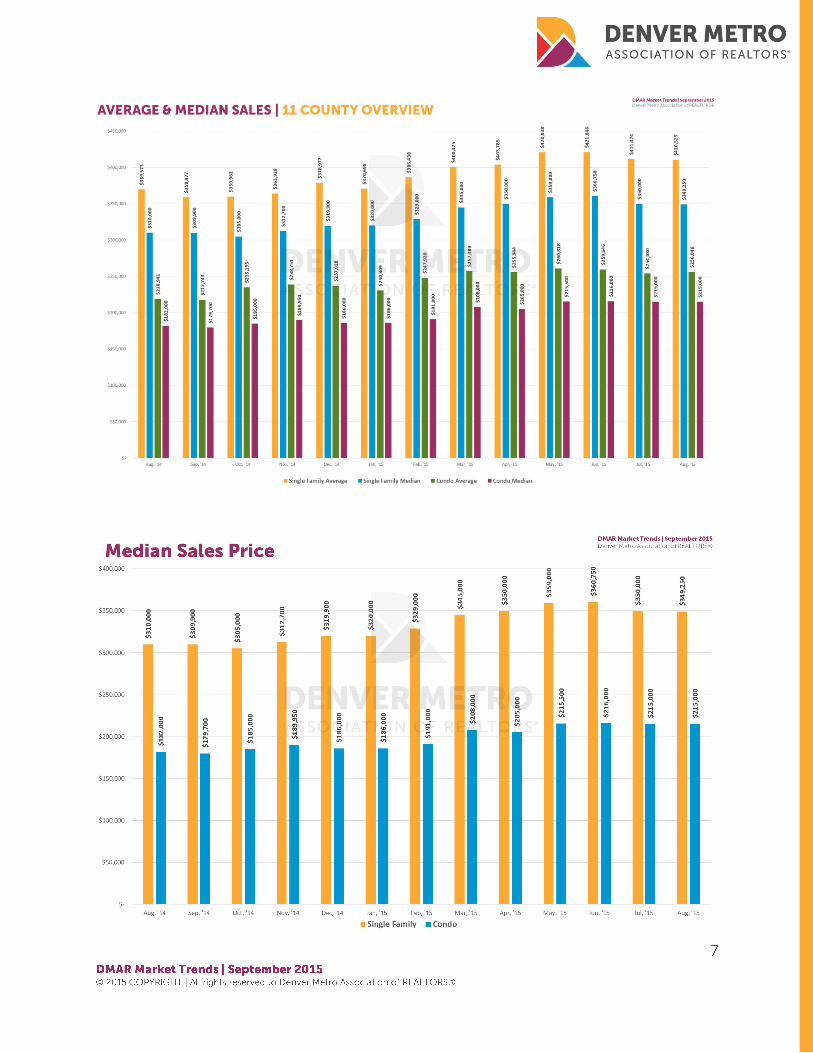
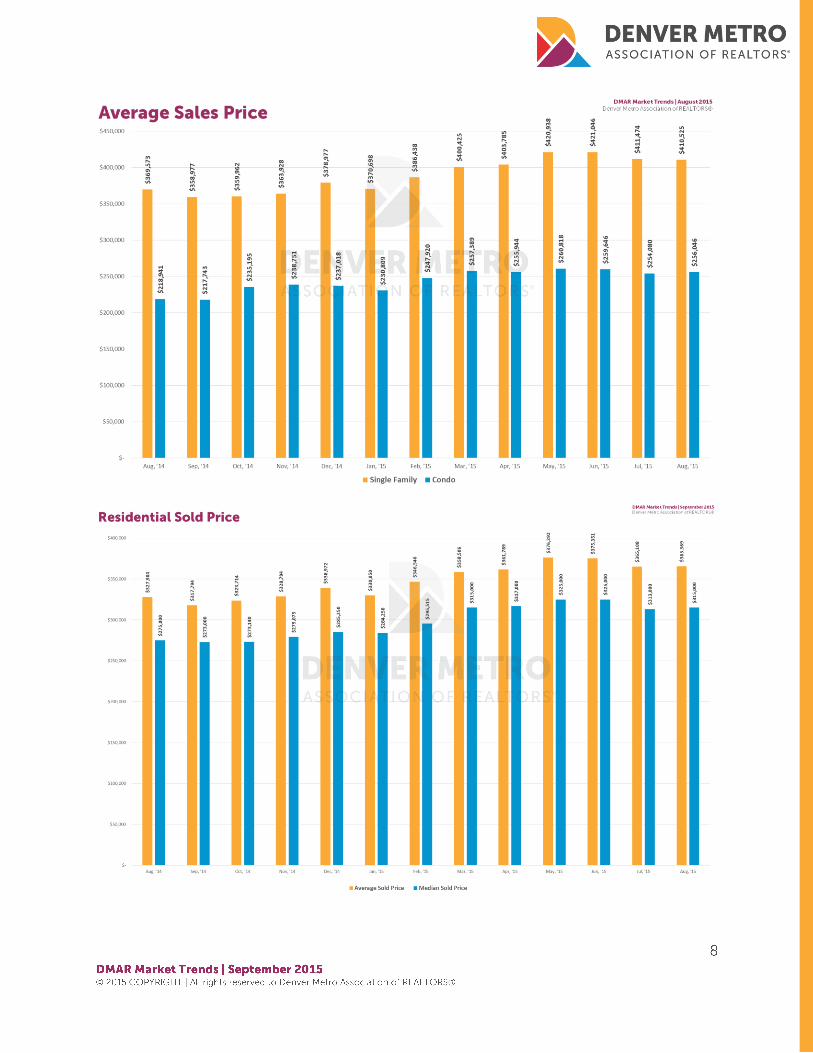
Average Sold Price $365,369 $365,108 $327,904 0.07% 11.43%
Median Sold Price $315,000 $313,000 $275,000 0.64% 14.55%
Sales Volume $1,858,632,040 $2,192,473,136 $1,727,070,382 -15.23% 7.62%
Active 6,138 6,055 6,618 1.37% -7.25%
New Listings 4,651 5,506 4,251 -15.53% 9.41%
Under Contract 3,860 3,950 3,501 -2.28% 10.25%
DOM 24 22 32 9.09% -25.00%
Sold 3,601 4,236 3,810 -14.99% -5.49%
Average Sold Price $410,525 $411,474 $369,573 -0.23% 11.08%
Median Sold Price $349,250 $350,000 $310,000 -0.21% 12.66%
Sales Volume $1,477,891,430 $1,743,005,828 $1,408,073,790 -15.21% 4.96%
Active 1,449 1,415 1,501 2.40% -3.46%
New Listings 1,765 1,987 1,527 -11.17% 15.59%
Under Contract 1,523 1,534 1,439 -0.72% 5.84%
DOM 25 19 24 31.58% 4.17%
Sold 1,487 1,769 1,457 -15.94% 2.06%
Average Sold Price $256,046 $254,080 $218,941 0.77% 16.95%
Median Sold Price $215,000 $215,000 $182,000 0.00% 18.13%
Sales Volume $380,740,610 $449,467,308 $318,996,592 -15.29% 19.36%
Residential (Single Family + Condo)
Single Family (aka Detached Single Family)
Condo (aka Attached Single Family)
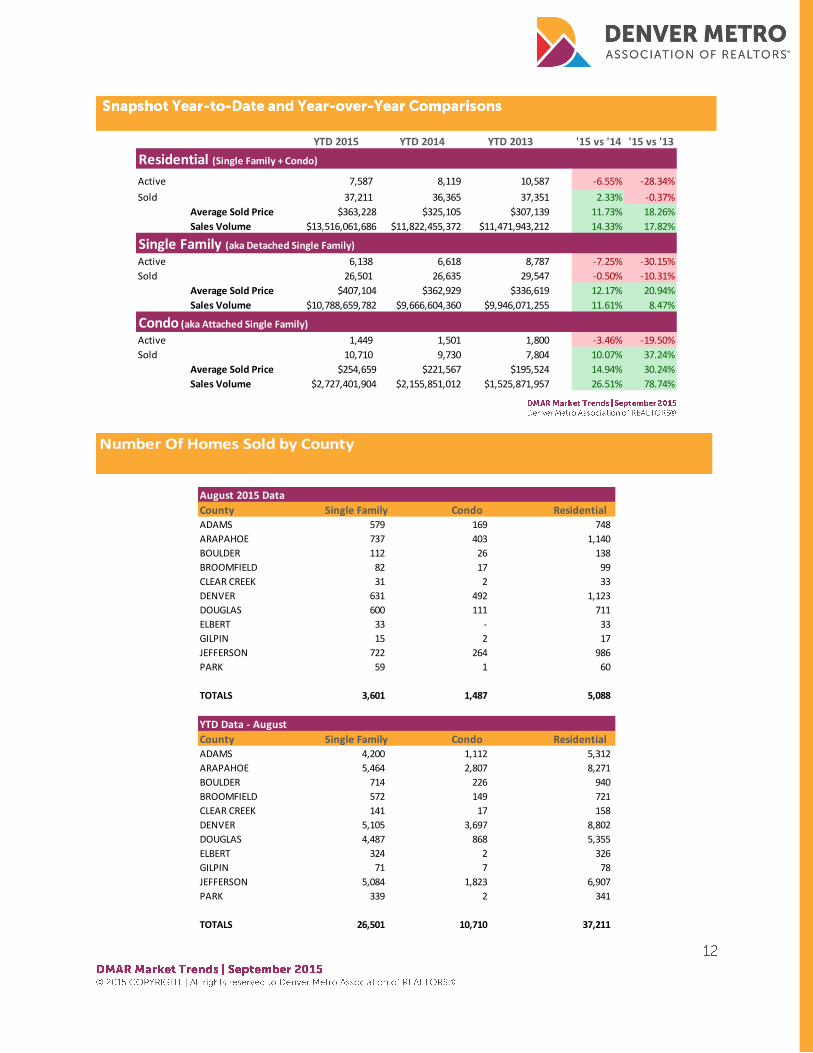
YTD 2015 YTD 2014 YTD 2013 '15 vs '14 '15 vs '13
Active 7,587 8,119 10,587 -6.55% -28.34%
Sold 37,211 36,365 37,351 2.33% -0.37%
Average Sold Price $363,228 $325,105 $307,139 11.73% 18.26%
Sales Volume $13,516,061,686 $11,822,455,372 $11,471,943,212 14.33% 17.82%
Active 6,138 6,618 8,787 -7.25% -30.15%
Sold 26,501 26,635 29,547 -0.50% -10.31%
Average Sold Price $407,104 $362,929 $336,619 12.17% 20.94%
Sales Volume $10,788,659,782 $9,666,604,360 $9,946,071,255 11.61% 8.47%
Active 1,449 1,501 1,800 -3.46% -19.50%
Sold 10,710 9,730 7,804 10.07% 37.24%
Average Sold Price $254,659 $221,567 $195,524 14.94% 30.24%
Sales Volume $2,727,401,904 $2,155,851,012 $1,525,871,957 26.51% 78.74%
Residential (Single Family + Condo)
Single Family (aka Detached Single Family)
Condo (aka Attached Single Family)
Number Of Homes Sold by County
August 2015 Data
County Single Family Condo ResidentialADAMS 579 169 748
ARAPAHOE 737 403 1,140
BOULDER 112 26 138
BROOMFIELD 82 17 99
CLEAR CREEK 31 2 33
DENVER 631 492 1,123
DOUGLAS 600 111 711
ELBERT 33 - 33
GILPIN 15 2 17
JEFFERSON 722 264 986
PARK 59 1 60
TOTALS 3,601 1,487 5,088
YTD Data - August
County Single Family Condo ResidentialADAMS 4,200 1,112 5,312
ARAPAHOE 5,464 2,807 8,271
BOULDER 714 226 940
BROOMFIELD 572 149 721
CLEAR CREEK 141 17 158
DENVER 5,105 3,697 8,802
DOUGLAS 4,487 868 5,355
ELBERT 324 2 326
GILPIN 71 7 78
JEFFERSON 5,084 1,823 6,907
PARK 339 2 341
TOTALS 26,501 10,710 37,211
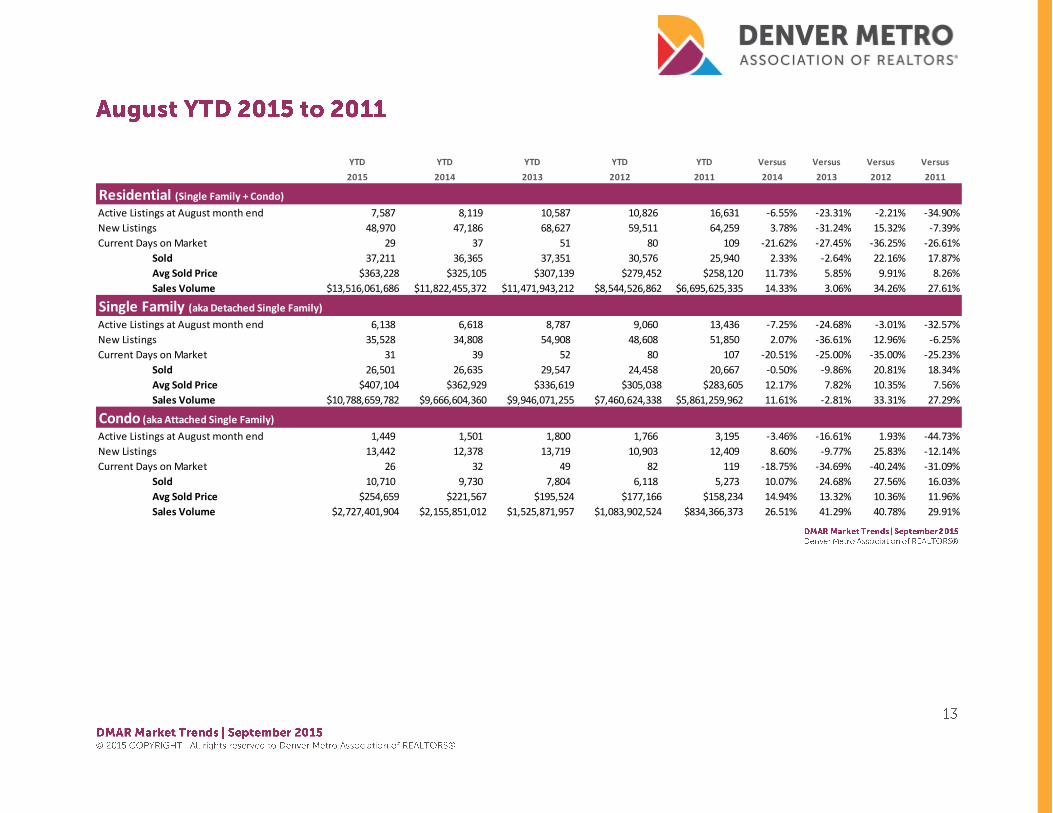
YTD YTD YTD YTD YTD Versus Versus Versus Versus
2015 2014 2013 2012 2011 2014 2013 2012 2011
Active Listings at August month end 7,587 8,119 10,587 10,826 16,631 -6.55% -23.31% -2.21% -34.90%
New Listings 48,970 47,186 68,627 59,511 64,259 3.78% -31.24% 15.32% -7.39%
Current Days on Market 29 37 51 80 109 -21.62% -27.45% -36.25% -26.61%
Sold 37,211 36,365 37,351 30,576 25,940 2.33% -2.64% 22.16% 17.87%
Avg Sold Price $363,228 $325,105 $307,139 $279,452 $258,120 11.73% 5.85% 9.91% 8.26%
Sales Volume $13,516,061,686 $11,822,455,372 $11,471,943,212 $8,544,526,862 $6,695,625,335 14.33% 3.06% 34.26% 27.61%
Active Listings at August month end 6,138 6,618 8,787 9,060 13,436 -7.25% -24.68% -3.01% -32.57%
New Listings 35,528 34,808 54,908 48,608 51,850 2.07% -36.61% 12.96% -6.25%
Current Days on Market 31 39 52 80 107 -20.51% -25.00% -35.00% -25.23%
Sold 26,501 26,635 29,547 24,458 20,667 -0.50% -9.86% 20.81% 18.34%
Avg Sold Price $407,104 $362,929 $336,619 $305,038 $283,605 12.17% 7.82% 10.35% 7.56%
Sales Volume $10,788,659,782 $9,666,604,360 $9,946,071,255 $7,460,624,338 $5,861,259,962 11.61% -2.81% 33.31% 27.29%
Active Listings at August month end 1,449 1,501 1,800 1,766 3,195 -3.46% -16.61% 1.93% -44.73%
New Listings 13,442 12,378 13,719 10,903 12,409 8.60% -9.77% 25.83% -12.14%
Current Days on Market 26 32 49 82 119 -18.75% -34.69% -40.24% -31.09%
Sold 10,710 9,730 7,804 6,118 5,273 10.07% 24.68% 27.56% 16.03%
Avg Sold Price $254,659 $221,567 $195,524 $177,166 $158,234 14.94% 13.32% 10.36% 11.96%
Sales Volume $2,727,401,904 $2,155,851,012 $1,525,871,957 $1,083,902,524 $834,366,373 26.51% 41.29% 40.78% 29.91%
Residential (Single Family + Condo)
Single Family (aka Detached Single Family)
Condo (aka Attached Single Family)
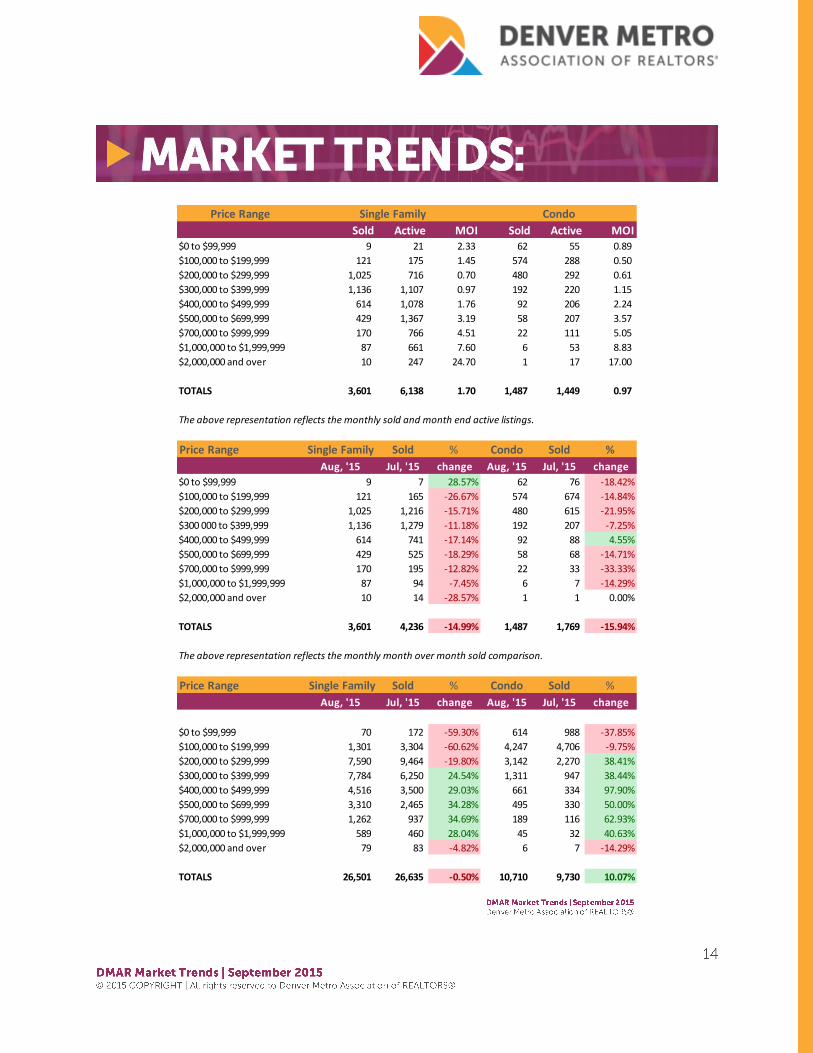
Price Range
Sold Active MOI Sold Active MOI$0 to $99,999 9 21 2.33 62 55 0.89
$100,000 to $199,999 121 175 1.45 574 288 0.50
$200,000 to $299,999 1,025 716 0.70 480 292 0.61
$300,000 to $399,999 1,136 1,107 0.97 192 220 1.15
$400,000 to $499,999 614 1,078 1.76 92 206 2.24
$500,000 to $699,999 429 1,367 3.19 58 207 3.57
$700,000 to $999,999 170 766 4.51 22 111 5.05
$1,000,000 to $1,999,999 87 661 7.60 6 53 8.83
$2,000,000 and over 10 247 24.70 1 17 17.00
TOTALS 3,601 6,138 1.70 1,487 1,449 0.97
The above representation reflects the monthly sold and month end active listings.
Price Range Single Family Sold % Condo Sold %
Aug, '15 Jul, '15 change Aug, '15 Jul, '15 change
$0 to $99,999 9 7 28.57% 62 76 -18.42%
$100,000 to $199,999 121 165 -26.67% 574 674 -14.84%
$200,000 to $299,999 1,025 1,216 -15.71% 480 615 -21.95%
$300 000 to $399,999 1,136 1,279 -11.18% 192 207 -7.25%
$400,000 to $499,999 614 741 -17.14% 92 88 4.55%
$500,000 to $699,999 429 525 -18.29% 58 68 -14.71%
$700,000 to $999,999 170 195 -12.82% 22 33 -33.33%
$1,000,000 to $1,999,999 87 94 -7.45% 6 7 -14.29%
$2,000,000 and over 10 14 -28.57% 1 1 0.00%
TOTALS 3,601 4,236 -14.99% 1,487 1,769 -15.94%
The above representation reflects the monthly month over month sold comparison.
Price Range Single Family Sold % Condo Sold %
Aug, '15 Jul, '15 change Aug, '15 Jul, '15 change
$0 to $99,999 70 172 -59.30% 614 988 -37.85%
$100,000 to $199,999 1,301 3,304 -60.62% 4,247 4,706 -9.75%
$200,000 to $299,999 7,590 9,464 -19.80% 3,142 2,270 38.41%
$300,000 to $399,999 7,784 6,250 24.54% 1,311 947 38.44%
$400,000 to $499,999 4,516 3,500 29.03% 661 334 97.90%
$500,000 to $699,999 3,310 2,465 34.28% 495 330 50.00%
$700,000 to $999,999 1,262 937 34.69% 189 116 62.93%
$1,000,000 to $1,999,999 589 460 28.04% 45 32 40.63%
$2,000,000 and over 79 83 -4.82% 6 7 -14.29%
TOTALS 26,501 26,635 -0.50% 10,710 9,730 10.07%
Single Family Condo

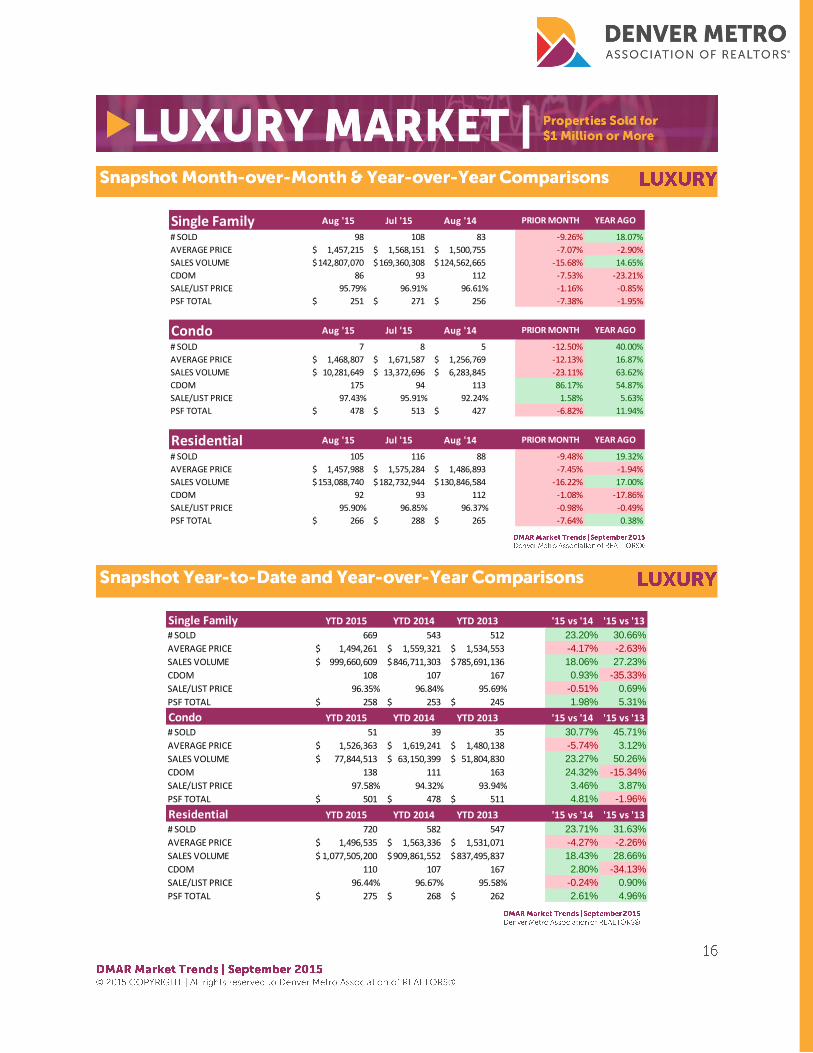
Single Family Aug '15 Jul '15 Aug '14 PRIOR MONTH YEAR AGO
# SOLD 98 108 83 -9.26% 18.07%
AVERAGE PRICE 1,457,215$ 1,568,151$ 1,500,755$ -7.07% -2.90%
SALES VOLUME 142,807,070$ 169,360,308$ 124,562,665$ -15.68% 14.65%
CDOM 86 93 112 -7.53% -23.21%
SALE/LIST PRICE 95.79% 96.91% 96.61% -1.16% -0.85%
PSF TOTAL 251$ 271$ 256$ -7.38% -1.95%
Condo Aug '15 Jul '15 Aug '14 PRIOR MONTH YEAR AGO
# SOLD 7 8 5 -12.50% 40.00%
AVERAGE PRICE 1,468,807$ 1,671,587$ 1,256,769$ -12.13% 16.87%
SALES VOLUME 10,281,649$ 13,372,696$ 6,283,845$ -23.11% 63.62%
CDOM 175 94 113 86.17% 54.87%
SALE/LIST PRICE 97.43% 95.91% 92.24% 1.58% 5.63%
PSF TOTAL 478$ 513$ 427$ -6.82% 11.94%
Residential Aug '15 Jul '15 Aug '14 PRIOR MONTH YEAR AGO
# SOLD 105 116 88 -9.48% 19.32%
AVERAGE PRICE 1,457,988$ 1,575,284$ 1,486,893$ -7.45% -1.94%
SALES VOLUME 153,088,740$ 182,732,944$ 130,846,584$ -16.22% 17.00%
CDOM 92 93 112 -1.08% -17.86%
SALE/LIST PRICE 95.90% 96.85% 96.37% -0.98% -0.49%
PSF TOTAL 266$ 288$ 265$ -7.64% 0.38%
Single Family YTD 2015 YTD 2014 YTD 2013 '15 vs '14 '15 vs '13
# SOLD 669 543 512 23.20% 30.66%
AVERAGE PRICE 1,494,261$ 1,559,321$ 1,534,553$ -4.17% -2.63%
SALES VOLUME 999,660,609$ 846,711,303$ 785,691,136$ 18.06% 27.23%
CDOM 108 107 167 0.93% -35.33%
SALE/LIST PRICE 96.35% 96.84% 95.69% -0.51% 0.69%
PSF TOTAL 258$ 253$ 245$ 1.98% 5.31%
Condo YTD 2015 YTD 2014 YTD 2013 '15 vs '14 '15 vs '13
# SOLD 51 39 35 30.77% 45.71%
AVERAGE PRICE 1,526,363$ 1,619,241$ 1,480,138$ -5.74% 3.12%
SALES VOLUME 77,844,513$ 63,150,399$ 51,804,830$ 23.27% 50.26%
CDOM 138 111 163 24.32% -15.34%
SALE/LIST PRICE 97.58% 94.32% 93.94% 3.46% 3.87%
PSF TOTAL 501$ 478$ 511$ 4.81% -1.96%
Residential YTD 2015 YTD 2014 YTD 2013 '15 vs '14 '15 vs '13
# SOLD 720 582 547 23.71% 31.63%
AVERAGE PRICE 1,496,535$ 1,563,336$ 1,531,071$ -4.27% -2.26%
SALES VOLUME 1,077,505,200$ 909,861,552$ 837,495,837$ 18.43% 28.66%
CDOM 110 107 167 2.80% -34.13%
SALE/LIST PRICE 96.44% 96.67% 95.58% -0.24% 0.90%
PSF TOTAL 275$ 268$ 262$ 2.61% 4.96%
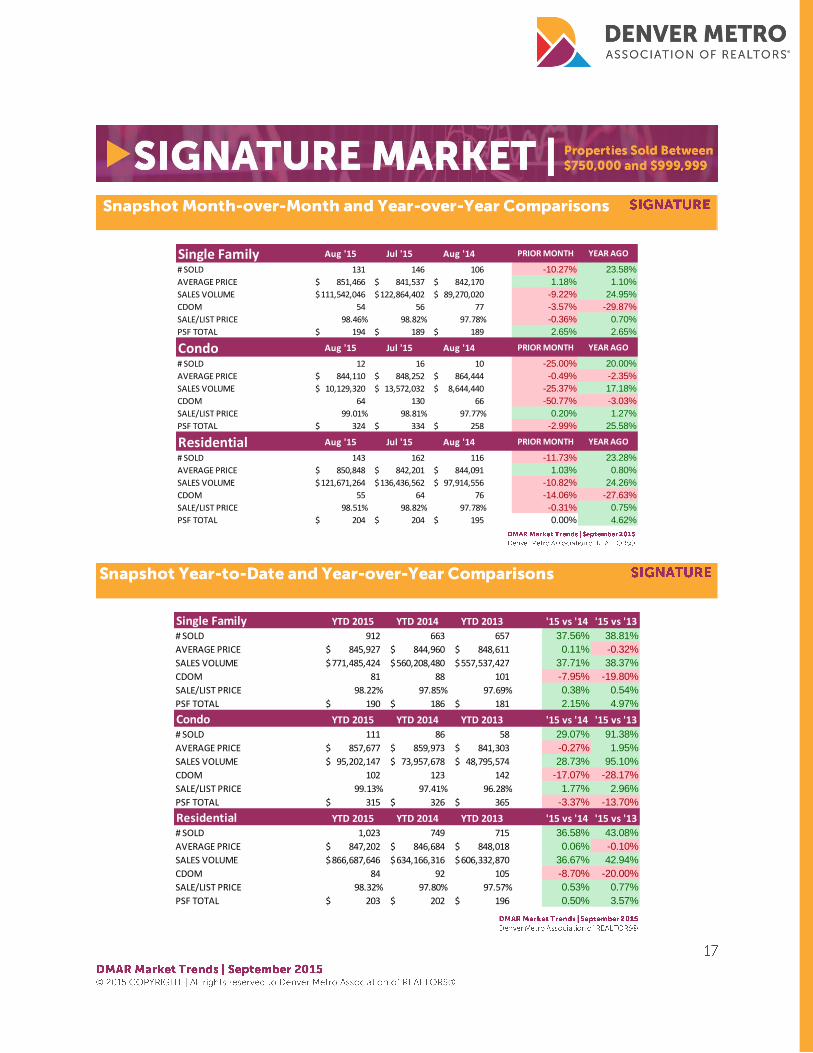
Single Family Aug '15 Jul '15 Aug '14 PRIOR MONTH YEAR AGO
# SOLD 131 146 106 -10.27% 23.58%
AVERAGE PRICE 851,466$ 841,537$ 842,170$ 1.18% 1.10%
SALES VOLUME 111,542,046$ 122,864,402$ 89,270,020$ -9.22% 24.95%
CDOM 54 56 77 -3.57% -29.87%
SALE/LIST PRICE 98.46% 98.82% 97.78% -0.36% 0.70%
PSF TOTAL 194$ 189$ 189$ 2.65% 2.65%
Condo Aug '15 Jul '15 Aug '14 PRIOR MONTH YEAR AGO
# SOLD 12 16 10 -25.00% 20.00%
AVERAGE PRICE 844,110$ 848,252$ 864,444$ -0.49% -2.35%
SALES VOLUME 10,129,320$ 13,572,032$ 8,644,440$ -25.37% 17.18%
CDOM 64 130 66 -50.77% -3.03%
SALE/LIST PRICE 99.01% 98.81% 97.77% 0.20% 1.27%
PSF TOTAL 324$ 334$ 258$ -2.99% 25.58%
Residential Aug '15 Jul '15 Aug '14 PRIOR MONTH YEAR AGO
# SOLD 143 162 116 -11.73% 23.28%
AVERAGE PRICE 850,848$ 842,201$ 844,091$ 1.03% 0.80%
SALES VOLUME 121,671,264$ 136,436,562$ 97,914,556$ -10.82% 24.26%
CDOM 55 64 76 -14.06% -27.63%
SALE/LIST PRICE 98.51% 98.82% 97.78% -0.31% 0.75%
PSF TOTAL 204$ 204$ 195$ 0.00% 4.62%
Single Family YTD 2015 YTD 2014 YTD 2013 '15 vs '14 '15 vs '13
# SOLD 912 663 657 37.56% 38.81%
AVERAGE PRICE 845,927$ 844,960$ 848,611$ 0.11% -0.32%
SALES VOLUME 771,485,424$ 560,208,480$ 557,537,427$ 37.71% 38.37%
CDOM 81 88 101 -7.95% -19.80%
SALE/LIST PRICE 98.22% 97.85% 97.69% 0.38% 0.54%
PSF TOTAL 190$ 186$ 181$ 2.15% 4.97%
Condo YTD 2015 YTD 2014 YTD 2013 '15 vs '14 '15 vs '13
# SOLD 111 86 58 29.07% 91.38%
AVERAGE PRICE 857,677$ 859,973$ 841,303$ -0.27% 1.95%
SALES VOLUME 95,202,147$ 73,957,678$ 48,795,574$ 28.73% 95.10%
CDOM 102 123 142 -17.07% -28.17%
SALE/LIST PRICE 99.13% 97.41% 96.28% 1.77% 2.96%
PSF TOTAL 315$ 326$ 365$ -3.37% -13.70%
Residential YTD 2015 YTD 2014 YTD 2013 '15 vs '14 '15 vs '13
# SOLD 1,023 749 715 36.58% 43.08%
AVERAGE PRICE 847,202$ 846,684$ 848,018$ 0.06% -0.10%
SALES VOLUME 866,687,646$ 634,166,316$ 606,332,870$ 36.67% 42.94%
CDOM 84 92 105 -8.70% -20.00%
SALE/LIST PRICE 98.32% 97.80% 97.57% 0.53% 0.77%
PSF TOTAL 203$ 202$ 196$ 0.50% 3.57%
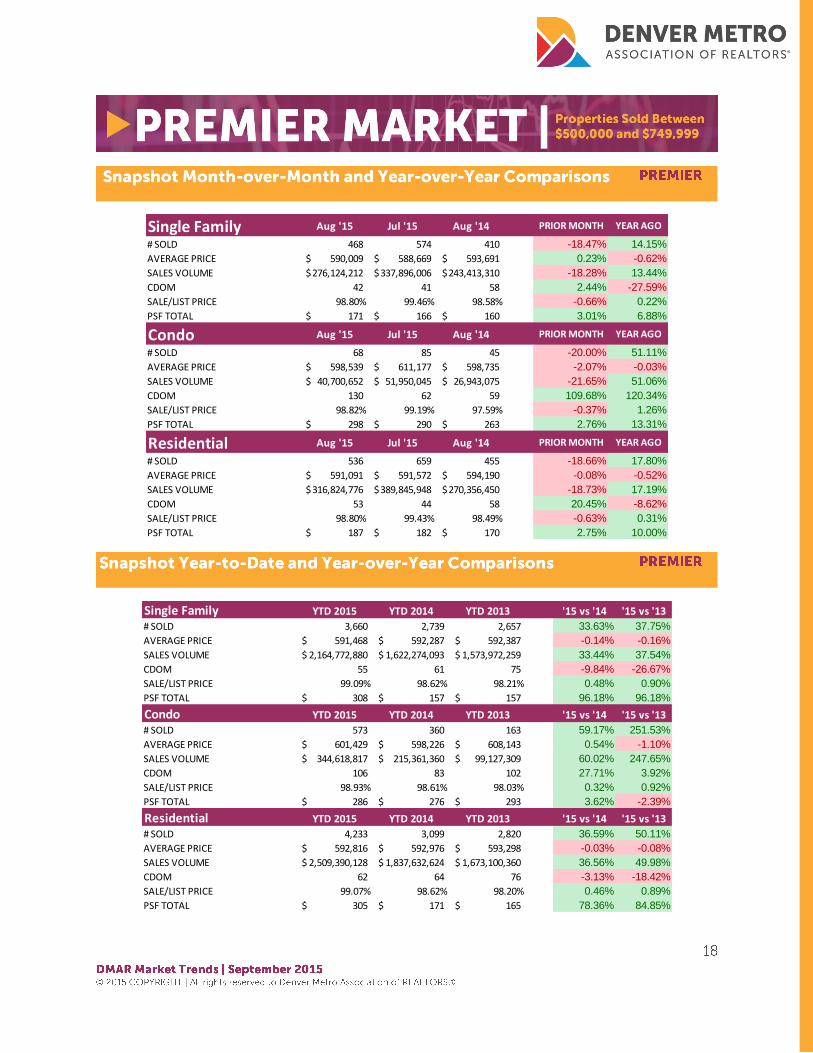
Single Family Aug '15 Jul '15 Aug '14 PRIOR MONTH YEAR AGO
# SOLD 468 574 410 -18.47% 14.15%
AVERAGE PRICE 590,009$ 588,669$ 593,691$ 0.23% -0.62%
SALES VOLUME 276,124,212$ 337,896,006$ 243,413,310$ -18.28% 13.44%
CDOM 42 41 58 2.44% -27.59%
SALE/LIST PRICE 98.80% 99.46% 98.58% -0.66% 0.22%
PSF TOTAL 171$ 166$ 160$ 3.01% 6.88%
Condo Aug '15 Jul '15 Aug '14 PRIOR MONTH YEAR AGO
# SOLD 68 85 45 -20.00% 51.11%
AVERAGE PRICE 598,539$ 611,177$ 598,735$ -2.07% -0.03%
SALES VOLUME 40,700,652$ 51,950,045$ 26,943,075$ -21.65% 51.06%
CDOM 130 62 59 109.68% 120.34%
SALE/LIST PRICE 98.82% 99.19% 97.59% -0.37% 1.26%
PSF TOTAL 298$ 290$ 263$ 2.76% 13.31%
Residential Aug '15 Jul '15 Aug '14 PRIOR MONTH YEAR AGO
# SOLD 536 659 455 -18.66% 17.80%
AVERAGE PRICE 591,091$ 591,572$ 594,190$ -0.08% -0.52%
SALES VOLUME 316,824,776$ 389,845,948$ 270,356,450$ -18.73% 17.19%
CDOM 53 44 58 20.45% -8.62%
SALE/LIST PRICE 98.80% 99.43% 98.49% -0.63% 0.31%
PSF TOTAL 187$ 182$ 170$ 2.75% 10.00%
Single Family YTD 2015 YTD 2014 YTD 2013 '15 vs '14 '15 vs '13
# SOLD 3,660 2,739 2,657 33.63% 37.75%
AVERAGE PRICE 591,468$ 592,287$ 592,387$ -0.14% -0.16%
SALES VOLUME 2,164,772,880$ 1,622,274,093$ 1,573,972,259$ 33.44% 37.54%
CDOM 55 61 75 -9.84% -26.67%
SALE/LIST PRICE 99.09% 98.62% 98.21% 0.48% 0.90%
PSF TOTAL 308$ 157$ 157$ 96.18% 96.18%
Condo YTD 2015 YTD 2014 YTD 2013 '15 vs '14 '15 vs '13
# SOLD 573 360 163 59.17% 251.53%
AVERAGE PRICE 601,429$ 598,226$ 608,143$ 0.54% -1.10%
SALES VOLUME 344,618,817$ 215,361,360$ 99,127,309$ 60.02% 247.65%
CDOM 106 83 102 27.71% 3.92%
SALE/LIST PRICE 98.93% 98.61% 98.03% 0.32% 0.92%
PSF TOTAL 286$ 276$ 293$ 3.62% -2.39%
Residential YTD 2015 YTD 2014 YTD 2013 '15 vs '14 '15 vs '13
# SOLD 4,233 3,099 2,820 36.59% 50.11%
AVERAGE PRICE 592,816$ 592,976$ 593,298$ -0.03% -0.08%
SALES VOLUME 2,509,390,128$ 1,837,632,624$ 1,673,100,360$ 36.56% 49.98%
CDOM 62 64 76 -3.13% -18.42%
SALE/LIST PRICE 99.07% 98.62% 98.20% 0.46% 0.89%
PSF TOTAL 305$ 171$ 165$ 78.36% 84.85%