Embed Size (px)
Citation preview

∎ TXT delivered a strong set of figures in H1/15. The group generated total revenues of €31.1m, which represent an increase of 13.2% y/y compared to H1/14 normalised. Sales of licenses and maintenances of TXT Retail software grew by +36.6% compared to H1/14 (i.e. Swatch and Adidas license extensions). While EBITDA margin was flat to 10.8% y/y due to higher share of employees and commercial expenses, net income advanced by +30.5% to €2.3m. In our analysis we used normalised figures given the non-recurring revenues and one-off expenses included during last fiscal year.
∎ Orders increased by +28% y/y to €35.0m for the first six months of 2015 (+40% from TXT Perform and +17% from TXT Next). TXT Perform, which focuses in planning solutions in end-to-end retail for the luxury and fashion market, improved its sales by 13.1% y/y (60% of group revenues). The best-performing division was TXT Next, which grew revenues by 13.4% y/y. Overall, international sales went up from €15.3m in H1/14 to €17m in H1/15 (56% of total sales), mainly stemmed from TXT Perform.
∎ From January to June 2015, operating cash flows were slightly up to €1.4m (vs. H1/14: €1.3m). Due to cash outflows for dividends´ distribution (€2.6m) and debts´ decrease (€2.9m), cash at the end of the period lowered by €1.9m. Thus, with around €10.4m in cash, net financial position was positive for €9.5m (vs. H1/14: €8.5m). As June 2015, TXT owned 1.3m of treasury shares (9.9% of total), purchased at an average of €2.18 per share.
∎ Despite the free capital increase (1.2m of new shares) approved in May 2015, we left unchanged our previous target price of 11€ per share. Given the strong orders and growing trend (+21.7% sales growth in Q2/15) we expect a positive development in Q3/15. Although the uncertainty in the international economies situation and an increase in competition with large players (i.e. Oracle or JDA), it seems that TXT is taking benefits from its position as first market mover. We like the starting in the Asia Pacific business, where the first license was sold for well in excess of €1m. Furthermore, in our adjusted estimates we considered an additional development of TXT solutions in the food, manufacturing and aeronautics industrials, while we left nearly unchanged our estimated profitability. Positive the shareholders remuneration for FY2014, with distributed dividend of 0.25€ per share outstanding.
∎ Key Facts
EURm 2012 2013 2014 2015E 2016E 2017E
Net sales 46.5 52.6 55.9 60.4 64.3 68.3EBITDA 5.3 6.3 6.8 6.9 7.5 8.0EBIT 4.2 5.0 5.5 5.6 6.0 6.4Net income 5.1 4.6 4.2 4.2 4.4 4.8
EPS 0.9 0.4 0.3 0.3 0.3 0.4BVPS 4.8 2.4 2.2 2.3 2.4 2.5
RoE 19.6% 16.6% 14.4% 14.2% 14.4% 14.9%EBIT margin 9.1% 9.4% 9.8% 9.2% 9.3% 9.4%
Source: company data, Dr. Kalliwoda International Research GmbH © Copyright 2003-2015
H1/15 reported growing sales and orders
01th September 2015
Mid Cap | Europe | Italy
Update
BUY
Target price: EUR 11
TXT e-solutions S.p.A.
Dr. Norbert Kalliwoda [email protected] Phone: +49 (69) 97 20 58 53 www.kalliwoda.com
Industry: Software and IT ServiceCountry: Italy
ISIN: IT0001454435
Bloomberg: TXT:IM
Reuters: TXTS.MIWebsite: txtgroup.com
Last Price: 7.73
High LowPrice 52 W.: 9.48 6.14Market Cap. (EURm) 100.54
No. of Shares 13.01
Shareholders
4CV PTE 25.60%
A. Braga Illa 13.80%Treasury shares 9.89%Management 8.10%
Kabouter 5%Float 37.6%
Performance
4 Weeks -1.77%
13 Weeks -2.51%26 Weeks -8.67%52 Weeks -1.75%
YTD 9.58%
Dividend
in EUR in %
2012 0.40 5.17%
2013 0.20 2.59%
2014 0.25 3.23% 1-year Chart
0.0
2.0
4.0
6.0
8.0
10.0
Aug-14 Dec-14 Apr-15 Aug-15
EUR
Analysts:
Dario Maugeri [email protected] Dr. Norbert Kalliwoda [email protected]
2 TXT e-solutions | Update | September 2015
Dr. Kalliwoda International Research GmbH | Primary Research
Content
1 Company profile ........................................................................................................................ 3
2 Swot ............................................................................................................................................ 4
3 Valuation .................................................................................................................................... 5
a. WACC .................................................................................................................................... …5
b. DCF-model .................................................................................................................................. 5
c. Peer Group Analysis .................................................................................................................... 6
4 H1/15 Results and Outlook ....................................................................................................... 7
a. Revenues ..................................................................................................................................... 7
b. Profitability .................................................................................................................................. 7
c. Balance Sheet and Cash Flow ..................................................................................................... 8
d. Outlook........................................................................................................................................ 8
5 Shares ..................................................................................................................................... …9
7 Financials ................................................................................................................................. 10
a. Profit and loss statement............................................................................................................ 10
b. Balance sheet ............................................................................................................................. 11
c. Cash flow statement .................................................................................................................. 12
d. Ratios ......................................................................................................................................... 12
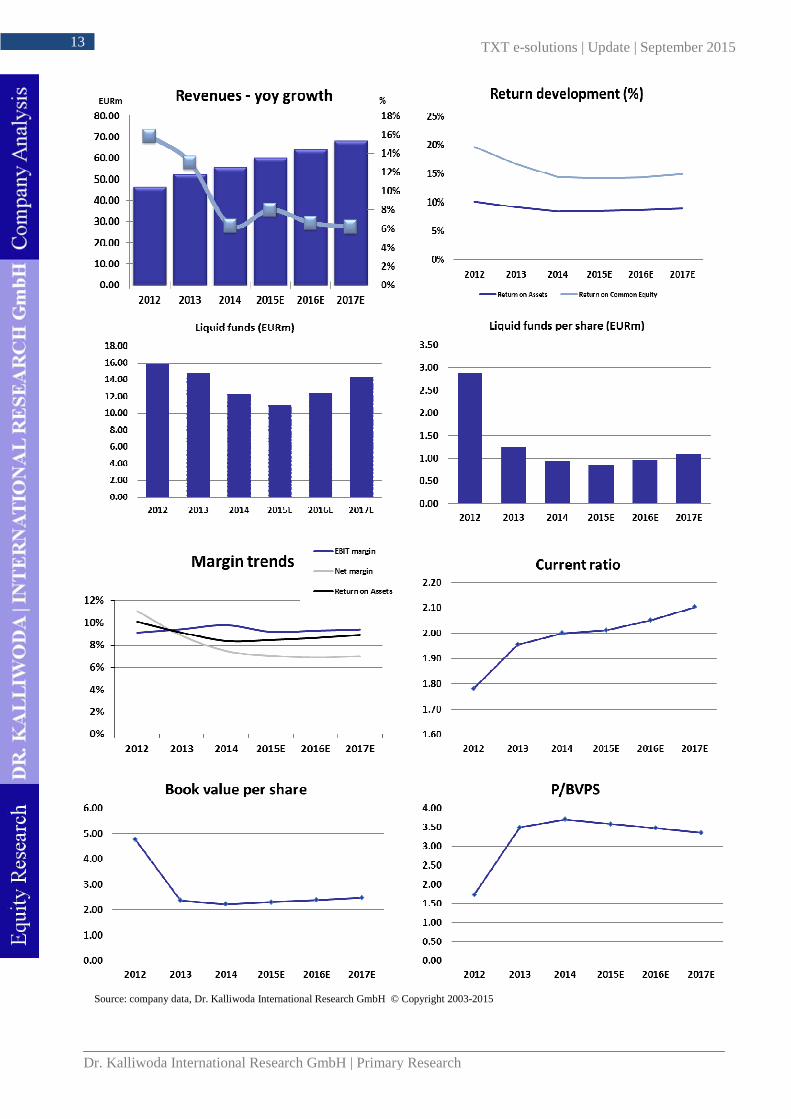
e. Summary ................................................................................................................................... 13
8 Contact ..................................................................................................................................... 14
8 Disclaimer ................................................................................................................................ 15
3 TXT e-solutions | Update | September 2015
Dr. Kalliwoda International Research GmbH | Primary Research
1. Company Profile
The group TXT e-solutions is a profitable international software specialist. Headquartered in Milan (Italy), TXT
filled an empty space in the supply chain IT solutions, developing planning software solutions in end-to-end
retail for the luxury and fashion sector. The company is divided in two business divisions: TXT Perform, which
provides IT planning solutions for luxury, fashion, retail and consumer goods; and TXT Next which focus in
software for complex operation and manufacturing for aerospace, defence, high-tech and finance. With TXT
Next division, the group expanded the business in other industries in order to capitalize its knowledge and
expertise.
After the IPO in 2000, TXT invested to become a global supply chain software vendor with a geographic
coverage of all main markets. Thus, sales grew in the North America, Germany, France, the UK and in the Asia
Pacific. With organic grown in both the divisions, the company recorded a significant increase in revenues
during the years (CAGR +11% in 2010-2014).
With the acquisition of the Canadian company Maple Lake at the end of 2012, TXT expanded its expertise of
merchandise planning and increased its international business. The acquisition brought around 50 new clients
(i.e. Levi Strauss &Co., Steve Madden, Aeropostale, Arcadia Group, Barneys New York and Columbia).
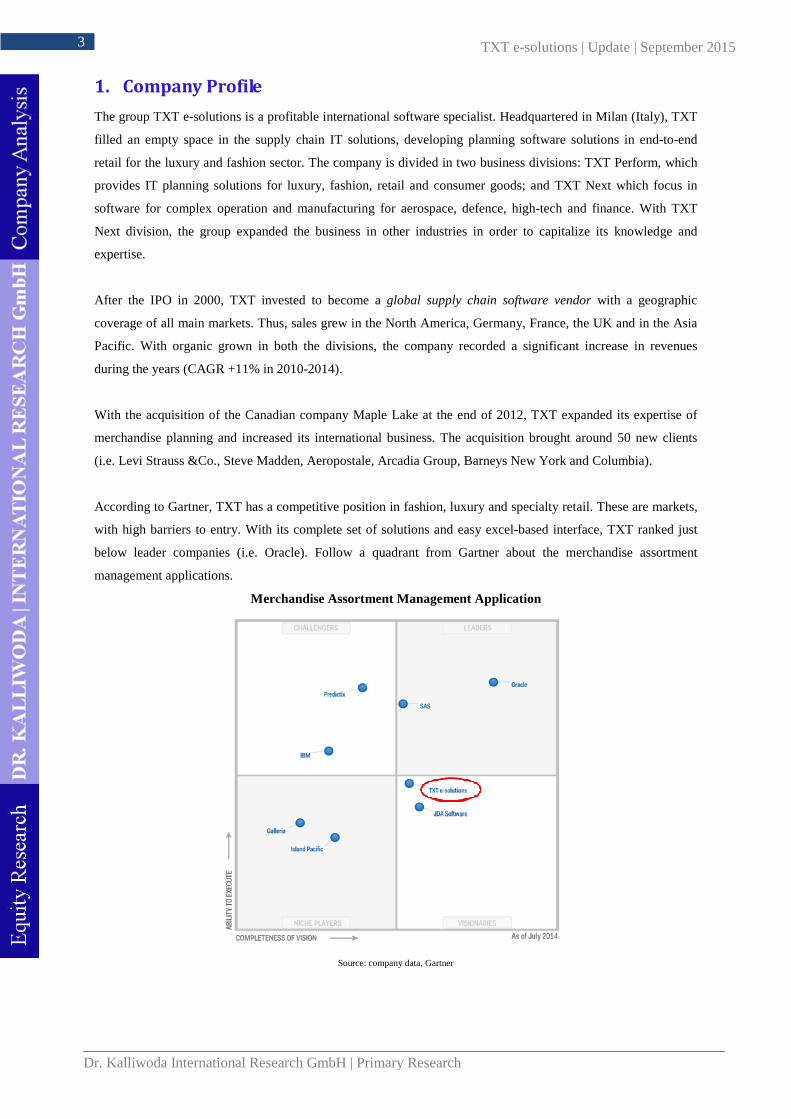
According to Gartner, TXT has a competitive position in fashion, luxury and specialty retail. These are markets,
with high barriers to entry. With its complete set of solutions and easy excel-based interface, TXT ranked just
below leader companies (i.e. Oracle). Follow a quadrant from Gartner about the merchandise assortment
management applications.
Merchandise Assortment Management Application
Source: company data, Gartner

4 TXT e-solutions | Update | September 2015
Dr. Kalliwoda International Research GmbH | Primary Research
Given the dynamic competitive environment, TXT invested heavily in new technology (R&D costs 8.7% of
revenues in H1/15) with engagement in the cloud services and in-memory processing sectors. In this global
market, the group intends to grow its sales of supply chain software solutions in the North America and Asia
Pacific area (fresh subsidiary in Hong Kong). Currently the company realise abroad about 56% of the revenues.
2. SWOT Analysis
Strengths Weaknesses
- Pioneer in the supply chain software for fashion and - Significant goodwill position, which amount to 43% of luxury. Almost 58% of sales from abroad. equity (30 June 2015).
- Self-financed business through profit, free cash flows and - Limited presence in emerging markets such as Asia, Pacific,growing stock values. Africa, the Middle East and Latin America. Strong focus in
- High entry barriers, given its customized and innovative the no-food area.solutions and well-established relations. - Continuous investments in marketing and IT modernization
- Strategic acquisition of Maple Lake, which will bring in order to compete with big players.international expertise and well-known clients (i.e. Levi s).
- Cash position of €10m, which increase the desire to acquire new fast-growing IT firms.
- Founders owns 14% of the capital.
Opportunities Threats
- Business development in North America, Asia and Pacific - Uncertainty in the fashion and luxury market, given the area. In February 2015 a new office was opened in economic slowdown and industry transformation. Hong Kong. - High competition from larger players.
- Expanding revenues mix in software, service and in other - Competition for talent leads to increasing personnel costs.retail segments. Monetization of existing clients with new - Currency risks as TXT generates more than 20% of isproducts and service. revenues outside Euro Area.
- International growth through acquisitions with possible effectof synegy from M&As
Source: company data, Dr. Kalliwoda International Research GmbH © Copyright 2003-2015
5 TXT e-solutions | Update | September 2015
Dr. Kalliwoda International Research GmbH | Primary Research
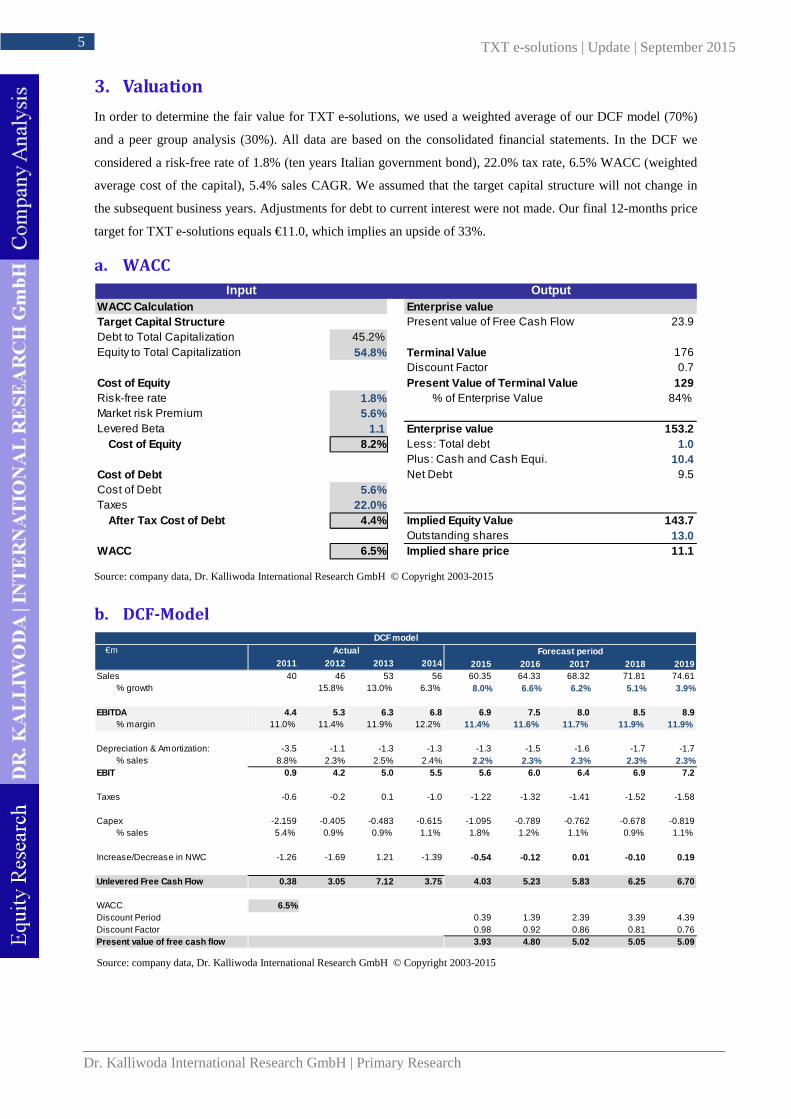
3. Valuation
In order to determine the fair value for TXT e-solutions, we used a weighted average of our DCF model (70%)
and a peer group analysis (30%). All data are based on the consolidated financial statements. In the DCF we
considered a risk-free rate of 1.8% (ten years Italian government bond), 22.0% tax rate, 6.5% WACC (weighted
average cost of the capital), 5.4% sales CAGR. We assumed that the target capital structure will not change in
the subsequent business years. Adjustments for debt to current interest were not made. Our final 12-months price
target for TXT e-solutions equals €11.0, which implies an upside of 33%.
a. WACC
WACC Calculation Enterprise valueTarget Capital Structure Present value of Free Cash Flow 23.9Debt to Total Capitalization 45.2%Equity to Total Capitalization 54.8% Terminal Value 176
Discount Factor 0.7Cost of Equity Present Value of Terminal Value 129Risk-free rate 1.8% % of Enterprise Value 84%Market risk Premium 5.6%Levered Beta 1.1 Enterprise value 153.2 Cost of Equity 8.2% Less: Total debt 1.0
Plus: Cash and Cash Equi. 10.4Cost of Debt Net Debt 9.5Cost of Debt 5.6%Taxes 22.0% After Tax Cost of Debt 4.4% Implied Equity Value 143.7
Outstanding shares 13.0WACC 6.5% Implied share price 11.1
OutputInput
Source: company data, Dr. Kalliwoda International Research GmbH © Copyright 2003-2015
b. DCF-Model
€m
2011 2012 2013 2014 2015 2016 2017 2018 2019Sales 40 46 53 56 60.35 64.33 68.32 71.81 74.61
% growth 15.8% 13.0% 6.3% 8.0% 6.6% 6.2% 5.1% 3.9%
EBITDA 4.4 5.3 6.3 6.8 6.9 7.5 8.0 8.5 8.9% margin 11.0% 11.4% 11.9% 12.2% 11.4% 11.6% 11.7% 11.9% 11.9%
Depreciation & Amortization: -3.5 -1.1 -1.3 -1.3 -1.3 -1.5 -1.6 -1.7 -1.7% sales 8.8% 2.3% 2.5% 2.4% 2.2% 2.3% 2.3% 2.3% 2.3%
EBIT 0.9 4.2 5.0 5.5 5.6 6.0 6.4 6.9 7.2
Taxes -0.6 -0.2 0.1 -1.0 -1.22 -1.32 -1.41 -1.52 -1.58
Capex -2.159 -0.405 -0.483 -0.615 -1.095 -0.789 -0.762 -0.678 -0.819% sales 5.4% 0.9% 0.9% 1.1% 1.8% 1.2% 1.1% 0.9% 1.1%
Increase/Decrease in NWC -1.26 -1.69 1.21 -1.39 -0.54 -0.12 0.01 -0.10 0.19
Unlevered Free Cash Flow 0.38 3.05 7.12 3.75 4.03 5.23 5.83 6.25 6.70
WACC 6.5%Discount Period 0.39 1.39 2.39 3.39 4.39Discount Factor 0.98 0.92 0.86 0.81 0.76Present value of free cash flow 3.93 4.80 5.02 5.05 5.09
ActualDCF model
Forecast period
Source: company data, Dr. Kalliwoda International Research GmbH © Copyright 2003-2015
6 TXT e-solutions | Update | September 2015
Dr. Kalliwoda International Research GmbH | Primary Research
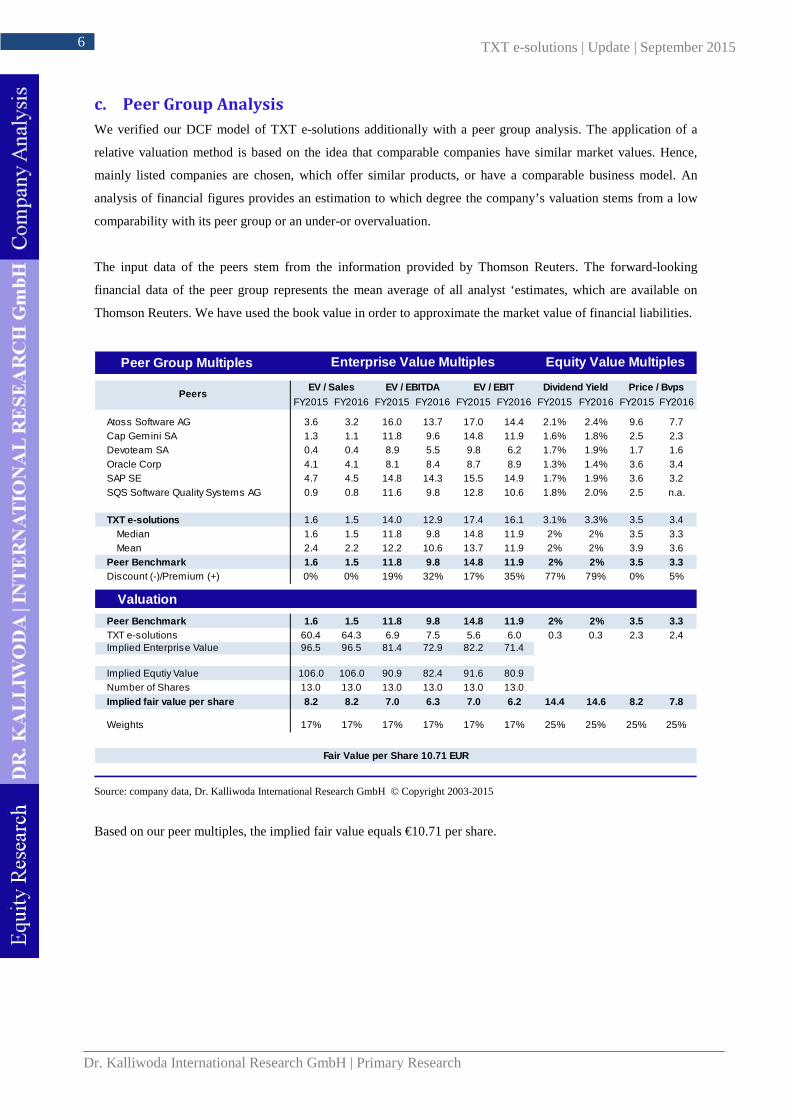
c. Peer Group Analysis
We verified our DCF model of TXT e-solutions additionally with a peer group analysis. The application of a
relative valuation method is based on the idea that comparable companies have similar market values. Hence,
mainly listed companies are chosen, which offer similar products, or have a comparable business model. An
analysis of financial figures provides an estimation to which degree the company’s valuation stems from a low
comparability with its peer group or an under-or overvaluation.
The input data of the peers stem from the information provided by Thomson Reuters. The forward-looking
financial data of the peer group represents the mean average of all analyst ‘estimates, which are available on
Thomson Reuters. We have used the book value in order to approximate the market value of financial liabilities.
Peer Group Multiples
FY2015 FY2016 FY2015 FY2016 FY2015 FY2016 FY2015 FY2016 FY2015 FY2016
Atoss Software AG 3.6 3.2 16.0 13.7 17.0 14.4 2.1% 2.4% 9.6 7.7Cap Gemini SA 1.3 1.1 11.8 9.6 14.8 11.9 1.6% 1.8% 2.5 2.3Devoteam SA 0.4 0.4 8.9 5.5 9.8 6.2 1.7% 1.9% 1.7 1.6Oracle Corp 4.1 4.1 8.1 8.4 8.7 8.9 1.3% 1.4% 3.6 3.4SAP SE 4.7 4.5 14.8 14.3 15.5 14.9 1.7% 1.9% 3.6 3.2SQS Software Quality Systems AG 0.9 0.8 11.6 9.8 12.8 10.6 1.8% 2.0% 2.5 n.a.
TXT e-solutions 1.6 1.5 14.0 12.9 17.4 16.1 3.1% 3.3% 3.5 3.4Median 1.6 1.5 11.8 9.8 14.8 11.9 2% 2% 3.5 3.3Mean 2.4 2.2 12.2 10.6 13.7 11.9 2% 2% 3.9 3.6
Peer Benchmark 1.6 1.5 11.8 9.8 14.8 11.9 2% 2% 3.5 3.3Discount (-)/Premium (+) 0% 0% 19% 32% 17% 35% 77% 79% 0% 5%
Valuation
Peer Benchmark 1.6 1.5 11.8 9.8 14.8 11.9 2% 2% 3.5 3.3TXT e-solutions 60.4 64.3 6.9 7.5 5.6 6.0 0.3 0.3 2.3 2.4Implied Enterprise Value 96.5 96.5 81.4 72.9 82.2 71.4- Preferred Equity 0.0 0.0 0.0 0.0 0.0 0.0
Implied Equtiy Value 106.0 106.0 90.9 82.4 91.6 80.9Number of Shares 13.0 13.0 13.0 13.0 13.0 13.0Implied fair value per share 8.2 8.2 7.0 6.3 7.0 6.2 14.4 14.6 8.2 7.8
Weights 17% 17% 17% 17% 17% 17% 25% 25% 25% 25%
Enterprise Value Multiples Equity Value Multiples
PeersEV / Sales EV / EBITDA EV / EBIT Dividend Yield Price / Bvps
Fair Value per Share 10.71 EUR
Source: company data, Dr. Kalliwoda International Research GmbH © Copyright 2003-2015
Based on our peer multiples, the implied fair value equals €10.71 per share.
7 TXT e-solutions | Update | September 2015
Dr. Kalliwoda International Research GmbH | Primary Research
4. H1/15 Results and Outlook
Revenues
In H1/15, TXT e-solutions realized total revenues of €31.1m, which were 13.2% higher compared to H1/14
normalized. This performance stemmed from an increase in revenues and orders in both the divisions. Sales of
licences and maintenance had a share of 27% in total sales, while orders came at €35m, 28% y/y compared to
H1/14. Given non-recurring income and costs included in 2014 figures, respectively of €1.5m (indemnity of two
sellers of Maple Lake) and of €0.4m, we chose to consider in our analysis the normalised data.
With a share in total sales of 60%, the core business TXT Perform grew revenues to €18.8m, +13.1% y/y and
orders up +40%. Driven by the first license sold in Asia for over €1m (management of over 40 duty free and
galleria stores in airports and tourist locations) and by an important contract in the aeronautic business,
international sales grew by 13.5% (vs. H1/14 norm.), accounting for 56% of total sales.
H1/15 vs. previous year H1/15 vs. previous year
in EURm H1/15 H1/14 % H1/14 norm. % norm.
Net sales 31.1 29.0 7.4% 27.5 13.2%
EBITDA 3.4 4.0 -16.2% 3.0 13.7%
EBITDA margin 10.8% 13.9% 10.8%
EBIT 2.9 3.4 -15.7% 2.3 22.8%
EBIT margin 9.2% 11.7% 8.5%
Net income 2.3 2.7 -0.1 1.8 0.3
Net margin 7.5% 9.2% 6.5% Source: company data, Dr. Kalliwoda International Research GmbH © Copyright 2003-2015
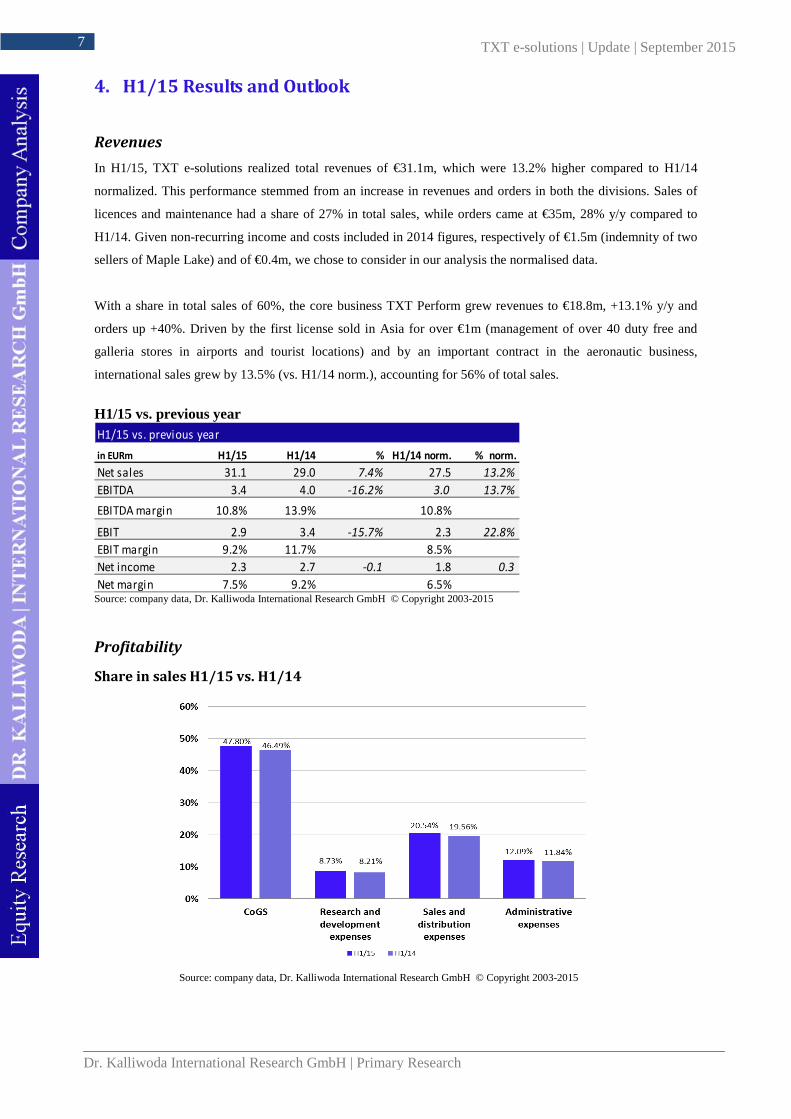
Profitability
Share in sales H1/15 vs. H1/14
Source: company data, Dr. Kalliwoda International Research GmbH © Copyright 2003-2015
8 TXT e-solutions | Update | September 2015
Dr. Kalliwoda International Research GmbH | Primary Research
Although additional investments in R&D (+14.1%) and marketing (+12.8%), EBITDA grew by +13.7% in
H1/15 (vs. norm. HI/14), accounting for 10.8% of revenues. Net income increased by 30.5% to €2.3m compared
to normalized H1/14 (income tax 15%).
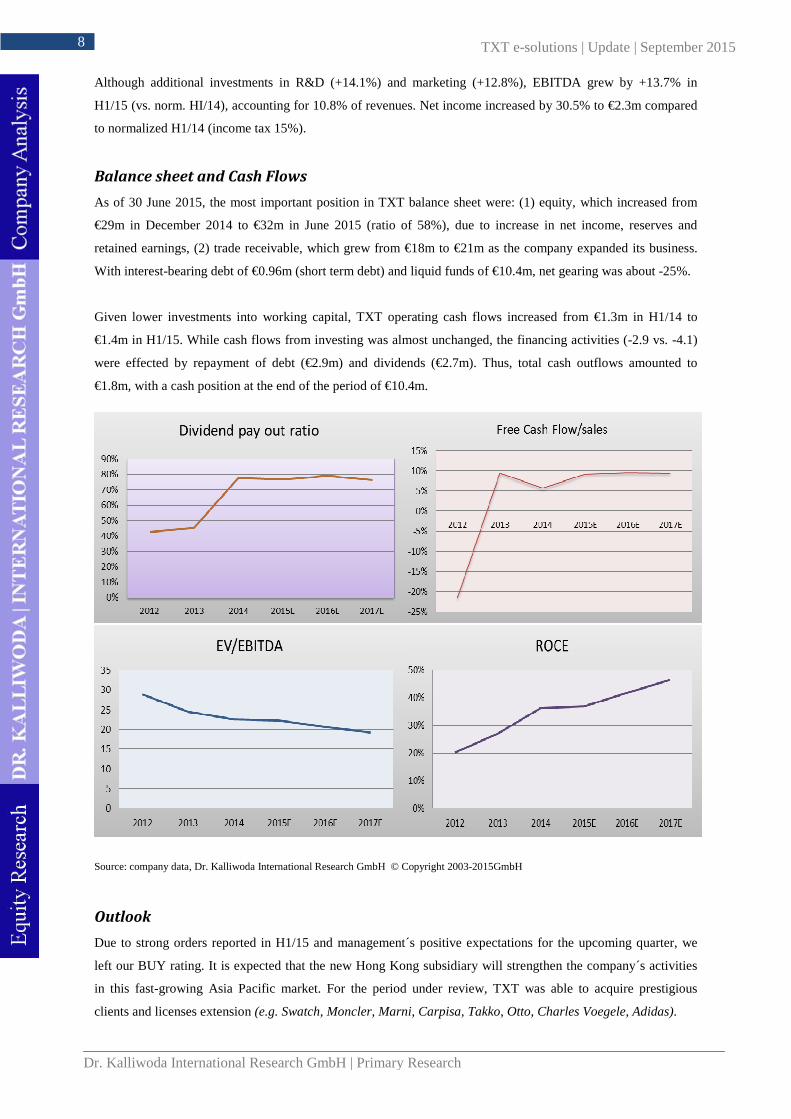
Balance sheet and Cash Flows
As of 30 June 2015, the most important position in TXT balance sheet were: (1) equity, which increased from
€29m in December 2014 to €32m in June 2015 (ratio of 58%), due to increase in net income, reserves and
retained earnings, (2) trade receivable, which grew from €18m to €21m as the company expanded its business.
With interest-bearing debt of €0.96m (short term debt) and liquid funds of €10.4m, net gearing was about -25%.
Given lower investments into working capital, TXT operating cash flows increased from €1.3m in H1/14 to
€1.4m in H1/15. While cash flows from investing was almost unchanged, the financing activities (-2.9 vs. -4.1)
were effected by repayment of debt (€2.9m) and dividends (€2.7m). Thus, total cash outflows amounted to
€1.8m, with a cash position at the end of the period of €10.4m.
Source: company data, Dr. Kalliwoda International Research GmbH © Copyright 2003-2015GmbH
Outlook
Due to strong orders reported in H1/15 and management´s positive expectations for the upcoming quarter, we
left our BUY rating. It is expected that the new Hong Kong subsidiary will strengthen the company´s activities
in this fast-growing Asia Pacific market. For the period under review, TXT was able to acquire prestigious
clients and licenses extension (e.g. Swatch, Moncler, Marni, Carpisa, Takko, Otto, Charles Voegele, Adidas).

9 TXT e-solutions | Update | September 2015
Dr. Kalliwoda International Research GmbH | Primary Research
Therefore, we increased our revenues estimates for 2015E-2019E (CAGR of 5.4%) and adjusted our earnings
estimates taking into account difficulties in the competitive environment and increasing personal and marketing
expenditures. Thus, in our analysis we left nearly unaffected the profitability previously estimated and we
assumed further growth in operating cash flows in 2015E-2017E. We found TXT able to generate sustainable
growing revenues with positive cash flows. The cash on hand of €10.4m represent a good opportunities for
future acquisitions.
Our estimates for fiscal-year 2015E-17E EURm 2015E 2016E 2017E
Net sales 60.4 64.3 68.3
EBITDA 6.9 7.5 8.0
EBITDA margin 11.4% 11.6% 11.7%
EBIT 5.6 6.0 6.4
EBIT margin 9.2% 9.3% 9.4%
Net income 4.2 4.4 4.8
Net margin 7.0% 6.9% 7.0% Source: company data, Dr. Kalliwoda International Research GmbH © Copyright 2003-2015
5. Shares
At the end of June 2015, the company held about 1.3m treasury shares (9.89% of issued shares), bought at an
average price of €2.18. The holding company 4CV PTE Ltd held 25.6%, followed by the founder A. Braga Illa
with 13.8% of the capital and by the management with 8.1%. The US fund Kabouter Management holds 5%.
Share price performance 2014/15 Shareholder structure (As of June 2015)
Source: company data, Dr. Kalliwoda International Research GmbH © Copyright 2003-2015
10 TXT e-solutions | Update | September 2015
Dr. Kalliwoda International Research GmbH | Primary Research
6. Financials
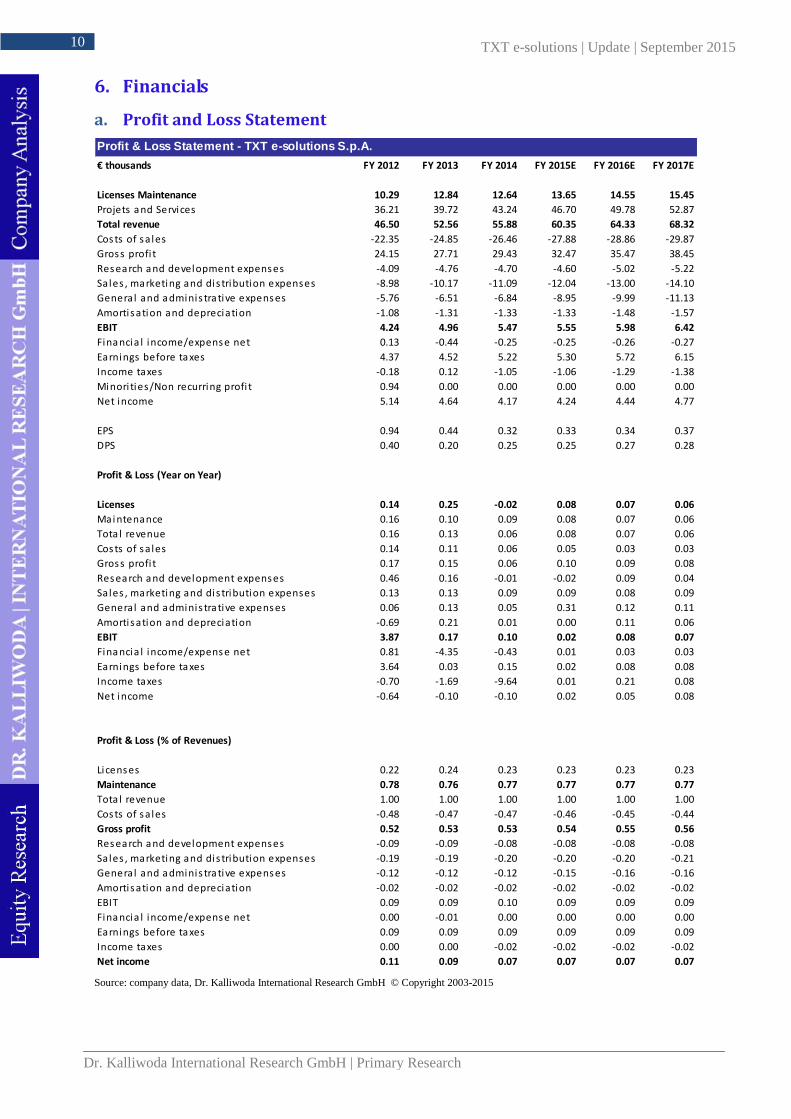
a. Profit and Loss Statement
€ thousands FY 2012 FY 2013 FY 2014 FY 2015E FY 2016E FY 2017E
Licenses Maintenance 10.29 12.84 12.64 13.65 14.55 15.45
Projets and Services 36.21 39.72 43.24 46.70 49.78 52.87
Total revenue 46.50 52.56 55.88 60.35 64.33 68.32
Cos ts of s a les -22.35 -24.85 -26.46 -27.88 -28.86 -29.87
Gros s profi t 24.15 27.71 29.43 32.47 35.47 38.45
Res earch and development expens es -4.09 -4.76 -4.70 -4.60 -5.02 -5.22
Sales , marketing and dis tribution expenses -8.98 -10.17 -11.09 -12.04 -13.00 -14.10
General and adminis tra tive expens es -5.76 -6.51 -6.84 -8.95 -9.99 -11.13
Amortis ation and depreciation -1.08 -1.31 -1.33 -1.33 -1.48 -1.57
EBIT 4.24 4.96 5.47 5.55 5.98 6.42
Financia l income/expens e net 0.13 -0.44 -0.25 -0.25 -0.26 -0.27
Earnings before taxes 4.37 4.52 5.22 5.30 5.72 6.15
Income taxes -0.18 0.12 -1.05 -1.06 -1.29 -1.38
Minori ties/Non recurring profi t 0.94 0.00 0.00 0.00 0.00 0.00
Net income 5.14 4.64 4.17 4.24 4.44 4.77
EPS 0.94 0.44 0.32 0.33 0.34 0.37
DPS 0.40 0.20 0.25 0.25 0.27 0.28
Profit & Loss (Year on Year)
Licenses 0.14 0.25 -0.02 0.08 0.07 0.06
Mai ntenance 0.16 0.10 0.09 0.08 0.07 0.06
Tota l revenue 0.16 0.13 0.06 0.08 0.07 0.06
Cos ts of s a les 0.14 0.11 0.06 0.05 0.03 0.03
Gros s profi t 0.17 0.15 0.06 0.10 0.09 0.08
Res earch and development expens es 0.46 0.16 -0.01 -0.02 0.09 0.04
Sales , marketing and dis tribution expenses 0.13 0.13 0.09 0.09 0.08 0.09
General and adminis tra tive expens es 0.06 0.13 0.05 0.31 0.12 0.11
Amortis ation and depreciation -0.69 0.21 0.01 0.00 0.11 0.06
EBIT 3.87 0.17 0.10 0.02 0.08 0.07
Financia l income/expens e net 0.81 -4.35 -0.43 0.01 0.03 0.03
Earnings before taxes 3.64 0.03 0.15 0.02 0.08 0.08
Income taxes -0.70 -1.69 -9.64 0.01 0.21 0.08
Net income -0.64 -0.10 -0.10 0.02 0.05 0.08
Profit & Loss (% of Revenues)
Licens es 0.22 0.24 0.23 0.23 0.23 0.23
Maintenance 0.78 0.76 0.77 0.77 0.77 0.77
Tota l revenue 1.00 1.00 1.00 1.00 1.00 1.00
Cos ts of s a les -0.48 -0.47 -0.47 -0.46 -0.45 -0.44
Gross profit 0.52 0.53 0.53 0.54 0.55 0.56
Res earch and development expens es -0.09 -0.09 -0.08 -0.08 -0.08 -0.08
Sales , marketing and dis tribution expenses -0.19 -0.19 -0.20 -0.20 -0.20 -0.21
General and adminis tra tive expens es -0.12 -0.12 -0.12 -0.15 -0.16 -0.16
Amortis ation and depreciation -0.02 -0.02 -0.02 -0.02 -0.02 -0.02
EBIT 0.09 0.09 0.10 0.09 0.09 0.09
Financia l income/expens e net 0.00 -0.01 0.00 0.00 0.00 0.00
Earnings before taxes 0.09 0.09 0.09 0.09 0.09 0.09
Income taxes 0.00 0.00 -0.02 -0.02 -0.02 -0.02
Net income 0.11 0.09 0.07 0.07 0.07 0.07
Profit & Loss Statement - TXT e-solutions S.p.A.
Source: company data, Dr. Kalliwoda International Research GmbH © Copyright 2003-2015
11 TXT e-solutions | Update | September 2015
Dr. Kalliwoda International Research GmbH | Primary Research
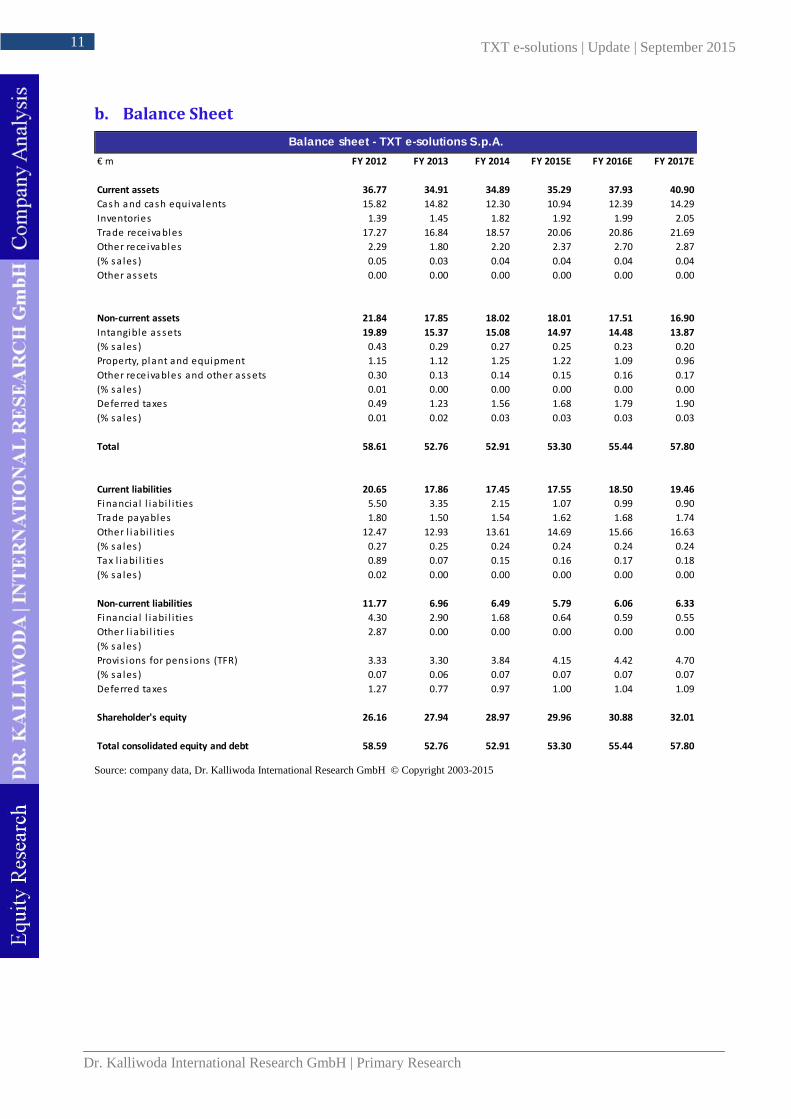
b. Balance Sheet
€ m FY 2012 FY 2013 FY 2014 FY 2015E FY 2016E FY 2017E
Current assets 36.77 34.91 34.89 35.29 37.93 40.90
Cas h and cash equiva lents 15.82 14.82 12.30 10.94 12.39 14.29
Inventories 1.39 1.45 1.82 1.92 1.99 2.05
Trade recei va bles 17.27 16.84 18.57 20.06 20.86 21.69
Other receivables 2.29 1.80 2.20 2.37 2.70 2.87
(% s a les ) 0.05 0.03 0.04 0.04 0.04 0.04
Other as sets 0.00 0.00 0.00 0.00 0.00 0.00
Non-current assets 21.84 17.85 18.02 18.01 17.51 16.90
Intangi ble as sets 19.89 15.37 15.08 14.97 14.48 13.87
(% s a les ) 0.43 0.29 0.27 0.25 0.23 0.20
Property, pl ant and equi pment 1.15 1.12 1.25 1.22 1.09 0.96
Other receivables and other ass ets 0.30 0.13 0.14 0.15 0.16 0.17
(% s a les ) 0.01 0.00 0.00 0.00 0.00 0.00
Deferred taxes 0.49 1.23 1.56 1.68 1.79 1.90
(% s a les ) 0.01 0.02 0.03 0.03 0.03 0.03
Total 58.61 52.76 52.91 53.30 55.44 57.80
Current liabilities 20.65 17.86 17.45 17.55 18.50 19.46
Fi nancia l l iabi l i ties 5.50 3.35 2.15 1.07 0.99 0.90
Trade payables 1.80 1.50 1.54 1.62 1.68 1.74
Other l i abi l i ti es 12.47 12.93 13.61 14.69 15.66 16.63
(% s a les ) 0.27 0.25 0.24 0.24 0.24 0.24
Tax l i abi l i ti es 0.89 0.07 0.15 0.16 0.17 0.18
(% s a les ) 0.02 0.00 0.00 0.00 0.00 0.00
Non-current liabilities 11.77 6.96 6.49 5.79 6.06 6.33
Fi nancia l l iabi l i ties 4.30 2.90 1.68 0.64 0.59 0.55
Other l i abi l i ti es 2.87 0.00 0.00 0.00 0.00 0.00
(% s a les )
Provis ions for pens ions (TFR) 3.33 3.30 3.84 4.15 4.42 4.70
(% s a les ) 0.07 0.06 0.07 0.07 0.07 0.07
Deferred taxes 1.27 0.77 0.97 1.00 1.04 1.09
Shareholder's equity 26.16 27.94 28.97 29.96 30.88 32.01
Total consolidated equity and debt 58.59 52.76 52.91 53.30 55.44 57.80
Balance sheet - TXT e-solutions S.p.A.
Source: company data, Dr. Kalliwoda International Research GmbH © Copyright 2003-2015
12 TXT e-solutions | Update | September 2015
Dr. Kalliwoda International Research GmbH | Primary Research
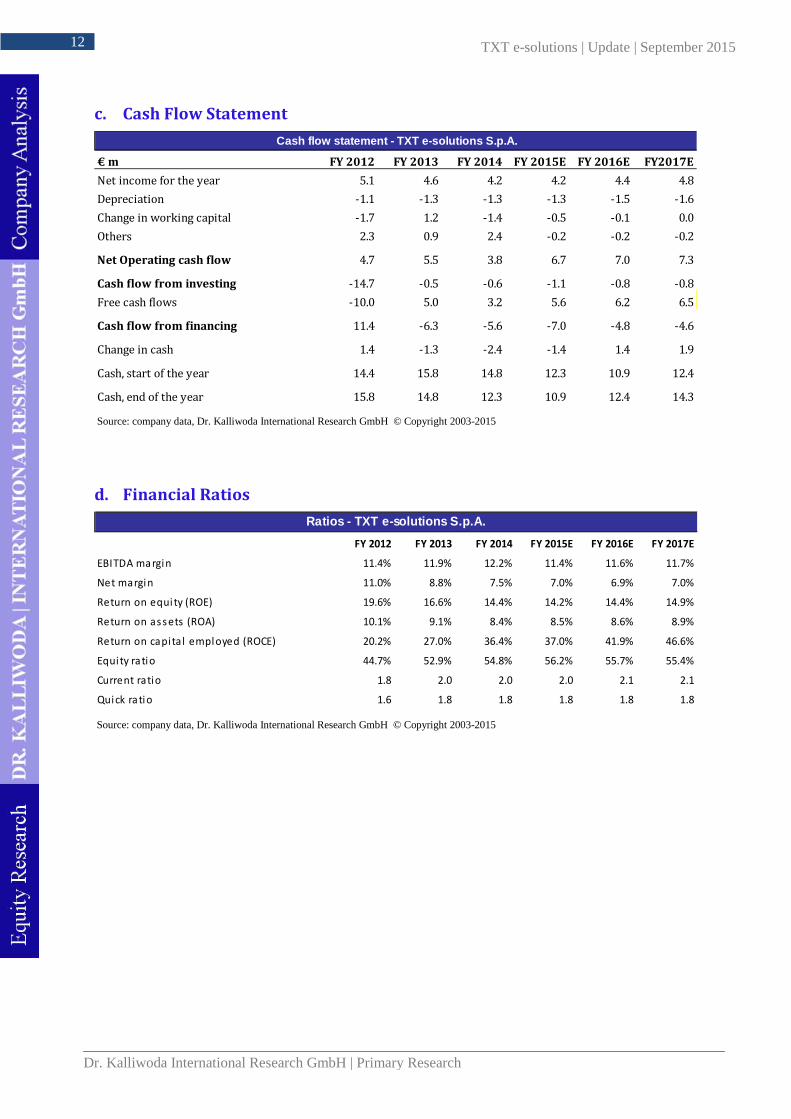
c. Cash Flow Statement
€ m FY 2012 FY 2013 FY 2014 FY 2015E FY 2016E FY2017E
Net income for the year 5.1 4.6 4.2 4.2 4.4 4.8
Depreciation -1.1 -1.3 -1.3 -1.3 -1.5 -1.6
Change in working capital -1.7 1.2 -1.4 -0.5 -0.1 0.0
Others 2.3 0.9 2.4 -0.2 -0.2 -0.2
Net Operating cash flow 4.7 5.5 3.8 6.7 7.0 7.3
Cash flow from investing -14.7 -0.5 -0.6 -1.1 -0.8 -0.8
Free cash flows -10.0 5.0 3.2 5.6 6.2 6.5
Cash flow from financing 11.4 -6.3 -5.6 -7.0 -4.8 -4.6
Change in cash 1.4 -1.3 -2.4 -1.4 1.4 1.9
Cash, start of the year 14.4 15.8 14.8 12.3 10.9 12.4
Cash, end of the year 15.8 14.8 12.3 10.9 12.4 14.3
Cash flow statement - TXT e-solutions S.p.A.
Source: company data, Dr. Kalliwoda International Research GmbH © Copyright 2003-2015
d. Financial Ratios
FY 2012 FY 2013 FY 2014 FY 2015E FY 2016E FY 2017E
EBITDA margin 11.4% 11.9% 12.2% 11.4% 11.6% 11.7%
Net margin 11.0% 8.8% 7.5% 7.0% 6.9% 7.0%
Return on equi ty (ROE) 19.6% 16.6% 14.4% 14.2% 14.4% 14.9%
Return on as s ets (ROA) 10.1% 9.1% 8.4% 8.5% 8.6% 8.9%
Return on capita l employed (ROCE) 20.2% 27.0% 36.4% 37.0% 41.9% 46.6%
Equi ty ra tio 44.7% 52.9% 54.8% 56.2% 55.7% 55.4%
Current ratio 1.8 2.0 2.0 2.0 2.1 2.1
Quick ratio 1.6 1.8 1.8 1.8 1.8 1.8
Ratios - TXT e-solutions S.p.A.
Source: company data, Dr. Kalliwoda International Research GmbH © Copyright 2003-2015
13 TXT e-solutions | Update | September 2015
Dr. Kalliwoda International Research GmbH | Primary Research
Source: company data, Dr. Kalliwoda International Research GmbH © Copyright 2003-2015
14 TXT e-solutions | Update | September 2015
Dr. Kalliwoda International Research GmbH | Primary Research
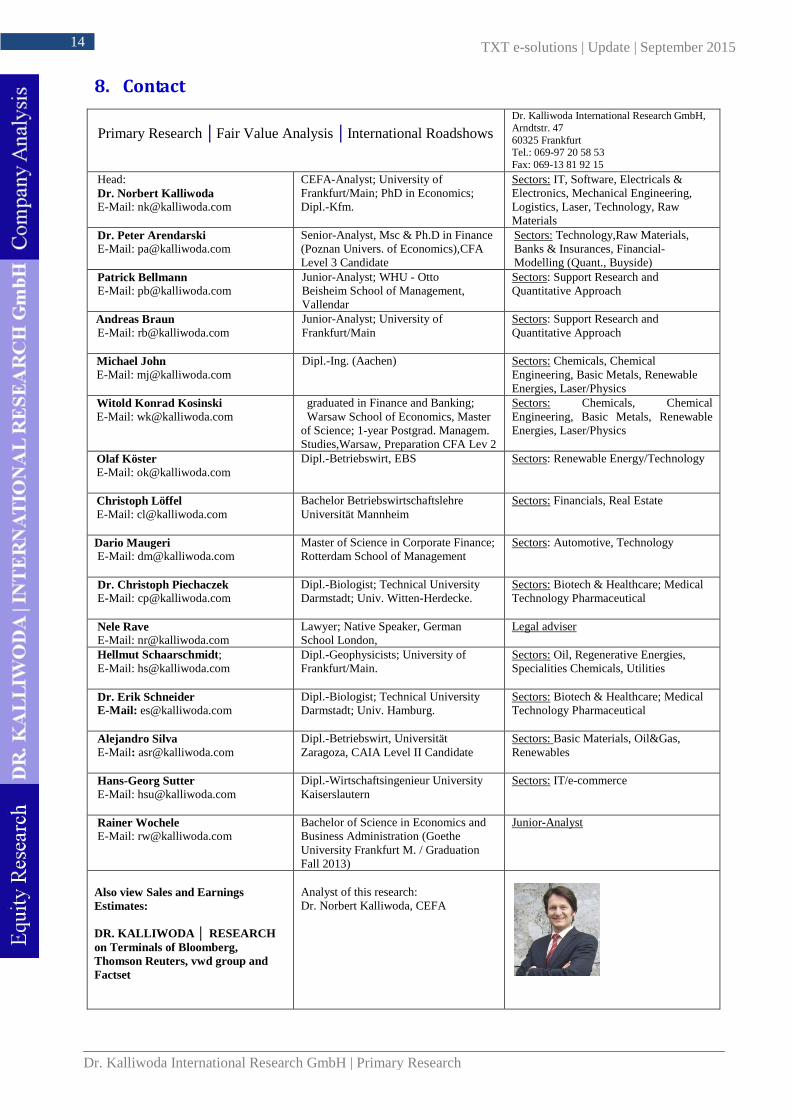
8. Contact
Primary Research │Fair Value Analysis │International Roadshows
Dr. Kalliwoda International Research GmbH, Arndtstr. 47 60325 Frankfurt Tel.: 069-97 20 58 53 Fax: 069-13 81 92 15 Head:
Dr. Norbert Kalliwoda E-Mail: [email protected]
CEFA-Analyst; University of Frankfurt/Main; PhD in Economics; Dipl.-Kfm.
Sectors: IT, Software, Electricals & Electronics, Mechanical Engineering, Logistics, Laser, Technology, Raw Materials
Dr. Peter Arendarski E-Mail: [email protected]
Senior-Analyst, Msc & Ph.D in Finance (Poznan Univers. of Economics),CFA Level 3 Candidate
Sectors: Technology,Raw Materials, Banks & Insurances, Financial-Modelling (Quant., Buyside)
Patrick Bellmann E-Mail: [email protected]
Junior-Analyst; WHU - Otto Beisheim School of Management, Vallendar
Sectors: Support Research and Quantitative Approach
Robin Andreas Braun E-Mail: [email protected]
Junior-Analyst; University of Frankfurt/Main
Sectors: Support Research and Quantitative Approach
Michael John E-Mail: [email protected]
Dipl.-Ing. (Aachen) Sectors: Chemicals, Chemical Engineering, Basic Metals, Renewable Energies, Laser/Physics
Witold Konrad Kosinski E-Mail: [email protected]
graduated in Finance and Banking; Warsaw School of Economics, Master of Science; 1-year Postgrad. Managem. Studies,Warsaw, Preparation CFA Lev 2
Sectors: Chemicals, Chemical Engineering, Basic Metals, Renewable Energies, Laser/Physics
Olaf Köster E-Mail: [email protected]
Dipl.-Betriebswirt, EBS Sectors: Renewable Energy/Technology
Christoph Löffel E-Mail: [email protected]
Bachelor Betriebswirtschaftslehre Universität Mannheim
Sectors: Financials, Real Estate
Dario Maugeri E-Mail: [email protected]
Master of Science in Corporate Finance; Rotterdam School of Management
Sectors: Automotive, Technology
Dr. Christoph Piechaczek E-Mail: [email protected]
Dipl.-Biologist; Technical University Darmstadt; Univ. Witten-Herdecke.
Sectors: Biotech & Healthcare; Medical Technology Pharmaceutical
Nele Rave E-Mail: [email protected]
Lawyer; Native Speaker, German School London,
Legal adviser
Hellmut Schaarschmidt; E-Mail: [email protected]
Dipl.-Geophysicists; University of Frankfurt/Main.
Sectors: Oil, Regenerative Energies, Specialities Chemicals, Utilities
Dr. Erik Schneider E-Mail: [email protected]
Dipl.-Biologist; Technical University Darmstadt; Univ. Hamburg.
Sectors: Biotech & Healthcare; Medical Technology Pharmaceutical
Alejandro Silva E-Mail: [email protected]
Dipl.-Betriebswirt, Universität Zaragoza, CAIA Level II Candidate
Sectors: Basic Materials, Oil&Gas, Renewables
Hans-Georg Sutter E-Mail: [email protected]
Dipl.-Wirtschaftsingenieur University Kaiserslautern
Sectors: IT/e-commerce
Rainer Wochele E-Mail: [email protected]
Bachelor of Science in Economics and Business Administration (Goethe University Frankfurt M. / Graduation Fall 2013)
Junior-Analyst
Also view Sales and Earnings Estimates: DR. KALLIWODA │ RESEARCH on Terminals of Bloomberg, Thomson Reuters, vwd group and Factset
Analyst of this research: Dr. Norbert Kalliwoda, CEFA
15 TXT e-solutions | Update | September 2015
Dr. Kalliwoda International Research GmbH | Primary Research
Essential information, disclosures and disclaimer
Essential information, disclosures and disclaimer
A. Essential information
The investments in financial instruments and securities (e.g. equities, bonds) generally involved on high risks. It is possible that the investors lose some or all of the invested money. Potential investors should be aware of the fact that the prices of securities could fall and rise. The income from such an investment might be considerable fluctuations. Investment strategies are not appropriate at all times and past results are not a guarantee for the future performance. Investors should make their own and independent decisions as to whether a risky investment.
B. Disclosures according to Section 34b of the German Securities Trading Act (WpHG) and to the German Regulation governing the Analysis of Financial Instruments (FinAnV).
I. Information about author, company held accountable, regulatory authority:
Company responsible for the content of this document: DR. KALLIWODA INTERNATIONAL RESEARCH GmbH, Frankfurt am Main, Germany.
Regulatory authority for DR. KALLIWODA INTERNATIONAL RESEARCH GmbH is the Federal Financial Supervisory Authority (BaFin), Graurheindorfer Straße 108, 53117 Bonn, Germany and Lurgiallee 12, 60439 Frankfurt am Main, Germany.
Author of this research: Dr. Norbert Kalliwoda, Analyst, CEO and founder of DR. KALLIWODA INTERNATIONAL RESEARCH GmbH.
II. Additional Information:
1. Sources of information:
Essential sources of information for the compilation of this document are publications from domestic and international information services and media (e.g. Bloomberg, dpa-AFX, Reuters, VWD, among others), financial press (e.g. Allgemeine Zeitung Frankfurter, Börsenzeitung, Financial Times Handelsblatt and others), specialized trade press, published statistics, rating agencies as well as publications by peer group companies and the company itself. Additionally, conservation has been held with the management of the company. This document was made available to the company before publishing to ensure the correctness of the information provided.
2. Summary of the basis of valuation principles and methods used to prepare this document:
Within the scope of the evaluation of companies the following valuation methods are applied: Multiple-based models (Price/Earnings, Price/Cash-flow, Price/Book value, EV/Sales, EV/EBIT, EV/EBITDA), peer group comparisons, historic valuation methods, discounting models, sum-of-the-parts-approaches, substance-valuation
16 TXT e-solutions | Update | September 2015
Dr. Kalliwoda International Research GmbH | Primary Research
methods and swot-analyses. The valuation principles and models are dependent on macroeconomic factors, such as interest rates, exchange rates, raw materials and on basic assumptions about the economy. Besides, the market moods and market sentiment affects the valuation of enterprises. The approaches are based on expectations that could change rapidly and without advance warning according on developments specific to individual branch. The valuation results and fair values derived from the models might therefore change accordingly.
The ratings are the evaluation results and refer to a fair value pricing reflecting a time-horizon of up general relate to a twelve-months. Nevertheless, evaluation results are subject to changing market conditions and constitute merely a snapshot. The evaluation results and fair values may be reached faster or slower than expected by the analysts. The results and fair values may to be scale upwards or downwards.
DR. KALLIWODA INTERNATIONAL RESEARCH GmbH uses the following rating model:
BUY: Based on our analysis, we expect the stock to appreciate and produce a total return of at least 10% over the next twelve months
ACCUMULATE: Based on our analysis, we expect the stock to appreciate and produce a total return between 5%- 10% over the next twelve months
HOLD: Based on our analysis, we expect the stock to produce a total return between -5% and +5% over the next twelve months
REDUCE: Based on our analysis, we expect the stock to cause a negative return between -5% and -10% over the next twelve months
SELL: Based on our analysis, we expect the stock to cause a negative return exceeding -10% over the next twelve months
3. Date of first publication of this document: 01th of September 2015
4. Updates:
A specific update of this document has currently not been set. The research reflects the author’s judgement on the date of this publication and is subject to change without any notice. The document might be incomplete or reduced and it may not contain all information concerning the company covered. It is in the sole decision of DR. KALLIWODA INTERNATIONAL RESEARCH GmbH whether and when a potential update of this research is made.
III. Disclosures about potential conflicts of interest:
The business model of DR. KALLIWODA INTERNATIONAL RESEARCH GmbH is based on economic relationships with issuer company and equity transactions to be performed relating to the issuer´s stock. Dr. Kalliwoda Research has entered into an agreement about the creation of this document with the company which is, or whose financial instruments are the issue of this research.
Conflicts of interest may be in existence with employees of DR. KALLIWODA INTERNATIONAL| RESEARCH GmbH who are the authors of this document as well as other persons that were involved in the preparation of this research or related parties.
17 TXT e-solutions | Update | September 2015
Dr. Kalliwoda International Research GmbH | Primary Research
Following conflicts of interest might exist:
1. DR. KALLIWODA INTERNATIONAL RESEARCH GmbH employees or other persons that were involved in the
preparation of this document or related parties might have a major shareholding (holding more than 5%) of the share capital of the emitter that is, or whose financial instruments are, the subject of the research.
2. DR. KALLIWODA INTERNATIONAL RESEARCH GmbH employees or other persons that were involved in the preparation of this document or related parties are possibly holders of instruments that are mentioned in this research (or that are linked to these instruments) or might become holders and could regularly trade the emitter´s securities or securities based on these issues as principal or agent.
3. DR. KALLIWODA INTERNATIONAL RESEARCH GmbH employees or other persons that were involved in the preparation of this document or related parties could have participated in leading a consortium for the emitter via a public offering of the financial instruments that are the subject of this research.
4. DR. KALLIWODA INTERNATIONAL RESEARCH GmbH employees or other persons that were involved in the preparation of this document or related parties might have been party to an agreement on the provision of investment banking services with the emitter which is the subject of this research, or have received services or a pledge to perform under the terms of such an arrangement during the same period.
5. DR. KALLIWODA INTERNATIONAL RESEARCH GmbH employees or other persons that were involved in the preparation of this document or related parties may have other substantial economic interests concerning to the emitter which is the subject of this research.
6. DR. KALLIWODA INTERNATIONAL RESEARCH GmbH employees or other persons that were involved in the preparation of this document or related parties might have been party to an agreement with the company, which is the subject of this research, resulting in receiving the compensation for preparation of this research.
7. DR. KALLIWODA INTERNATIONAL RESEARCH GmbH employees or other persons that were involved in the preparation of this document or related parties received the feedback concerning the company profile and SWOT from the company, which is the subject of this research, before publishing this report to the public.
Important: Please get familiar with possible risks and possible conflicts of interest in the disclosure and disclaimer at the end of this report, especially for this report: 7.
The analysts have limited access to gain information that possibly could constitute a conflict of interest for the institution DR. KALLIWODA INTERNATIONAL RESEARCH GmbH keeps insider registers appropriate to sec. 15 WpHG for assignees that normally have approach to inside information. Insiders´ dealings appropriate to sec. 14 WpHG categorically are prohibited.
The analysts that composed this research did not receive or acquire shares in the emitter that is the subject of this document at any time. The analysts mentioned above herby certify that all of the views expressed accurately reflect the individual views about the emitter. No part of the indemnity was, is or will be, directly or indirectly, linked to the evaluation result or views expressed by the analyst in this research.
C. Disclaimer:
This document is published and being distributed by DR. KALLIWODA INTERNATIONAL RESEARCH GmbH solely for informational purposes and for the personal use by persons in Germany. This research is not intended to be in any form an offer or advice to buy or sell the securities referred to herein. This research is intended to provide information to assist investors in making their own investment decisions. Any decision to purchase any securities of the emitter must be made solely on the basis of the information contained in the offering documents from the emitter relating to such securities and not on the contents hereof. Furthermore, our recommendation may not be fully suitable to every investor, depending on their investment objective, individual financial situation or targeted holding period.
18 TXT e-solutions | Update | September 2015
Dr. Kalliwoda International Research GmbH | Primary Research
Potential investors should seek professional and individual information and advice before making their investment decisions. This document neither constitutes a contract or any kind of obligation.
Neither this document nor any copy, in whole or in part, thereof may be distributed in any other jurisdiction where its distribution might be restricted by law, and person into whose published this document comes should inform and observe themselves about any such restrictions.
The information within this document has been obtained from sources believed by DR. KALLIWODA INTERNATIONAL RESEARCH GmbH to be reliable. DR. KALLIWODA INTERNATIONAL RESEARCH GmbH does not examine the information to be verify and complete, nor warrantees its correctness and completeness. Although due attention has been taken in compilation this document, it cannot be excluded that the information given is not complete or the document contains mistakes.
The liability of DR. KALLIWODA INTERNATIONAL RESEARCH GmbH shall be restricted to gross negligence and wilful misconduct. All aspects penned in this document are those of DR. KALLIWODA INTERNATIONAL RESEARCH GmbH respectively the authors and subject to modify without notice. Possible faults or incompleteness of this document may be reformed by DR. KALLIWODA INTERNATIONAL RESEARCH GmbH and do not constitute reasons for liability, neither with regard to indirect nor to direct or consequential losses.
Moreover, DR. KALLIWODA INTERNATIONAL RESEARCH GmbH does not accept any responsibility and liability for any damage arising from using of this research or its contents or otherwise arising in relation herewith. In each case, the liability and responsibility of DR. KALLIWODA INTERNATIONAL RESEARCH GmbH is limited to typical, predictable damages and the liability for any direct or indirect losses is excluded.
This document is subject to the laws of the Federal Republic of Germany. Place of jurisdiction is Frankfurt am Main, Germany.
This document or any copy, in whole or in part thereof, may be distributed in any other jurisdiction where its distribution might be restricted by law and persons who have access to this document have to inform and observe themselves about any such restrictions.
In the United Kingdom this document is to be distributed only to persons who are described in Section 11 (3) of the Financial Services Act 1986 (Investment Advertisements) (Exemptions) Order 1996 (as amended). This research may not be distributed and forwarded directly or indirectly to any other group of individuals. The distribution of this document in other international jurisdictions may be restricted by law and individuals who possess this study should inform themselves of any existing restrictions and comply with them.
Neither this document nor any copy of it may be taken or transmitted into the United States of America, Canada, Japan or Australia or distributed, directly or indirectly, in the United States of America, Canada, Japan or Australia or to any resident thereof. Any Failure to comply with these restrictions may constitute a violation of United States, Canadian, Japanese or Australian securities laws or the law of any other jurisdiction.
By confirming this document the reader or user agrees and accepts to be bound by all of the foregoing provisions and this disclaimer. Besides, the user accepts not to distribute this document to unauthorized persons. The user of this document compensated DR. KALLIWODA INTERNATIONAL RESEARCH GmbH for any disadvantages, damages, claims and losses resulting from or in relation with the unauthorized use of this document.
© 2015 DR. KALLIWODA INTERNATIONAL RESEARCH GmbH, Arndtstraße 47, D-60325 Frankfurt am Main. All rights reserved.


![[]_Narcissistic_Personality_Disorder( ).txt](https://img.pdfslide.us/doc/110x75/577cc03a1a28aba7118f53b5/narcissisticpersonalitydisorderbookfiorgtxt.jpg)