Embed Size (px)
Citation preview

Company Presentation
September 2010
Slide 2
This presentation includes forward-looking statements regarding DiaGenic ASA, including projections and
expectations, which involve risk and uncertainty. Such statements are included without any guarantees
to their future realization. Although DiaGenic believes that the expectations regarding the Company
reflected in such forward-looking statements are based on reasonable assumptions, no assurance can be
given that such projections will be fulfilled. Any such forward-looking statement must be considered
along with knowledge that actual events or results may vary materially from such predictions due to,
among other things, political, economic, financial or legal changes in the markets in which DiaGenic does
business, and competitive developments or risks inherent to the Company’s business plans. Many of
these factors are beyond DiaGenic’s ability to control or predict. Given these uncertainties, readers are
cautioned not to place undue reliance on any forward-looking statements. The Company does not
intend, and does not assume any obligation, to update the forward-looking statements included in this
presentation as of any date subsequent to the date hereof.
Disclaimer
Slide 3
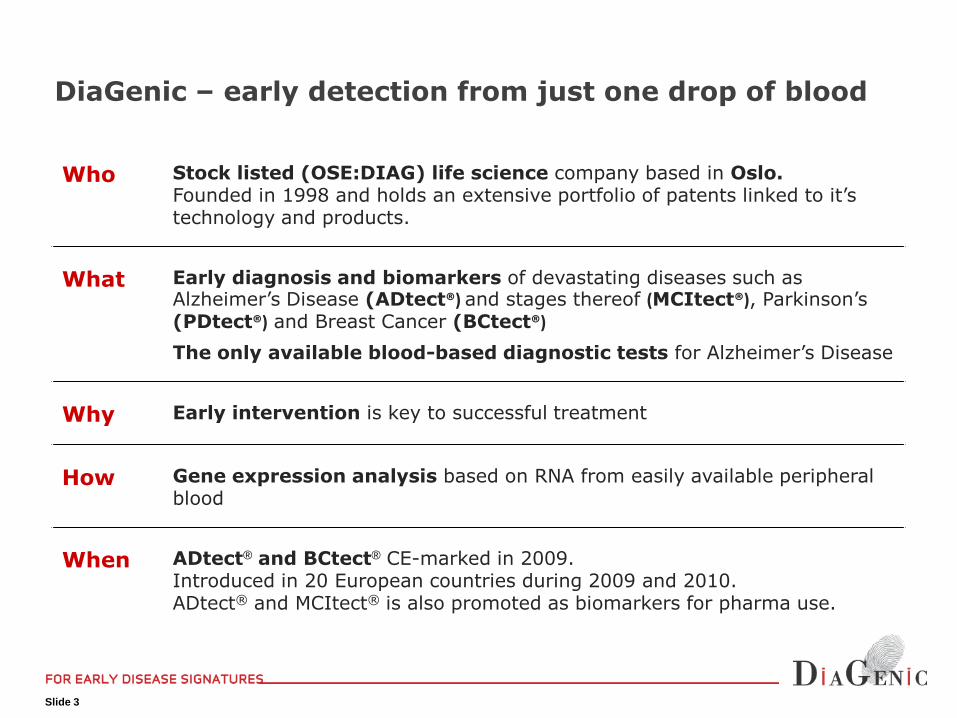
DiaGenic – early detection from just one drop of blood
Who Stock listed (OSE:DIAG) life science company based in Oslo. Founded in 1998 and holds an extensive portfolio of patents linked to it’s technology and products.
What Early diagnosis and biomarkers of devastating diseases such as Alzheimer’s Disease (ADtect®) and stages thereof (MCItect®), Parkinson’s (PDtect®) and Breast Cancer (BCtect®)
The only available blood-based diagnostic tests for Alzheimer’s Disease
Why Early intervention is key to successful treatment
How Gene expression analysis based on RNA from easily available peripheral blood
When ADtect® and BCtect® CE-marked in 2009. Introduced in 20 European countries during 2009 and 2010. ADtect® and MCItect® is also promoted as biomarkers for pharma use.

Slide 4
Historical positioned as stand alone IVD diagnostics– Developed the worlds first CE marked gene expression test for Alzheimer’s diagnostics
– Very challenging for a small company like DiaGenic alone to change medical practice and obtain reimbursement
– No global partner with marketing muscle, only smaller distributors
New opportunities with big pharma and diagnostics companies– Major USD billion market for Alzheimer's disease, but Pharma and high end imaging companies
are facing challenges in developing new solutions for Alzheimer Disease
– A convergence observed; expressed their needs for DiaGenic tests and competence
Repositioned business model for DiaGenic – focus on Alzheimer's disease– New Board with extensive pharma competence elected June 3rd
– Focus on partnership with key players in pharma and imaging (global top 10 players)
– Initial approach successful, invited into development programs
– Change of financing strategy – aim to ensure funding until break-even
Aim to become a leader in companion diagnostics for Alzheimer's– Develop a one to one relationship between DiaGenic tests and a pharmaceutical compound
and/or PET imaging;
– Validation of technology by big pharma to drive the stand-alone usage for DiaGenic's diagnostics
The repositioned DiaGenic
Slide 5
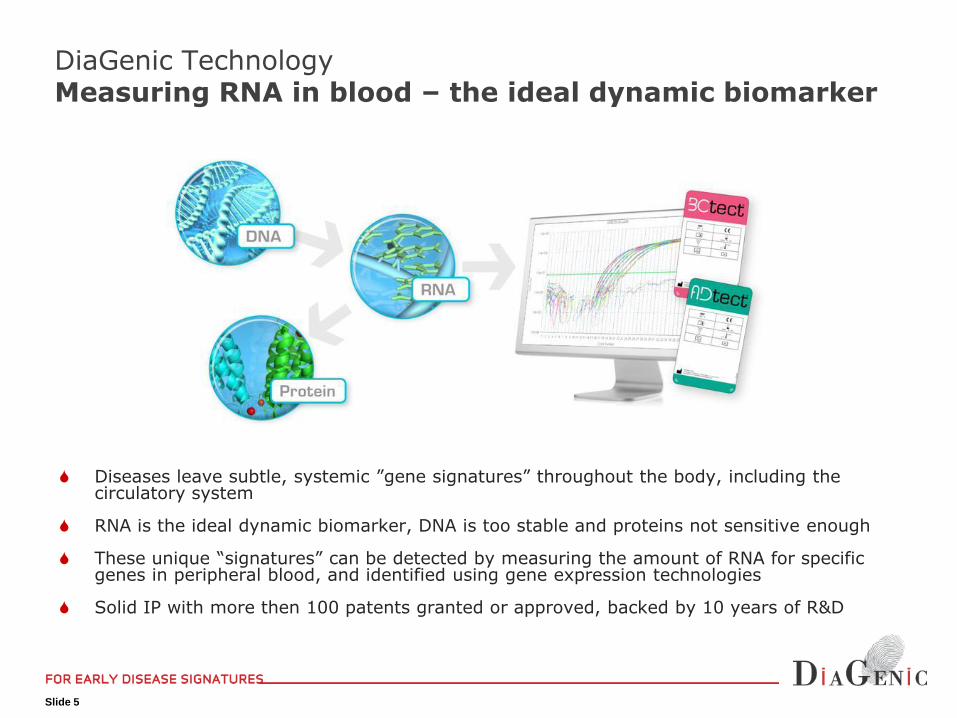
Diseases leave subtle, systemic ”gene signatures” throughout the body, including the circulatory system
RNA is the ideal dynamic biomarker, DNA is too stable and proteins not sensitive enough
These unique “signatures” can be detected by measuring the amount of RNA for specific genes in peripheral blood, and identified using gene expression technologies
Solid IP with more then 100 patents granted or approved, backed by 10 years of R&D
DiaGenic TechnologyMeasuring RNA in blood – the ideal dynamic biomarker

Slide 6
Developing Molecular DiagnosticsCNS focused product pipeline
New pharma
partner
New imaging
partner
Pre-clinical researchPrototype
development
Clinical studies
Regulatory
(CE)
Pharma Sales
& Marketing
Reimbursement
General Sales
Parkinson's disease
Alzheimer's disease
Co
llab
orati
on
p
artn
ers
Key strategicfocus
Early Alzheimer's disease
Breast Cancer
Slide 7

Slide 8
A progressive neurodegenerative disease– Multifactorial, and not completely understood disease
mechanism
Affects 34 million worldwide– More than 100 million with AD in 2050
– 5.3 million with AD in U.S. in 2007
– 1 in 10 above 65 years affected
– 1 in 2 above 85 years affected
– AD is the 3rd most costly disease in U.S. after heart disease and cancer
– Worldwide costs 2009 $422Billion
A substantial unmet medical need
– No effective medications that delays disease development today, only symptomatic treatment
– Disease management today is a combination of drugs, change of lifestyle and diet
Alzheimer’s diseaseA global epidemic
Ref: Alzheimer Association 2009
Ref: Klunk et al: Ann Neurol 55:306-19 (2004)
PET image in controls and AD patients
Slide 9
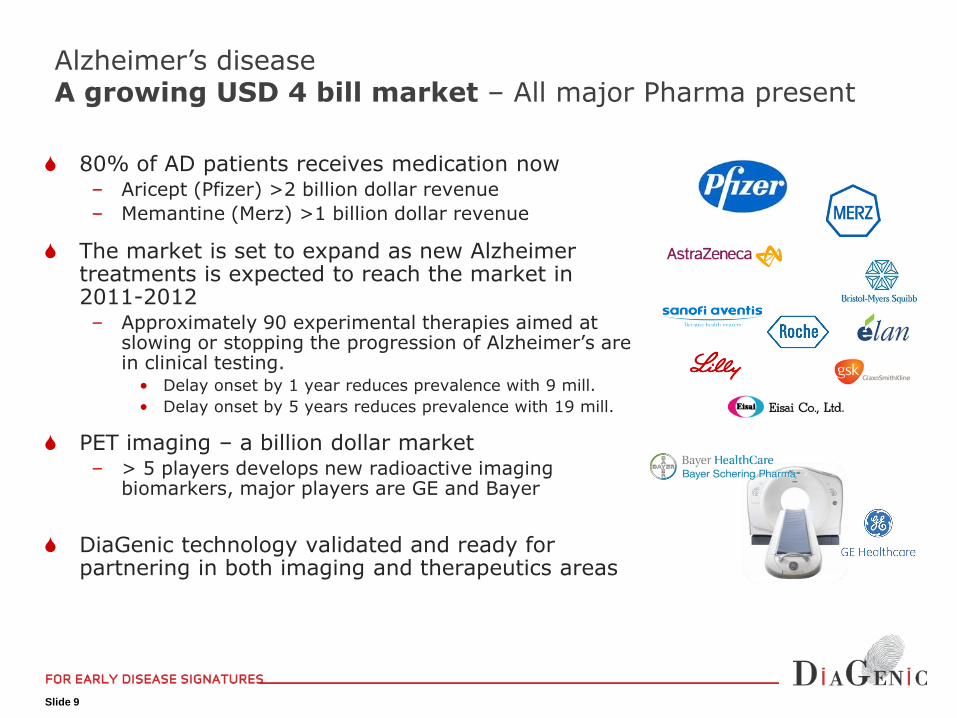
80% of AD patients receives medication now– Aricept (Pfizer) >2 billion dollar revenue
– Memantine (Merz) >1 billion dollar revenue
The market is set to expand as new Alzheimer treatments is expected to reach the market in 2011-2012– Approximately 90 experimental therapies aimed at
slowing or stopping the progression of Alzheimer’s are in clinical testing.
• Delay onset by 1 year reduces prevalence with 9 mill.
• Delay onset by 5 years reduces prevalence with 19 mill.
PET imaging – a billion dollar market– > 5 players develops new radioactive imaging
biomarkers, major players are GE and Bayer
DiaGenic technology validated and ready for partnering in both imaging and therapeutics areas
Alzheimer’s diseaseA growing USD 4 bill market – All major Pharma present
Slide 10
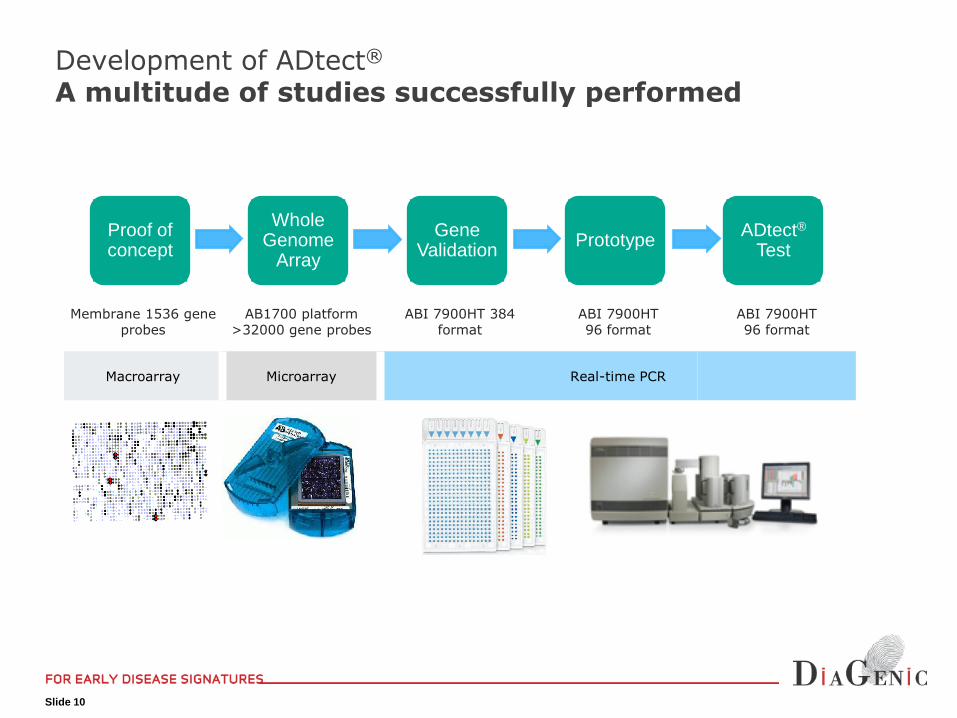
Development of ADtect®
A multitude of studies successfully performed
WholeGenome
Array
GeneValidation
PrototypeADtect®
TestProof ofconcept
Membrane 1536 gene probes
AB1700 platform >32000 gene probes
ABI 7900HT 384 format
ABI 7900HT96 format
ABI 7900HT96 format
Macroarray Microarray Real-time PCR

Slide 11
Conventional Diagnostics vs ADtectADtect adds significant value to Alzheimer diagnostics
Methodology & characteristics
Conventional Diagnostics
• 7 – 32 months • 2 weeks
• ~5,000 EUR • 600 Euro
• 60 – 85% • 75 – 85%
• Medical history
• Interview with a close relative
• Somatic evaluation incl. blood tests
• Cognitive & neuropsychiatric testing
– MMSE, Clock Drawing Test, GDS, others...
– GDS
– Monitor progression over months
• Neuroimaging
– MRI/CT
– (PET with PIB and other labels)
– EEG
• Spinal fluid (CSF) biomarkers
– Aβ,T-tau,P-tau
• Ultimate gold standard:
– Brain biopsy post-mortem
– 90-95 % accurate
• Measuring RNA by blood sample
• Two independent validation studies of ADtect® showed similar agreement of ADtect® with the clinical diagnosis
• Assuming an accuracy of 80% for the clinical diagnosis, a probable 85%-90% accuracy is observed using ADtect®
alone,
• Agreement with CSF results in 80% - 85%
• Reported clinical agreements in the study was 72 – 73%
Time to diagnosis
Cost
Accuracy

Slide 12
Competitive positioning for ADtect®
The only available CE-market non-invasive Alzheimer testC
SF b
iom
arker
PET im
ag
ing • Expensive
• Tracer costs $6000
• Equipment
• Limited access
• Invasive• Medical complications
• Average charge $5700
• 36% false positives
• Assay standardization
Patient friendly Less invasive Objective Less expensive Fast turnaround time
Slide 13
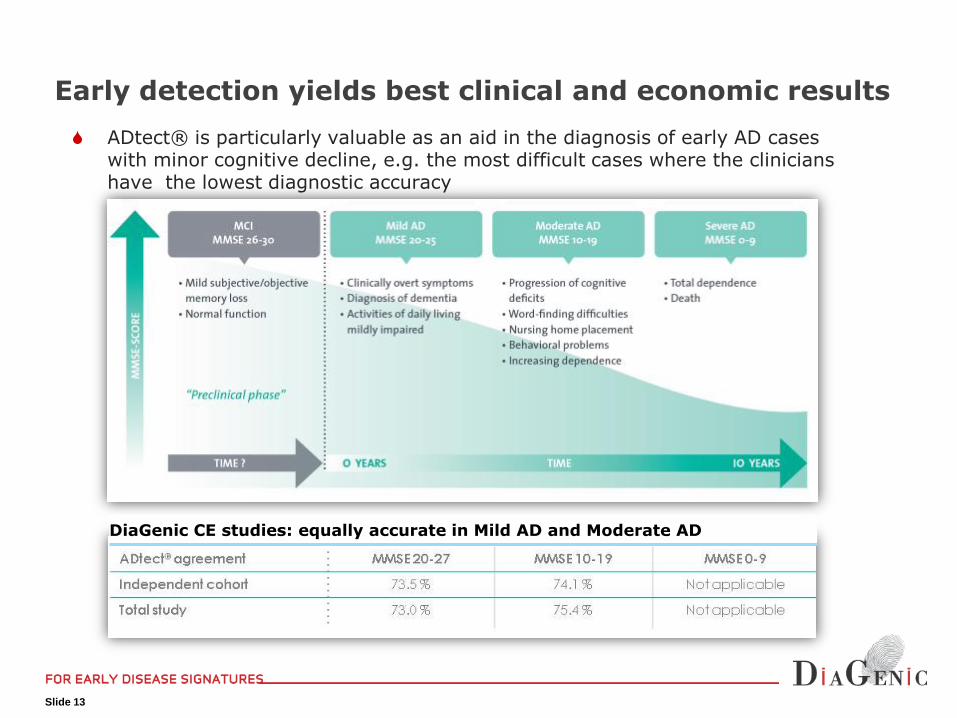
ADtect® is particularly valuable as an aid in the diagnosis of early AD cases with minor cognitive decline, e.g. the most difficult cases where the clinicians have the lowest diagnostic accuracy
Early detection yields best clinical and economic results
ADtect® agreement MMSE 20-27 MMSE 10-19 MMSE 0-9
Independent cohort 73.5 % 74.1 % Not applicable
Total study 73.0 % 75.4 % Not applicable
DiaGenic CE studies: equally accurate in Mild AD and Moderate AD
Slide 14
in development
Slide 15
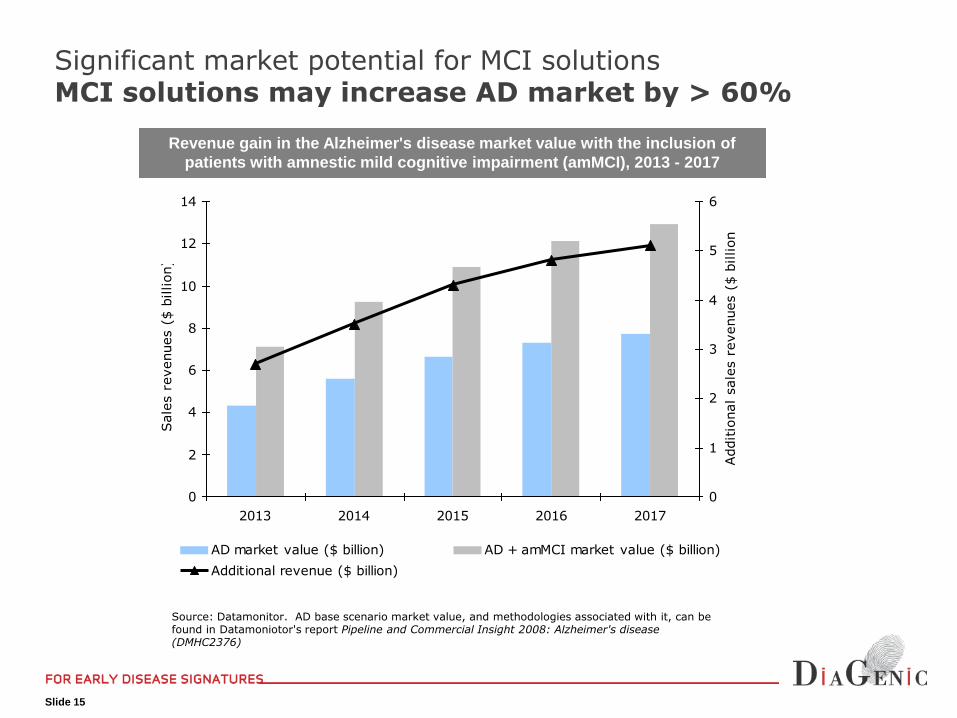
Revenue gain in the Alzheimer's disease market value with the inclusion of
patients with amnestic mild cognitive impairment (amMCI), 2013 - 2017
Source: Datamonitor. AD base scenario market value, and methodologies associated with it, can be found in Datamoniotor's report Pipeline and Commercial Insight 2008: Alzheimer's disease (DMHC2376)
0
2
4
6
8
10
12
14
2013 2014 2015 2016 2017
Sale
s r
evenues (
$ b
illion)
0
1
2
3
4
5
6
Additio
nal sale
s r
evenues (
$ b
illion)
AD market value ($ billion) AD + amMCI market value ($ billion)
Additional revenue ($ billion)
Significant market potential for MCI solutionsMCI solutions may increase AD market by > 60%

Slide 16
Gene expression in stages of Alzheimer’sDiaGenic technology targets in on MCI
Prediction based on differentgene expression models:
AD grades very mild to severe have similar level of accuracy independent of disease severity.
• Reflects biological nature of disease progression
Increasing trend from healthy controls via MCI to very mild AD
Individuals within the MCI group may be associated with a tendency for conversion to AD
Ref:Lönneborg et al (2008). "A blood-based gene expression test for Alzheimer's disease identifies likelihood of progression in MCI patients.“ ICAD 2008
Figure: Prediction of AD based on four models.
10 MCI patients were predicted and two groups wereobserved (hypothesis: one progressing to AD and one stable)
non-A
D
Pre
dic
tive V
alu
e
A
D
MCI
Healthy
Very mild Severe
Alzheimer’s Disease
Slide 17
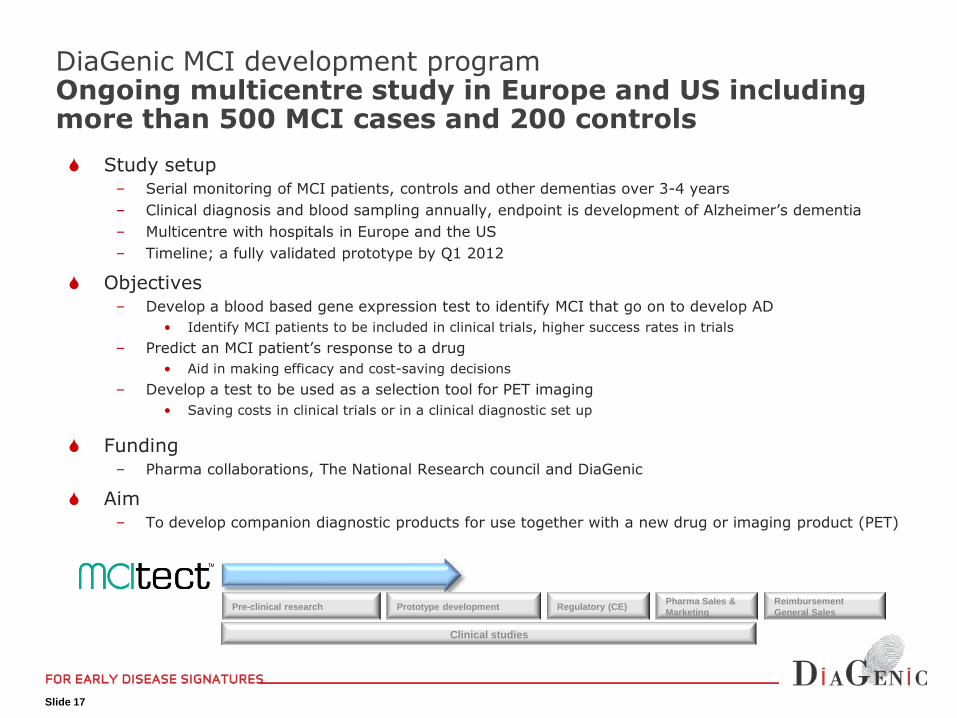
Study setup– Serial monitoring of MCI patients, controls and other dementias over 3-4 years
– Clinical diagnosis and blood sampling annually, endpoint is development of Alzheimer’s dementia
– Multicentre with hospitals in Europe and the US
– Timeline; a fully validated prototype by Q1 2012
Objectives– Develop a blood based gene expression test to identify MCI that go on to develop AD
• Identify MCI patients to be included in clinical trials, higher success rates in trials
– Predict an MCI patient’s response to a drug
• Aid in making efficacy and cost-saving decisions
– Develop a test to be used as a selection tool for PET imaging
• Saving costs in clinical trials or in a clinical diagnostic set up
Funding– Pharma collaborations, The National Research council and DiaGenic
Aim– To develop companion diagnostic products for use together with a new drug or imaging product (PET)
DiaGenic MCI development programOngoing multicentre study in Europe and US including more than 500 MCI cases and 200 controls
Pre-clinical research Prototype development
Clinical studies
Regulatory (CE)Pharma Sales &
Marketing
Reimbursement
General Sales

Slide 18

Slide 19
Companion diagnostic value propositionDiaGenic with key solutions for AD management
High end imaging diagnostics (PET)
Characteristics Challenges Value proposition
Established high-value segment, but only symptomatic treatment
Significant resources from big pharma being invested in developing new drugs
Recruiting the right patients for clinical trials
Objective monitoring of disease progression (clinical development end-points)
Patient specific treatment
Objective diagnostic tests to optimise inclusion
Progression based on measuring bio-markers
Predict patient specific drug efficacy based on RNA profile
PET imaging diagnostics are the most accurate diagnostic tool for Alzheimer Disease
Expensive equipment and procedures
High cost per patient
Capacity constraints –limited no of scanners available due to cost
Lack of objective selection criteria for reimbursements
Blood-based diagnostics as a tool for pre-selecting patients for PET
Increases hit-rates
Reduces capacity constraints
Validates reimbursement
Drug development
Slide 20
No
of
pro
du
ct
no
mali
ties
pre 2010
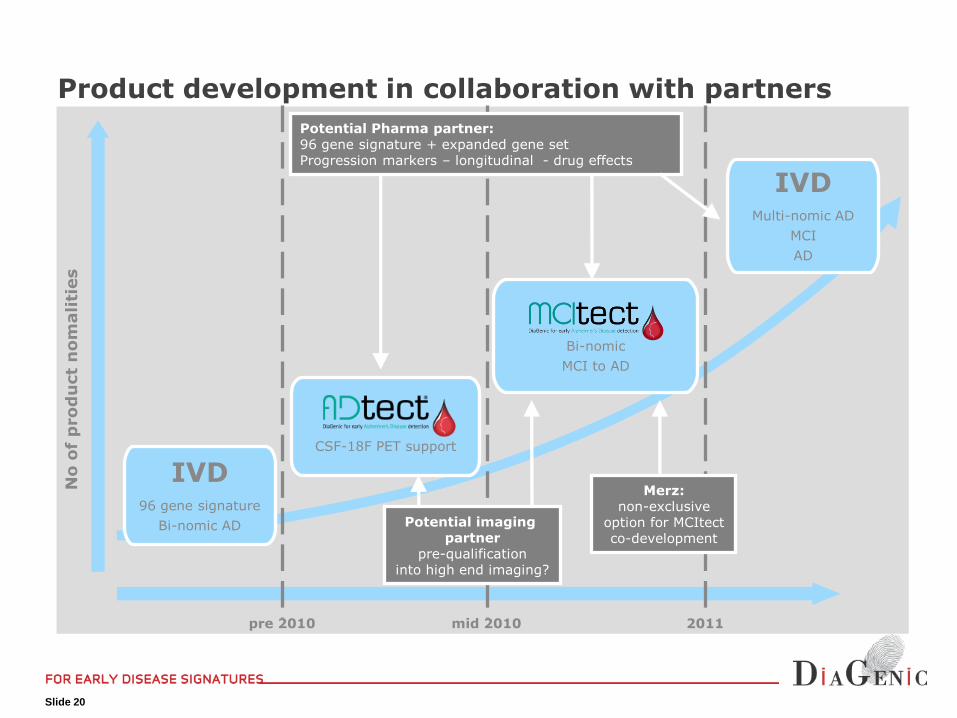
IVD96 gene signature
Bi-nomic AD
ADtectCSF-18F PET support
MCItectBi-nomic
MCI to AD
IVDMulti-nomic AD
MCI
AD
mid 2010 2011
Product development in collaboration with partners
Potential imaging partner
pre-qualificationinto high end imaging?
Merz:non-exclusive
option for MCItectco-development
Potential Pharma partner: 96 gene signature + expanded gene setProgression markers – longitudinal - drug effects
Slide 21
Multiple ongoing pharma interactions ongoing
– Therapeutics
– High-end Diagnostics
DiaGenic invited into Phase II and Phase III development (R&D collaborations)
Protocols exchanged for new progression and drug effect marker (expanded gene signature)
Potential partner's Due diligence has confirmed Diagenic's strong IP position
– Granted IP on diagnosing Alzheimer by gene expression in US and EU
– Freedom to operate as an independent 3 party provider of IVD in AD
– Expansion of gene signatures and to piggy back on DiaGenic main patent classes/claims
Multiple potential milestones going forwardPositive progression in partner discussions
Slide 22
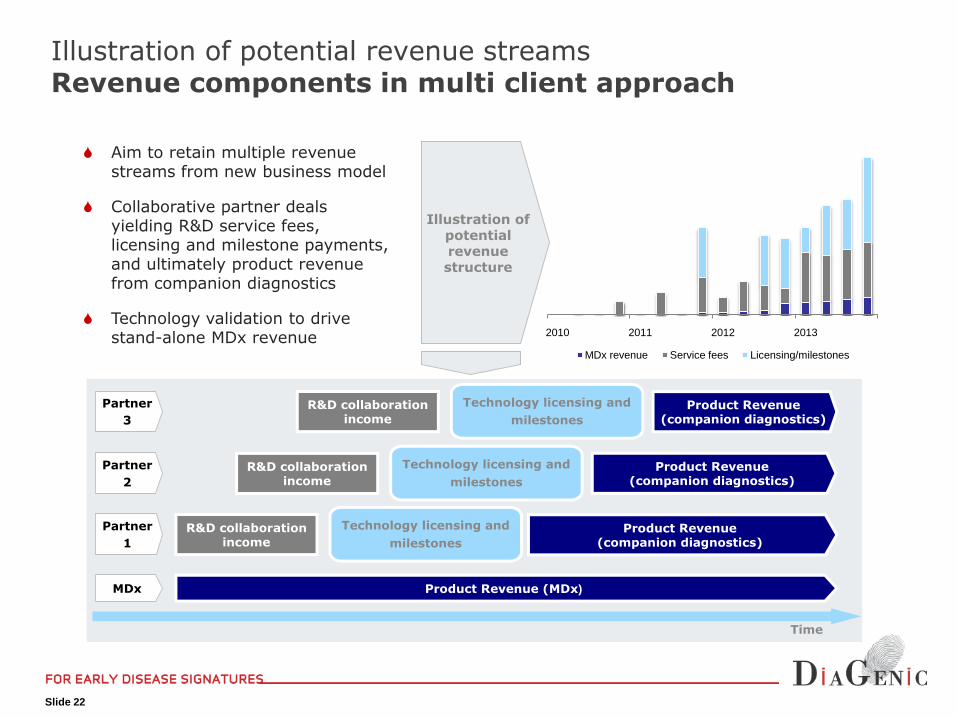
Illustration of potential revenue streamsRevenue components in multi client approach
Aim to retain multiple revenue streams from new business model
Collaborative partner deals yielding R&D service fees, licensing and milestone payments, and ultimately product revenue from companion diagnostics
Technology validation to drive stand-alone MDx revenue
Illustration of potential revenue structure
Partner
1
Technology licensing and
milestones
R&D collaborationincome
Time
Partner
3
Partner
2
Technology licensing and
milestones
R&D collaborationincome
Technology licensing and
milestones
R&D collaborationincome
MDx
Product Revenue(companion diagnostics)
Product Revenue(companion diagnostics)
Product Revenue(companion diagnostics)
Product Revenue (MDx)
2010 2011 2012 2013
MDx revenue Service fees Licensing/milestones
Slide 23
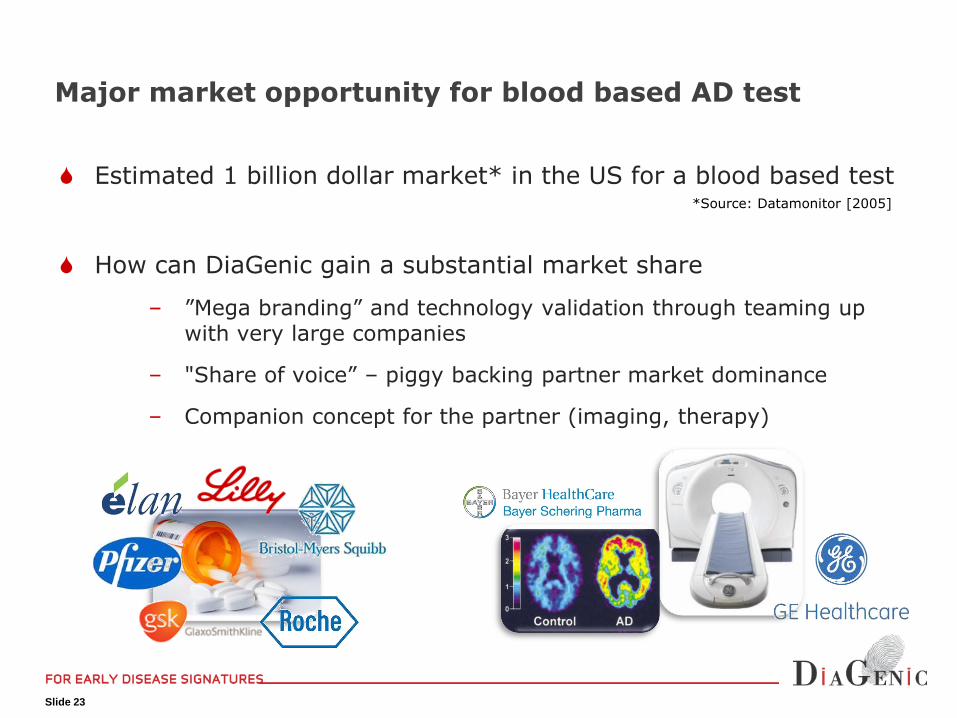
Estimated 1 billion dollar market* in the US for a blood based test
How can DiaGenic gain a substantial market share
– ”Mega branding” and technology validation through teaming up with very large companies
– "Share of voice” – piggy backing partner market dominance
– Companion concept for the partner (imaging, therapy)
Major market opportunity for blood based AD test
*Source: Datamonitor [2005]

Slide 24
Aim to finance towards break-even in H2 2012
Aim to secure funding to achieve key milestones
Should cover the contractual period of partner deals
Historically funded through continuous equity financing
Aim to secure long-term financing until positive cash flow
Annual costs of ~MNOK 45 to be offset by contribution from deals
Cash-flow break even level expected in H2 2012
Estimated capital need until break-even of approx. MNOK 50
-
2,0
4,0
6,0
8,0
10,0
12,0
14,0
Q1 09 Q2 09 Q3 09 Q4 09 Q1 10 Q2 10
Salaries and related Depr. and Write downs
Other operating cost
(36)
(32)
(29)
(20)
(17)
(8)
45
41
24
33
19
16
(50) (40) (30) (20) (10) - 10 20 30 40 50
2009
2008
2007
2006
2005
2004
Net cash flow from financing activities
Net cash flow from operating activities
Historical operating and financing Cash flow
Operating costs
Slide 25
Outlook & Summary

Slide 26
Expected milestones and outlookPotential for a rich newsflow

Slide 27
Unique blood based gene expression signature– ADtect® the first CE marked Alzheimer test
– Favorable competitive position
• Few players with documented blood based tests for AD – no other with CE mark
Unique diagnostic needs in AD– Early diagnosis needed for cost efficient intervention
Major companion diagnostic opportunities– Pharma late development confirms the need for objective diagnostic tests
– High End Diagnostics market entry challenges
– Encouraging progress with potential partners
Strong IP protection within AD diagnosing and monitoring. – Broad claims protects against infringement
– Freedom to Operate confirmed by 3rd party
DiaGenic’s value proposition“Early detection, from just one drop of blood”
Slide 28
DiaGenic ASA
Grenseveien 92, N-0663 Oslo, Norway
Tel +47 23 24 89 50
Mail: [email protected]
www.diagenic.com

Slide 29
Appendix

Slide 30
Financials and Shareholders

Slide 31
Financials Q2 2010 – P&LStatement of comprehensive income 2010 2009 2010 2009 2009
(figures NOK thousands) Q2 Q2 1 Jan-30 June 1 Jan-30 June 1 Jan-30 Dec
Operating Income
Other income 8 0 8 5 131
Total operating revenue 8 0 8 5 131
Operating expenses
Cost of goods sold 71 62 265 71 372
Total cost of goods sold 71 62 265 71 372
Operating costs
Wages and social costs 4,202 3,625 10,576 9,336 21,275
Depreciation 235 226 470 451 966
Writedow n 0 0 0 0 352
Other operating costs 6,018 3,664 11,148 9,344 17,021
Total other operating costs 10,454 7,515 22,194 19,130 39,614
Total operating costs 10,525 7,577 22,459 19,201 39,986
Operating profit (loss) -10,518 -7,577 -22,451 -19,196 -39,856
Financial income 177 167 401 456 738
Financial expenses 194 50 300 95 214
Net financial income/expense -16 116 101 361 524
Pre-tax profit (loss) -10,534 -7,460 -22,350 -18,835 -39,332
Income tax costs (benefits) 0 0 0 0 0
NET PROFIT (LOSS) -10,534 -7,460 -22,350 -18,835 -39,332
Other comprehensive income 0 0 0 0 0
Comprehensive income -10,534 -7,460 -22,350 -18,835 -39,332
Net profit per share (figures in NOK) -0.15 -0.14 -0.32 -0.36 -0.73
Net profit per share after delution -0.15 -0.14 -0.32 -0.36 -0.73

Slide 32
Financials Q2 2010 – Balance SheetStatement of financial position 2010 2009 2009
(figures NOK thousands) 30 June 30 June 31 Dec
ASSETS
Fixed assets
Goodw ill 572 572 572
Softw are 1,391 1,255 1,559
Fixed assets 1,398 2,155 1,576
Total non-current assets 3,361 3,983 3,707
Current assets
Inventory 2,589 2,455 2,127
Trade receivables 8 0 141
Other receivables 4,480 3,542 5,105
Cash and cash equivalents 19,812 8,101 35,404
Total current assets 26,888 14,097 42,777
TOTAL ASSETS 30,249 18,080 46,484
EQUITY AND LIABILITIES
Equity
Share capital 3,512 2,587 3,337
Paid in equity 34,388 26,030 26,036
Retained earnings -22,350 -18,835 0
Total equity 15,550 9,782 29,373
Provisions
Pension liabilities 2,977 2,302 2,571
Total provisions 2,977 2,302 2,571
Other long term liabilities
Other long term liabilities 5,474 849 5,698
Total other long term liabilities 5,474 849 5,698
Liabilities
Accounts payable 2,900 2,609 3,307
Social security, VAT etc. payable 1,451 1,056 1,950
Other current liabilities 1,897 1,482 3,586
Total current liabilities 6,248 5,147 8,842
TOTAL EQUITY AND LIABILITIES 30,249 18,080 46,484

Slide 33
Financials Q2 2010 – Cash Flows
CASH FLOW STATEMENTS 2010 2009 2010 2009 2009
(figures NOK thousands) Q2 Q2 1 Jan-30 June 1 Jan-30 June 1 Jan-30 Dec
Cash flow from operating activities
Pre-tax profit (loss) -10,534 -7,460 -22,350 -18,835 -39,332
Income taxes paid 0 0 0 0 0
Ordinary depreciation 235 226 470 451 966
Impairment of f ixed assets 0 0 0 0 352
Fair value granted option rights 48 102 96 205 409
Loss on sale of f ixed assets 0 0 0 0 0
Change in pension scheme liabilities 203 170 406 341 609
Change in inventories, accounts
receiveable and accounts payable 418 152 -735 -1,872 -988
Change in other short-term receivables
and other short-term liabilities -3,050 -2,757 -1,562 862 2,296
Net cash flow from operating activities -12,679 -9,567 -23,674 -18,849 -35,687
Cash flow from investment activities
Proceeds from sale of f ixed assets 0 0 0 0 0
Acquisitions of f ixed assets -16 -494 -124 -804 -1,394
Net cash flow from investing activities -16 -494 -124 -804 -1,394
Cash flow from financing activities
Contribution of share capital -316 0 8,431 0 39,883
Proceeds from new loan
Payment of long term liabilities -98 -88 -224 -204 -356
Net cash flow from financing activities -414 -88 8,207 -204 39,527
Net change in cash and cash equivalents -13,109 -10,150 -15,591 -19,857 2,446
Cash and cash equivalents 19,812 8,101 19,812 8,101 35,404

Slide 34
Financials Q2 2010 – Equity and no. of shares
Statement of changes in Equity and Number of Shares: Share prem. Other Other Total Number
(figures in NOK/numbers) Share capital reserve reserves equity equity of shares
As at 1st January 2009 2,586,826 25,825,158 0 0 28,411,984 51,736,520
Fair value granted subscription rights 0 0 409,322 0 409,322 0
Increase of capital - 8th July 2009 125,000 9,225,000 0 0 9,350,000 2,500,000
Transaction cost 0 -702,115 0 0 -702,115 0
Increase of capital - 26th November 2009 625,000 33,750,000 0 0 34,375,000 12,500,000
Transaction cost 0 -3,139,705 0 0 -3,139,705 0
Comprehensive income 01.01.-31.12.2009 0 0 0 -39,331,572 -39,331,572 0
Allocation of comprehensive loss 0 -38,922,250 -409,322 39,331,572 0 0
As at 31st December 2009 3,336,826 26,036,088 0 0 29,372,916 66,736,520
Fair value granted subscription rights 0 0 96,042 0 96,042 0
Increase of capital - 22nd February 2010 175,000 9,450,000 0 0 9,625,000 3,500,000
Transaction cost 0 -1,193,795 0 0 -1,193,795 0
Comprehensive income 01.01.-30.06.2010 0 0 0 -22,349,762 -22,349,762 0
As at 30th June 2010 3,511,826 34,292,293 96,042 -22,349,762 15,550,401 70,236,520

Slide 35
September 20, 201020 Largest Shareholders
Investor No of shares Percent
TREDJE AP-FONDEN 3 963 795 5,64%
LØNNEBORG ERIK ANDERS 2 907 370 4,14%
NORDEA NORDIC EQUITY HEDGE FUND 2 599 670 3,70%
SHARMA PRAVEEN 2 490 764 3,55%
SIX SIS AG 25PCT 1 903 224 2,71%
HOLBERG NORDEN 1 892 178 2,69%
HOLBERG NORGE 1 421 959 2,02%
JPMORGAN CHASE BANK 1 363 600 1,94%
HAAVIND KARL WILHELM 1 290 000 1,84%
SKAGEN VEKST 1 267 667 1,80%
STOREBRAND VEKST 1 043 082 1,49%
LIVSFORSIKRING.NORDEA LIV NORGE AS 1 003 100 1,43%
VPF NORDEA SMB 853 300 1,21%
AMFIBIEN AS 848 000 1,21%
NARMO SIGRID 820 000 1,17%
NORDNET BANK AB 778 896 1,11%
GJØRLING KENNETH RAYMOND 755 000 1,07%
STORHAUG DAG ERIK 699 078 1,00%
KIKUT AS 655 000 0,93%
DIEDRICHSEN TAGE 575 472 0,82%
Sum Top 20 shareholders 29 131 155 41,48%

Slide 36
IP

Slide 37
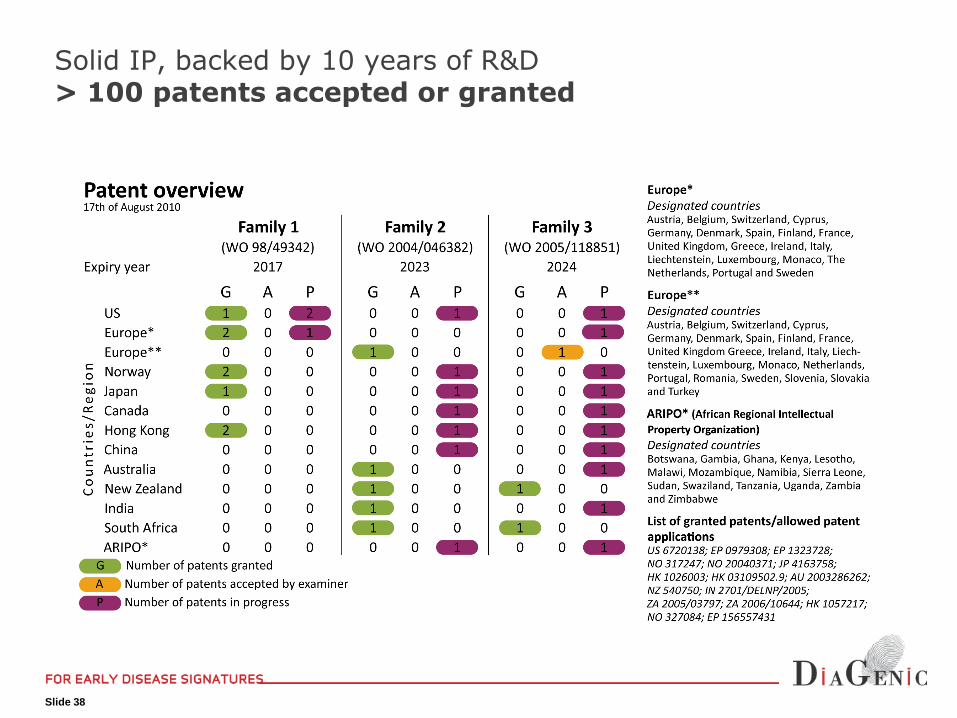
Solid IP, backed by 10 years of R&D> 100 patents accepted or granted
4 patent families granted, accepted by examiner, or in process
Family 1 a. Method to identify diseases using blood samples and gene expression technology, where the sample is collected distant to the area of the disease
b. Method to identify diseases using non-sequence based gene expression methods
a. Covers both sequence based and non-sequence based gene expression methods. Granted for Alzheimer in US, Europe, and Hong Kong. Broad patent, including Alzheimer, in Japan and Norway.
b. No disease limitations, no sample limitations. Granted in Europe, Norway and Hong Kong
Family 2 Describes sets of gene sequences that can be used to develop expression signature for the detection of diseases
Granted in South Africa. Granted in Australia, New Zealand and Europe for Alzheimer and Breast Cancer, and for breast cancer in India
Family 3 Describes gene families and genes expressed in blood which can be used to detect cancer
Accepted in Europe, Granted in South Africa and New Zealand
Family 4 Describes oligonucletide probes in kitform that can be used to identify, diagnose and monitor breast cancer
Application filed 2010
Slide 38
Solid IP, backed by 10 years of R&D> 100 patents accepted or granted

Slide 39
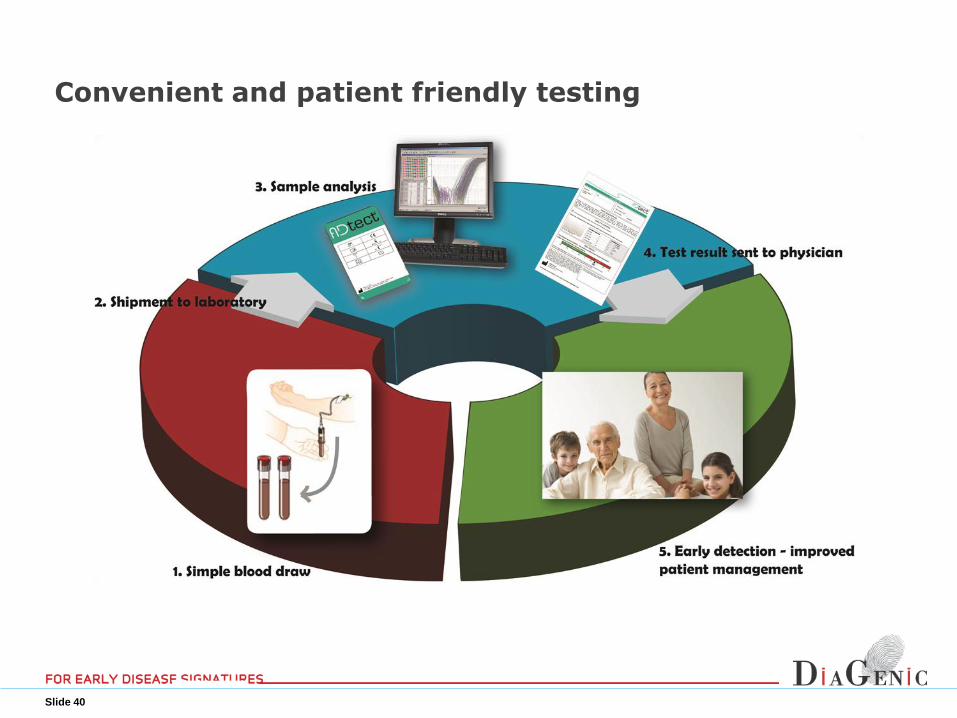
Process flow
From blood sample to test report
Slide 40
Convenient and patient friendly testing
Slide 41
Organization

Slide 42
• Experienced management team, BoD and Scientific Advisory Boards
OrganizationStrong organizational platform
Erik ChristensenMD PhD
Chief Executive
Officer
Anders LönneborgPhD
Research Director
Praveen SharmaPhD
Technology Director
Morten Johansen
International Business
Development Director
Dag Christiansen
Marketing Director
Edith RianPhD
Operations Director
Ruben Ekbråten
Financial Controller
Management team Scientific Advisors
Alzheimer Advisory Board
Prof. Bengt Winblad, Karolinska Institutet, Sweden
Prof. Khalid Iqbal,New York State University, US
Prof. Sam Gandy, Mount Sinai School of Medicine, New York, US
Prof. Dag Årsland, Stavanger University Hospital, Norway
Breast Cancer Advisory BoardProf. Anne Lise Børresen Dale, Det Norwegian Radium Hospital, Norway
Dr. Alan Hollingsworth, Mercy Women’s Center, Oklahoma, US
Prof. Martine Piccart, Université Libre de Bruxelles, Belgium
Dr. Christos Sotiriou, Université Libre de Bruxelles, Belgium

Slide 43
• Henrik Lund, Chairman of the Board. (1956) came to Diagenic from the role of Global Vice President MC Clinical Development, AstraZeneca R&D. Lund has more than 15 years international management experience from the pharmaceutical industry. His academic background is from University of Oslo and University of California, San Francisco. Lund joined AstraZeneca in 1994 and since 2005 he has headed AstraZeneca's clinical development, phase I-III, across 43 subsidiaries in Europe, Asia and Latin America. For the last 5 years Lund has been part of the Clinical Development management team. Prior to joining AstraZeneca Lund has gained experience from both commercial and R&D management roles from Nycomed Imaging and Rhone-Poulenc Rorer. Henrik Lund is also a board member in other Life Science organisations in Scandinavia (Oslo Cancer Cluster, Medcoast Scandinavia).
• Ingrid Wiik, Deputy Chairman of the Board, (1945) holds a Master of Pharmacy from University of Oslo, and an M.Sc (Biopharmacy) from University of London, and an MBA from the Norwegian School of Management. She has spent more than 30 years in the pharmaceutical industry, both in R&D and general management, and has extensive leadership and international experience. In the years from 2000 to 2006 she was President and CEO of Alpharma Inc., a NYSE listed US Corporation with $ 1.5 billion in turnover and 4300 employees. Ms. Wiik currently holds several Board positions: Coloplast AS, Norske Skog ASA, Biotec Pharmacon ASA and Algeta ASA.
• Mina Louise Blair, (1965) holds a degree in political studies from Aberdeen University, Scotland. In the period 1999-2009 she has worked for the pharmaceuticals company AstraZeneca in London as Director Investor Relations Europe. Before that Blair worked in public affairs at Zeneca Agrochemicals' headquarters in England. Through her work Blair has extensive expertise in a number of technical areas within the pharmaceutical industry. In addition she has an extensive network among investors and pharmaceutical companies.
• Maria Holmlund, (1956) holds an M.Sc from the University of North Carolina and Institute of Marine Sciences, North Carolina, USA. She is currently business area manager in Phadia AB with responsibility for building up a new product concept for Phadia internationally in the Point of Care segment. Holmlund has held a number of management positions within diagnostics companies, including, in addition to Phadia, Pharmacia Diagnostics, Roche Diagnostics and Boehringer Mannheim.
• Atul Shah, (1963) is a leading business man and industrialist of Indian origin. Atul's family are owners of "Anchor" group of companies. One of "Anchor" group companies, Anchor Electricals, a household name in India , was recently successfully acquired by "Matsushita Electricals", a Panasonic company for USD 600 million. Atul led the entire transaction with Panasonic. Atul has diverse international business interests spanning from real estate to health care.
• Gustav Ingemar Kihlström, (1952) has a doctorate in physiology from Uppsala University. He is an Associate Professor of Uppsala University and has more than 15 years experience with Astra and Pharmacia in Sweden and other countries. From 1996 to 2004 he worked as a financial analyst, latterly as head of the health sector team at ABG Securities in Stockholm. Today he is an independent consultant within the field of science and the financing of life science companies. He is Chairman of KaroCell AB and New Science AB and a board member in Artimplant AB, Memapure AB, NicoNovum AB and OxyPharma AB.
• Praveen Sharma, (1964) is the Director of Technology and co-founder of DiaGenic. He holds a doctorate in molecular biology from NLH, 1995. Sharma has held several research positions, most recently at the Norwegian Institute for Forest Research. He joined DiaGenic in 2000.
Board of Directors
Slide 44
Slide 45
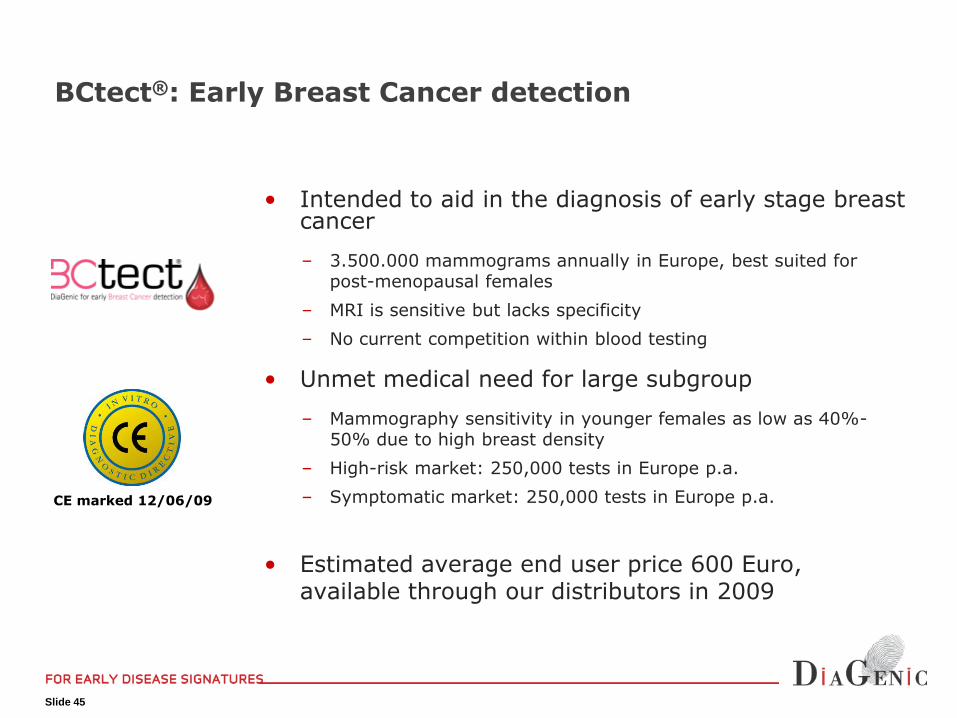
• Intended to aid in the diagnosis of early stage breast cancer
– 3.500.000 mammograms annually in Europe, best suited for post-menopausal females
– MRI is sensitive but lacks specificity
– No current competition within blood testing
• Unmet medical need for large subgroup
– Mammography sensitivity in younger females as low as 40%-50% due to high breast density
– High-risk market: 250,000 tests in Europe p.a.
– Symptomatic market: 250,000 tests in Europe p.a.
• Estimated average end user price 600 Euro, available through our distributors in 2009
BCtect®: Early Breast Cancer detection
CE marked 12/06/09
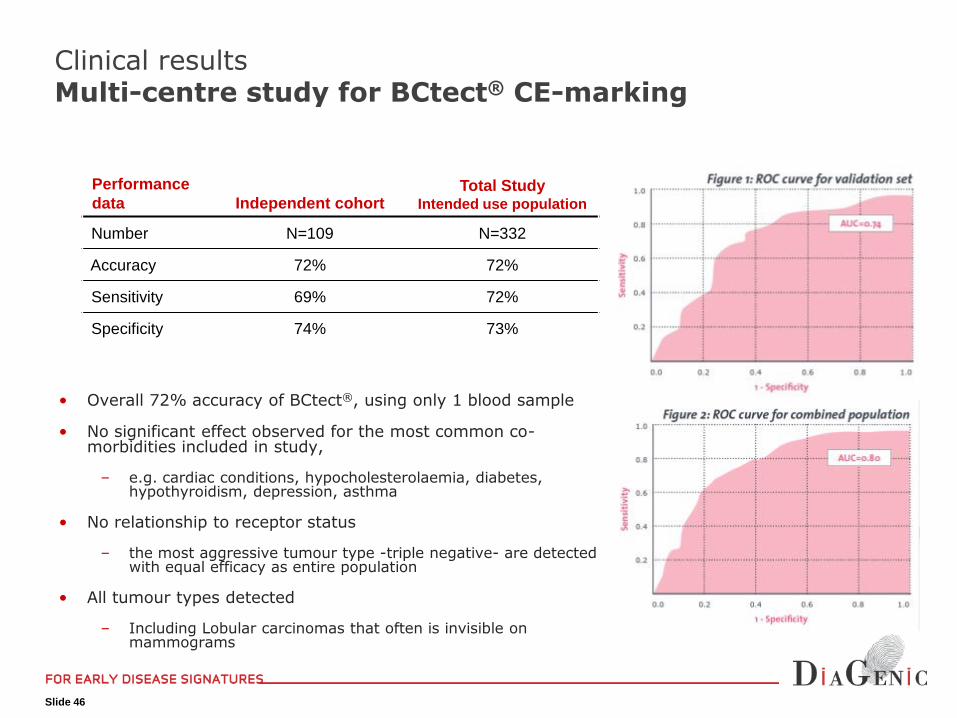
Slide 46
• Overall 72% accuracy of BCtect®, using only 1 blood sample
• No significant effect observed for the most common co-morbidities included in study,
– e.g. cardiac conditions, hypocholesterolaemia, diabetes, hypothyroidism, depression, asthma
• No relationship to receptor status
– the most aggressive tumour type -triple negative- are detected with equal efficacy as entire population
• All tumour types detected
– Including Lobular carcinomas that often is invisible on mammograms
Performance
data Independent cohortTotal Study
Intended use population
Number N=109 N=332
Accuracy 72% 72%
Sensitivity 69% 72%
Specificity 74% 73%
Clinical resultsMulti-centre study for BCtect® CE-marking

Slide 47
The intended use for BCtect® is in the detection of early stage breast cancer.
– First line test for asymptomatic females with worries due to family history, resistance to mammography or who is not part of a screening program
– Problem solver : Mammography in younger females has low sensitivity
• No current competition within blood based testing
– Mammography is a lower cost tool, best suited for postmenopausal females. Sensitivity in younger females as low as 40%-50%
– Higher cost Magnetic Resonance Imaging (MRI) is sensitive, but lacks specificity
In Europe
Clinical utility and positioning
Tumours are not always detected by
mammograms
Mammogram with a 5 cm invisible
tumour in the right breast (upper
right quadrant).
The left breast finding is a benign
change.

Slide 48

Slide 49
• In early stage of development of a biomarker and a diagnostic test for early detection of Parkinson’s disease
• Fully funded by external sources
– Biomarker program
• Funded through Michael J Fox research grant
• Working in co-operation with Harvard Medical School
– Diagnostic test program
• Funded by the Norwegian Research Council’s BIA grant
• NOK 6 million over 4 years
• Multi-centre trials with university hospitals in Norway, Sweden, and other European countries and in the US (UC Davis, California)
• Whole genome screening ongoing
Early stage development