Embed Size (px)
Citation preview


Agenda
9.00 – 9.30 New ambitions for profitable growth Rune Bjerke
9.30 – 10.10 Financial ambitions and new regulations Bjørn Erik Næss
10.10 – 10.35 Break
10.35 – 11.20 Growth in Norway Karin B. Orgland
11.20 – 11.50 International growth in the large corporate segment
Leif Teksum
11.50 – 12.15 Break
12.15 – 12.40 The Baltics – Raising the bar Terje Turnes
12.40 – 13.40 Q&A
13.40 – 14.00 Concluding Remarks Rune Bjerke
2


Financial ambitions towards 2015
Return on equity above 14 per cent
NOK 30 billion in pre-tax operating profits before write-downs
Cost/income ratio below 45 per cent
2

Untapped opportunities
Strong platform
Robust strategy for profitable growth
3

Strong development in operating profit
4
9.4
12.5
14.115.1 15.6
18.7
21.1
2004 2005 2006 2007 2008 2009 2010
Development in pre-tax operating profit before write-downs (NOK billion)
CAGR 14.4%

Significant growth in income
5
13 306 13 610
15 289
17 866
21 910 22 633
23 436
10 486
11 725
13 204
13 732
12 438
14 994 16 156
2004 2005 2006 2007 2008 2009 2010
Net interest income Net other operating income
CAGR
NII: 9.9%
NOOI: 7.5%
NOK million

6
Improved cost efficiency
NOK million
14 402
12 864
14 427
16 450
18 721 18 911 18 511
56.0%
50.2% 50.1% 50.6% 51.4%
48.1% 47.6%
0.0 %
10.0 %
20.0 %
30.0 %
40.0 %
50.0 %
60.0 %
70.0 %
80.0 %
90.0 %
100.0 %
2004 2005 2006 2007 2008 2009 2010
0
2 000
4 000
6 000
8 000
10 000
12 000
14 000
16 000
18 000
20 000
Operating expenses Ordinary Cost/income ratio

Sharp decline in loan losses after a peak in 2009
( 179)
137
( 258)
220
3 509
7 710
2 997
2004 2005 2006 2007 2008 2009 2010
NOK million
1) Pro forma figures including effects resulting from the implementation of IAS 39
1)
7

Strong ROE also in post-crisis environment
8
39.5
46.8
53.5
62.4
70.1
89.6
94.9
17.7% 18.8%
19.5%
22.0%
12.4%
10.6%
13.6%
2004 2005 2006 2007 2008 2009 2010
Equity Tier 1 capital Return on equity
NOK billion

Strong share price development relative to peers
9 Source: Bloomberg

Untapped opportunities
Strong platform
Robust strategy for profitable growth
10

The Norwegian bank
Norway
Share of group income
Photo: Erik Berg
11

Norwegians - The most attractive customers
12
0
10 000
20 000
30 000
40 000
50 000
60 000
70 000
1987 1989 1991 1993 1995 1997 1999 2001 2003 2005 2007 2009
USA EU12 Denmark Sweden Norway
GDP per capita in USD (PPP adjusted)
Source: Thomson Datastream/EIU/DnB NOR Markets

Among the fastest growing populations in Europe
13
Annual population growth in urban areas
> 750 000 inhabitants, 2005-2010
Estimated population growth in Europe
2010-2030*
Source: United Nations population division, World population prospects: The 2010 revision
Oslo
Norway
Istanbul
Turkey
Madrid
Spain
Toulouse
France
Munich
Germany
90
95
100
105
110
115
120
2010 2014 2018 2022 2026 2030
Norway
UK
Sweden
France
Denmark
Germany
Per cent
*Indexed, 2010 = 100

Stable low unemployment rates
14
Unemployment rates (in per cent of labour force)
Source: DnB NOR Markets and OECD, Economic Outlook NO 89
0 %
2 %
4 %
6 %
8 %
10 %
12 %
2004 2005 2006 2007 2008 2009 2010 F2011 F2012
Norway Sweden Euro Area Denmark Finland

Norway - An economy in a unique position
15
Public net wealth, per cent of GDP (2011)
Source: IMF (World Economic Outlook) and DnB NOR Markets
The Sovereign Wealth Fund (based on DnB NOR's oil price estimates)
-200
-150
-100
-50
0
50
100
150
200 USD billion
In per cent of GDP
0
50
100
150
200
250
0
200
400
600
800
1 000
1 200
1 400
1 600
2001 2005 2009 2013 2017
in USD billion in per cent of GDP

Still rich in natural resources
16
Norwegian exports by sector in 2010
50 %
6 %7 %
9 %
28 %
Oil/gas Food/seafood
Shipping Other commodities
Other
Source: Statistics Norway

The Norwegian bank – also internationally
International
Share of group income
17

Increasing international activity – presence in 20 countries
18 Source: IMF, World Economic Outlook
Global growth
about 4%

Oil demand exceeding supply - greater investment required
19
Global oil supply vs demand E&P spending among 70 oil companies
Source: DnB NOR Markets
75
80
85
90
95
100
105
110
2002 2004 2006 2008 2010 2012 2014
Global supply* Global demand
* Assuming OPEC producing at current level
Million b/d
0
25
50
75
100
125
0
100 000
200 000
300 000
400 000
500 000
600 000
1975
1980
1990
2000
2005
2010
2011e
2012e
E&P spending WTI crude price
USD million USD/bbl

Global trade is back on track
20
20
40
60
80
100
120
140
160
180
80-90 per cent of global trade goes by sea
2-3 per cent higher growth in global exports
than in global GDP
Source: CPB - Netherlands Bureau for Economic Policy Analysis
Total global trade (Seasonally adjusted volume, average exports and imports)
Indexed, 2000 = 100

Population growth and health focus drive demand for seafood
21
Population growth
Increased consumption per capita
0
50
100
150
200
250
300
350
World fisheries and fish farming production (In million tonnes)
Wild catch Fish farming scenario 1 Fish farming scenario 2 Fish farming
Source: FAO and DnB NOR Markets

Untapped opportunities
Strong platform
Robust strategy for profitable growth
22

How to grow?
Large corporate
customers
32%
Small and
medium-sized
enterprises
20%
Personal
banking
customers
48%
Share of net lending Q1 2011
23
Maintain an even balance between personal
banking customers and corporates

Where to grow?
Internationally - Strategic core industries
DnB
NORD
5%
Norwegian units 82%
International units 13%
Share of group income Q1 2011 Norway
- Personal banking customers and corporates
Nordics and the Baltics - Selective retail growth
24

Consider sale of Polish division
25
• Modest position
• Highly competitive market
• Costly to achieve a favourable strategic position
• Safeguard interests of both customers and employees

26
Stronger and united – one group, one brand

27
Sustainable strategy
Growth opportunities
More of the same

30


New financial ambitions
Drivers for growth
New regulations
Funding
2
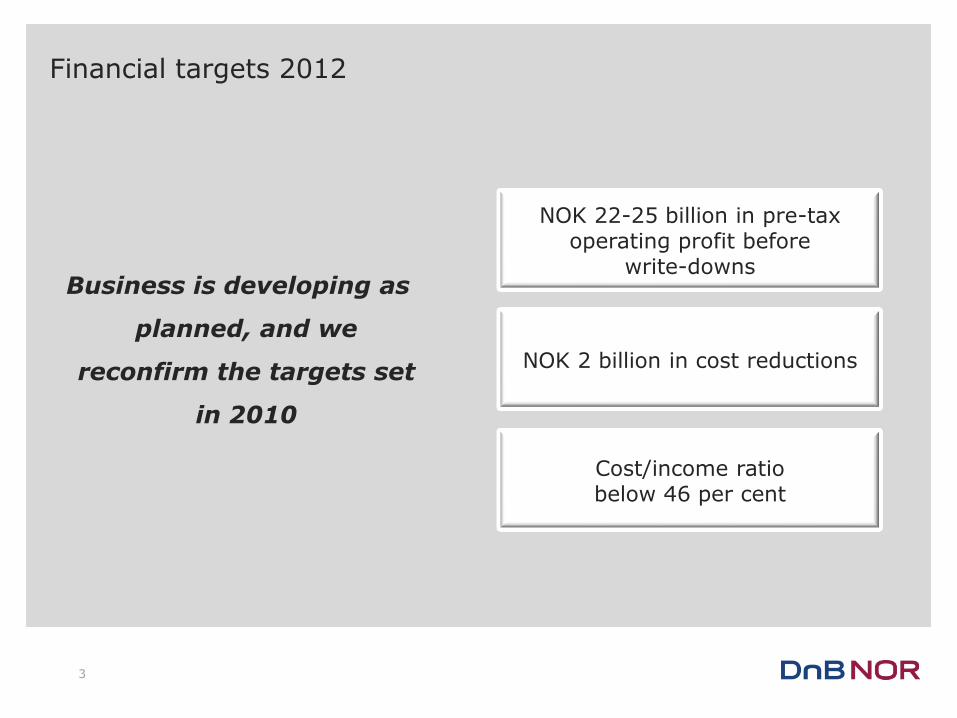
Financial targets 2012
Business is developing as
planned, and we
reconfirm the targets set
in 2010
NOK 22-25 billion in pre-tax operating profit before
write-downs
NOK 2 billion in cost reductions
Cost/income ratio below 46 per cent
3

Financial ambitions towards 2015
Return on equity above 14 per cent
NOK 30 billion in pre-tax operating profit before write-downs
NOK 1 billion in new cost reductions
Cost/income ratio below 45 per cent
4

No change in capital strategy and dividend policy
Be among the best capitalised banks in the Nordic region
Long-term AA rating for the bank
Approximately 50% dividend payout ratio
5

Assumptions underlying our financial ambitions
• Basel III will be implemented according to the schedule presented in December 2010
Basel III
• The Norwegian authorities will not introduce additional regulations or taxes/fees for the Norwegian financial sector
Norwegian regulations
• Increasing economic growth in Norway
• Stable international growth
• NOK money market rates of 5% in 2014
Macroeconomic developments
6

Robust macroeconomic development in Norway
0
1
2
3
4
5
2010 2011 2012 2013 2014
0
1
2
3
4
5
6
2010 2011 2012 2013 2014
0
1
2
3
4
2010 2011 2012 2013 2014
4
5
6
7
2010 2011 2012 2013 2014
GDP growth, per cent excluding the oil and gas sector
3-month NIBOR, per cent
Unemployment rate (In per cent of labour force)
Exchange rate NOK/USD
7

New financial ambitions
Drivers for growth
New regulations
Funding
8

Drivers for profitable growth
• Increase in volume above market
growth
• Higher interest rates
• Wider combined spreads
• Improvement programmes and
cost reductions
• Low write-downs
9

Additional NOK 1 billion in targeted annual cost savings by year-end 2014
10
Streamlining of business processes
Consolidation and centralisation
Improving procurement routines
Reorganising IT operations
350-400
300-400
200-250
NOK million
Increased cost savings (NOK million)
0
100
200
300
400
500
600
700
800
900
1000
2011 2012 2013 2014
50 -100

• Automatisation
• Digitalisation
• Increased use of self-service options
11
NOK million
350-400 Streamlining of business processes

• Postbanken, Vital and other entities united under one brand
in Norway • From 11 marketing units to one • Streamlined distribution • Full integration of DnB NORD, including closing down the
Copenhagen office
Consolidation and centralisation
NOK million 300-400
12

• Better prices and terms • Better allocation of resources • Coordinated processes
Improving procurement routines
Reorganising IT operations
• Simplification and standardisation • From 14 IT units to one
NOK million 50-100
NOK million 200-225
13

Portfolio quality remains strong
836
430
140
22
941
430
101
19
PD 0.01% - 0.75% PD 0.75% - 2.0% PD 2.0% - Net non-performing and net doubtful
commitments 31 March 2010 31 March 2011
Exposure at default (NOK billion)
PD = probability of default
14

Low write-downs
0,00 %
0,10 %
0,20 %
0,30 %
0,40 %
2010 2011 2012 2013 2014
Best estimate of future write-downs in per cent of total lending
15

New financial ambitions
Drivers for growth
New regulations
Funding
16

Basel III – four main issues
• Prepare for the schedule presented in December 2010 Implementation
• Leverage ratio best among Nordic peers Leverage ratio
• Capitalisation above expected requirements Capitalisation
• On track Liquidity
17

Expected implementation schedule
2013 2015 2016 2018 2019
Basel III introduction Solvency II introduction
LCR, minimum
Tier 1 capital
(4.5/6.0%)
Phase-in conservation buffer
NSFR, leverage ratio in pillar 1
Basel III completed
- as of 1 January each year
18

Leverage ratio: best among Nordic peers
3.6%
3.9% 4.0%
4.8% 4.8%
5.2%
Bank 1 Bank 2 Bank 3 Bank 4 Bank 5 DnB NOR
Tier 1 capital/total assets
As of 31 March 2011, from the quartely reports of our Nordic peers 19

DnB NOR is adequately capitalised
9.2 %
11.4 %
Expected range
10.0 – 12.0 %
10.0 %
12.3 %
Expected range 12.0 – 14.0%
CE T1 ratio CE T1 ratio New standard
T1 ratio T1 ratio New standard Full IRB Full IRB
Common Equity T1 and Equity T1 for DnB NOR as of 31 March 2011, including 50 per cent of profit for the period
Capitalisation of DnB NOR as of 31 March 2011 compared to expected new Basel III standards
20

New financial ambitions
Drivers for growth
New regulations
Funding
21

DnB NOR: a strong name in the funding market
Increasing the average residual maturity on
long- term senior debt and covered bonds
Diversifying funding activities to the USA and Australia with good results, both for long and short-
term funding
Stable deposit coverage at about 55%
22

Average residual maturity is increasing
2.0
2.5
3.0
3.5
4.0
4.5
2003 2004 2005 2006 2007 2008 2009 2010
Average residual maturity, long-term senior debt and covered bonds (years)
23

Long-term funding at competitive prices
25
35
45
55
65
75
85
95
105
115
125
aug.10 sep.10 okt.10 nov.10 des.10 jan.11 feb.11 mar.11 apr.11 mai.11
Z s
pread
, b
id levels
Secondary performance large liquid Nordic 5-year transactions over the last six months
DANBNK 4.75 06/04/2014 DNBNOR 4.5 05/29/2014 NBHSS 4.5 05/12/2014
POHBK 4.5 05/22/2014 SEB 5.5 05/06/2014 SHBASS 4.875 03/25/2014
Source: Barclays Capital Research, Time Series Plotter 24

Well positioned
New and strong financial ambitions
Robust and profitable portfolio
Well prepared for new regulations
Good access to funding at competitive prices
25

56


Untapped opportunities for profitable growth
Strong platform in Norway
2

Strong market shares Well positioned in home market – product areas and customer segments
Retail market
28 %
32 %
51 %
29 %
Corporate market
24 %
35 %
26 %
22%
Lending Deposits Policyholders’ funds Mutual fund assets
Lending* Deposits Policyholders’ funds Mutual fund assets
1Q 2011 * = share of lending from credit institutions
3

Stable total income and high return on allocated capital
ROAC is calculated on the basis of internal measurement of risk-adjusted capital. 4
4.7
5.0 5.1
4.8 4.6
4.8 4.7 4.8 4.8
24 %
31 % 27 % 26 %
25 % 23 % 25 %
23 % 25 %
0 %
5 %
10 %
15 %
20 %
25 %
30 %
35 %
40 %
45 %
50 %
1
2
3
4
5
6
1Q 09 2Q 09 3Q 09 4Q 09 1Q 10 2Q 10 3Q 10 4Q 10 1Q 11
Total income Return on allocated capital (annualised)
Development in total income and return on allocated capital in Retail Banking
NOK billion

Increasing growth – relatively stable interest spreads
Lending to and deposits from customers. Nominal values, excluding impaired loans. * Volume growth in Retail Banking in the period Jan-May 2011 (annualised)
Development in spreads Volume growth (annualised)
5
1.67% 1.67% 1.61%
1.69% 1.63%
0.42% 0.44% 0.53%
0.37% 0.40%
1.24% 1.26% 1.24% 1.24% 1.21%
1Q 10 2Q 10 3Q 10 4Q 10 1Q 11
Lending spread Deposit spread
Weighted spread
4.9 %
4.2 % 3.7 %
4.2 %
8.0 %
1.2 % 1.1 %
2.3 %
4.2 %
7.7 %
1Q 10 2Q 10 3Q 10 4Q 10 YTD*
Growth lending volumes Growth deposit volumes

Income is well balanced between products and segments
Excluding interest on allocated capital
23%
7%
13%
10% 5%
2%
12%
9%
9%
10% Mortgages lending
Corporate long term lending Consumer finance/ short-term credit Car finance
Investment and equipment finance Autolease/factoring
Other loans
Current account
Demand deposits
Other deposits
6
Net interest income 2010

Improved portfolio quality
Exposure at default (NOK billion) Corporate customers
Exposure at default (NOK billion) Personal banking customers
Low risk Medium risk High risk Low risk Medium risk High risk
7
416
127
45
5
458
132
38
4
PD 0.01% -
0.75 %
PD 0.75% -
2.0%
PD 2.0% - Net non
performing and
net doubtful
commitments
31 Dec 2009 31 March 2011
130
86
44
2
148
89
37
2
PD 0.01% -
0.75 %
PD 0.75% -
2.0%
PD 2.0% - Net non
performing
and net
doubtful
commitments 31 Dec 2009 31 March 2011
PD = Probability at default

Sound asset quality in mortgage loan portfolio in Retail Banking
Mortgage loans (NOK billion)
Mortgage loans based on actual collateral categories 8
397
52 28
430
52 22
Mortgage within 60 per cent of collateral value
Mortgage between 60 and 80 per cent of collateral value
Mortgage above 80 per cent of collateral value
31 Dec 2009 31 March 2011

Actual write-downs on loans significantly below normal levels
Corporate and personal customers - Retail Banking
NOK million
9
207
284
372 362
252
562 556 558 551 545
1Q 2010 2Q 2010 3Q 2010 4Q 2010 1Q 2011
Write-downs on loans and guarantees
Normalized write-downs on loans and guarantees

2.1 million personal
customers
200 000 corporate customers
1 million
insurance policyholders
130 000
non-life insurance
policyholders
600 000
mutual fund customers
400 000
mortgage loan customers
Out of 4 937 000 inhabitants:
Total customer base represents nearly half of the market
10
Estimated 40% of customers uses additional banks

Strong and unique distribution power in Norway
50 corporate advisory services centres
13 regional Markets
sales desks
112 real estate
offices
218
branch offices
208 post offices
2165 in-store
banking and postal outlets
Only bank in Norway with services available on Saturdays
11

1.6 million
online banking
customers
17 000 daily calls
and e-mails from
customers
0.8 million mobile
banking users
24/7
telephone banking
More than 4 million SMS
per month
37 million debit card
transactions per month Share of
households with Internet access and broadband connection
>= 70%
50 - < 70%
< 50%
High Internet and broadband penetration*
Strong and unique distribution power in Norway
Only bank in Norway with customer service open 24 hours a day,
every day
12 *Source: European Commission – Eurostat

Having satisfied customers leads to long-term profitability
DnB NOR customer satisfaction personal banking customers
RepTrak reputation survey - DnB NOR
56.2
64.2
65.8
2009 2010 2011
62
70
72 73
2008 2009 2010 2011
13

Ambitions in Norway
Stable and high return on equity
Lending growth > national credit growth rate
Low and stable losses
14

Untapped opportunities for profitable growth
Strong platform in Norway
15

Opportunities for profitable and sustainable growth
16

Regional variations in growth rates
Growth of new enterprises High growth rate in the four
largest cities in Norway
Source: Statistics Norway Source: The Confederation of Norwegian Enterprises (NHO)
17

We are well positioned for further growth
Low growth rate
High market share Low market share
High growth rate
Smaller cities East and North
Bergen
West coast
Oslo
Smaller cities West Trondheim Stavanger
18 Source: Statistics Norway – number of citizens

Growth on schedule in the four largest cities
Volume growth in Retail Banking in the period Jan-May 2011 (annualised) Banking market annualised based on 1Q 2011
Lending Deposits
Personal Banking
customers
Corporate customers
19
Banking market = 5.7%
Banking market = 6.4%
Banking market = 9.1%
Banking market = 3.8%

Opportunities for profitable and sustainable growth
20

High focus on selected segments with substantial potential
Young adults:
High net present value
Academics:
High potential segment
Affluent:
Very high potential segment
SME: Business offering
tailored to industry needs
1 2
3 4
21

Population growth among young adults ‒ increasing need for new housing
Source: Statistics Norway /DnB NOR Markets
-20 000
-10 000
0
10 000
20 000
30 000
40 000
50 000
1980 1988 1996 2004 2012 2020 2028 2036 2044 2052 2060
Population 20-34: y/y Completed homes
Highly competitive mortgage loan interest
rates
NOK 33 billion in ‘BLU’ loans
Cross-selling between a number of products
1
Distribution advantages home-university-work
Marketing and sponsorships
22
Development in young population vs completed homes

Exclusive distribution to academics – attractive customer segment with high growth
Best market terms – also for self-employed persons and SMEs
Product range to suit both professional and private
needs
Exclusive distribution agreement with the
Federation of Norwegian Professional Associations
2
Source: Norwegian Professional Associations
128
133
139
126
131
137
144
148
154
2003 2004 2005 2006 2007 2008 2009 2010 2011
Increasing number of members joining the Federation of Norwegian Professional Associations (in 1000)
23

Well positioned to be the natural choice for Norway’s most affluent bank customers
Assets under management – 33% annual growth rate
Proven excellent quality of management of proprietary mutual funds
Wide product range – including non-proprietary products
3
24

The number of newly established enterprises increased over the last 12 months
Corporate and personal needs
Entrepreneurs
Franchises
Academics
Source: Statistics Norway
4
25

Export industries are generating growth in the SME segment 4
Norwegian exports by sector in 2010
50 %
6 %7 %
9 %
28 %
Oil/gas Food/seafood
Shipping Other commodities
Other
Source: The Confederation of Norwegian Enterprises (NHO) Source: Statistics Norway
26

We are the preferred bank for CM solutions in Norway –important driver for stable funding
Products tailored to customer size and
growth
Services available on Saturdays through post
offices
Local and national bank
Source: Large Corporate Banking Survey, Norway
(116) (88)
(110) (91)
(70) (53)
(66) (59)
(48) (39)
(27) (26)
(76) (60)
(73) (63)
(46) (37)
(47) (39)
(34) (22)
(19) (22)
Use bank for domestic cash management
Use bank for overall international cash management
DnB NOR
Bank #2
Bank #3
Bank #4
Bank #5
Bank #6 2010
2009
4
27

Growth in demand and rising interest rates will reduce pressure on spreads
Stable interest rates generate pressure on spreads. Rising interest rates give
opportunities over time
International spread adjustment not fully implemented in the Norwegian corporate
market due to slack in demand
Competitive funding terms compared to local savings banks
3.7
- 3.0
- 1.0
1.0
3.0
5.0
7.0
9.0
11.0
13.0
15.0
Jan 09
Apr Jul Oct Jan 10
Apr Jul Oct Jan 11
Apr Jul Oct
Growth in corporate lending - credit indicator C2
Source: Statistics Norway 28

Opportunities for profitable and sustainable growth
29

Product penetration – leading position compared to European peers
Source: Finalta and DnB NOR - 2010
0.00
0.50
1.00
1.50
2.00
2.50
3.00
3.50
4.00
4.50
5.00
1 4 7 10 13 16 19 22 25 28 31 34
West European Peers
Average 2.27
DnB NOR
30
Average number of products per customer

Still untapped potential – pricing scheme encourages greater product penetration
0.00
0.50
1.00
1.50
2.00
2.50
3.00
3.50
4.00
4.50
5.00
1 4 7 10 13 16 19 22 25 28 31 34
West European Peers
Average 2.27
DnB NOR
DnB NOR loyalty programme customers
31
Average number of products per customer
Source: Finalta and DnB NOR - 2010

Innovative products increase sales
Find your ”home” app Start-up enterprise app
Buy a car app – easier and more efficient
32

New pension reform requires more private savings
Source: Finance Norway (FNO)
Example: Pension payment for a person born in 1963, 40-year service period,
retirement at 67
Pro-active offering of professional advice and savings solutions
New product range and good track record
Discretionary asset management
More than 45% of top-rated mutual funds (Morningstar)
33
150
155
160
165
170
175
180
185
Former national insurance scheme
New national insurance scheme
NOK 1000

Brisk sales of insurance products
Non-life insurance market share up almost 50% in two years*
Number of life insurance policies up from 4 000 in 1Q 2010 to 9 000 in 1Q 2011
More than 90% of our sales people are certified
Development in number of insurance policies sold
* Source: Finance Norway (FNO) 34
-
10 000
20 000
30 000
40 000
50 000
60 000
70 000
80 000
90 000
100 000
Jan-May 2010 Jan-May 2011

Strong foothold in the market and high market share within consumer finance, with further growth potential
Source: Datamonitor
Pay Later Card Market Forecasted compound growth rates until 2013
1.0 %
1.6 %
1.6 %
3.4 %
4.0 %
5.7 %
6.0 %
6.1 %
6.4 %
6.7 %
6.7 %
7.6 %
7.8 %
7.9 %
8.8 %
9.3 %
16.3 %
UK
Greece
Ireland
Sweden
Switzerland
Denmark
France
Germany
Portugal
Italy
Spain
Belgium
Norway
Austria
Finland
Netherlands
Turkey
Substantial growth in credit card usage in Norway
Increasing market share within car financing and credit cards
Strong sales from distribution through other retailers
Wider presence in neighbouring countries
35

Close integration between real-estate business and home loan sales, with further growth potential
Increase in number of real estate sales through our real estate agents.
Leads to home loan sales six times greater
than actual housing sales: Increasing hit rate on mortgage
leads – 36 000 leads yearly
New projects – cooperation between brokers, private and corporate
sales
Most satisfied and most loyal customers
Front runner in online solutions
Market leader in Norway – strategy for growth
36
3 901
4 096
4 414
5 234
1Q 2008 1Q 2009 1Q 2010 1Q 2011

Four drivers for sustainable growth in the Norwegian market
37

94


2
Growth opportunities
Proven strategy – solid results

3
Strategy based on long-term relationship-oriented banking and industry expertise
EaD NOK billion
31 March 2011
284
67
163

4
Increasing share of total income from international business*
3 371
4 160
4 555
5 096
9.8%
11.1% 11.5%
13.4%
0%
2%
4%
6%
8%
10%
12%
14%
16%
0
1 000
2 000
3 000
4 000
5 000
6 000
2008 2009 2010 2011 (annualised)
Total income international units Share of group income
*Baltics & Poland not included Annualisation: Income = Q1-2011 * 4, Share of group income = actual proportion Q1-2011
NOK million

5
Strong and profitable growth in our global industries
Development in profit, losses and RORAC Global industries*
NOK million
*Sum of shipping, offshore, logistics, energy & seafood Annualisation 2011: Profit before write-downs = ytd May/5*12, Actual losses = ytd May/5*12, Normalised losses = ytd May/5*12, RORAC = ytd May/5*12
2 436
3 150
3 478 3 605
758
1 251 1 092
735
145
457 307
43
13.5%
10.9%
14.7%
22.4%
0 %
5 %
10 %
15 %
20 %
25 %
0
500
1 000
1 500
2 000
2 500
3 000
3 500
4 000
2008 2009 2010 2011 (annualised)
Profit before write-downs Normalised losses Actual losses RORAC
Shipping, Offshore and
LogisticsEnergy Seafood
Telecom
ServiceTech-nology
RetailIndustry
Com-mercial
Real Estate
PublicSector
Finance
Customer value
Healthcare products
Forest
IndustriesMedia

6
Increased profitability driven by volume growth and wider lending spreads
NOK billion
Development in lending, deposits and spreads Global industries*
*Sum of shipping, offshore, logistics, energy & seafood
147
195 179 183
86 103 107 117
0.70 % 0.86 %
0.94 % 0.97 % 1.00%
1.26%
1.49% 1.60%
0.00 %
0.25 %
0.50 %
0.75 %
1.00 %
1.25 %
1.50 %
1.75 %
2.00 %
-
20
40
60
80
100
120
140
160
180
200
2008 2009 2010 1Q2011
Net lending (excl. cred. inst.) Deposits from customers
Combined spread (weighted) Lending spread (weighted)
Shipping, Offshore and
LogisticsEnergy Seafood
Telecom
ServiceTech-nology
RetailIndustry
Com-mercial
Real Estate
PublicSector
Finance
Customer value
Healthcare products
Forest
IndustriesMedia

7
Other industries are also important contributors to profitability and diversification
Development in profit, losses and RORAC Other industries*
NOK million
*Sum of telecom, healthcare, forest industries, media, commercial real estate, retail industry, technology, public sector, services, finance
2 169
2 770 2 588
3 273
368 461 419 463
10
621
-41
463
22.6%
19.9%
24.9%
20%
0 %
5 %
10 %
15 %
20 %
25 %
30 %
- 500
0
500
1 000
1 500
2 000
2 500
3 000
3 500
2008 2009 2010 2011 (annualised)
Profit before write-downs Normalised losses Actual losses RORAC
Annualisation 2011: Profit before write-downs = ytd May/5*12, Actual losses = Eguals normalised losses, Normalised losses = ytd May/5*12, RORAC = ytd May/5*12
Shipping, Offshore and
LogisticsEnergy Seafood
Telecom
ServiceTech-nology
RetailIndustry
Com-mercial
Real Estate
PublicSector
Finance
Customer value
Healthcare products
Forest
IndustriesMedia

8
Significant increase in lending volume and spreads at the start of 2011
NOK billion
*Sum of telecom, healthcare, forest industries, media, commercial real estate, retail industry, technology, public sector, services, finance
Development in lending, deposits and spreads Other industries*
138
110 111
159
122 93 89 105
0.65% 0.79%
0.84% 0.95% 0.97%
1.31% 1.41%
1.52%
0.00 %
0.25 %
0.50 %
0.75 %
1.00 %
1.25 %
1.50 %
1.75 %
2.00 %
-
20
40
60
80
100
120
140
160
180
200
2008 2009 2010 1Q2011
Net lending (excl. cred. inst.) Deposits from customers
Combined spread (weighted) Lending spread (weighted)
Shipping, Offshore and
LogisticsEnergy Seafood
Telecom
ServiceTech-nology
RetailIndustry
Com-mercial
Real Estate
PublicSector
Finance
Customer value
Healthcare products
Forest
IndustriesMedia

244
163
65
4
314
170
30 4
PD 0.01% - 0.75% PD 0.75% - 2.0% PD 2.0% - Net non-performing and net doubtful
commitments
30 Dec. 2009 31 March 2011
9
Improved quality in the large corporate portfolio
Low risk Medium risk High risk
Shipping, Offshore and
LogisticsEnergy Seafood
Telecom
ServiceTech-nology
RetailIndustry
Com-mercial
Real Estate
PublicSector
Finance
Customer value
Healthcare products
Forest
IndustriesMedia
PD = Probability of default
Exposure at default (NOK billion)

10
Diversified LBO portfolio
Distribution per risk category
Total portfolio of NOK 51.3 billion,
comprising 92 exposures
Acceptable risk level
Well-diversified sector mix
17 % 70 %
14 % High risk (grade 7.7-10)
Moderate risk (grade 5-
7.7)
Low risk ( grade < 5)
Infrastructure 2 % Energy
12 %
Industrials 11 %
Services 29 %
Consumer 12 %
Healthcare 18 %
Technology 8 %
Media 2 %
Financials 6 %
Distribution per industry segment
Shipping, Offshore and
LogisticsEnergy Seafood
Telecom
ServiceTech-nology
RetailIndustry
Com-mercial
Real Estate
PublicSector
Finance
Customer value
Healthcare products
Forest
IndustriesMedia

11
The shipping, offshore and logistics portfolio has been stable since the end of 2008
Loans and guarantees 2006-2010
Portfolio segmentation 31 March 2011 vs 31 March 2010
Offshore
25% (27%)
Crude oil
tankers
10%
(10%)
RoRo/PCC
3% (4%)
Container 11% (9%)
Cruise
4% (5%)
Dry cargo
15%
(15%)
Chemical and
product
tankers
7% (8%)
Other
shipping
2% (3%)
Other non-
shipping
8% (3%)
Gas
9% (10%)
Logistics
6% (7%)
Shipping, Offshore and
LogisticsEnergy Seafood
Telecom
ServiceTech-nology
RetailIndustry
Com-mercial
Real Estate
PublicSector
Finance
Customer value
Healthcare products
Forest
IndustriesMedia
89
117
180
143 152
143
0
20
40
60
80
100
120
140
160
180
200
2006 2007 2008 2009 2010 1Q2011
Total loans and guarantees Adj.Loans/guarantees
NOK billion

12
Limited write-downs and improved portfolio quality
Shipping write-downs in NOK and per cent of drawn portfolio past 20 years
Exposure at default Shipping, offshore & logistics
Low risk Medium risk High risk
-1.0 %
-0.5 %
0.0 %
0.5 %
1.0 %
1.5 %
2.0 %
2.5 %
3.0 %
-200
0
200
400
600
800
1000
Net write-downs % of drawn portfolio
PD = Probability of default
NOK million
0
20
40
60
80
100
120
PD 0.01% -
0.75%
PD 0.75% -
2.0%
PD 2.0% -
31 March 2010 31 March 2011
Shipping, Offshore and
LogisticsEnergy Seafood
Telecom
ServiceTech-nology
RetailIndustry
Com-mercial
Real Estate
PublicSector
Finance
Customer value
Healthcare products
Forest
IndustriesMedia
NOK billion

13
The dry bulk and tanker segments are showing high volatility
Dry bulk (USD/day)
Spot rates for dry-bulk capesize vessels last 10 years vs. DnB NOR's current estimates
Tankers (USD/day)
Spot rates for VLCC tanker vessels last 10 years vs. DnB NOR's current estimates
0
20 000
40 000
60 000
80 000
100 000
120 000
140 000
160 000
180 000
200 000
apr.
01
apr.
02
apr.
03
apr.
04
apr.
05
apr.
06
apr.
07
apr.
08
apr.
09
apr.
10
apr.
11
Spot rates Base Case Risk Case
-20 000
30 000
80 000
130 000
180 000
230 000
apr.
01
apr.
02
apr.
03
apr.
04
apr.
05
apr.
06
apr.
07
apr.
08
apr.
09
apr.
10
apr.
11
Spot rates Base Case Risk Case
10 000 15 000
20 000 25 000
USD USD
Shipping, Offshore and
LogisticsEnergy Seafood
Telecom
ServiceTech-nology
RetailIndustry
Com-mercial
Real Estate
PublicSector
Finance
Customer value
Healthcare products
Forest
IndustriesMedia
Apr
01
Apr
02
Apr
03
Apr
04
Apr
05
Apr
06
Apr
07
Apr
08
Apr
09
Apr
10
Apr
11
Apr
01
Apr
02
Apr
03
Apr
04
Apr
05
Apr
06
Apr
07
Apr
08
Apr
09
Apr
10
Apr
11

14
Growth opportunities
Proven strategy – solid results

15
We have a clear #1 position in the Norwegian market
DnB NOR Bank #2 Bank #3 Bank #4 Bank #5 Bank #5
Source: Large Corporate Banking Survey, Norway
Market penetration and tier position
Shipping, Offshore and
LogisticsEnergy Seafood
Telecom
ServiceTech-nology
RetailIndustry
Com-mercial
Real Estate
PublicSector
Finance
Customer value
Healthcare products
Forest
IndustriesMedia

16
Significant improvement in our pan-Nordic position
-23
-4
52
44
109
-15
11
40
81
94
-40 -20 0 20 40 60 80 100 120
Bank #5
Bank #4
Bank #3
DnB NOR
Bank #2
2010 2009
Overall relationship quality – pan-Nordic
Source: Large Corporate Banking Survey, Pan-Nordic
Shipping, Offshore and
LogisticsEnergy Seafood
Telecom
ServiceTech-nology
RetailIndustry
Com-mercial
Real Estate
PublicSector
Finance
Customer value
Healthcare products
Forest
IndustriesMedia

17
Growth in non-lending income
LCI total (NOK million)
Dedicated customer teams drive cross-sales
LCI international units (NOK million)
1 418 1 708
1 995 2 202
669
842
1 142 1 342
0
500
1 000
1 500
2 000
2 500
3 000
3 500
4 000
2008 2009 2010 Q1-2011
annualised
Lending income Non-lending income
3 237 4 354
5 315 5 567
4 077
4 215
4 334 4 869
0
2 000
4 000
6 000
8 000
10 000
12 000
2008 2009 2010 Q1-2011
annualised
Lending income Non-lending income
Shipping, Offshore and
LogisticsEnergy Seafood
Telecom
ServiceTech-nology
RetailIndustry
Com-mercial
Real Estate
PublicSector
Finance
Customer value
Healthcare products
Forest
IndustriesMedia

18
We are one of the world’s leading shipping banks
2010 top bookrunner table: syndicated shipping loans
Pos. Bookrunner Deal value $m No. % share
1 DnB NOR Bank 5 714 39 11
2 Nordea Bank 4 622 22 9
3 Mitsubishi UFJ Financial Group 3 576 12 7
4 ING 1 952 9 4
5 Citi 1 679 7 3
6 BNP Paribas 1 156 4 2
7 RBS 1 072 4 2
8 JPMorgen 1 003 4 2
9 Bank of America Merrill Lynch 910 4 2
10 Danske Bank 900 2 2
Source: Dealogic
Shipping, Offshore and
LogisticsEnergy Seafood
Telecom
ServiceTech-nology
RetailIndustry
Com-mercial
Real Estate
PublicSector
Finance
Customer value
Healthcare products
Forest
IndustriesMedia

19
We have supported our core clients and remained active throughout the financial crisis
We know the industry and our
clients
We give priority to clients with
cross-sale potential
We finance shipping companies, not
vessels
Shipping, Offshore and
LogisticsEnergy Seafood
Telecom
ServiceTech-nology
RetailIndustry
Com-mercial
Real Estate
PublicSector
Finance
Customer value
Healthcare products
Forest
IndustriesMedia

20
US IG Energy Bookrunner
2009
Rank Bank Volume
1 DnB NOR 3 937
2 JP Morgan 3 715
3 Bank of America 3 695
4 Wells Fargo 3 556
5 BNP Paribas 1 960
2010
Rank Bank Volume
1 Wells Fargo 15 694
2 JP Morgan 15 149
3 Bank of America Merril Lynch 12 285
4 Citi 12 195
5 DnB NOR 8 650
EMEA Oil & Gas Bookrunner
2010
Rank Bank Volume
1 BNP Paribas Group 5 769
2 Societe Generale 5 528
3 RBS 3 299
4 Credit Agricole CIB 3 257
5 JP Morgan 3 194
6 ING Groep NV 2 697
7 Standard Chartered PLC 2 541
8 Misubishi UFJ finanncial 2 254
9 Citi 2 214
10 DnB NOR 1 990
We are clearly visible in the major energy league tables
Source: Thomson Reuters Loan Pricing Corporation
Shipping, Offshore and
LogisticsEnergy Seafood
Telecom
ServiceTech-nology
RetailIndustry
Com-mercial
Real Estate
PublicSector
Finance
Customer value
Healthcare products
Forest
IndustriesMedia

And well positioned to capitalise on future opportunities
Strong Norwegian platform
Reinforced international standing
during the financial crisis
Energy professionals and products
available worldwide
21
Shipping, Offshore and
LogisticsEnergy Seafood
Telecom
ServiceTech-nology
RetailIndustry
Com-mercial
Real Estate
PublicSector
Finance
Customer value
Healthcare products
Forest
IndustriesMedia
Selected transactions 2010 and 2011

22
Our expertise and global presence enable us to capitalise on the opportunities within seafood
Cross-sales to our existing Norwegian customer base
Aquisition of selected customers in Chile and Peru, North-America and
Northern Europe
Shipping, Offshore and
LogisticsEnergy Seafood
Telecom
ServiceTech-nology
RetailIndustry
Com-mercial
Real Estate
PublicSector
Finance
Customer value
Healthcare products
Forest
IndustriesMedia
Selected transactions 2009 and 2010

Our international presence supports our strategy
Proven model of control & governance – no business
outside strategy
Organic growth in international network to meet customer needs
Significant industry and product capabilities added
over the years
23
Shipping, Offshore and
LogisticsEnergy Seafood
Telecom
ServiceTech-nology
RetailIndustry
Com-mercial
Real Estate
PublicSector
Finance
Customer value
Healthcare products
Forest
IndustriesMedia

No change in strategy. More of the same. Solid market position in key segments
Strong mega-trends support our growth opportunities within shipping, offshore, energy and seafood
International network with products and expertise adapted to our customers’ needs
Well-positioned to tap into the growth areas of the future
24
Well positioned for the future

119


2
Macroeconomic situation and future outlook
Background
Growth

-20
-15
-10
-5
0
5
10
15
Real GDP growth in per cent
Estonia Latvia Lithuania
From joint venture to 100 per cent ownership
3
“The Baltics...an area with good future earnings potential.”
Evaluation period starts
“Establishing DnB NORD is strategically important to participate in the expected growth in this region, as well as being present for our Nordic customers.”
DnB NOR enters into JV with NORD/LB “The Baltics...higher growth potential than Western Europe, and DnB NOR wishes to grow within the retail banking segment.”
DnB NOR acquires 100 %

Governance model aligned with DnB NOR
4
New legal structure
New operational governance structure implemented
”One Group” in the Baltics
Strong central control of risk
Centralised funding

5
Macroeconomic situation and future outlook
Background
Growth

c
Recession over – strong recovery
6 Source: Eurostat, European Commission, DnB NORD forecasts

Positive credit demand expected
Growth in loans granted to private sector in per cent
Source: Eurostat, ECB Data Warehouse 7

0
1 000
2 000
3 000
4 000
5 000
6 000
7 000
Lendin
g
Deposit
Lendin
g
Deposit
Lendin
g
Deposit
Lendin
g
Deposit
Lendin
g
Deposit
2007 2008 2009 2010 Q1
2011
mEUR
Lithuania Latvia Estonia
0
100
200
300
400
500
600
700
800
Private individuals Legal entities
Non-performing portfolio Baltic States 1Q 2008 – 1Q 2011
mEUR
Customers have been safeguarding their financial position
Lending and deposit volumes DnB NORD , Q1 2011
8
Lendin
g
Deposits
Lendin
g
Deposits
Lendin
g
Deposits
Lendin
g
Deposits
Lendin
g
Deposits
2008 2009 2010 1Q 2011
2007

Growth potential in a sizeable market
9
Country Population Market position
No of customers
Lithuania 3.3 mill 3 0.7 mill
Latvia 2.3 mill 4 0.2 mill
Estonia 1.3 mill 5 0.01 mill
Total Baltics
6.9 mill 0.9 mill
Norway 4.9 mill 1 2.1 mill
Lithuania 1.8 %
Latvia 1.4 % Estonia
0.2 %
Rest of the
Group 96.5 %
DnB NOR lending per country Q1 2011

Large corporate
8 %
SME 46 %
Lithuania 52 %
Latvia 41 %
Estonia 7 %
A well diversified retail portfolio
Lending per country - Q1 2011
EUR 5 450 million
Lending per segment - Q1 2011 EUR 5 450 million
10 Definintion large corporate > EUR 50 mill turnover
Private individuals
46%

11
Macroeconomic situation and future outlook
Background
Growth

Good market coverage in Latvia and Lithuania
• Estonia: Mainly a corporate and leasing bank with efficient operations
• Latvia: A universal bank ranked number 2 within lending to private individuals
• Lithuania: A universal bank with an extensive branch network and a top position in rural areas and the public sector
DnB NORD branches in the Baltics
12

Large
corporate 11 %
SME
48 %
Private
individuals 41 %
Lending volumes in Lithuania by segment Q1 2011 EUR 3 171 million
Lithuania: Expecting pick-up in retail market
13
0 %
5 %
10 %
15 %
20 %
25 %
2003 2004 2005 2006 2007 2008 2009 2010
Retail loans Corporate loans Total loans
Market share in Lithuania 2003 - 2010
Definintion large corporate > EUR 50 mill turnover

Lithuania: Customer feedback supports the potential for growth
14
73.6
81
71
78.3
B2B B2C
DnB NORD Industry average
Customer survey index for banking sector in Lithuania 20101
1) EPSI research 2010 2) Survey conducted by Spect-Dive (”Mystery shopping”), December 2010
0 % 50 % 100 %
DnB NORD
Bank 2
Bank 3
Bank 4
Bank 5
2009 2010
99
94
93 94
95
75
92
77
86 69
Mystery shopping ranking Lithuania2
(Top 5 banks 2009 – 2010)

Lithuania: Further develop an already strong position
• Strengthen the position in the five main cities
• Protect the existing strong position in rural areas
• Cross-selling to existing customers
• Target to be number 1 or 2 in selected market segments
15

Large
corporate 5 %
SME
38 % Private
individuals 57 %
Latvia: Second largest financial institution for private individuals
Lending volumes in Latvia by segment 1Q 2011 EUR 2 228 million
16
Market share in Latvia DnB NORD 2002-2010
Definintion large corporate > EUR 50 mill turnover

Latvia: Customer satisfaction increased
17
71.2
74.9
69.8
76.8
B2B B2C
DnB NORD Industry average
Customer survey index for Latvian banking sector 20101
1) EPSI research 2010 2) Mystery shopping, Dorus Ltd, 2010- 2011
0 1 2 3 4
Bank 4
Bank 3
Bank 2
Bank 1
DnB NORD
2011 2010
Mystery shopping ranking in Latvia2 (Top 5 banks, 2010–2011)

Latvia: Increase quality of income
• Capitalise on position as the second largest bank for private individuals
• Focus on cost-efficient operations
• More emphasis on non-lending income
• Competence programme to enhance sales skills
18

Large
corporate 10 %
SME
43 %
Private
individuals 15 %
Leasing
32 %
Estonia: A strong platform for leasing
Lending volumes in Estonia by segment Q1 2011 EUR 372 million
19
Market share DnB NORD 2010
Definintion large corporate > EUR 50 mill turnover

Estonia: Set to grow
• Niche player challenging a consolidated market
• Utilisation of the Group's industry competence
• Increase income from cross-border banking primarily from the Nordic client base
• Re-entry into retail banking to be evaluated
20

Raising the bar in the Baltics
Pick-up in GDP growth
Increased cross-sales and quality of income
Lower write-downs
21
Evaluate organic and structural growth

141


Untapped opportunities
Strong platform
Robust strategy
• Strong track record • Unique distribution power and customer base • Proven industry strategy
• A balanced portfolio • Norway: Four largest cities and selected segments • International: industry strategy • Strengthening position in the Baltics and optimize
integration
• Urbanization and population growth • Increased demand for shipping, energy and
seafood driven by emerging markets growth • Pick up in GDP growth in the Baltics
Well positioned for profitable growth

Financial ambitions towards 2015
Return on equity above 14 per cent
NOK 30 billion in pre-tax operating profits before write-downs
Cost/income ratio below 45 per cent

145