Embed Size (px)
Citation preview
SEPARATION OF HYDROCHLORIC ACID AND GLUCOSE USING ELECTRODIALYSIS
by
NURHASLINA BINTI CHE RADZI
Thesis submitted in fulfillment of the requirements for the degree of
Master of Science
UNIVERSITI SAINS MALAYSIA
2007
ii
ACKNOWLEDGEMENTS
I am thankful to The Great Almighty Allah; for the strength, guidance and bless
until I accomplished my studies. Here I would like to express my genuine gratitude and
appreciation to everyone for their endless support, assistance and help throughout my
research.
I would like to thank my major advisor, Professor Dr. Abdul Latif Ahmad for his
assistance, advice and guidance, during my Master study and thesis research. I would
especially like to thank him for the opportunity he provided for me to continue the
pursuit of my goals, and his patience and hard work during my studies and research. I
would like to thank Dr Norashid Aziz, as my co-supervisor, for his suggestions and
assistance throughout my research. Without this assistance it would have been very
difficult for my membrane separation apparatus to be set-up. I enjoyed working on my
membrane separation project; it gave me a sense of pride when it was completed and
working. Not forgetting to thank my ex-supervisor, Associate Professor Dr. Ghasem
Najafpour, who believe much in my capability and help me a lot at the early stage of my
research.
I would like to express my sincere gratitude to my beloved parents Mr. Hj. Che
Radzi Hj Abdul Hamid and Mrs. Hjh. Zainub and also to my sibling (Muhammad
Firdaus, Muhammad Helmi, Muhammad Hafiz and NurFatin Syahirah) for their endless
love, support and blessing. For being there for me through everything that happened to
me, to help me through the hard times and the good. Not forgotten to Ahmad Yusrizal
and Aizwan Anuar. Thank you very much and I always love all of you.
My best regards to Universiti Sains Malaysia for giving me financial support by
granting the Graduate Assistance scholarship. My appreciation also goes to MOSTI for
iii
funding this research through IRPA R&D grant and FELDA grant. Sincere thanks to all
the technicians (Mr Roqib, Mrs Latifah, Ms Wani and etc) and staffs (Ms. Dilla, Mrs.
Aniza, Mrs Mariam etc) of School of Chemical Engineering and also in main campus for
their cooperation, kindness and warmest helping hand.
A special appreciation to all my beloved friends especially to Zalina,
NorFaeqah, Hairul Nazirah, Lau, Sunarti, Airenne, Zarina, Anis, Zulfakar and Yasmin
and also to my housemates and couples of friends that I am not able to list down here
for their unparalleled help, kindness and moral supports towards me. Thank you my
friends for always being there for me. To those who are indirectly involved in this
research, thank you a lot and your contribution shall not be forgotten. Thank you.
iv
TABLE OF CONTENTS
Page ACKNOWLEDGEMENTS ii
TABLE OF CONTENTS iv
LIST OF TABLES ix
LIST OF FIGURES x
LIST OF SYMBOLS xiv
LIST OF ABBREVIATION xvi
ABSTRAK xvii
ABSTRACT xviii
CHAPTER 1 – INTRODUCTION
1.1 Research background
1.1.1 Membrane technology 1
1.1.2 Membrane potential and its current status 2
1.2 Problem statement 3
1.3 Objectives of the research 8
1.4 Scopes of the study 9
1.5 Organization on the thesis
9
CHAPTER 2 – LITERATURE REVIEW
2.1 Membrane definition 11
2.1.1 Types of membranes 13
2.1.2 Structure of ion exchange membrane 16
2.1.3 Requirements for electrodialysis membrane 17
2.2 Electrodialysis 23
2.2.1 Definition 23
2.2.2 Potential of Electrodialysis in a separation technology 26
2.3 Principle of electrodialysis 30
2.3.1 The electrodialysis stack 32
v
2.3.2 Electrodialysis in recycle batch modes 35
2.3.3 Electrodialysis reversal (EDR) 36
2.4 Parameters affecting the electrodialysis performance 38
2.4.1 Concentration of feed solution 38
2.4.2 Current applied 38
2.4.3 Flow velocities 38
2.4.4 Voltage requirements 39
2.4.5 Stack resistance 39
2.4.6 Resistance solution measurement 41
2.4.7 Water transport 41
2.5 Key performance indicators 42
2.5.1 Current efficiency 42
2.5.2 Flux or mass transfer 44
2.5.3 Product recovery percentage 45
2.5.4 Energy consumption 45
2.6 Design of Experiment (DoE) 46
2.6.1 Response surface methodology (RSM) 47
2.6.2 Central composite design (CCD) 50
CHAPTER 3 – METHODOLOGY
3.1 Material and chemical used 52
3.2 Batch recirculation mode at constant applied voltage 53
3.3 Structure of an electrodialysis unit 58
3.4 Flowchart of the overall experimental works 58
3.4.1 Membrane selection 60
3.4.2 Preparation of solution 60
3.4.1(a) Preparation of feed solution 60
3.4.2(b) Preparation of DNS reagent 61
3.4.3 Leakage test 61 3.4.4 Resistance solution measurement 62
3.4.5 Preliminary study 63
vi
3.4.5(a) Operating parameters 63
3.4.5(b) Experimental variables 63
3.5 Experimental design : Optimization of acid and glucose separation process using design of experiment (DoE)
66
3.5.1 Response surface methodology (RSM) and Central composite design (CCD)
66
3.6 Clean-In-Place (C.I.P) instruction 68
3.7 Assembling and dismantling procedures 69
3.7.1 Dismantling 69
3.7.2 Assembling 69
3.8 Safety precaution 70
3.9 Analytical method 71
3.9.1 Measurement of acid hydrochloric concentration using titration method
71
3.9.2 Measurement of glucose concentration 71
CHAPTER 4: RESULTS AND DISCUSSION
4.1 Process in ED compartment 75
4.2 Electrical resistance 76
4.2.1 Electrical resistance for solution 76
4.3 Characteristic study of ED system 77
4.3.1 Effect of initial concentration of hydrochloric acid in the feed stream on ED performance (TEST A)
77
4.3.1(a) Effect of initial feed concentration of hydrochloric acid in the feed stream on duration time to complete separation
77
4.3.1(b) Effect of initial feed concentration of hydrochloric acid in the feed stream on recovery percentage
81
4.3.1(c) Effect of initial feed concentration of hydrochloric acid in the feed stream on product stream
82
4.3.1(d) Effect of initial concentration of hydrochloric acid in the feed stream on product flux
84
4.3.1(e) Effect of initial concentration of hydrochloric acid in the feed stream on current efficiency
85
vii
4.3.1(f) Effect of initial concentration of hydrochloric acid in feed stream on energy consumption
87
4.3.2 Effect of initial concentration of hydrochloric acid in product stream on ED performance (TEST B)
88
4.3.2(a) Effect of initial concentration of hydrochloric acid in product stream on time duration to complete separation
88
4.3.2(b) Effect of initial concentration of hydrochloric acid in the product stream on average flux
89
4.3.2(c) Effect of initial concentration of hydrochloric acid in the product stream on current efficiency
90
4.3.3 Effect of voltage supplied on ED performance (TEST C) 91 4.3.3(a) Effect of voltage supplied on duration time to
complete separation
92
4.3.3(b) Effect of voltage supplied on current (A) and time to complete separation
93
4.3.3(c) Effect of supplied voltage on energy consumption 94 4.3.4 Effect of feed flow rate on ED performance (TEST D) 95
4.3.4(a) Effect of feed flow rate on recovery percentage of hydrochloric
95
4.3.4(b) Effect of feed flow rate on average flux 96 4.3.4(c) Effect of feed flow rate on current efficiency 97 4.4 SECTION B: Optimization of acid-glucose separation process
using design of experiment (DoE)
98
4.4.1 Regression models 100 4.4.2 Adequacy of the model 105 4.4.3 Effects of process variables
110
CHAPTER 5: CONCLUSION AND RECOMMENDATIONS
5.1 Conclusions 114
5.2 Recommendations
116
REFERENCES 117
viii
APPENDICES
APPENDIX A [Calibration curves] 123
APPENDIX B [Sample of calculation] 125
LIST OF SEMINARS AND AWARDS 129
ix
LIST OF TABLES Page
Table 2.1 Potential applications of novel ion exchange membrane-
based process, their state of development and possible advantages and experienced problems (Xu ,2005)
18
Table 2.2 Properties of ion-exchange membranes
21
Table 2.3: Main properties of some commercially available homogeneous ion exchange membranes (Xu, 2005)
22
Table 3.1 List of chemicals
53
Table 3.2 Process variables for Test A
65
Table 3.3 Process variables for Test B
65
Table 3.4 Process variables for Test C
65
Table 3.5 Process variables for Test D
66
Table 3.6 Experimental factors and their levels
68
Table 3.7 Dilution ratio between stock and distilled water
72
Table 4.1 Electrical resistance of solutions at different concentration
76
Table 4.2 Duration time to complete the process run for five different initial feed concentration
80
Table 4.3 Process parameters and their levels
99
Table 4.4 Experimental factors and responses
100
Table 4.5 Model and coded factor
101
Table 4.6 Analysis of variance (ANOVA) for energy consumption
105
Table 4.7 Analysis of variance (ANOVA) for recovery percentage
106
Table 4.8 Analysis of variance (ANOVA) for average flux
107
Table 4.9 Comparison between experimental (actual) and predicted values for response of energy consumption (kWh) , recovery percentage (%) and average flux (kmol/m2.s)
108
Table 4.10 Optimum condition for a solutions
112
x
LIST OF FIGURES Page
Figure 2.1 Schematic drawing illustrating a membrane separation
process (Beerlage, 1994)
12
Figure 2.2 Types of separation processes and their applications (Cheryan, 1998)
12
Figure 2.3 The two types of (mono polar) electrodialysis membranes. a:cation exchange membrane b:anion-exchange membrane (Batchelder, 1986)
14
Figure 2.4 Time line of ion exchange membrane development and their related processes (Xu, 2005)
16
Figure 2.5 Ion exchange membrane structure (Savitri, 2000)
17
Figure 2.6 Electrotechnologies (Marcotte et al., 2003)
24
Figure 2.7 Electrodialysis process with series at cationic and anionmembranes in series (Perry & Green, 1998)
33
Figure 2.8 The salt concentration profile(Perry & Green, 1998)
34
Figure 2.9 Schematic drawing illustrating the removal of deposited negatively charged colloidal components from the surface of an anion-exchange membrane (aem) by reversing the electric field (Yeon et al., 2007)
37
Figure 2.10 Electrodialysis scheme a: before polarity reversal and b: after polarity reversal (Morantes, 2004)
37
Figure 2.11 Resistance elements in an electrodialysis system: A-Anion permeable membrane; C-Cation Permeable Membrane; f-feed; P-Product; c-Concentrate (Morantes, 2004)
40
Figure 2.12 Central composite model (Cho and Zoh, 2006)
51
Figure 3.1 Schematic diagram for experimental set-up
54
Figure 3.2 Experimental set-up
55
Figure 3.3 Electrodialysis stack, power supply and peristaltic pump
55
Figure 3.4 Structure of electrodialysis unit
56
Figure 3.5 Flowchart of the overall experimental
59
Figure 3.6 Electrodialysis stack part
70
Figure 4.1 Schematic representation of ED cell and the process take place
76
xi
Figure 4.2 Initial concentration of HCl in feed stream vs Time. Experimental conditions; 0.1 M of initial concentration HCl in product stream, 22 V and 1.81 mL/s of feed flow rate
79
Figure 4.3 Initial feed concentration of hydrochloric acid in feed stream vs time. Experimental conditions; 0.1 M of initial concentration HCl in product stream, 22 V and 1.81 mL/s of feed flow rate
79
Figure 4.4 Recovery percentage vs initial concentration of hydrochloric acid in feed stream. Experimental conditions; 0.1 M of initial concentration HCl in product stream, 22 V and 1.81 mL/s of feed flow rate
81
Figure 4.5 Concentration of hydrochloric acid in product stream at different feed concentration, constant voltage (22 V) and flow rate (1.81 mL/s)
82
Figure 4.6 Volume of HCl in feed and product stream and glucose concentration vs time. Experimental conditions; 0.1 M of initial concentration HCl in product stream, 22 V and 1.81 mL/s of feed flow rate
83
Figure 4.7 Relationship between the average flux and initial concentration of HCl in feed stream. Experimental conditions; 0.1 M of initial concentration HCl in product stream, 22 V and 1.81 mL/s feed flow rate
84
Figure 4.8 Current efficiency vs concentration of hydrochloric acid in feed stream. Experimental conditions; 0.1 M of initial concentration HCl in product stream, 22 V and 1.81 mL/s of feed flow rate
86
Figure 4.9 Energy consumption vs initial concentration of hydrochloric acid in feed concentration. Experimental conditions; 0.1 M of initial concentration HCl in product stream, 22 V and 1.81 mL/s of feed flow rate
88
Figure 4.10 Time duration to complete separation vs initial concentration of hydrochloric acid in product stream. Experimental conditions; 0.1 M of initial concentration HCl in feed stream, 22 V and 1.81 mL/s of feed flow rate
89
Figure 4.11 Average flux vs initial concentration of HCl in the product stream. Experimental conditions; 0.1 M of initial concentration HCl in feed stream, 22 V and 1.81 mL/s of feed flow rate
90
Figure 4.12 Current efficiency vs Initial concentration of HCl in product stream. Experimental conditions; 0.1 M of initial concentration HCl in feed stream, 22 V and 1.81 mL/s of feed flow rate
91
xii
Figure 4.13 Concentration of HCl in feed stream vs time consumed to complete separation at different voltage. Experimental conditions; 0.1 M of initial concentration HCl in product and feed stream,1.81 mL/s of feed flow rate
93
Figure 4.14 Effect of the applied voltage on the variation of the current with time.Experimental conditions; 0.1 M of initial concentration HCl in product and feed stream, 1.81 mL/s of feed flow rate
94
Figure 4.15 Energy consumption (kW.h) vs Voltage supplied (V). Experimental conditions; 0.1 M of initial concentration HCl in product and feed stream, 1.81 mL/s of feed flow rate
95
Figure 4.16 Recovery percentage vs initial feed flow rate. Experimental conditions; 24 V and 0.1 M of initial concentration HCl in product and feed stream
96
Figure 4.17 Relationship between the average flux and feed flow rate. Experimental conditions; 24 V and 0.1 M of initial concentration HCl in product and feed stream
97
Figure 4.18 Current efficiency at different feed flow rate. Experimental conditions; 24 V and 0.1 M of initial concentration HCl in product and feed stream
98
Figure 4.19 Predicted vs. actual data for energy consumption (kW.h) 102
Figure 4.20 Predicted vs. actual data for recovery percentage of hydrochloric acid
103
Figure 4.21 Predicted vs. actual data for average flux of hydrochloric acid
103
Figure 4.22 Response surface plot and contour plot on voltage supplied and feed flow rate for energy consumption. Experimental conditions; 0.1M of initial concentration HCl in product and feed stream and 125 minute of sampling time
110
Figure 4.23 Effect of voltage and feed flow rate on recovery percentage of HCl; 3D surface graph and contour plot. Experimental conditions; 0.1M of initial concentration HCl in product and feed stream and 125 minute of sampling time
110
Figure 4.24 Effect of voltage and feed flow rate on average flux; 3D surface graph and contour plot. Experimental conditions; 0.1M of initial concentration HCl in product and feed stream and 125 minute of sampling time
111
Figure 4.25 Effect of voltage and feed flow rate on average flux; 3D surface graph and contour plot
114
Figure A1 Glucose calibration curve by DNS method
122
xiii
Figure A2 Pump calibration curve
122
Figure A3 Neutralization curve using titration method 123
xiv
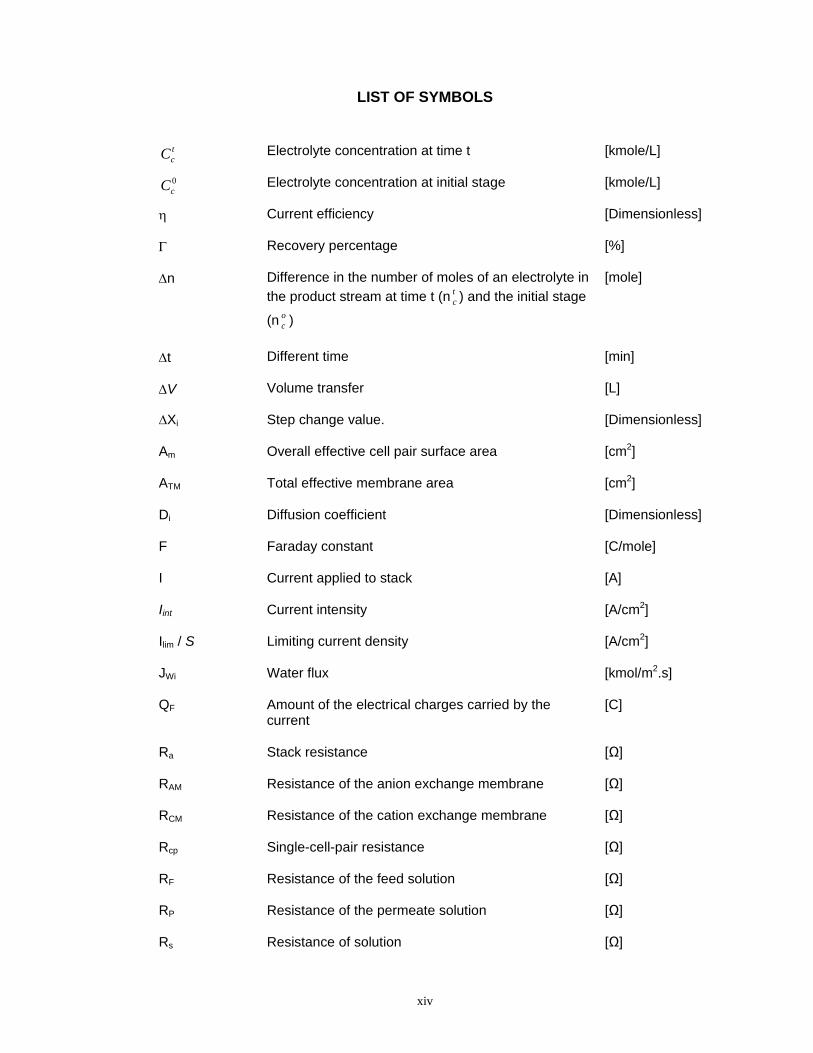
LIST OF SYMBOLS
tcC Electrolyte concentration at time t
[kmole/L]
0cC Electrolyte concentration at initial stage
[kmole/L]
η Current efficiency [Dimensionless]
Γ Recovery percentage
[%]
∆n Difference in the number of moles of an electrolyte in the product stream at time t (n t
c ) and the initial stage
(n oc )
[mole]
∆t Different time [min]
∆V Volume transfer [L]
∆Xi Step change value.
[Dimensionless]
Am Overall effective cell pair surface area [cm2]
ATM Total effective membrane area
[cm2]
Di Diffusion coefficient [Dimensionless]
F Faraday constant
[C/mole]
I Current applied to stack [A]
Iint Current intensity [A/cm2]
Ilim / S Limiting current density [A/cm2]
JWi Water flux [kmol/m2.s]
QF Amount of the electrical charges carried by the current
[C]
Ra Stack resistance [Ω]
RAM Resistance of the anion exchange membrane [Ω]
RCM Resistance of the cation exchange membrane [Ω]
Rcp Single-cell-pair resistance [Ω]
RF Resistance of the feed solution [Ω]
RP Resistance of the permeate solution [Ω]
Rs Resistance of solution [Ω]
xv
V Voltage [V]
Xi The natural value of the ith independent variable.
[Dimensionless]
xi The coded value of the ith independent variable [Dimensionless]
Xix The natural value of the ith independent variable
at the center point.
[Dimensionless]
Y The predicted response.
[Dimensionless]
∆C Concentration gradient [mole/L]
∆E Electrical potential gradient [V]
∆P Pressure gradient [N/m2]
∆T Temperature gradient [K]
xvi
LIST OF ABBREVIATIONS
AEM Anion exchange membrane
CCD Central composite design
CEM Cation exchange membrane
CIP Cleaning-in- place
CV Constant voltage
DC Direct current
DoE Design of experiment
DVB Divinyl benzene
ED Electrodialysis
EDI Electrodialysis ionization
EDR Electrodialysis reversal
EED Electro-electrodialysis
EIC Ion exchange capacity
ES Electrochemical series
HCl Hydrochloric acid
PVC Polyvinyl chloride
RSM Response surface methodology
UF Ultrafiltration
(CH3)3N Triamine
SO2Cl Sulfochlorination
UF Ultrafiltration
RO Reverse osmosis
MW Molecular weight
xvii
PEMISAHAN ASID HIDROKLORIK DAN GLUKOSA MENGGUNAKAN ELEKTRODIALISIS
ABSTRAK
Elektrodialisis (ED) merupakan kaedah yang berpotensi untuk pemisahan dan
pemekatan asid hidroklorik manakala glukosa yang tidak bertindakbalas diguna
semula. Dua bahagian eksperimen dijalankan; bahagian A dan bahagian B.
Eksperimen bahagian A dijalankan menggunakan campuran asid hidroklorik dan
glukosa dengan kepekatan asid hidroklorik yang berlainan di dalam aliran suapan dan
produk; voltan yang dialirkan dan kadar aliran suapan menggunakan membran
pertukaran anion (PC Acid 60) dan membran pertukaran kation (PC-SK) dalam mod
kelompok. Parameter utama yang menentukan keupayaan proses adalah jangka masa
pemisahan lengkap, paras maksimum perolehan semula asid, fluk purata produk,
kecekapan arus dan penggunaan tenaga.
Eksperimen bahagian B, dijalankan berdasarkan parameter yang dipilih
daripada bahagian A, iaitu kepekatan asid hidroklorik di dalam aliran suapan, voltan
yang dialirkan dan kadar aliran suapan, di bawah parameter tetap iaitu kepekatan asid
hidroklorik (0.1M) di dalam aliran produk dan kepekatan glukosa (5g/L) di dalam aliran
masuk. Ini dilakukan menggunakan rekabentuk ujikaji (DoE). Rekabentuk ujikaji
gabungan pusat (CCD) dan metodologi permukaan sambutan (RSM) telah digunakan
untuk mendapatkan nilai parameter yang optimum.
Kesimpulannya dibawah nilai optimum (0.1M HCl di dalam aliran suapan dan
produk, 1.47 mL/s kadar aliran suapan, voltan yang dialirkan sebanyak 21.21V dan
masa pensampelan 100 min), keputusan terbaik bagi penggunaan tenaga, peratusan
perolehan semula dan fluk purata produk ialah 37.93 kW.h, 97.4% dan 5.3 kmol/m2.s.
xviii
SEPARATION OF HYDROCHLORIC ACID AND GLUCOSE USING ELETRODIALYSIS
ABSTRACT
Electrodialysis (ED) is a method that shows a good potential to separate and
concentrate hydrochloric acid while unreacted glucose are partially recycled. Two
sections of experiment had been done; section A and section B. Section A of the
experiment was carried out using hydrochloric acid and glucose mixture with different
concentration of hydrochloric acid in feed and product stream; voltage supplied and
feed flow rate using anion-exchange membrane (PC Acid 60) and cation-exchange
membrane (PC-SK) in batch mode. The main parameters which quantify the
performance of the process are the duration of completing the separation, the
maximum recovery level of the acid, the average product flux, the current efficiency and
the energy consumption.
Section B of the experiment was done based on chosen effects from section A,
which were the concentration of hydrochloric acid in feed stream, the voltage supplied
and the feed flow rate, under constant parameters of concentration hydrochloric acid
(0.1M) in product stream and glucose concentration (5 g/l) in feed stream. This had
been done using design of experiment (DoE). A central composite design (CCD) and
response surface methodology (RSM) were used to obtain the optimum values of the
parameters.
It can be conclude that under optimum conditions (0.1M HCl in feed and product
stream, 1.47 mL/s of feed flow rate,voltage supplied of 21.21V and sampling time of
100 min), the best results of energy consumption, recovery percentage and average
flux were 37.93kW.h, 97.4% and 5.3kmol/m2.s.
1
CHAPTER ONE
INTRODUCTION
1.1 Research background
1.1.1 Membrane technology
Nowadays “membrane” has been extended to describe a thin flexible sheet or
film, acting as a selective boundary between two phases because of its semi
permeable properties. Membrane exists in solid and liquid. It functions as a separation
agent that is very selective based on the difference of diffusivity coefficient, electric
current or solubility. The membrane can be defined essentially as a barrier, which
separates two phases and restrict transport of various chemicals in a selective manner
(Wenten, 2002).
Membrane technology began in 1960. Aided substantially by several key
technical breakthroughs, membrane processes had come to compete favorably with
more established technologies in such areas such as water desalting, water purification
and gas separation. Several new membrane based industries have been established,
and membrane research and development (R&D) is now being intensely pursued in the
principal industrial countries (Torrey, 1984).
Membrane separations commonly used for water purification or other liquid
processing. The driving force of the separation depends on the type of the membrane
separation. Pressure-driven membrane filtration, also known as membrane filtration,
included microfiltration, ultrafiltration, nanofiltration and reverse osmosis, and used
pressure as a driving force, whereas the electrical driving force is used in
electrodialysis (ED) and electrodeionization. Historically, membrane separation
processes or systems were not considered cost effective for water treatment due to the
adverse impacts that membrane scaling, membrane fouling, membrane degradation
2
and the efficiency of removing solutes from aqueous water streams. Advancements in
technology have now made membrane separation a more commercially viable
technology for treating aqueous feed streams suitable for use in industrial processes
(Zeiher et al., 2005).
ED is an electrochemical membrane separation technique for ionic solutions
that has been used in industry for several decades. It can be used in the separation
and concentration of salts, acids, and bases from aqueous solutions, the separation of
monovalent ions from multivalent ions, and the separation of ionic compounds from
uncharged molecules. It can be used for either electrolyte reduction in feed streams or
recovery of ions from dilute streams. Industrial applications encompass several
industries and include the production of potable water from brackish water, removal of
metals from wastewater, demineralization of whey, deacidification of fruit juices, and
the removal of organic acids from fermentation broth (Farrell et al., 2003). ED
separation using of ion-exchange membranes was different from those involving
ultrafiltration (UF) and reverse osmosis (RO) membranes: UF membranes permit
electrolyte and low molecular weight (MW) organic solutes to pass through; while RO
membranes reject all components apart from pure water (Koide et al., 2004).
1.1.2 Membrane potential and its current status
Probably the leading concern for chemical engineers when evaluating a novel
process was the process cost relative to alternative processes performing the same
task. While there were a few examples in which the economics of the process have
been reported. ED is reported to have superior economics compared to the existing
technology, depending on the specific application (Chukwu et al., 1999; Lindheimer et
al., 1993; Onuki et al., 2000).
3
The ion exchange membrane has been applied in ED. During the last 50 years,
ion exchange membranes have evolved from a laboratory tool to industrial products
with significant technical and commercial impact. Today ion exchange membranes
were successfully applied for desalination of sea and brackish water and for treated
industrial effluents. They are efficiently used for the concentration or separation of food
and pharmaceutical products containing ionic species as well as the manufacture of
basic chemical products. The evolvement of an ion exchange membrane does not only
make the process cleaner and more energy-efficient but also recovers useful effluents
that were now going to wastes (Xu, 2005).
However, the use of electrodialysis in purification and reconcentration of spent
acid has been limited by the deficiencies of commercial membranes: they suffered from
an important proton leakage through the anion exchange membrane (AEM). This
limited the concentration capacity and a poor selectivity of the cation exchange
membrane (CEM), which affected the proton/bivalent cation separation. In recent
years, new AEM’s with lower proton leakage have appeared on the market. These
membranes are necessary in order to improve the performance of the electrodialysis
process for spent acid recovery (Boucher et al., 1997). Therefore, the choice of
membrane type will play an important role in this study.
1.2 Problem statement
From the viewpoints of both environmental protection and economy, the usage
of waste can reduce the pollution (Blackburn, 1999). Waste acid solutions are among
the most troublesome waste products produced by a manufacturing process and one of
the most expensive to dispose of. One of the examples takes place in palm oil industry.
In order to produce ethanol from palm solid wastes, the acid hydrolysis process is
needed at the first place. However, the glucose produced had to separate from
hydrochloric acid because the bacteria used in fermentation process could not life
4
longer in acidic media. After the separation and recovery of the concentrated
hydrochloric acid, the sugars are suitable for further refinement and processing.
Recognized the cost of acid and chemicals for neutralized the acid, the study of
separation acid from the hydrolysis mixture have been investigated by many
researchers (Forster et. al, 1980; Boeteng, 1991). Although the most frequently
employed technique for the disposal of spent acid residues was the neutralization-
precipitation-discharge sequence, this practice was increasingly being questioned
because of the environmental consequences related to the stocking of toxic solid waste
(Boeteng, 1991). Other methods used were crystallization, solvent extraction and
membrane technology. The disadvantages of crystallization method were due to the
low yield; high chemical costs and waste production. While, solvent extraction is energy
intensive, leads to problems of toxic waste disposal, and gives a product that requires
further purification. Thus, new extraction technologies need to be established for
enhancing recovery yields and reducing cost and environmental impact (Yao et al.,
1994).
The modularity and profitability of membrane technology in a small scale which
offered by the third process is a well suites technique to the treatment of the pollution.
The principal advantages of membrane processes compared to other separation
processes are low energy consumption, simplicity and environmental friendliness
(Wenten, 2002). The technology and innovation of membrane separation is rapidly
growth. As a result, many different membrane separation processes have been
developed and new processes are constantly emerging, which includes, besides other
techniques, microfiltration, reverse osmosis and electrodialysis (ED). The use of ED, on
the treatment of solutions containing complexes, has shown that this technique is
effective not only to ions concentration but also to their separation (Rodrigues et al.,
2006).
5
ED was a feasible method for separation of acid from glucose. Removal (and
recycling) of this acid from the products requires a separation process for which a
membrane process (electrodialysis) has been proposed. Differ from other membrane
separation processes such as ultrafiltration and reverse osmosis; ED process
separates ions in aqueous solutions by exploiting the difference in electrical charges
between them, instead of particle size. Therefore, ED can separate not only cations
from anions, but also ions with the same charge but different valences, which are
termed of permselectivity. The permselectivity is closely correlated to the characteristic
of the ion exchange membranes and plays a very important role in the ED process,
although other parameters, such as ion charge and mobility, solution conductivity,
relative concentrations, and applied voltage also influenced the efficiency of the
process. Therefore, there was great significance in using high-permselectivity ion
exchange membranes in ED processes (Peng et al., 2003).
ED was a technology that is well-suited for pollution prevention exploitation. It
had the capability of separated ionic chemicals from nonionic chemicals in process or
waste streams to achieve product purity or eliminate wastes, concentrated the
separated chemicals relative to concentration in the initial process or waste streams to
aid in reuse of the chemicals and being used as a reactor, both electrolytic and
otherwise, to convert chemicals at high efficiencies to more desirable products. This
technology did not required chemicals and was simple to operate. It adapted to no-
continuous feed supplied and different load. Besides, it was not very dependent on
temperature (Blackburn, 1999). The product could be concentrated up to a certain
amount together with the separation process (Thang et al., 2005). Further, ED had the
capability to meet these function simultaneously in a single equipment assembly. It
accomplished these tasks with low levels of pollution generation and high energy
efficiencies relative to current technologies (Mohammadi et al., 2005).
6
In spite of the advantages of ED, there were some problems can limit the
efficiencies and operation of separation technologies using electrodialysis. The first
problem is regarding the fouling which is become the most important limitations in ED
processes. The fouling build-up can reduce the performance of the ED process by
increasing the resistance and can eventually lead to membrane integrity alteration.
Under certain conditions, fouling and integrity alterations are irreversible and
membranes must be replaced. Researches on avoiding or preventing fouling are study
in order to reduce the cost of cleaning and membrane replacement which is extremely
expensive. Fouling is essentially caused by deposition of foulants on the membrane
surfaces such as organics, minerals, colloids, biomass and particles causing
deterioration in the membrane performance, in terms of flux decline and increase in the
electrical resistance. Besides, the fouling sometimes causes a loss in selectivity of the
membrane. If the fouling is irreversible, the membranes must be changed frequently,
adding to the increased energy cost caused by fouling (Morantes, 2004).
Second problem involved the concentrations of solutions which also affected
the membrane resistance. A marked increase in fouling was observed when
approaching the saturation concentration (Lindstrand et al., 2000). Membrane fouling
easily occurred on the anion exchange membrane more than the cation exchange
membrane. It was caused by the precipitation of colloids mostly on the anion selectivity
membrane because the colloids are usually charged negatively. Particularly, fouling in
the biological process was caused by organic compounds in the fermentation broth. In
order to minimize fouling, the selection of suitable membrane (Nikbakht et.al, 2007)
pre-treatment of foulants and optimization of operating condition, etc is needed (Kim
and Moon, 2001).
Another problem ; ideally, the separation of hydrochloric acid from the sugar by
electrodialysis should provide a maximum yield of recovered acid at maximum
7
concentration with minimum power consumption using minimum membrane area. Most
of experimental results made it obvious that these conditions cannot be met
simultaneously. At the highest current efficiencies and, thus, the minimum membrane
area, the final acid concentration in the concentration was too low. At the highest
concentration of acid, the percentage of acid transferred decreased, and power
consumption and membrane area increased (Goldstein, 1993).
In order to solve these problems, several studies been approached. In the case
of electrodialysis which is conducted to a solution containing organic substances as the
solution to be treated using an ion-exchange membrane, periodical membrane washing
is conducted with an alkaline solution for the purpose of removing fouling substances
stuck in the ion-exchange membrane in order to maintain a stable operation for a long
period (Aritomi et al., 1996). Many approaches have been examined to minimize
fouling during membrane processes. This includes pretreatment of feed solution,
turbulence in the compartment, optimization of process conditions and the modification
of the membrane properties. However, relevant cleaning-in- place (CIP) is still need in
practical processes although all the said methods can reduce fouling to some extent.
Consequently, several cleaning methods including hydraulic and chemical cleaning
methods have been use effectively. Consider to all the problems; the use of
electrodialysis reversal in this study which can avoid membrane fouling is implemented.
Beside that, a suitable membrane for the ED process can reduce the power
consumption and achieve a stable long-term operation without membrane fouling. In
general, the electrical resistance of ion-exchange membranes is one of the important
characteristics that determine the energy requirement and membrane area needed for
the ED process. A low electrical resistance membrane is required for the process to be
operated at low energy consumption (Kim et al., 2001). For that reason, the membrane
used in this study, is based on its low resistance and had been considered the
8
approach to obtain high efficiencies by electrodialysis in acid medium. Consider the
high permeability of acids through standard anion exchange membranes; PC Acid 60 is
used together with cation exchange membrane; PC SK, in this separation process.
To improve the ED stack, the electrodialysis reversal (EDR) had been used. It
can be enhanced by periodically reversing the polarity of the electrodes that reverse
the direction of ion movement within the membrane stack. The dilute stream becomes
the concentrate stream and vice versa. The reversal process is useful in breaking up
and flushing out scales, slime and other deposits in the cells before they could build up
and created a problem. EDR had an advantage with self-cleaning membranes, and the
ability to easily disassemble membrane stacks for hand cleaning (Lee et al., 2002).
1.3 Objectives of the research
The goals of this project are:
a) To determine the effects of hydrochloric acid concentration in feed and product
stream, the voltage supplied and feed flow rate on separation process
performance of acid-glucose solution.
b) To characterize an EDR by means of the determination the optimum working
condition with minimum energy consumption.
c) To optimize the separation of hydrochloric acid and glucose using response
surface methodology (RSM) followed with central composite (CCD) as
statistical design.
9
1.4 Scopes of the study
The aim of this study was to investigate the most favorable experimental
conditions to separate acid and glucose using electrodialysis. The research project was
divided into 2 main parts. The first part was deal with experimental to find the
characterization of electrodialysis. The second part involves optimization using DoE
(Design of Experiment).
The preliminary experiment has been done to evaluate the performance of the
ED. Several parameters that affected the electrodialysis performance such as initial
concentration of HCl in feed stream, initial concentration of HCl in product stream,
voltage supplied and feed flow rate were studied. The influence of the initial
concentration of HCl in feed and initial product stream manipulated were 0.1 M, 0.3 M,
0.5, 0.7 and 1.0 M. Different voltage varied from 18 V to 24 V at same initial
concentration of HCl feed stream and product was also studied. The pump was
calibrated by manual experiment by varied it to respective number (range 0-10). The
volume flow out was collected over time taken and the calibration curve is plotted as in
Figure A2 (Appendix A). To minimize the range, the feed flow rates were varied from
1.58 mL/s until 2.26 mL/s (respectively number 4-10). For the performances of the ED
system, three important indicators were examined, namely energy consumption,
product recovery percentage and average flux.
1.5 Organization on the thesis
This thesis has been organized into several chapters.
Chapter One introduces the alternative of membrane separation and their advantage
and disadvantages. The problem statement leads to the process study was then
discussed in the next section followed by the objective of the research study.
10
Chapter Two reviews the previous finding and fundamentals related to the previous
research. This chapter subdivided into 8 sections. The first section covers the entire
topic about membrane such as membrane definition, separation alternatives, type of
membrane and history of ion exchange membrane. The second sections cover the
whole focus on definition of electrodialysis, development and commercialization and
electrodialysis potential as a separator. The third section covers up all the principles,
process description, modes and stack of electrodialysis, requirements for
electrodialysis membrane and structure of ion membrane. The problem facing by
electrodialysis technology and their problem solving has been discussed in section
four. The next sections discussed on parameter affecting the electrodialysis
performance followed by the key performance indicators. Finally, literature survey on
the design of experiment (DoE) which is used to optimize the experiment is discussed.
Chapter Three presents materials and methods will be discussed thoroughly in order
to separate the mixture of acid and glucose. The first section show material and
chemical used followed by flow chart of the overall experimental works. Specification of
material and equipment were listed. Procedure to run the experiment was outlined
properly. All stages of experiment were summarized in flow chart.
Chapter Four presents all the result and followed by discussion. In this chapter, all
experiments were listed in table form and graph. All figures and graphs were discussed
analytically. The detail explanations of the results have been divided into section A and
section B. Section A focuses on process in electrodialysis compartment, electrical
resistance and characteristic study on electrodialysis system. Section B implements the
design of experiment (DoE). The regression models, adequacy and the effects of
process variable had been discussed through this section.
Chapter five finally gives the conclusions and recommendations of the thesis.
11
CHAPTER TWO
LITERATURE REVIEW
This chapter presents a review of the different separation methods; the
conventional treatment and possible technologies. Electrodialysis has a great potential
of becoming an excellent separation method for hydrochloric acid-glucose mixture,
which is chosen to be applied in this study. Finally, the design of experiment (DoE)
using response surface methodology (RSM) is presented at the end of this chapter.
2.1 Membrane definition
In the past few decades Membrane based separation has become one of the
emerging technologies. The word membrane comes from the Latin word; “membrana”
which means skin. Today’s word “membrane” has been extended to describe a thin
flexible sheet or film, acting as a selective boundary between two phases because of
its semi permeable properties. Membranes exist in solids and liquids. It functions as a
separation agent that is very selective based on the difference of diffusivity coefficient,
electric current or solubility (Wenten, 2002). The two phases separated by the
membrane, i.e., the feed and permeate; could be present in the liquid or in the gaseous
state. The driving force that was necessary for the transport was a transmembrane
pressure gradient (∆P), a concentration gradient (∆C), an electrical potential gradient
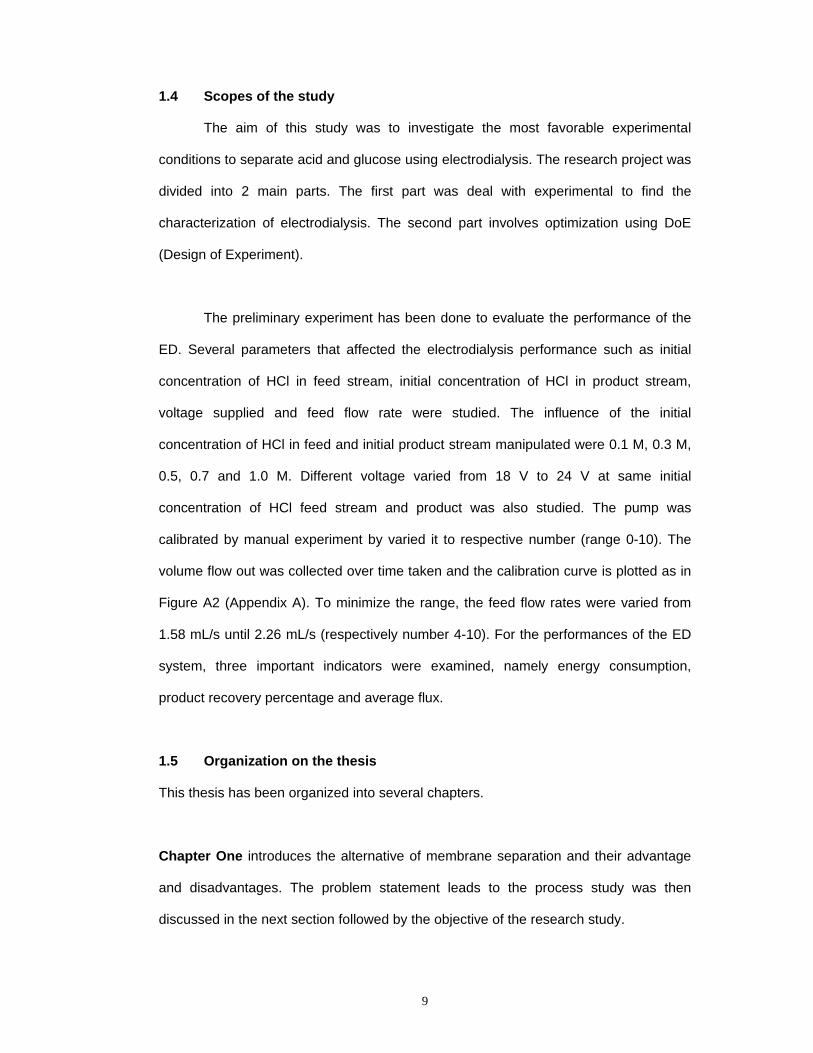
(∆E), or a temperature gradient (∆T) (Beerlage, 1994). A schematic drawing illustrated
a membrane separation process was given in Figure 2.1.
12
Driving force
Retained solute Membrane Permeated solute
Figure 2.1 Schematic drawing illustrating a membrane separation process (Beerlage, 1994)
The principal advantageous of membrane processes compared to other
separation processes are low energy consumption, simplicity and environmental
friendliness. Membrane-based separation is a result of different rates of transfer
between each substance in the membrane and not a result of phase equilibrium or
mechanically based separation. Therefore, there is no need to add additive materials
such as extractors and absorbers to precede the separation. We can then say that
membrane technology is “clean technology”, in which no additive materials are, needed
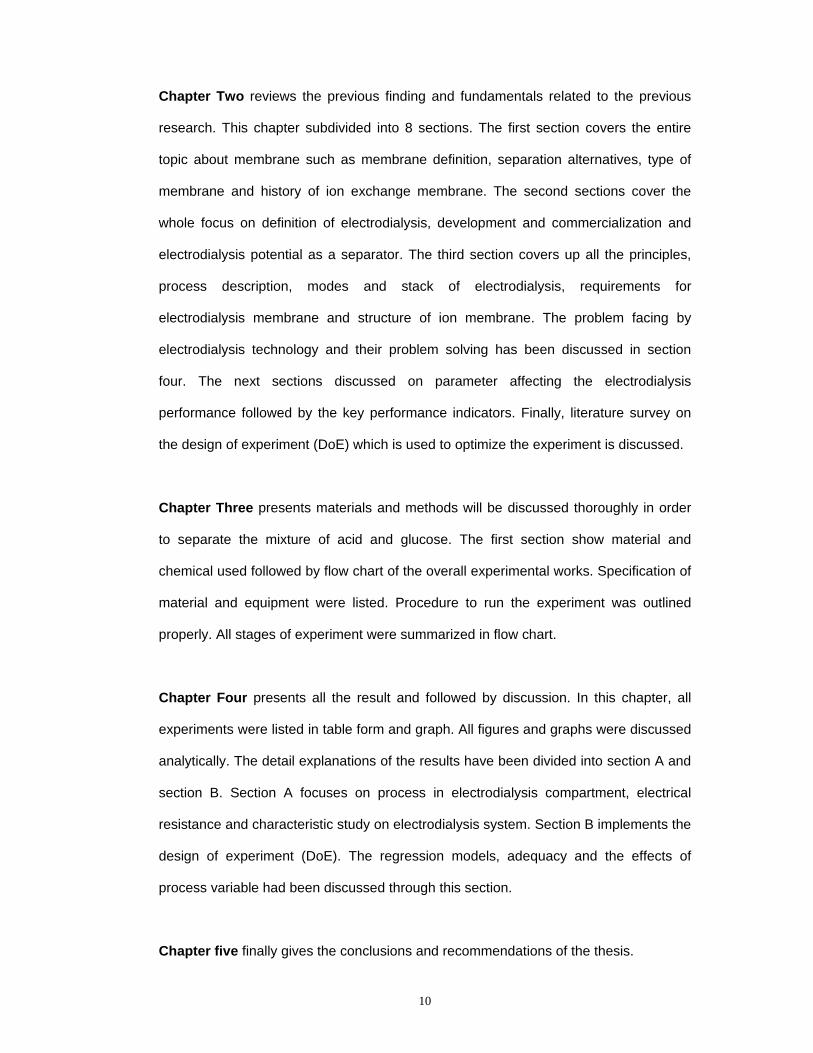
(Wenten, 2002). Figure 2.2 classifies membranes according to structure, production,
essential transport mechanism and areas of application.
Figure 2.2: Types of separation processes and their applications (Cheryan, 1998)
Feed Product
13
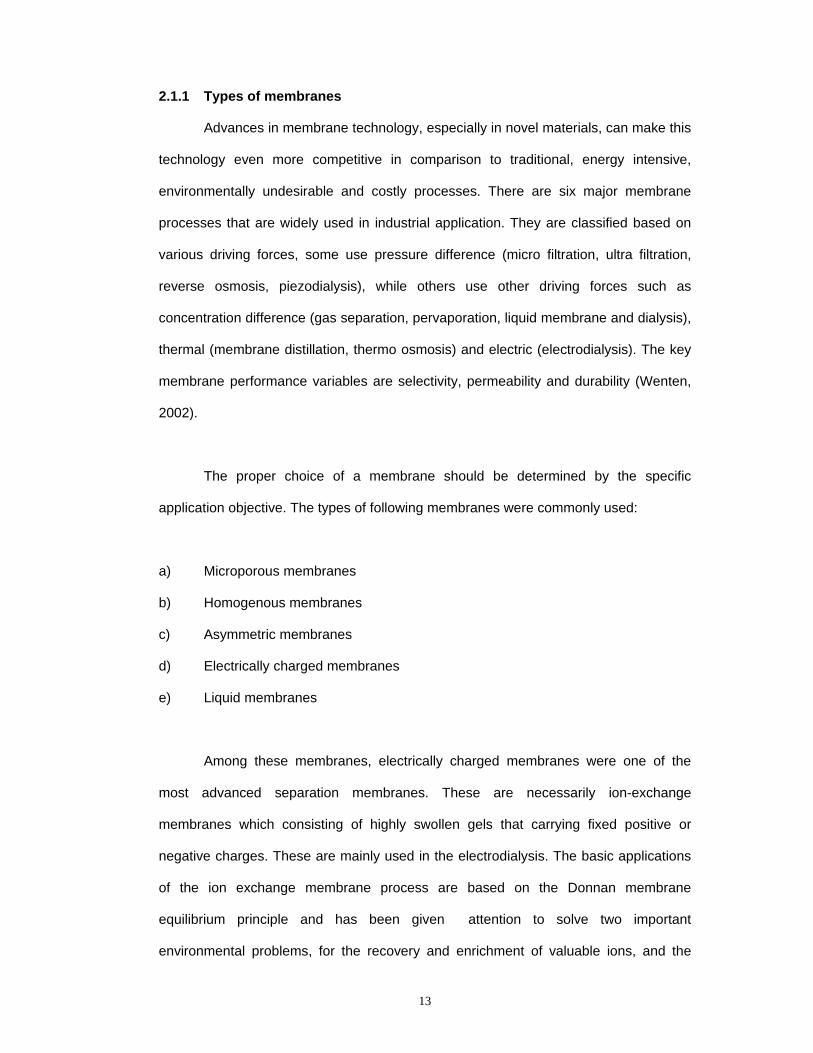
2.1.1 Types of membranes
Advances in membrane technology, especially in novel materials, can make this
technology even more competitive in comparison to traditional, energy intensive,
environmentally undesirable and costly processes. There are six major membrane
processes that are widely used in industrial application. They are classified based on
various driving forces, some use pressure difference (micro filtration, ultra filtration,
reverse osmosis, piezodialysis), while others use other driving forces such as
concentration difference (gas separation, pervaporation, liquid membrane and dialysis),
thermal (membrane distillation, thermo osmosis) and electric (electrodialysis). The key
membrane performance variables are selectivity, permeability and durability (Wenten,
2002).
The proper choice of a membrane should be determined by the specific
application objective. The types of following membranes were commonly used:
a) Microporous membranes
b) Homogenous membranes
c) Asymmetric membranes
d) Electrically charged membranes
e) Liquid membranes
Among these membranes, electrically charged membranes were one of the
most advanced separation membranes. These are necessarily ion-exchange
membranes which consisting of highly swollen gels that carrying fixed positive or
negative charges. These are mainly used in the electrodialysis. The basic applications
of the ion exchange membrane process are based on the Donnan membrane
equilibrium principle and has been given attention to solve two important
environmental problems, for the recovery and enrichment of valuable ions, and the
14
removal of undesirable ions from waste water, especially to extract toxic metal ions
from effluents (Nagarale, 2006).
Electrically charged membranes are used together with electrodialysis in the
separation of hydrochloric acid- glucose. Traditionally, ion exchange membranes are
classified into anion exchange membranes and cation exchange membranes
depending on the type of ionic groups attached to the membrane matrix. Cation
exchange membranes contain negatively charged groups (such as –SO3−, –COO−,
–PO32−,–PO3H−, –C6H4O−, etc.), fixed to the membrane backbone and allow the
passage of cations but reject anions. Anion exchange membranes contains positively
charged groups, such as –NH3+, –NRH2
+, –NR2H+, –NR3+, –PR3
+,–SR2+, etc., fixed to
the membrane backbone and allow the passage of anions but reject cations. According
to the connection way of charge groups to the matrix or their chemical structure, ion
exchange membranes can be further classified into homogenous and heterogeneous
membranes, in which the charged groups are chemically bonded to or physically mixed
with the membrane matrix, respectively. However, most of the practical ion exchange
membranes are rather homogenous and composed of either hydrocarbon or
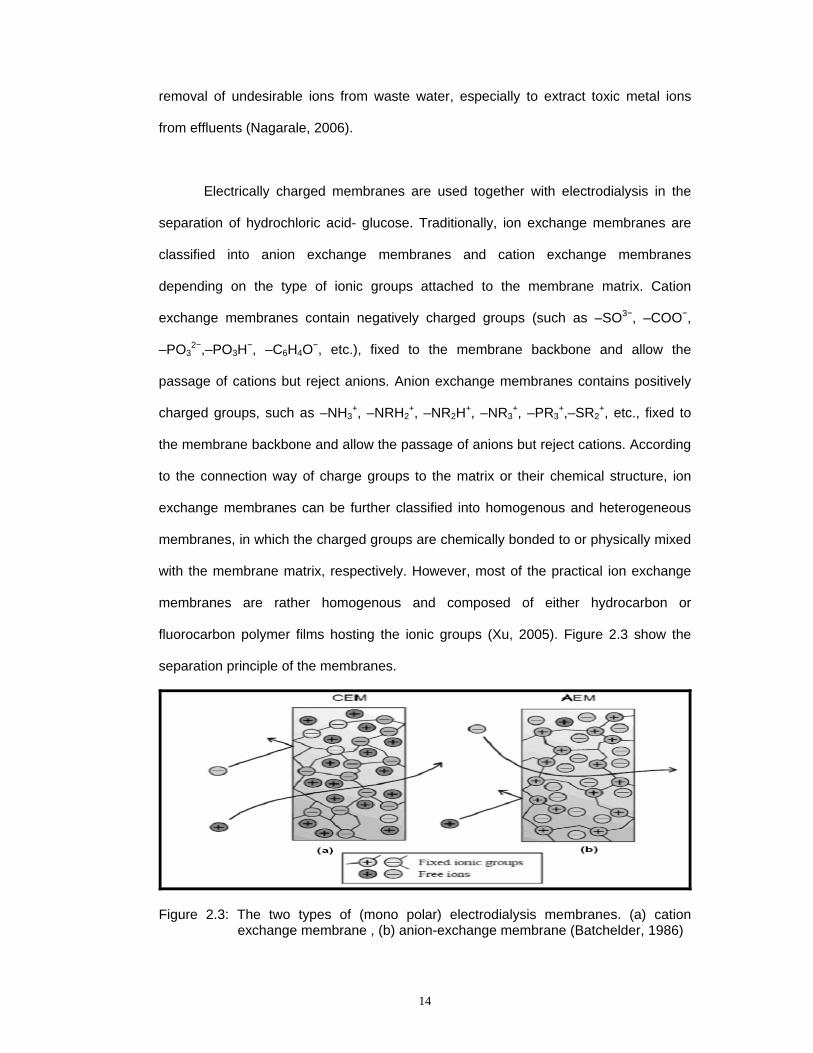
fluorocarbon polymer films hosting the ionic groups (Xu, 2005). Figure 2.3 show the
separation principle of the membranes.
Figure 2.3: The two types of (mono polar) electrodialysis membranes. (a) cation exchange membrane , (b) anion-exchange membrane (Batchelder, 1986)
15
The development of the ion exchange membrane-based process began in 1890
with the work of Ostwald who studied the properties of semi permeable membranes
and discovered that a membrane can be impermeable for any electrolyte if it is
impermeable either for its cation or its anion. To illustrate this, the so-called “membrane
potential” at the boundary between a membrane and its surrounding solution was
postulated as a consequence of the difference in concentration. In 1911, Donnan
confirmed the existence of such a boundary and developed a mathematical equation
describing the concentration equilibrium, which resulted in the so-called “Donnan
exclusion potential”. However, the actual basic studies related to ion exchange
membranes began in 1925 and was carried out by Michaelis and Fujita with the
homogeneous, weak acid collodium membranes. In 1930s, S¨ollner presented the idea
of a charge-mosaic membrane or amphoteric membrane containing both negatively
and positively charged ion exchange groups and showed distinctive ion transport
phenomena. Around 1940, interest in industrial applications led to the development of
synthetic ion exchange membrane on the basis of phenol-formaldehyde-
polycondensation (Xu, 2005).
With the development of stable, highly selective ion exchange membrane of low
electric resistance in 1950 by Juda and McRae of Ionics Inc. and Winger in 1953,
electrodialysis based on ion exchange membranes rapidly became an industrial
process for demineralizing and concentrating electrolyte solutions. Since then, both ion
exchange membranes and electrodialysis have been greatly improved and widely used
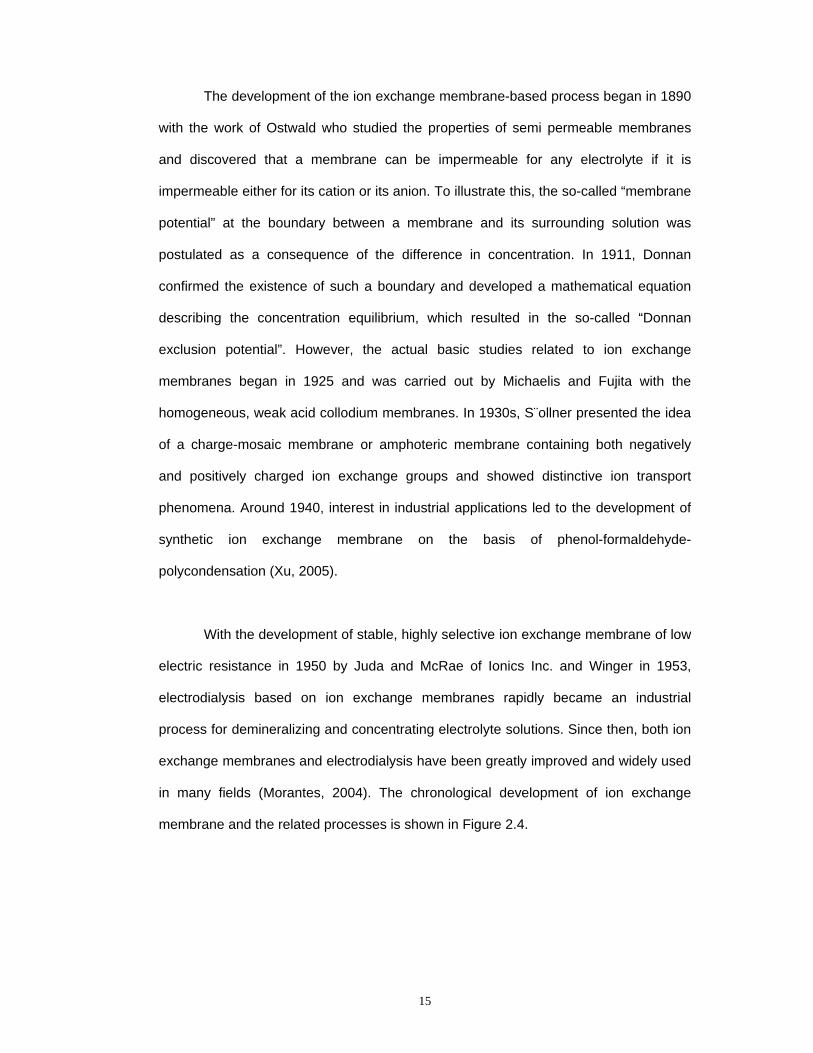
in many fields (Morantes, 2004). The chronological development of ion exchange
membrane and the related processes is shown in Figure 2.4.
16
Figure 2.4:Time line of ion exchange membrane development and their related processes (Xu, 2005).
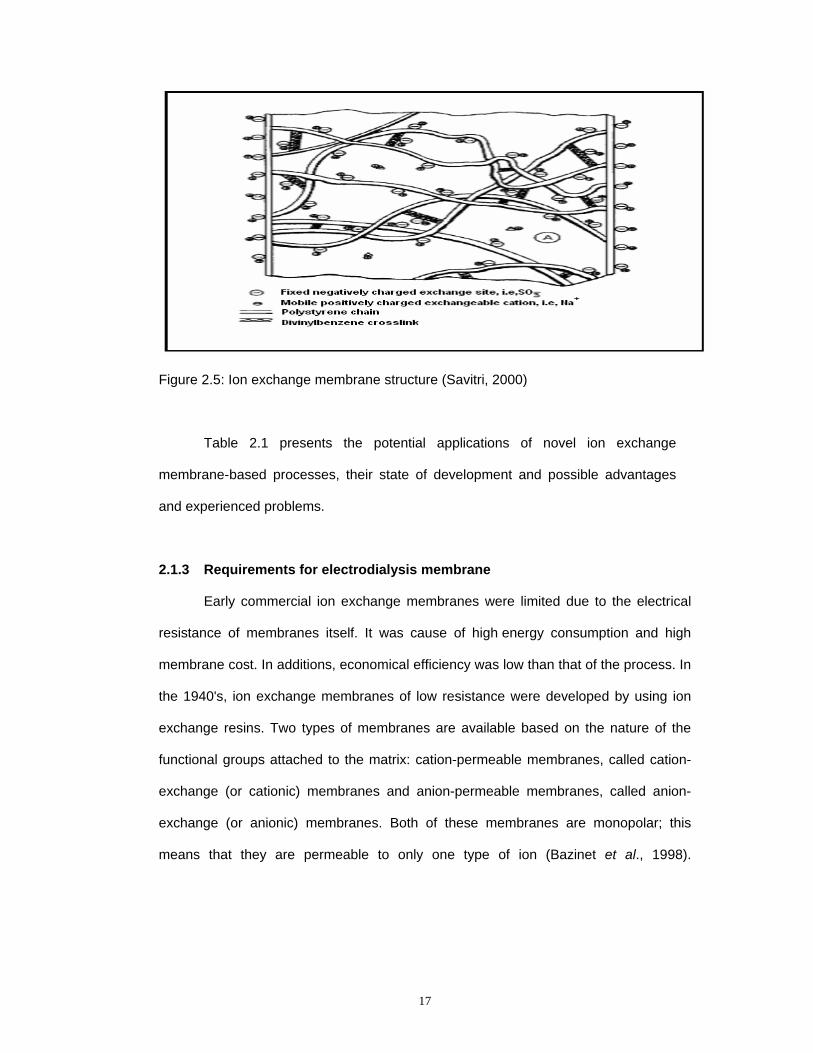
2.1.2 Structure of ion exchange membrane
Commercially available ion exchange membranes are essentially sheets of
ion exchange resins made up of (theoretically) a jumble of polymer chains with void
spaces between the chains. Ion exchange membranes are selectively permeable to
positively charged ions (cations) only or negatively charged ions (anions) only. The
structure of an ion exchange membrane is show in Figure 2.5. The most important
factor in the electrodialysis (ED) process is the permselectivity of the ion exchange
membranes, which permit not only the separation of cations and anions in a solution,
but also the separation of ions with the same sign but different valences (Peng at al.,
2004).
17
Figure 2.5: Ion exchange membrane structure (Savitri, 2000)
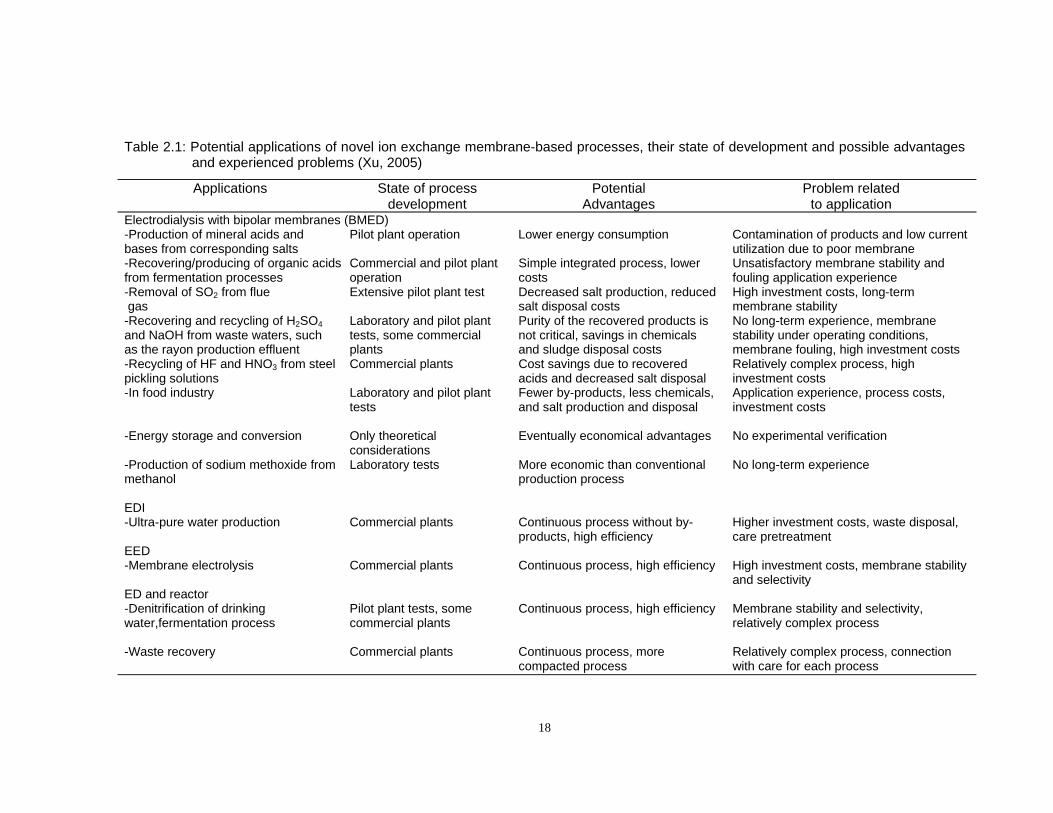
Table 2.1 presents the potential applications of novel ion exchange
membrane-based processes, their state of development and possible advantages
and experienced problems.
2.1.3 Requirements for electrodialysis membrane
Early commercial ion exchange membranes were limited due to the electrical
resistance of membranes itself. It was cause of high energy consumption and high
membrane cost. In additions, economical efficiency was low than that of the process. In
the 1940's, ion exchange membranes of low resistance were developed by using ion
exchange resins. Two types of membranes are available based on the nature of the
functional groups attached to the matrix: cation-permeable membranes, called cation-
exchange (or cationic) membranes and anion-permeable membranes, called anion-
exchange (or anionic) membranes. Both of these membranes are monopolar; this
means that they are permeable to only one type of ion (Bazinet et al., 1998).
18
Table 2.1: Potential applications of novel ion exchange membrane-based processes, their state of development and possible advantages
and experienced problems (Xu, 2005)
Applications State of process development
Potential Advantages
Problem related to application
Electrodialysis with bipolar membranes (BMED) -Production of mineral acids and bases from corresponding salts
Pilot plant operation Lower energy consumption Contamination of products and low current utilization due to poor membrane
-Recovering/producing of organic acids from fermentation processes
Commercial and pilot plant operation
Simple integrated process, lower costs
Unsatisfactory membrane stability and fouling application experience
-Removal of SO2 from flue gas
Extensive pilot plant test Decreased salt production, reduced salt disposal costs
High investment costs, long-term membrane stability
-Recovering and recycling of H2SO4 and NaOH from waste waters, such as the rayon production effluent
Laboratory and pilot plant tests, some commercial plants
Purity of the recovered products is not critical, savings in chemicals and sludge disposal costs
No long-term experience, membrane stability under operating conditions, membrane fouling, high investment costs
-Recycling of HF and HNO3 from steel pickling solutions
Commercial plants
Cost savings due to recovered acids and decreased salt disposal
Relatively complex process, high investment costs
-In food industry
Laboratory and pilot plant tests
Fewer by-products, less chemicals, and salt production and disposal
Application experience, process costs, investment costs
-Energy storage and conversion Only theoretical considerations
Eventually economical advantages No experimental verification
-Production of sodium methoxide from methanol
Laboratory tests
More economic than conventional production process
No long-term experience
EDI -Ultra-pure water production
Commercial plants
Continuous process without by-products, high efficiency
Higher investment costs, waste disposal, care pretreatment
EED -Membrane electrolysis Commercial plants Continuous process, high efficiency High investment costs, membrane stability
and selectivity ED and reactor -Denitrification of drinking water,fermentation process
Pilot plant tests, some commercial plants
Continuous process, high efficiency Membrane stability and selectivity, relatively complex process
-Waste recovery Commercial plants Continuous process, more compacted process
Relatively complex process, connection with care for each process
19
Ion selectivity is the most important of these properties. Perm selectivity is used
to describe these membranes and indicates that they are permeable to selected ions.
The manufacturers make ion-exchange membranes of various thicknesses and hence,
the resistance is tabulated as membrane area resistance of unit’s ohms cm2
(Strathmann, 1992).
Mechanical properties are important in the design of the support structures for
the membranes. The membranes must have sufficient mechanical strength to
withstand the fluid pressures and mechanical forces to which they are subjected. The
method of sealing to prevent leakage is to clamp the edges of the membranes between
flat surfaces so it is important for the membranes to be strong to resist fastening forces
without deformation. The fluid pressures involved in an electrodialysis cell are those
required to cause flow through very narrow passages in the spacers. The membrane
must have the ability to maintain its stability under continued exposure to the feed
compartment, containing various ions and having pH values from highly acidic to
alkaline (Savitri, 2000).
It is difficult to find all of these properties together in the commercially produced
membranes. Electrodialysis is characterized by the use of ion-selective membranes
and an electric field orthogonal to the membranes. In contrast to other membrane
processes, membranes used for electrodialysis can be arranged only in plate and
frame modules. The membranes themselves should be as large as possible and the
distance between them should be as small as possible, since these conditions are
favorable to the economics of the process (Kabay et al., 2003).
20
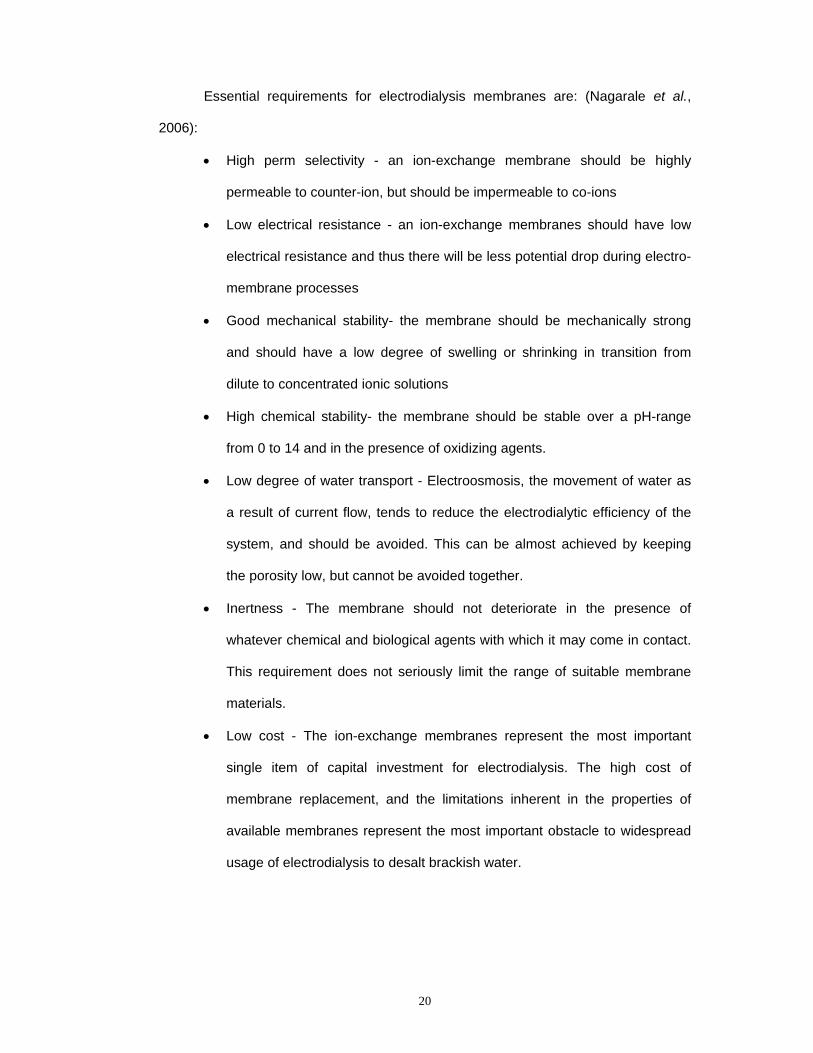
Essential requirements for electrodialysis membranes are: (Nagarale et al.,
2006):
• High perm selectivity - an ion-exchange membrane should be highly
permeable to counter-ion, but should be impermeable to co-ions
• Low electrical resistance - an ion-exchange membranes should have low
electrical resistance and thus there will be less potential drop during electro-
membrane processes
• Good mechanical stability- the membrane should be mechanically strong
and should have a low degree of swelling or shrinking in transition from
dilute to concentrated ionic solutions
• High chemical stability- the membrane should be stable over a pH-range
from 0 to 14 and in the presence of oxidizing agents.
• Low degree of water transport - Electroosmosis, the movement of water as
a result of current flow, tends to reduce the electrodialytic efficiency of the
system, and should be avoided. This can be almost achieved by keeping
the porosity low, but cannot be avoided together.
• Inertness - The membrane should not deteriorate in the presence of
whatever chemical and biological agents with which it may come in contact.
This requirement does not seriously limit the range of suitable membrane
materials.
• Low cost - The ion-exchange membranes represent the most important
single item of capital investment for electrodialysis. The high cost of
membrane replacement, and the limitations inherent in the properties of
available membranes represent the most important obstacle to widespread
usage of electrodialysis to desalt brackish water.
21
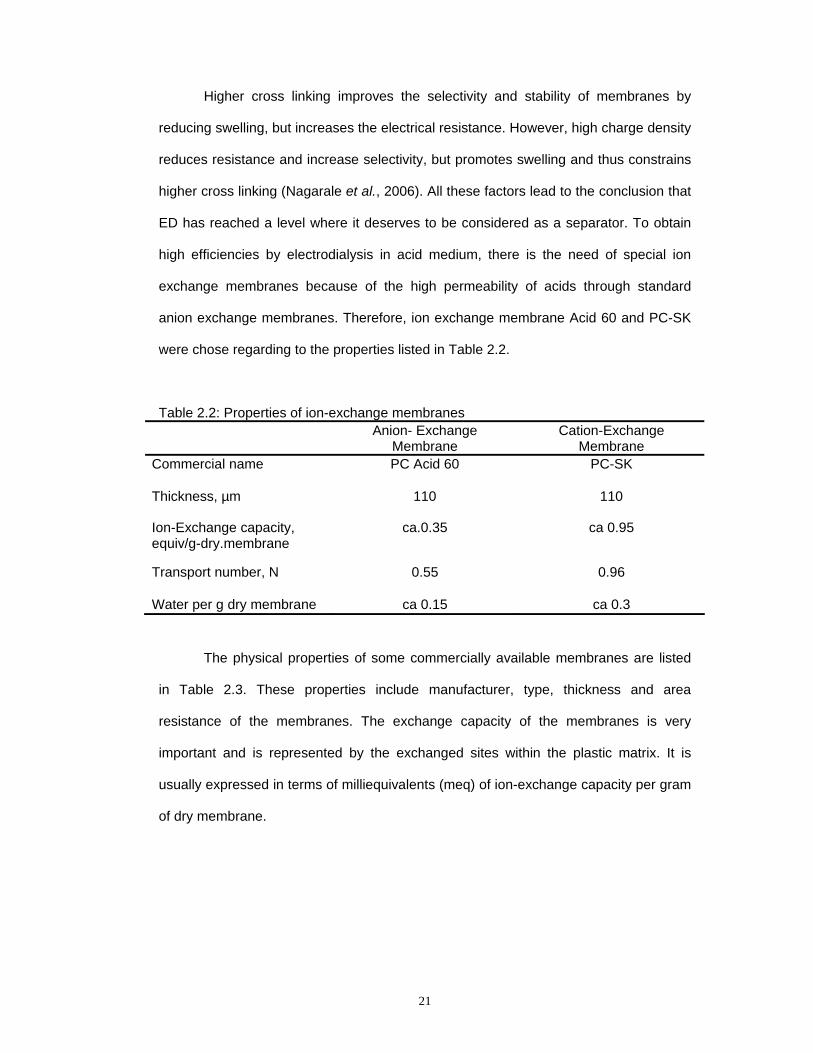
Higher cross linking improves the selectivity and stability of membranes by
reducing swelling, but increases the electrical resistance. However, high charge density
reduces resistance and increase selectivity, but promotes swelling and thus constrains
higher cross linking (Nagarale et al., 2006). All these factors lead to the conclusion that
ED has reached a level where it deserves to be considered as a separator. To obtain
high efficiencies by electrodialysis in acid medium, there is the need of special ion
exchange membranes because of the high permeability of acids through standard
anion exchange membranes. Therefore, ion exchange membrane Acid 60 and PC-SK
were chose regarding to the properties listed in Table 2.2.
Table 2.2: Properties of ion-exchange membranes Anion- Exchange
Membrane Cation-Exchange
Membrane Commercial name PC Acid 60 PC-SK
Thickness, µm 110 110
Ion-Exchange capacity, equiv/g-dry.membrane
ca.0.35 ca 0.95
Transport number, N 0.55 0.96
Water per g dry membrane ca 0.15 ca 0.3
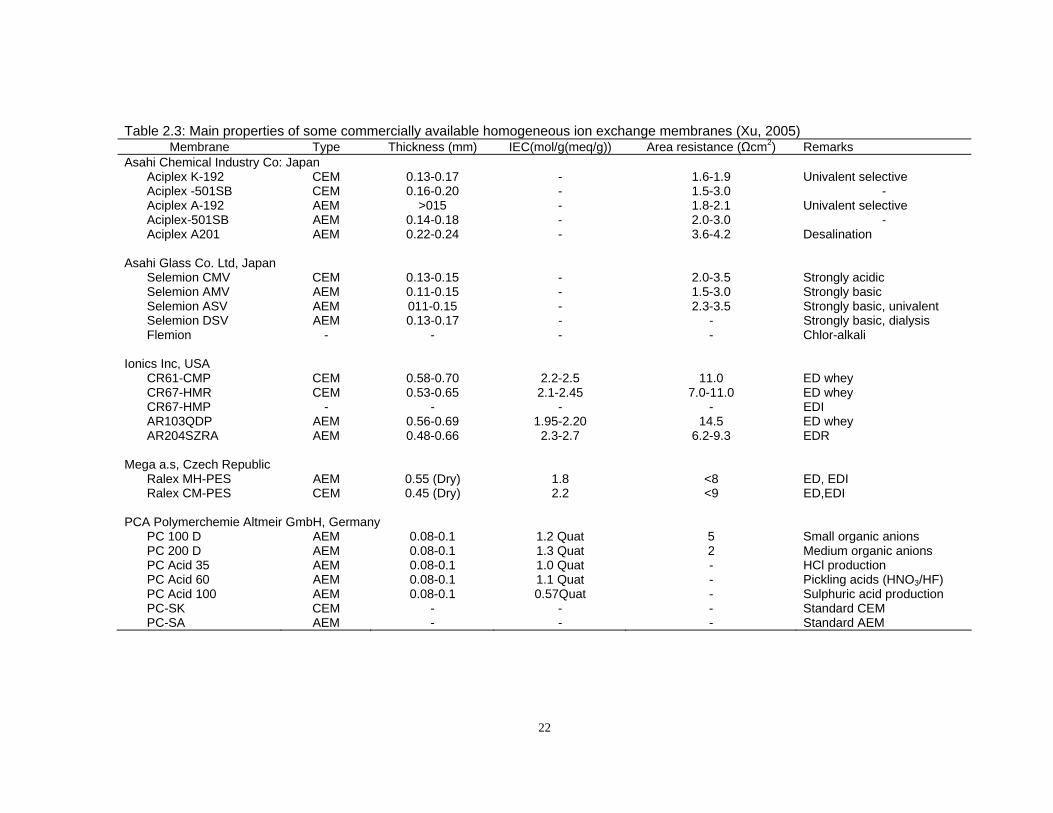
The physical properties of some commercially available membranes are listed
in Table 2.3. These properties include manufacturer, type, thickness and area
resistance of the membranes. The exchange capacity of the membranes is very
important and is represented by the exchanged sites within the plastic matrix. It is
usually expressed in terms of milliequivalents (meq) of ion-exchange capacity per gram
of dry membrane.
22
Table 2.3: Main properties of some commercially available homogeneous ion exchange membranes (Xu, 2005) Membrane Type Thickness (mm) IEC(mol/g(meq/g)) Area resistance (Ωcm2) Remarks
Asahi Chemical Industry Co: Japan Aciplex K-192 CEM 0.13-0.17 - 1.6-1.9 Univalent selective Aciplex -501SB CEM 0.16-0.20 - 1.5-3.0 - Aciplex A-192 AEM >015 - 1.8-2.1 Univalent selective Aciplex-501SB AEM 0.14-0.18 - 2.0-3.0 - Aciplex A201 AEM 0.22-0.24 - 3.6-4.2 Desalination
Asahi Glass Co. Ltd, Japan
Selemion CMV CEM 0.13-0.15 - 2.0-3.5 Strongly acidic Selemion AMV AEM 0.11-0.15 - 1.5-3.0 Strongly basic Selemion ASV AEM 011-0.15 - 2.3-3.5 Strongly basic, univalent Selemion DSV AEM 0.13-0.17 - - Strongly basic, dialysis Flemion - - - - Chlor-alkali
Ionics Inc, USA
CR61-CMP CEM 0.58-0.70 2.2-2.5 11.0 ED whey CR67-HMR CEM 0.53-0.65 2.1-2.45 7.0-11.0 ED whey CR67-HMP - - - - EDI AR103QDP AEM 0.56-0.69 1.95-2.20 14.5 ED whey AR204SZRA AEM 0.48-0.66 2.3-2.7 6.2-9.3 EDR
Mega a.s, Czech Republic
Ralex MH-PES AEM 0.55 (Dry) 1.8 <8 ED, EDI Ralex CM-PES CEM 0.45 (Dry) 2.2 <9 ED,EDI
PCA Polymerchemie Altmeir GmbH, Germany
PC 100 D AEM 0.08-0.1 1.2 Quat 5 Small organic anions PC 200 D AEM 0.08-0.1 1.3 Quat 2 Medium organic anions PC Acid 35 AEM 0.08-0.1 1.0 Quat - HCl production PC Acid 60 AEM 0.08-0.1 1.1 Quat - Pickling acids (HNO3/HF) PC Acid 100 AEM 0.08-0.1 0.57Quat - Sulphuric acid production PC-SK CEM - - - Standard CEM PC-SA AEM - - - Standard AEM
23
2.2 Electrodialysis
2.2.1 Definition
Electrodialysis (ED) is a membrane-based separation process in which electrically
charged membranes and an electrical potential difference are used to separate ionic
species from an aqueous solution. It can be operated only with solutions at the same
temperature to eliminate the energy consumption for the formation of a new phase as
distillation process (Luo et al., 2002).
ED is usually considered as a desalination process, but there is much wider scope
for this technique because ED is in many cases a powerful separation method when
charged compounds have to be separated from a solution (Min-tian et al., 2004). It is an
environmentally friendly membrane separation process. It is also an alternative to the
chemical treatment process of recovering hydrochloric acid from the hydrolysis mixture.
ED is gaining an increasing attention and has been widely investigated in many chemical
fields such as production of H2 and O2 from water. ED is a membrane separation process
in which ionic species are separated from water, macro solutes, and all uncharged solutes.
Ions are induced to move by an electrical potential, and separation is facilitated by ion-
exchange membranes. Membranes are highly selective, passing either anions or cations
and very little of anything else (Perry & Green, 1998).
Electrodialysis has been used in a multitude of applications which include the
separation of cations, anions, monovalent from multivalent ions, ionic species of the same
or different electrical charge, acids from elements in ionic form, amphoteric elements,
compounds of different conductances and degree of dissociation in solution, and ionic
species from non dissociated organic compounds (Boateng, 1992).
24
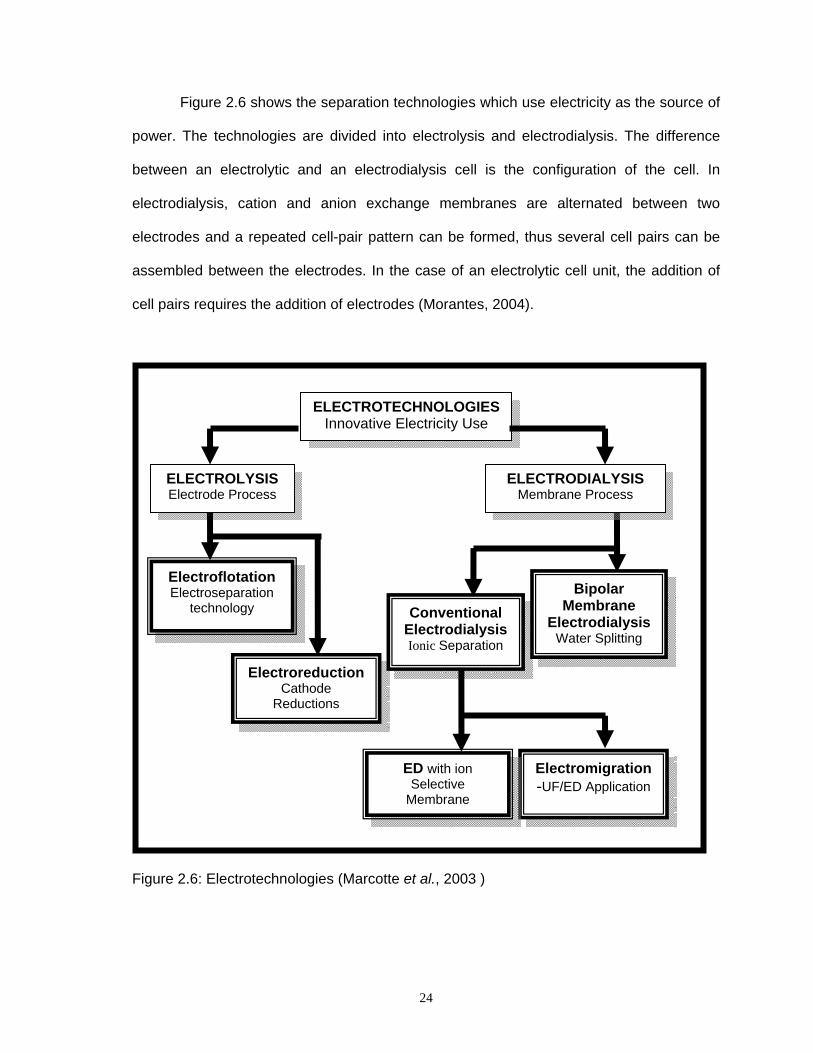
Figure 2.6 shows the separation technologies which use electricity as the source of
power. The technologies are divided into electrolysis and electrodialysis. The difference
between an electrolytic and an electrodialysis cell is the configuration of the cell. In
electrodialysis, cation and anion exchange membranes are alternated between two
electrodes and a repeated cell-pair pattern can be formed, thus several cell pairs can be
assembled between the electrodes. In the case of an electrolytic cell unit, the addition of
cell pairs requires the addition of electrodes (Morantes, 2004).
Figure 2.6: Electrotechnologies (Marcotte et al., 2003 )
ELECTROTECHNOLOGIES Innovative Electricity Use
Electroflotation Electroseparation
technology
Electroreduction Cathode
Reductions
Conventional Electrodialysis Ionic Separation
Bipolar Membrane
Electrodialysis Water Splitting
Electromigration -UF/ED Application
ED with ion Selective
Membrane
ELECTROLYSIS Electrode Process
ELECTRODIALYSIS Membrane Process