Embed Size (px)
Citation preview
SEPA Bathing Waters Signage
Calum McPhailEnvironmental Quality
Unit manager
Ruth Stidson
Bathing Waters Signage
Officer
Contents
SEPA beach signage – overview and results
Development of the SEPA Signage Prediction Tool
Development of future modelling systems
Background on Bathing Waters
Scotland has had problems of poor quality bathing water in some areas
Combination of diffuse pollution, especially on the west coast, and CSO discharges
For some sites meeting the potential new Directive will be challenging

Signage Overview
SEPA makes a daily water quality prediction, relating to the EU standards for bathing water, at the 10 signage sites throughout the bathing season
This is based on relevant environmental (mainly rainfall) events from the previous two days
This information is then displayed at the beach via an electronic variable message sign and on the web and phone line.

Example of electronic beach sign (at Prestwick) and alternative sign face legends
EC Bathing Water with signage
EC Bathing Water
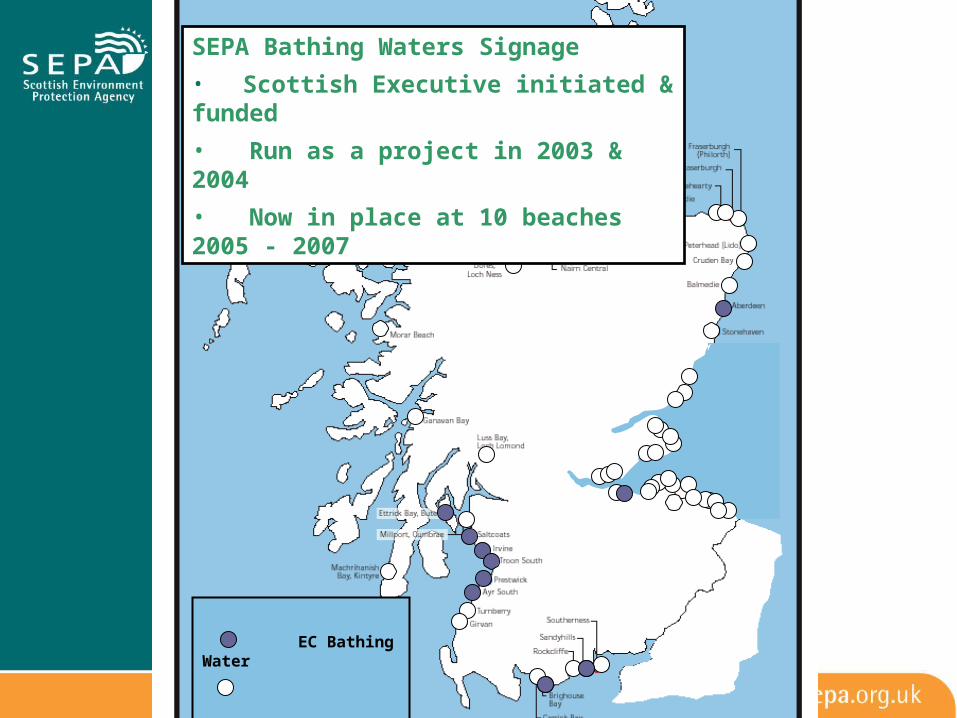
SEPA Bathing Waters Signage
• Scottish Executive initiated & funded
• Run as a project in 2003 & 2004
• Now in place at 10 beaches 2005 - 2007
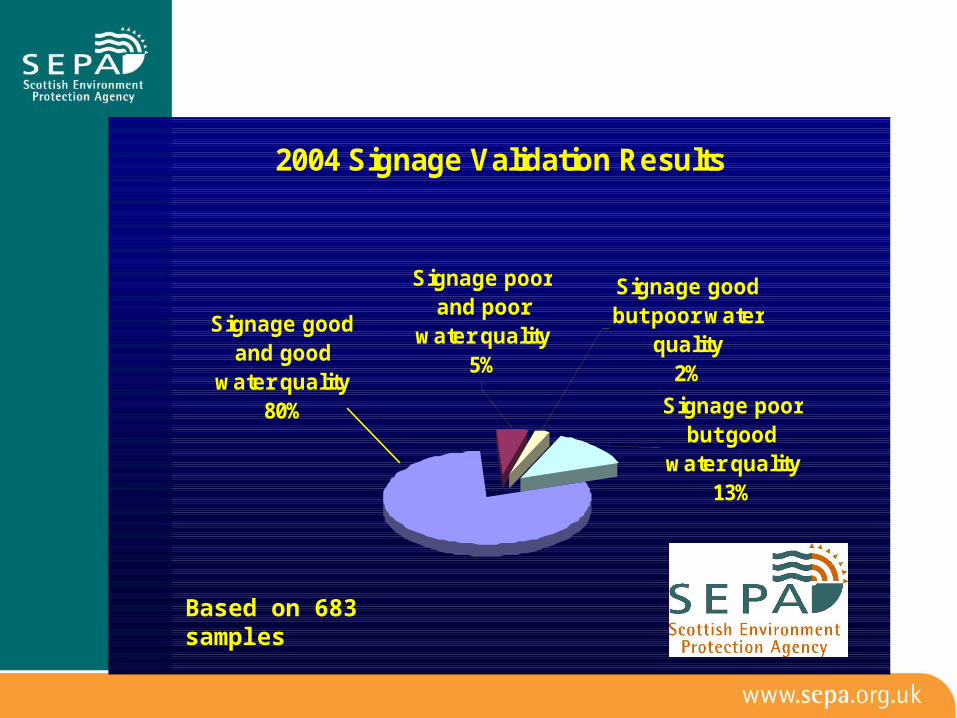
2004 Signage Validation Results
Signage good and good
water quality80%
Signage poor and poor
water quality5%
Signage good but poor water
quality2%
Signage poor but good
water quality13%
Based on 683 samples
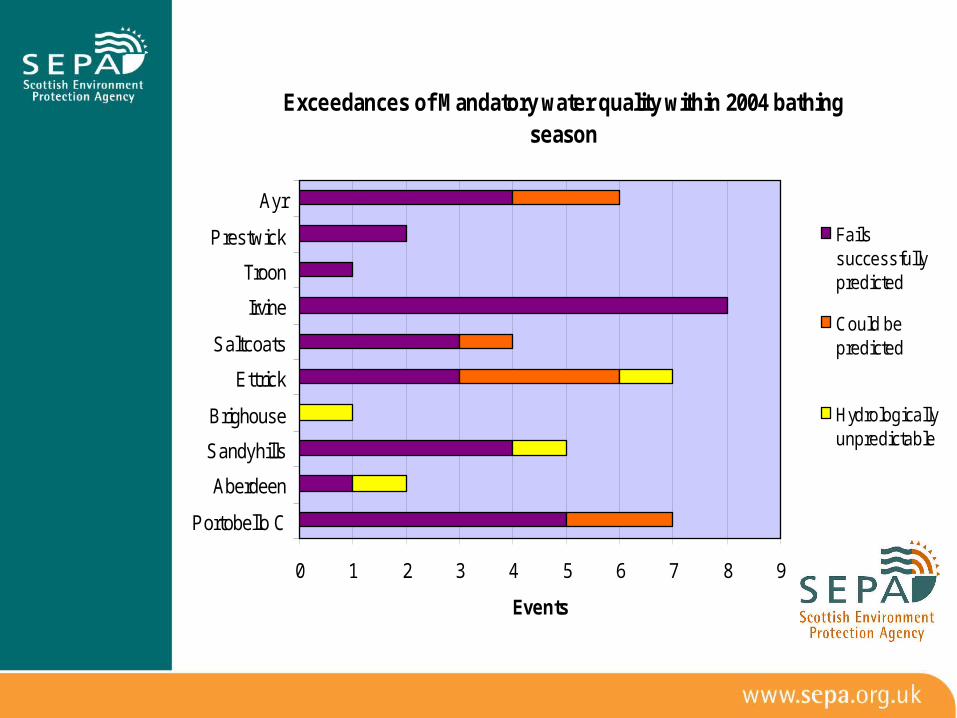
Exceedances of Mandatory water quality within 2004 bathing season
0 1 2 3 4 5 6 7 8 9
Ayr
Prestwick
Troon
Irvine
Saltcoats
Ettrick
Brighouse
Sandyhills
Aberdeen
Portobello C
Events
Failssuccessfullypredicted
Could bepredicted
Hydrologicallyunpredictable
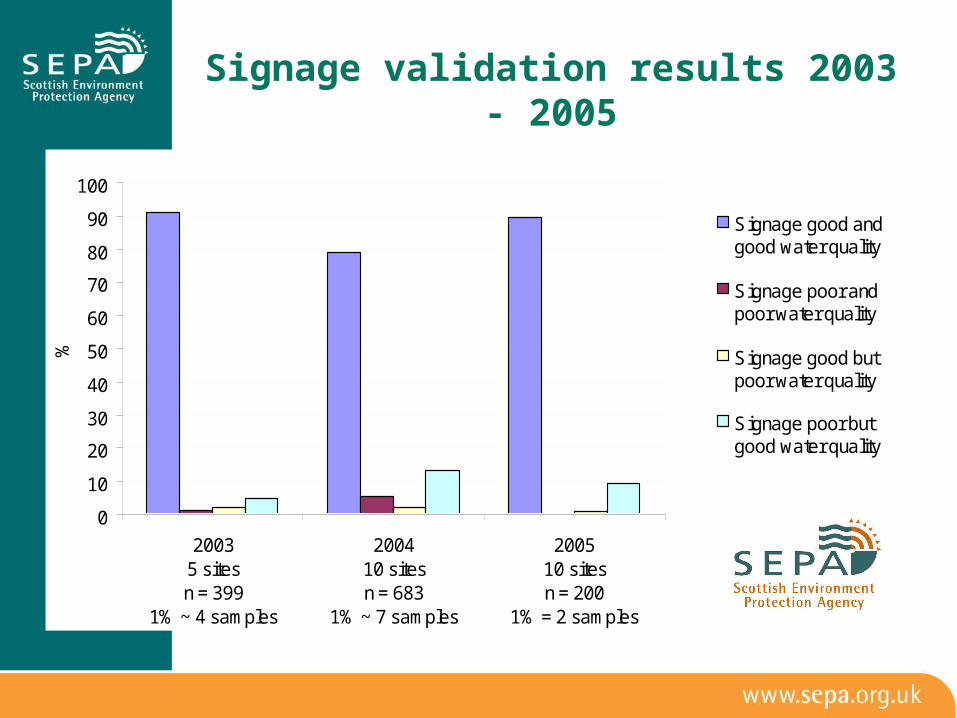
Signage validation results 2003 - 2005
0
10
20
30
40
50
60
70
80
90
100
20035 sitesn = 399
1% ~ 4 samples
200410 sitesn = 683
1% ~ 7 samples
200510 sitesn = 200
1% = 2 samples
%
Signage good andgood water quality
Signage poor andpoor water quality
Signage good butpoor water quality
Signage poor butgood water quality

Aberdeen Signage results 2004 & 2005(excellent, good, or poor status predictions)
0
10
20
30
40
50
SignageEXCEL,Microb.EXCEL
SignageGOOD,Microb.GOOD
SignagePOOR,Microb.
FAIL
SignageGOOD,Microb.EXCEL
SignagePOOR,Microb.GOOD
SignagePOOR,Microb.EXCEL
SignageEXCEL,Microb.GOOD
SignageGOOD,Microb.
FAIL
SignageEXCEL,Microb.
FAIL
%
2004 Solid fill2005 Striped fill
First year - 2003 sign management
Signs set to predict poor quality if: 24 hr rain greater than 10 mm or 48 hr rain greater than 15 mm
These were known as ‘decision trigger levels’
This worked well but there was scope for improvement

Development of the SEPA Signage Prediction Tool
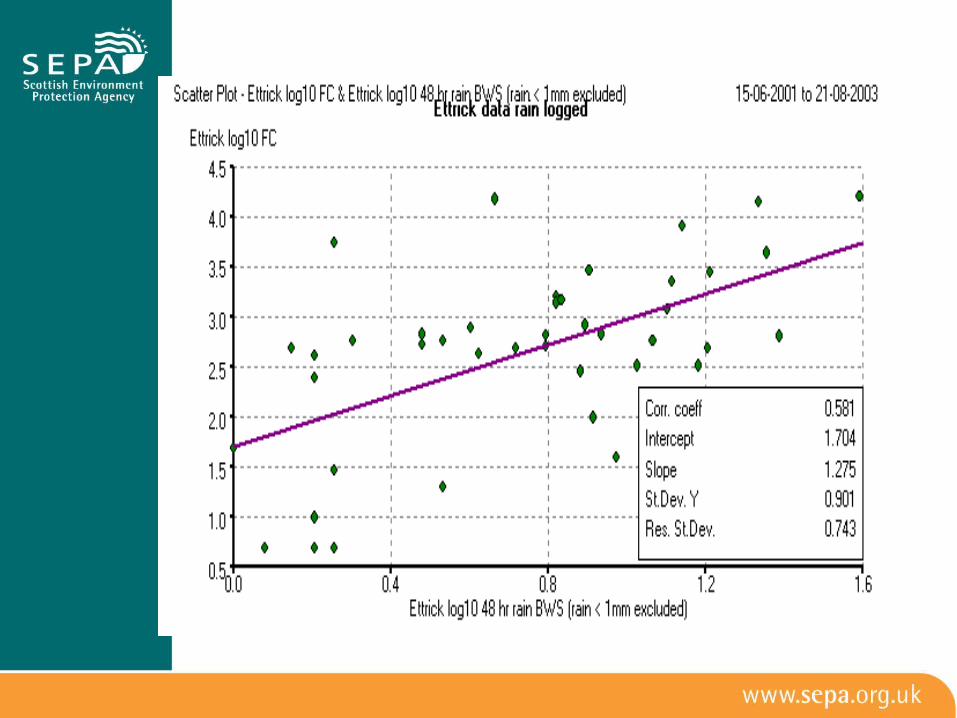
Known relationship between rainfall and coliform levels
SEPA archives for historical datasets (e.g. water quality results and environmental drivers)
Understanding site response to inputs, or recent infrastructure improvements/schemes
Predicting diffuse pollution: rain events run-off from fields increased coliform levels
Further developing the relationship between rain & coliforms
For each of the signage sites: Relevant rain and river gauging stations
were identified At each raingauge, 1 to 5 days rain was
correlated against faecal and non-faecal coliforms and faecal streptococci
Strongest relationships at each site were identified

Conversion into a useful tool
Possible to use relationship to predict coliform levels on any given day
Use this information to predict if the coliform levels will be in exceedance of EC guidelines
Development of signage prediction tool to refine decision trigger levels
What does the tool do?
Site specific Enables the testing of potential decision
trigger levels against actual data from 2000/1 onwards
Instantly allows the user to see the outcomes of trial decision trigger levels
Allows the user to alter the coliform exceedence limits in anticipation of the new Directive
Irvine rainSaughall
rainAmlaird
rainBlackdyke
rain
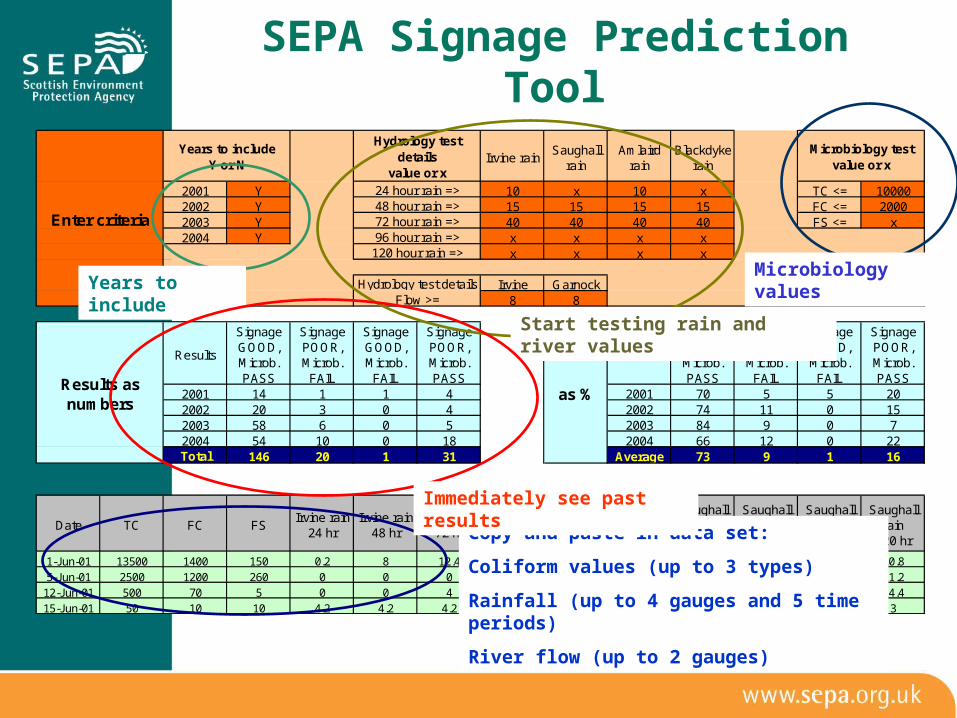
2001 Y 10 x 10 x TC <= 100002002 Y 15 15 15 15 FC <= 20002003 Y 40 40 40 40 FS <= x2004 Y x x x x
x x x x
Irvine Garnock8 8
Results
Signage GOOD, Microb. PASS
Signage POOR, Microb.
FAIL
Signage GOOD, Microb.
FAIL
Signage POOR, Microb. PASS
Results
Signage GOOD, Microb. PASS
Signage POOR, Microb.
FAIL
Signage GOOD, Microb.
FAIL
Signage POOR, Microb. PASS
2001 14 1 1 4 2001 70 5 5 202002 20 3 0 4 2002 74 11 0 152003 58 6 0 5 2003 84 9 0 72004 54 10 0 18 2004 66 12 0 22Total 146 20 1 31 Average 73 9 1 16
Date TC FC FSIrvine rain
24 hrIrvine rain
48 hrIrvine rain
72 hrIrvine rain
96 hrIrvine rain
120 hr
Saughall rain
24 hr
Saughall rain
48 hr
Saughall rain
72 hr
Saughall rain
96 hr
Saughall rain
120 hr
1-Jun-01 13500 1400 150 0.2 8 12.4 13 13.4 1.2 12.1 13.9 18.5 20.85-Jun-01 2500 1200 260 0 0 0 5.2 5.4 0 0.2 0.2 10 11.212-Jun-01 500 70 5 0 0 4 10.4 10.4 0 0.5 4.2 13.6 14.415-Jun-01 50 10 10 4.2 4.2 4.2 4.2 4.2 2.5 2.5 2.5 2.5 3
Microbiology testvalue or x
as %
Years to includeY or N
Hydrology test details
value or x
24 hour rain =>48 hour rain =>72 hour rain =>96 hour rain =>120 hour rain =>
Hydrology test detailsFlow >=
Enter criteria
Results as numbers
Copy and paste in data set:
Coliform values (up to 3 types)
Rainfall (up to 4 gauges and 5 time periods)
River flow (up to 2 gauges)
Years to includeMicrobiology values
Start testing rain and river values
SEPA Signage Prediction Tool
Immediately see past results

Strengths of the current tool
Very effective at predicting compliance against mandatory standard in Scotland 98% correct or precautionary in 03 & 04,
99% in 05 Simple to:
Use Update Apply to additional sites
Transparent
Easy adaptations
Very easy to adapt for other factors IF they can be considered as a single variable E.g. if sunshine is a major driver can add in
test as per river flow Input sunshine (eg) as hours Use test such as ‘if sunshine < x hours
predict poor’ Use tool to test different values of x Can use similar technique for wind, tide,
telemetered CSO spills etc
More challenging adaptations
It is possible to consider combined factors IF rain > 10 mm → poor IF rain > 8 mm AND
Wind = onshore OR tide = incoming
→ poor
Rapidly becomes more complex !
Bathing Water Future Models
Colin GrayData Analyst Modeller, SEPA
Aim: To try and improve current models To develop models for future, more
stringent EU directive To utilise new developments and
software within SEPA
Data Available to Models
Rainfall data for relevant gauges per beach River flow data High tide times & sample times Weather Salinity
Can not be used in predictions currently due to sampling methods
Wind direction and speed Beach usage
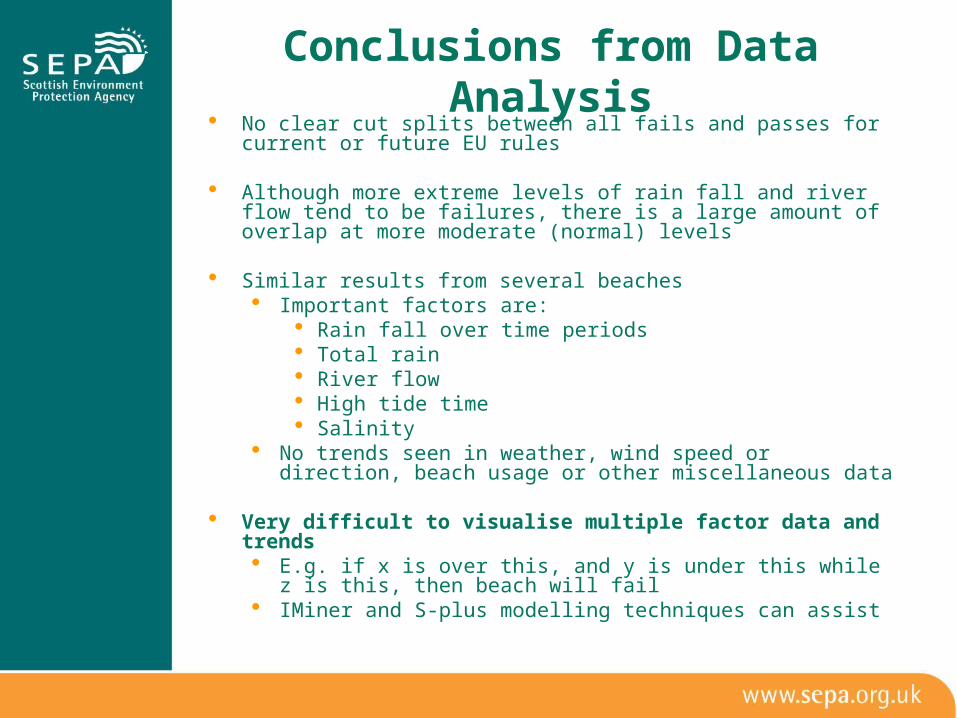
Conclusions from Data Analysis No clear cut splits between all fails and passes for current or future
EU rules
Although more extreme levels of rain fall and river flow tend to be failures, there is a large amount of overlap at more moderate (normal) levels
Similar results from several beaches Important factors are:
Rain fall over time periods Total rain River flow High tide time Salinity
No trends seen in weather, wind speed or direction, beach usage or other miscellaneous data
Very difficult to visualise multiple factor data and trends E.g. if x is over this, and y is under this while z is this, then
beach will fail IMiner and S-plus modelling techniques can assist

Software and Techniques
SEPA Statistical and Modelling software S-plus
ideal for data manipulation and graphing Insightful Miner (IMiner)
designed for producing work flows and modelling large amounts of data
Both are closely integrated
Models Used Scoring Method Classification Trees (a.k.a. Decision Trees) Neural Networks Classification Regression Naïve Bayes
General Principles
Performance will be very dependant on true trends being present
Lack of failure data can lead to models using incorrect assumptions
Computers know nothing of science! All models need human validation and
adjustment to ensure making sensible assumptions and relationships

Decision trees
Uses method called RPART (recursive partitioning) Builds braches which represent relationships between
factors Helps highlight key factors affecting a bathing water
Easy to interpret and adjust Very fast to generate and utilise Widely used in other industries e.g. pharmaceutical Easy to implement as an everyday prediction tool Suited well to bathing water predictions
Uses predefined conditions to determine prediction
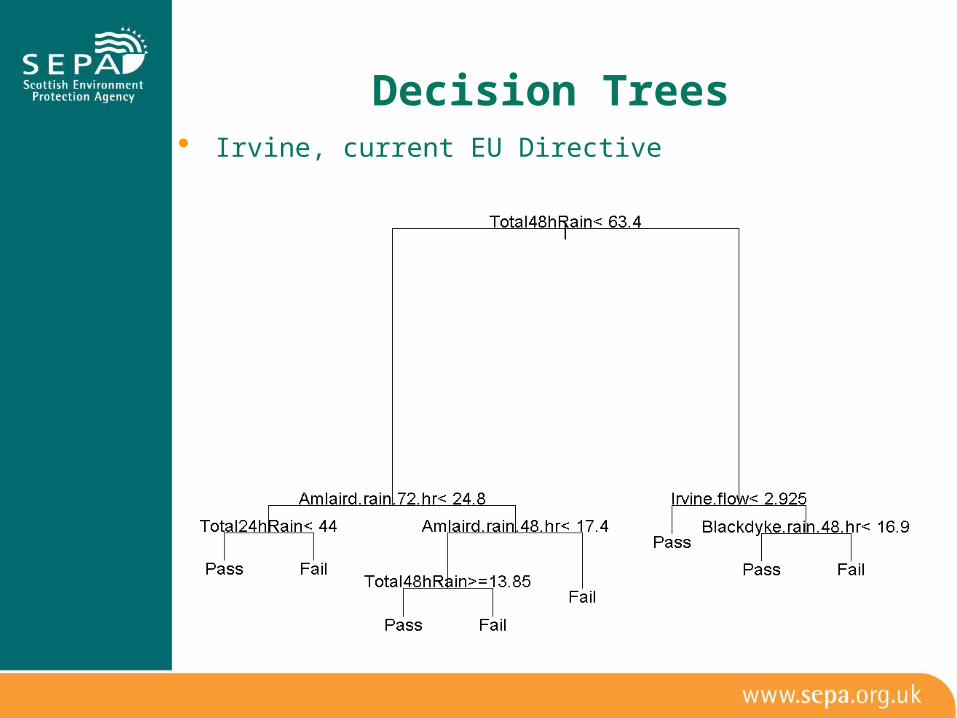
Decision Trees Irvine, current EU Directive
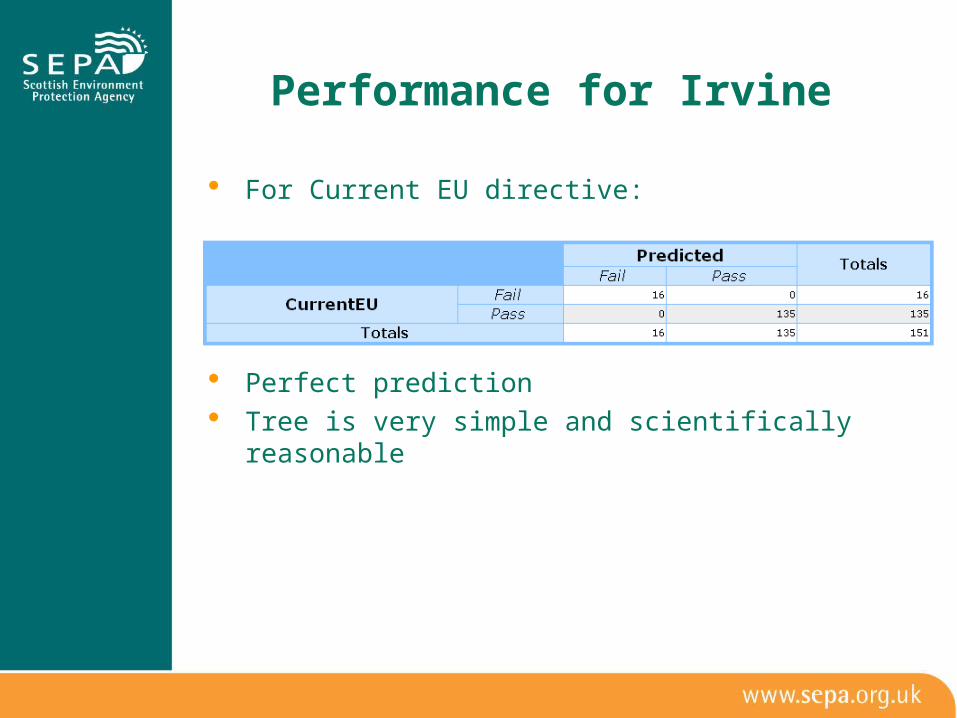
Performance for Irvine
For Current EU directive:
Perfect prediction Tree is very simple and scientifically reasonable

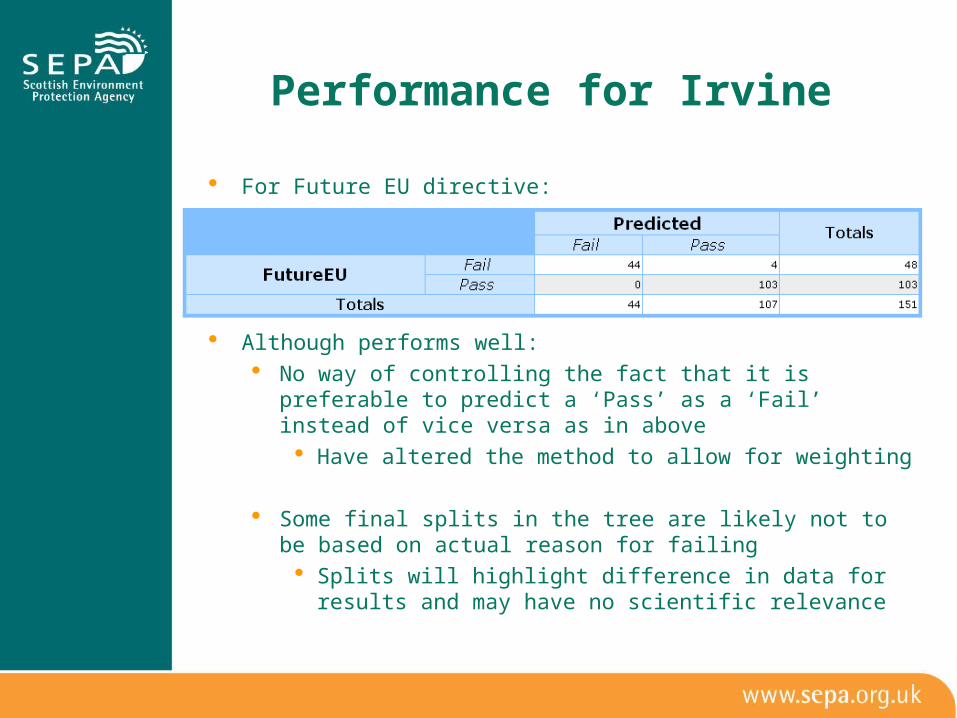
Performance for Irvine For Future EU directive:
Tree becomes very complex
Performance for Irvine
For Future EU directive:
Although performs well: No way of controlling the fact that it is preferable to predict
a ‘Pass’ as a ‘Fail’ instead of vice versa as in above Have altered the method to allow for weighting
Some final splits in the tree are likely not to be based on actual reason for failing
Splits will highlight difference in data for results and may have no scientific relevance
Summary of Decision Trees
Decision trees appear to provide a good method of modelling beaches Easier to interpret and adjust than other methods Better performance than scoring, neural networks or
logistic regression
However careful manipulation of the weighting may be required
Care needed to ensure final splits are scientifically valid
Missing data needs to be handled in a standard method
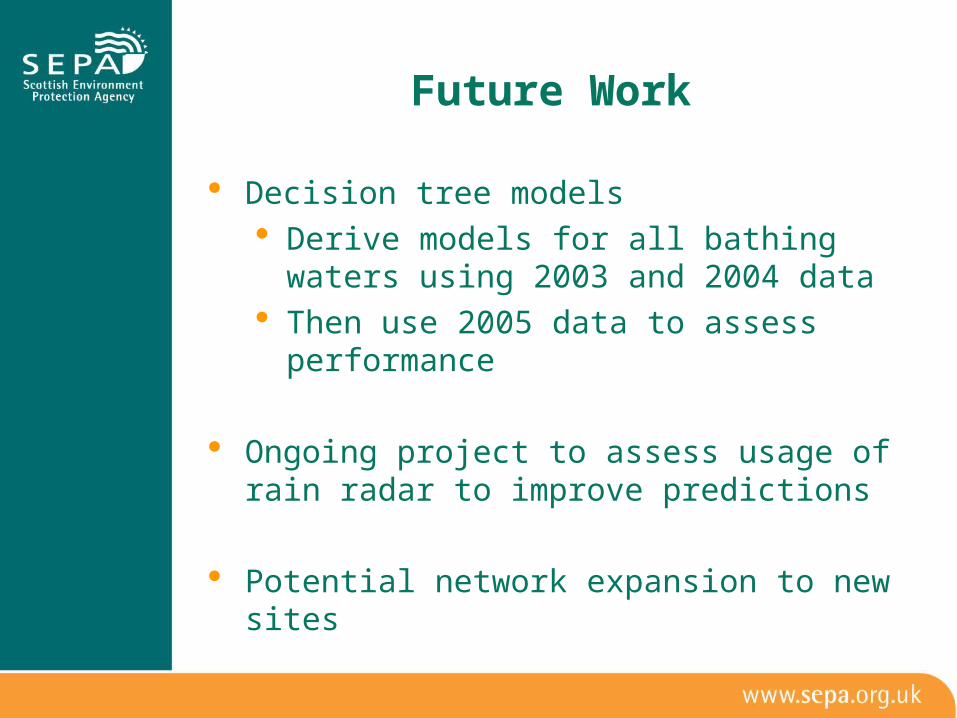
Future Work
Decision tree models Derive models for all bathing waters using
2003 and 2004 data Then use 2005 data to assess
performance
Ongoing project to assess usage of rain radar to improve predictions
Potential network expansion to new sites
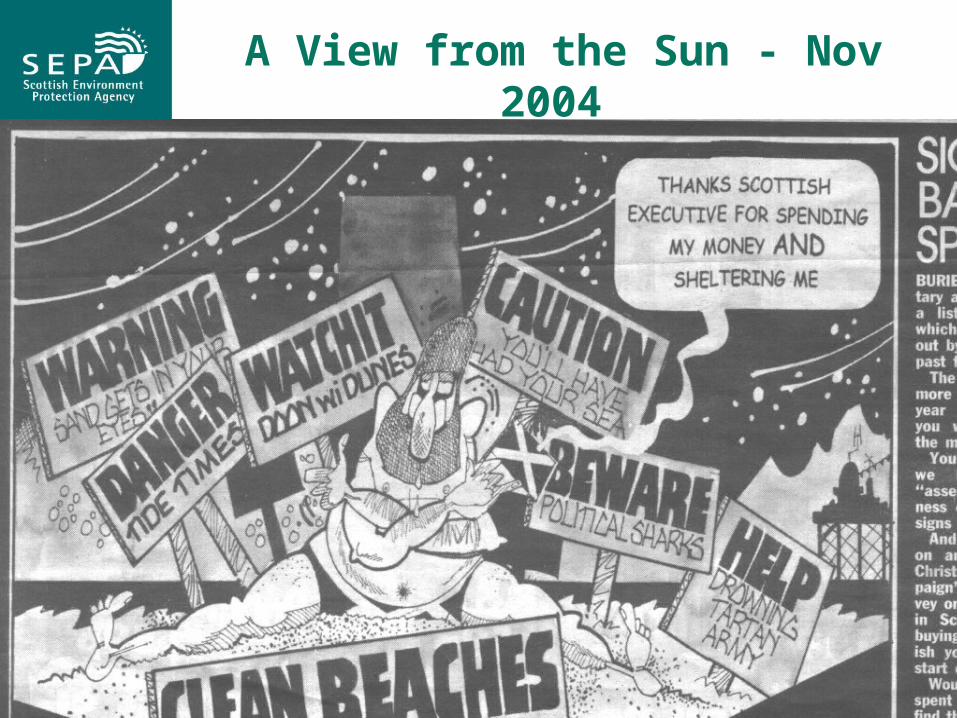
A View from the Sun - Nov 2004

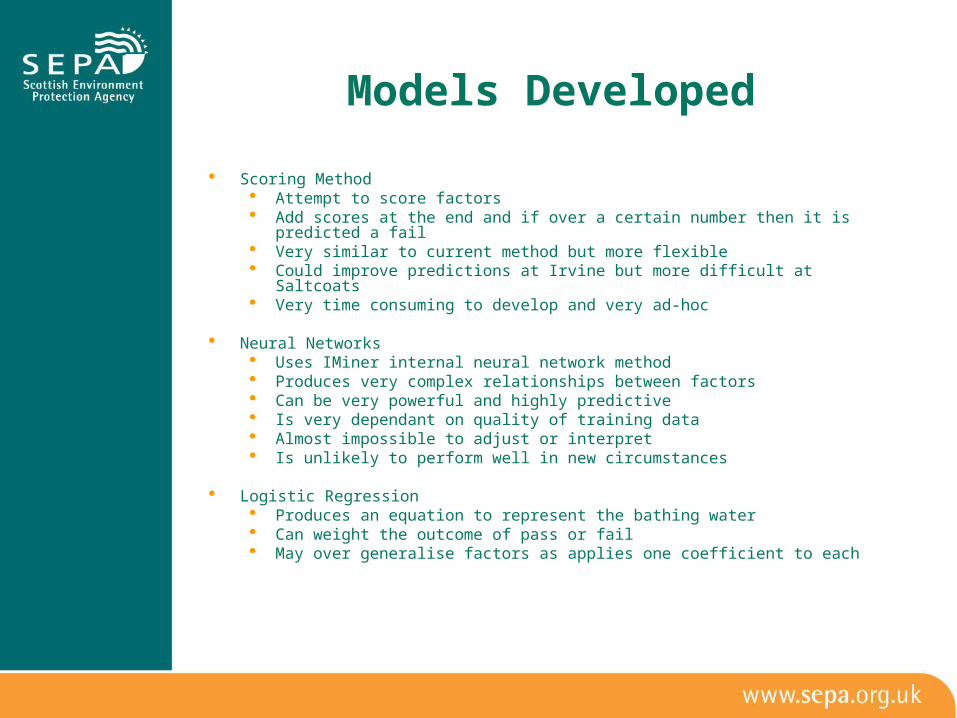
Models Developed
Scoring Method Attempt to score factors Add scores at the end and if over a certain number then it is predicted a fail Very similar to current method but more flexible Could improve predictions at Irvine but more difficult at Saltcoats Very time consuming to develop and very ad-hoc
Neural Networks Uses IMiner internal neural network method Produces very complex relationships between factors Can be very powerful and highly predictive Is very dependant on quality of training data Almost impossible to adjust or interpret Is unlikely to perform well in new circumstances
Logistic Regression Produces an equation to represent the bathing water Can weight the outcome of pass or fail May over generalise factors as applies one coefficient to each
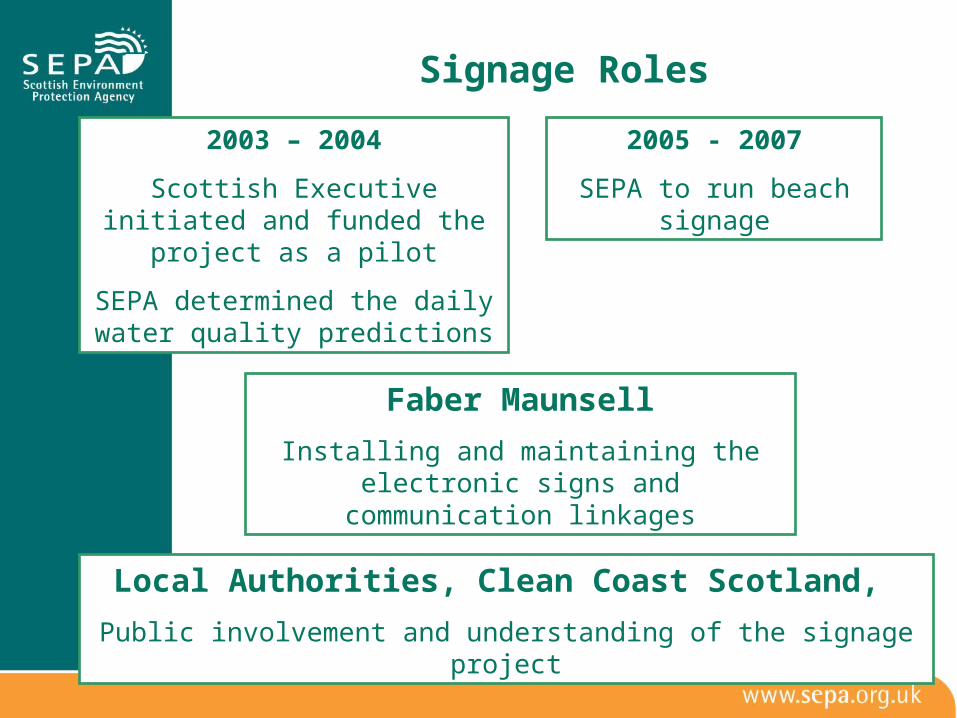
Signage Roles
2003 – 2004
Scottish Executive initiated and funded the project as a pilot
SEPA determined the daily water quality predictions
2005 - 2007
SEPA to run beach signage
Faber Maunsell
Installing and maintaining the electronic signs and communication linkages
Local Authorities, Clean Coast Scotland,
Public involvement and understanding of the signage project
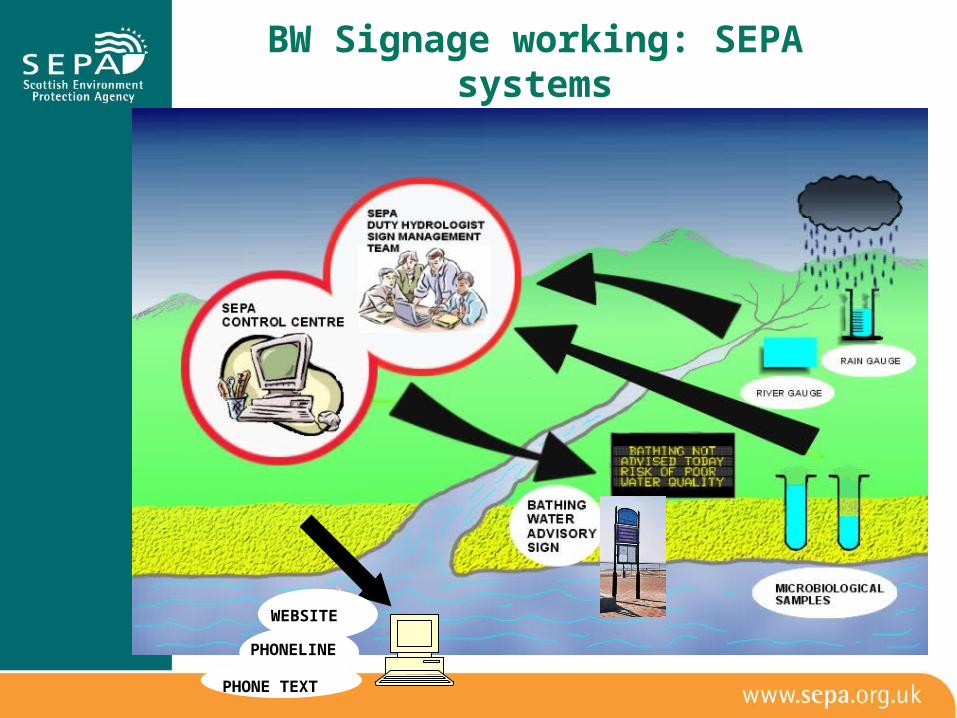
BW Signage working: SEPA systems
WEBSITE
PHONELINE
PHONE TEXT

Incorporating into predictive tool
If tide / wind / sunshine is to be incorporated into the tool, it needs to be a secondary consideration to rainfall
Say statistical tests show that an onshore wind at Irvine significantly increases coliform concentrations
If the trigger level for Irvine is set at 12 mm of rain within 24 hours, can code into Excel that: IF rain is x % lower than the trigger level AND the
wind is onshore, then OVERRIDE to POOR IF rain is x % above the trigger level AND the wind
is NOT onshore, then OVERRIDE to GOOD Can potentially code for tide, wind and sunshine for
multiple triggers, however this does considerably increase the complexity of the tool