Embed Size (px)
Citation preview

Sep. 29, 2016
Jong Wook Lee
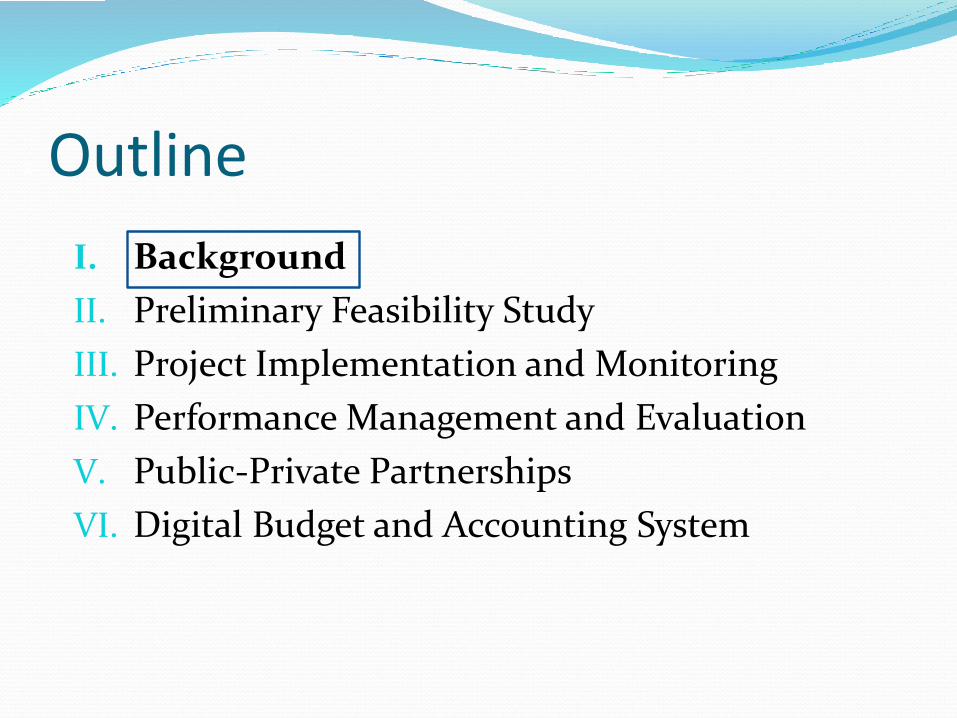
Outline
I. Background
II. Preliminary Feasibility Study
III. Project Implementation and Monitoring
IV. Performance Management and Evaluation
V. Public-Private Partnerships
VI. Digital Budget and Accounting System
2

I-1. Korea Overview Area: 100,000㎢ (WR 109th)
* Brazil : 8,515,770㎢ (WR 5th)
Population : 49 Million(28th)
* Brazil : 204 Million (WR 6th)
2015 GDP: $1,435 Billion(11th)
* Budget $294.1 Billion(20.5%)
2015 GNI per capita
: $ 27,340(42th )
1

I-2. Background of PIM Reform
The Asian financial crisis in 1997 served as an impetus for the development of public investment management systems
2
TPCM introducedPPP Law enacted
PFSRSFPE
PPP Reform MTEFTop-DownPMSDBAC
SASPBMRDBTL
1994 1997 1999 2001 2004 2005 2006
Public Sector Reform
Asian Financial
Crisis
PB
RDF
National Finance Act
4 Fiscal Reform Initiatives
4

-* Average growth rate during 1960~2010 : 7.5%
[ Economic Development & Challenges ]
Asian Economic Crisis
19801960 1970 1995
5,000
10,000
1953
GNI per Capita (US$)
19901945
OECD Membership
1998 2007
15,000
20,000Global
Economic Crisis
2009
5-year Economic Development Plan
67 79
11,505
7,607
100(1963)1,043(1977)
21,632
17,041
2013
26,205
3
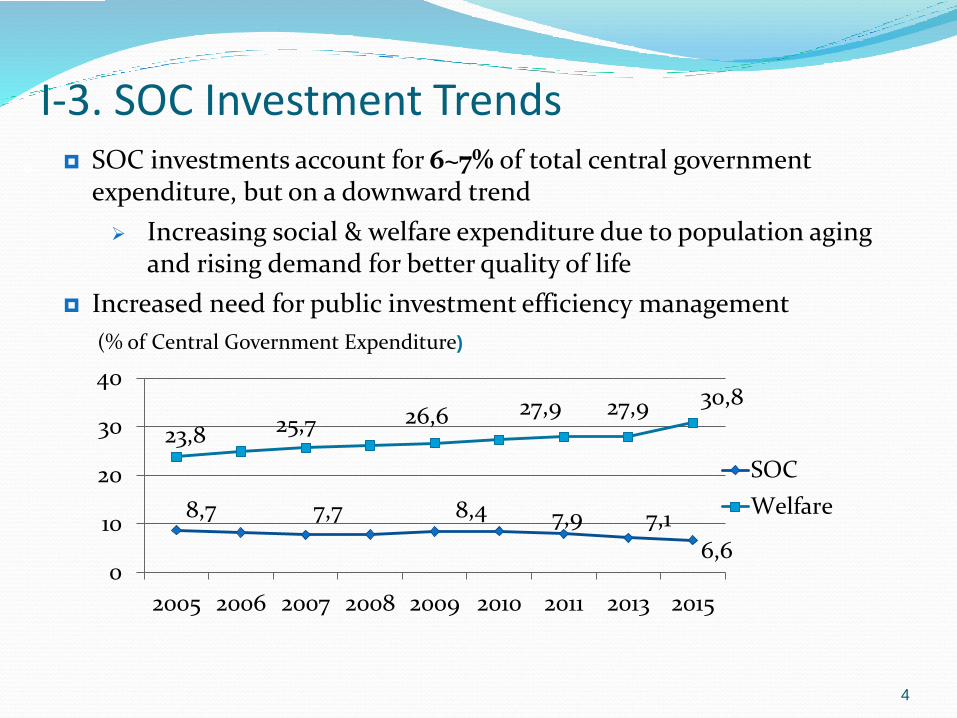
I-3. SOC Investment Trends SOC investments account for 6~7% of total central government
expenditure, but on a downward trend
Increasing social & welfare expenditure due to population aging and rising demand for better quality of life
Increased need for public investment efficiency management
6
8,7 7,7 8,4 7,9 7,1
6,6
23,8 25,7 26,6 27,9 27,9 30,8
0
10
20
30
40
2005 2006 2007 2008 2009 2010 2011 2013 2015
SOC
Welfare
(% of Central Government Expenditure)
4

I-4. Unique roles of Key Players
5
Centralized decision-making with strong MoSF
MoSF holds budget formulation authority; also in charge of project selection, feasibility study and implementation monitoring
The Legislature can not introduce new spending items without consent from the administration body (Constitution § 57)
PIMAC (Public and Private Infrastructure Investment Management Center)
Established in 2001, as an affiliated body of the KDI
Enhances expertise and objectivity of PIM
PIMAC
Policy Research Div
Public Investment Evaluation Div
Public-Private Partnership
Div
7
Outline
I. Background
II. Preliminary Feasibility Study
III. Project Implementation and Monitoring
IV. Performance Management and Evaluation
V. Public-Private Partnerships
VI. Digital Budget and Accounting System
8

II-1. Preliminary Feasibility Study
6
What is PFS?
Brief project evaluation for budgetary decision
Introduced first in 1999
Prerequisite for budget request (the National Finance Act)
Budget request should be follow the order
Only one stage of budgeting is allowed in a fiscal year
9
PFSFeasibility
StudyBasic
DesignWorking Design
Compensation
Construction

7
Difference with previous FS*
PFS Previous FS
Owned by MoSF Executing ministries
Focused on Financial feasibility Technical feasibility
Research Cost 80~100 Mil. Won 300 Mil.~2 Bil. Won
Duration Less than 6 months Depending on size
(months~years)
*32 out of 33 projects appraised were deemed feasible in the period of 1994-97.10
II-2. Coverage of PFS
8
All new large-scale projects with KRW 50 billion or more are subject to PFS
Local governments and PPPs are also subject to PFS if central government subsidy exceeds KRW 30 billion
The following types of projects are exempted from PFS:
Typical building projects such as government offices and schools Legally required facilities such as sewage and waste treatment facilities
Rehabilitation and restoration projects from natural disasters Military facilities and national security projects
11

II-3. Process of PFS
9
Open review process and Multi-disciplinary PFS team
Well developed evaluation guidelines by sectors
Line
Ministries PFS
Council*
PFS
Team**
(7~8
people)
(1) Proposals (2) Select
(3) Draft
(4) Comment
(5) Final Report
MoSF PIMAC
(6) Decision
12

II-4. Analytic Hierarchy Process (AHP)
10
• Consistency with policy
directions
• Project risk (financing and
environmental impacts)
• Demand analysis
• Cost-benefit analysis
• Sensitivity analysis
• Financial analysis
Economic analysis
AHP weight: 40-50%
• Overall feasibility
• Prioritization
• Financing and policy suggestion
Analytic Hierarchy Process
• Regional backwardness
index analysis
• Regional economic impacts
A multi-criteria decision-making technique, combining quantitative and qualitative evaluations into a decision with a hierarchical structure
Policy analysis
AHP weight: 25-35%
Balanced regional
development analysis
AHP weight: 25~30%
AHP
If, AHP score ≥ 0.5, a project is appraised as feasible.
13

II-5. Results of PFS (1999-2013)
11
422 out of 665 projects(63.4%) were deemed feasible
243 (36.5%) projects were not feasible, thus cancelled
budget savings of 129.4 trillion won
14
Total Feasibility-verifies
Need mid- or long-term revise
projects cost projects cost projects cost
665 304 422(63.4%)
174.5(57.4%)
243(36.5%)
129.4(42.6%)
(Number, Trillion KRW)

Outline
I. Background
II. Preliminary Feasibility Study
III. Project Implementation and Monitoring
IV. Performance Management and Evaluation
V. Public-Private Partnerships
VI. Digital Budget and Accounting System
15

III-1. Total Project Cost Mgt(TPCM)
13
Any changes in size, costs, and time frame throughout the project cycle require preliminary consultation with MoSF
Coverage: 892 projects (254 trillion won) as of 2014
Projects whose construction period exceeds two years; and
Civil engineering projects with 50 billion won (USD 50 Mil.) or more, or architectural projects with 20 billion won (USD 20 Mil.) or more; and
Including projects implemented by local governments or private institutions that involve central government funding
Construction contingencies of up to 8% of the contract price are allowed to accommodate increased safety features and legal changes
16
PFSFeasibility
StudyBasic
DesignWorking Design
Compensation
Construction

III-2. Re-assessment Study of Feasibility(RSF)
14
Under TPCM, projects are re-assessed for their feasibility, if
TPC increases by more then 20% or
Demand forecast decreases by more than 30% according to RDF
RSF uses the same methodology and procedures as PFS
According to RSF, the project might be stop/cancelled or adjusted
RDF (Re-assessment of Demand Forecast) is conducted, when
A large scale international event or a new city development plan that is directly related to demand for a project is cancelled
An alternative way that directly competes with is suggested
5 years have passed since the latest demand forecast conducted
RSF
RDF
17

III-2. RSF Results (2003-2013)
15
18
Request After RSF Difference
Projects(A)
Cost(B)
Projects(a)
Cost(b)
Projects(A-a)
Cost(B-b)
198 90.5 159 63.8 39 26.7
(Number, Trillion KRW)
39 projects(19.7%) out of 198 are cancelled/stopped after RSF

16
III-2. RSF Results Examples Type I (cost increase)
Project : Nat’l Road #59 (Najeon~ Jinbu, 20.3 km) Improvement
Period: ‘97~15
Status: completed working design(’07.9)
Cost : $62 Mil.→237 Mil.
RSF Result(2009)
B/C : 0.08
AHP: 0.389
17
III-2. RSF Results Examples
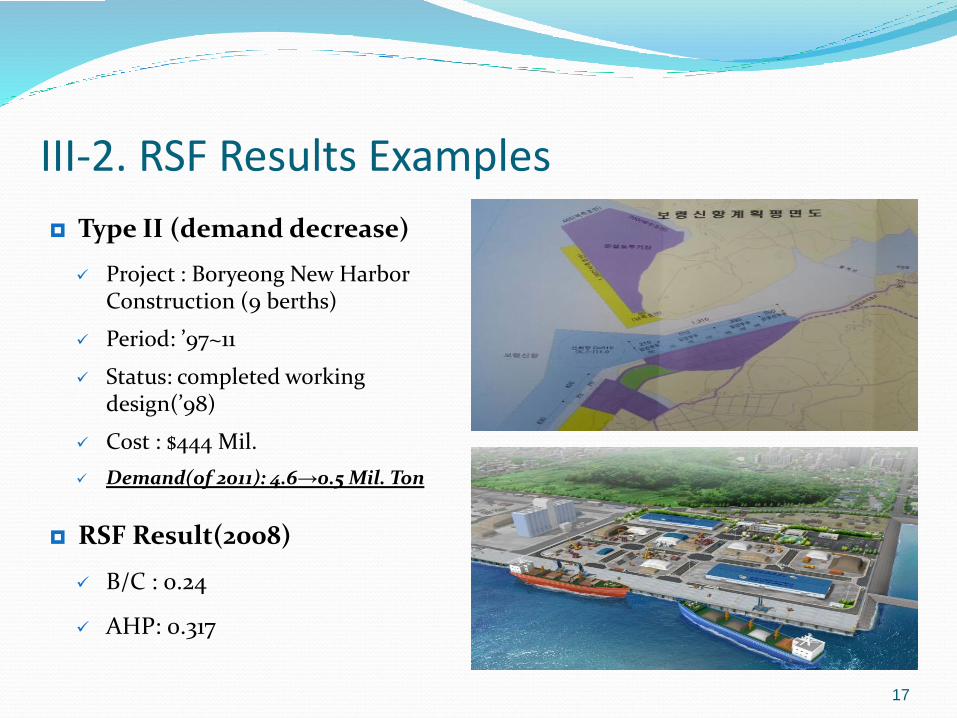
Type II (demand decrease)
Project : Boryeong New Harbor Construction (9 berths)
Period: ’97~11
Status: completed working design(’98)
Cost : $444 Mil.
Demand(of 2011): 4.6→0.5 Mil. Ton
RSF Result(2008)
B/C : 0.24
AHP: 0.317
18
III-2. RSF Results Examples
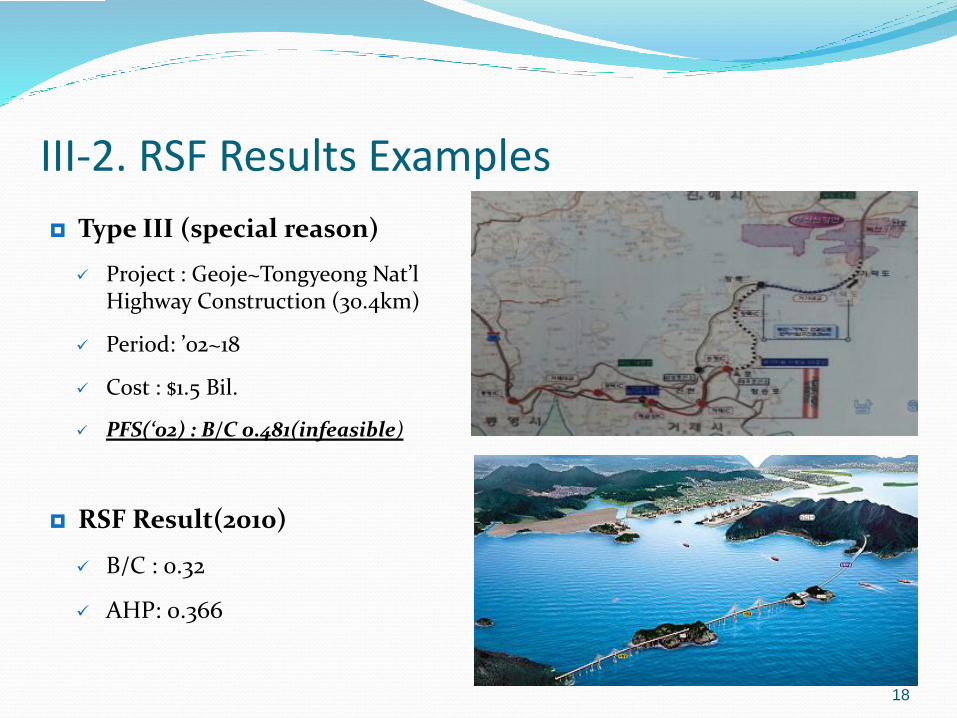
Type III (special reason)
Project : Geoje~Tongyeong Nat’l Highway Construction (30.4km)
Period: ’02~18
Cost : $1.5 Bil.
PFS(‘02) : B/C 0.481(infeasible)
RSF Result(2010)
B/C : 0.32
AHP: 0.366

III-3. Front-loading of Budget Expenditure
19
<Economic Effect of Front-loading>
22 Utilize budget expenditure as an anti-cyclical policy
In cases of a subdued economic growth in the first half and a rapid growth in the second half of the year,
Key programs/expenditures are front-loaded during the first half of year to support economic growth and stabilization
<Economic Effect of Front-loading>0
5
10
15
20
25
30
35
40
45
50
1Q 2Q 3Q 4Q
GDP growth rate w front-loading
B
A-B > 0.2%
GDP growth rate w/out front-loadingA
Budget Execution Special Inspection Meeting monitors not only Gov. but also SOE expenditures

Outline
I. Background
II. Preliminary Feasibility Study
III. Project Implementation and Monitoring
IV. Performance Management and Evaluation
V. Unified Framework with PPPs
VI. Digital Budget and Accounting System
23

IV-1. Efforts towards PB in Korea
20
2000 ~ 2002
2003 ~
2005 ~
2006 ~
Performance Budgeting (Pilot Project)- Developed Strategic Goals, Performance Objectives and Performance Indicators
Performance Goal Management System- Expanded “Performance Budgeting” to all ministries and agencies- Annual performance plan and report are required
Self-Assessment of Budgetary Program (SABP)- 1/3 of major budgetary programs are evaluated every year- results will be reflected in the formulation of MTEF and annual budget- Ineffetive projects are subject to at least 10% budget cut or project cancel.
In-Depth Evaluation- Selected programs are subject to program evaluation- About 10 programs are subject to program evaluation every year
24

IV-2. Ex-post Performance Evaluation(PE)
21
Construction projects with TPC of 30 billion won or more are subject to PE within three years of construction completion
Analyses of PE include:
Comparison and analysis of construction cost and time;
Comparison between forecasted demand and actual demand;
Feedback to future projects
Should refer to PE reports in working out basic plan of similar project
The difference between expected and actual demand should be informed to the technology service company which estimated demand
25

Outline
I. Background
II. Preliminary Feasibility Study
III. Project Implementation and Monitoring
IV. Performance Management and Evaluation
V. Public-Private Partnerships
VI. Digital Budget and Accounting System
26

V-1. Active in PPPs Performance of PPPs(1994~2014)
27
22
(Number, Trillion Won)
BTO BTL Total
• Operation 163(44.5) 408(22.4) 580 (68.2)
• Under Construction 30 (16.6) 31(5.3) 63 (22.4)
• Under Preparation 20 (8.4) 13(0.8) 34 (9.4)
Total 213 (69.5) 452 (28.5) 677 (100.0)
PPP taking up around 10% of Gov. investment in SOC
1,52,8 2,7 2,7
0,8
5,1 5
2,8
5,4 5,6
8,16,1
11,29,7 9,2
7,6
4,8 5,23,6
02468
1012
199
5
199
6
199
7
199
8
199
9
200
0
200
1
200
2
200
3
200
4
200
5
200
6
200
7
200
8
200
9
2010
2011
2012
2013
(Trillion Won)

AHP ≥0.5
PFSTraditional
Procurement
PPPs (BTO)
PPPs (BTL)
VFM>0
User-fee applicableCancel
NoYes
No
Yes
No
Yes
28
First Stage of Test(Economic Feasibility)
Second Stage of Test(Suitability for PPPs)
PPP is one of Procurement Option
Korea has a unified project selection framework for both PPPs and traditionally implemented projects
23
V-2. Unified Framework

Outline
I. Background
II. Preliminary Feasibility Study
III. Project Implementation and Monitoring
IV. Performance Management and Evaluation
V. Public-Private Partnerships
VI. Digital Budget and Accounting System
29

24
Users
Policy
Decision
Maker
Public
officials
People
Central Finance Information SystemFIscal Work
Support System
Homepage
Fiscal
Portal
Electronic
Approval
Budget
5-year
Fiscal Plan
Budget
Compilation
Budget
Allocation
Total
Program
Expense
Preliminary
Feasibility
BTL/BTO
program
Registration
Performance
Management
program
Execution
Completion of
program
Individual Program
Monitoring
Execution
Monitoring
Performance
Monitoring
Accounting
National
Properties/
Inventories
AR/AP
Fund
Settlement/
Cost
Revenue/
Expenditure
EBPP/EFT
Program Management
Statistical Analysis System
OLAPfiscal
EIS
DM
Budget
DW
Fund
Assets
Debt
Accounting
EDW
Budget
Accounting
Program
Management
Fiscal
Range
Fiscal
Scope
Meta Data
Related System
Local Government
Finance
Local Education
Finance
Public Entities and
Affiliated Organizations
Board of Audit and
Inspection of Korea
Business Reference
Model (BRM)
VI. Digital Budget and Accounting System
Integrate and analyze the whole process of fiscal activities