Embed Size (px)
Citation preview

Seoul National UnivSeoul National UnivUAW2008UAW2008
An assessment of uncertainties An assessment of uncertainties in the estimation of dust emission in the estimation of dust emission rate due to vegetationrate due to vegetation
2008. 7. 2Eunjoo Jung & Soon-Chang Yoon
School of Earth and Environmental SciencesSeoul National University

Seoul National UnivSeoul National UnivUAW2008UAW2008
1. PurposePurpose - Improvement of dust emission scheme by evaluating uncertainties in dust emission estimation due to vegetation 2. MethodMethod - Sensitivity tests of dust emission scheme - Numerical simulation of East Asian dust event in Mar. 2004 using regional-scale dust transport model3. ValidationValidation - PM10, LIDAR - WMO SYNOP observations4. Discussion and conclusionDiscussion and conclusion
OutlineOutline
Seoul National UnivSeoul National UnivUAW2008UAW2008
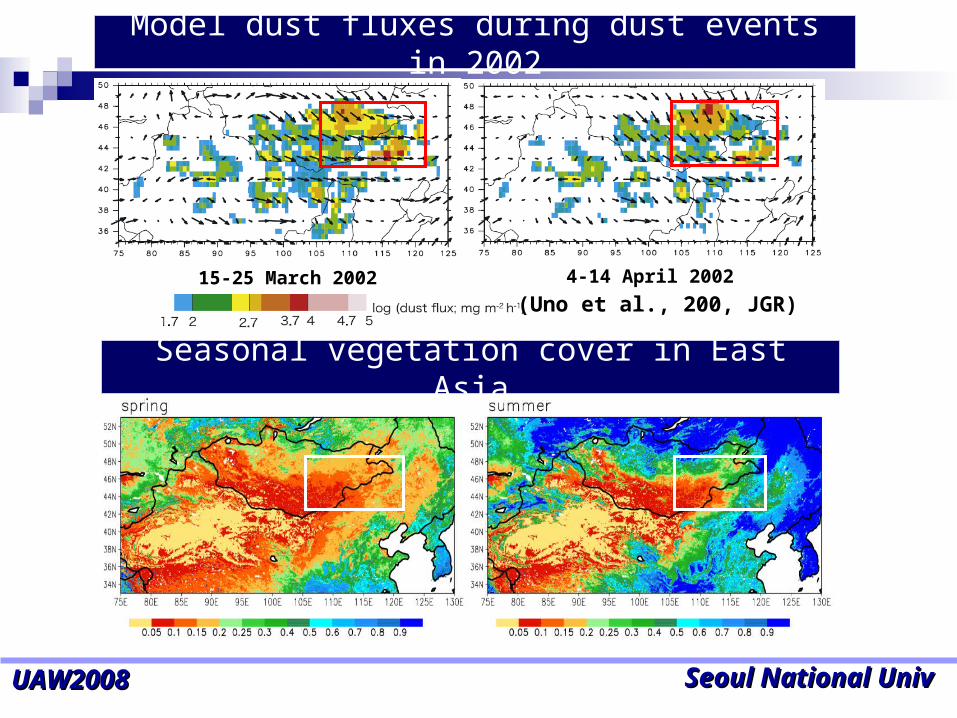
Model dust fluxes during dust events in 2002
Seasonal vegetation cover in East Asia
15-25 March 2002 4-14 April 2002
(Uno et al., 200, JGR)

Seoul National UnivSeoul National UnivUAW2008UAW2008
Drag partition schemeDrag partition scheme
n : number of roughness elementsb : mean breadth of roughness elementsh: mean height of roughness elementsS: ground area
: frontal area index
S
nbh
h
b
where : the ratio of the drag coefficient for an roughness element, CD to that for the ground surface, CS having no roughness element
where : total wind shear stress acting on ground area S R: a part of acting on the roughness elements averaged over S S: a part of acting on the bare surface averaged over S
SSRCC SD
s
)/(1
1(Raupach et al.,1993)(Raupach et al.,1993)
SR
Seoul National UnivSeoul National UnivUAW2008UAW2008
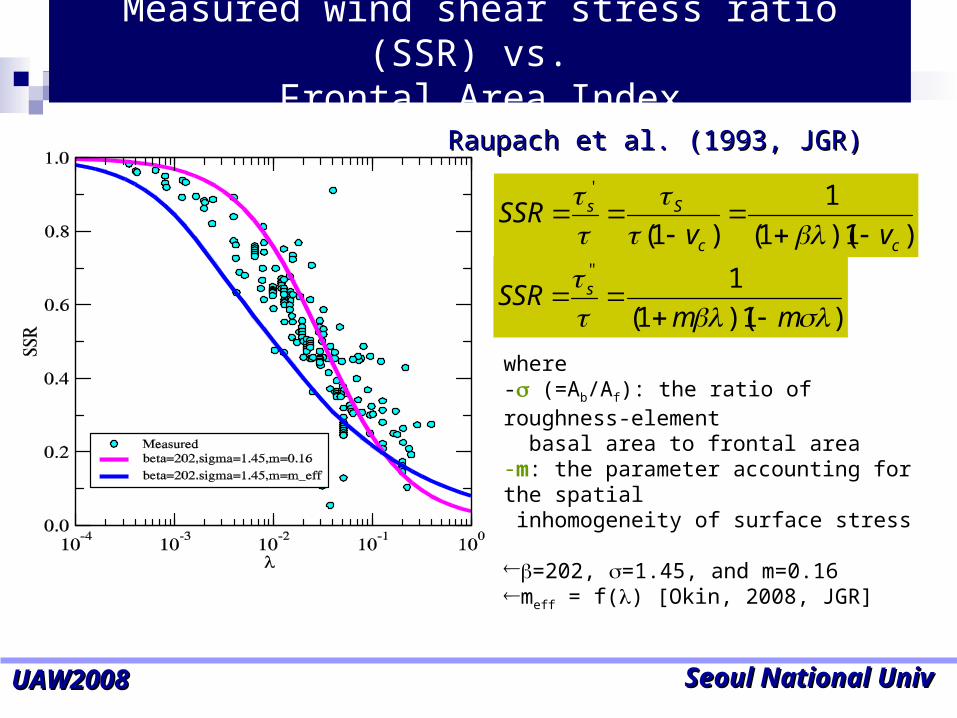
where - (=Ab/Af): the ratio of roughness-element basal area to frontal area-m: the parameter accounting for the spatial inhomogeneity of surface stress
=202, =1.45, and m=0.16meff = f() [Okin, 2008, JGR]
Measured wind shear stress ratio (SSR) vs. Frontal Area Index
)1)(1(
1"
mmSSR s
Raupach et al. (1993, JGR)Raupach et al. (1993, JGR)
)1)(1(
1
)1(
'
cc
Ss
vvSSR

Seoul National UnivSeoul National UnivUAW2008UAW2008
Dependence of streamwise sand flux on SSR
(Lancaster and Baas,1998: 0.38<u*<0.62m/s)
),1979,(11),(2*
2*
*
*3*** JGRWhite
u
u
u
uug
uuQ tststS
)(**
* fu
SSR
uu ttts
Q: streamwise sand flux in [ML-1T] u*t: threshold friction velocity for a smooth surfaceu*ts: threshold friction velocity for a rough surface with roughness elements

Seoul National UnivSeoul National UnivUAW2008UAW2008
The effect of vegetation on vertical dust flux
Two field measurements 1. Gillette (1977): bare crusted soil in Texas 2. Nickling and Gillies (1993):various vegetation types in Mali, West Africa Dust emission scheme (Shao, 2004) F(d, D, u*)=cyf(d)[(1-)+p](1+m)(g/u*
2)Q(u*,D,)

Seoul National UnivSeoul National UnivUAW2008UAW2008
Model: regional-scale dust model (Shao et al., 2002) - Horizontal resolution: 50 km x 50 km - Vertical resolution: 25 levels Period - Asian dust event during 7-11 March, 2004 Data - Atmospheric data interpolated from CMA T213 analysis - GIS data with horizontal resolution of 5km x 5km Experimental Design
Validation - PM10, LIDAR, WMO SYNOP observations
Numerical simulation of a dust event in Mar. 2004
Experiment m=0.16 m=m_eff
Frontal Area Index data1 EXP1A EXP1B
Frontal Area Index data2 EXP2A EXP2B

Seoul National UnivSeoul National UnivUAW2008UAW2008
T
G
BTUHu Ho
Spatial distribution of vegetation cover and frontal area indices in East Asia
T: the Taklamakan desertG: the Gobi desertBTU: sandy deserts in N ChinaHu: Hunshandake desertHo: Horqin desert

Seoul National UnivSeoul National UnivUAW2008UAW2008
NCEP MSLP reanalysis and dust weather codes during the Asian dust event
LL
HH
LL
LL
LL
LL

Seoul National UnivSeoul National UnivUAW2008UAW2008
Simulated vs. measured PM10

Seoul National UnivSeoul National UnivUAW2008UAW2008
Time-height cross section of model PM20vs. LIDAR in Beijing

Seoul National UnivSeoul National UnivUAW2008UAW2008
Comparison of model dust fluxes
Experiment
Area-averaged
(95-125E,38-48N)
Emission rate (g/m2/s)
Area-averaged
(95-125E,38-48N)
Dry deposition rate (g/m2/s)EXP1A 104.6 94.8EXP1B 76.0 ( -27.4%) 68.8 (-27.4%)EXP2A 122.2 (+16.8%) 112.2 (+18.4%)EXP2B 97.3 ( +7.0%) 89.4 ( -5.6%)

Seoul National UnivSeoul National UnivUAW2008UAW2008
model dust emission rates vs. friction velocity

Seoul National UnivSeoul National UnivUAW2008UAW2008
Spatial distribution of threshold friction velocity

Seoul National UnivSeoul National UnivUAW2008UAW2008
Conclusion
The dust transport model predicted well the dust event during 9-11 March 2004.
Comparison of the four simulations shows significant differences in dust fluxes from 7% to 61% each other.
It is essential to quantitatively estimate the non-uniformity of wind shear stress for different vegetation types and vegetation covers
It is desirable to replace frontal area index with a more directly measurable quantity such as vegetation cover.

Seoul National UnivSeoul National UnivUAW2008UAW2008
Thank you!!

Seoul National UnivSeoul National UnivUAW2008UAW2008
Source of uncertainties due to vegetation in dust emission scheme
1. Estimation of vegetation cover, vc, from MODIS/Terra fPAR (fraction of Photosynthetically Active Radiation)
based on Darke et al. (1997) and Wittich & Hansing (1995)
2. Estimation of frontal area index, , as a function of vegetation cover, vc, following (Shao, 2000) = - C ln(1-vc) where C is dependent on vegetation type (desert, grass, shrubs, crops, trees)
3. Non-uniformity of wind shear stress, m SSR = [(1+m)(1-m)]-1/2