Embed Size (px)
Citation preview
Report No. SAIC-TN-99020
Evaluation of Trapped Radiation
Model Uncertainties for
Spacecraft Design
Prepared by
T. W. Armstrong and B. L. Colbom
Science Applications International Corporation (SAIC)
Prepared for
NASA Marshall Space Flight Center
Space Environments and Effects (SEE) Program OfficeHuntsville, Alabama
Contract No. NAS8 - 40294
Draft Report September 1999
Final Report February 2000
https://ntrs.nasa.gov/search.jsp?R=20000021571 2018-06-13T19:39:54+00:00Z
Table of Contents
11. Introduction and Summary ........................................................................................
1.1 Background ............................................................................................. 1
11.2 Study Objectives .....................................................................................
1.3 Study Products ........................................................................................ 2
1.4 Summary Conclusions for Design Applications ..................................... 2
52. Approach ...................................................................................................................
2.1 Flight Data ............................................................................................... 5
2.2 Models ..................................................................................................... 9
3. Trapped Proton Model Uncertainties ...................................................................... 10
3.1 Model-Data Comparisons .................................................................... 10
3.2 Model Uncertainty Dependence on Solar Cycle ................................. 16
3.3 Model Uncertainty Dependence on Proton Energy ............................. 16
3.4 Model Uncertainty Dependence on Radiation Effect .......................... 20
3.5 Discussion ............................................................................................ 20
3.6 Conclusions ......................................................................................... 25
4. Trapped Electron Model Uncertainties .................................................................... 27
4.1 Model-Data Comparisons 27
4.2 Discussion ............................................................................................ 37
4.3 Conclusions ......................................................................................... 42
5. References ............................................................................................................... 45
Evaluation of Trapped Radiation Model
Uncertainties for Spacecraft Design
1. Introduction and Summary
1.1 Background
Trapped radiation models which describe the characteristics of protons and
electrons in the Van Allen belts are essential in addressing numerous Earth-orbit
spacecraft and mission design issues related to the ionizing radiation environment, such as
parts selection and placement, component lifetimes, performance degradation, and orbit
parameters to minimize risk. The de-facto standard models used internationally for
predicting trapped radiation environments (AP8 for protons and AE8 for electrons,
developed by Vette and colleagues [1-3]) are based on old and incomplete flight data
collected 2-3 decades ago.
While new models are needed, it is expected to be some time before sufficient
flight data are available to allow new models to be generated with the general capabilities
in terms of complete inclination and altitude coverage as currently provided by AP8 and
AE8. In the meantime, designers are confronted with specifying spacecraft and mission
requirements and radiation designs using AP8 and AE8, which do not reflect what has
been learned from trapped radiation flight measurements during the past decade or longer.
1.2 Study Objectives
The objectives of the present work are: (a) to evaluate AP8 and AE8 model
uncertainties based on comparisons with various sets of recent satellite data, and (b) to
derive "empirical correction factors" which designers can apply to AP8 and AE8 results
so that the models will be more consistent with recent flight data. Thus, the aim is to
distill from various flight observations and publications simple model correction factors
that have adequate accuracy for engineering-type applications and can be readily applied
by the spacecraft designer.
1.3 StudyProducts
In this report a summaryof AP8 andAE8 modelcomparisonswith flight data is
given,mainly in termsof measured-to-predictedratios for variousorbit inclinationsand
altitudes. Valuesfor the modelpredictionsand flight dataandadditionaldetailsof the
model-datacomparisonsare given in a companionreport [4]. Also included in the
companionreport aremodel-modelcomparisonsfor the standardAP8 and AE8 models,
the EuropeanSpaceAgency versionsof AP8 and AE8, and Russiantrappedradiation
models. In addition, as part of the presentstudy ionizing radiation environmentsand
effectsfrom Russiansatellitemeasurementswere assimilatedand assessmentsmadeon
thesuitabilityof thesedatasetsfor AP8 andAE8 modelvalidationapplications[5].
Another product from this study is the TRAP/SEEcode,a PC version of the
standardand EuropeanSpaceAgency versions of the AP8 and AE8 models with a
convenientuserinterface,an accurateorbit codefor treatinghighly elliptical aswell as
circular orbits, and user documentation[6]. (The code is available from the Space
Environments and Effects Program Office, NASA Marshall Space Flight Center,
http://see.msfc.nasa.gov/.) Factors which can influence the predictions made using
different implementations of the AP8 and AE8 models are discussed in [6].
1.4 Summary Conclusions for Design Applications
While current flight data available for model comparisons are not sufficiently
complete to quantify model uncertainties for all orbit environments, radiation effects, and
extreme geomagnetic activity conditions of interest, there are two cases, described below,
where sufficient data are available to provide definitive model uncertainty estimates.
Model correction factors for these two cases are considered sufficiently accurate that they
can be applied in spacecraft design applications and in setting radiation design margins.
1.4.1 AP8 Model for Low Altitude Orbits
From comparisons of the AP8 trapped proton model with several sets and types of
flight data (flux, dose, and activation) at low altitudes (below about 2000 km, where most
of the flight data are available for comparison), it is found that the AP8 model
underpredicts by about a factor of 2. By multiplying the AP8 model output fluxes by a
factorof 2, the resultingcorrectedmodelpredictionsarewithin about+ 25% of the flight
data, as discussed in Sec. 3.1.1. This empirical factor of 2 correction applies to both
AP8M1N and AP8MAX predictions and is independent of proton energy (at least for
energies above about 15 MeV, the energy range where model checks against flight data
have been made).
This factor of 2 correction applies, of course, only for situations where the AP8
model is used within the inherent limitations of the model; these limitations are
summarized in Sec. 3.5.3. In particular, this correction factor is not generally applicable
for short duration flights such as the Space Shuttle, as shown in Sec. 3.5.2.
1.4.2 AE8 Model at High Altitudes
The AE8 trapped electron model clearly overpredicts the electron fluxes in the
outer electron belt. During periods of normal geomagnetic activity, the overprediction is a
factor of 5 tol0 in the peak regions of the outer belt and a factor of 10 to 100 in the outer
regions of the belt (which includes geosynchronous satellite altitudes). The AE8 model
overprediction is so large that electron fluxes in the outer belt are still overstimated even
for highly enhanced transient flux conditions caused by large geomagnetic disturbances
(Sec. 4.1.3).
1.4.3 Other Cases
For other cases (AP8 at high altitudes, AE8 at low altitudes, quiet vs. active
geomagnetic conditions), some flight data are available that provide insight on model
uncertainties, but the data-model comparisons are not considered sufficiently complete to
extract definitive model uncertainty factors. These comparisons are discussed in Secs.
3.1.2 and 3.6.2 for protons at high altitudes, in Secs. 4.1.1 and 4.2 for electrons at low
altitudes, and the influence of high geomagnetic activity is discussed in Secs. 3.6.2, 4.1.1,
4.1.3, and 4.2.
1.4.4 Implications for Spacecraft Design
A common procedure used in designing spacecraft to withstand the trapped proton
environment has been to use the AP8 model for environment predictions and then apply a
designmargin(commonlya factor of 2) to the AP8 output spectrafor use in predicting
radiationeffects. TheresultshereshowthattheAP8 flux predictionsarea factorof 2 too
low. Thus, using the common procedure the design margin is consumed by the AP8
model error. The results here suggest that a factor of 2 correction to the AP8 results
should be applied and then a design margin applied.
The large AE8 model overpredictions can have important consequences related to
spacecraft design. For example, if designers use the standard AE8 output, and then apply
conservative safety factors to the environment predictions, which is a common procedure,
then the radiation requirements most likely will be significantly overestimated for most
radiation effects - e.g., the use of radiation hardened parts may be indicated but not
actually needed.

2. Approach
2.1 Flight Data
Summarized below are features and application limitations of the data sets which
have been used in evaluating AP8 and AE8 model uncertainties.
2.1.1 CRRES
The Combined Release and Radiation Effects Satellite (CRRES) made several
types of radiation measurements in a geosynchronous transfer orbit (18.2 ° inclination, 327
km perigee, 33,575 km apogee) over a 14 month period (July 1990 to October 1991)
during the maximum of Solar Cycle 22 [7, 8]. A unique feature of the CRRES data is that
during the mission (23-31 March 1991) an extraordinarily large geomagnetic storm
occurred in conjunction with an intense solar proton event, resulting in a strong shock
front hitting the magnetosphere and greatly enhanced radiation belt fluxes, which
gradually decayed over a year or so. Thus, CRRES data are available for a "quiet"
magnetic activity period of 8 months prior to the storm and an "active" period of high
magnetic activity and enhanced flux levels for 6 months after the storm. We have used
the following four data sets from the CRRES mission for model comparisons.
Space Radiation Dosimeters
These detectors measured the dose in silicon semiconductors under aluminum
hemispheres having four different thicknesses (0.57, 1.59, 3.14, and 6.08 g/cm2),
corresponding to energy thresholds of 1, 2.5, 5, and 10 MeV for electrons and 20, 35, 50,
and 75 MeV for protons [9]. Dose contributions were obtained separately for low LET
particles (protons > 100 MeV, electrons, and bremsstrahlung) and high LET particles (20
- 100 MeV protons and > 5 MeV electrons).
The CRRES dose values compared with here were generated using the
CRRESRAD software package [10] from Phillips Laboratory (Hanscom AFB) in which
the flight data have been organized in B/Bo and L coordinates so that orbit-average doses
for different orbit parameters can be determined. Although the CRRES orbit perigee was
350 km, statistics at the lowest altitudes are poor, and the data are applicable only for
altitudesaboveabout800km. Thedataaremostaccuratefor inclinationsbelowabout30°
(magnetic), but CRRESRAD can be applied for higher inclination orbits for the thicker
shielding t,3.14 and 6.08 g/cm 2) where the dose is dominated by protons [10].
PROTEL Detector
A proton telescope (PROTEL) detector on CRRES measured protons in the 1-100
MeV range in 24 energy steps [11]. Corrections to the data were made to remove
contamination by out-of-aperture protons slowing down and being counted. These
corrections become increasingly less reliable for altitudes below 2500 km [11], so we
have used PROTEL data only down to 1500 km. As with the CRRES dose rate, a
PROTEL data base in B/Bo - L space has been generated by Phillips Laboratory and
incorporated in a software package called CRRESPRO [12] for determining proton flux
for other orbits. The CRRESPRO code, which is applicable for all inclinations, was used
here for the comparisons with CRRES proton measurements.
HEEF Detector
The High Energy Electron Fluxmeter (HEEF) detector on CRRES measured
electrons in 10 energy intervals from 0.5 to 6.60 MeV. The software utility CRRESELE
[13] was used here to access the measurement data base and compute orbit average fluxes
at different altitudes. These electron measurements are limited to the outer zone electron
belt in the region from about L = 2.5 to 6.80. To provide information on flux
enhancement dependence on magnetic activity level, the fluxes in the CRRESELE data
bases are separated into bins according to Apl5, a 15-day running average of the 3-hour
Ap magnetic activity index.
MEA Detector
The Medium Electron A (MEA) electron spectrometer on CRRES measured outer
zone electrons in the energy range from 90 keV to 1.7 MeV. Vampola [14] has extended
the energy range up to 7 MeV and down to 40 keV using OVI-19 satellite data and
incorporated this CRRES mission average data into a model called ESA-SEE1. This
model was then included in an updated version of the RADMODLS code [15] so that
,rageelectronspectrain the outer zonecanbe calculatedusing the ESA-SEEI
lsedon MEA datawith OVl-19 energyextrapolationinsteadof AES. We have
DMODLS with the ESA-SEE1databaseto compareouterzone electronfluxes
8 predictionsand with CRRESELEcalculationsbasedon the CRRES HEEF
tit.
as flown
km, 99 °)
Electron
;hields of
•1.2 APEX
he Advanced Photovoltaic and Electronics Experiments (APEX) satellite was
ml from August 94 to June 96 (near solar minimum) in an elliptical 362 km x
orbit at 70 ° inclination [16]. APEX carried radiation detectors for silicon dose
nents of the same design as described above for CRRES except that on APEX the
with thinnest shielding was a slab of aluminum 4.29 mils (0.0294 g/cm 2) thick.
r three detectors on APEX had hemispherical aluminum shields like on CRRES
:knesses of 0.57, 1.59, and 3.14 g/cm 2. The energy thresholds for particles
ag the shielding and being detected are, in order of increasing shielding
;, 0.15, 1.0, 2.5, and 5.0 MeV for electrons, and 5, 20, 35, and 52 MeV for
At higher inclinations and thin (< 1 g/cm 2) shielding, dose from the "horns" of
zone electrons, which can have high variability depending on magnetic activity,
ignificant contribution to the dose. Thus, the APEX dose data have been binned
als according to the magnetic activity index Apl5. We have determined dose
the altitude range 300 - 2000 km and at various inclinations from APEX
nents by using the APEXRAD software utility [17].
1.3 DMSP
he Defense Meteorological Support Program (DMSP) F7 satellite (840 km, 98.80
,n) also carried a version of the Space Radiation Dosimeter as on CRRES and
r measuring silicon dose. The hemispherical aluminum shielding thicknesses for
detectors (0.55, 1.55, 3.05, and 5.91 g/era 2) are only slightly different than used
_S. Measurements have been made during the 1984 - 1987 solar minimum. Here
used DSMP dose values quoted in the literature [18].
3m seven
This data
)RTRAN
:alculated
,ns using
e [21], to
lmost six
ironment
insertion,
radiation
.ons with
ments by
:tivation)
[23, 24].
.'d proton
.q of the
edictions
the AP8
and [24],
2.1.6 Shuttle
ExtensiveLEO radiationdosedataareavailablefrom measurementsmadeon the
SpaceShuttle,andwehavemadepredictionsto comparewith thedosemeasurementsfor
63 Shuttle flights at low- (28.5°) andmid- (51.6°, 57°) inclinations in the altitude range
from about 300 - 600 km [4]. These comparisons are discussed in Sec. 3.5.
2.2 Models
Flight data are compared here with predictions made using the Vette, et al. [1-3]
trapped proton models for solar minimum and maximum, AP8MIN and AP8MAX, and
trapped electron models at solar minimum and maximum, AE8MIN and AE8MAX, as
implemented in software packages at NASA MSFC. The magnetic field models used are
the 80-term International Geomagnetic Reference Field for 1965.0 [25] projected to 1964
for solar minimum calculations and the U.S. Coast and Geodetic Survey 168-term
geomagnetic field model for 1970 [26] for solar maximum calculations. The magnetic
moment is calculated from the field model expansion coefficients for the epoch of the
field. The B and L calculations are made using the ALLMAG code and associated
subroutines [27]. These models are coupled with the MSFC orbit code written by Burrell
[21] to obtain orbit-average flux spectra. Dose calculations have been made using the
Shieldose-2 code [28]. In comparing with hemispherical shield detectors, we have used
one-half the calculated dose at the center of a spherical aluminum shield with 4n steradian
incident flux.
3. Trapped Proton Model Uncertainties
3.1 Model-Data Comparisons
3.1.1 Low Altitudes
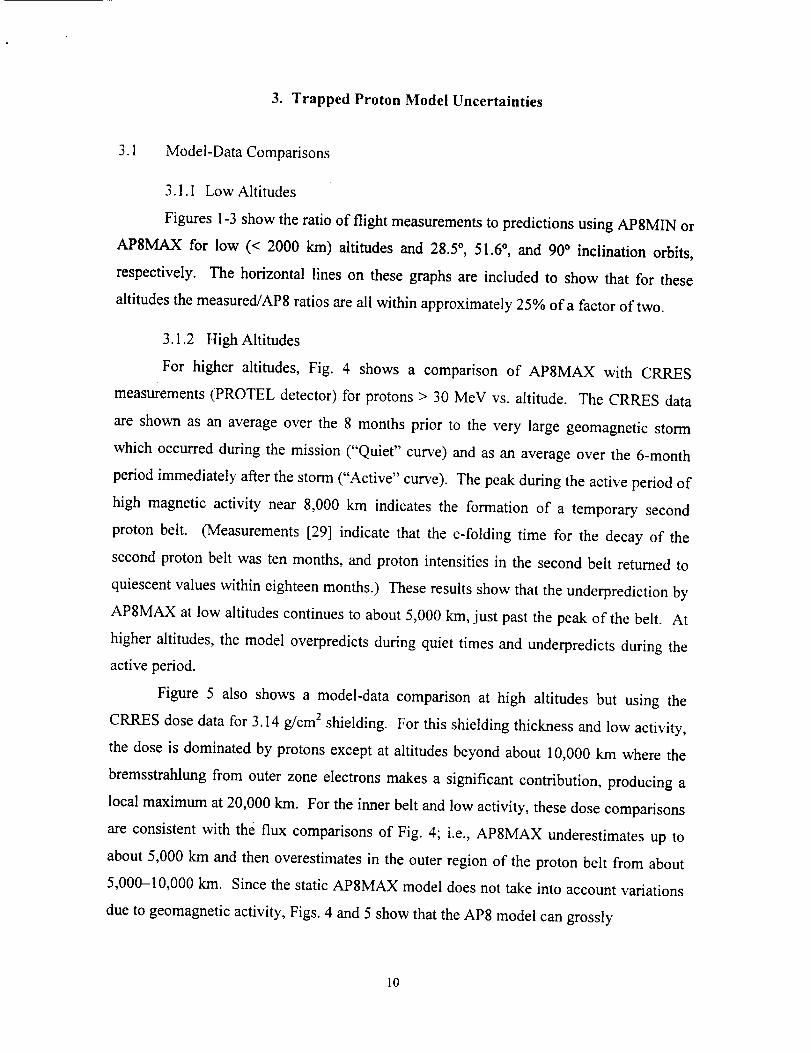
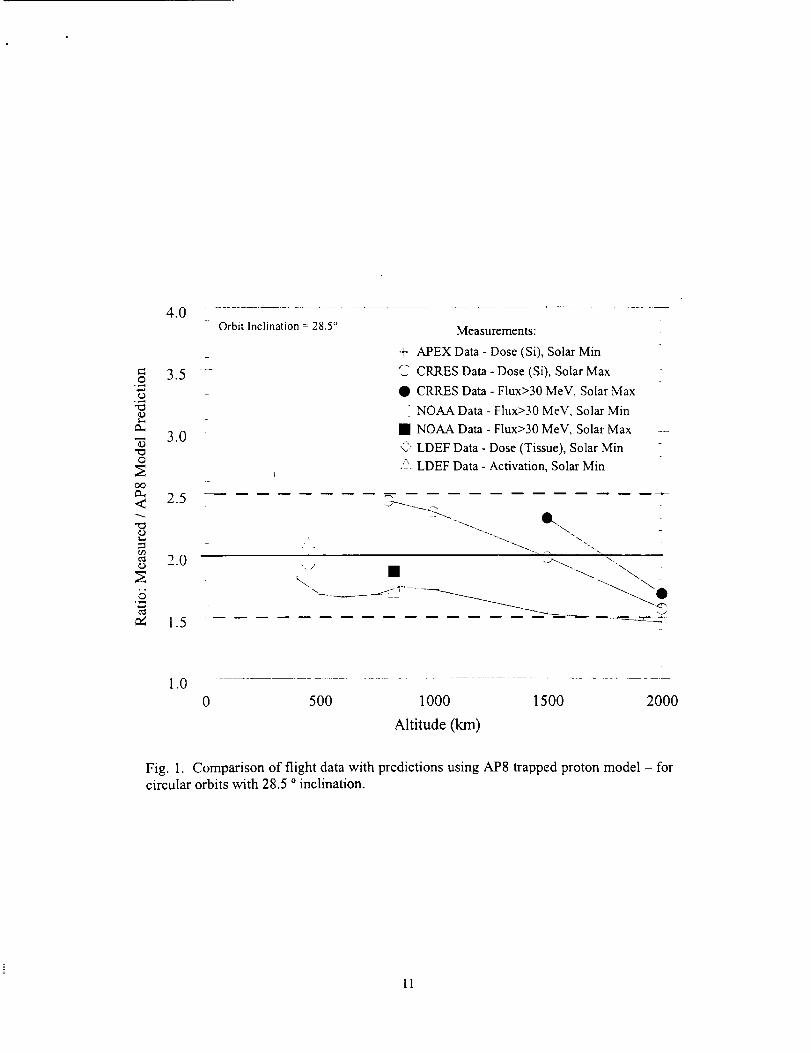
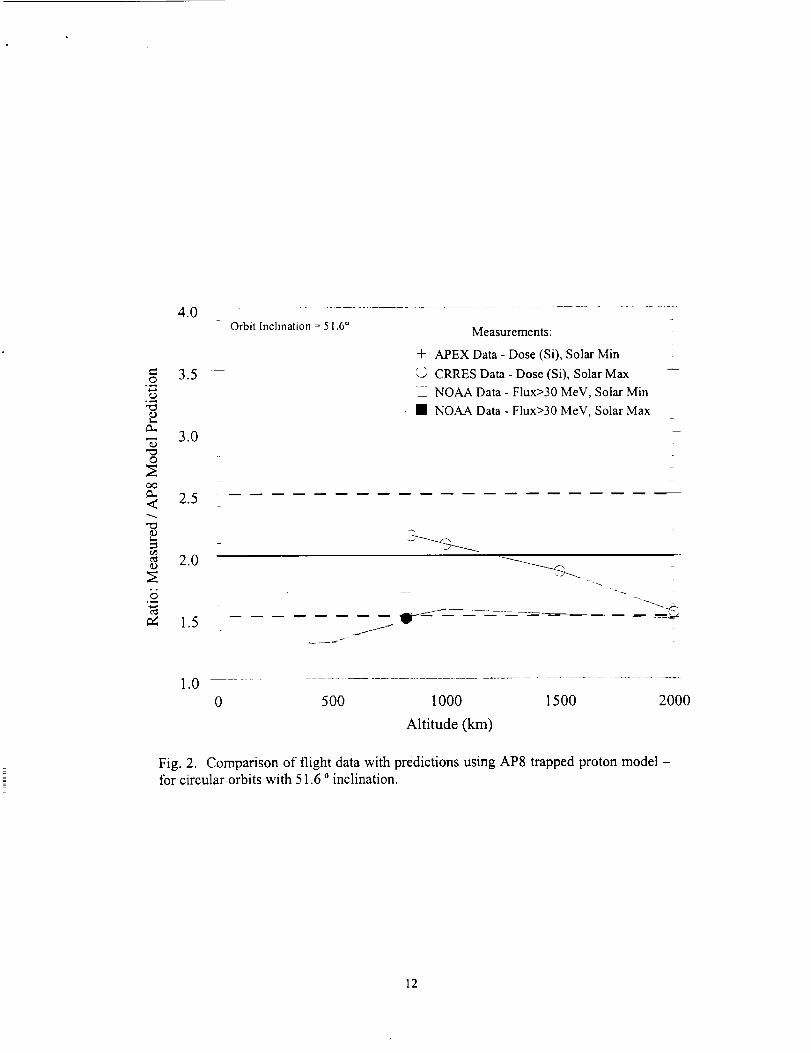
Figures 1-3 show the ratio of flight measurements to predictions using AP8MIN or
AP8MAX for low (< 2000 km) altitudes and 28.5 °, 51.6 °, and 90 ° inclination orbits,
respectively. The horizontal lines on these graphs are included to show that for these
altitudes the measured/AP8 ratios are all within approximately 25% of a factor of two.
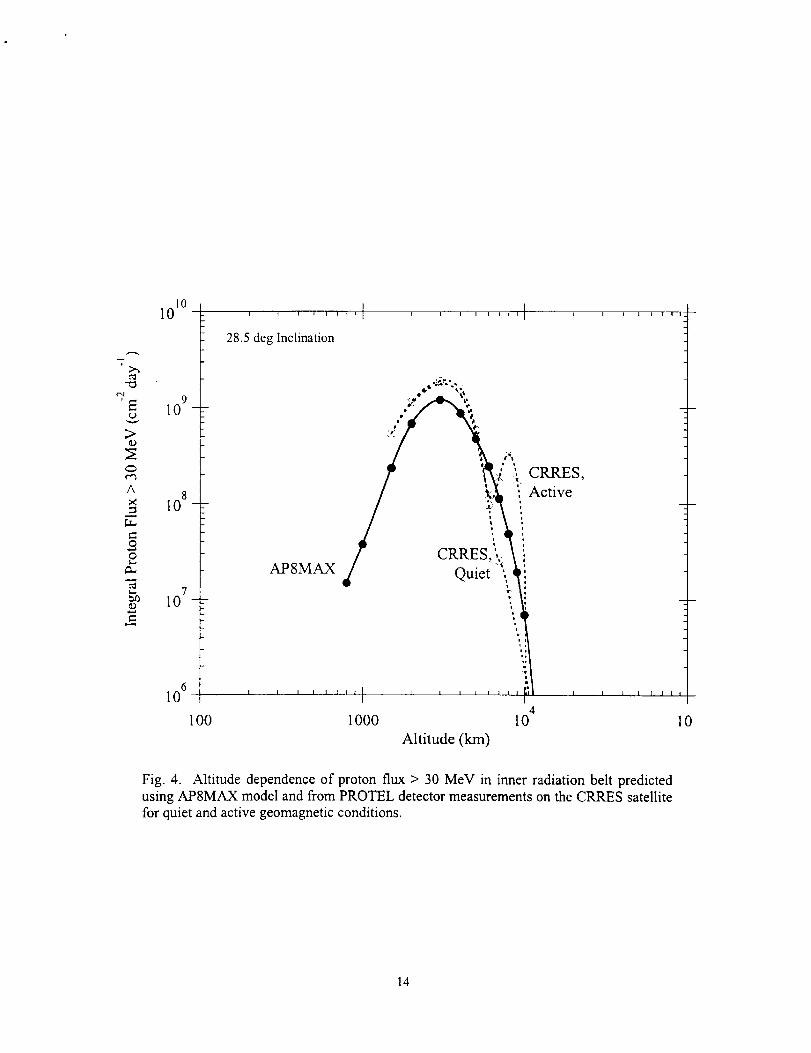
3.1.2 High Altitudes
For higher altitudes, Fig. 4 shows a comparison of AP8MAX with CRRES
measurements (PROTEL detector) for protons > 30 MeV vs. altitude. The CRRES data
are shown as an average over the 8 months prior to the very large geomagnetic storm
which occurred during the mission ("Quiet" curve) and as an average over the 6-month
period immediately after the storm ("Active" curve). The peak during the active period of
high magnetic activity near 8,000 km indicates the formation of a temporary second
proton belt. (Measurements [29] indicate that the e-folding time for the decay of the
second proton belt was ten months, and proton intensities in the second belt returned to
quiescent values within eighteen months.) These results show that the underprediction by
AP8MAX at low altitudes continues to about 5,000 km, just past the peak of the belt. At
higher altitudes, the model overpredicts during quiet times and underpredicts during the
active period.
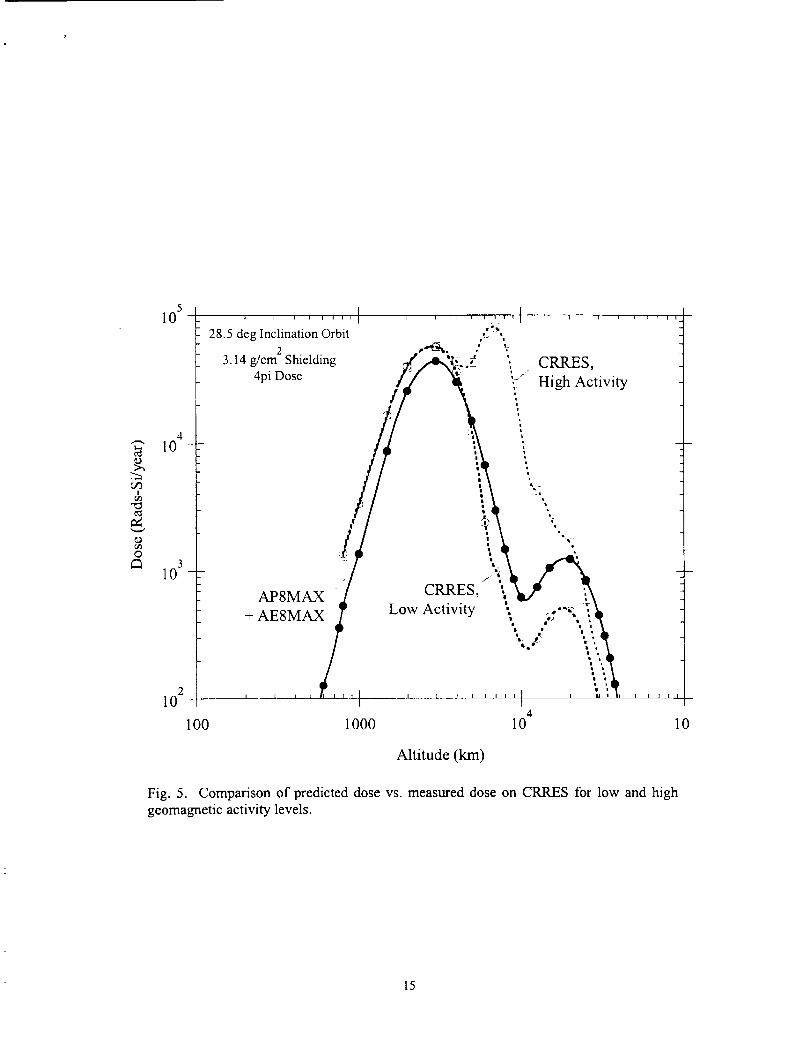
Figure 5 also shows a model-data comparison at high altitudes but using the
CRRES dose data for 3.14 g/cm 2 shielding. For this shielding thickness and low activity,
the dose is dominated by protons except at altitudes beyond about 10,000 km where the
bremsstrahlung from outer zone electrons makes a significant contribution, producing a
local maximum at 20,000 km. For the inner belt and low activity, these dose comparisons
are consistent with the flux comparisons of Fig. 4; i.e., AP8MAX underestimates up to
about 5,000 km and then overestimates in the outer region of the proton belt from about
5,000-10,000 km. Since the static AP8MAX model does not take into account variations
due to geomagnetic activity, Figs. 4 and 5 show that the AP8 model can grossly
10
o
o
oo
.0 .............
Orbit Inclination = 28.5 °
3.5
3.0
Measurements:
+ APEX Data - Dose (Si), Solar Min
'- CRRES Data - Dose (Si), Solar Max
• CRRES Data - Flux>30 MeV, Solar Max
NOAA Data - Flux>30 MeV, Solar Min
• NOAA Data - Flux>30 MeV, Solar Max --
C'_LDEF Data - Dose (Tissue), Solar Min
2'. LDEF Data - Activation, Solar Min
2.5
L<
o,2/,..,
o:l
_5
1.0
0 500 1000 1500 2000
Altitude (km)
Fig. 1. Comparison of flight data with predictions using AP8 trapped proton model - forcircular orbits with 28.5 ° inclination.
11
O
O
oo
<
ill
b
4.0
3.5
3.0
2.5
2.0
1.5
Orbit Inclination = 51.6 ° Measurements:
+ APEX Data - Dose (Si), Solar Min
"-..5CRRES Data - Dose (Si), Solar Max
_ NOAA Data - Flux>30 MeV, Solar Min
• NOAA Data - Flux>30 MeV, Solar Max
J
1.0
500 1000 1500 2000
Altitude (km)
Fig. 2. Comparison of flight data with predictions using AP8 trapped proton model -for circular orbits with 51.6 ° inclination.
12
O
k-q
e_
O
<
0_
_5
4.0
3.5
3.0
2.5
2.0
1.5
Orbit Inclination = 90 °
r
Measurements:
+ APEX Data - Dose (Si), Solar Min
(? CRRES Data - Dose (Si), Solar Max
• CRRES Data - Flux>30 MeV, Solar Max
NOAA Data - Flux>30 MeV, Solar Min
• NOAA Data - Flux>30 MeV, Solar Max
Z'. DMSP Data - Dose(S0, Solar Min
1.0o 500 1000 1500 2000
Altitude (kin)
Fig. 3. Comparison of flight data with predictions using AP8 trapped proton model - forcircular orbits with 90 ° inclination.
13
-7
¢-q
'E
>ID
¢q
A
o
1010
910 -
810 -
710 -
I
28.5 deg Inclination
APSMAX
II I I I t I I I
I
t
i
CRRES,\.Quiet
Altitude (km)
10
Fig. 4. Altitude dependence of proton flux > 30 MeV in inner radiation belt predictedusing AP8MAX model and from PROTEL detector measurements on the CRRES satellitefor quiet and active geomagnetic conditions.
14
10 5
4
10 -
o
10 3 -
210
100
, , , ' ' ' ' ' I , ,
28.5 deg Inclination Orbit
2 ,"_.
1i t i i i _ I
i
rw i_
I T i i I I I
3.14 g/cm Shielding
4pi Dose
1 I I t
1000
" "-_._..£ ; . CRRES,
..... High Activity
)', ":",i,
Low
I I
4I0
Altitude (km)
Fig. 5. Comparison of predicted dose vs. measured dose on CRRES for tow and high
geomagnetic activity levels.
i
10
15
underestimate the flux and dose for orbits passing through the outer region of the proton
belt during transient periods of high magnetic activity.
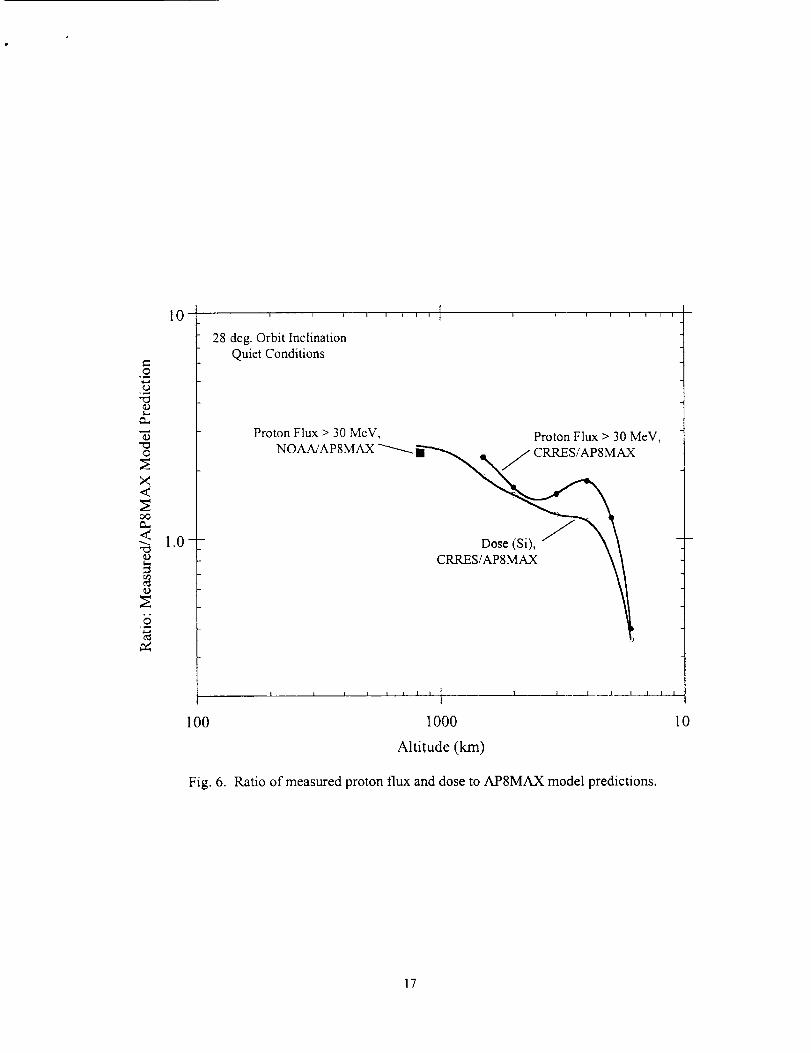
Figure 6 shows the measured/model ratio for the flux and dose comparisons of
Figs. 4 and 5 during quiet conditions, indicating approximate agreement using the two
data sets. As also indicated in Fig. 6, these ratios join reasonably well with the NOAA-
based ratios at lower (850 km) altitude.
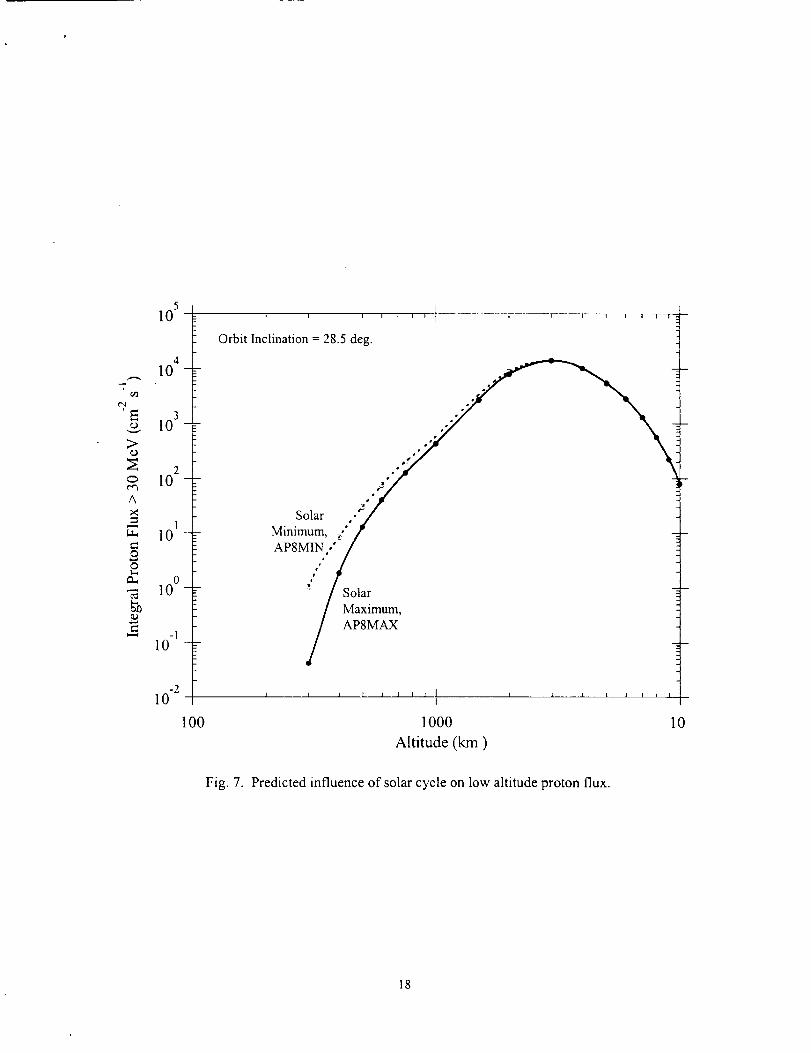
3.2 Model Uncertainty Dependence on Solar Cycle
As indicated in Fig. 7, below about 1000 km the trapped proton flux is influenced
by atmospheric losses and, therefore, atmospheric density changes due to solar heating.
Comparisons of the NOAA data for integral proton fluxes above 16, 36, and 80 MeV at
solar minimum and solar maximum with AP8MIN and AP8MAX predictions given in
[20] show essentially the same model uncertainty at solar minimum and solar maximum in
the 300-800 km altitude range. Also, model comparisons with activation measurements
for various radioisotopes produced in material samples carried on LDEF suggest
comparable uncertainties in the AP8MIN and AP8MAX models [24]. Therefore, we take
the measured/predicted ratio of 2 -0.5 at low altitudes derived from the comparisons of
Figs. 1 - 3 to be applicable to both APSMIN and AP8MAX.
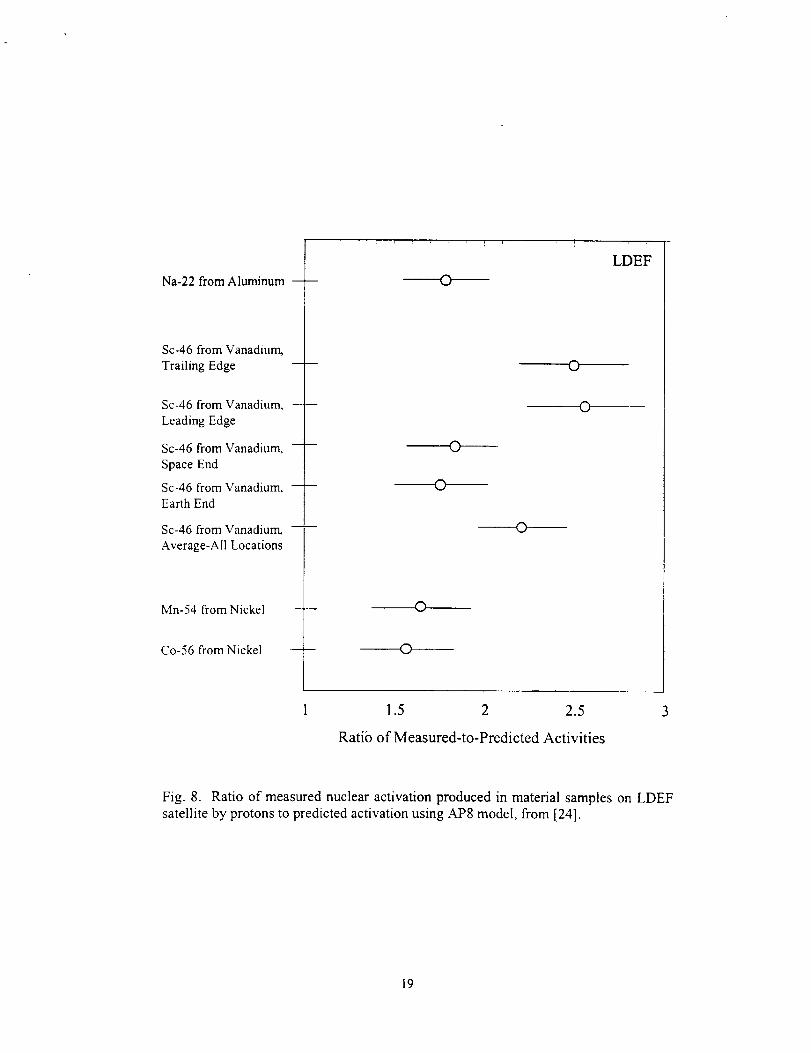
3.3 Model Uncertainty Dependence on Proton Energy
Both the NOAA and LDEF flight data and model comparisons indicate that the
AP8 model uncertainty is independent of proton energy over a broad energy range. For
example, the ratio of measured-to-predicted activities using AP8MIN and APSMAX was
approximately the same for material samples on LDEF (Fig. 8) despite the different
proton energy thresholds (= 20 - 100 MeV) for the nuclear reactions producing the
radioisotopes and the different amounts of shielding covering the samples. In one LDEF
experiment, activation and absorbed dose measurements were made at the same location
for shielding depths varying from about 1 to 19 g/cm 2 (aluminum equivalent),
corresponding to the range of 28 to 150 MeV protons. The constant observed-to-predicted
16
@
c_
10
1.0-
28 deg. Orbit Inclination
Quiet Conditions
I I I I i I _ I i I i I
Proton Flux > 30 MeV, Proton Flux > 30 MeV,
NOAA/AP8MAX _m_'"_ . / CRRES/APSMAX
CRRES/AP8MAX \
I I i I I I I I I I I
lO0 1000
Altitude (km)
Fig. 6. Ratio of measured proton flux and dose to AP8MAX model predictions.
10
17
¢q
>
A
o
105
410 -
10 3 -
2l0 -
Il0 -
010 -
-110 -
-210
100
i I I t I 1
Orbit Inclination = 28.5 deg.
Solar
Minimum, ,,'"
APSMIN ,"o
wF
Solar
Maximum,
AP8MAX
[ I I I I I I _I I I I
1000
Altitude (km)
10
Fig. 7. Predicted influence of solar cycle on low altitude proton flux.
18
Na-22 from Aluminum --
Sc-46 from Vanadium,
Trailing Edge
Sc-46 from Vanadium, --
Leading Edge
Sc-46 from Vanadium, --
Space End
Sc-46 from Vanadium, --Earth End
Sc-46 from Vanadium, --
Average-All Locations
Mn-54 from Nickel --
Co-56 from Nickel --
O
LDEF
0
©
©
©
0
1 1.5 2 2.5 3
Ratio of Measured-to-Predicted Activities
Fig. 8. Ratio of measured nuclear activation produced in material samples on LDEF
satellite by protons to predicted activation using AP8 model, from [24].
19
ratio over this shielding range (shown in Fig. 9) indicates that the AP8 uncertainty is the
same for proton energies from = 30 to at least 150 MeV.
The NOAA data also indicates that the error in AP8 predictions is independent of
proton energy for the measured energy range of 16 to 215 MeV. For example, at 850 km
and solar minimum, the NOAA/AP8MIN integral proton flux ratios are 1.74, 1.70, and
1.85 for E > 16, 36, and 80 MeV, respectively. (These ratios are for a 28.5 ° inclination
orbit, but the results are very similar for other inclinations)
3.4 Model Uncertainty Dependence on Radiation Effect
The conclusion above that the AP8 model uncertainty at low altitudes is
independent of energy, at least in the energy range from about 15 MeV to several hundred
MeV, has the important consequence that the uncertainty ratios shown earlier in Figs. I -
3 are expected to be independent of radiation effect. Thus, the same uncertainty factor
associated with the trapped proton environment is applicable to predictions using AP8 for
flux, dose, material activation, displacement damage, single event effects, etc.
3.5 Discussion
3.5.1 Scope
A complete review of AP8 model comparisons with flight observations quoted in
the literature is not included here. This is mainly because such comparisons are
commonly made in the context of approximate consistency checks between predictions
and measurements. To definitively attribute such differences to uncertainties in the
environment model requires an accurate treatment of other factors which can contribute to
the uncertainty (such as a detailed analysis of shielding effects, accurate flight trajectory
simulations, and, where applicable, accurate knowledge of the response function or cross
section for the radiation effect measured). Analyses which delineate the different
uncertainties are commonly not included in the reported model-data comparisons, so
definitive, quantitative uncertainties related to the environment alone are often not
available.
20

...............................
2.5 - 22Na Activation
from Aluminum,_ -
_ 62t
_ 2
1.5-b -
°_
TLD Dose
-÷
1 -- Dosimetry in LDEF Exp. P0006
Predictions Using AP8
Trapped Proton Flux Model
0.5 ....................................................................................................................................................
0 5 10 15
Vertical Shielding (g/c_)
--- -n _
Activation Samples:
• 54Mn from Nickel ---
S6Co from Nickel
X 46Sc from Vanadium
2O
Fig. 9. Ratio of measured depth-dependent nuclear activation and dose from
thermoluminescent dosimeters (TLDs) produced by protons on LDEF satellite topredictions using AP8 model, from [24].
21

3.5.2 Shuttle Data
One large flight data set not included here in the AP8 model comparisons is dose
measurements that have been made on Shuttle flights. Such comparisons have been often
reported in the literature; for example: the AP8 calculated dose was reported to be "'nearly
a factor of 2 higher" than dose measurements on Shuttle flight STS-63 (51.6 °, 314 -395
kin) [30]; for flight STS-60 (57 °, 353 km), the average ratio was 1.82 [31], and in
summarizing dose comparisons for a large number of Shuttle flights, it is stated in [32]
that "based on Shuttle measurements both the AP8MIN and AP8MAX model dose
calculations have consistently been higher by a factor of 1.8 - 2.0 when compared with
TEPC (Tissue Equivalent Proportional Counter) measurements".
Thus, these reported model comparisons with Shuttle dose data indicate that AP8
overpredicts the trapped proton flux by about a factor of 2 at low altitudes, whereas the
comparisons with other data sets made here (Figs. 1 - 3) show that AP8 underpredicts the
flight data by a factor of about 2.
To investigate this apparent discrepancy, we have made calculations to compare
with dose measurements made on some 60 Shuttle flights at low- (28.5 °) and mid- (51.6 °,
57 °) inclinations. The calculations were compared with TLD dose measurements made at
two locations on the Shuttle, taking into account the 3-D shielding distributions around the
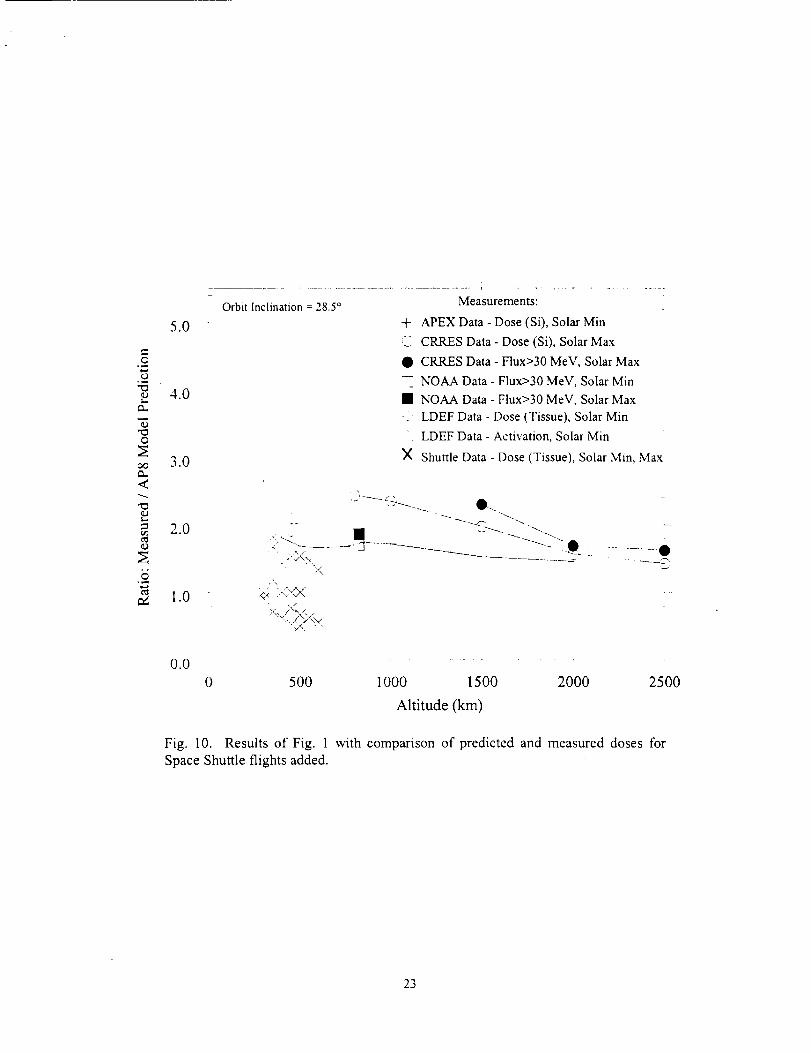
detectors; details of the calculations and comparisons are given in [4]. A summary of the
results for 28.5 ° Shuttle flights are shown in Fig. 10 together with the comparisons for
other flight data sets shown earlier in Fig. 1. The distinguishing feature of the Shuttle
results is their variability, with the measured-to-predicted ratio varying from about 0.5 (in
agreement with the literature values quoted above) to about 2 (in agreement with the value
found here from comparisons with other flight data). The variability of the model-data
comparison for Shuttle flights at mid-inclinations is similar [4].
There are several factors which may contribute to the variability of the Shuttle
model-data comparisons. One is that AP8 is a static model applicable for predicting
average fluxes over relatively long periods (6 months or so), whereas the duration of
Shuttle flights is about one week, so AP8 cannot take into account such short term
temporal variations. Also, in the low-altitude South Atlantic Anomaly region which
dominates the Shuttle proton exposure, the trapped proton flux is anisotropic, so the
22
o
"Oo
oo
<
b.,...a
5.0
4.0
3.0
2.0
l.O
Orbit Inclination = 28.5 ° Measurements:
+ APEX Data - Dose (Si), Solar Min
C CRRES Data - Dose (Si), Solar Max
• CRRES Data - Flux>30 MeV, Solar Max
-- NOAA Data - Flux>30 MeV, Solar Min
• NOAA Data - Flux>30 MeV, Solar Max
-- LDEF Data - Dose (Tissue), Solar Min
LDEF Data - Activation, Solar Min
_( Shuttle Data - Dose (Tissue), Solar Min, Max
• ,.,X_,;<
./
o0 .........
0 500 1000 1500 2000 2500
Altitude (km)
Fig. I0. Results of Fig. 1 with comparison of predicted and measured doses for
Space Shuttle flights added.
23
incident flux and resulting dose can vary substantially with spacecraft altitude. For
example, for LDEF (= 450 km. 28.5°), which was a gravity-gradient stabilized spacecraft
with fixed attitude, the dose ratio on the West (trailing edge) of the spacecraft was
measured to be 2.4 times the dose on the East (leading edge) of the spacecraft [23]. (This
directionality of the proton flux was not taken into account in the Shuttle model
predictions made here nor for the Shuttle ratios quoted above from the literature.)
Thus, application of AP8 model-data comparisons based on short duration Shuttle
flights to long-term missions does not seem valid, and we have not included Shuttle
measurements in the evaluation of AP8 model uncertainties here. In particular, the
procedure used in [32] of reducing AP8 results by a factor of 1.8 based on Shuttle
measurements in predicting long-term astronaut dose on the International Space Station
seems inappropriate.
3.5.3 AP8 Model Limitations
The model uncertainties derived here are relevant, of course, only to AP8
applications that do not violate the model limitations. The major AP8 model application
limitations are summarized below together with some references to related information.
Solar Cycle Dependence - The AP8 models provide fluxes at or near solar minimum or
solar maximum conditions only, not the variations which occur during a solar cycle. The
NOAA satellite data [19], covering 1.5 solar cycles, and reported long-term measurements
on the MIR Space Station [33] provide guidance on estimating the solar cycle dependence
of trapped protons.
Transients - The AP8 models are static in that they are most accurate in providing average
fluxes for time periods of about 6 months or more. In particular, large temporal variations
at high altitudes due to geomagnetic disturbances, such as observed during the CRRES
mission [e.g., Figs. 4, 5), are not accounted for.
Directionality - The AP8 model provides only omnidirectional fluxes without any angular
dependence. Models for generating directional proton spectra from AP8 omnidirectional
spectra have been developed [34, 35] and tested against flight data [e.g., 23].
24
Energy Extrapolation - The AP8 model proton spectrabelow about 10 MeV are
extrapolationsof flight data, and the model uncertainty in this energy has not been
evaluatedhere. An alternativeto AP8 in determiningprotonspectraat very low energies
is to usedatafrom the$3-3 satellite,which providesspectradownto 80kev for altitudes
below8200km [36].
SAA Drift - Because of secular geomagnetic changes, the proton flux at low altitudes in
the high intensity region of the South Atlantic Anomaly (SAA) region drifts westward at a
rate of about 0.3 ° per year [37]. AP8 does not correctly predict the geographic location of
fluxes in the SAA region because the magnetic fields that must be used to retrieve fluxes
from the data base are those corresponding to the epoch of the flight data incorporated.
However, as suggested in [37], the SAA drift can be accounted for approximately by
simply shifting the AP8 predicted fluxes westward in longitude using the drift rate of
0.3°/yr and the time elapsed from the epochs corresponding to the AP8 data bases (1964
for AP8MIN, 1970 for AP8MAX). For altitudes below about 800 km the NOAA satellite
data as incorporated in the NOAAPRO model [20] an be used to accurately treat the SAA
drift.
3.6 Conclusions
3.6.1 Low Altitudes
The major finding from the AP8 trapped proton model comparisons with several
sets and types (flux, dose, activation) of flight data is that for low-altitudes (below about
2000 km, where most of the flight data are available for comparison), the AP8 model
underpredicts by about a factor of 2. By applying a factor of 2 correction to AP8
predicted proton fluxes, the model predictions are within about -25% of the flight data.
Another important conclusion is that this simple factor of 2 model correction is
approximately independent of solar cycle (i.e., the same for AP8MIN and AP8MAX) and
independent of proton energy (at least above about 15 MeV, where the model has been
checked here against flight data). This constant uncertainty with energy has the important
consequence that we expect the same factor of 2 correction to apply not only to the model
predicted fluxes but to radiation effects estimates (dose, displacement damage, single
25
4. Trapped Electron Model Uncertainties
4.1 Model-Data Comparisons
4.1.1 Low-Altitude, Thin-shielding Dose Comparisons
As noted in See. 2.1.2, one of the dosimeters on the APEX satellite consisted of a
silicon detector beneath a thin (4.3 mils, or 0.029 g/cm 2) slab of aluminum and sensitive to
electrons above 150 keV and protons above 5 MeV. For such thin shielding, the dose is
dominated by electrons, so data from this dosimeter can be used to check the accuracy of
the AE8MIN model for predicting spacecraft near-surface dose levels in the low-altitude
range where the APEX data are applicable (300-2000 km).
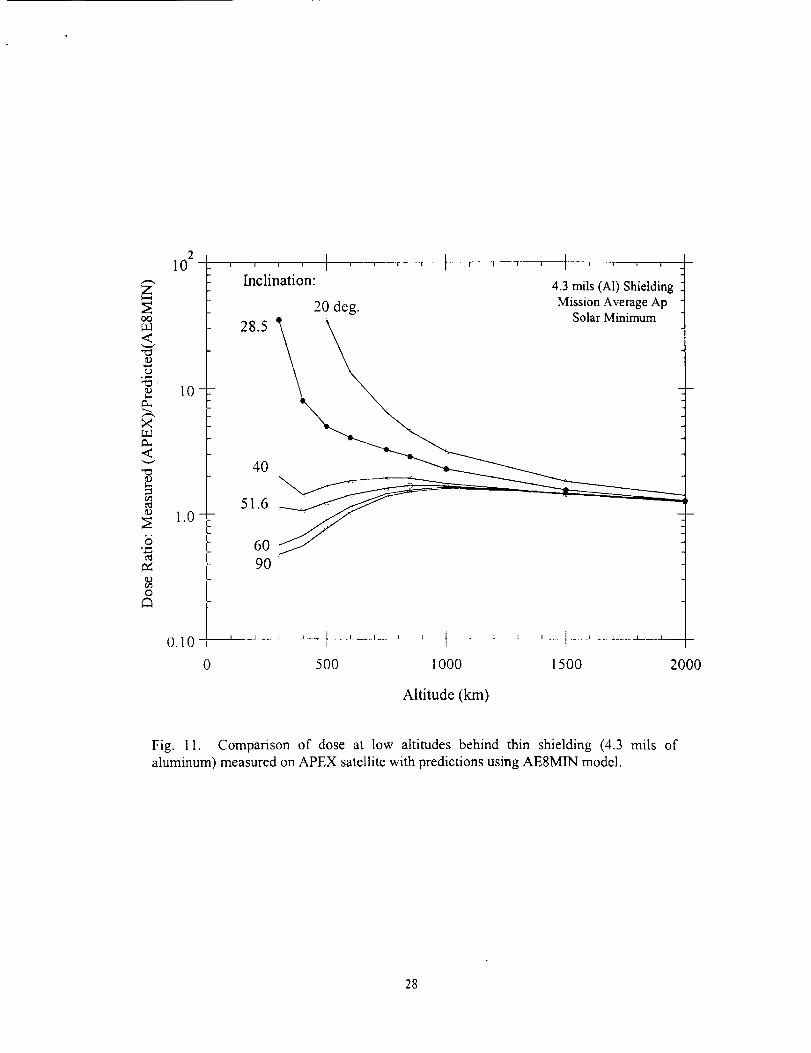
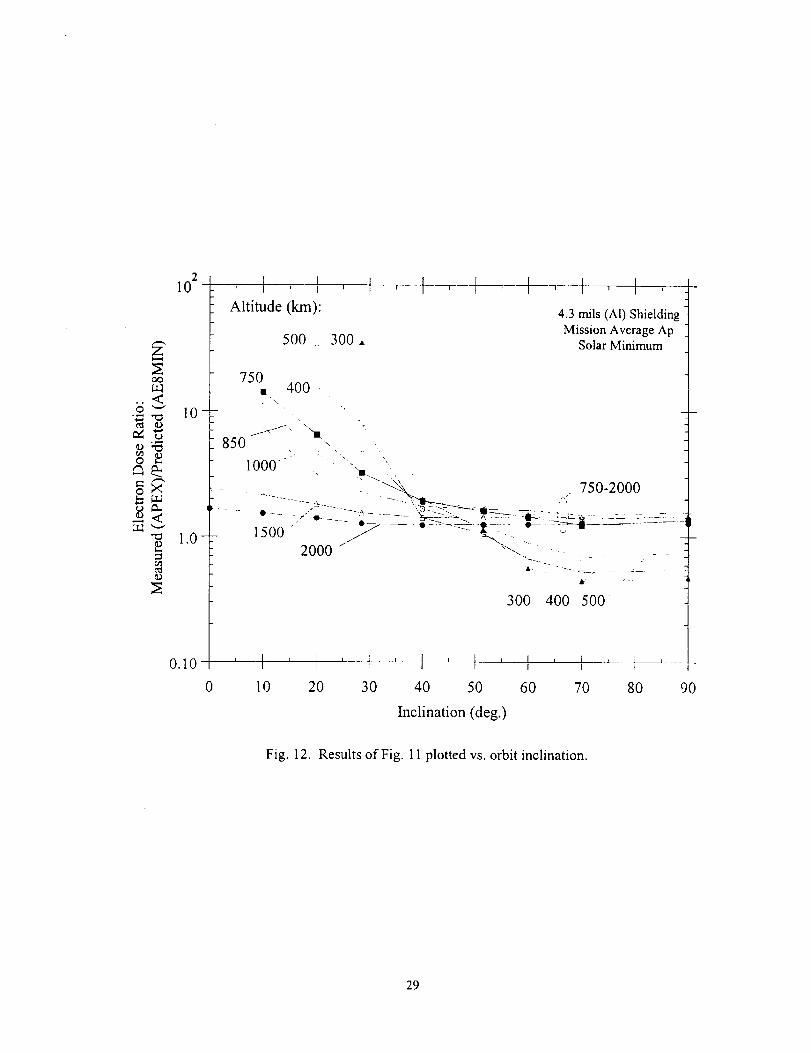
Figures 11 and 12 show the APEX/AESMIN dose ratio for circular orbits as a
function of altitude for selected inclinations and as a function of inclination for selected
altitudes, respectively. The ratios can be considered in three categories: (a) For
inclinations below about 40 ° and altitudes below about 750 km, the orbits are essentially
below the radiation belts and the electron dose levels are low. Below about 20 ° and 500
km, the trapped electron dose is expected to be below the galactic cosmic-ray dose. (The
cosmic-ray background has been subtracted from the APEX dose or part of the data
analysis [16].) Thus, while AE8MIN underprediction is large in this region, the practical
importance is lessened because of the low dose levels. (b) For low altitudes (below about
750 km) and high inclinations (above about 40°), the dose is due mainly to exposure in the
"horns" of the outer zone electrons which reach low altitudes at high latitudes. In this
region, AE8MIN underpredicts by about a factor of 2 (see Fig. 12). The dose in this
region is sensitive to outer zone intensity fluctuations caused by magnetic disturbances, so
the model uncertainty depends on the magnetic activity level. (c) For altitudes above
about 1500 km at low (< 40 °) inclinations, and altitudes above about 750 km for high (>
40 °) inclinations, the dose is due to electrons in the inner radiation belt, and AE8MIN
overpredicts the dose by about a factor of 2 at low inclinations and a factor of 1.5 at high
inclinations.
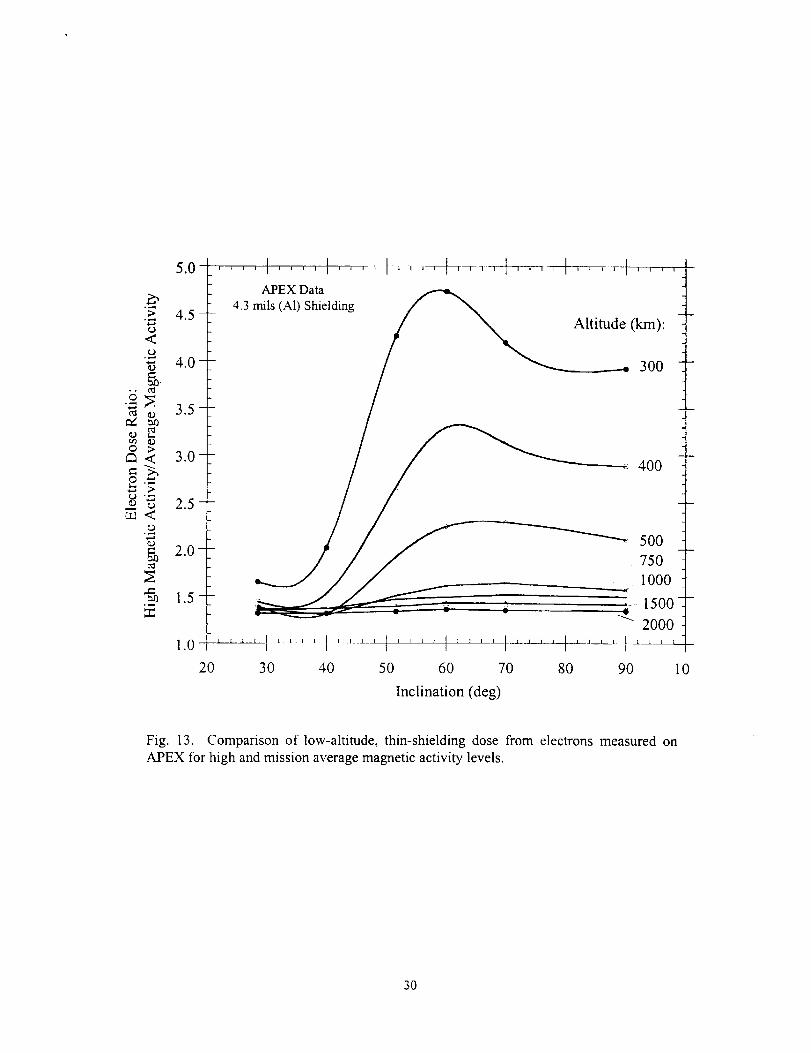
The results of Figs. 11 and 12 are based on the average magnetic activity level
during the APEX mission. To indicate the sensitivity of these results to magnetic activity,
in Fig. 13 the APEX dose for high magnetic activity periods (corresponding to the dose
27
OO
<
e3
;,<
.<
b
_D
O
210
10-
1.0-
l l , I ,Inclination:
20 deg.
28.5
40
\51.6
60
90
i t t i '
4.3 mils (A1) Shielding
Mission Average Ap
Solar Minimum
010-_-_---_-_----_. ' ' ..... f .... ' I ' ...._.........._---
0 500 1000 1500 2000
Altitude (km)
Fig. 11. Comparison of dose at low altitudes behind thin shielding (4.3 mils of
aluminum) measured on APEX satellite with predictions using AESMIN model.
28
oo
O
¢_I 0.3
oX
o<f-r-l'--"
10 2
10
1.0-
0.10
' J ' ] ' r T 1 ' [ ' [ ' I ' [ '
Altitude (km): 4.3 mils (Al) Shielding
Mission Average Ap
Solar Minimum500 300 •
750• 400
850/2_ 7 xl!
1000- ". "
" 7 0_ 000
2000 "\- -..
&
300 400 500
' -t ' I ' f ' [.... F ' I '0 10 20 30 40 50 60 70 80 90
Inclination (deg.)
Fig. 12. Results of Fig. 11 plotted vs. orbit inclination.
29
5.0
APEX Data
4.3 mils (AI) Shielding
Altitude (kin):
300
400
Inclination (deg)
Fig. 13. Comparison of low-altitude, thin-shielding dose from electrons measured on
APEX for high and mission average magnetic activity levels.
3O
measured in the Apl5 index range of 20 to 25) is compared with the mission average dose.
This illustrates the large variations which can occur tbr low altitude (< 750 km), high-
inclination (> 40 °) orbits where exposure is dominated by the outer zone electron horns,
and also indicates that the electron flux at the inner belt inner edge is fairly stable. As an
approximate upper limit for AEMIN prediction uncertainty during periods of high
magnetic activity, the ratios of Figs. 11 or 12 should be multiplied by the ratios in Fig. 13.
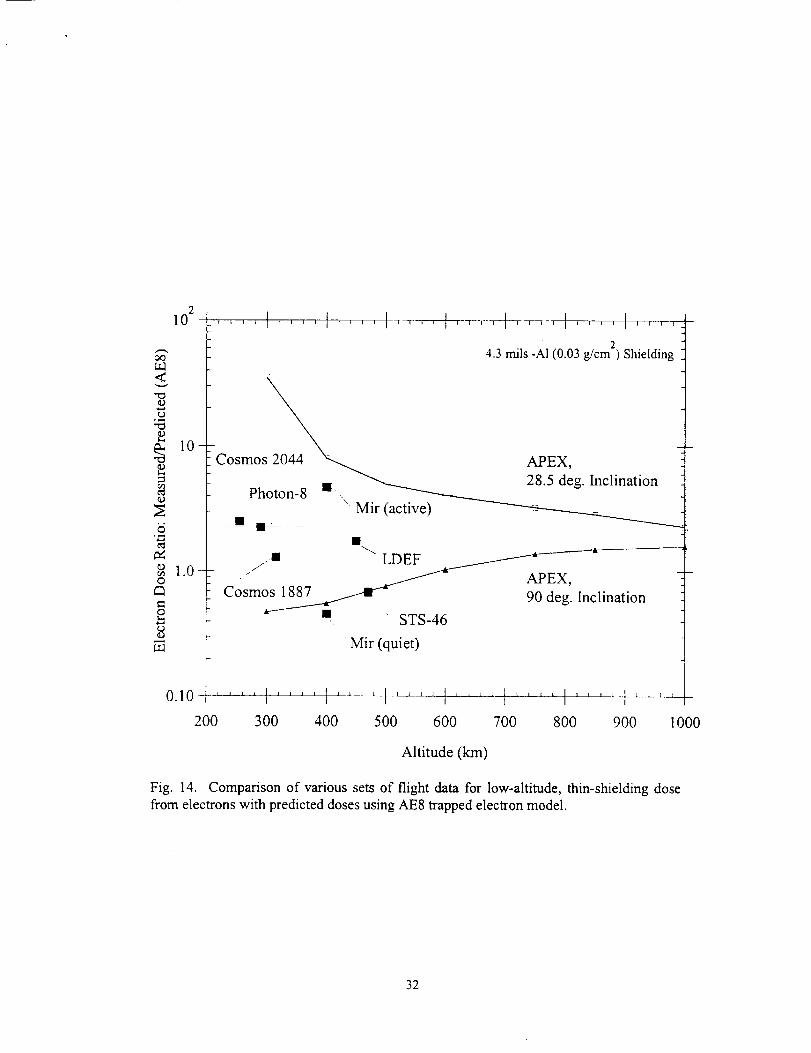
As further tests of the accuracy of AE8 in predicting thin-shielding dose from
electrons, we have compared predictions with depth-dose measurements made on several
low-altitude spacecraft using thermoluminescent dosimeters. From these results, given in
[4], we have extracted measured/predicted ratios corresponding to the APEX thinnest
shielding (4.3 mils aluminum) and compared them with the ratios based on APEX data as
a consistency check. This comparison is shown in Fig. 14, where the horizontal bars
represent the altitude range during the mission, and the vertical bars represent the spread
in the data where multiple data sets were available. Shown are ratios from measurements
on Cosmos-2044 (82.3 °, 216 - 294 km, solar max), Cosmos-1887 (62.8 °, 224 - 406 km,
solar min), Photon-8 (62.8 °, 220 - 359 km, midway between solar max and solar min), Mir
Space Station (51.6 °, 400 km, solar max), LDEF (28.5 °, 319 - 479 km, mainly solar min),
and Shuttle Flight STS - 46 (28.5 °, 420 - 520 km, midway between solar min and solar
max). Two ratios are shown for Mir: "active", from measurements about 3 months after
the intense magnetic disturbance of March 1991, and "quiet", from measurements made
during a period of low magnetic activity in 1997.
As indicated by Fig. 14, the measured/predicted electron close ratios for these
spacecraft are generally consistent with the APEX ratios but the ratio range is broad, from
about 0.5 - 2 (excluding the "Mir active" ratio, which is about 5). The Russian spacecraft
are in the altitude-inclination regime where, as indicated by Fig. 13, the dose levels are
sensitive to magnetic activity. Also, it is important to note that, except for LDEF, the
measurements were made over short time periods (a few weeks) and that temporal
variations on this time scale are not accounted for by the static AE8 model. Given these
model limitations, and that the comparisons shown are for different times during the solar
cycle, the data/model ratio variation shown in Fig. 14 is not unexpected.
31
210
<
m, lO-
aD
b
_ 1.0-o
o
0.10
24.3 mils -AI (0.03 g/cm ) Shielding
APEX,
28.5 deg. Inclination
C osm;S_hoton_8 ,,
• Mir (active)n •_. _
/ APEX,
Cosmos 1887 _ 90 deg. Inclination
• STS-46
Mir (quiet)
200 300 400 500 600 700 800 900 1000
Altitude (km)
Fig. 14. Comparison of various sets of flight data for low-altitude, thin-shielding dosefrom electrons with predicted doses using AE8 trapped electron model.
32
4.1.2 High Altitude Comparisons- Quiet times
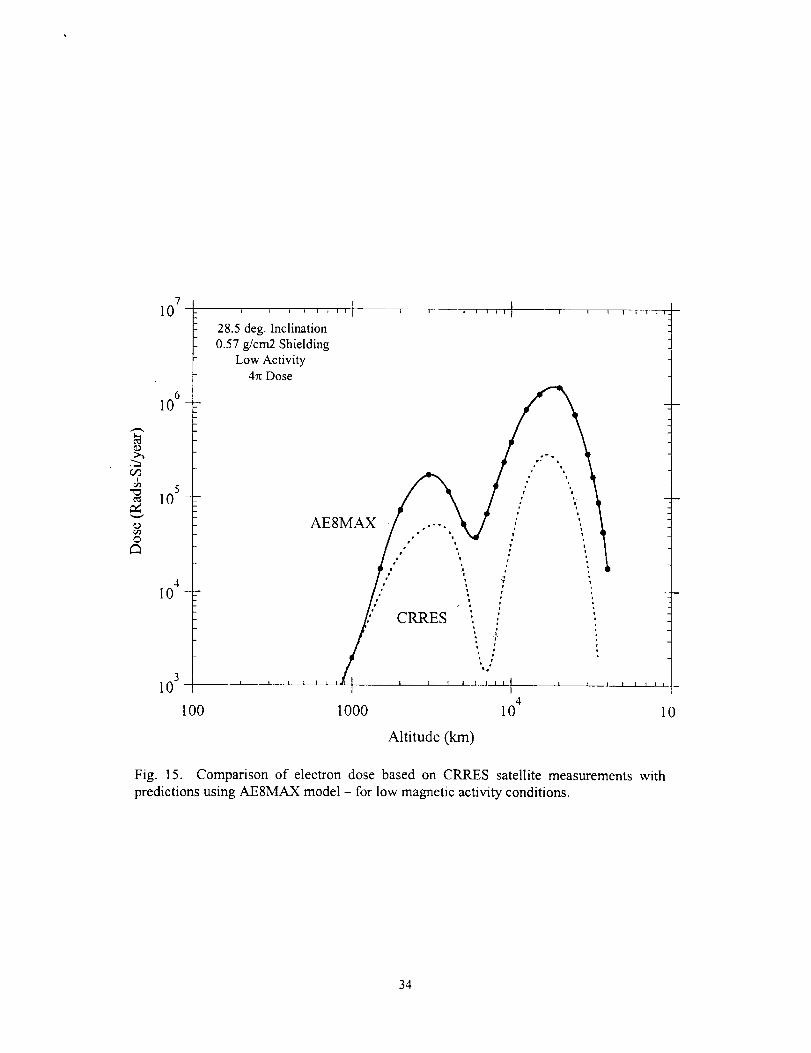
Figure 15 shows a dose comparison predicted using AE8MAX and measured on
CRRES during quiet conditions, i.e., the period of low geomagnetic activity during the
mission before the March 1991 event. The CRRES results, calculated using the
CRRESRAD software utility, are from the detector with thinnest shielding (82.5 mils
aluminum, 0.57 g/cm 2) and the low LET data, which measures essentially the dose from
electrons. For these comparisons, the CRRES hemispherical detector data have been
multiplied by two to compare with the AE8MAX doses calculated for 4n solid angle
incidence on an aluminum sphere of 0.57 g/cm 2 radius.
Figure 16 shows the AE8MAX/CRRESRAD dose ratio for the curves in Fig. 15.
(Note that here we show the model/data ratio, whereas in previous graphs data/model
ratios have been shown). Fig. 16 shows: (a) in the peak and outer edge of the inner belt
(= 2,000- 5,000 km), AESMAX overpredicts by about a factor of three, (b) in the low
dose 'slot' region between the inner and outer belts (5,000 - 10,000 kin), AESMAX
overpredicts by as much as a factor of 50, (c) in the peak region of the outer belt,
AE8MAX overpredicts by a factor of 5 - 10, and (d) in the outer regions of the outer belt,
AESMAX overpredicts by a factor of 10- 100.
4.1.3 High Altitude Comparisons - High Activity
Data from the CRRES mission taken after the extremely large geomagnetic
disturbance and solar particle event of March 1991 provide what is probably a practical
upper limit for temporal enhancements to the trapped electron populations. Thus,
comparison of these data with AE8, which is a static model and does not account for
fluctuations due to geomagnetic storms, provides a bound on AE8 uncertainty related to
geomagnetic activity.
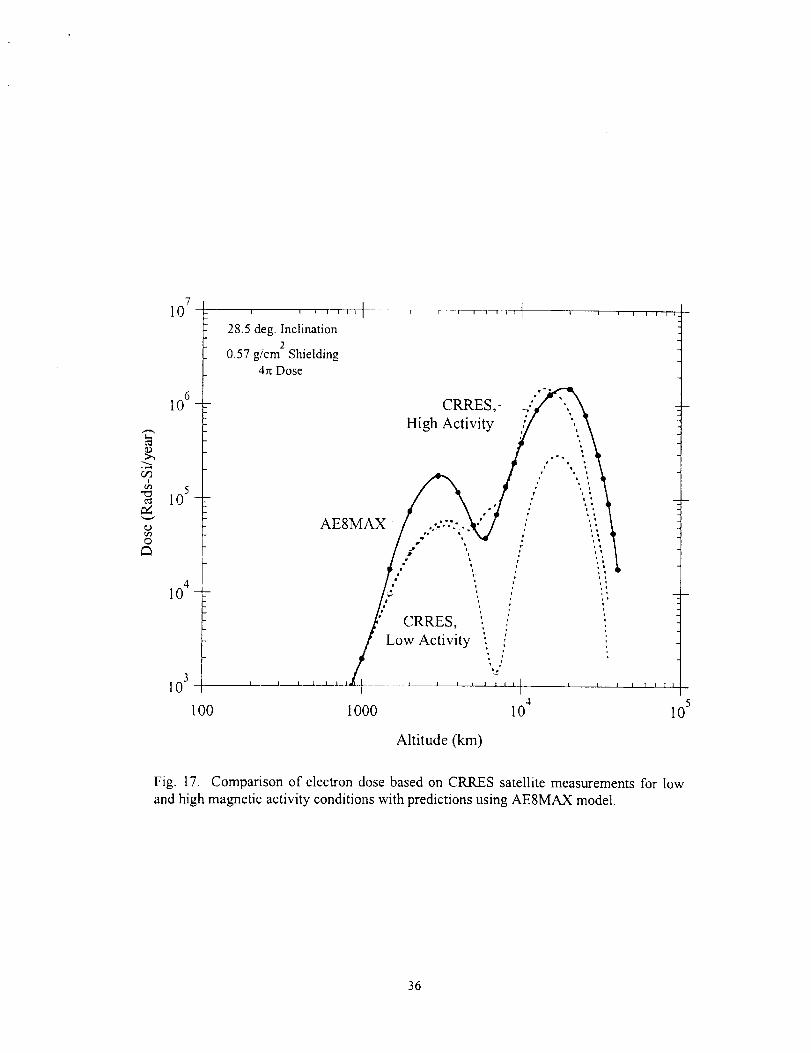
Figure 17 shows the AE8MAX and CRRES low activity dose curves of Fig. 15
with the average dose measurements during the 6-month observation period after the
March 91 storm ("CRRES, High Activity" curve). These results show that such a large
disturbance enhances the electron dose down to altitudes corresponding to the peak of the
inner belt, with increases of about two orders-of-magnitude in the slot region and one
order-of-magnitude in the peak region of the outer belt. However, the static AE8MAX
33
o
7I0
6l0
10 5
410
310
28.5 deg. Inclination
0.57 g/cm2 Shielding
Low Activity
4rt Dose
100 1000
AE8MAX
J
f
I ¢ I t I I [
CRRES
I I 2 I I I I ,i
4I0
Altitude (kin)
10
Fig. 15. Comparison of electron dose based on CRRES satellite measurements with
predictions using AE8MAX model - for low magnetic activity conditions.
34

i.)
r/3
<
b
1.0o
2
10 1_''t ' , , _ .... ]
28.5 deg. Inclination
2
0.57 g/cm ShieldingLow Activity
Altitude (kin)
10
Fig. 16. Ratio of predicted electron dose using AE8MAX to dose from CRRES satellite
measurements for low magnetic activity conditions.
35
&
r/3
o
710
610
l0 s
410 -
310
100
, , i , , i,, I
28.5 deg. Inclination
20.57 g/cm Shielding
i i i i 1_ I i ]
4_ Dose
CRRES,- v'_
High Activity_ill _
AE8M
// CRRES, ! /
/ owactivi y4
1000 10
Altitude (km)
I
I
1 1 I I I
510
Fig. 17. Comparison of electron dose based on CRRES satellite measurements for low
and high magnetic activity conditions with predictions using AESMAX model.
36
model overestimates the dose levels for quiet conditions by such a large amount that the
model results are not appreciably exceeded during these extremely high activity
conditions, and the model doses are still overestimates in the inner belt (by a factor of
about 3 near the peak) and for the outer edge of the outer belt (by a factor of about 10 or
more).
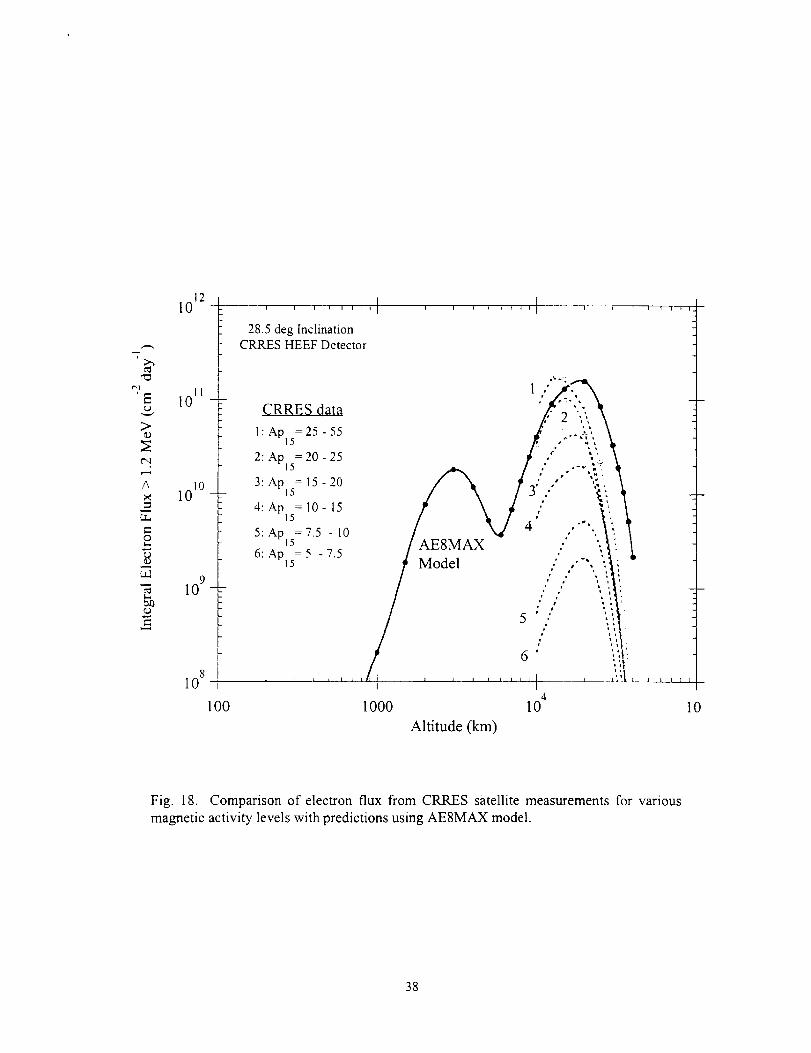
Figure 18 compares the AE8MAX electron flux > 1.2 MeV with the outer belt
fluxes measured by the CRRES HEEF detector. The HEEF data are given for different
levels of magnetic activity as measured by the Apl5 magnetic index - i.e., as if the whole
mission was during the indicated activity levels. The basic features of this flux
comparison are the same as the dose comparison of Fig. 17 - i.e., AE8MAX predictions
are comparable to the flux or dose observed for the very highest levels of magnetic
activity in the peak region of the outer belt and significantly higher at the outer edge.
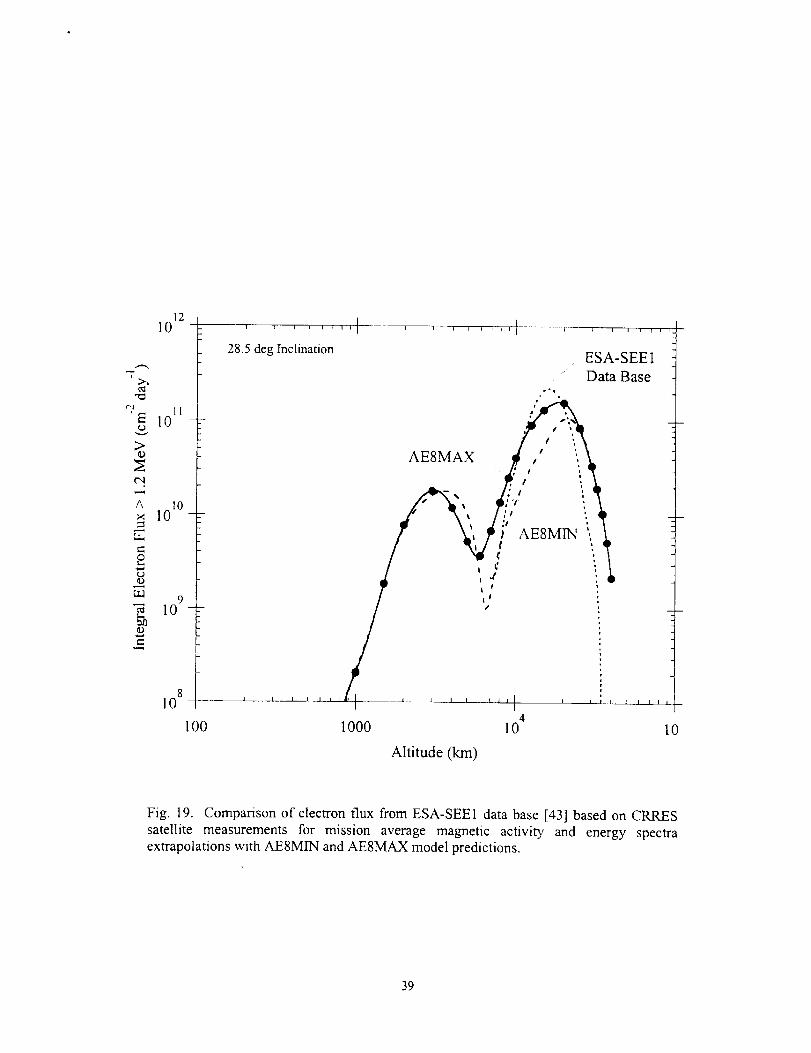
The outer belt ESA-SEE1 electron model is for solar minimum and based on
CRRES mission average electron measurements (high and low activity). A comparison of
AE8M1N and AE8MAX with the ESA-SEE1 data base in terms of the altitude-dependent
electron flux > 1.2 MeV is given in Fig. 19. The ESA-SEE1 flux, which as discussed in
Sec. 2.1.1 is based on the CRRES MEA detector with added energy spectra
extrapolations, is somewhat higher than the flux from the HEEF detector shown in Fig. 18
- i.e., the mission average ESA-SEE1 flux is comparable to the HEEF flux for the highest
activity level in Fig. 18.
4.2 Discussion
Evaluation of the uncertainties associated with the AE8 trapped electron model is
complicated by several factors - namely: (a) there are large transient fluctuations caused
by geomagnetic disturbances and solar particle event injection, whereas AE8 is a long-
term (six months or so) average flux model not capable of predicting trapped electron
dynamics; (b) there are several trapped electron source regions (polar horns, inner belt,
outer belt), and orbits of interest commonly pass through multiple source regions, which
complicates the derivation of simple guidelines on quantitative model uncertainties for
orbit-average environments and effects; and, (c) the flight data currently available for
checking the model accuracy is very limited.
37
e'l
'E
>_D
C,I
A
O
0_
L,
_0
i210
I110 -
1010 -
109 -
8i0
100
II J I I I I I 3 ]
28.5 deg InclinationCRRES HEEF Detector
I I I _ l I 1 L 1 ....... _,_. i I
1 ..' .!5
CRRES data ,'" 2 "i,"I,1:APl5 = 25 - 55
2: Apl 5= 20 - 25 _ ""
3:APl5 = 15 - 20 _,' ," ,,_',4: APl5= 10 - 15 "" ,'",_'"2
5:APl =7.5 -10
6: APls= 5 - 7.5 Model ,:" ,'", " :
, , , , , , ,t,t ' ' ' ' ' '"1 ' '""'i
41000 10
Altitude (km)
I f i"='f_.
I
10
Fig. 18. Comparison of electron flux from CRRES satellite measurements for various
magnetic activity levels with predictions using AE8MAX model.
38
1210
i>-_
_l IIE 10
(',.1
A 10× 10
¢.,o
o
109_m
e.-,
810
i t i i i i i i I
28.5 deg Inclination
100 1000
i 1 t i i i i I
AE8MAX
i i i i i i
ESA-SEE1
Data Base
1
-- 1 I J _1 I I t I I ._1 I I I I I I
410 10
Altitude (km)
Fig. 19. Comparison of electron flux from ESA-SEEI data base [43] based on CRRES
satellite measurements for mission average magnetic activity and energy spectraextrapolations with AE8MIN and AE8MAX model predictions.
39
Despitethesedifficulties, it is clearfrom thecomparisonsherethat theAE8 model
substantiallyoverestimatesthetrappedelectronintensityin both theinnerandouterbelts.
Theoverestimatefor the innerbelt shownhere(Fig. 17) is confirmedby therecentstudy
of Abel, et al. [39] in which datafrom six satellitescoveringthe period1966- 1991were
analyzed. They found a continuousdecline in inner zone electronswith energies> 1
MeV, and attribute this to the decay of remnantsfrom upper atmosphericnuclear
detonationscardedout in the late 1950sandearly 1960s. For electronenergiesbelow 1
MeV, they found large short-termfluctuationsoccurdue to inward radial diffusion of
outerzoneelectrondisturbancesfrom geomagneticstorms,andtherearevariationsdueto
solarcycleeffects.
It is clear from the outer belt dosecomparison(e.g., Fig. 17) that AE8 fluxes
significantlyoverestimatethe doseat geosynchronousaltitudes,ashasbeenpointedout
severalplacesin the literature[e.g., 40, 41]. We calculatethe AE8MAX/CRRES dose
ratio (0.57g/cm2shielding)for a geostationaryorbit (0° inclination; 35,800 km altitude) to
be 56 for low magnetic activity and 10 for high activity. An AE8/measured dose ratio of
12 for similar (0.69 g/cm 2) shielding has been observed for Molniya - type orbits [42].
The AE8 model comparisons here with the CRRES data for low (or nominal)
geomagnetic activity and high activity indicate the regions which are significantly affected
by enhanced fluxes following large geomagnetic disturbances. To account for dose
variations due to such disturbances in estimating the total dose for a mission, making
estimates using the "high activity" results alone from CRRES for the whole mission
would be overly conservative since these data represent a 6-month average after the
largest disturbances of this type ever observed. There is some evidence that disturbances
of the magnitude observed during the CRRES mission in 199 ! (i.e., large enough to create
a third belt) may have also occurred in 1958 [43], in 1963 [44] and in 1986 [45], or
roughly one such disturbance per 11-year solar cycle. Thus, a reasonable assumption
would be one such disturbance during a 5- or 10-year mission with the extreme dose due
to magnetic activity fluctuations based on one-year of CRRES high activity and the
remaining years using CRRES low activity results. The point here is that for practical
total dose mission estimates, the mission-average difference between high-activity and
40
low-activity doseestimateswill typically besubstantiallylessthan the high-activity and
low-activity CRRES curves shown here (e.g., Fig. 17).
We have not addressed uncertainties in the spectral shape of the AE8 model
electron fluxes. Above a few MeV, the accuracy of the AE8 model spectra are suspect
because of uncertainties in detector efficiencies and background corrections for the flight
data incorporated in the model [14]. This is consistent with AE8 comparisons with
CRRES data which show that the shape of AE8 spectrum in the outer belt is too low > 5
MeV [40]. Thus, this uncertainty in the shape of the AE8 spectrum means that the
data/model comparisons made here in terms of dose for specific shielding thicknesses can
vary with the shielding thickness selected for the comparison.
4.3 Conclusions
Tables 1 and 2 summarize the AE8 trapped electron model comparisons with flight
data for low and high altitudes, respectively, and nominal geomagnetic activity conditions.
The Table 1 results are summarized from the APEX data comparisons given in Figs. 11
and 12, and Table 2 results are summarized from Figs. 15 and 16. These results indicate
that the AE8 model: (a) is most accurate for low altitudes (300 - 2000 km) and
inclinations above 40 °, (b) overpredicts by a factor of 3 in the inner belt, and (c) can
overpredict by a factor of 10 or more in other regions. AE8 is most inaccurate at the outer
edge of the outer belt, corresponding to the region of geosynchronous altitude.
For times when the electron intensity is enhanced due to geomagnetic storms, at
low altitudes the APEX data show that the electron dose can increase by a factor of 1.5 to
about 5 for altitudes below about 750 km and inclinations above about 40 ° where orbits
are exposed to the polar 'horns' - i.e., where the outer belt electrons reach low altitudes at
polar latitudes - as shown earlier in Fig. 13. Since the inner part of the inner belt is
relatively stable during geomagnetic storms, orbits in the 750 - 2000 km altitude range are
relatively insensitive to electron variations with magnetic activity level.
For high altitudes, electron flux enhancements during geomagnetic storms can be
very large based on the CRRES satellite measurements after the extremely large
geomagnetic disturbance and particle injection event of March 1991 (Fig. 17). However,"
41
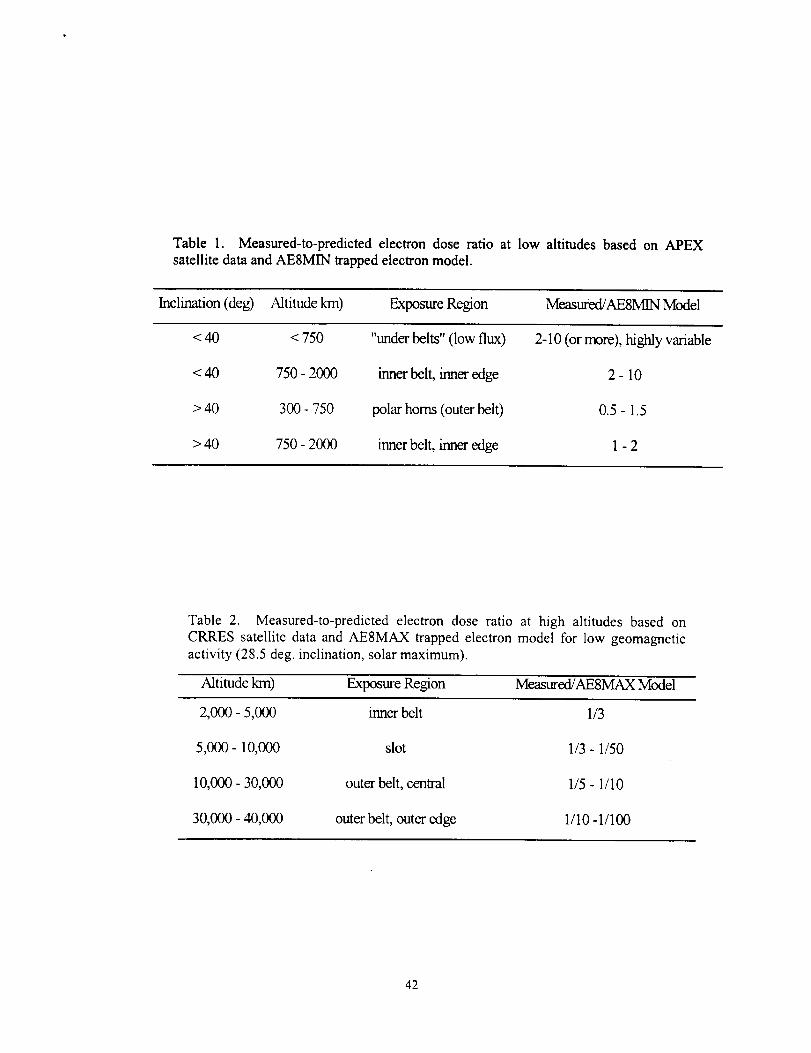
Table 1. Measured-to-predicted electron dose ratio at low altitudes based on APEX
satellite data and AE8MIN trapped electron model.
Inclination (deg) Altitude km) Exposure Region Meast_ed/AESMIN Model
< 40 < 750 "under belts" (low flux) 2-10 (or more), highly variable
< 40 750 - 2000 inner belt, inner edge 2 - 10
> 40 300 - 750 polar horns (outer belt) 0.5 - 1.5
> 40 750 - 2000 inner belt, inner edge 1 - 2
Table 2. Measured-to-predicted electron dose ratio at high altitudes based on
CRRES satellite data and AE8MAX trapped electron model for low geomagneticactivity (28.5 deg. inclination, solar maximum).
Altitude km) Exposure Region Measured/AE8MAX Model
2,000 - 5,000 inner belt 1/3
5,000- 10,000 slot 1/3 - 1/50
10,000 - 30,000 outer belt, central 1/5 - 1/10
30,000 - 40,000 outer belt, outer edge 1/10 -1/100
42

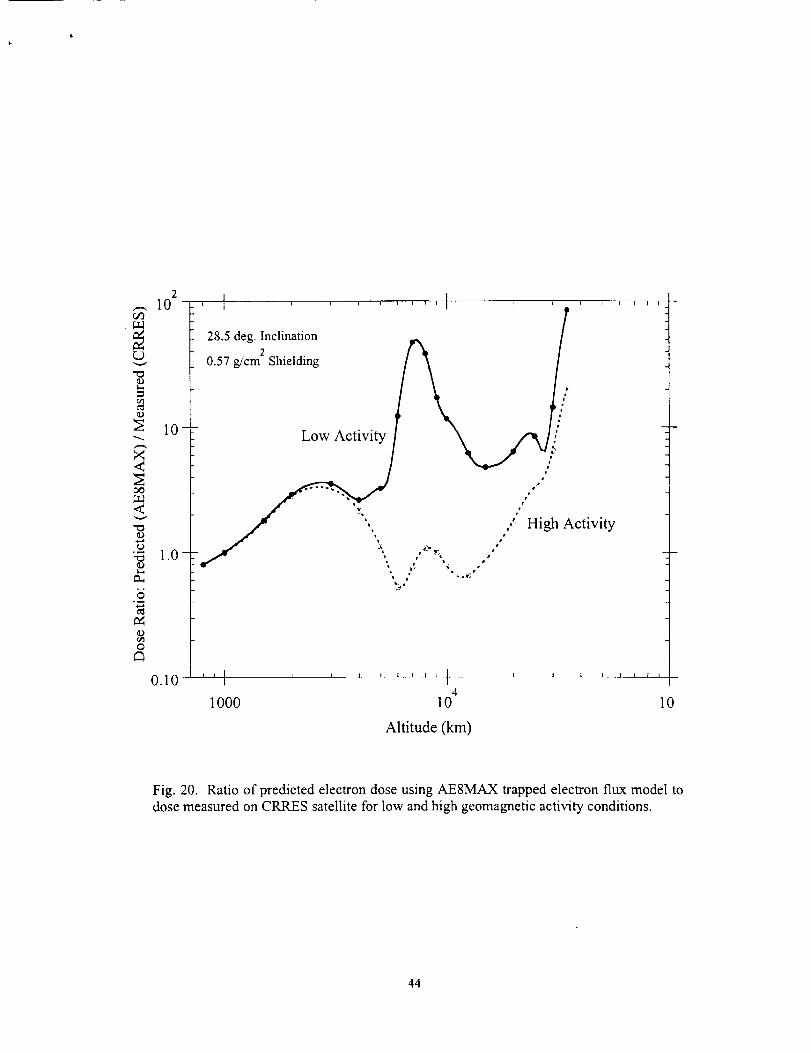
the AE8 model overprediction for quiet times is so large that the model still overpredicts
for most altitudes during high geomagnetic activity conditions. This is illustrated in Fig.
20, where we have added a curve comparing AE8MAX to CRRES data during high
activity conditions after the March 1991 event to the low-activity ratio shown previously
(Fig. 16).
43
2,-., 10
;.l.l
r_
lO-
X<
_D
b..a
ID
oC3
o.lo I
- t i ! i i
28.5 deg. Inclination
20.57 g/cm Shielding
Low Activity
"11000
1i i i i | i i i i l t i
1
r
• High Activity
r r _%
• o oe), w
I I I I I I I 1 I _ I 1 1i
410 10
Altitude (km)
Fig. 20. Ratio of predicted electron dose using AE8MAX trapped electron flux model todose measured on CRRES satellite for low and high geomagnetic activity conditions.
44
5. References
[l]
[2]
[3]
[4]
[5]
[6]
[7]
[8]
[9]
[10]
[il]
[12]
[13]
[14]
[15]
Donald W. Sawyer and James I. Vette, "AP-8 Trapped Proton Environment for Solar Maximum and
Solar Minimum", National Space Science Data Center NASA Goddard Space Flight Center,NSSDC/WDC-A-R&S 76-06, 1976.
M. J. Teague and J. I. Vette, "A Model of the Trapped Electron Population for Solar Minimum",National Space Science Data Center, NASA Goddard Space Flight Center, NSSDC 03-74, 1974.
James I. Vette, "The AE-8 Trapped Electron Model Environment", National Space Science DataCenter, Goddard Space Flight Center, NSSDC/WDC-A-R&S 91-24, Nov. 1991.
T. W. Armstrong and B. L. Colbom, "Trapped Radiation Model Uncertainties: Model-Data and
Model-Model Comparisons", Science Applications International Corporation, Contractor Report forNASA/MSFC, SAIC-TN-99030, September 1999.
E. R. Benton and E. V. Benton, "A Survey of Radiation Measurements Made Aboard RussianSpacecraft in Low-Earth Orbit", NASA/CR-1999-020956, March 1999.
T. W. Armstrong and B. L. Colborn, "TRAP/SEE Code Users Manual for Predicting TrappedRadiation Environments", Science Applications International Corporation, Contractor Report forNASA/MSFC, SAIC-TN-99010, August !999.
M. S. Gussenhoven and E. G. Mullen, "Space Radiation Effects Program: An Overview", IEEETrans, Nucl. Sci. 40 (2), 221 (1993).
M. S. Gussenhoven, E. G. Mullen, and D. H. Brautigam, "Improved Understanding of the Earth's
Radiation Belts from the CRRES Satellite:, IEEE Trans. Nucl. Sci. 43 (2), 353 (1996).
M. S. Gussenhoven, E. G. Mullen, D. H. Brautigam, E. Holman, C. Jordan, F. Hanser, and Dichter,"Preliminary Comparison of Dose Measurements on CRRES to NASA Model Predictions", IEEETrans. Nucl. Sci. 38 (6), 1655 (1994).
K. J. Kerns and M. S. Gussenhoven, "CRRESRAD Documentation", Phillips Laboratory, GeophysicsDirectorate, Hanscom AFB, PL-TR-92-2202, August I992.
M. S. Gussenhoven, E. G. Mullen, M. D. Violet, C. Hein, J. Bass, and D. Madden, "CRRES HighEnergy Proton Flux Maps", IEEE Trans. Nucl. Sci. 40 (6), 1450 (1993).
Jeralyn D. Meffert and M. S. Gussenhoven, "CRRESPRO Documentation", Phillips Laboratory,Geophysics Directorate, Hanscom AFB, PL-TR-94-2218, July 1994.
Donald H. Brautigam and Jabin T. Bell, "CRRESELE Documentation", Phillips Laboratory,Geophysics Directorate, Hanscom AFB, PL-TR-95-2128, July 1995.
A. L. Vampola, "ESA Update of AE-8 Using CRRES Data and a Neutral Network", in: Radiation
Belts: Models and Standards (J. F. Lemaire, D. Heynderickx, and D. N. Baker, Eds.), GeophysicalMonograph 97, American Geophysical Union (! 996).
A. L. Vampola, "Radiation Belt Model for the PC: RADMODLS", in: Radiation Belts: Models and
Standards (J. F. Lemaire, D. Heynderickx, and D. N. Baker, Eds.), Geophysical Monograph 97,American Geophysical Union (1996).
45
[33]
[34]
[35]
[36]
[37]
[38]
[39]
[401
[41]
[42]
[43]
[44]
[45]
G. D. Badhwar, V. A. Schurshkov, and V. A. Testlin. "Solar Modulation of Dose Rate Onboard theMir Station", IEEE Trans. Nucl. Sci. 44(6), 2529 (1997).
J. W. Watts, T. A. Parnell, and H. H. Heckman, "'Approximate Angular Distribution and Spectra forGeomagnetically Trapped Protons in Low-Earth Orbit", in Proc. on High-Energy Radiation inBackground Space, A. C. Rester, Jr., and J. I. Trombka (Eds.), Santibel Island, FL 1987, AlP Conf.Proc. 186, 1989.
M. Kruglanski, "Engineering Tool for Trapped Proton Flux Anisotropy Evaluation", Radiat. Meas.26(6), 953 (1996).
A. L. Vampola, "Low Energy Inner Zone Protons - Revisited", in: Workshop on the Earth's TrappedParticle Environment (Geoffrey D. Reeves, Ed.), American Institute of Physics Conf. Proc. 383, AlPPress, Woodbury, N. Y. (1996).
D. Heynderickx, "Comparison Between Methods to Compensate for the Secular Motion of the SouthAtlantic Anomaly", Radiat. Meas. 26(3), 369 (1996).
K. P. Ray, et al. "Solar Cell Degradation Observed by the Advanced Photovoltaic and Electronics
Experiments (APEX) Satellite", IEEE Trans. Nucl. Sci. (TBD)(1997).
Bob Abel, Richard M. Thorne, and Alfred L. Vampola, "Solar Cyclic Behavior of Trapped EnergeticElectrons in Earth's Inner Radiation Belt", J. Geophys. Res. 99 (AI0), p. 19, 427 (1994).
M. S. Gussenhoven, E. G. Mullen, and D. H. Brautigam, "Near-Earth Radiation Model Deficiencies
as Seen on CRRES", Adv. Space Res. 14 (10), 927 (1994).
A. L. Vampola, "The ESA Outer Zone Electron Model Update", in Proc. Environment Modelling for
Space-based Applications, ESTEC, Noordwijk, NL 18-20 Sept. 1996, European Space AgencyReport ESA SP-392, Dec. 1996.
J. B. Blake and J. E. Cox, "The Radiation Dose in a Moiniya-type Orbit", in Proc. High-EnergyRadiation Background in Space (A. C. Rester and J. I. Trombka, Eds.), Santibel Island, FL 1987, AlPConf. Proc. 186, 1989.
James A. Van Allen, "Pertubations of the Earth's Inner Radiation Belt by Two Geomagnetic Storms",J. Geophys. Res. I04(A9), 20,001(1999).
C. E. Mcllwain, "The Radiation Belts, Natural and Artificial", Science 142, 355 (1963).
M. S. Gussenhoven, E. G. Mullen, and E. Holman, "Radiation Belt Dynamics During SolarMinimum", IEEE Trans. Nucl. Sci. 36 (6), 2008 (1989).
47
Form ADproveel
REPORT DOCUMENTATION PAGE OMe ozo4-orea
P'J_)UC f_OOl'tlrlQ burden _t3f I/_15 (Cll_"_lOtt OT lnYormgltlO_ =s i_Iit_l(E_l tO _weflDQe i _ouf _lr ¢os4_Otl_e in(1u_lnq lf1_ = Ilffle 1of r_/l_o/ll'll_ i_lfU_lOn$. $_llffl_t_(_ ellStlt_ o&_ll _r_.
_oHe_'g=on of info rmllltlOtl, i¢_ciuO*lMq $uqgL_tlOn', Io¢ ft-u_,,,_/ _-,. ............ _ • R{_OtlPI, 1_ 1S Je_ft_e_n
C;=w_ H,ahwav. Suite 1204 2_hngton. JA 22202-4102. and to tt_ Of%ce of Man,l_emen( ar_ Bt_lq_t. P,JD_t_OtW RL_UCtlon Pro ect (0704-01BII), Wa_t.nqton. OC 20_]-
1. AGENCY USE ONLY _Leave o/an/c) 2.' REPORT DATE ' 3. REPQ,R.T TyP.,E AND.DATES COY_n.EO_,r,=:5eptemoer 1999 r mat [ecnmca= (paruau, ,-_/w- 9/99
4. rtTtl: ANn SUBTITLI:Evaluation of Trapped Radiation Model Uncertainties
tbr Spacecraft Design
6. _UTHORtS)
T. W. Armstrong and B. L. Colborn
7. PERFORMING ORGANIZATION NAME(S) AND ADORESS(ES)
Science Applications International Corporation (SAIC)
1706 Prospect-Elkton Road
Prospect, TN 38477
n
9. SPONSORING;MONITORINGAGENCYNAME(S)AND ADORESS(ES)
Space Environments and Effects (SEE) Program OfficeNASA Marshall Space Flight Center
Huntsville, AL 35812
S. FUNDING NUMBERS
Contract No.
NAS8-40294
B. PERFORMING ORGANIZATIONREPORT NUMBER
' SAIC-TN-99020
10. SPONSORING_ MONITORING
AGENCY REPORT NUMBER
11. SUPPLEMENTARY .';OTES
12a. DISTRIBUTION'AVAILABILITY STATEMENT12b. DISTRIBUTION CODE
13'. ABSTRACT (Maximum £OOworas)
The standard AP8 and AE8 models for predicting trapped proton and electron environments have been
compared with several sets of flight data to evaluate model uncertainties. Model comparisons are made with flux,
dose, and activation measurements made on various U.S. low-Earth orbit satellites (APEX, CRRES, DMSP. LDEF,
NOAA) and Space Shuttle flights, on Russian satellites (Photon-8, Cosmos-1887, Cosmos-2044), and on the
Russian Mir space station. This report gives a summary of the model_lata comparisons -- detailed results are
given in a companion report. Results from the model comparisons with flight data show, for example, that the AP8
model underpredicts the trapped proton flux at low altitudes by a factor of about two (independent of proton energy
and solar cycle conditions), and that the AE8 model flverpredicts the flux in the outer electron belt be an order of
magnitude or more.
14. SUBJECT TERMS
Trapped Radiation Model Uncertainties, AP8, AE8, Space Radiation, Space Ionizing
Radiation Environments
SECURITY CLASSIFICATIO_ 18. SECURITY CLASS;HCATION l a9 - SECURITY CLASSIFICATIONOF REPORT OF THIS PAGE OF ABSTRACT
Unclassified Unclassified Unclassified
' 15. NUMBER OF _,A,,-:cc47
16. PRICE CODE
20. LiMITATiON OF ABSTRACT


![Spacecraft Simulation]](https://img.pdfslide.us/doc/110x75/544e0a73b1af9f33638b4bf0/spacecraft-simulation.jpg)