Embed Size (px)
Citation preview
Technological University Dublin Technological University Dublin
ARROW@TU Dublin ARROW@TU Dublin
Articles School of Culinary Arts and Food Technology
2013
Sensory and Chemical Interactions of Food Pairings (Basmati Sensory and Chemical Interactions of Food Pairings (Basmati
Rice, Bacon and Extra Virgin Olive Oil) with Banana Rice, Bacon and Extra Virgin Olive Oil) with Banana
Mark Traynor Technological University Dublin, [email protected]
Roisin Burke Technological University Dublin, [email protected]
Maurice O'Sullivan University College Cork, Ireland
See next page for additional authors
Follow this and additional works at: https://arrow.tudublin.ie/tfschafart
Part of the Food Science Commons
Recommended Citation Recommended Citation Traynor, M.P. et al. (2013) :Sensory and chemical interactions of food pairings (basmati rice, bacon and extra virgin olive oil) with banana.Food Research International Volume 54, Issue 1, November 2013, Pages 569–577. DOI.org/10.1016/j.foodres.2013.07.050
This Article is brought to you for free and open access by the School of Culinary Arts and Food Technology at ARROW@TU Dublin. It has been accepted for inclusion in Articles by an authorized administrator of ARROW@TU Dublin. For more information, please contact [email protected], [email protected].
This work is licensed under a Creative Commons Attribution-Noncommercial-Share Alike 4.0 License

Authors Authors Mark Traynor, Roisin Burke, Maurice O'Sullivan, John Hannon, and Catherine Barry-Ryan
This article is available at ARROW@TU Dublin: https://arrow.tudublin.ie/tfschafart/175

Sensory and chemical interactions of food pairings (basmati rice, bacon and extra virgin olive oil) with banana
• Mark P. Traynora, Roisin Burkea,Maurice G. O'Sullivanb,John A. Hannonc and Catherine Barry-Ryand
• aSchool of Culinary Arts and Food Technology, Dublin Institute of Technology, Cathal Brugha Street, Dublin 1, Ireland
• bSchool of Food and Nutritional Science, University College Cork, Cork, Ireland • cTeagasc Food Research Centre, Moorepark, Fermoy Co. Cork, Ireland • dSchool of Food Science and Environmental Health, Dublin Institute of Technology, Cathal
Brugha Street, Dublin 1, Ireland
Abstract The aim of this study was to investigate food pairings as an important sensory phenomenon in order to determine how different components in the selected food pairings affect and interact with other components. Three novel food pairings (banana and bacon, banana and olive oil, and banana and rice) were selected. A conjoint approach utilising qualitative (organic volatile analysis and descriptive sensory analysis) and quantitative (comparable semi quantitative organic volatile analysis and affective sensory tests) methods of analysis n an attempt to elucidate the success or failure of selected food pairings. Free choice profiling (descriptive sensory analysis) data was analysed using Generalised Procrustes analysis. The correlation between volatile analysis and descriptive sensory analysis results were analysed using ANOVA partial least squared regression. Hedonic results were analysed using a Friedman rank sum test, while preference results were analysed using a Wilcoxon signed rank test. The food pairings of banana and bacon and banana and rice were found to be liked significantly more than banana and olive oil. The results of this study suggest that synergistic and/or antagonistic interactions between the volatile compounds in the foods influenced the hedonic ratings of these food pairings.
Keywords • Molecular gastronomy; • Food flavour analysis; • Flavour volatile interactions; • ANOVA PLSR
1. Introduction Food is much more than a source of biological nutrition for humans, it provides one of the major sources of pleasure to our species (Rozin, 1990). Humans principally learn to consume and prefer certain foods, and avoid and dislike others, with traditions, biological, psychological, and cultural factors being the main influences (Rozin, 2001). Few food preferences or aversions are innate; the majority of our food choices are learnt via differing degrees of exposure to foods (Nicklaus, Boggio, Chabanet, &

Issanchou, 2005). Similarly, the development and maintenance of food acceptances are controlled by affective, personal, cultural and situational factors (de Klepper, 2011 and Martins and Pliner, 2005). Additionally, mere exposure, pairing of foods with positive or negative consequences and a variety of social influences cultivate a like or dislike for foods (Rozin, 2001). Palatability of a food is largely determined by flavour (Breslin & Beauchamp, 1995), and for this reason, flavour is one of the most imperative attributes of food in terms of determining consumer acceptance (Liu & Yang, 2002). Our experience of food flavours are a result of a complex amalgamation of gustatory, olfactory and somatosensory sensations during consumption (Delwiche, 2004). Release of flavour compounds is an essential prerequisite for flavour perception of foods (Roberts & Taylor, 2000). Interactions between volatile and non-volatile compounds may be of a physical (reversible) or chemical (reversible or irreversible) nature (Charles-Bernard, Kraehenbuehl, Rytz, & Roberts, 2005). The physicochemical behaviour of small molecules such as flavour compounds in food matrices is one of the most important parameters involved in their sensory perception (Mirhosseini, Tan, Hamid, & Yusof, 2008). Flavoursome foods can often contain hundreds of organic volatile compounds, interactions between these compounds can be complex (Chung, Heymann, & Grün, 2003). For example, a mixture of two volatile compounds usually elicits a weaker aroma than the sum of its parts, the perceived intensity of flavour compounds having a logarithmic rather than a linear relationship with concentration (Wright, 2010). Furthermore, any type of interaction between a flavour compound and a food constituent (protein, carbohydrate or fat) which results in a restriction of the movement of a flavour stimulus to a sensory receptor will ultimately influence flavour perception (Reineccius, 2005). In addition to these interactions, other complex volatile–volatile and volatile–non-volatile exist. It has been recognised that some taste compounds (such as MSG) can increase the perceived aroma intensity of foods and, conversely, the perceived intensity of tastes may also be increased by aroma, especially when they are associated within congruent mixtures (such as classical sweetness and fruitiness) (Salles, 2006). In addition to the chemistry and physics of the food flavour, flavour perception is a dynamic process, which must engage the consumer (Piggott, 2000). In an increasingly globalised food market, innovation is an essential strategic tool for enterprises to achieve a competitive advantage (Menrad, 2004 and Gellynck et al., 2007) and the search for successful flavour pairings is a constant pre-occupation of food product developers (de Klepper, 2011). Flavour pairing (or food pairing) is the coupling of flavours to produce an experience that is more appreciated than either of the two flavours alone (Møller, 2013). Flavour pairing has for the most part been described for the combinations of wines with foods, with many wine labels often offering menu suggestions (Kort, Nijssen, van Ingen-Visscher, & Donders, 2010). However, in more recent times, hypotheses regarding flavour pairings have been put forward. There are numerous websites and software packages currently available that provide food pairings based on these different hypotheses. The concept that foods can combine well when they share major organic volatile compounds is one such hypothesis (de Klepper, 2011). However, despite recent advances, the scientific literature on flavour pairing is surprisingly limited, especially given the enormous scientific and

commercial progress towards a better understanding of flavour pairing (Møller, 2013). Some studies have focused on the hedonic response to pairing chocolate with a wide range of beverages (teas and alcoholic beverages) (Donadini, Daria Fumi, & Lambri, 2012) and on preferences for wine and cheese pairings (Bastian, Collins, & Johnson, 2010). A literature search reveals a lack of research papers published which explore the pairing of foods, only two to date that we know of explore the impact of volatile compounds on successfully pairing foods.Ahn, Ahnert, Bagrow, and Barabási (2011) used a volatile database and food ingredient databases in a network based approach to explore the impact volatile compounds had on the selection of ingredients. Similarly,Kort et al. (2010) explored food pairings using a volatile database, however more of a sensory driven approach was taken. Hence, no studies have explored the phenomena of food pairing using the holistic approach of organic volatile analysis, hedonic response evaluation and descriptive sensory analysis. The aim of this study was to investigate food pairings as an important sensory phenomenon with a key interest in determining how different components in the selected food pairings affect and interact with other components. Although the food pairings investigated in this study can be found in African and South American countries, in a European context, these food pairings would be considered novel and unique, and were therefore of interest. The selected ingredients comprise of a variety of food categories; meat, starchy food, fruit and lipid. A conjoint approach utilising qualitative (organic volatile analysis and descriptive sensory analysis) and quantitative (comparable semi quantitative organic volatile analysis affective sensory tests) methods of analysis was performed to explain why these foods did or did not pair well together from a sensory flavour perspective.
2. Materials and methods
2.1. Materials Bacon (St. Bernard, mild cured back rashers, Dunnes Stores Ltd., Dublin, Ireland), basmati rice (Dunnes basmati rice, Dunnes Stores Ltd., Dublin, Ireland) and bananas (Cavendish, origin Costa Rica) (Fyffe plc, Dublin, Ireland) were purchased from the local supermarket. Fully ripe bananas ready for consumption were selected based on a commercial peel colour scale (entirely yellow, stage 6). All food ingredients were purchased on the day of analysis. Prior to commencing this study, it was a requirement that ethical clearance be granted from the Dublin Institute of Technology Research Ethics Committee before conducting any sensory tests using human subjects. Subjects gave informed consent to take part in the study and for the results to be published.
2.2. Screening of food pairings
2.2.1. Selection of food pairings Selection of the food pairing samples was performed through preliminary research and experimentation. This preliminary work involved selecting eight food pairings with banana (bacon, basmati rice, extra virgin olive oil, blue cheese, gruyere cheese,
mackerel, soy sauce and whole grain mustard) which were generated using the online software package provided on Foodpairing.com (Sense for Taste, Bruges, Belgium). This software claims to pair foods that are compatible from a sensory point of view based on their organic volatile components. Banana was selected as the primary ingredient in the food pairings as it is a pleasant fruit and one of the most produced and consumed fruits throughout the world (Jordán et al., 2001 and Mayr et al., 2003) The eight food pairings were then subjected to screening tests to reduce the sample number to allow for sensory and instrumental work.
2.2.2. Selection of assessors Assessors were recruited from staff and students from the School of Culinary Arts and Food Technology and from the School of Food Science and Environmental Health, Dublin Institute of Technology, Dublin, and also from the School of Food and Nutritional Sciences, University College Cork, Cork. Assessors gave informed consent and permission for the results from this study to be published.
2.2.3. Preliminary sensory evaluation The screening process involved sensory evaluation of the orthonasal aroma (odour) of the pairings (n=19). Sensory analysis was carried out in a sensory laboratory under guidelines and conditions according to ISO 8589:2010 (ISO, 2010). Samples prepared at least 30 min before the test to allow time for vapour pressure to reach equilibrium at ambient temperature (ISO, 2006). The food pairings were placed in three-digit random number coded opaque plastic containers with opaque lids so that respondents could smell the samples without seeing them. Five minutes before the presentation of the food, small holes are made with a needle, through which the aromas were released (Raz et al., 2008). Samples were presented in a monadic sequential randomised order. Panellists were instructed to evaluate the orthonasal aroma acceptability of the paired samples on a nine point hedonic scale, where 9=“like extremely”, 5=“neither like nor dislike” and 1=“dislike extremely”. Additionally, the panellists were also asked to rank the samples in order of preference, from most preferred to least preferred. From the results of this preliminary sensory work, it was found that the banana food pairings of basmati rice (B+R), bacon (B+BN) and extra virgin olive oil (B+O) scored the highest mean acceptability scores for aroma (data not shown). Hence, these samples were used for the consumer sensory panel, descriptive sensory analysis and organic volatile compound profiling.
2.3. Consumer sensory panel
2.3.1. Sample preparation Prior to conducting the consumer panel, the bacon was cooked in an oven (Rational Combi Dämpfer, Rational UK, Luton, UK) at 190°C for 9 min and then turned and cooked for a further 9 min. Basmati rice was cooked in water at a ratio of 1.5:1 water:rice (Limpawattana, Yang, Kays, & Shewfelt, 2008) until deemed cooked (tender with a little bite). Once the bacon and basmati rice were cooked, they were

allowed to cool to below 5°C and were then stored in a refrigerator below 5 C until the sensory evaluation took place (approximately one hour). To reduce oxidation of the bananas, they were prepared by slicing only as required.
2.3.2. Conducting the consumer panel Untrained panellists (n=85) were asked to evaluate the three preferred food pairings with banana. Sensory analysis was carried out in a sensory laboratory under guidelines and conditions according to ISO 8589:2010 (ISO, 2010). The panellists worked in a single booth under defined conditions of 22°C and white light. Sample quantity ratios were selected based on preliminary sensory testing (n=5), where a perceived flavour balance was achieved through preliminary sensory analysis (data not shown). Cooked bacon and cooked rice were heated separately in a microwave (Sharp Plutonium Collection FR957, Cheshire, UK) (at 600 W) to above 63°C, and were held above this temperature in a bain maire until required (less than five minutes). Twenty grammes of both cooked bacon and cooked rice were served separately with 20 g of sliced banana in the sample containers. Twenty grammes of sliced banana were served in the sample containers with 10 ml of the olive oil. Samples were coded with three-digit random numbers and were presented in a monadic sequential randomised order to the panel. Panellists were instructed to consume unsalted crackers and mineral water to rinse their mouths between evaluating each sample (Bárcenas et al., 2001). For the hedonic tests, consumers were instructed to evaluate taste acceptability of the paired samples on a 9 point hedonic scale, where 9 = “like extremely”, 5 = “neither like nor dislike” and 1 = “dislike extremely”. Additionally, the panellists were also asked to rank the samples in order of preference, from most preferred to least preferred. Panellists were encouraged to write comments regarding their opinion of the food pairings, these comments were coded (both positive and negative comments).
2.4. Descriptive sensory analysis (free choice profiling) Assessors (n = 28, 11 males, 17 females, aged 20–40) were recruited for orthonasal (odour) and retronasal (flavour) aroma evaluation of seven food samples (banana (B), bacon (BN), rice (R), oil (O), banana and bacon (B + BN), banana and rice (B + R) and banana and oil (B+O)) using Free Choice Profiling (FCP). All assessors had previous experience in sensory evaluation. The assessors were separated into three groups (ten, ten and eight in each group), a total of two sessions were carried out with each group; the first session was a training session and the second session was a data collection session. Each session took place on two separate days and took approximately 60–90 min to complete.
In the training session the assessors got a brief introduction into the procedure of FCP, during which descriptive lexicons were developed and defined for each sample with the help of some previously developed descriptive lexicons from the literature (Angerosa et al., 2000, Civille and Lyons, 1996, Delgado and Guinard, 2011, Jeremiah et al., 1996, Jordán et al., 2001, Kanavouras et al., 2005, Limpawattana et al., 2008, Maw et al., 2001, Morales et al., 1995, Sekhon et al., 2010 and Timón et al., 2004). Sample preparation was as described in Section 2.3.2. All seven samples were

coded with three-digit random numbers and were presented in a monadic sequential order during each session. Breaks between each sample evaluation were provided, during which assessors were instructed to consume unsalted crackers and mineral water to rinse their mouths. Assessors were asked to evaluate the orthonasal aroma, followed by the retronasal aromas of the samples, and describe their sensory perception in their own words with the help of the descriptors provided. Assessors were asked to evaluate the intensity of the sensory attributes of the samples using a 15 cm line scale, anchored with the terms “weak/mild” and “strong”. Based on the individual descriptors, personalised scoresheets were created, and a consensual description list was generated based on the individual descriptors from each panellist for each sample. At the beginning of the second session the assessors were asked to take a moment to read the consensual description list and to update their own list if desired. The assessors then proceeded to evaluate the intensity of the sample's attributes as described in the first session.
2.5. GC–MS SPME volatile analysis
2.5.1. HS-SPME procedure Sample introduction was accomplished using a CTC Analytics Combipal Autosampler (Agilent). A single 1 cm SPME device (Supelco, Bellefonte, PA, USA) with a 10mm fibre coated with a 50/30 μm StableFlex Divinylbenzene/Carboxen/Polydimethylsiloxane (DVB/CAR/PDMS) fibre (Sulpelco, Bellafonte, PA, USA) was used for the extraction of the headspace volatiles. Initially, single foods (banana, basmati rice, bacon and extra virgin olive oil) were analysed by HS-SPME GC/MS to assess the range of volatile compounds present in each sample and the response detected by the MS and to optimise the quantities to be used during extraction of the food mixtures to ensure that the response of each individual food was within the same range. The quantities used for extraction of the individual foods were as follows: five grammes of bacon, one gramme of banana, five grammes of rice or one gramme of oil. These were weighed individually into 20 ml headspace SPME glass vials (O.D. 2.25 mm × H 75 mm) (Apex Scientific Ltd., Maynooth, Co. Kildare, Ireland) which were sealed with a stainless steel magnetic screw cap fitted with a Polytetrafluoroethylene (PTFE)/silicone septum (septum thickness 1.3 mm). For evaluation of the paired samples (banana and basmati rice (B+R), banana and bacon (B+BN) and banana and extra virgin olive oil (B+O)) the quantities used for extraction were as follows; banana one gramme: bacon four grammes (B+BN), banana one gramme: basmati rice four grammes (B+R) and banana one gramme: extra virgin olive oil one gramme (B+O). The choice of the ratios used for the paired samples analysis were established based on the preliminary volatile analysis of the individual food samples as discussed above. To determine optimal extraction time, the SPME fibre was exposed to the headspace above the samples for various lengths of time (5–60 min) at 40°C. Results from these preliminary experiments indicated that an extraction time of 20 min was sufficient to facilitate equilibration, and extending extraction time beyond this point was unwarranted. Sample mixtures were weighed into the vials and were placed in an incubation shaker chamber at 40°C with pulsed
agitation of 4 s at a shear rate of 150s−1. Following a pre-equilibration step at 40°C for 10 min the volatile compounds present in the headspace were extracted for 20 min.
2.5.2. GC conditions Analysis of the organic volatile compounds absorbed onto the fibre was carried out using a Varian 450 Gas Chromatograph (Varian Analytical Instruments, Harbour City, California, USA) with temperature programmable split/splitless injector, oven cryogenics, equipped with a Varian 320 triple quadrupole Mass Spectrometer (Varian Chromatography Systems, Walnut Creek, CA, USA). Separation of the volatiles was accomplished on an Elite 5 MS column (60m × 0.25μm, 0.25μm film thickness, Perkin Elmar, Ma, US). Helium, at a flow rate of 1.2ml/min was used as the carrier gas. Thermal desorption of the compounds took place in the GC injection port at 250°C in splitless mode. The fibre remained in the injection port for 2 min. Oven temperature was programmed at −60°C for 2 min, then ramped to 20°C at 50°C/min, then to 110°C at 4°C/min, and finally raised to 250°C at 25°C/min and held for 7 min. The transfer line temperature was set to 260°C. The mass spectrometer was tuned using autotune procedures and operated in the scan mode within a mass range of m/z 29 to 350 at 2.5 scans/s. Ionisation was performed by electron impact at 70 eV. Peak areas were analysed and quantified using the Varian Star MS chromatography workstation software, version 6.9.2 (Varian Analytical Instruments, Harbour City, California, USA). Individual compounds were assigned quantification and qualifier ions to ensure that only the individual compounds were identified and quantified. Individual compounds were identified using mass spectral comparisons to the NIST 2005 mass spectral library. Quantification was performed by integrating the peak areas of the extracted ions using the Varian MS workstation, version 6.9.2 (Varian Analytical Instruments, Harbour City, California, USA). The comparative semi-quantifiable results were recorded as the average of triplicate analysis with a mean percentage residual standard deviation (RDS %) of 8.52%. An autotune was performed at the start of the analysis to ensure that the mass spectrometer was performing optimally.
2.6. Data analysis
2.6.1. Consumer panel To analyse the consumer hedonic test, the Friedman rank sum was performed, using a significance level of P ≤ 0.05 to determine whether samples were significantly preferred over one another. Follow-up pair wise comparisons were conducted using a Wilcoxon signed rank test and controlling for the Type I errors across the comparisons at the P ≤ 0.05 level using the Fisher's Least significant difference procedure (LSD) to ascertain where significant differences were. The data from the preference test was analysed using the Pearson's chi squared test and cross-tabulation test. The analysis was performed using SPSS programme for Windows (Version 19.0, SPSS Inc., Chicago, US).

2.6.2. Descriptive sensory and volatile analysis Free choice profiling (descriptive sensory analysis) data was analysed using Generalised Procrustes Analysis (GPA) using XLSTAT system software, version 2013.4.03 (Addinsoft, Paris, France). The first two factors of the GPA analysis completed 59.88% of the variance. ANOVA-partial least squares regression (APLSR) was used to interpret the raw data accumulated from the 28 test subjects for the descriptive sensory evaluation and data acquired by volatile analysis. The X-matrix was designed as 0/1 design variables for the individual food samples and the food pairing samples. The Y-matrix was designed as descriptive sensory (orthonasal and retronasal aroma) and volatile analysis variables. The optimal number of components in the APLSR models presented was determined to be four principal components. The validated explained variance for the model constructed was 17% and the calibrated variance was 45%. APLSR was performed using Unscrambler Software, version 9.7 (CAMO ASA, Trondheim, Norway).
3. Results
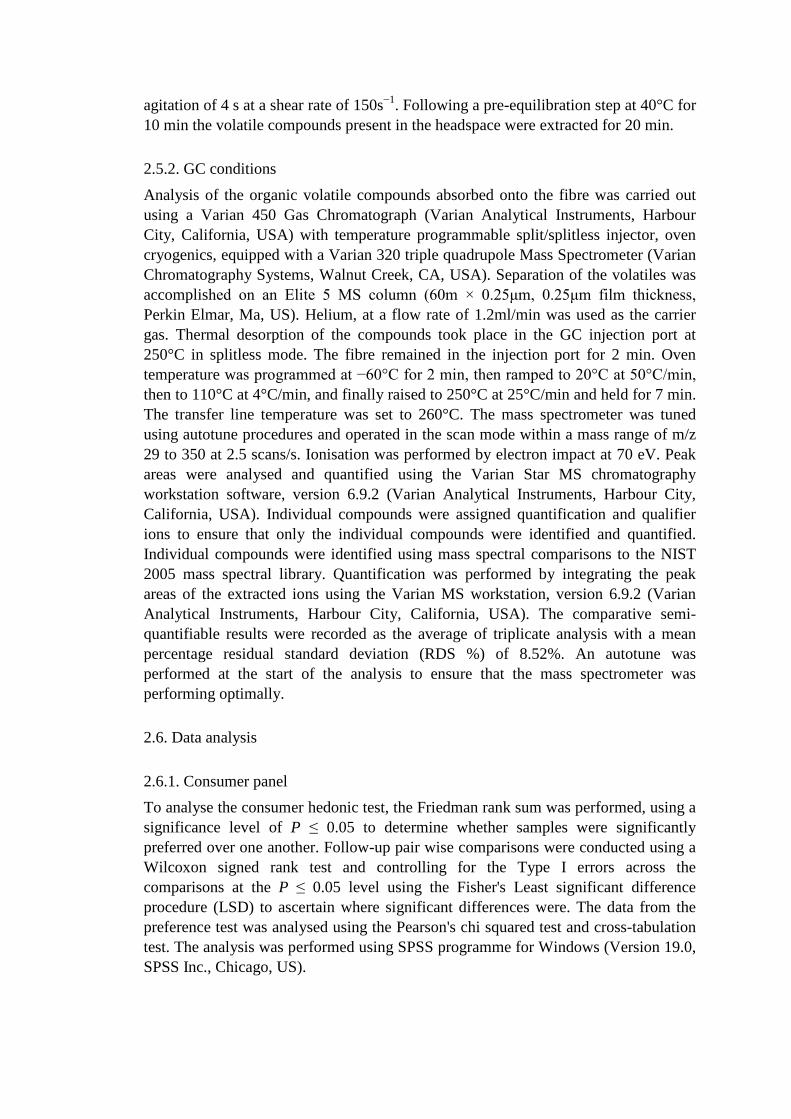
3.1. Consumer panel The mean acceptability scores for the three food pairings samples illustrated in Fig. 1. No significant differences (P > 0.05) were found between the acceptability scores of B + BN and B + R (6.2 ± 2.1 and 6.1 ± 1.6 respectively). B + O received a significantly lower (P ≤ 0.05) mean hedonic scoring (3.4 ± 2.2) in comparison to B + BN and B + R. In this study, a score of five for the hedonic ratings of the samples was considered to be a limit of acceptance, hence B + O was subsequently deemed to be unacceptable as a food pairing. Regarding the preference test results, B + BN had the highest percentage of 1st preference choices (55.3%), B + R had the highest percentage of 2nd choice preferences (49.4%) and B + O had the highest percentage of 3rd preference choices (77.6%). The cross tabulation results corroborate the results for the hedonic ratings of the samples, were B + BN and B + R scored significantly (P ≤ 0.05) higher than B + O, and hence were more preferred. Additionally, the Pearson's Chi-squared value was 120.424 (4 degrees of freedom), which is greater than the tabulated Chi-squared value (18.47) for the same number of degrees of freedom when P ≤ 0.001. Thus, the results are highly significant. Additionally, the Cramer's V coefficient value was 0.5, which indicates that there is a high association between the sample type and preference.
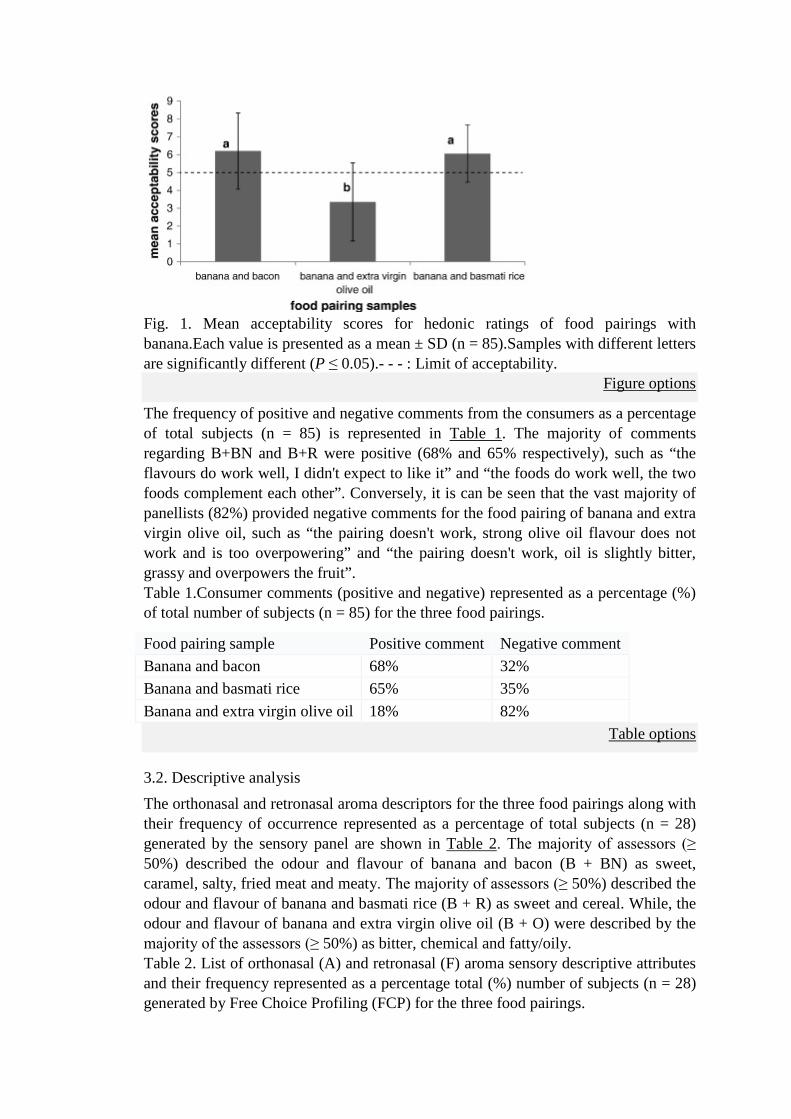
Fig. 1. Mean acceptability scores for hedonic ratings of food pairings with banana.Each value is presented as a mean ± SD (n = 85).Samples with different letters are significantly different (P ≤ 0.05).- - - : Limit of acceptability.
Figure options
The frequency of positive and negative comments from the consumers as a percentage of total subjects (n = 85) is represented in Table 1. The majority of comments regarding B+BN and B+R were positive (68% and 65% respectively), such as “the flavours do work well, I didn't expect to like it” and “the foods do work well, the two foods complement each other”. Conversely, it is can be seen that the vast majority of panellists (82%) provided negative comments for the food pairing of banana and extra virgin olive oil, such as “the pairing doesn't work, strong olive oil flavour does not work and is too overpowering” and “the pairing doesn't work, oil is slightly bitter, grassy and overpowers the fruit”. Table 1.Consumer comments (positive and negative) represented as a percentage (%) of total number of subjects (n = 85) for the three food pairings.
Food pairing sample Positive comment Negative comment Banana and bacon 68% 32% Banana and basmati rice 65% 35% Banana and extra virgin olive oil 18% 82%
Table options
3.2. Descriptive analysis The orthonasal and retronasal aroma descriptors for the three food pairings along with their frequency of occurrence represented as a percentage of total subjects (n = 28) generated by the sensory panel are shown in Table 2. The majority of assessors (≥ 50%) described the odour and flavour of banana and bacon (B + BN) as sweet, caramel, salty, fried meat and meaty. The majority of assessors (≥ 50%) described the odour and flavour of banana and basmati rice (B + R) as sweet and cereal. While, the odour and flavour of banana and extra virgin olive oil (B + O) were described by the majority of the assessors (≥ 50%) as bitter, chemical and fatty/oily. Table 2. List of orthonasal (A) and retronasal (F) aroma sensory descriptive attributes and their frequency represented as a percentage total (%) number of subjects (n = 28) generated by Free Choice Profiling (FCP) for the three food pairings.

B + R
B+BN
B+O
B+R
B+BN
B+O
A F A F A F A F A F A F Sweet Empyreuma
tic
Sweet 62
55
69
97
48
41
Smoky 38
24
Caramel 62
48
Woody 24
7 21
Maple 28
Fried meat 66
48
Starchy Floral Cereal 6
2 66
Floral 45
10
25
21
38
24
Starchy 41
14
31
14
Herbal 38
Popcorn 28
31
Olive 34
55
Fruit Fat Fruity 4
5 31
59
31
28
Fatty/oily 34
52
55
83
Pear/apple 7 3 Buttery 10
10
Misc. Savoury Citric 1
0 Meaty 6
6 86
Salty 52
72
Savoury 41
38
Bitter 10
14
3 3 52
72
Umami 28
Chemical/soapy
3 72
66
Earthy
Acidic 3 3 31
38
Earthy 48
28
7 17
17
Watery 28
41
Pine 17
3
Spicy/peppery
45
41
Nutty 38
34
24
21
14
Grassy 21
10
7 3 28
28
Italics indicates orthonasal aroma and retronasal aroma (flavour) classification obtained from Fisher & Scott (1997).A: indicates orthonasal aroma descriptive term.F: indicates retronasal aroma descriptive term.B+R: banana and basmati rice.B+BN: banana and bacon.B+O: banana and extra virgin olive oil.
Table options
A consensus biplot of the orthonasal and retronasal descriptive terms and there correlation with the unpaired and paired samples generated by the GPA is presented in Fig.2. From this plot it can be seen that the food pairings were separated into different quadrants through the correlated sensory descriptors for orthonasal and retronasal aroma from factor 1 and factor 2. The correlation between the orthonasal and retronasal sensory attributes and the first two factors of the GPA analysis are presented in Table 3. As it can be seen from the higher correlation levels (≥0.8 and ≤−0.8), factor 1 was more associated to oily orthonasal (bitter, soapy/chemical, herbal, olive, spicy/peppery and pine-aromas) and retronasal (smoky, buttery, floral and olive flavours) sensory properties. While, factor 2 appeared to be more associated to meaty orthonasal (earthy, meaty, fried meat, savoury, salty, smoky and fatty/oily aromas) and retronasal (earthy, meaty, fried meat, savoury, salty, umami and fatty/oily flavours) sensory properties. As it seems, the assessors perceived the difference between the formulations in this study as being based on meaty and oily properties, which allowed them to differentiate in preference between food pairings.
Fig. 2.Consensus biplot for orthonasal (A) and retronasal (F) aroma sensory descriptors and samples generated by GPA. : food samples (unpaired and paired). : descriptive sensory terms for orthonasal (A) and retronasal (F) aroma generated by FCP.B+R: banana and basmati rice.B+BN: banana and bacon.B+O: banana and extra virgin olive oil.
Figure options
Table3.Correlation coefficients for GPA analysis of the first 2 factors.
Descriptive terms Factor 1 Factor 2 Descriptive terms Factor 1 Factor 2 Earthy-A − 0.014 − 0.829 Earthy-F − 0.014 − 0.829 Bitter-A 0.970 0.118 Floral-F 0.970 0.118 Soapy/chemical-A 0.925 0.078 Caramel-F 0.925 0.078

Descriptive terms Factor 1 Factor 2 Descriptive terms Factor 1 Factor 2 Herbal-A 0.972 0.202 Nutty-F 0.972 0.202 Fatty/oily-A 0.499 0.847 Fatty/oily-F 0.499 0.847 Olive-A 0.849 0.128 Olive-F 0.849 0.128 Spicy/peppery-A 0.952 0.209 Buttery-F 0.952 0.209 Pine-A 0.857 0.130 Smoky-F 0.857 0.130 Meaty-A − 0.554 0.816 Meaty-F − 0.554 0.816 Savoury-A − 0.512 0.833 Fried meat-F − 0.512 0.833 Salty-A − 0.535 0.814 Salty-F − 0.535 0.814 Smoky-A − 0.551 0.814 Savoury-F − 0.551 0.814 Fried meat-A − 0.564 0.809 Umami-F − 0.564 0.809 A: indicates orthonasal aroma descriptive term.F: indicates retronasal aroma descriptive term.
Table options
The significant estimated regression coefficients for the correlation between the unpaired and paired samples and the orthonasal and retronasal aroma descriptive terms generated during FCP analysed by APLSR are displayed in Table 4. Numerous significant (P ≤ 0.05, P ≤0.01 and P≤ 0.001) positive correlations between descriptive terms and food samples were found. B+BN was found to have a significant correlation to meaty aroma (P≤0.01) and meaty flavour (P≤0.05). It can also be seen in the biplot for the descriptive terms (Fig.2), that the both the unpaired (banana, rice, oil and bacon) and the paired (B+BN, B+R and B+O) samples were successfully separated from each other as were their corresponding sensory descriptors. All three food pairings were positioned in different quadrants to each other, hence were perceived by the panel of assessors to have different sensory profiles. Table 4. Significance of estimated regression coefficients (ANOVA values) for the relationships between the samples and the orthonasal (A) and retronasal (F) aroma sensory attributes.
Banana Oil Bacon Rice B + R B + BN B + O Sweet-A 0.18⁎⁎ − 0.17 − 0.04 − 0.03 0.08 0.00 − 0.03 Meaty-A − 0.84 0.79 0.18 0.12 − 0.37 0.002⁎⁎ 0.12 Acidic-F − 0.19⁎ 0.18 0.04 0.03 − 0.09 0.00 0.03 Woody-F − 0.19⁎ 0.18 0.04 0.03 − 0.08 0.00 0.03 Bitter-F − 0.24⁎⁎⁎ 0.23 0.05 0.04 − 0.11 0.00 0.03 Fatty/oily-F − 0.22 0.20⁎⁎ 0.05 0.03 − 0.10 0.00 0.03 Meaty-F − 0.54 0.50 0.11 0.08 − 0.24 0.001⁎ 0.08 ANOVA APLSR values, the sign dictates whether the correlation is positively or negatively correlated.Significance of regression coefficients.A: orthonasal aroma descriptive term.F: retronasal descriptive term.B + R: banana and basmati rice.B + BN: banana and bacon.B + O: banana and extra virgin olive oil.
⁎

P≤0.05. ⁎⁎ P≤0.01. ⁎⁎⁎ P≤0.001.
Table options
3.3. Volatile analysis In total 119 organic volatile compounds were detected in the samples. Esters were identified as being most abundant, with 50 ester volatiles detected in total. Alcohols were the second most abundant volatiles detected, with 23 detected. 21 aldehydes and 10 ketones were also detected. Other compounds that were detected in lesser quantities were; sulphurs (four), phenyls (three), alkenes (three), parazines (two), carboxylic acids (two), terpenes (one), phenols (one) and furans (one). From the 119 organic volatile compounds detected in the samples, only three of the volatile compounds acetaldehyde, 3-pentanone (both absent from B+BN), and amyl isovalerate (absent from B+O) were not present in headspace of all the food pairings. The headspace of the banana was found to contain the most abundant number of volatile compounds with 118 volatile compounds being detected, followed by the extra virgin olive oil (102 volatile compounds), bacon (98 volatile compounds) and finally basmati rice (86 volatile compounds). In addition, 11 organic volatile compounds (mainly esters) were detected only in banana and not in the other unpaired samples (Table 5). The significant ANOVA values for some of the volatiles compounds which were detected in this study and that are considered to contribute to the characteristic aroma and flavour of their corresponding foods as suggested by the literature are presented in Table 6. Numerous significant correlations were found between the volatile compounds and the unpaired and paired samples. Table 5. List of volatile compounds detected from the food pairings that were contributed by banana only.
Volatile compound B O R BN B + BN B + R B + O RT Acetyl valeryl P NP NP NP P P P 16.8 2-Methylbutyl propanoate P NP NP NP P P P 21.7 1-Methylbutyl butanoate P NP NP NP P P P 24.6 2-Methylbutyl butanoate P NP NP NP P P P 25.3 3-Methylbutyl butanoate P NP NP NP P P P 25.6 3-Methyl, 6-hepten-1-ol P NP NP NP P P P 26.5 Amyl isovalerate P NP NP NP P P NP 26.6 Butyl pentanoate P NP NP NP P P P 27.1 1-Methyl, octyl butanoate P NP NP NP P P P 27.7 3-Octen-1-ol acetate P NP NP NP P P P 29.2 Hexyl 2-methylbutanoate P NP NP NP P P P 29.8 Hexyl 3-methylbutanoate P NP NP NP P P P 29.8

P: compound present in sample.NP: compound not present in sample.RT: retention time in minutes.B + R: banana and basmati rice.B+BN: banana and bacon.B+O: banana and extra virgin olive oil.
Table options
Table 6. Significance of estimated regression coefficients (ANOVA PLSR values) for the relationships between samples and volatile compounds detected by SPME GCMS.
RT
Volatile compounds
B O BN R B+R B+BN B+O
6.5
Ethanol − 0.237⁎⁎⁎
0.220⁎
⁎⁎ 0.051⁎
⁎ 0.034⁎
⁎⁎ − 0.105⁎
0.004⁎
⁎ 0.033⁎
9 Ethyl acetate
− 0.381⁎
0.354⁎
⁎⁎ 0.082ns
0.054⁎
⁎⁎ − 0.169ns
0.007ns
0.052⁎
9.2
Acetic acid
− 0.413⁎⁎
0.384⁎
⁎⁎ 0.089⁎
⁎ 0.058ns
− 0.183⁎⁎⁎
0.008⁎
⁎⁎ 0.057⁎
14
1-Pentanol − 0.404⁎⁎
0.376⁎
⁎⁎ 0.087ns
0.057⁎
⁎⁎ − 0.179⁎
0.008⁎
⁎⁎ 0.055⁎
18
Isoamyl acetate
0.552⁎
⁎⁎ − 0.513⁎⁎⁎
− 0.119⁎⁎
− 0.078⁎⁎⁎
0.245⁎ − 0.010ns
− 0.076ns
18
p-Xylene − 0.475⁎⁎⁎
0.441⁎
⁎⁎ 0.102ns
0.067⁎
⁎ − 0.210⁎⁎⁎
0.009⁎ 0.065⁎
20
Pentyl acetate
0.498⁎
⁎⁎ − 0.463⁎⁎⁎
− 0.107⁎⁎⁎
− 0.071⁎
0.221⁎
⁎⁎ − 0.009⁎⁎⁎
− 0.068⁎⁎⁎
20
Heptanal − 0.269⁎⁎⁎
0.250⁎
⁎⁎ 0.058⁎ 0.038⁎
⁎⁎ − 0.119ns
0.005⁎
⁎ 0.037⁎
⁎⁎ 21
Pinene − 0.406⁎⁎
0.377⁎
⁎⁎ 0.088ns
0.057⁎
⁎ − 0.180ns
0.008⁎
⁎ 0.056⁎
⁎⁎ 22
2-Heptenal
− 0.454⁎⁎⁎
0.422⁎
⁎⁎ 0.098 0.064⁎
⁎⁎ − 0.201⁎⁎⁎
0.009⁎
⁎⁎ 0.062⁎
⁎ 22
Benzaldehyde
− 0.010ns
0.010⁎
⁎⁎ 0.002 0.001⁎
⁎⁎ − 0.005ns
0.000⁎
⁎ 0.001⁎
⁎ 24
Octanal − 0.202⁎⁎
0.187ns
0.043⁎ 0.029⁎
⁎⁎ − 0.089ns
0.004⁎
⁎⁎ 0.028⁎
26
3-Methylbutyl butanoate
0.567⁎
⁎⁎ − 0.527⁎⁎⁎
− 0.122⁎⁎
− 0.080⁎⁎⁎
0.251⁎ − 0.011⁎⁎⁎
− 0.078⁎⁎
27
3-Methylbutyl 2-methylbutanoate
0.554⁎
⁎⁎ − 0.515⁎⁎⁎
− 0.119⁎⁎
− 0.078⁎⁎⁎
0.245⁎ − 0.010⁎
− 0.076⁎⁎⁎
27
Isoamyl isovalerate
0.513⁎
⁎⁎ − 0.476ns
− 0.114⁎⁎
− 0.073⁎⁎⁎
0.227⁎ − 0.010⁎⁎⁎
− 0.070⁎⁎⁎

RT
Volatile compounds
B O BN R B+R B+BN B+O
29
Decanal − 0.405ns
0.377⁎
⁎⁎ 0.087⁎ 0.057⁎
⁎⁎ − 0.179⁎⁎
0.008⁎
⁎ 0.056ns
APLSR (ANOVA values). + or − dictates whether the correlation is positively or negatively correlated.Significance of regression coefficients, ns: Not significant.RT: retention time.B + R: banana and basmati rice.B + BN: banana and bacon.B + O: banana and extra virgin olive oil.
⁎ P≤0.05. ⁎⁎ P≤0.01. ⁎⁎⁎ P≤0.001.
Table options
4. Discussion From the volatile compounds analysis results it would seem that banana contributed greatly to the volatile profiles of the food pairings (Table5). Esters have been identified as being the most abundant volatile compounds and the most odour active compounds (key odorants or character impact aroma compounds) in fresh banana (banana notes from amyl esters, and fruity notes from butyl esters) eliciting the characteristic fruity-banana notes (Boudhrioua et al., 2003,Imahori et al., 2013,Liu and Yang, 2002, Mayr et al., 2003, Pino and Febles, 2013 and Vermeir et al., 2009). Of these esters, acetates are of particular importance due to their high concentrations and low odour thresholds (Pontes, Pereira, & Câmara, 2012). In particular, isoamyl acetate, pentyl acetate, 3-methylbutyl butanoate, 3-methylbutyl 3-methylbutanoate, 3-methylbutyl 2-methylbutanoate and isoamyl valerate which were found to have a significant positive correlation with banana (P ≤ 0.001) (Table 6). These results correlate with the regression coefficient values (Table 4), where banana was found to have a significant positive correlation (P ≤ 0.01) with sweet aroma. An apparent change in the distribution coefficient appeared to occur at an approximate retention time of 18 min onwards, in which the release of the more non polar (lipophilic) compounds (mainly esters) appeared to be suppressed. This suppression in lipophilic compounds seemed to be more prominent in B+BN and B+O, than in B+R. Such a phenomenon is more than likely due to the binding of these lipophilic compounds to the food matrices. It is well known that food matrix components can bind, entrap or encapsulate volatile flavour compounds, resulting in a reduction in the rate of flavour release and flavour intensity (Naknean & Meenune, 2010). Lipid content and the volatile compounds lipophilicity are known key factors affecting flavour release in foods (Philippe et al., 2006). The effect of lipids on flavour release and perception is complex, and affects both the release of stimuli from the food matrix and also the release during oral processing of foods (Arancibia,

Jublot, Costell, & Bayarri, 2011). For instance, flavour release of lipophilic aroma compounds was reported to decrease with increasing lipid levels in the food matrix (Linforth, Cabannes, Hewson, Yang, & Taylor, 2010). Thus, a strong affinity of lipophilic volatile compounds for the lipid content in both B+BN and in B+O may have resulted in a retention of such volatiles, thereby influencing the flavour profile and influencing the perceived sensory perception. As expected, the low fat content of the rice in B+R did not alter the fruit flavour eliciting compounds. The individual foods (unpaired) of banana, basmati rice, bacon and extra virgin olive oil shared the majority of volatile compounds, therefore possible synergistic and/or antagonistic volatile–volatile interactions occurred resulting in positive or negative hedonic responses from the assessors. When discussing combining flavours, odour intensity (compound concentration in the foods and flavour thresholds) must be taken into account (Ahn et al., 2011). A possible volatile–volatile interaction regarding odour intensity may have occurred. In that, an increase in the concentrations of certain volatile compounds (with low initial concentrations) to a level that exceeds their odour threshold would result in these volatile compounds having more of a contribution to the flavour profile and thereby altering it (Belitz, Grosch, & Schieberle, 2009). In the case of B+R and B+BN, this interaction was positive, whereas with B+O it was a negative interaction. Furthermore, the perceived aroma of certain compounds can be altered as concentrations change. It has been found that hexanal and nonanal in extra virgin olive oil elicit herb olive odours at low concentrations, changing to rancid odours at higher concentrations (Aparicio, Rocha, Delgadillo, & Morales, 2000). Therefore in the case of B+O, compounds which may have initially elicited pleasant aromas in the extra virgin olive oil may have contributed negatively to the perceived flavour profile of food pairing once paired with banana due to a cumulative increase in concentration of such compounds. Another possible volatile–volatile interaction may have involved the odour active compounds of the constituents of the food pairings. In the case of B+R (esters from banana and aldehydes from basmati rice) and B+BN (esters from banana and sulphurous and pyrazines from bacon) the pairing of these foods produced harmonious and pleasant volatile mixtures from a sensory perspective (Fig.1 and Table 1). Whereas, in the case of B+O, the combination of odour active compounds in extra virgin olive oil (mainly aldehydes, ketones and alkenes) and banana appeared to produce an unpleasant perceived volatile mixture. Creating a balanced flavour mixture is another important aspect to take into consideration when discussing pairing of foods. As the concentration of sharing volatiles increases, subsequently the volatile concentration ratio can be altered in such a way that certain compounds predominate the flavour profile (Belitz et al., 2009). Hence, in case of B+R, it appears that the pleasant banana eliciting compounds predominated the flavour profile more so than in B+BN and B+O. This is clear in Fig.2, as B + R and banana covaried in the lower left hand side quadrant, while being directionally correlated with descriptive terms of fruity, pear/apple, sweet aromas and flavours. The rice descriptive terms of popcorn, starchy and cereal aromas and flavours are also directionally correlated with B+R, these terms are associated with rice (Limpawattana et al., 2008). In contrast the dominating influence of extra virgin olive oil is clear in B + O, as B + O was positioned to the far right hand side of the

biplot, being closer to the oil and its respective associated descriptive terms (spicy, soapy/chemical, bitter and oily/fatty aromas and flavours) (Tanouti et al., 2012). Additionally, this was reflected in the assessors comments as some stated that “the oil is slightly bitter, grassy and overpowers the fruit”. Hence, the characterise bitter, pungent, and leaf sensory attributes of extra virgin olive oil (Angerosa et al., 2000) appear to have dominated the flavour profile of B+O. Furthermore, pinene which has previously been identified as the active compound for the hot spicy flavour in virgin olive oils (Ekundayo et al., 1988) was found to have a significant positive correlation (P ≤ 0.001) with oil and B+O (Table 6), suggesting that the lipid content caused an increase in the hot spicy flavour perceived in B+O. In addition, acetic acid, ethanol and ethyl acetate which have all previously been associated with vinegar or wine flavours in olive oils (Kalua et al., 2007), were found to have significant positive correlations with B+O (P≤0.05). Although the foods in this study were found to share the majority of volatile compounds, it would be extremely difficult to support the hypothesis that the success of the food pairings is based on such a fact. It would appear that the pairing of foods is more complex and complicated than simply pairing foods that share common key compounds. Positive and negative synergistic and/or antagonistic volatile–volatile and volatile–matrix (volatile–lipid, volatile–protein and volatile–carbohydrate) interactions are important and must be taken into account. Additionally, positive and negative synergistic and/or antagonistic volatile–volatile interactions (odour intensity and flavour balance) are important aspects to consider when discussing food pairings. A simple alternative hypothesis to the volatile sharing food pairing hypothesis would be that creating the right balance between odour active volatiles in foods is required to produce a volatile mixture that is perceived as pleasant or harmonious. It seems that the volatiles contributed by the banana provided bacon and rice with the flavour and odour notes that they were lacking, and vice versa, producing a complete complementary flavour profile. In addition to this, the influence of non-volatile compounds contributing to the taste of the food parings (salty, sour, sweet, bitter and umami) must also be consider as an influential factor on hedonic evaluation. In particular, many of the assessors from the consumer panel noted that the “sweetness of the banana with the saltiness of the bacon worked well together” for B + BN. The scientific analysis of any art (including culinary art), is unlikely to be capable of explaining every aspect of the artistic creativity involved. Furthermore, the fitness of ingredients for a dishes or food pairings depends on a multitude of ingredient characteristics other their flavour profile. There are many ingredients whose main role in a recipe is other than simply providing flavour, recipes rely on ingredients to provide final textures and overall structure of a given dish (Ahn et al., 2011). In addition, as mentioned by the participants of the focus groups, the flavour of a dish owes as much to the mode of preparation (cooking method) as to the choice of particular ingredients (McGee, 2004 and This, 2005).
5. Conclusions The novel food pairings selected had complex flavour interactions which appeared to have influenced descriptive sensory evaluation and hedonic evaluation. Overall, the consumer panel liked some of the novel food pairings (B+R and B+BN). It has been

suggested in this study that possible positive and negative synergistic and antagonistic volatile interactions in the foods influenced the hedonic ratings of these food pairings. Based on these findings, it would be difficult to hypothesise successful food pairings due to this sharing of common volatiles. It appeared that creating certain flavour balances in volatile profiles of food pairings is important for a positive hedonic response. In addition, a binding phenomenon in the food matrices was more than likely an influencing factor on the rate of volatile release and the perceived aromas of the volatiles. Volatile concentration and odour thresholds are an important aspect to consider when discussing food pairings. Such knowledge may be exploited in the development of novel food products to produce interesting flavour combinations with a better understanding of consumer acceptance and rejection.
Acknowledgements The authors acknowledge funding from the Dublin Institute of Technology under the ABBEST Programme.
References 1.
o Ahn et al., 2011 o Y. Ahn, S. Ahnert, J. Bagrow, A. Barabási o Flavour pairing and network principles of food pairing
o Scientific Reports, 1 (2011), pp. 1–7
o View Record in Scopus | Cited By in Scopus (1)
2. o Angerosa et al., 2000 o F. Angerosa, R. Mostallino, C. Basti, R. Vito o Virgin olive oil odour notes: Their relationship with colatile compounds
from lipoxygenase pathway and secoiridoid compounds
o Food Chemistry, 68 (3) (2000), pp. 283–287
o Article |
PDF (130 K) | View Record in Scopus | Cited By in Scopus (135)
3. o Aparicio et al., 2000 o R. Aparicio, S. Rocha, I. Delgadillo, M. Morales o Detection of rancid defect in virgin olive oil by the Electronic Nose
o Journal of Agricultural and Food Chemistry, 48 (2000), pp. 853–860
o View Record in Scopus

| Full Text via CrossRef | Cited By in Scopus (48)
4. o Arancibia et al., 2011 o C. Arancibia, L. Jublot, E. Costell, E. Bayarri o Flavor release and sensory characteristics of o/w emulsions. Influence of
composition, microstructure and rheological behaviour
o Food Research International, 44 (2011), pp. 1632–1641
o Article |
PDF (984 K) | View Record in Scopus | Cited By in Scopus (12)
5. o Bárcenas et al., 2001 o P. Pérez Bárcenas, R. de San Román, F. Pérez Elortondo, M. Albisu o Consumer preference structures for traditional Spanish cheeses and their
relationship with sensory properties
o Food Quality and Preference, 12 (4) (2001), pp. 269–279
o Article |
PDF (386 K) | View Record in Scopus | Cited By in Scopus (21)
6. o Bastian et al., 2010 o S. Bastian, C. Collins, T. Johnson o Understanding consumer preferences for Shiraz wine and Cheddar cheese
pairings
o Food Quality and Preference, 21 (7) (2010), pp. 668–678
o Article |
PDF (359 K) | View Record in Scopus | Cited By in Scopus (7)
7. o Belitz et al., 2009 o H. Belitz, W. Grosch, P. Schieberle o Food Chemistry
o (4th ed.)Springer-Verlang, Berlin (2009)
o 8.
o Boudhrioua et al., 2003 o N. Boudhrioua, P. Giampaoli, C. Bonazzi o Changes in aromatic components of banana during ripening and air-dying
o Food Science and Technology, 36 (6) (2003), pp. 633–642
o Article |
PDF (604 K) | View Record in Scopus | Cited By in Scopus (32)
9. o Breslin and Beauchamp, 1995 o P. Breslin, G. Beauchamp o Suppression of bitterness by sodium: Variation among bitter taste stimuli
o Chemical Senses, 20 (1995), pp. 609–623
o 10.
o Charles-Bernard et al., 2005 o M. Charles-Bernard, K. Kraehenbuehl, A. Rytz, D. Roberts o Components. 1. Screening of nonvolatile components
o Journal of Agricultural and Food Chemistry, 53 (11) (2005), pp. 4417–4425
o 11.
o Chung et al., 2003 o S. Chung, H. Heymann, I. Grün o Application of GPA and PLSR in correlating sensory and chemical data sets
o Food Quality and Preference, 14 (5–6) (2003), pp. 485–495
o 12.
o Civille and Lyons, 1996 o G. Civille, B. Lyons o Aroma and Flavour Lexicon for Sensory Evaluation: Terms, Definitions,
References, and Examples
o ASTM, Philadelphia (1996)
o 13.
o de Klepper, 2011 o M. de Klepper
o Food pairing theory: A Eurpoean fad
o Gastronomica: The Journal of Food and Culture, 11 (4) (2011), pp. 55–58
o 14.
o Delgado and Guinard, 2011 o C. Delgado, J. Guinard o How do consumer hedonic ratings for extra virgin olive oil relate to quality
ratings by experts and descriptive analysis ratings?
o Food Quality and Preference, 22 (2) (2011), pp. 213–225
o 15.
o Delwiche, 2004 o J. Delwiche o The impact of perceptual interactions on perceived flavor
o Food Quality and Preference, 15 (2) (2004), pp. 137–146
o 16.
o Donadini et al., 2012 o G. Donadini, M. Daria Fumi, M. Lambri o The hedonic response to chocolate and beverage pairing: A preliminary
study
o Food Research International, 48 (2) (2012), pp. 703–771
o 17.
o Ekundayo et al., 1988 o O. Ekundayo, I. Laakso, R. Adegbola, B. Oguntimein, A. Sofowora, R. Hiltunen o Essential oil constituents of Ashanti pepper (Piper guineense) fruits (Berries) o Journal of Agricultural and Food Chemistry, 36 (1988), pp. 880–882
o View Record in Scopus | Full Text via CrossRef | Cited By in Scopus (25)
18. o Fisher and Scott, 1997 o C. Fisher, T. Scott o Food Flavours: Biology and Chemistry
o Athenaeum Press Ltd., Tyne and Wear (1997)
o 19.
o Gellynck et al., 2007 o X. Gellynck, B. Vermeire, J. Viaene
o Innovation in food firms: Contribution of regional networks within the international business context
o Entrepreneurship and Regional Development, 19 (3) (2007), pp. 209–226
o View Record in Scopus | Full Text via CrossRef | Cited By in Scopus (23)
20. o Imahori et al., 2013 o Y. Imahori, K. Yamamoto, H. Tanaka, J. Bai o Residual effects of low oxygen storage of mature green fruit on ripening
processes and ester biosynthesis during ripening in bananas
o Postharvest Biology and Technology, 77 (2013), pp. 10–27
o 1.
o ISO, 2006 o ISO o ISO 5496. Sensory analysis — Methodology — Initiation and training of
assessors in the detection and recognition of odours
o International Organization for Standardization, Geneva (2006)
o 2.
o ISO, 2010 o ISO o ISO 8589: Sensory analysis — General guidance for the design of test rooms
o International Organization for Standardization, Geneva (2010)
o 3.
o Jeremiah et al., 1996 o L. Jeremiah, R. Ball, B. Uttaro, L. Gibson o The relationship of chemical components to flavour attributes of bacon and
ham
o Food Research International, 29 (1996), pp. 457–464
o Article |
PDF (921 K) | View Record in Scopus | Cited By in Scopus (5)
4. o Jordán et al., 2001

o J. Jordán, K. Tandon, P. Shaw, K. Goodner o Aromatic profile of aqueous banana essence and banana fruit by gas
chromatography–mass spectrometry (GC–MS) and gas chromatography–olfactometry (GC–O)
o Journal of Agricultural and Food Chemistry, 49 (2001), pp. 4813–4817
o 5.
o Kalua et al., 2007 o C. Kalua, M. Allen, D. Bedgood, A. Bishop, P. Prenzler, K. Robards o Olive oil volatile compounds
o Flavour development and quality: A critical review, 100 (1) (2007), pp. 273–286
o Article |
PDF (306 K) | View Record in Scopus | Cited By in Scopus (94)
6. o Kanavouras et al., 2005 o A. Kanavouras, A. Kiritsakis, R.J. Hernandez o Comparative study on volatile analysis of extra virgin olive oil by dynamic
headspace and solid phase micro-extraction
o Food Chemistry, 90 (2005), pp. 69–79
o 7.
o Kort et al., 2010 o M. Kort, B. Nijssen, K. van Ingen-Visscher, J. Donders o Food pairing from the perspective of the ‘volatile compounds in food’
database
o I. Blank, M. Wüst, C. Yeretzian (Eds.), Expression of Multidisciplinary Flavour Science: Proceedings of the 12th Weurman Symposium, Interlaken, Switzerland, Institut of Chemistry and Biological Chemistry, Winterthur (2010), pp. 589–592
o 8.
o Limpawattana et al., 2008 o M. Limpawattana, D. Yang, S. Kays, R. Shewfelt o Relating sensory descriptors to volatile components in flavor of specialty rice
types
o Journal of Food Science, 73 (9) (2008), pp. 456–461
o 9.

o Linforth et al., 2010 o R. Linforth, M. Cabannes, L. Hewson, N. Yang, A.J. Taylor o Effect of fat content on flavour delivery during consumption: An in vivo
model
o Journal of Agricultural and Food Chemistry, 58 (2010), pp. 6905–6911
o 10.
o Liu and Yang, 2002 o T. Liu, T. Yang o Optimization of solid-phase microextraction analysis for studying change of
headspace flavor compounds of banana during ripening
o Journal of Agricultural and Food Chemistry, 50 (2002), pp. 653–657
o 11.
o Martins and Pliner, 2005 o Y. Martins, P. Pliner o Human food choices: An examination of the factors underlying
acceptance/rejection of novel and familiar animal and nonanimal foods
o Appetite, 45 (2005), pp. 214–224
o 12.
o Maw et al., 2001 o S. Maw, V. Fowler, M. Hamilton, A. Petchey o Effect of husbandry and housing of pigs on the organoleptic properties of
bacon
o Livestock Production Science, 68 (2001), pp. 119–130
o 13.
o Mayr et al., 2003 o D. Mayr, T. Märk, W. Lindinger, H. Brevard, C. Yeretzian o Breath-by-breath analysis of banana aroma by portion transfer reaction
mass spectrometry
o International Journal of Mass Spectrometry (2003), pp. 223–224
o 14.
o McGee, 2004 o H. McGee o On food and cooking: An encyclopedia of kitchen science, history and
culture
o Hodder & Stoughton, London (2004)
o
15. o Menrad, 2004 o K. Menrad o Innovations in the food industry in Germany
o Research Policy, 33 (2004), pp. 845–878
o 16.
o Mirhosseini et al., 2008 o H. Mirhosseini, C.P. Tan, N. Hamid, S. Yusof o Effect of Arabic gum, xanthan gum and orange oil contents on ζ-potential,
conductivity, stability, size index and pH of orange beverage emulsion
o Colloids and Surfaces A: Physicochemical and Engineering Aspects, 315 (2008), pp. 47–56
o 17.
o Møller, 2013 o P. Møller o Gastrophysics in the brain and body
o Flavour, 2 (8) (2013), pp. 2–4
o 18.
o Morales et al., 1995 o M. Morales, M. Alonso, J. Rios, R. Aparicio o Virgin olive oil aroma: Relationship between volatile compounds and
sensory attributes by chemometrics
o Journal of Agricultural and Food Chemistry, 43 (1995), pp. 2925–2931
o View Record in Scopus | Full Text via CrossRef | Cited By in Scopus (110)
19. o Naknean and Meenune, 2010 o P. Naknean, M. Meenune o Factors affecting retention and release of flavour compounds in food
carbohydrates
o International Food Research Journal, 17 (2010), pp. 23–34
o View Record in Scopus | Cited By in Scopus (9)
20. o Nicklaus et al., 2005 o S. Nicklaus, V. Boggio, C. Chabanet, S. Issanchou
o A prospective study of food variety seeking in childhood, adolescence and early adult life
o Appetite, 44 (2005), pp. 289–297
o Article |
PDF (273 K) | View Record in Scopus | Cited By in Scopus (78)
1. o Philippe et al., 2006 o E. Philippe, A. Seuvre, B. Colas, V. Langendorff, C. Schippa, A. Voilley o Behaviour of flavor compounds in model food systems: A thermodynamic
study
o Journal of Agricultural and Food Chemistry, 51 (2006), pp. 1393–1398
o 2.
o Piggott, 2000 o J. Piggott o Dynamism in flavour science and sensory methodology
o Food Research International, 33 (2000), pp. 191–197
o Article |
PDF (114 K) | View Record in Scopus | Cited By in Scopus (30)
3. o Pino and Febles, 2013 o J. Pino, Y. Febles o Odour-active compounds in banana fruit cv. Giant Cavendish
o Food Chemistry, 141 (2) (2013), pp. 795–801
o Article |
PDF (254 K) | View Record in Scopus | Cited By in Scopus (1)
4. o Pontes et al., 2012 o M. Pontes, J. Pereira, J. Câmara

o Dynamic headspace solid-phase microextraction combined with one-dimensional gas chromatography–mass spectrometry as a powerful tool to differentiate banana cultivars based on their volatile metabolite profile
o Food Chemistry, 134 (4) (2012), pp. 2509–2520
o Article |
PDF (678 K) | View Record in Scopus | Cited By in Scopus (5)
5. o Raz et al., 2008 o C. Raz, D. Piper, R. Haller, H. Nicod, N. Dusart, A. Giboreau o From sensory marketing to sensory design: How to drive formulation using
consumers' input?
o Food Quality and Preference, 19 (8) (2008), pp. 719–726
o Article |
PDF (514 K) | View Record in Scopus | Cited By in Scopus (8)
6. o Reineccius, 2005 o G. Reineccius o Flavor chemistry and technology
o Taylor & Francis, Boca Raton (2005)
o 7.
o Roberts and Taylor, 2000 o D. Roberts, A. Taylor o Flavour release: A rationale of its study
o D. Roberts, A. Taylor (Eds.), Flavor release, American Chemical Society, New Orleans (2000), pp. 1–7
o 8.
o Rozin, 1990 o P. Rozin o Acquisition of stable food preference
o Nutritional Reviews, 48 (2) (1990), pp. 106–113
o
9. o Rozin, 2001 o P. Rozin o Food preference
o International Encyclopaedia of Social and Behavioral Sciences (2001), pp. 5719–5722
o 10.
o Salles, 2006 o C. Salles o Odour–taste interactions in flavour perception
o A. Voilley, P. Etievant (Eds.), Flavour in food, Woodhead Publishing Limited, Cambrige (2006), pp. 345–368
o View Record in Scopus | Full Text via CrossRef | Cited By in Scopus (1)
11. o Sekhon et al., 2010 o R. Sekhon, M. Schilling, T. Phillips, M. Aikins, M. Hasan, A. Corzo et al. o Effects of phosphine and methyl bromide fumigation on the volatile flavor
profile and sensory quality of dry cured ham
o Meat Science, 86 (2010), pp. 411–417
o Article |
PDF (261 K) | View Record in Scopus | Cited By in Scopus (3)
12. o Tanouti et al., 2012 o K. Tanouti, H. Serghini-Caid, M. Sindic, J. Wathelet, A. Bouseta, A. Elamrani o Volatile compounds, profiles of virgin olive oils produced in the eastern
Morocco: Oxidative stability and sensory defects
o Journal of Food Research, 1 (4) (2012), pp. 194–206
o View Record in Scopus | Cited By in Scopus (1)
13. o This, 2005 o H. This o Molecular gastronomy: Exploring the science of flavour
o Columbia University Press, Sussex (2005)

o 14.
o Timón et al., 2004 o M. Timón, A. Carrapiso, Á. Jurado, J. van de Lagemaat o A study of the aroma of fried bacon and fried pork loin
o Journal of Agricultural and Food Chemistry, 84 (2004), pp. 825–831
o View Record in Scopus | Full Text via CrossRef | Cited By in Scopus (12)
15. o Vermeir et al., 2009 o S. Vermeir, M. Hertog, K. Vankerschaver, R. Swennen, B. Nicolai, J.
Lammertyn o Instrumental based flavour characterisation of banana fruit
o Food Science and Technology, 42 (2009), pp. 1647–1658
o 16.
o Wright, 2010 o J. Wright o Creating and formulating flavours
o A. Taylor, R. Linforth (Eds.), Food flavour technology (2nd ed.), Blackwell Publishing Ltd., Sussex (2010), pp. 1–23