Embed Size (px)
Citation preview
Sensors and Actuators A 157 (2010) 228–234
Contents lists available at ScienceDirect
Sensors and Actuators A: Physical
journa l homepage: www.e lsev ier .com/ locate /sna
The effects of cubic stiffness on fatigue characterization resonator performance
M. Budnitzkia,b, M.C. Scatesc, R.O. Ritchied, E.A. Stache, C.L. Muhlsteinc, O.N. Pierrona,∗
a G.W. Woodruff School of Mechanical Engineering, Georgia Institute of Technology, 771 Ferst Drive, Atlanta, GA 30332-0405, USAb Technische Universität Bergakademie Freiberg, Institute of Mechanics and Fluid Dynamics, Lampadiusstraße 4, D-09596 Freiberg, Germanyc Department of Materials Science and Engineering, The Pennsylvania State University, University Park, PA 16802, USAd Department of Materials Science and Engineering, University of California, Berkeley, CA 94720, USAe School of Materials Engineering and Birck Nanotechnology Center, Purdue University, West Lafayette, IN 47907, USA
a r t i c l e i n f o
Article history:Received 31 July 2009Received in revised form 6 October 2009Accepted 18 November 2009Available online 26 November 2009
Keywords:MEMS resonatorDuffing behaviorFatigue testing
a b s t r a c t
Micromachined, kHz-frequency resonators are now routinely employed as testing structures to charac-terize the fatigue degradation properties of thin film materials such as polycrystalline silicon (polysilicon).In addition to stress-life (S–N) fatigue curves, important properties such as crack propagation rates maybe inferred from proper resonant frequency measurements throughout a fatigue test. Consequently, anynonlinear dynamic behavior that would complicate the interpretation of resonant frequency changesshould be avoided. In this paper, nonlinear frequency–response curves of a polysilicon fatigue structureare measured in a vacuum environment. Finite element models of the structure are used to identify thesource of geometric nonlinearity leading to a Duffing-type cubic stiffness. Given the origin of the behav-ior, a parametric optimization strategy is performed to minimize the cubic stiffness. This study highlightsthe importance of considering the dynamic behavior when designing resonating structures, especiallywhen they are used for mechanistic studies in various environments.
© 2009 Elsevier B.V. All rights reserved.
1. Introduction
The characterization of mechanical properties with microma-chined resonators is a conceptually simple strategy, as long as theresonator’s response is strictly linear. Provided that the materialproperties and geometry are well defined, analytical and finite ele-ment models can be applied to establish the natural frequenciesof the structure. Then the changes in resonant frequency can beassociated with damage accumulation [1–10], strength can be eval-uated from the amplitude of motion at failure [2,11–14], and thedifferences in resonant frequency of arrays of devices with varyinggeometries can be used to establish the elastic modulus of the mate-rial [15]. However, nonlinear mechanical stiffness [16], nonlinearforcing functions [17–21], and other phenomena such as cracking[10] or residual stress in fixed–fixed beams [22] can induce non-linear responses in the devices. For some applications, nonlineardynamics can be exploited to improve the performance of MEMSsensors [19,23]. In the context of resonator-based fatigue testing ofsilicon thin films, however, linear behavior is preferred because itsimplifies the analysis of fatigue crack growth [10,24]. As such, it isessential to have a clear understanding of why and when nonlin-ear behavior manifests itself in resonant characterization systems
∗ Corresponding author. Tel.: +1 404 894 7877; fax: +1 404 894 8496.E-mail address: [email protected] (O.N. Pierron).
so that it can be controlled and data are properly interpreted. Thepurpose of the present work is therefore twofold: highlight therisk of erroneous mechanistic interpretation when testing nonlin-ear MEMS fatigue resonators, and emphasize the value of assessingthe occurrence of nonlinearities early in the design process usinganalytical and numerical models.
In this paper, a series of in vacuo measurements of a poly-crystalline silicon (polysilicon) fatigue structure are presented(Section 2), where amplitude frequency–response curves exhibitnonlinear behavior (jump phenomenon) for large amplitudes. Twolikely sources of nonlinearity are investigated using analytical andfinite element models: structural nonlinearity and actuator non-linearity (Section 3). Structural nonlinearity may arise when largedisplacements occur and is often described based on the Duffing-type behavior. Actuator nonlinearity may arise if the amplitudeof the forcing function depends on the structure’s displacementand can be modeled with the Mathieu equation. Material nonlin-earity was not considered in this study, as micron-scale silicondoes not deform plastically at room temperature (i.e., the con-stitutive behavior remains elastic) under bending load [25] andthe deformations are small.1 The corresponding simulations of thefrequency–response curves are compared to experimental curves
1 A maximum stress of 3.5 GPa corresponds to a strain of only about 2% in polysil-icon with a Young’s modulus of E = 163 GPa [26].
0924-4247/$ – see front matter © 2009 Elsevier B.V. All rights reserved.doi:10.1016/j.sna.2009.11.020
M. Budnitzki et al. / Sensors and Actuators A 157 (2010) 228–234 229
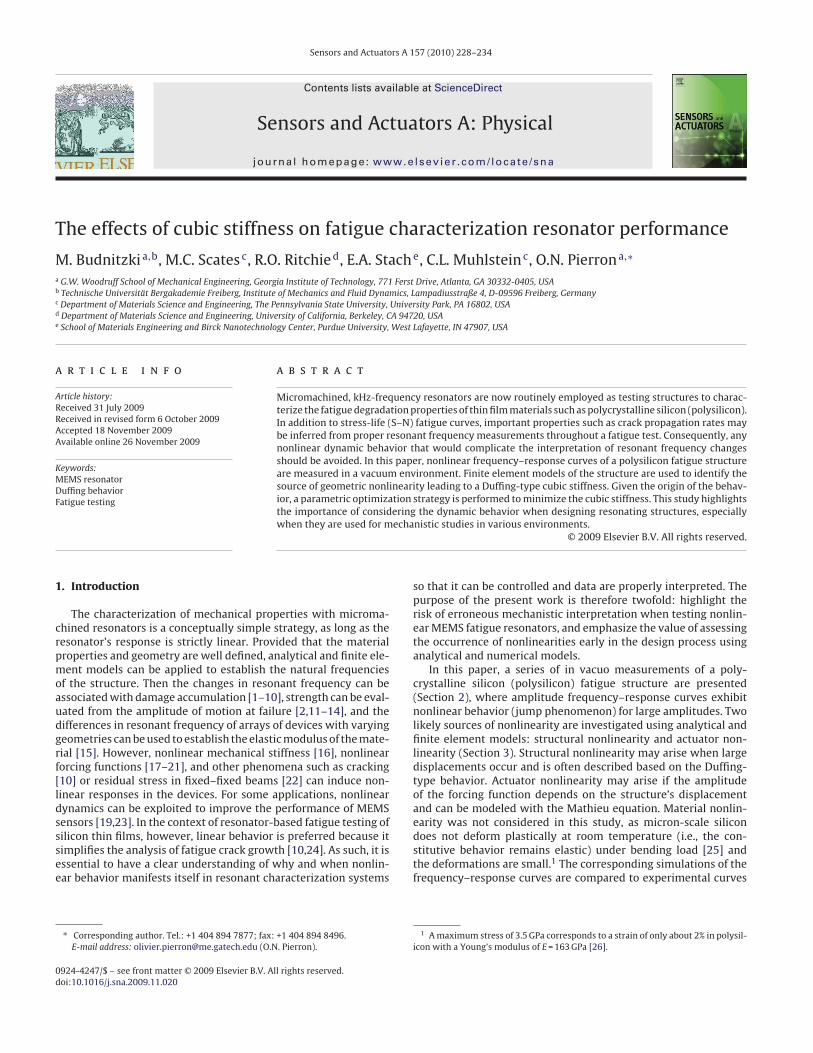
Fig. 1. Scanning electron micrographs of the polysilicon fatigue characterization structure employed in this study (detail of the notched cantilever beam on the right, alongwith the symbols used for its dimensions).
(Section 4), and the implications of nonlinear behavior on the accu-racy of the measured fatigue properties are presented (Section 5)with recommendations for design improvement to minimize non-linearities.
2. Experimental procedures
The fatigue characterization structures (see Fig. 1) employedin this investigation were surface-micromachined with thePolyMUMPsTM fabrication process (Run 18). The structure consistsof a mass-spring rotational oscillator in the form of a fan-shapedmass connected to a notched, cantilever beam. At resonance, largestresses (∼GPa range) can develop at the notch root of the beam.The maximum principal stress, �1, is proportional2 to the ampli-tude of rotation of the structure; the constant of proportionalityis calculated using finite element analysis, as described in Section3.2. Twenty-two pairs of interdigitated fingers (comb drives) lay oneach side of the mass to provide electrostatic actuation and capac-itive sensing of the resulting motion. The fan-shaped mass spans60◦ and has inner and outer radii of ∼30 and 300 �m, respectively.The two comb drive arrays each span 15◦, with a 5◦ overlap. Thefan-shaped mass and comb drive arrays are attached to a sub-strate anchor via a notched cantilever beam (Fig. 1, inset). Thecenter of rotation of the resonator that also defined the geom-etry of the comb fingers and fan-shaped mass is positioned atthe center of the remaining ligament of the notched, cantileverbeam. The critical dimensions that affect the structure’s naturalfrequency and the maximum principal stress at the notch rootare defined in Fig. 1. Specifically, the stiffness of the notched can-tilever beam is a function of its length, L, its width, W, and thelocation and remaining ligament size (h and w, respectively) ofthe 60◦ opening-angle notch. Table 1 lists the measured dimen-sions based on high-magnification scanning electron micrographs.All measurements were made after the devices were released fromthe sacrificial oxide layer (2.5 min in 50% HF followed by 15 min indeionized H2O, 5 min in isopropyl alcohol, and 1 min on a hot plateat ∼110 ◦C) without further post-fabrication modifications such asorganic monolayer or conductive coatings.
2 The effect of cubic stiffness, though crucial for the dynamic response, can beneglected in stress calculations.
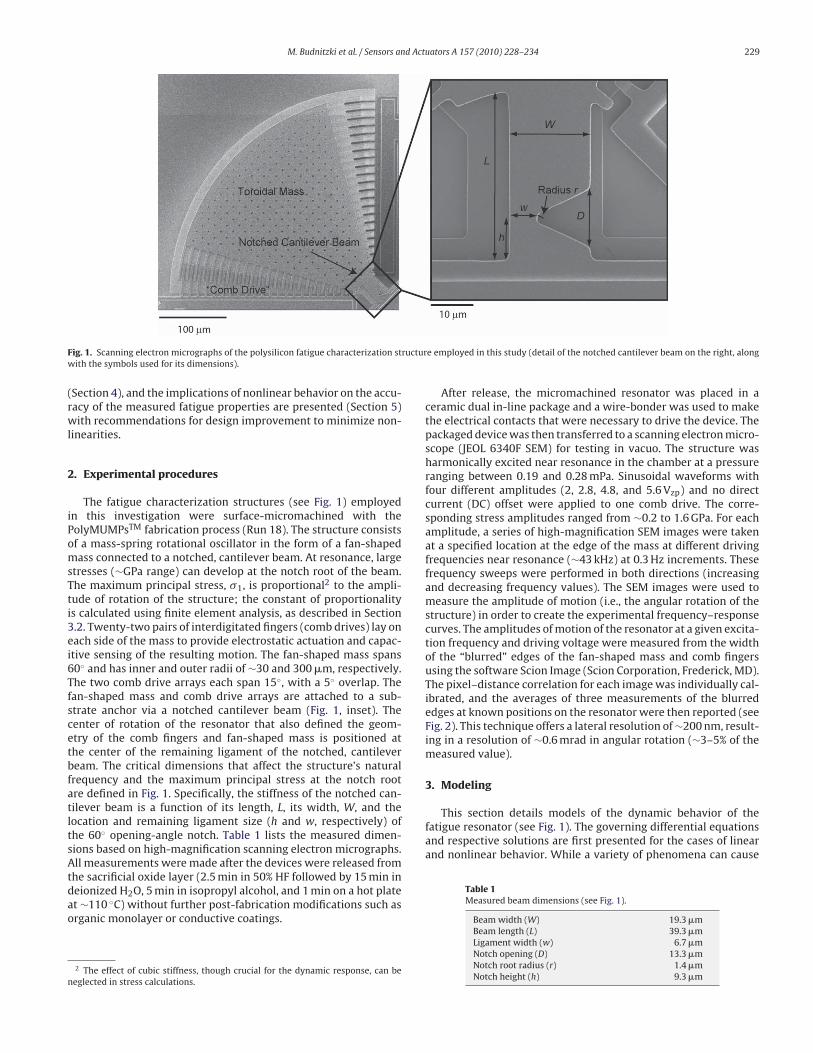
After release, the micromachined resonator was placed in aceramic dual in-line package and a wire-bonder was used to makethe electrical contacts that were necessary to drive the device. Thepackaged device was then transferred to a scanning electron micro-scope (JEOL 6340F SEM) for testing in vacuo. The structure washarmonically excited near resonance in the chamber at a pressureranging between 0.19 and 0.28 mPa. Sinusoidal waveforms withfour different amplitudes (2, 2.8, 4.8, and 5.6 Vzp) and no directcurrent (DC) offset were applied to one comb drive. The corre-sponding stress amplitudes ranged from ∼0.2 to 1.6 GPa. For eachamplitude, a series of high-magnification SEM images were takenat a specified location at the edge of the mass at different drivingfrequencies near resonance (∼43 kHz) at 0.3 Hz increments. Thesefrequency sweeps were performed in both directions (increasingand decreasing frequency values). The SEM images were used tomeasure the amplitude of motion (i.e., the angular rotation of thestructure) in order to create the experimental frequency–responsecurves. The amplitudes of motion of the resonator at a given excita-tion frequency and driving voltage were measured from the widthof the “blurred” edges of the fan-shaped mass and comb fingersusing the software Scion Image (Scion Corporation, Frederick, MD).The pixel–distance correlation for each image was individually cal-ibrated, and the averages of three measurements of the blurrededges at known positions on the resonator were then reported (seeFig. 2). This technique offers a lateral resolution of ∼200 nm, result-ing in a resolution of ∼0.6 mrad in angular rotation (∼3–5% of themeasured value).
3. Modeling
This section details models of the dynamic behavior of thefatigue resonator (see Fig. 1). The governing differential equationsand respective solutions are first presented for the cases of linearand nonlinear behavior. While a variety of phenomena can cause
Table 1Measured beam dimensions (see Fig. 1).
Beam width (W) 19.3 �mBeam length (L) 39.3 �mLigament width (w) 6.7 �mNotch opening (D) 13.3 �mNotch root radius (r) 1.4 �mNotch height (h) 9.3 �m
230 M. Budnitzki et al. / Sensors and Actuators A 157 (2010) 228–234
Fig. 2. Scanning electron micrographs of the polysilicon fatigue characterization structure near resonance. Similar images were used to measure the amplitude of rotationat a given frequency and driving voltage.
nonlinear behavior, this work considers cubic mechanical stiffnessand parametric excitation. Finally, the geometrical model is param-eterized to study the influence of critical geometrical features onthe linearity of the response.
3.1. Governing equations
The fatigue oscillator can, to a first approximation, be modeledas a one-degree-of-freedom, harmonic, rotational oscillator whosegoverning second-order differential equation is:
J��̈ + b�̇ + k�� = M0 sin(2�ft) (1)
where J� is the mass moment of inertia, b the damping coefficient,k� the linear torsional stiffness, M0 the amplitude of the appliedelectrostatic moment, f is the frequency of the applied moment,and �(t) is the angle of rotation of the structure about the midpointof the remaining ligament of the notched beam. The amplitude ofthe applied moment is given by [10]:
M0 = 14
εh
44∑j=1
1ln(ro,j/ri,j)
V2in (2)
where ε is the dielectric permittivity of vacuum, h the thickness ofthe structure (2 �m), ro,j and ri,j are the outer and inner radii of thejth capacitor formed by two adjacent fingers (22 pairs in this work),and Vin is the amplitude (zero-to-peak value) of the applied volt-age. The numerical factor of 1/4 results from the forcing momentbeing a quadratic function of the applied sinusoidal waveform (theconstant part of the forcing function is negligible on the overallresponse for lightly damped resonators, as is the case for the fatiguestructure). The general form of the solution to Eq. (1) is given by:
�(t) = M0
k�
f0/f
[(f0/f − f/f0)2 + 1/Q 2]1/2
cos(2�ft − ı)
= � cos(2�ft − ı) (3)
where f0 is the undamped resonant frequency, ı is a phase shift dueto the damping force, � is the amplitude of rotation, and Q is thequality factor defined by:
Q = f0�f
≈ 2�f0�
(4)
where �f represents the full width at half-power (the amplitude athalf-power points is approximately 70.7% of the peak amplitude)[27], and � = b/J� is the damping ratio.
In the case of a nonlinear spring force with a cubic stiffness, Eq.(1) becomes Duffing’s equation [28]:
J��̈ + b�̇ + k�� + k�3�3 = M0 sin(2�ft) (5)
where k�3 is the cubic stiffness coefficient. The correspond-ing amplitude of rotation � is given by the followingfrequency–response equation:
[(k�
J�− (2�f )2
)� + 3
4k�3
J��3
]2
+(
b
J�2�f�
)2
=(
M0
J�
)2(6)
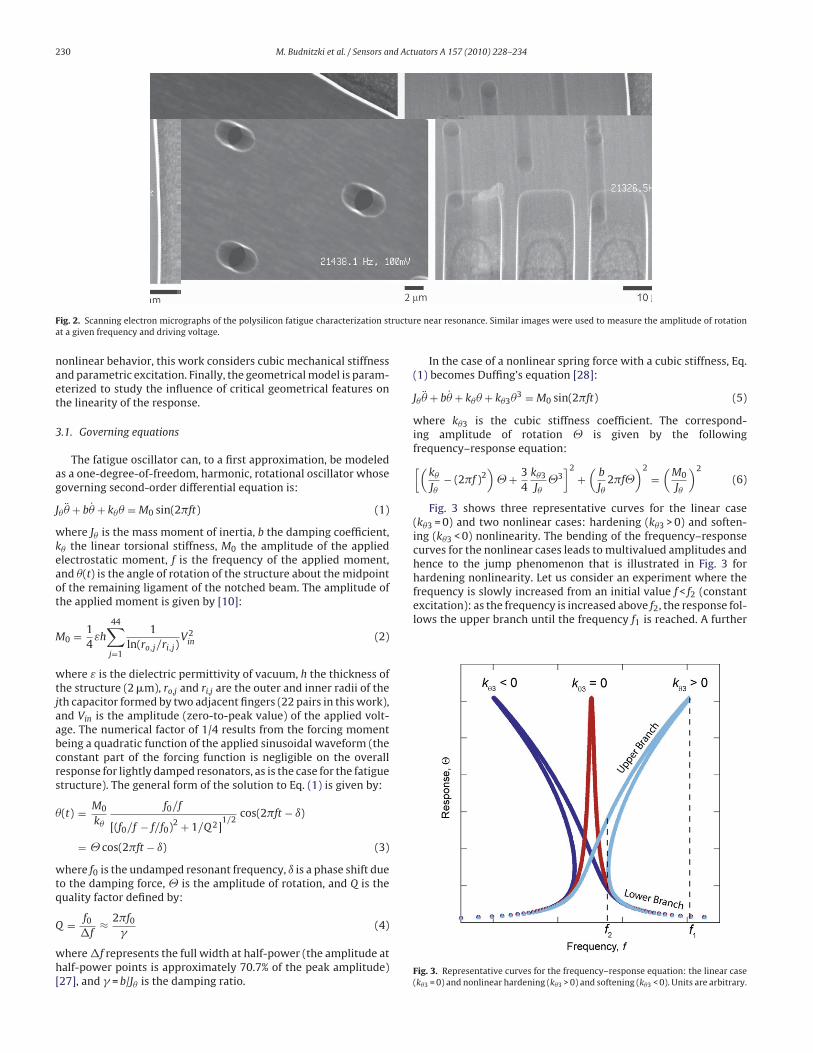
Fig. 3 shows three representative curves for the linear case(k�3 = 0) and two nonlinear cases: hardening (k�3 > 0) and soften-ing (k�3 < 0) nonlinearity. The bending of the frequency–responsecurves for the nonlinear cases leads to multivalued amplitudes andhence to the jump phenomenon that is illustrated in Fig. 3 forhardening nonlinearity. Let us consider an experiment where thefrequency is slowly increased from an initial value f < f2 (constantexcitation): as the frequency is increased above f2, the response fol-lows the upper branch until the frequency f1 is reached. A further
Fig. 3. Representative curves for the frequency–response equation: the linear case(k�3 = 0) and nonlinear hardening (k�3 > 0) and softening (k�3 < 0). Units are arbitrary.

M. Budnitzki et al. / Sensors and Actuators A 157 (2010) 228–234 231
Fig. 4. Illustration of the influence of excitation (a) and damping (b) on Duffing’s frequency–response curves (arbitrary units).
increase in frequency causes the response to jump to the lowerbranch. Conversely, if the frequency is slowly decreased from an ini-tial value above f1, the response remains on the lower branch untilthe frequency reaches f2. Lowering the frequency further causesthe response to jump to the upper branch. The apparent maxi-mum response therefore depends on the direction in which thefrequency is swept, which has important consequences for the test-ing of fatigue structures in vacuum (see Section 5).
Fig. 4(a) illustrates the influence of the applied moment on theresulting frequency–response curve, while Fig. 4(b) illustrates theinfluence of damping. In both cases, the frequency correspondingto the maximum response is given by the following equation:
f = 12�
√k� + (3/4)k�3�2
J�≈ f0
(1 + 3
8k�3
k��2
)(7)
Another common origin of nonlinear effects is a nonideal exci-tation source. In the case of the fatigue structure shown in Fig. 1,a nonideal excitation may exist if the electrostatic forces dependon the angular rotation of the structure. Specifically, the electro-static forces may increase for large angular rotation due to theproximity of the moving fingers’ tips to the stator basis [29]. Thecorresponding governing equation is in that case is:
J��̈ + b�̇ + k�� = M0(�) sin(2�ft) (8)
where M0(�) is the amplitude of the applied electrostatic momentthat depends on the angular rotation. This differential equationcannot be analytically solved, and numerical strategies need to beapplied (see for example [21] for a treatment of parametric excita-tion using the Mathieu equation).
3.2. Finite element modeling
A static analysis using the commercial finite element (FE)software ANSYS v. 11.0 was employed to study the (geometric)mechanical nonlinearity of the fatigue resonator due to large-deflection effects. 2D models of the entire structure (notched beamwith the fan-shaped mass; see Fig. 1) were employed to calculateits (nonlinear) stiffness. A pressure was applied along one edge ofthe plate to simulate the moment applied via electrostatic forceswhile the displacements at the bottom of the beam were set tozero. The resulting motion of the structure was computed in asmall strain, finite rotation analysis. Specifically, the NLGEOM,ONcommand [30] was issued to account for the geometric stiffnessas well as follower forces [31], while the Saint Venant-Kirchhoffmaterial with E = 163 GPa, � = 0.23 [26] was used as constitutiverelation. The geometry of the structure was fully parameterizedto evaluate the stiffness of the PolyMUMPsTM 18 structure as well
as modified geometries. The measured critical dimensions of thePolyMUMPsTM 18 structure (see Table 1) were used, as opposedto nominal, “as-drawn” values. The meshing was performed using8-node quadrilateral elements (PLANE 82) with the mesh densitylocally increased at the notch. The mesh was refined until conver-gence of the results was achieved.
4. Results
Fig. 5 shows the measured frequency–response curves of thefatigue structure (Fig. 1) in a vacuum environment (P ∼0.2 mPa),for four different driving amplitudes. At low signal amplitude (2 V),the curve is symmetric (quality factor Q equal to approximately40,000). However, at higher amplitudes the measured behaviorcorresponds to that of a nonlinear oscillator. At 2.8 V the responsecurve is asymmetric, and a jump behavior develops at 4.8 and 5.6 V,as illustrated in Fig. 5 for the largest signal amplitude.
Previous studies performed on comb drives [29,32,33] indicatethat the amplitude of applied moment (M0) is fairly constant for �less than 0.04 rad, above which it increases due to the electrostaticforces between the tip of the moving finger and the base of thestator. Since the nonlinear behavior was observed experimentallyfor maximum amplitude of rotation less than 0.02 rad (see Fig. 4),the origin of the nonlinearities cannot be parametric excitation.
Fig. 5. Measured frequency–response curves for the fatigue structure (see Fig. 1)tested in vacuo.
232 M. Budnitzki et al. / Sensors and Actuators A 157 (2010) 228–234
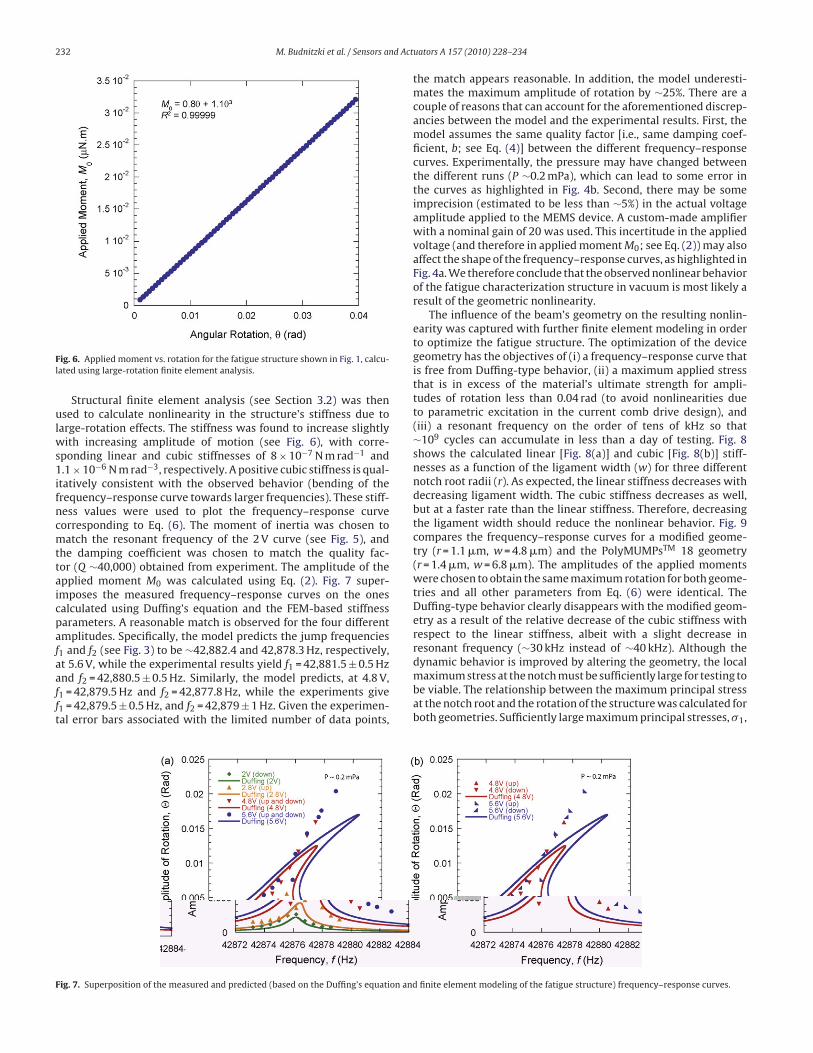
Fig. 6. Applied moment vs. rotation for the fatigue structure shown in Fig. 1, calcu-lated using large-rotation finite element analysis.
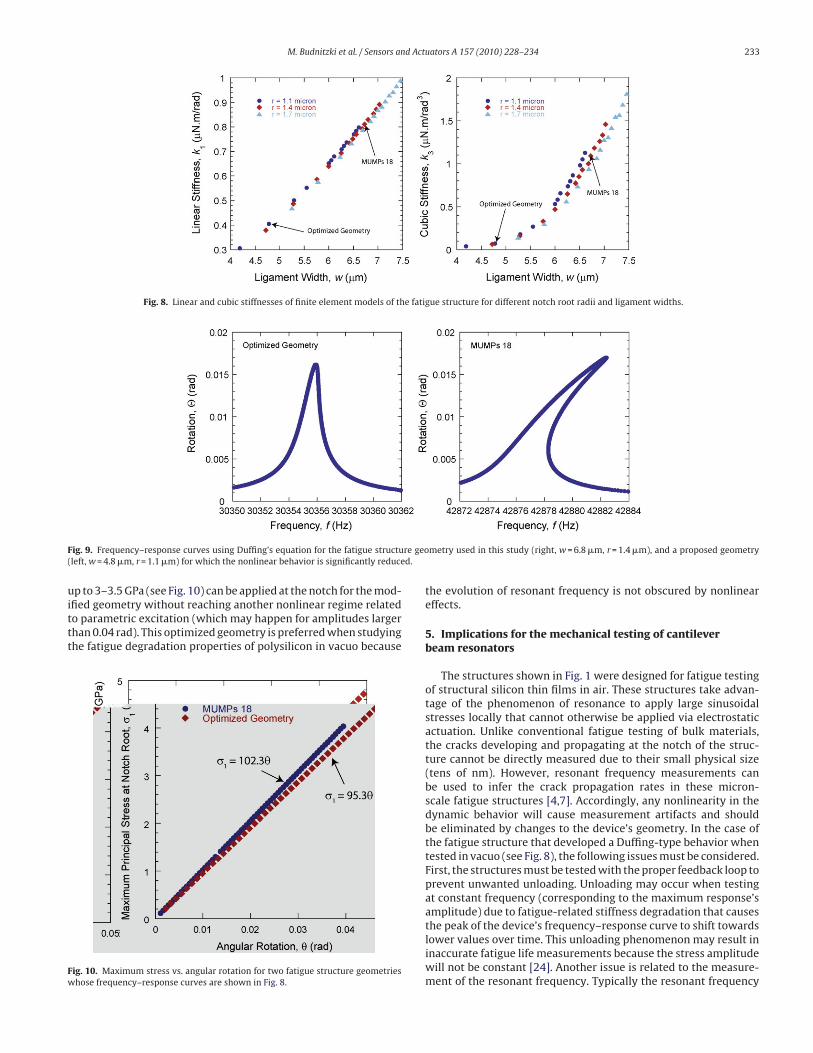
Structural finite element analysis (see Section 3.2) was thenused to calculate nonlinearity in the structure’s stiffness due tolarge-rotation effects. The stiffness was found to increase slightlywith increasing amplitude of motion (see Fig. 6), with corre-sponding linear and cubic stiffnesses of 8 × 10⁻⁷ N m rad−1 and1.1 × 10−6 N m rad−3, respectively. A positive cubic stiffness is qual-itatively consistent with the observed behavior (bending of thefrequency–response curve towards larger frequencies). These stiff-ness values were used to plot the frequency–response curvecorresponding to Eq. (6). The moment of inertia was chosen tomatch the resonant frequency of the 2 V curve (see Fig. 5), andthe damping coefficient was chosen to match the quality fac-tor (Q ∼40,000) obtained from experiment. The amplitude of theapplied moment M0 was calculated using Eq. (2). Fig. 7 super-imposes the measured frequency–response curves on the onescalculated using Duffing’s equation and the FEM-based stiffnessparameters. A reasonable match is observed for the four differentamplitudes. Specifically, the model predicts the jump frequenciesf1 and f2 (see Fig. 3) to be ∼42,882.4 and 42,878.3 Hz, respectively,at 5.6 V, while the experimental results yield f1 = 42,881.5 ± 0.5 Hzand f2 = 42,880.5 ± 0.5 Hz. Similarly, the model predicts, at 4.8 V,f1 = 42,879.5 Hz and f2 = 42,877.8 Hz, while the experiments givef1 = 42,879.5 ± 0.5 Hz, and f2 = 42,879 ± 1 Hz. Given the experimen-tal error bars associated with the limited number of data points,
the match appears reasonable. In addition, the model underesti-mates the maximum amplitude of rotation by ∼25%. There are acouple of reasons that can account for the aforementioned discrep-ancies between the model and the experimental results. First, themodel assumes the same quality factor [i.e., same damping coef-ficient, b; see Eq. (4)] between the different frequency–responsecurves. Experimentally, the pressure may have changed betweenthe different runs (P ∼0.2 mPa), which can lead to some error inthe curves as highlighted in Fig. 4b. Second, there may be someimprecision (estimated to be less than ∼5%) in the actual voltageamplitude applied to the MEMS device. A custom-made amplifierwith a nominal gain of 20 was used. This incertitude in the appliedvoltage (and therefore in applied moment M0; see Eq. (2)) may alsoaffect the shape of the frequency–response curves, as highlighted inFig. 4a. We therefore conclude that the observed nonlinear behaviorof the fatigue characterization structure in vacuum is most likely aresult of the geometric nonlinearity.
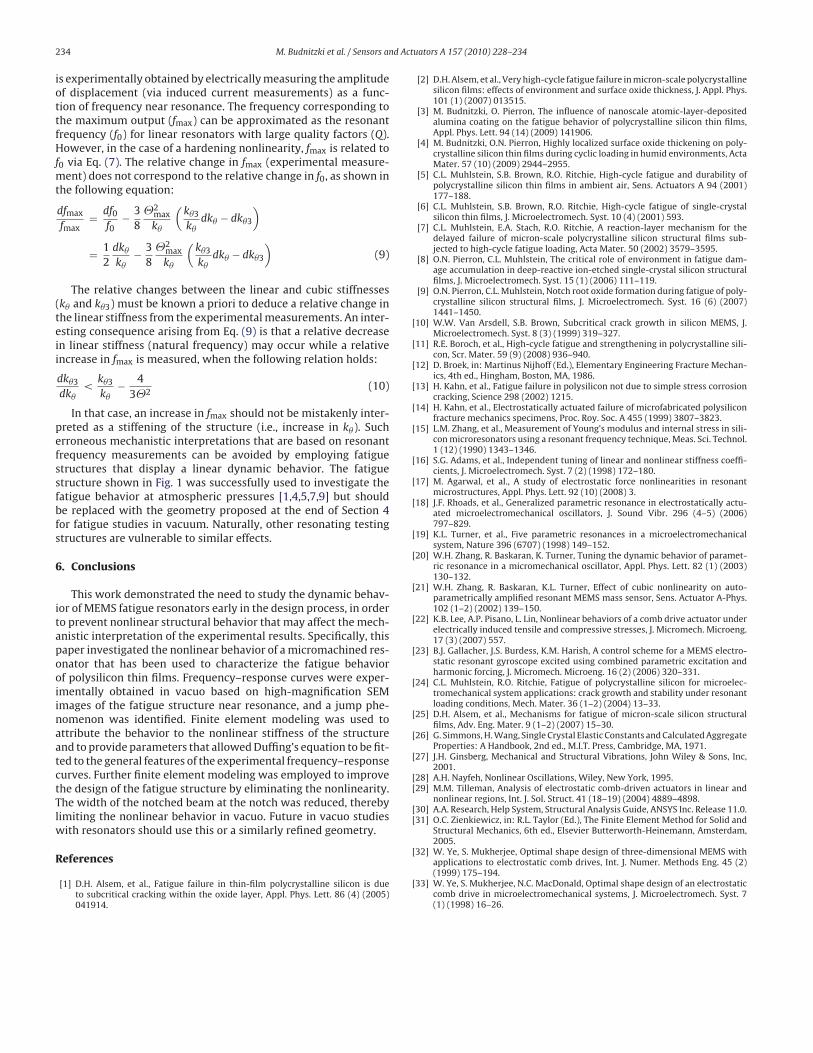
The influence of the beam’s geometry on the resulting nonlin-earity was captured with further finite element modeling in orderto optimize the fatigue structure. The optimization of the devicegeometry has the objectives of (i) a frequency–response curve thatis free from Duffing-type behavior, (ii) a maximum applied stressthat is in excess of the material’s ultimate strength for ampli-tudes of rotation less than 0.04 rad (to avoid nonlinearities dueto parametric excitation in the current comb drive design), and(iii) a resonant frequency on the order of tens of kHz so that∼109 cycles can accumulate in less than a day of testing. Fig. 8shows the calculated linear [Fig. 8(a)] and cubic [Fig. 8(b)] stiff-nesses as a function of the ligament width (w) for three differentnotch root radii (r). As expected, the linear stiffness decreases withdecreasing ligament width. The cubic stiffness decreases as well,but at a faster rate than the linear stiffness. Therefore, decreasingthe ligament width should reduce the nonlinear behavior. Fig. 9compares the frequency–response curves for a modified geome-try (r = 1.1 �m, w = 4.8 �m) and the PolyMUMPsTM 18 geometry(r = 1.4 �m, w = 6.8 �m). The amplitudes of the applied momentswere chosen to obtain the same maximum rotation for both geome-tries and all other parameters from Eq. (6) were identical. TheDuffing-type behavior clearly disappears with the modified geom-etry as a result of the relative decrease of the cubic stiffness withrespect to the linear stiffness, albeit with a slight decrease inresonant frequency (∼30 kHz instead of ∼40 kHz). Although thedynamic behavior is improved by altering the geometry, the localmaximum stress at the notch must be sufficiently large for testing tobe viable. The relationship between the maximum principal stressat the notch root and the rotation of the structure was calculated forboth geometries. Sufficiently large maximum principal stresses, �1,
Fig. 7. Superposition of the measured and predicted (based on the Duffing’s equation and finite element modeling of the fatigue structure) frequency–response curves.
M. Budnitzki et al. / Sensors and Actuators A 157 (2010) 228–234 233
Fig. 8. Linear and cubic stiffnesses of finite element models of the fatigue structure for different notch root radii and ligament widths.
Fig. 9. Frequency–response curves using Duffing’s equation for the fatigue structure geometry used in this study (right, w = 6.8 �m, r = 1.4 �m), and a proposed geometry(left, w = 4.8 �m, r = 1.1 �m) for which the nonlinear behavior is significantly reduced.
up to 3–3.5 GPa (see Fig. 10) can be applied at the notch for the mod-ified geometry without reaching another nonlinear regime relatedto parametric excitation (which may happen for amplitudes largerthan 0.04 rad). This optimized geometry is preferred when studyingthe fatigue degradation properties of polysilicon in vacuo because
Fig. 10. Maximum stress vs. angular rotation for two fatigue structure geometrieswhose frequency–response curves are shown in Fig. 8.
the evolution of resonant frequency is not obscured by nonlineareffects.
5. Implications for the mechanical testing of cantileverbeam resonators
The structures shown in Fig. 1 were designed for fatigue testingof structural silicon thin films in air. These structures take advan-tage of the phenomenon of resonance to apply large sinusoidalstresses locally that cannot otherwise be applied via electrostaticactuation. Unlike conventional fatigue testing of bulk materials,the cracks developing and propagating at the notch of the struc-ture cannot be directly measured due to their small physical size(tens of nm). However, resonant frequency measurements canbe used to infer the crack propagation rates in these micron-scale fatigue structures [4,7]. Accordingly, any nonlinearity in thedynamic behavior will cause measurement artifacts and shouldbe eliminated by changes to the device’s geometry. In the case ofthe fatigue structure that developed a Duffing-type behavior whentested in vacuo (see Fig. 8), the following issues must be considered.First, the structures must be tested with the proper feedback loop toprevent unwanted unloading. Unloading may occur when testingat constant frequency (corresponding to the maximum response’samplitude) due to fatigue-related stiffness degradation that causesthe peak of the device’s frequency–response curve to shift towardslower values over time. This unloading phenomenon may result ininaccurate fatigue life measurements because the stress amplitudewill not be constant [24]. Another issue is related to the measure-ment of the resonant frequency. Typically the resonant frequency
234 M. Budnitzki et al. / Sensors and Actuators A 157 (2010) 228–234
is experimentally obtained by electrically measuring the amplitudeof displacement (via induced current measurements) as a func-tion of frequency near resonance. The frequency corresponding tothe maximum output (fmax) can be approximated as the resonantfrequency (f0) for linear resonators with large quality factors (Q).However, in the case of a hardening nonlinearity, fmax is related tof0 via Eq. (7). The relative change in fmax (experimental measure-ment) does not correspond to the relative change in f0, as shown inthe following equation:
dfmax
fmax= df0
f0− 3
8�2
maxk�
(k�3
k�dk� − dk�3
)
= 12
dk�
k�− 3
8�2
maxk�
(k�3
k�dk� − dk�3
)(9)
The relative changes between the linear and cubic stiffnesses(k� and k�3) must be known a priori to deduce a relative change inthe linear stiffness from the experimental measurements. An inter-esting consequence arising from Eq. (9) is that a relative decreasein linear stiffness (natural frequency) may occur while a relativeincrease in fmax is measured, when the following relation holds:
dk�3
dk�<
k�3
k�− 4
3�2(10)
In that case, an increase in fmax should not be mistakenly inter-preted as a stiffening of the structure (i.e., increase in k�). Sucherroneous mechanistic interpretations that are based on resonantfrequency measurements can be avoided by employing fatiguestructures that display a linear dynamic behavior. The fatiguestructure shown in Fig. 1 was successfully used to investigate thefatigue behavior at atmospheric pressures [1,4,5,7,9] but shouldbe replaced with the geometry proposed at the end of Section 4for fatigue studies in vacuum. Naturally, other resonating testingstructures are vulnerable to similar effects.
6. Conclusions
This work demonstrated the need to study the dynamic behav-ior of MEMS fatigue resonators early in the design process, in orderto prevent nonlinear structural behavior that may affect the mech-anistic interpretation of the experimental results. Specifically, thispaper investigated the nonlinear behavior of a micromachined res-onator that has been used to characterize the fatigue behaviorof polysilicon thin films. Frequency–response curves were exper-imentally obtained in vacuo based on high-magnification SEMimages of the fatigue structure near resonance, and a jump phe-nomenon was identified. Finite element modeling was used toattribute the behavior to the nonlinear stiffness of the structureand to provide parameters that allowed Duffing’s equation to be fit-ted to the general features of the experimental frequency–responsecurves. Further finite element modeling was employed to improvethe design of the fatigue structure by eliminating the nonlinearity.The width of the notched beam at the notch was reduced, therebylimiting the nonlinear behavior in vacuo. Future in vacuo studieswith resonators should use this or a similarly refined geometry.
References
[1] D.H. Alsem, et al., Fatigue failure in thin-film polycrystalline silicon is dueto subcritical cracking within the oxide layer, Appl. Phys. Lett. 86 (4) (2005)041914.
[2] D.H. Alsem, et al., Very high-cycle fatigue failure in micron-scale polycrystallinesilicon films: effects of environment and surface oxide thickness, J. Appl. Phys.101 (1) (2007) 013515.
[3] M. Budnitzki, O. Pierron, The influence of nanoscale atomic-layer-depositedalumina coating on the fatigue behavior of polycrystalline silicon thin films,Appl. Phys. Lett. 94 (14) (2009) 141906.
[4] M. Budnitzki, O.N. Pierron, Highly localized surface oxide thickening on poly-crystalline silicon thin films during cyclic loading in humid environments, ActaMater. 57 (10) (2009) 2944–2955.
[5] C.L. Muhlstein, S.B. Brown, R.O. Ritchie, High-cycle fatigue and durability ofpolycrystalline silicon thin films in ambient air, Sens. Actuators A 94 (2001)177–188.
[6] C.L. Muhlstein, S.B. Brown, R.O. Ritchie, High-cycle fatigue of single-crystalsilicon thin films, J. Microelectromech. Syst. 10 (4) (2001) 593.
[7] C.L. Muhlstein, E.A. Stach, R.O. Ritchie, A reaction-layer mechanism for thedelayed failure of micron-scale polycrystalline silicon structural films sub-jected to high-cycle fatigue loading, Acta Mater. 50 (2002) 3579–3595.
[8] O.N. Pierron, C.L. Muhlstein, The critical role of environment in fatigue dam-age accumulation in deep-reactive ion-etched single-crystal silicon structuralfilms, J. Microelectromech. Syst. 15 (1) (2006) 111–119.
[9] O.N. Pierron, C.L. Muhlstein, Notch root oxide formation during fatigue of poly-crystalline silicon structural films, J. Microelectromech. Syst. 16 (6) (2007)1441–1450.
[10] W.W. Van Arsdell, S.B. Brown, Subcritical crack growth in silicon MEMS, J.Microelectromech. Syst. 8 (3) (1999) 319–327.
[11] R.E. Boroch, et al., High-cycle fatigue and strengthening in polycrystalline sili-con, Scr. Mater. 59 (9) (2008) 936–940.
[12] D. Broek, in: Martinus Nijhoff (Ed.), Elementary Engineering Fracture Mechan-ics, 4th ed., Hingham, Boston, MA, 1986.
[13] H. Kahn, et al., Fatigue failure in polysilicon not due to simple stress corrosioncracking, Science 298 (2002) 1215.
[14] H. Kahn, et al., Electrostatically actuated failure of microfabricated polysiliconfracture mechanics specimens, Proc. Roy. Soc. A 455 (1999) 3807–3823.
[15] L.M. Zhang, et al., Measurement of Young’s modulus and internal stress in sili-con microresonators using a resonant frequency technique, Meas. Sci. Technol.1 (12) (1990) 1343–1346.
[16] S.G. Adams, et al., Independent tuning of linear and nonlinear stiffness coeffi-cients, J. Microelectromech. Syst. 7 (2) (1998) 172–180.
[17] M. Agarwal, et al., A study of electrostatic force nonlinearities in resonantmicrostructures, Appl. Phys. Lett. 92 (10) (2008) 3.
[18] J.F. Rhoads, et al., Generalized parametric resonance in electrostatically actu-ated microelectromechanical oscillators, J. Sound Vibr. 296 (4–5) (2006)797–829.
[19] K.L. Turner, et al., Five parametric resonances in a microelectromechanicalsystem, Nature 396 (6707) (1998) 149–152.
[20] W.H. Zhang, R. Baskaran, K. Turner, Tuning the dynamic behavior of paramet-ric resonance in a micromechanical oscillator, Appl. Phys. Lett. 82 (1) (2003)130–132.
[21] W.H. Zhang, R. Baskaran, K.L. Turner, Effect of cubic nonlinearity on auto-parametrically amplified resonant MEMS mass sensor, Sens. Actuator A-Phys.102 (1–2) (2002) 139–150.
[22] K.B. Lee, A.P. Pisano, L. Lin, Nonlinear behaviors of a comb drive actuator underelectrically induced tensile and compressive stresses, J. Micromech. Microeng.17 (3) (2007) 557.
[23] B.J. Gallacher, J.S. Burdess, K.M. Harish, A control scheme for a MEMS electro-static resonant gyroscope excited using combined parametric excitation andharmonic forcing, J. Micromech. Microeng. 16 (2) (2006) 320–331.
[24] C.L. Muhlstein, R.O. Ritchie, Fatigue of polycrystalline silicon for microelec-tromechanical system applications: crack growth and stability under resonantloading conditions, Mech. Mater. 36 (1–2) (2004) 13–33.
[25] D.H. Alsem, et al., Mechanisms for fatigue of micron-scale silicon structuralfilms, Adv. Eng. Mater. 9 (1–2) (2007) 15–30.
[26] G. Simmons, H. Wang, Single Crystal Elastic Constants and Calculated AggregateProperties: A Handbook, 2nd ed., M.I.T. Press, Cambridge, MA, 1971.
[27] J.H. Ginsberg, Mechanical and Structural Vibrations, John Wiley & Sons, Inc,2001.
[28] A.H. Nayfeh, Nonlinear Oscillations, Wiley, New York, 1995.[29] M.M. Tilleman, Analysis of electrostatic comb-driven actuators in linear and
nonlinear regions, Int. J. Sol. Struct. 41 (18–19) (2004) 4889–4898.[30] A.A. Research, Help System, Structural Analysis Guide, ANSYS Inc. Release 11.0.[31] O.C. Zienkiewicz, in: R.L. Taylor (Ed.), The Finite Element Method for Solid and
Structural Mechanics, 6th ed., Elsevier Butterworth-Heinemann, Amsterdam,2005.
[32] W. Ye, S. Mukherjee, Optimal shape design of three-dimensional MEMS withapplications to electrostatic comb drives, Int. J. Numer. Methods Eng. 45 (2)(1999) 175–194.
[33] W. Ye, S. Mukherjee, N.C. MacDonald, Optimal shape design of an electrostaticcomb drive in microelectromechanical systems, J. Microelectromech. Syst. 7(1) (1998) 16–26.