Embed Size (px)
Citation preview
Turk J Elec Eng & Comp Sci
(2015) 23: 17 – 27
c⃝ TUBITAK
doi:10.3906/elk-1111-40
Turkish Journal of Electrical Engineering & Computer Sciences
http :// journa l s . tub i tak .gov . t r/e lektr ik/
Research Article
Sensitivity analysis and optimum design for the stator of synchronous reluctance
machines using the coupled finite element and Taguchi methods
Hossein AZIZI∗, Abolfazal VAHEDIDepartment of Electrical Engineering, Center of Excellence for Power System Automation and Operation
Iran University of Science and Technology, Narmak, Tehran, Iran
Received: 17.11.2011 • Accepted: 13.11.2012 • Published Online: 12.01.2015 • Printed: 09.02.2015
Abstract:This paper presents an investigation of the effect and optimization of stator geometry design parameters on the
performance of synchronous reluctance machines (SynRMs). The level of importance of the stator design variable on the
characteristic of the SynRM is determined using both the Taguchi method and a parametric analysis. An optimum design
parameter combination is obtained using sensitivity analysis along with signal-to-noise ratio results. The 2-dimensional
finite element model (FEM) of a SynRM is used to perform a sensitivity analysis and construct a Taguchi design of the
experiment. The FEM simulation results confirm that the performance of the SynRM can be improved significantly in
comparison with the initial design, using the proposed Taguchi method.
Key words: Synchronous reluctance machines, Taguchi method, finite element method, orthogonal array, sensitivity
analysis
1. Introduction
Generally, induction motors are the most common solution for many industrial applications because of their
robust structure, line start capability, and simple manufacturing process. However, in recent years, synchronous
reluctance machines (SynRMs) have gained interest due to their several advantages, especially because of their
variable speed and servo drive systems. SynRMs employ a high torque density, fault-tolerant capability, high
efficiency, and simple controllability in comparison with induction machines [1–3]. Moreover, the inverter-fed
SynRM has negligible rotor losses, which leads to both an efficiency improvement and a reduction in thermal
problems related to the rotor and bearing. Despite several advantages of the SynRM, the low operating power
factor and high contents of the torque ripple are 2 main drawbacks of such machines. Hence, to improve
the developed torque and power factor, a high saliency ratio is required. To achieve a high saliency ratio,
different types of rotor structures, such as single-barrier rotors, multibarrier rotors, and axially and transversally
laminated rotors, can be used [4]. In the SynRM, the flux density in the stator and rotor is fluctuated because of
the anisotropy of the rotor, spatial stator winding, and slot harmonics. Therefore, additional high-frequency iron
losses in the stator teeth and rotor ribs increase the total core loss and reduce the efficiency [5]. The harmonic
contents of air gap flux density and related core loss highly depend on the stator geometry parameters. Usually,
the SynRM stator is like an asynchronous stator, although, considering the high flux density fluctuation in
the SynRM, studying the stator slot parameter design in order to investigate the performance of the SynRM is
essential [6]. Efficiency improvement can be achieved through the design optimization of the stator slot geometry
∗Correspondence: [email protected]
38
AZIZI and VAHEDI/Turk J Elec Eng & Comp Sci
parameters. The effect of the stator slot and air gap length on the SynRM performance was studied in [5–7].
Nevertheless, the optimal designing of the stator slot and air gap length for the SynRM was not performed.
The effect of the stator winding chording, rotor skewing, and stator slot number on the average torque, power
factor, and torque ripple of a reluctance synchronous machine was investigated using the 2-dimensional (2D)
finite element time method in [8]. The open width of the slot, slot depth, teeth width, and flux barrier width
in order to optimize the torque ripple in a concentrated winding SynRM were studied in [9]. The stator iron
and windings were designed to minimize the rotor losses in [10].
In this paper, the effects of the air gap length, and number of stator slots, closed slots, and open slots
are investigated. Several approaches are presented to investigate the effects of different controlled variables in
the design process [11–13]. The Taguchi method is a new engineering design optimization methodology that
improves the quality of existing processes and simultaneously reduces their costs. In this method, by developing
a set of standard orthogonal arrays (OAs), as well as a methodology for the analysis of the results, information
from the experiment can be extracted more accurately with higher efficiency. Moreover, fewer tests are needed,
even when the number of parameters being investigated is quite large.
The focus of this paper is on achieving optimum stator slot geometry parameters, as well as air gap
length, in order to enhance the performance of the SynRM. In this paper, first, the parametric analysis is
performed to consider the effect of each individual design parameter on the performance of the SynRM. Next,
the contribution of several stator design parameters on the characteristics of the SynRM is taken into account
using the L27 7-parameter, 3-level OA. The sensitivity analysis results and Taguchi parameter design are used
to determine the optimum stator design for maximizing the motor efficiency and minimizing the rotor core loss.
The interaction effects of the design variable are considered in the optimization process. Transient finite element
model (FEM) simulations verify the improvement of the SynRM performance characteristics.
2. 2D FEM and design parameter definition
The 2D FEM of the SynRM is used to execute a parametric analysis and construct a Taguchi design of the
experiments. The initial design parameters of the 2.5-kW, 400-V, 200-Hz, 4-pole, 36-slot, 4-flux barrier SynRM
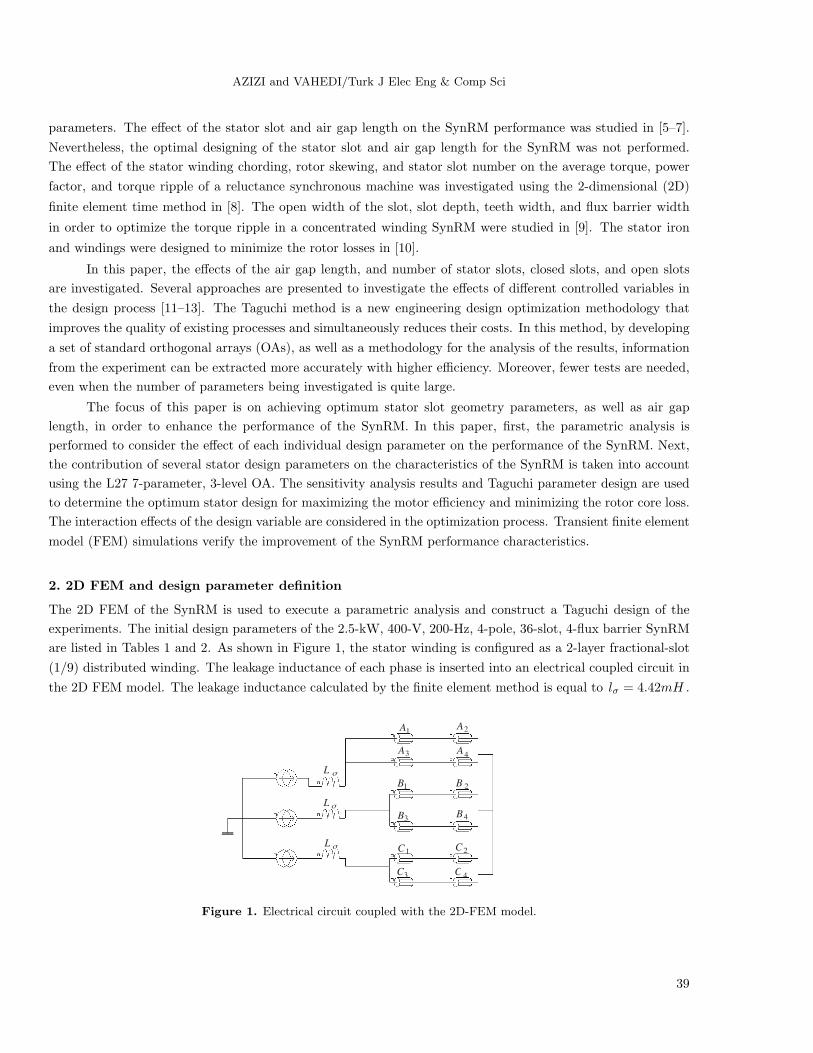
are listed in Tables 1 and 2. As shown in Figure 1, the stator winding is configured as a 2-layer fractional-slot
(1/9) distributed winding. The leakage inductance of each phase is inserted into an electrical coupled circuit in
the 2D FEM model. The leakage inductance calculated by the finite element method is equal to lσ = 4.42mH .
σ�L�
σ�L�
σ�L
1A 2A�
3A 4�A�
1B� 2�B
3B 4B�
1C 2C�
3C 4�C�
Figure 1. Electrical circuit coupled with the 2D-FEM model.
39
AZIZI and VAHEDI/Turk J Elec Eng & Comp Sci
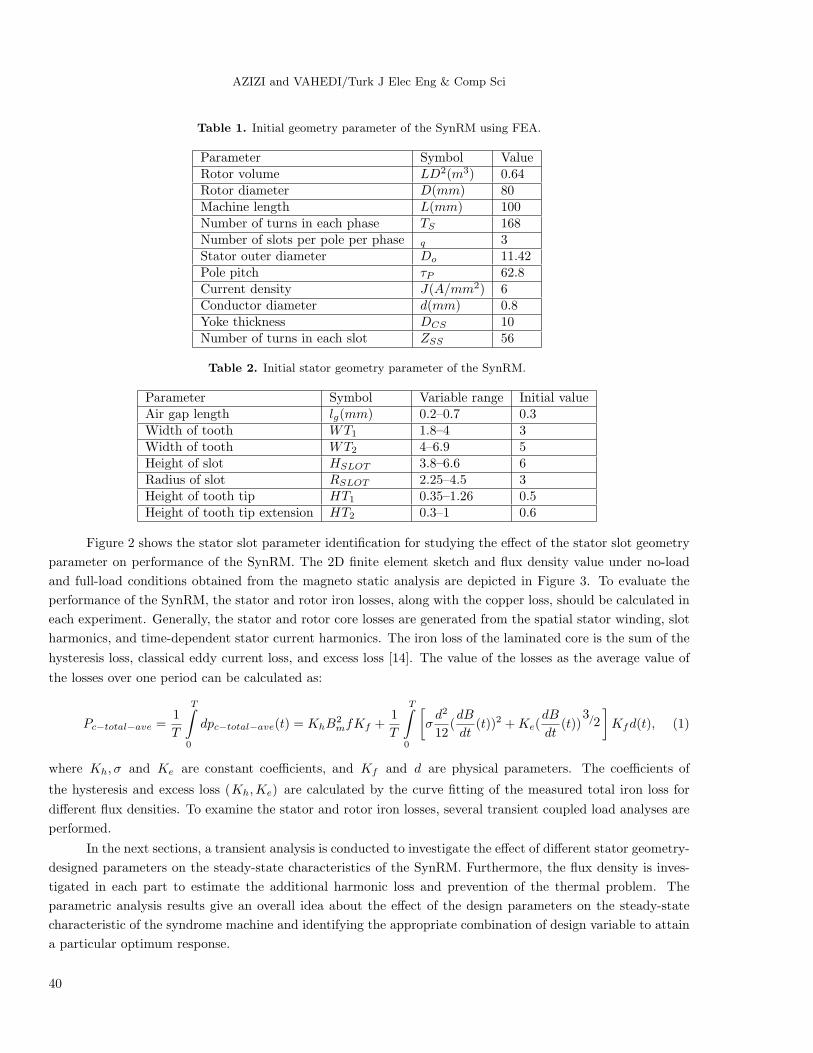
Table 1. Initial geometry parameter of the SynRM using FEA.
Parameter Symbol ValueRotor volume LD2(m3) 0.64Rotor diameter D(mm) 80Machine length L(mm) 100Number of turns in each phase TS 168Number of slots per pole per phase q 3Stator outer diameter Do 11.42Pole pitch τP 62.8Current density J(A/mm2) 6Conductor diameter d(mm) 0.8Yoke thickness DCS 10Number of turns in each slot ZSS 56
Table 2. Initial stator geometry parameter of the SynRM.
Parameter Symbol Variable range Initial valueAir gap length lg(mm) 0.2–0.7 0.3Width of tooth WT1 1.8–4 3Width of tooth WT2 4–6.9 5Height of slot HSLOT 3.8–6.6 6Radius of slot RSLOT 2.25–4.5 3Height of tooth tip HT1 0.35–1.26 0.5Height of tooth tip extension HT2 0.3–1 0.6
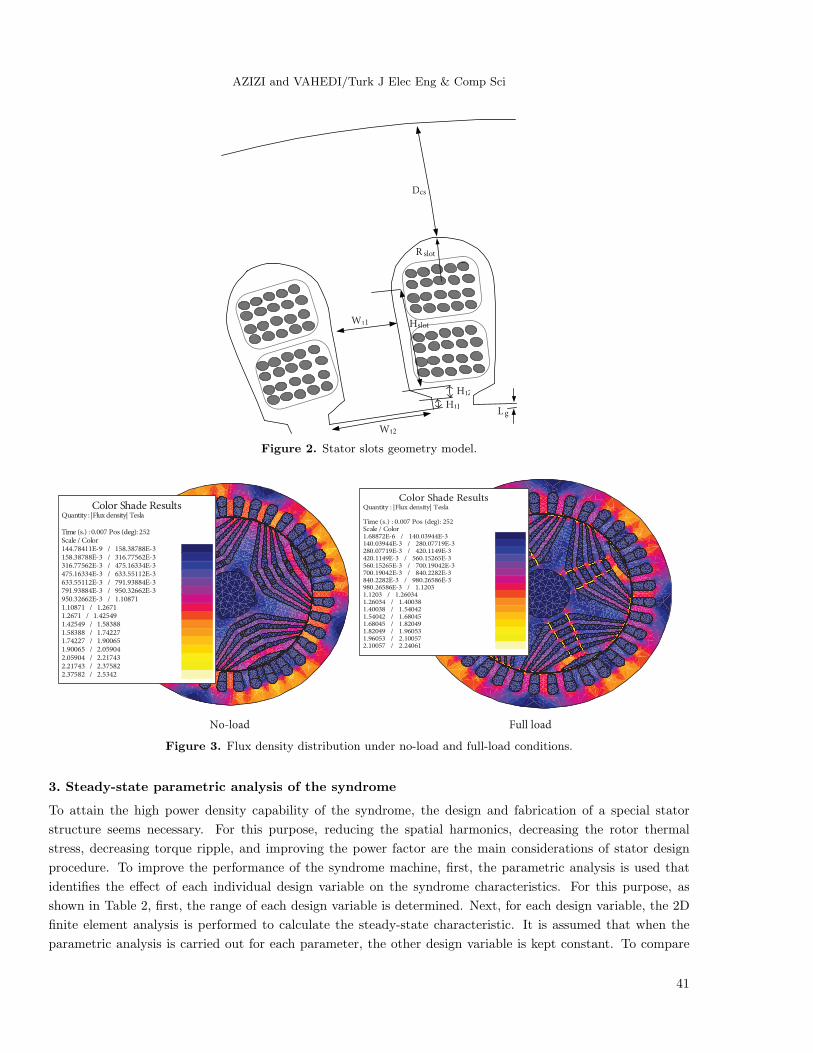
Figure 2 shows the stator slot parameter identification for studying the effect of the stator slot geometry
parameter on performance of the SynRM. The 2D finite element sketch and flux density value under no-load
and full-load conditions obtained from the magneto static analysis are depicted in Figure 3. To evaluate the
performance of the SynRM, the stator and rotor iron losses, along with the copper loss, should be calculated in
each experiment. Generally, the stator and rotor core losses are generated from the spatial stator winding, slot
harmonics, and time-dependent stator current harmonics. The iron loss of the laminated core is the sum of the
hysteresis loss, classical eddy current loss, and excess loss [14]. The value of the losses as the average value of
the losses over one period can be calculated as:
Pc−total−ave =1
T
T∫0
dpc−total−ave(t) = KhB2mfKf +
1
T
T∫0
[σd2
12(dB
dt(t))2 +Ke(
dB
dt(t))
3/2
]Kfd(t), (1)
where Kh, σ and Ke are constant coefficients, and Kf and d are physical parameters. The coefficients of
the hysteresis and excess loss (Kh,Ke) are calculated by the curve fitting of the measured total iron loss for
different flux densities. To examine the stator and rotor iron losses, several transient coupled load analyses are
performed.
In the next sections, a transient analysis is conducted to investigate the effect of different stator geometry-
designed parameters on the steady-state characteristics of the SynRM. Furthermore, the flux density is inves-
tigated in each part to estimate the additional harmonic loss and prevention of the thermal problem. The
parametric analysis results give an overall idea about the effect of the design parameters on the steady-state
characteristic of the syndrome machine and identifying the appropriate combination of design variable to attain
a particular optimum response.
40
AZIZI and VAHEDI/Turk J Elec Eng & Comp Sci
Dcs
W t1
R� slot
Hslot
Ht2�
H t1L� g
Wt2
Figure 2. Stator slots geometry model.
No-load Full load
Color Shade ResultsQuantity : |Flux density| Tesla
Time (s.) : 0.007 Pos (deg): 252Scale / Color144.78411E-9 / 158.38788E-3158.38788E-3 / 316.77562E-3316.77562E-3 / 475.16334E-3475.16334E-3 / 633.55112E-3633.55112E-3 / 791.93884E-3791.93884E-3 / 950.32662E-3950.32662E-3 / 1.108711.10871 / 1.26711.2671 / 1.425491.42549 / 1.583881.58388 / 1.742271.74227 / 1.900651.90065 / 2.059042.05904 / 2.217432.21743 / 2.375822.37582 / 2.5342
Color Shade ResultsQuantity : |Flux density| Tesla
Time (s.) : 0.007 Pos (deg): 252Scale / Color1.68872E-6 / 140.03944E-3140.03944E-3 / 280.07719E-3280.07719E-3 / 420.1149E-3420.1149E-3 / 560.15265E-3560.15265E-3 / 700.19042E-3700.19042E-3 / 840.2282E-3840.2282E-3 / 980.26586E-3980.26586E-3 / 1.12031.1203 / 1.260341.26034 / 1.400381.40038 / 1.540421.54042 / 1.680451.68045 / 1.820491.82049 / 1.960531.96053 / 2.100572.10057 / 2.24061
Figure 3. Flux density distribution under no-load and full-load conditions.
3. Steady-state parametric analysis of the syndrome
To attain the high power density capability of the syndrome, the design and fabrication of a special stator
structure seems necessary. For this purpose, reducing the spatial harmonics, decreasing the rotor thermal
stress, decreasing torque ripple, and improving the power factor are the main considerations of stator design
procedure. To improve the performance of the syndrome machine, first, the parametric analysis is used that
identifies the effect of each individual design variable on the syndrome characteristics. For this purpose, as
shown in Table 2, first, the range of each design variable is determined. Next, for each design variable, the 2D
finite element analysis is performed to calculate the steady-state characteristic. It is assumed that when the
parametric analysis is carried out for each parameter, the other design variable is kept constant. To compare
41
AZIZI and VAHEDI/Turk J Elec Eng & Comp Sci
the effect of several design parameters on a particular characteristic, the design variables are normalized based
on the parameter setting level ranges. The natural variable (ξi) can be converted to a coded variable (xi)
design and can be calculated as:
Pc−total−ave =1
T
T∫0
dpc−total−ave(t) = KhB2mfKf +
1
T
T∫0
[σd2
12(dB
dt(t))2 +Ke(
dB
dt(t))
3/2
]Kfd(t), (2)
where mi and ci are calculated as:
mi =ξmax + ξmin
2(3)
ci =ξmax − ξmin
2(4)
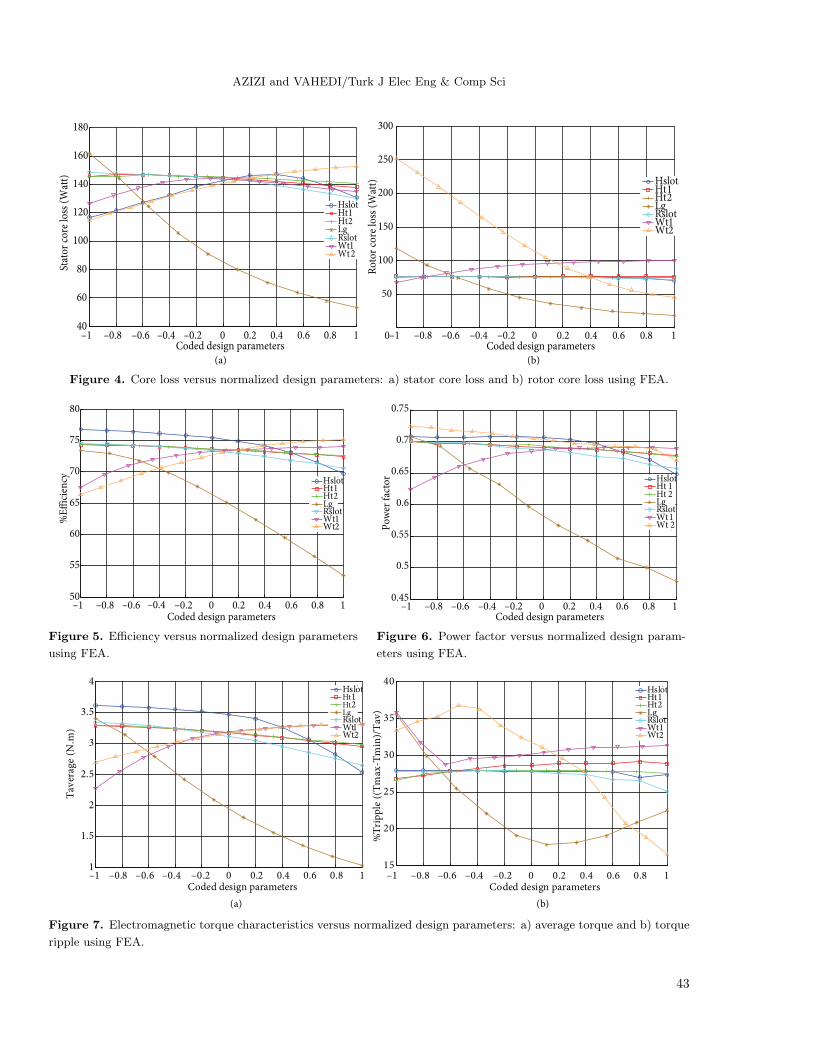
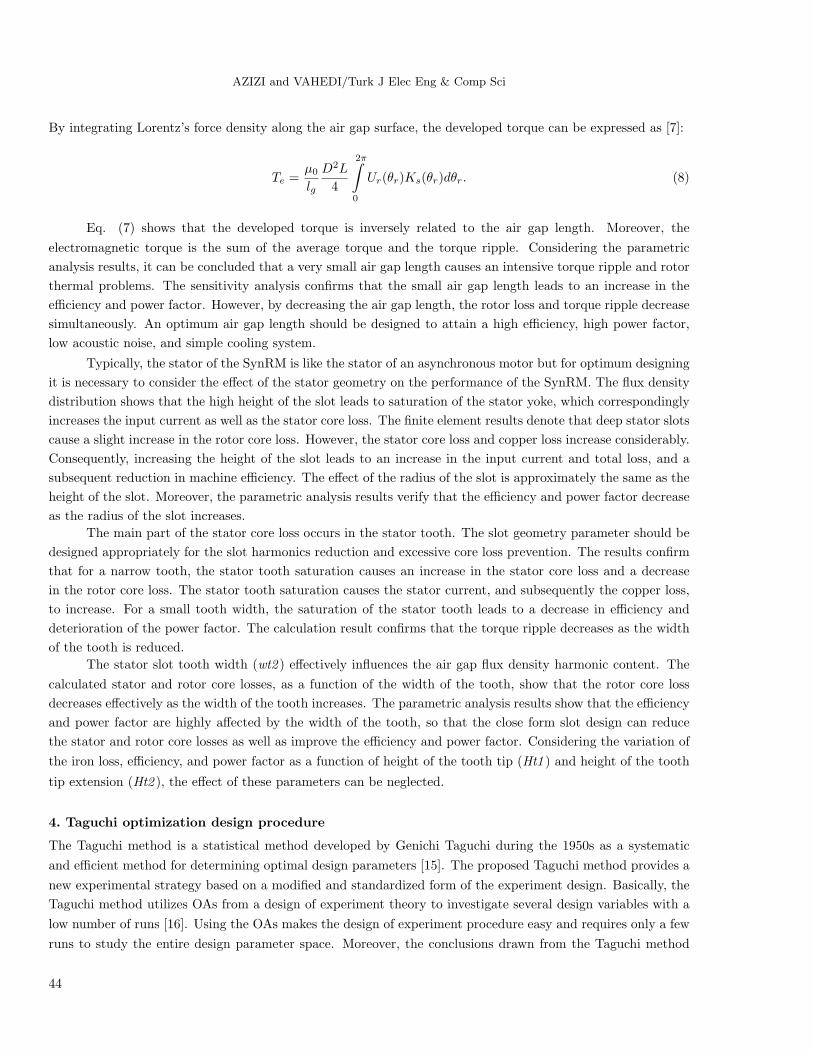
The stator and rotor core loss as a function of the stator slot design variables are shown in Figure 4. It is
evident that each parameter has a different effect on the characteristic of the SynRM. Figures 5 and 6 show the
efficiency and power factor versus the design variables. The average torque and torque ripple versus the design
parameters are shown in Figure 7.
The key consideration during the designing of the SynRM is estimating the stator, rotor iron losses, and
copper loss to evaluate the efficiency and predict the thermal behavior of the system. The air gap length is one
of the determinative parameters that should be designed in an optimal form. In this paper, the effect of the
air gap length on the stator and rotor core loss is evaluated using 2D finite element simulation. It is assumed
that the input voltage is kept constant and the core loss is calculated at a steady-state synchronous speed
operating condition. As the air gap length along the q-axis is much larger than that on the d-axis, increasing
this parameter considerably decreases only the d-axis inductance. While the air gap length is increased, the
harmonic content of the air gap flux density is reduced. The calculated stator and rotor core loss versus the air
gap length is depicted in Figure 4. As expected, increasing the air gap length causes rotor core loss, together
with total core loss, to decrease. Hence, by increasing the air gap length, the rotor temperature becomes cooler.
However, the calculation results confirm that by increasing the air gap length, the input current and subsequent
copper loss increase significantly. The calculation results show that the total loss increases for a larger air gap
length. It should be noted that if the SynRM motor is supplied with a constant 3-phase current source, its
efficiency will be increased slightly by increasing the air gap length. For a full-pitch distributed stator winding,
the stator magnetic potential Us(θr) along the stator bore can be calculated as [7]:
Us(θr) =∑v
−Kv
v
D
2Pcos(υpθr + (v − 1)pθm − αe
i ), (5)
where v and Kυ are the harmonic order and peak value of the electric loading harmonic of v , respectively.
Moreover, θs is the stator synchronous reference frame coordinate and θm is the rotor position angle, as follows:
Pθs = P (θr + θm), (6)
where P is the number of pole pairs. Thus, the air gap flux density can be calculated as:
Bg(θr) = µ0−Us(θr) + Ur(θr)
lg. (7)
42
AZIZI and VAHEDI/Turk J Elec Eng & Comp Sci
(a) (b)
–1 –0.8 –0.6 –0.4 –0.2 0 0.2 0.4 0.6 0.8 140
60
80
100
120
140
160
180
Coded design parameters
Stat
or c
ore
loss
(W
att)
HslotHt1Ht2LgRslotWt1Wt 2
–1 –0.8 –0.6 –0.4 –0.2 0 0.2 0.4 0.6 0.8 10
50
100
150
200
250
300
Coded design parameters
Rot
or c
ore
loss
(W
att)
HslotHt1Ht2LgRslotWt1Wt2
Figure 4. Core loss versus normalized design parameters: a) stator core loss and b) rotor core loss using FEA.
–1 –0.8 –0.6 –0.4 –0.2 0 0.2 0.4 0.6 0.8 150
55
60
65
70
75
80
Coded design parameters
%E
"ic
ien
cy
HslotHt1Ht2LgRslotWt1Wt2
–1 –0.8 –0.6 –0.4 –0.2 0 0.2 0.4 0.6 0.8 10.45
0.5
0.55
0.6
0.65
0.7
0.75
Coded design parameters
Po
wer
fac
tor
HslotHt 1Ht 2LgRslotWt1Wt 2
Figure 5. Efficiency versus normalized design parameters
using FEA.
Figure 6. Power factor versus normalized design param-
eters using FEA.
(a) (b)
–1 –0.8 –0.6 –0.4 –0.2 0 0.2 0.4 0.6 0.8 11
1.5
2
2.5
3
3.5
4
Coded design parameters
Tav
erag
e (N
.m)
HslotHt1Ht2LgRslotWt1Wt2
–1 –0.8 –0.6 –0.4 –0.2 0 0.2 0.4 0.6 0.8 115
20
25
30
35
40
Coded design parameters
%T
rip
ple
((T
max
-Tm
in)/
Tav
)
HslotHt1Ht2LgRslotWt1Wt2
Figure 7. Electromagnetic torque characteristics versus normalized design parameters: a) average torque and b) torque
ripple using FEA.
43
AZIZI and VAHEDI/Turk J Elec Eng & Comp Sci
By integrating Lorentz’s force density along the air gap surface, the developed torque can be expressed as [7]:
Te =µ0
lg
D2L
4
2π∫0
Ur(θr)Ks(θr)dθr. (8)
Eq. (7) shows that the developed torque is inversely related to the air gap length. Moreover, the
electromagnetic torque is the sum of the average torque and the torque ripple. Considering the parametric
analysis results, it can be concluded that a very small air gap length causes an intensive torque ripple and rotor
thermal problems. The sensitivity analysis confirms that the small air gap length leads to an increase in the
efficiency and power factor. However, by decreasing the air gap length, the rotor loss and torque ripple decrease
simultaneously. An optimum air gap length should be designed to attain a high efficiency, high power factor,
low acoustic noise, and simple cooling system.
Typically, the stator of the SynRM is like the stator of an asynchronous motor but for optimum designing
it is necessary to consider the effect of the stator geometry on the performance of the SynRM. The flux density
distribution shows that the high height of the slot leads to saturation of the stator yoke, which correspondingly
increases the input current as well as the stator core loss. The finite element results denote that deep stator slots
cause a slight increase in the rotor core loss. However, the stator core loss and copper loss increase considerably.
Consequently, increasing the height of the slot leads to an increase in the input current and total loss, and a
subsequent reduction in machine efficiency. The effect of the radius of the slot is approximately the same as the
height of the slot. Moreover, the parametric analysis results verify that the efficiency and power factor decrease
as the radius of the slot increases.
The main part of the stator core loss occurs in the stator tooth. The slot geometry parameter should be
designed appropriately for the slot harmonics reduction and excessive core loss prevention. The results confirm
that for a narrow tooth, the stator tooth saturation causes an increase in the stator core loss and a decrease
in the rotor core loss. The stator tooth saturation causes the stator current, and subsequently the copper loss,
to increase. For a small tooth width, the saturation of the stator tooth leads to a decrease in efficiency and
deterioration of the power factor. The calculation result confirms that the torque ripple decreases as the width
of the tooth is reduced.
The stator slot tooth width (wt2 ) effectively influences the air gap flux density harmonic content. The
calculated stator and rotor core losses, as a function of the width of the tooth, show that the rotor core loss
decreases effectively as the width of the tooth increases. The parametric analysis results show that the efficiency
and power factor are highly affected by the width of the tooth, so that the close form slot design can reduce
the stator and rotor core losses as well as improve the efficiency and power factor. Considering the variation of
the iron loss, efficiency, and power factor as a function of height of the tooth tip (Ht1 ) and height of the tooth
tip extension (Ht2 ), the effect of these parameters can be neglected.
4. Taguchi optimization design procedure
The Taguchi method is a statistical method developed by Genichi Taguchi during the 1950s as a systematic
and efficient method for determining optimal design parameters [15]. The proposed Taguchi method provides a
new experimental strategy based on a modified and standardized form of the experiment design. Basically, the
Taguchi method utilizes OAs from a design of experiment theory to investigate several design variables with a
low number of runs [16]. Using the OAs makes the design of experiment procedure easy and requires only a few
runs to study the entire design parameter space. Moreover, the conclusions drawn from the Taguchi method
44
AZIZI and VAHEDI/Turk J Elec Eng & Comp Sci
are valid over the entire experimental region. The Taguchi method was established based on the signal to noise
(S/N) ratio to measure the quality characteristics deviating from the desired values [17]. The S/N measures
the level of performance and evaluation of the stability performance of an output characteristic. For analyzing
the S/N ratio, 3 types of quality characteristics are defined, i.e. the-lower-the-better, the-higher-the-better, and
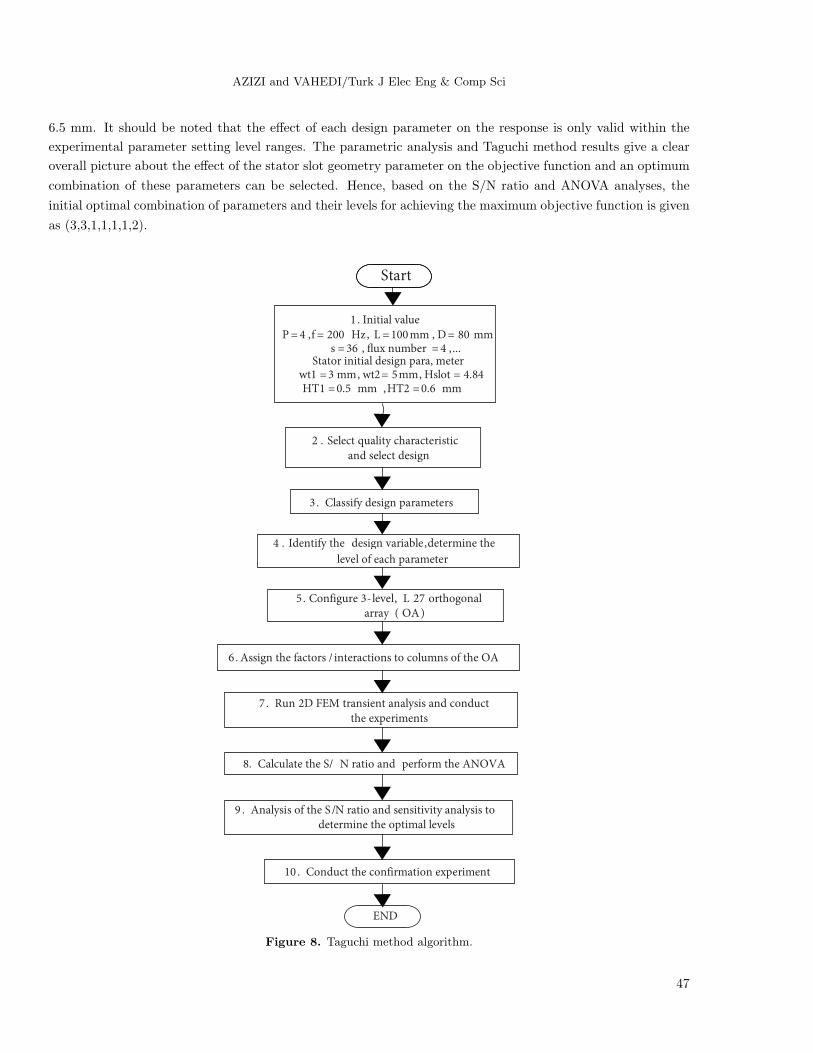
the-nominal-the-better [18]. Figure 8 shows the detailed procedure of the Taguchi optimum design methodology.
In this paper, the larger-the-better quality characteristic is chosen for maximizing the objective function. The
S/N ratio is used to measure the sensitivity of the quality characteristic being investigated in an optimum
procedure. To determine the effect of each design parameter on the output, the S/N ratio should be calculated
for the experimental data. The S/N ratio for the experimental data can be calculated based on Eq. (8) [19,20]:
SNi = 10 log(y2is2i
), (9)
where, yi and s2i are the mean value and variance for the given experiment, respectively. Hence, yi and s2i can
be calculated as:
yi =1
Ni
Ni∑u=1
yi,u, (10)
s2i =1
Ni − 1
Ni∑u=1
(yi,u − yi), (11)
where i and u are the experiment number and trial number of experiments, respectively. Ni is the number of
trials for experiment i . For the case of maximizing the objective function, the S/N ratio is calculated by:
SNI = −10 log
[1
Ni
Ni∑u=1
1
y2u
]. (12)
The weighting method enables one to express the normalized response of efficiency and rotor core loss as a
single objective. Hence, the resultant weighted objective function that should be maximized while subjected to
a defined constraint is given as:
y = w1(%ηnormalized) + w2(100− (Prot−loss
Prot−loss−nomin al)), (13)
where the parameters w1 = 0.6 and w2 = 0.4 are the weighting factors applied to the normalized efficiency and
rotor core loss used in the objective function of the optimization process. The weighting factors are selected in
such a manner that their sum is equal to 1. A higher value of weighting factor w1 indicates that more emphasis is
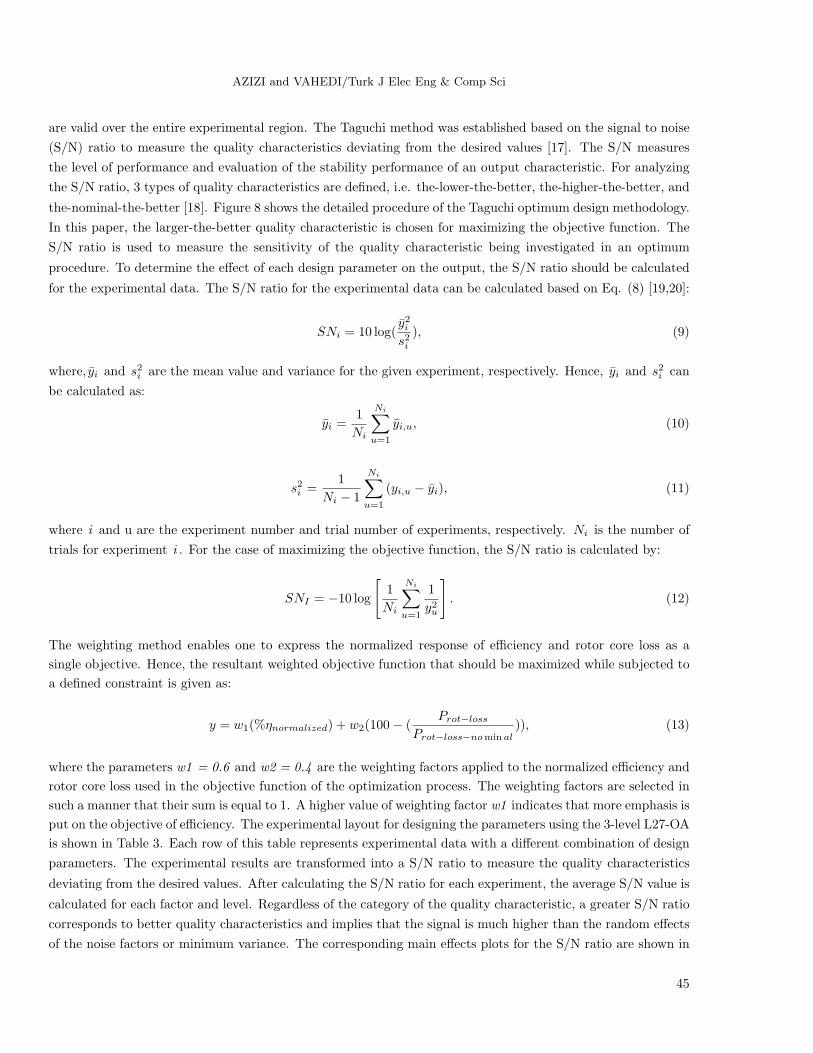
put on the objective of efficiency. The experimental layout for designing the parameters using the 3-level L27-OA
is shown in Table 3. Each row of this table represents experimental data with a different combination of design
parameters. The experimental results are transformed into a S/N ratio to measure the quality characteristics
deviating from the desired values. After calculating the S/N ratio for each experiment, the average S/N value is
calculated for each factor and level. Regardless of the category of the quality characteristic, a greater S/N ratio
corresponds to better quality characteristics and implies that the signal is much higher than the random effects
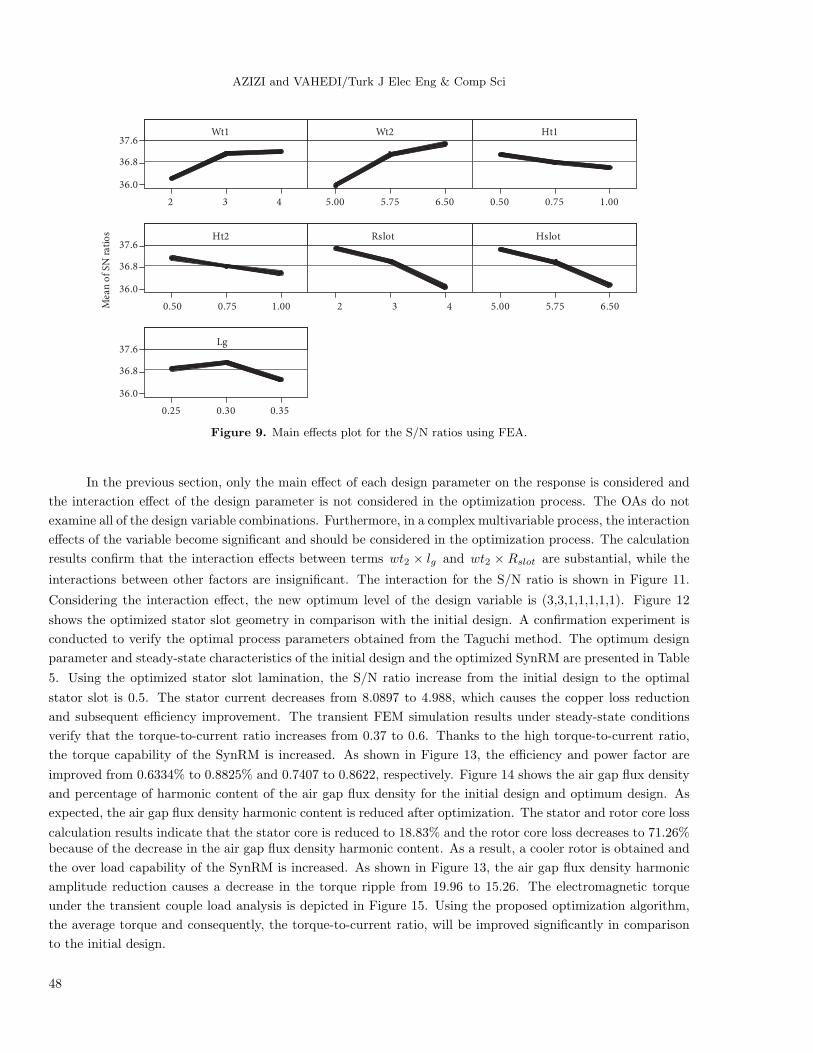
of the noise factors or minimum variance. The corresponding main effects plots for the S/N ratio are shown in
45
AZIZI and VAHEDI/Turk J Elec Eng & Comp Sci
Figure 9. The mean S/N ratio for each level of the other parameters can be computed in a similar manner. The
effect of each stator slot designing parameter on the S/N ratio at different levels can be separated because the
experimental design is orthogonal. In addition, analysis of variance (ANOVA) is performed to find out which
parameter significantly affects the response. Variance analysis is similar to regression, which is used for studying
and determining the relationship between a response variable and design parameters. The analysis of the results
is carried out using MINITAB 15 software. Table 4 shows the calculation result of the ANOVA. The smallest P
value gives more significant effect-corresponded design parameters. A larger F value implies that the variation
of the designing parameter has a significant effect on the performance. Next, the effect of each parameter is
calculated by determining the range of the average S/N value (∆ = max(SNaverage)−min(SNaverage)) for each
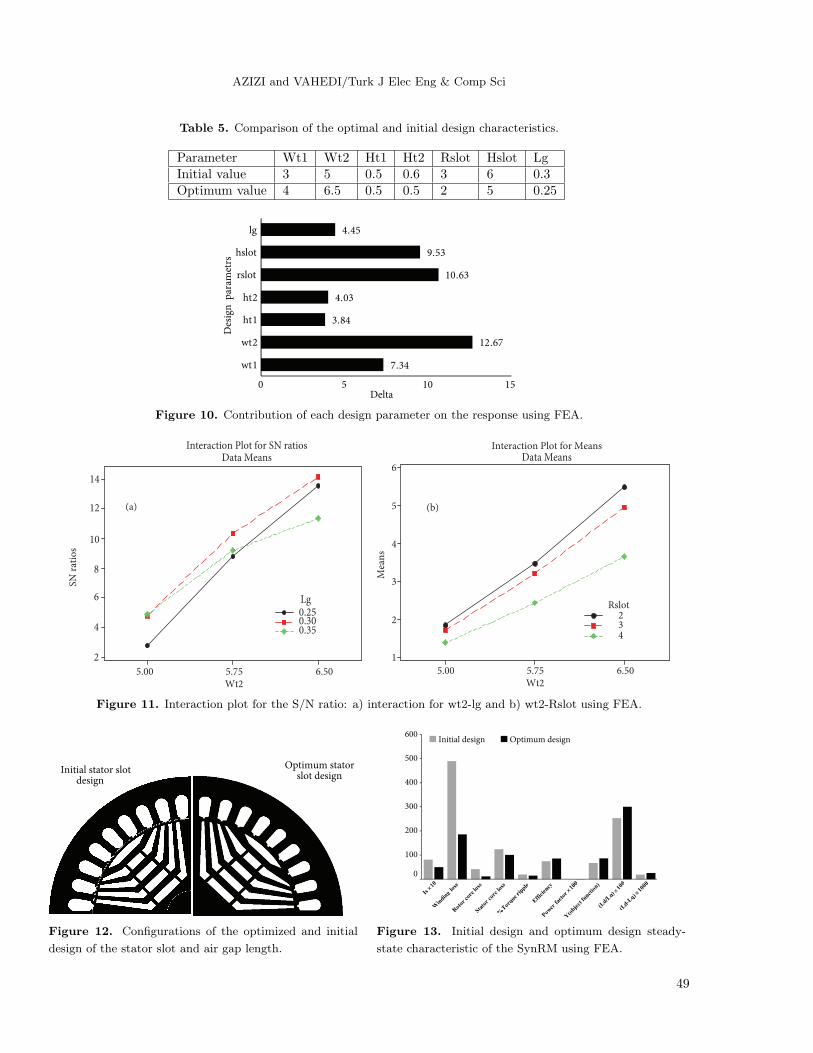
factor. The average for the main effect of the S/N ratio is summarized in Figure 10. According to Figure 10,
wt2, rslot, hslot, and wt1 are the major factors affecting the objective function, whereas ht1, ht2, and lg have a
relatively insignificant effect on the response.
Table 3. Experimental plan using an L27 OA related S/N ratio.
S/N y Lg Hslot Rslot Ht2 Ht1 Wt2 Wt1 Expt. no.36.694109 68.3448 0.25 5 2 0.5 0.5 5 2 136.353475 65.7164 0.3 5.75 3 0.5 0.5 5 2 234.558824 53.4492 0.35 6.5 4 0.5 0.5 5 2 3. . . . . . . . . .. . . . . . . . . .37.776479 77.4148 0.35 5 3 1 0.5 5.75 4 2336.925455 70.1896 0.25 5.75 4 1 0.5 5.75 4 2438.2477 81.7308 0.3 6.5 2 0.5 0.75 6.50 4 2538.224004 81.508 0.35 5 3 0.5 0.75 6.50 4 2637.846567 78.042 0.25 5.75 4 0.5 0.75 6.50 4 27
Table 4. ANOVA for S/N ratios considering the interaction effect.
P F Adj MS Adj SS Seq SS DF0 102.87 149.135 298.271 298.27 2 Wt10 262.41 380.42 760.839 760.84 2 Wt20.006 22.96 33.291 66.581 66.58 2 Ht10.005 25.22 36.559 73.117 73.12 2 Ht20 179.72 260.549 521.098 521.1 2 Rslot0 143.3 207.752 415.503 415.5 2 Hslot0.004 31.22 45.266 90.531 90.53 2 Lg0.712 0.55 0.797 3.187 3.19 4 Wt2 × Rslo0.01 15.78 22.878 91.511 91.51 4 Wt2 ×Lg
1.45 5.799 5.8 4 Residual2326.44 26 Total
S = 1.204, R-Sq = 99.8%, R-Sq(adj) = 98.4%
5. Optimization design for stator of the SynRM with consideration of the interaction effects
According to the results of the S/N ratio and ANOVA, the main effect of the design variable indicates the trend
of each factor. As shown in Figure 9, considering the influence of the individual design variable on the desired
response, it can be observed that it will increase sharply as the width of the tooth (wt2 ) increases from 5 to
46
AZIZI and VAHEDI/Turk J Elec Eng & Comp Sci
6.5 mm. It should be noted that the effect of each design parameter on the response is only valid within the
experimental parameter setting level ranges. The parametric analysis and Taguchi method results give a clear
overall picture about the effect of the stator slot geometry parameter on the objective function and an optimum
combination of these parameters can be selected. Hence, based on the S/N ratio and ANOVA analyses, the
initial optimal combination of parameters and their levels for achieving the maximum objective function is given
as (3,3,1,1,1,1,2).
6� . Assign the factors / interactions to columns of the OA
Start
4 . Identify the design variable, determine the
level of each parameter
5. Configure 3-level, L 27 orthogonal
array ( OA)
10 . � Conduct the confirmation experiment�
1. Initial value
P = 4 ,f = 200 Hz, L = 100 mm , D = 80 mms = 36 , "ux number = 4 ,...
Stator initial design para, meterwt1 = 3 mm, wt2= 5mm, Hslot = 4.84HT1 = 0.5 mm ,HT2 = 0.6 mm
END
7. Run 2D FEM transient analysis and conduct
the experiments
8. Calculate the S/� N ratio and perform the ANOVA
9 . � Analysis of the S/N ratio and sensitivity analysis to
determine the optimal levels�
2 . Select quality characteristic
and select design
3 . Classify design parameters
Figure 8. Taguchi method algorithm.
47
AZIZI and VAHEDI/Turk J Elec Eng & Comp Sci
432
37.6
36.8
36.0
6.505.755.00 1.000.750.50
1.000.750.50
37.6
36.8
36.0
432 6.505.755.00
0.350.300.25
37.6
36.8
36.0
Wt1
Mea
n o
f S
N r
atio
s
Wt2 Ht1
Ht2 Rslot Hslot
Lg
Figure 9. Main effects plot for the S/N ratios using FEA.
In the previous section, only the main effect of each design parameter on the response is considered and
the interaction effect of the design parameter is not considered in the optimization process. The OAs do not
examine all of the design variable combinations. Furthermore, in a complex multivariable process, the interaction
effects of the variable become significant and should be considered in the optimization process. The calculation
results confirm that the interaction effects between terms wt2 × lg and wt2 × Rslot are substantial, while the
interactions between other factors are insignificant. The interaction for the S/N ratio is shown in Figure 11.
Considering the interaction effect, the new optimum level of the design variable is (3,3,1,1,1,1,1). Figure 12
shows the optimized stator slot geometry in comparison with the initial design. A confirmation experiment is
conducted to verify the optimal process parameters obtained from the Taguchi method. The optimum design
parameter and steady-state characteristics of the initial design and the optimized SynRM are presented in Table
5. Using the optimized stator slot lamination, the S/N ratio increase from the initial design to the optimal
stator slot is 0.5. The stator current decreases from 8.0897 to 4.988, which causes the copper loss reduction
and subsequent efficiency improvement. The transient FEM simulation results under steady-state conditions
verify that the torque-to-current ratio increases from 0.37 to 0.6. Thanks to the high torque-to-current ratio,
the torque capability of the SynRM is increased. As shown in Figure 13, the efficiency and power factor are
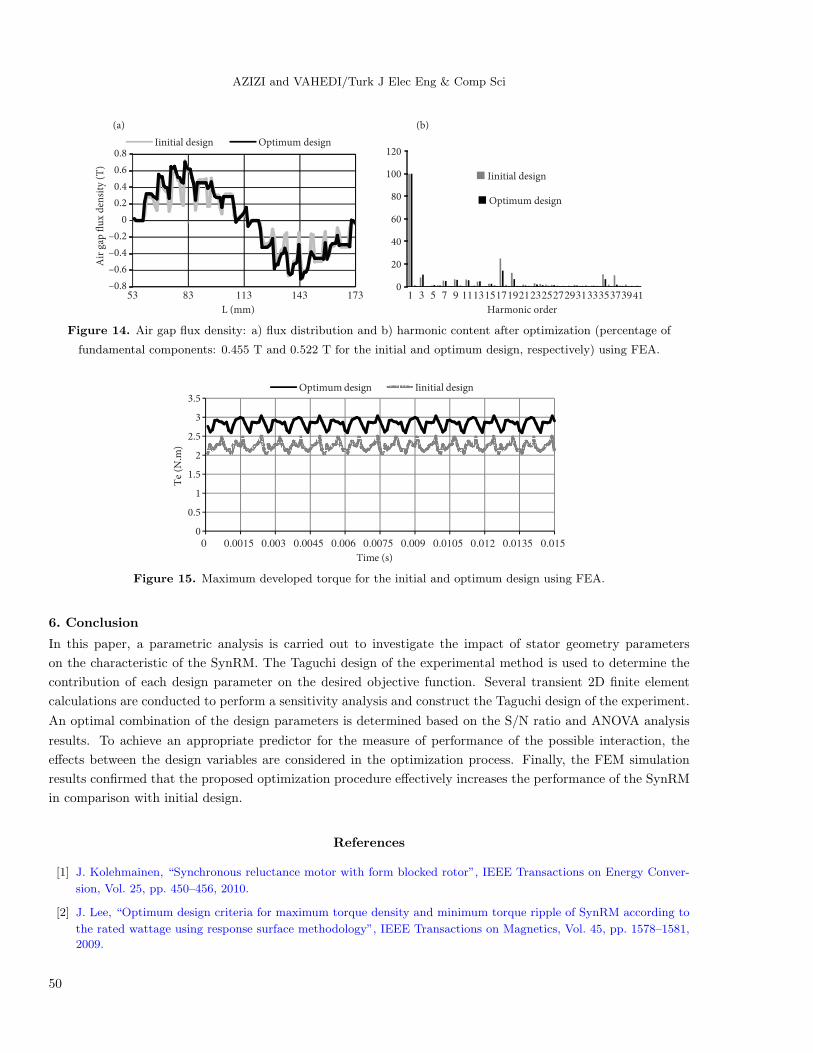
improved from 0.6334% to 0.8825% and 0.7407 to 0.8622, respectively. Figure 14 shows the air gap flux density
and percentage of harmonic content of the air gap flux density for the initial design and optimum design. As
expected, the air gap flux density harmonic content is reduced after optimization. The stator and rotor core loss
calculation results indicate that the stator core is reduced to 18.83% and the rotor core loss decreases to 71.26%because of the decrease in the air gap flux density harmonic content. As a result, a cooler rotor is obtained and
the over load capability of the SynRM is increased. As shown in Figure 13, the air gap flux density harmonic
amplitude reduction causes a decrease in the torque ripple from 19.96 to 15.26. The electromagnetic torque
under the transient couple load analysis is depicted in Figure 15. Using the proposed optimization algorithm,
the average torque and consequently, the torque-to-current ratio, will be improved significantly in comparison
to the initial design.
48
AZIZI and VAHEDI/Turk J Elec Eng & Comp Sci
Table 5. Comparison of the optimal and initial design characteristics.
Parameter Wt1 Wt2 Ht1 Ht2 Rslot Hslot LgInitial value 3 5 0.5 0.6 3 6 0.3Optimum value 4 6.5 0.5 0.5 2 5 0.25
7.34
12.67
3.84
4.03
10.63
9.53
4.45
0 5 10 15
wt1
wt2
ht1
ht2
rslot
hslot
lg
Delta
Des
ign
par
amet
rs
Figure 10. Contribution of each design parameter on the response using FEA.
6.505.755.00
6
5
4
3
2
1
Wt26.505.755.00
Wt2
Mea
ns
SN r
atio
s
234
Rslot
Interaction Plot for MeansData Means
(b) (a)
14
12
10
8
6
4
2
0.250.300.35
Lg
Interaction Plot for SN ratiosData Means
Figure 11. Interaction plot for the S/N ratio: a) interaction for wt2-lg and b) wt2-Rslot using FEA.
Optimum stator slot design
Initial stator slot design
0
100
200
300
400
500
600Initial design Optimum design
×× × ×
Figure 12. Configurations of the optimized and initial
design of the stator slot and air gap length.
Figure 13. Initial design and optimum design steady-
state characteristic of the SynRM using FEA.
49
AZIZI and VAHEDI/Turk J Elec Eng & Comp Sci
(a) (b)
–0.8
–0.6
–0.4
–0.2
0
0.2
0.4
0.6
0.8
53 83 113 143 173
Air
gap
"u
x d
ensi
ty (
T)
L (mm)
Iinitial design Optimum design
0
20
40
60
80
100
120
1 3 5 7 9 11131517192123252729313335373941
Harmonic order
Iinitial design
Optimum design
Figure 14. Air gap flux density: a) flux distribution and b) harmonic content after optimization (percentage of
fundamental components: 0.455 T and 0.522 T for the initial and optimum design, respectively) using FEA.
0
0.5
1
1.5
2
2.5
3
3.5
0 0.0015 0.003 0.0045 0.006 0.0075 0.009 0.0105 0.012 0.0135 0.015
Te
(N.m
)
Time (s)
Optimum design Iinitial design
Figure 15. Maximum developed torque for the initial and optimum design using FEA.
6. Conclusion
In this paper, a parametric analysis is carried out to investigate the impact of stator geometry parameters
on the characteristic of the SynRM. The Taguchi design of the experimental method is used to determine the
contribution of each design parameter on the desired objective function. Several transient 2D finite element
calculations are conducted to perform a sensitivity analysis and construct the Taguchi design of the experiment.
An optimal combination of the design parameters is determined based on the S/N ratio and ANOVA analysis
results. To achieve an appropriate predictor for the measure of performance of the possible interaction, the
effects between the design variables are considered in the optimization process. Finally, the FEM simulation
results confirmed that the proposed optimization procedure effectively increases the performance of the SynRM
in comparison with initial design.
References
[1] J. Kolehmainen, “Synchronous reluctance motor with form blocked rotor”, IEEE Transactions on Energy Conver-
sion, Vol. 25, pp. 450–456, 2010.
[2] J. Lee, “Optimum design criteria for maximum torque density and minimum torque ripple of SynRM according to
the rated wattage using response surface methodology”, IEEE Transactions on Magnetics, Vol. 45, pp. 1578–1581,
2009.
50
AZIZI and VAHEDI/Turk J Elec Eng & Comp Sci
[3] J. Lee, K. Lee, Y.H. Cho, T.W. Yun, “Characteristics analysis and optimum design of anisotropy rotor synchronous
reluctance motor using coupled finite element method and response surface methodology”, IEEE Transactions on
Magnetics, Vol. 45, pp. 4696–4699, 2009.
[4] J.M. Park, S. Kim, J.P. Hong, J.H. Lee, “Rotor design on torque ripple reduction for a synchronous reluctance
motor with concentrated winding using response surface methodology”, IEEE Transactions on Magnetics, Vol. 42,
pp. 3479–3481, 2006.
[5] S. Giurgea, D. Fodorean, G. Cirrincione, A. Miraoui, M. Cirrincione, “Multimodel optimization based on the
response surface of the reduced FEM simulation model with application to a PMSM”, IEEE Transactions on
Magnetics, Vol. 44, pp. 2153–2157, 2008.
[6] D.K. Hong, B.C. Woo, D.H. Koo, D.H. Kang, “Optimum design of transverse flux linear motor for weight reduction
and improvement thrust force using response surface methodology”, IEEE Transactions on Magnetics, Vol. 44, pp.
4317–4320, 2008.
[7] N. Bianchi, S. Bolognani, D. Bon, M. Dai Pre, “Rotor flux-barrier design for torque ripple reduction in synchronous
reluctance and PM-assisted synchronous reluctance motors”, IEEE Transaction on Industry Applications, Vol. 45,
pp. 921–928, 2009.
[8] X.B. Bomela, M.J. Kamper, “Effect of stator chording and rotor skewing on performance of reluctance synchronous
machine”, IEEE Transactions on Industry Applications, Vol. 38, pp. 91–100, 2002.
[9] Y.C. Choi, J.H. Lee, “Rotor & stator design on torque ripple reduction for a synchronous reluctance motor with a
concentrated winding using RSM”, Proceedings of the International Conference on Electrical Machines and Systems,
pp. 1216–1221, 2007.
[10] H. Hofmann, S.R. Sanders, “High-speed synchronous reluctance machine with minimized rotor losses”, IEEE
Transactions on Industry Applications, Vol. 36, pp. 531–539, 2000.
[11] A. Fratta, G.P. Troglia, A. Vagati, F. Villata, “Torque ripple evaluation of high-performance synchronous reluctance
machines”, IEEE Industry Applications Magazine, Vol. 1, pp. 14–22, 1995.
[12] D.A. Staton, S.E. Wood, T.J.E. Miller, “Maximising the saliency ratio of the synchronous reluctance motor”,
Electric Power Applications, IEE Proceedings B, Vol. 140, pp. 49–59, 1993.
[13] P. Niazi, H. Toliyat, D. Cheong, J. Chul Kim, “A low-cost and efficient permanent-magnet-assisted synchronous
reluctance motor drive”, IEEE Transactions on Industry Applications, Vol. 43, pp. 542–550, 2007.
[14] J.W. Kim, B.T. Kim, “Optimal stator slot design of inverter-fed induction motor in consideration of harmonic
losses”, IEEE Transactions on Magnetics, Vol. 41, pp. 2012–2015, 2005.
[15] S. Brisset, F. Gillon, S. Vivier, P. Brochet, “Optimization with experimental design: an approach using Taguchi’s
methodology and finite element simulations”, IEEE Transactions on Magnetics, Vol. 37, pp. 3530–3533, 2001.
[16] S. Kamaruddin, Z.A. Khan, S.H. Foong, “Application of Taguchi method in the optimization of injection moulding
parameters for manufacturing products from plastic blend”, International Journal of Engineering and Technology,
Vol. 2, pp. 574–580, 2010.
[17] P. Georgilakis, “Taguchi method for the optimization of transformer cores annealing process”, Journal of Optoelec-
tronics and Advanced Materials, Vol. 10, pp. 1169–1177, 2008.
[18] L.A. Dobrzanski, J. Domaga, J.F. Silva, “Application of Taguchi method in the optimisation of filament winding
of thermoplastic composites”, Archives of Materials Science and Engineering, Vol. 28, pp. 133–140, 2007.
[19] J. Kang, M. Hadfield, “Parameter optimization by Taguchi methods for finishing advanced ceramic balls using a
novel eccentric lapping machine”, Proceedings of the Institution of Mechanical of Mechanical Engineers, pp. 69–78,
2001.
[20] H. Gonda Neddermeijer, G.J. van Oortmarssen, “A framework for response surface methodology for simulation
optimization”, Proceedings of the 32nd Winter Simulation Conference, Vol. 1, pp. 129–136, 2000.
51


![Multi-objective optimum stator and rotor stagger angle ...scientiairanica.sharif.edu/article_3658_4b9c5ea15d4859b...Researchers Curves Applications Oyama et al. [4] B-spline curves](https://img.pdfslide.us/doc/110x75/6058611f8e9ea109717b1459/multi-objective-optimum-stator-and-rotor-stagger-angle-researchers-curves.jpg)


![The NEMO Stator - netzschusa.com Geometries.pdf · The NEMO ® Stator The design and ... elastomers, and have established their own stator manufacturing facility. ©NETZSCH ... [bar]](https://img.pdfslide.us/doc/110x75/5a83b2677f8b9ada388ebb00/the-nemo-stator-geometriespdfthe-nemo-stator-the-design-and-elastomers-and.jpg)